 Scott D. Bachman
 Joan A. Kleypas
 Mark Erdmann
 Edy Setyawan
- 1Climate and Global Dynamics Laboratory, National Center for Atmospheric Research, Boulder, CO, United States
- 2Conservation International Aotearoa, The University of Auckland, Auckland, New Zealand
- 3Institute of Marine Science, The University of Auckland, Auckland, New Zealand
Coral reefs are highly threatened by ocean warming and the majority are likely to be lost in less than three decades. A first step in maximizing reef conservation through this period is to identify where coral reefs are more likely to survive rising ocean temperatures, such as locations that experience lower temperatures than surrounding regions, high temperature variability, and high food supply. Such conditions are often the result of naturally occurring internal gravity waves (IGWs), oscillatory subsurface disturbances that can entrain cooler and/or nutrient-rich subsurface waters and cause high frequency temperature fluctuations. These features usually remain undetected because they occur subsurface and at spatial scales of O(1 km) and smaller. To shed light on where IGWs are likely to impact temperature conditions within coral reef regions, we present an analysis of data from the LLC4320, a massive high resolution (1/48˚; < 2.5 km) numerical global ocean simulation. The results highlight strong regional differences in the incidence of IGW-induced temperature variability. The analysis also reveals that thermal refugia are limited to depths where high temperature variability coincides with the actual reef depth and may not persist year-round. Assuming 10-m depth as the nominal reef depth, reef regions likely to benefit from IGW-induced cooling occur in SE Asia and the Coral Triangle, the Galápagos, along the Pacific shelf of Central America, and isolated locations worldwide. Such refugia are rare within the Atlantic reef sector. An interactive global atlas showing the results of this study has been made freely available online at https://ncar.github.io/coral-viz/.
Introduction
Coral reefs are suffering severe and frequent mortality due to ocean warming, and the majority are projected to experience unsustainable coral bleaching within two to three decades (van Hooidonk et al., 2013; Hoegh-Guldberg et al., 2018). The magnitude of the loss depends on future efforts to mitigate greenhouse gases, and on the ability of corals and other reef organisms to adapt to warming temperatures (Logan et al., 2014; Bay et al., 2017; Kleypas et al., 2021). Two factors are important in determining where coral reefs are likely to survive warming temperatures into the future: environmental conditions that limit exposure to extreme temperature, and environmental conditions that promote resiliency in the coral holobiont.
As with exposure to heat waves on land, exposure to temperature extremes in the ocean causes stress in many organisms. Stressed corals eject the symbiotic algae that live within their tissues, and often die due to the loss of nutrition that the algae provide to the coral. There is also evidence that extreme heat can kill corals directly, i.e., before corals die from lack of nutrition (Hughes et al., 2018). Many studies have qualified ocean regions and reefs according to the severity of temperature stress over the next few decades, or when unsustainable temperature stress is likely to occur.
More optimistically, other studies have identified oceanic conditions that appear to increase coral bleaching resistance. These conditions include high temperature variability at seasonal to daily time scales (Schmidt et al., 2016; Safaie et al., 2018; Green et al., 2019b; Schoepf et al., 2020), and abundant food supply that supplements the algae-powered nutrition to coral (Roder et al., 2010). Internal gravity waves (IGWs) are naturally occurring phenomena that can induce these conditions. IGWs are oscillatory disturbances that occur in stratified fluids and can be excited by a variety of mechanisms, including wind, tides, and oceanic turbulence (Blumen, 1972; Garrett and Munk, 1979; Munk, 1981; Nikurashin and Ferrari, 2011; Shakespeare and Taylor, 2014). By inducing regular upwelling of cool, nutrient-rich water, IGWs have been shown to lower mean temperatures on coral reefs (Reid et al., 2019; Wyatt et al., 2020), subject corals to high-frequency changes in temperature (Leichter et al., 2005; Wall et al., 2015), and increase nutrient fluxes that promote production of food that at least some corals consume (Leichter et al., 2003; Smith et al., 2004; Green et al., 2019a).
The potential of IGWs to create thermal refugia for coral reefs has been suggested previously, but only recently has it been considered for identifying regions where reefs may survive longer into the future. This is because the effects of IGWs are subsurface and tend to operate over small spatial scales (O(1 km)and smaller) so that their effects on temperature are usually not detected by satellite observations of sea surface temperature (SST). However, if IGWs create conditions that improve survival of coral reefs relative to surrounding regions, it is important to identify these refugia as sites of strategic importance to coral reef conservation and restoration.
The increasing resolution and realism of numerical ocean models provide an alternative means for locating thermal refugia even in the absence of observations (Bachman et al., 2020). However, running these models at the O(1) km resolutions needed to resolve IGWs is generally prohibitively expensive except over very localized regions. The present study aims to take advantage of a notable exception to this rule – namely, the LLC4320 ocean simulation, which at the time of this writing is the highest-resolution global ocean simulation ever conducted. We present an analysis of the output from this simulation to create a novel global atlas of IGW-driven temperature variability on shallow-water coral reefs, with a nuanced analysis of their potential as thermal refugia. In addition, we discuss the technical details of the LLC4320 model that make it well-suited for this problem, and the filtering methods used to identify IGW-driven temperature variability in the model output.
Materials and methods
The LLC4320 model
The small spatial scale and high temporal frequency of IGWs, combined with the global distribution of coral reefs, imposes a tremendous computational burden in terms of storing and processing data for this research. Output from the LLC4320, a massive numerical ocean simulation conducted using the Massachusetts Institute of Technology General Circulation Model (Marshall et al., 1997), was chosen for this study because the LLC4320 datasets provide a unique combination of high-resolution (1/48˚), output frequency (1 hour), duration (over one year), and domain (fully global) that are needed to identify locations where IGWs consistently drive cooling. Technical details of the model setup can be found in the supporting text of Su et al. (2020). The LLC4320 solution has been well-studied in the context of small-scale oceanic processes, including the IGW and internal tidal dynamics that are germane to this study (see https://data.nas.nasa.gov/viz/vizdata/llc4320/index.html). In particular, IGW continuum spectra from sea surface height, temperature, and velocity variances have been shown to be skillfully depicted in this simulation (Rocha et al., 2016; Savage et al., 2017; Arbic et al., 2018; Luecke et al., 2020).
The high-pass filtered heat budget
Heat fluxes driven by IGWs are difficult to distinguish since their temporal frequency significantly overlaps with that of the surface forcing due to the diurnal cycle, the effects of which are especially significant in the near-surface zone where coral reefs are located. To estimate the effects of the surface forcing on the local temperature tendency one may vertically integrate the heat budget equation, written here in simplified form as
for the in situ temperature θ, advecting velocity u = (u, v, w), vertical diffusivity κ, and gradient operator For brevity, we ignore the horizontal diffusivity, and note that the specifics of the model’s heat budget equation may differ from (1) when eddy parameterizations are included. We also note that even with hourly model output there would appear a small, rectified effect in the budget due to averaging over sub-hourly timesteps, which is also ignored in (1). None of these missing terms affects the logic underpinning this derivation.
Defining the angle brackets as a vertical average from the surface down to a fixed depth H,
applying this operator to (1) yields
where Qnet represents the surface buoyancy flux, ρ0 is the reference density, cp is the specific heat of seawater, and D represents a generic diffusive tendency evaluated here at z = - H. The term involving Qnet represents the instantaneous change in heat content for a volume of fluid bounded by the horizontal grid cell edges and lying between the free surface and depth z = - H.
In this study we performed analysis using three different values of H = {10, 25, 50} meters. The 10 m depth was chosen as being representative of where reef-building corals proliferate, while also being slightly removed from the top layer of the ocean model where air-sea interactions dominate. The 25 and 50 meter depths are relevant for deeper reefs, and also lie at and beneath the seasonal thermocline in many parts of the tropics. Using three depths is helpful for understanding how much IGW effects vary with depth, as well as how much the potential energy barrier of the thermocline affects the ability of IGWs to generate temperature variability near the surface.
At any instant in time, we can estimate the cumulative heat change in the volume by integrating in time from the beginning of the simulation (t = 0), so that the net change in heat content is
The change due only to internal processes, here labeled by the subscript int, can thus be easily obtained by subtracting the cumulative surface heating (subscript ext) from the cumulative change in overall heat,
which is readily accomplished using the LLC4320 output of the 3D ocean temperature and net surface buoyancy flux.
We are specifically interested in the parts of Δ〈 θ 〉int that are driven by the internal tide or higher-frequency waves generated by its interaction with topography. Here we use an 8th-order Butterworth filter to apply a high-pass temporal filtering with a cutoff timescale of 27 hours to both sides of (6). This procedure was determined to be sufficient to capture the signal due to the dominant S2, M2, K1, and O1 tidal components with minimal attenuation due to the spectral roll off of the Butterworth filter, while avoiding the risk of the filter diverging at even higher orders. This filtering, hereafter denoted with a tilde, thus isolates the changes in heat content due to internal processes in the IGW frequency band, which can also include very fast submesoscale processes. These processes can contribute a sizable fraction of the kinetic energy and fluxes at these timescales even though they are not waves (Shakespeare et al., 2021); however, since they are highly transient and we are interested primarily in the heat variability that appears consistently throughout the year, they are unlikely to overwhelm the consistent daily signal of the internal tide. Regardless, for the sake of identifying regions with large temperature variability at fast timescales, the distinction between submesoscales processes and IGWs is relatively immaterial.
Note that this procedure for obtaining does not yield the same result as would be obtained if the model was run without surface forcing, as it does not account for surface heating that is advected away from its point of application. However, because the temporal filtering is applied over such short timescales, such residual heat would not be advected far from its origin, and the surface heating would likely not vary significantly over this area. We thus can assume that gives a fairly robust approximation of the net surface heating that should be removed at any given point to obtain . The temporal filtering tends to result in time series of small temperature variations that are due to an assortment of weak internal waves and submesoscale processes, but IGW-induced variability tends to be defined by large variations that appear near the tidal frequency and can persist for several hours (Bachman et al., 2020). Furthermore, their association with the tides means that these large variations tend to occur on a daily basis, and sometimes twice daily depending on the dominant tidal constituent. Akin to previous studies (Smith et al., 2016; Safaie et al., 2018), we therefore focus on the average range of daily temperatures observed near the surface to locate thermal refugia – that is, we take the difference of the maximum and minimum values of for each day and average these values over the entire year.
Results
Because the LLC4320 output provides an uninterrupted time series of data for a full year over the entire world, it offers an opportunity to analyze the temperature variability on reefs in novel ways, such as in terms of seasonal variations, depth, and regional dependence. To establish the trustworthiness of the model results, we first highlight a few comparisons against previous studies and observations.
Comparison with observations
Wall et al. (2015) placed Onset HOBO temperature loggers on the continental shelf in the Andaman Sea (Figures 1A, B) and documented how reefs exposed to cooling associated with large-amplitude internal waves (LAIW) escaped coral bleaching during a regional warming event. They provided a striking comparison between the temperature variability observed on the sides of Ko Miang (8.57˚ N, 97.64˚ E) that are exposed to and sheltered from LAIW. Their temperature records also showed a significant decrease in variability from the first half of the year (January to June) to the second half.
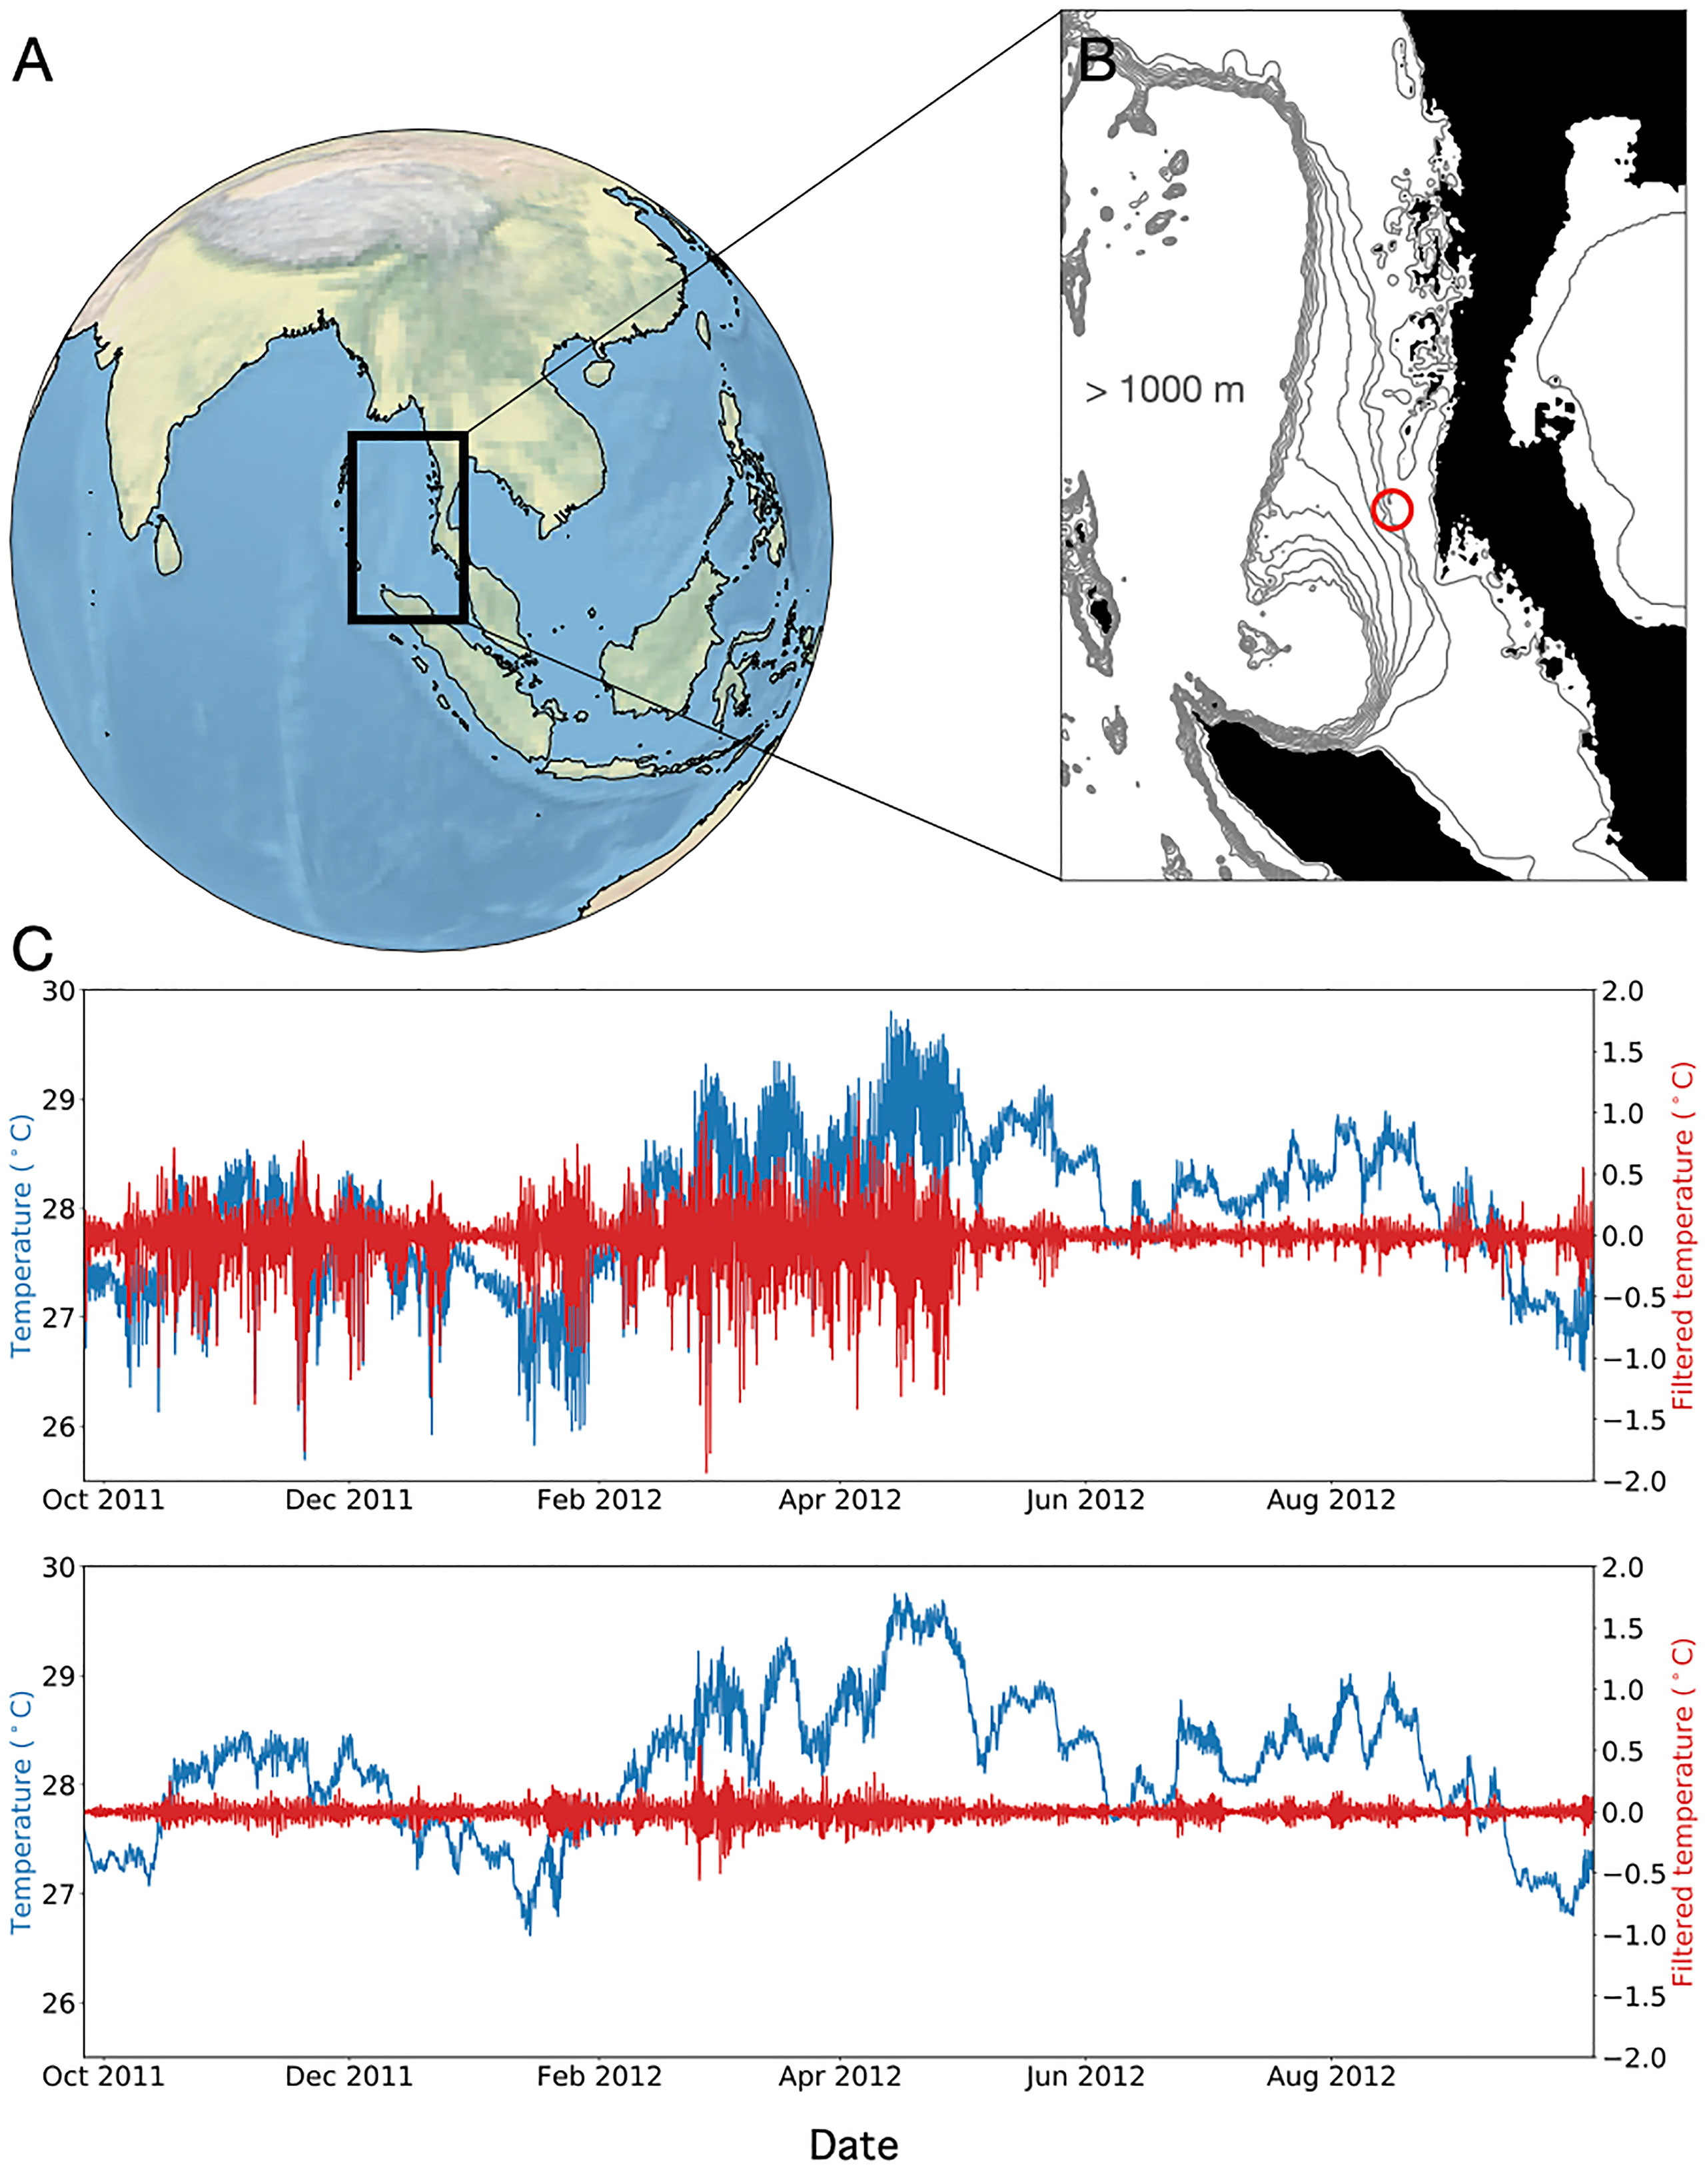
Figure 1 (A) Regional map and (B) bathymetric contours near Miang Island, the site of the Wall et al. (2015) study. (C) Model output of hourly temperature (blue) and filtered temperature (red) profiles from the west (top) and east (bottom) sides of the island, the differences of which are broadly consistent with the observations in Wall et al. (2015).
To compare against these observations the closest point to the true Miang Island coordinates was found on the LLC4320 grid. The island itself is too small to be resolved by the grid, but instead appears as a submerged seamount, or local maximum in the bathymetry (Figure 1B). To mimic the location of the HOBO loggers, two points were chosen 8 km apart on the east and west sides of the seamount. Note that the separation between the simulated loggers was larger than the actual separation in Wall et al. (2015); we did this purposefully to ensure that it was unambiguous as to which side of the seamount each logger was stationed. Although the Wall et al. (2015) observations were collected approximately one year prior to the time simulated in the LLC4320, the variability observed in the model is very similar to the that of the HOBO temperature records (Figure 1C). The west side of the seamount (Figure 1C, upper panel) experiences much larger temperature variability than the east side (Figure 1C, lower panel), and also exhibits a strong seasonal difference between the first and second halves of the year. A noteworthy difference is that the observations show far stronger variability, with several events exceeding 5°C as compared to the occasional 2°C event in the model. Such dampened variability was also observed in the simulations of Bachman et al. (2020) and is likely due to a combination of coarse vertical grid resolution and excessive viscosity needed to keep the simulation stable [e.g., the “viscous lee wave problem” Shakespeare and Hogg (2017)].
We also performed model-observation comparisons against HOBO temperature logger data collected in the Coral Triangle between 2011 and 2012 (Figure 2). Twelve HOBO temperature sensors were distributed at 20 m depth on multiple reefs around West Papua, Indonesia (1.03˚ S, 130.51˚ E) (Figures 2A, B), each logging temperature measurements every 15 minutes. The data were high-pass filtered using the procedure described in the Materials and Methods section, and the daily range of the filtered data was assembled into a time series spanning the full year.
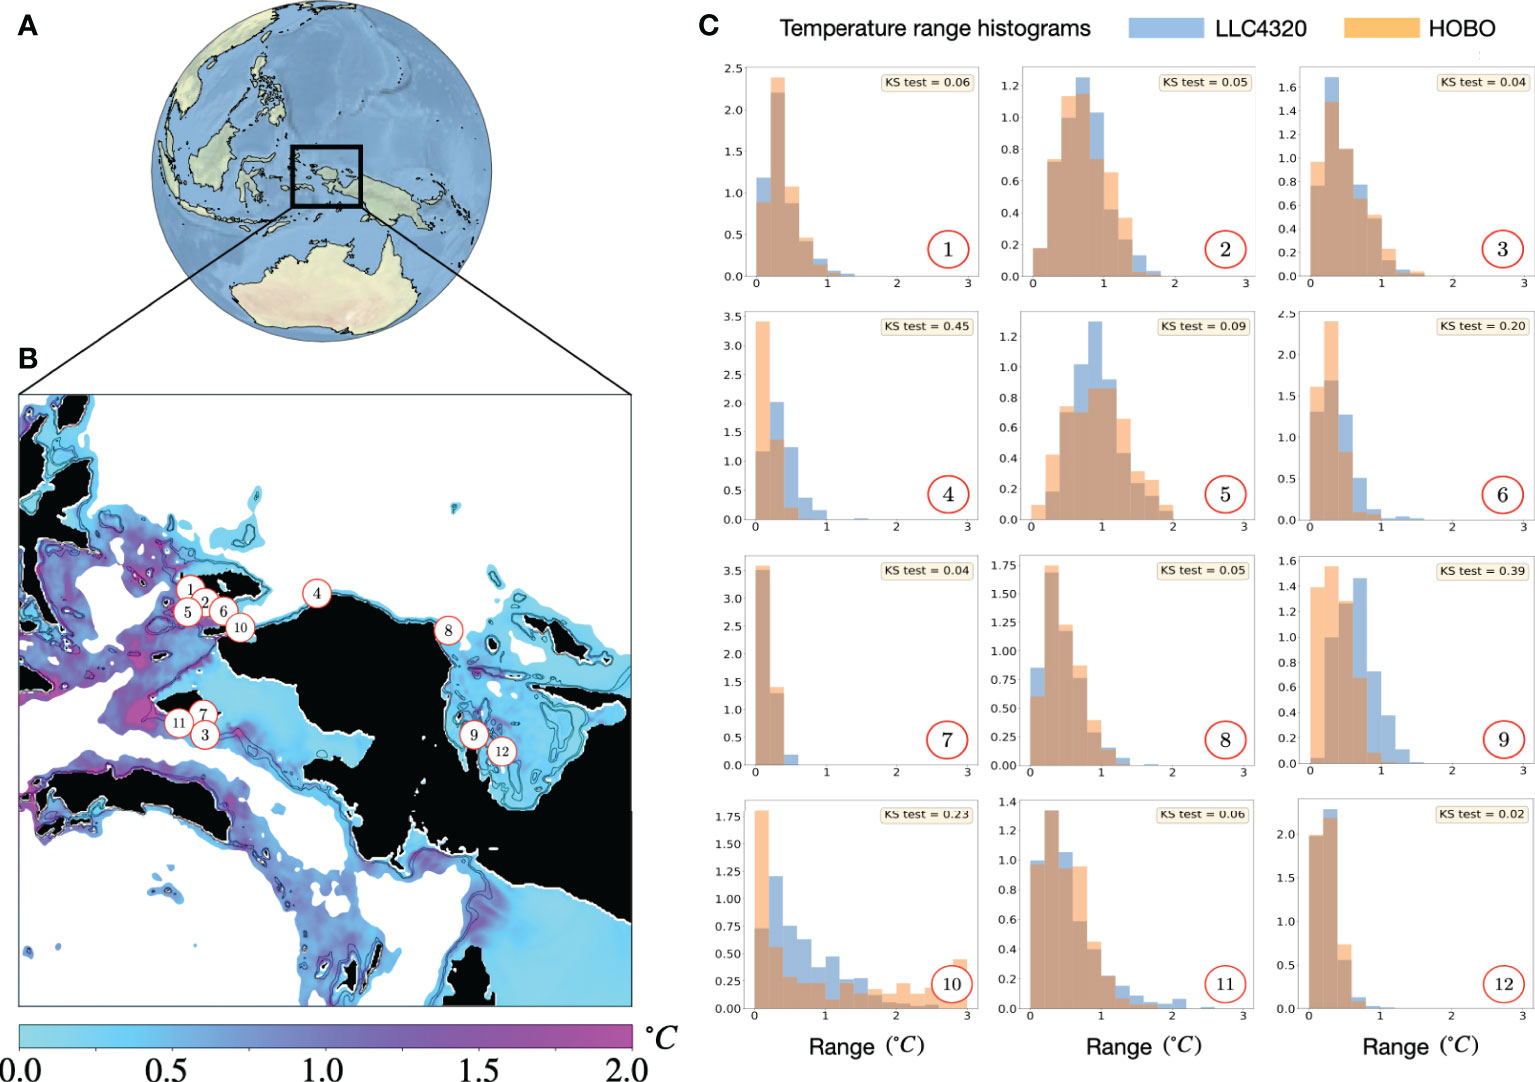
Figure 2 Model versus HOBO logger comparisons in West Papua, Indonesia (A). Twelve loggers were distributed as in (B), where the colors indicate the mean daily temperature range at 50 m depth. The daily temperature ranges observed by the loggers were used to form probability density functions, which were compared against co-located areas on the model grid (C). Model and observational PDFs generally show good agreement, as measured by the Kolmogorov-Smirnov (KS) test.
Comparisons with the Coral Triangle logger data are meant to establish that the model can capture the amplitude and probability of IGW variability over a broader region, rather than simply a pair of points as with the Wall et al. (2015) loggers. Recognizing that the model will not be able to capture specific IGW events as they were observed in reality, and that the accuracy of the bathymetry will be limited by the discretized model grid, a sensible approach is to compare the probability density functions (PDFs) of the variability over a local area. That is, for each location we calculated the PDFs of every grid point within a 5 km radius and used the best match to the PDFs from the observations (Figure 2C). The comparisons generally show good agreement, with the model being able to represent both narrow, large-amplitude distributions (histograms 7 and 12), and wider, long-tailed distributions (histograms 10 and 11). These results were also validated using a Kolmogorov-Smirnov test (“KS test”, tan insets), with many histograms showing strong matches and KS test values less than 0.1.
Mapping variability at a global scale
Given the dispersed nature of coral reefs globally and the wide variety of regional oceanographic and atmospheric conditions, a comprehensive region-by-region analysis of these data is impractical and beyond the scope of this paper. For now, we highlight a few locations in particular which may be especially interesting, and which reveal novel information that may be used to guide further studies.
We are primarily interested in variability occurring at ocean depths likely to impact reefs, i.e., shallower than 50 m. As shown in Bachman et al. (2020), the largest temperature variability often occurs where IGWs entrain cold, deep water; e.g., where bathymetry rapidly transitions from deep to shallow. Therefore, to best highlight areas where this effect occurs, we restrict our mapping to wherever the depth is shallower than 1000 m. We also show the 100 m and 200 m depth contours to indicate where the bathymetric slope is steep.
Figure 3 shows maps centered on the Coral Triangle region (A) and the Caribbean Sea (B) using this approach. An obvious feature on both maps is that variability tends to be significantly stronger where the depth transitions rapidly, i.e., where isobaths are very close together. Conversely, where the depth is shallow over broad areas the map tends to be shaded nearly uniformly light blue, indicating weak variability. It is also clear, however, that steep bathymetry alone is not a sufficient condition for large temperature variability, i.e. several regions with a rapid depth transition experience very little variability.
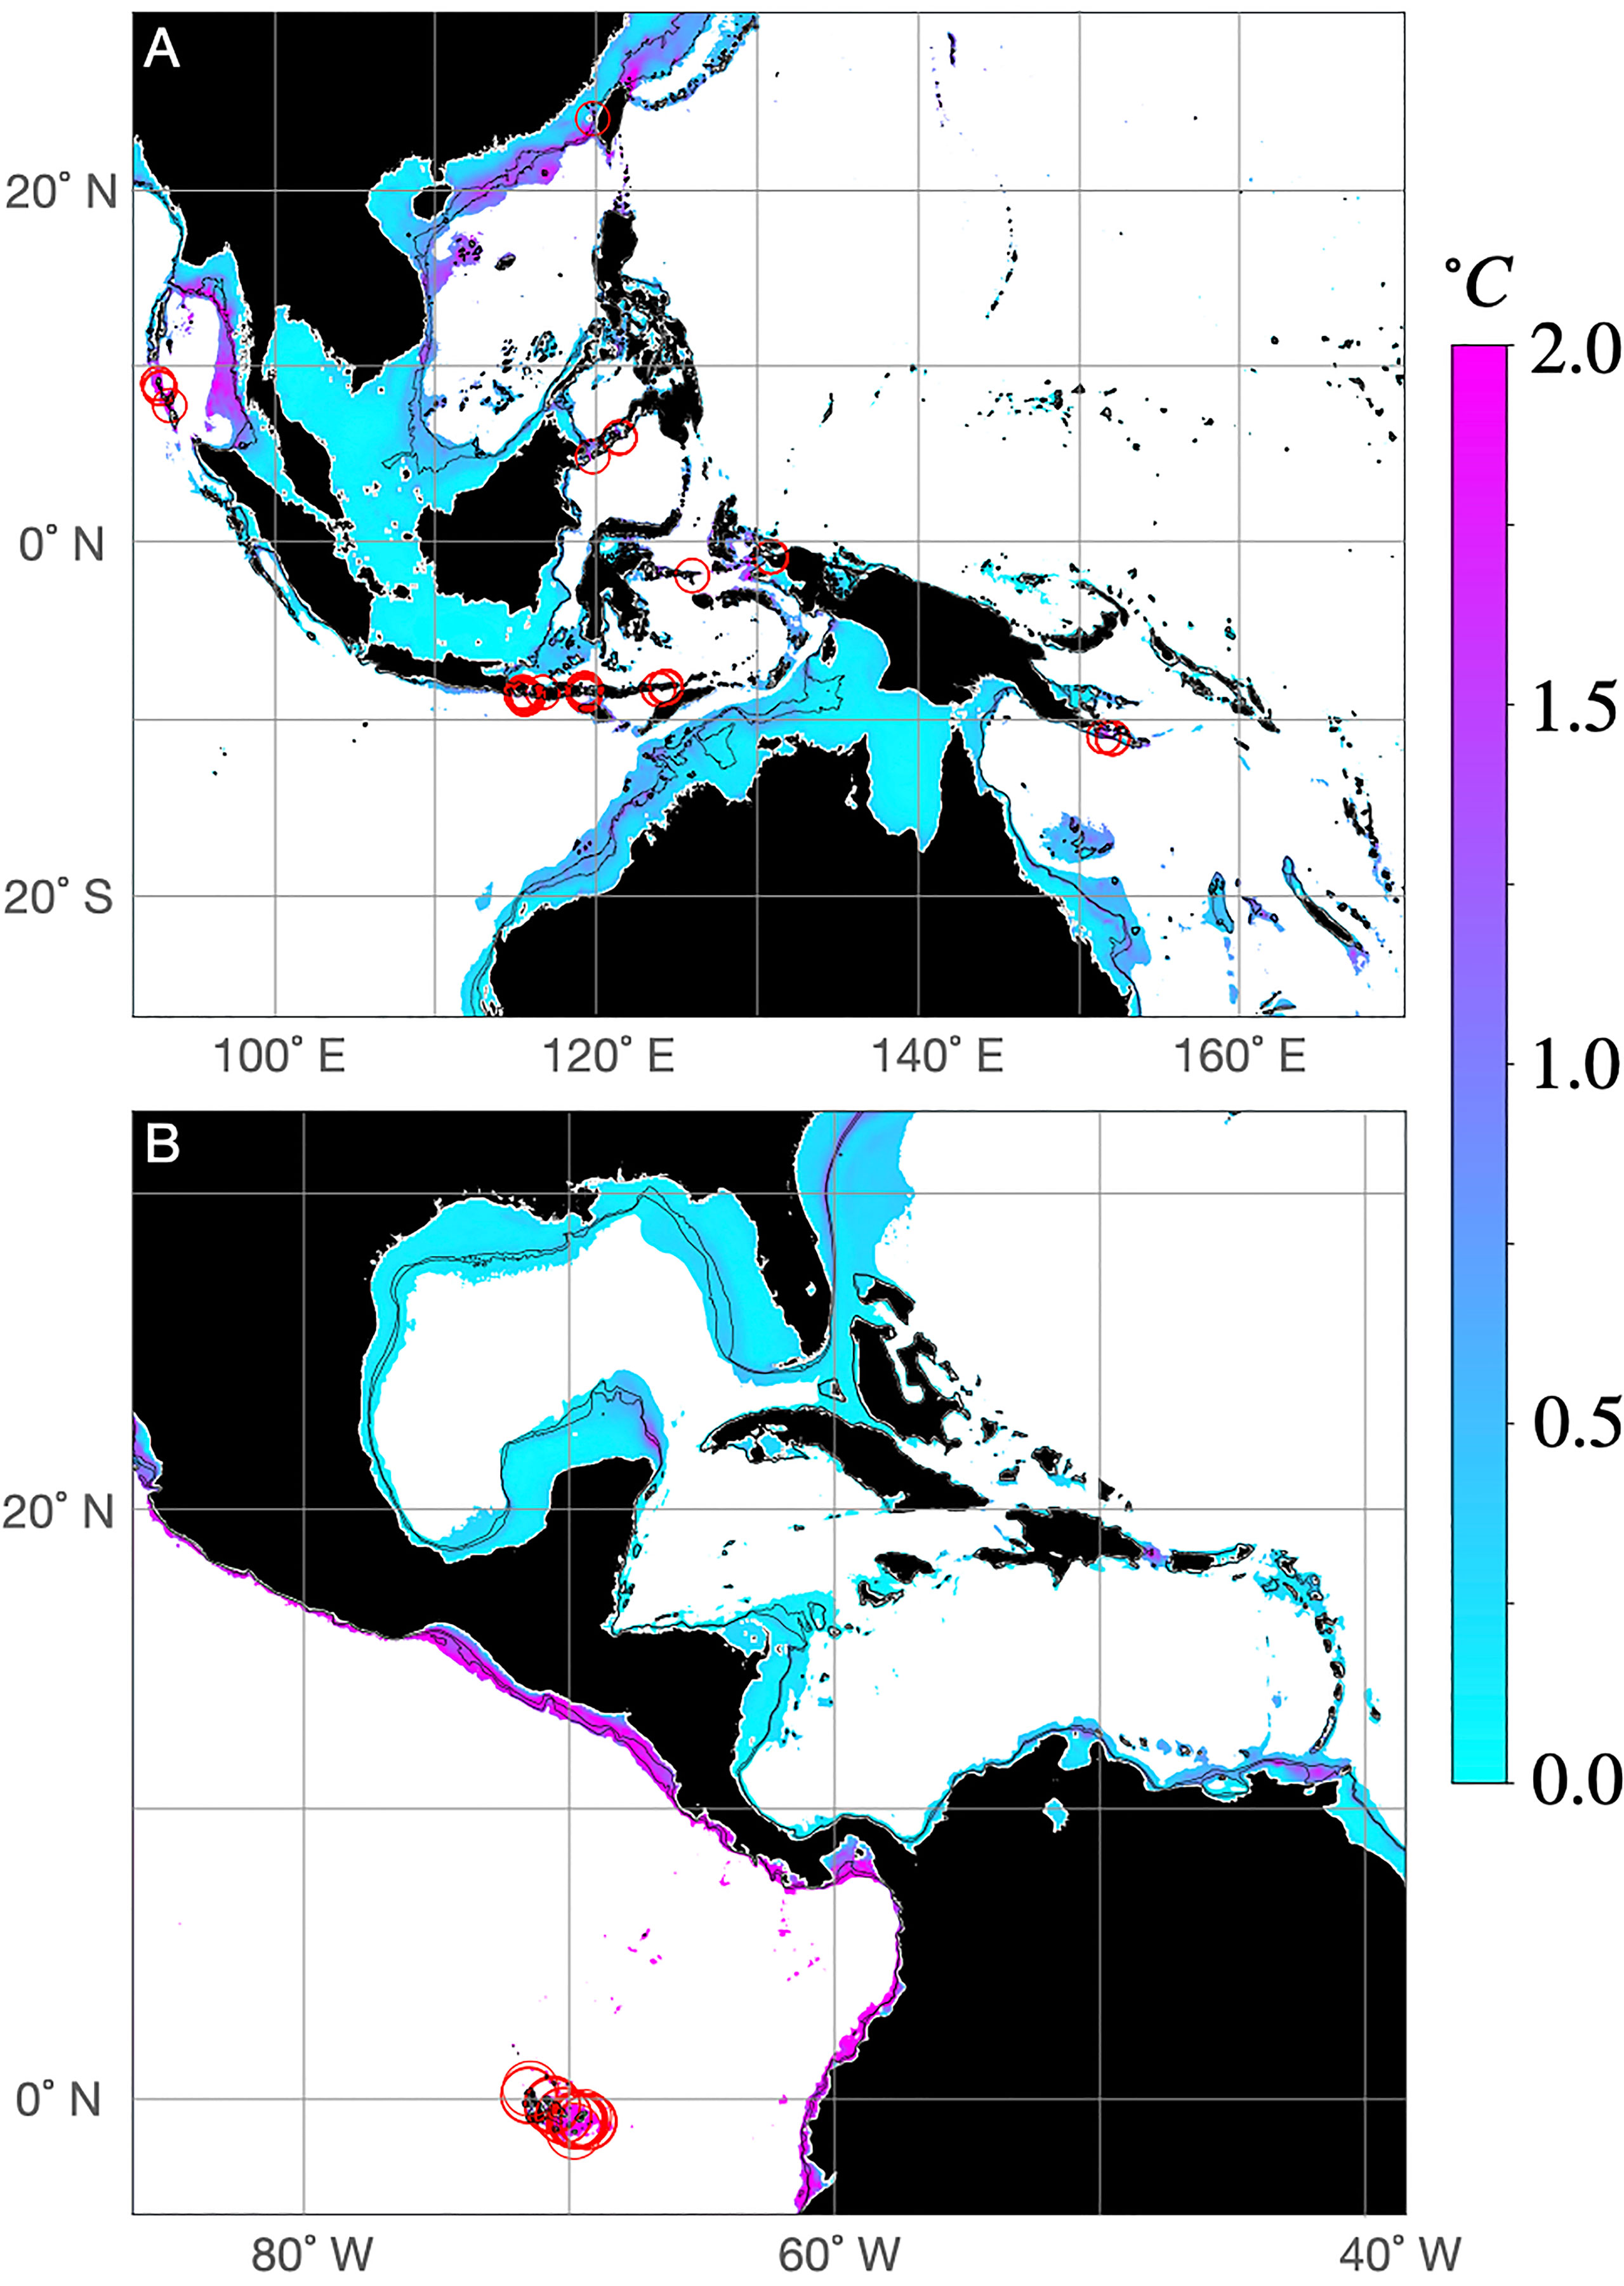
Figure 3 Mean daily temperature range at 50 m depth, shown only for locations shallower than 1000 m in (A) the western Pacific and (B) eastern Pacific/Caribbean. The 100m and 200m isolines are indicated by thin black lines. Red circles indicate locations where the daily temperature range at 10m depth exceeds 2.5°C.
Of special note in this figure are locations where the average daily temperature range at 10 m exceeds 2.5°C (denoted by red circles). These locations experience very high temperature variability within the depth range of reef-building corals, potentially making them intriguing targets for conservation. The majority of these locations occur in the Coral Triangle (Figure 3A), and essentially match the findings in Bachman et al. (2020). Additional locations in this region that were not included in the domain of the Bachman et al. (2020) simulations are observed at Raja Ampat, Indonesia, in the Taiwan Strait near Penghu, and in the Nicobar Islands in the eastern Indian Ocean. Figure 3B shows many such locations in the Galapagos Islands, but none on the Atlantic side of the Americas. Interestingly, nearly the entire west coast of the Americas shown in Figure 3B exhibit very strong temperature variability at 50 m depth; however, as will be shown later, strong variability at depth does not necessarily imply strong variability at shallower depths that would be beneficial to reefs.
Seasonal variability and mixed layer depth
Thermal refugia that are created by tidally-generated IGWs are of interest partly because the tides are not affected by climate change, and therefore these refugia might be expected to persist well into the future. One aspect of these refugia that has received less attention is their persistence on subannual timescales, which is relevant because the beneficial effects of IGWs are most important when corals experience maximal heat stress (Liu et al., 2022). The LLC4320 data allow us to examine how thermal variability may depend on season, and whether the strength of some refugia may depend on the background ocean state.
To begin it is worth thinking kinematically about what background conditions would be conducive for large temperature variability. For an IGW of a given amplitude, its effects on the temperature variability near the surface depend partly on the proximity of the cool water that will be entrained from below. A location on the reef that is proximal to both warm and cool water will likely experience larger variability than one that is surrounded only by warm water (Figures 4A, B). Since most locations in the tropical ocean tend to feature a well-mixed surface layer bounded below by a highly stratified thermocline, this implies that greater temperature variability on a reef should occur as the thermocline depth comes closer to the reef depth, i.e. when the thermocline shoals during the local summer.
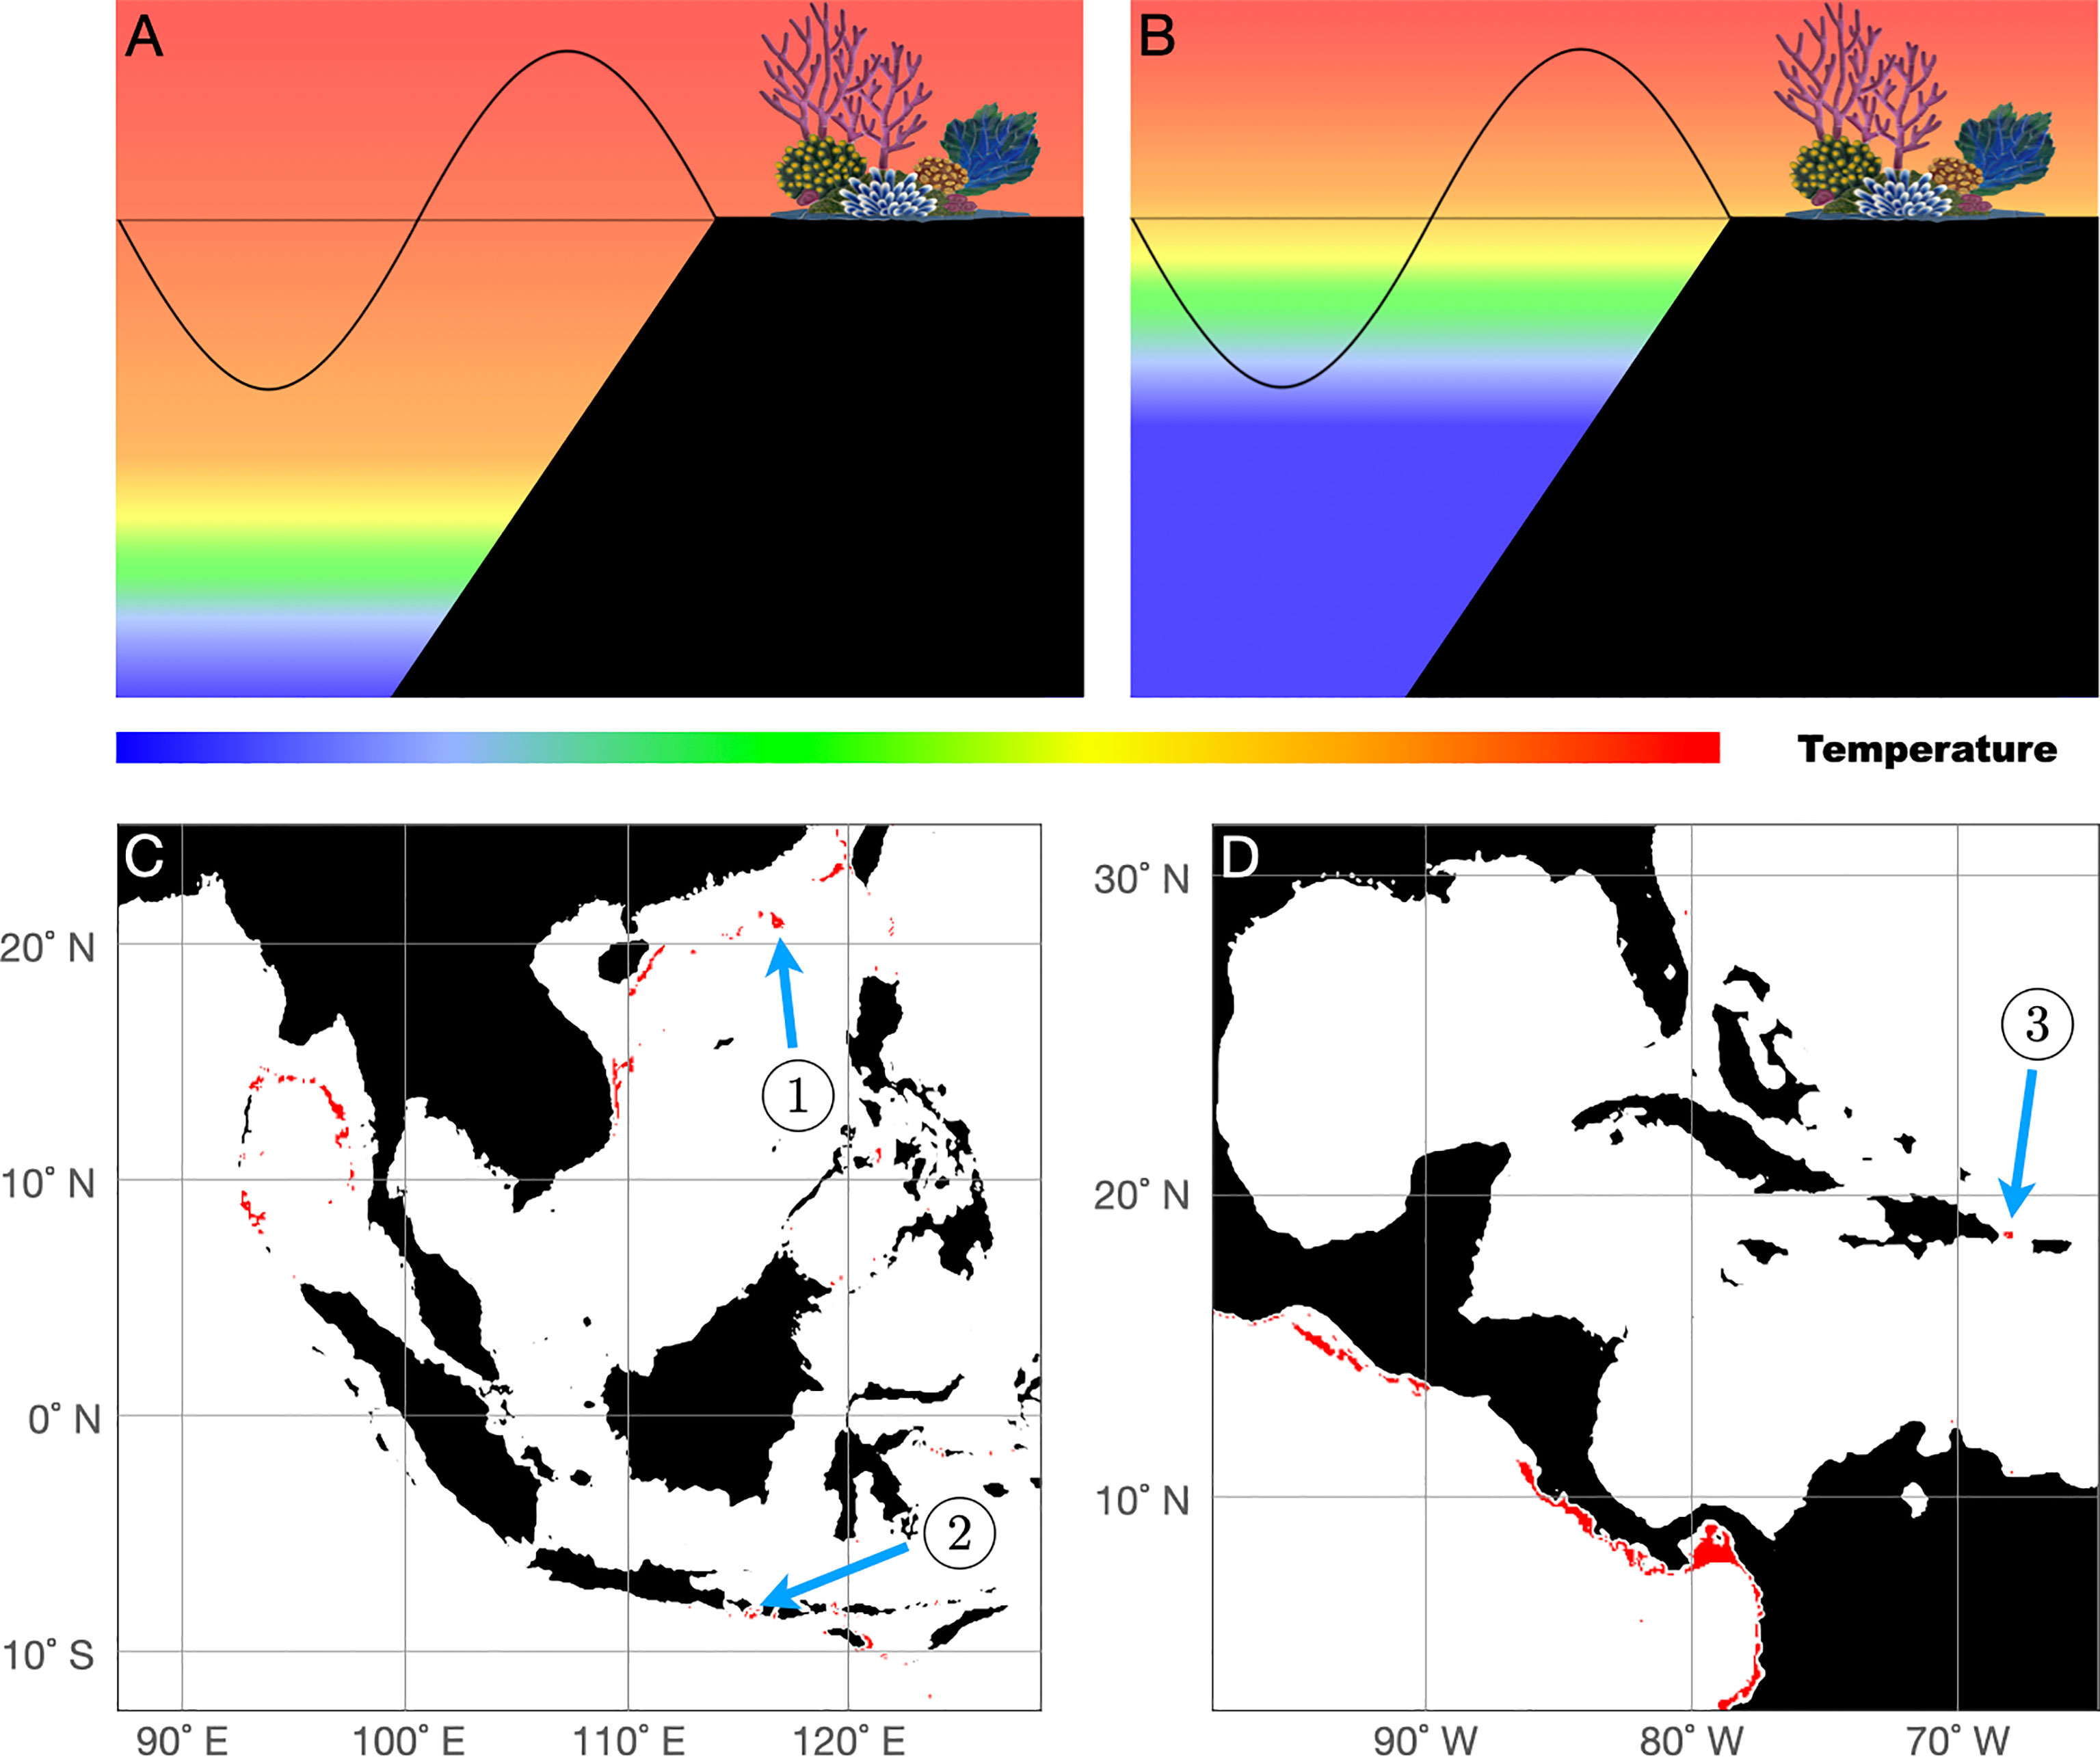
Figure 4 (A) A tidally-generated internal wave near a shallow water coral reef oscillates over a smaller range of temperatures when the mixed layer is deep versus (B) when it is shallow. (C, D) Selected locations where the difference between the maximum and minimum monthly-averaged daily range in temperature at 10 m depth exceeds 1°C, indicated in red. Specific locations highlighted in Figure 5 are indicated by blue arrows. ①: Dongsha Atoll; ②: Lombok Strait; ③: Mona Passage.
The degree to which this concept holds depends on several other factors, such as winds, surface wave conditions, or seasonal upwelling, so we do not expect it to apply everywhere. To identify sites where the seasonality is especially pronounced, at each location we averaged the daily temperature range for each month and took the difference in this averaged range between the most and least variable months. Areas where the difference exceeds 1°C at 10 m depth are shown as red patches in Figure 4C for the western Coral Triangle region, and in Figure 4D for Central America and the Caribbean Sea. Most of the highlighted areas closely correspond with the most variable regions in Figure 3. However, several locations are marked in Figure 4 that do not lie in the red circles in Figure 3, meaning that they may experience high variability through only part of the year.
Three locations, indicated by blue arrows in Figures 4C, D, are examined in more detail. Location ① indicates Dongsha Atoll, which is a well-known study site for both coral ecology and IGW behavior Wang et al. (2007); Fu et al. (2012); Li et al. (2013); Reid et al. (2019); Davis et al. (2020). Location ② is within the Lombok Strait area, which is also known for exceptional internal wave activity Susanto et al. (2005); Ningsih et al. (2010); Matthews et al. (2011). Location ③ is in a shallow region in the Mona Passage, which is a lesser-known but prominent region of IGW generation in the Caribbean Sea (Rosario-Llantín, 2000; Zaron, 2019).
Figure 5 shows time series of the mixed layer depth (MLD, blue), daily range of sea surface temperature (SST, green), and daily temperature range at 10 m depth over the full study period at each of these locations. A common feature at all three locations is an obvious negative correlation between the MLD and the daily temperature range at 10 m. When the mixed layer deepens the temperature variability is reduced, though the behavior at each location ranges from the variability being essentially shut off completely (Dongsha Atoll, Figure 5A) to being only slightly affected (Lombok Strait, Figure 5B). Interestingly, the plots differ in terms of the timescales over which this negative correlation holds. For example, Dongsha Atoll shows a very weak correlation at short timescales but a period of several months where the mixed layer is deep, and the variability is minimal (and vice versa). Lombok Strait also tends to show low correlation at short timescales except for three very conspicuous events between January 2012 and April 2012 where the mixed layer became very deep, and the temperature variability drops nearly to zero. Historical weather data from the region indicates that these events coincided with strong precipitation and thunderstorms1.
In contrast, Mona Passage (Figure 5C) shows a very strong correlation between these fields at short timescales, where the MLD and 10 m range oscillate with opposite phase at the frequency of the spring tide. These plots demonstrate that, depending on location, the temperature variability in shallow water can depend on the background ocean state and season, the tidal phase, and even isolated weather events.
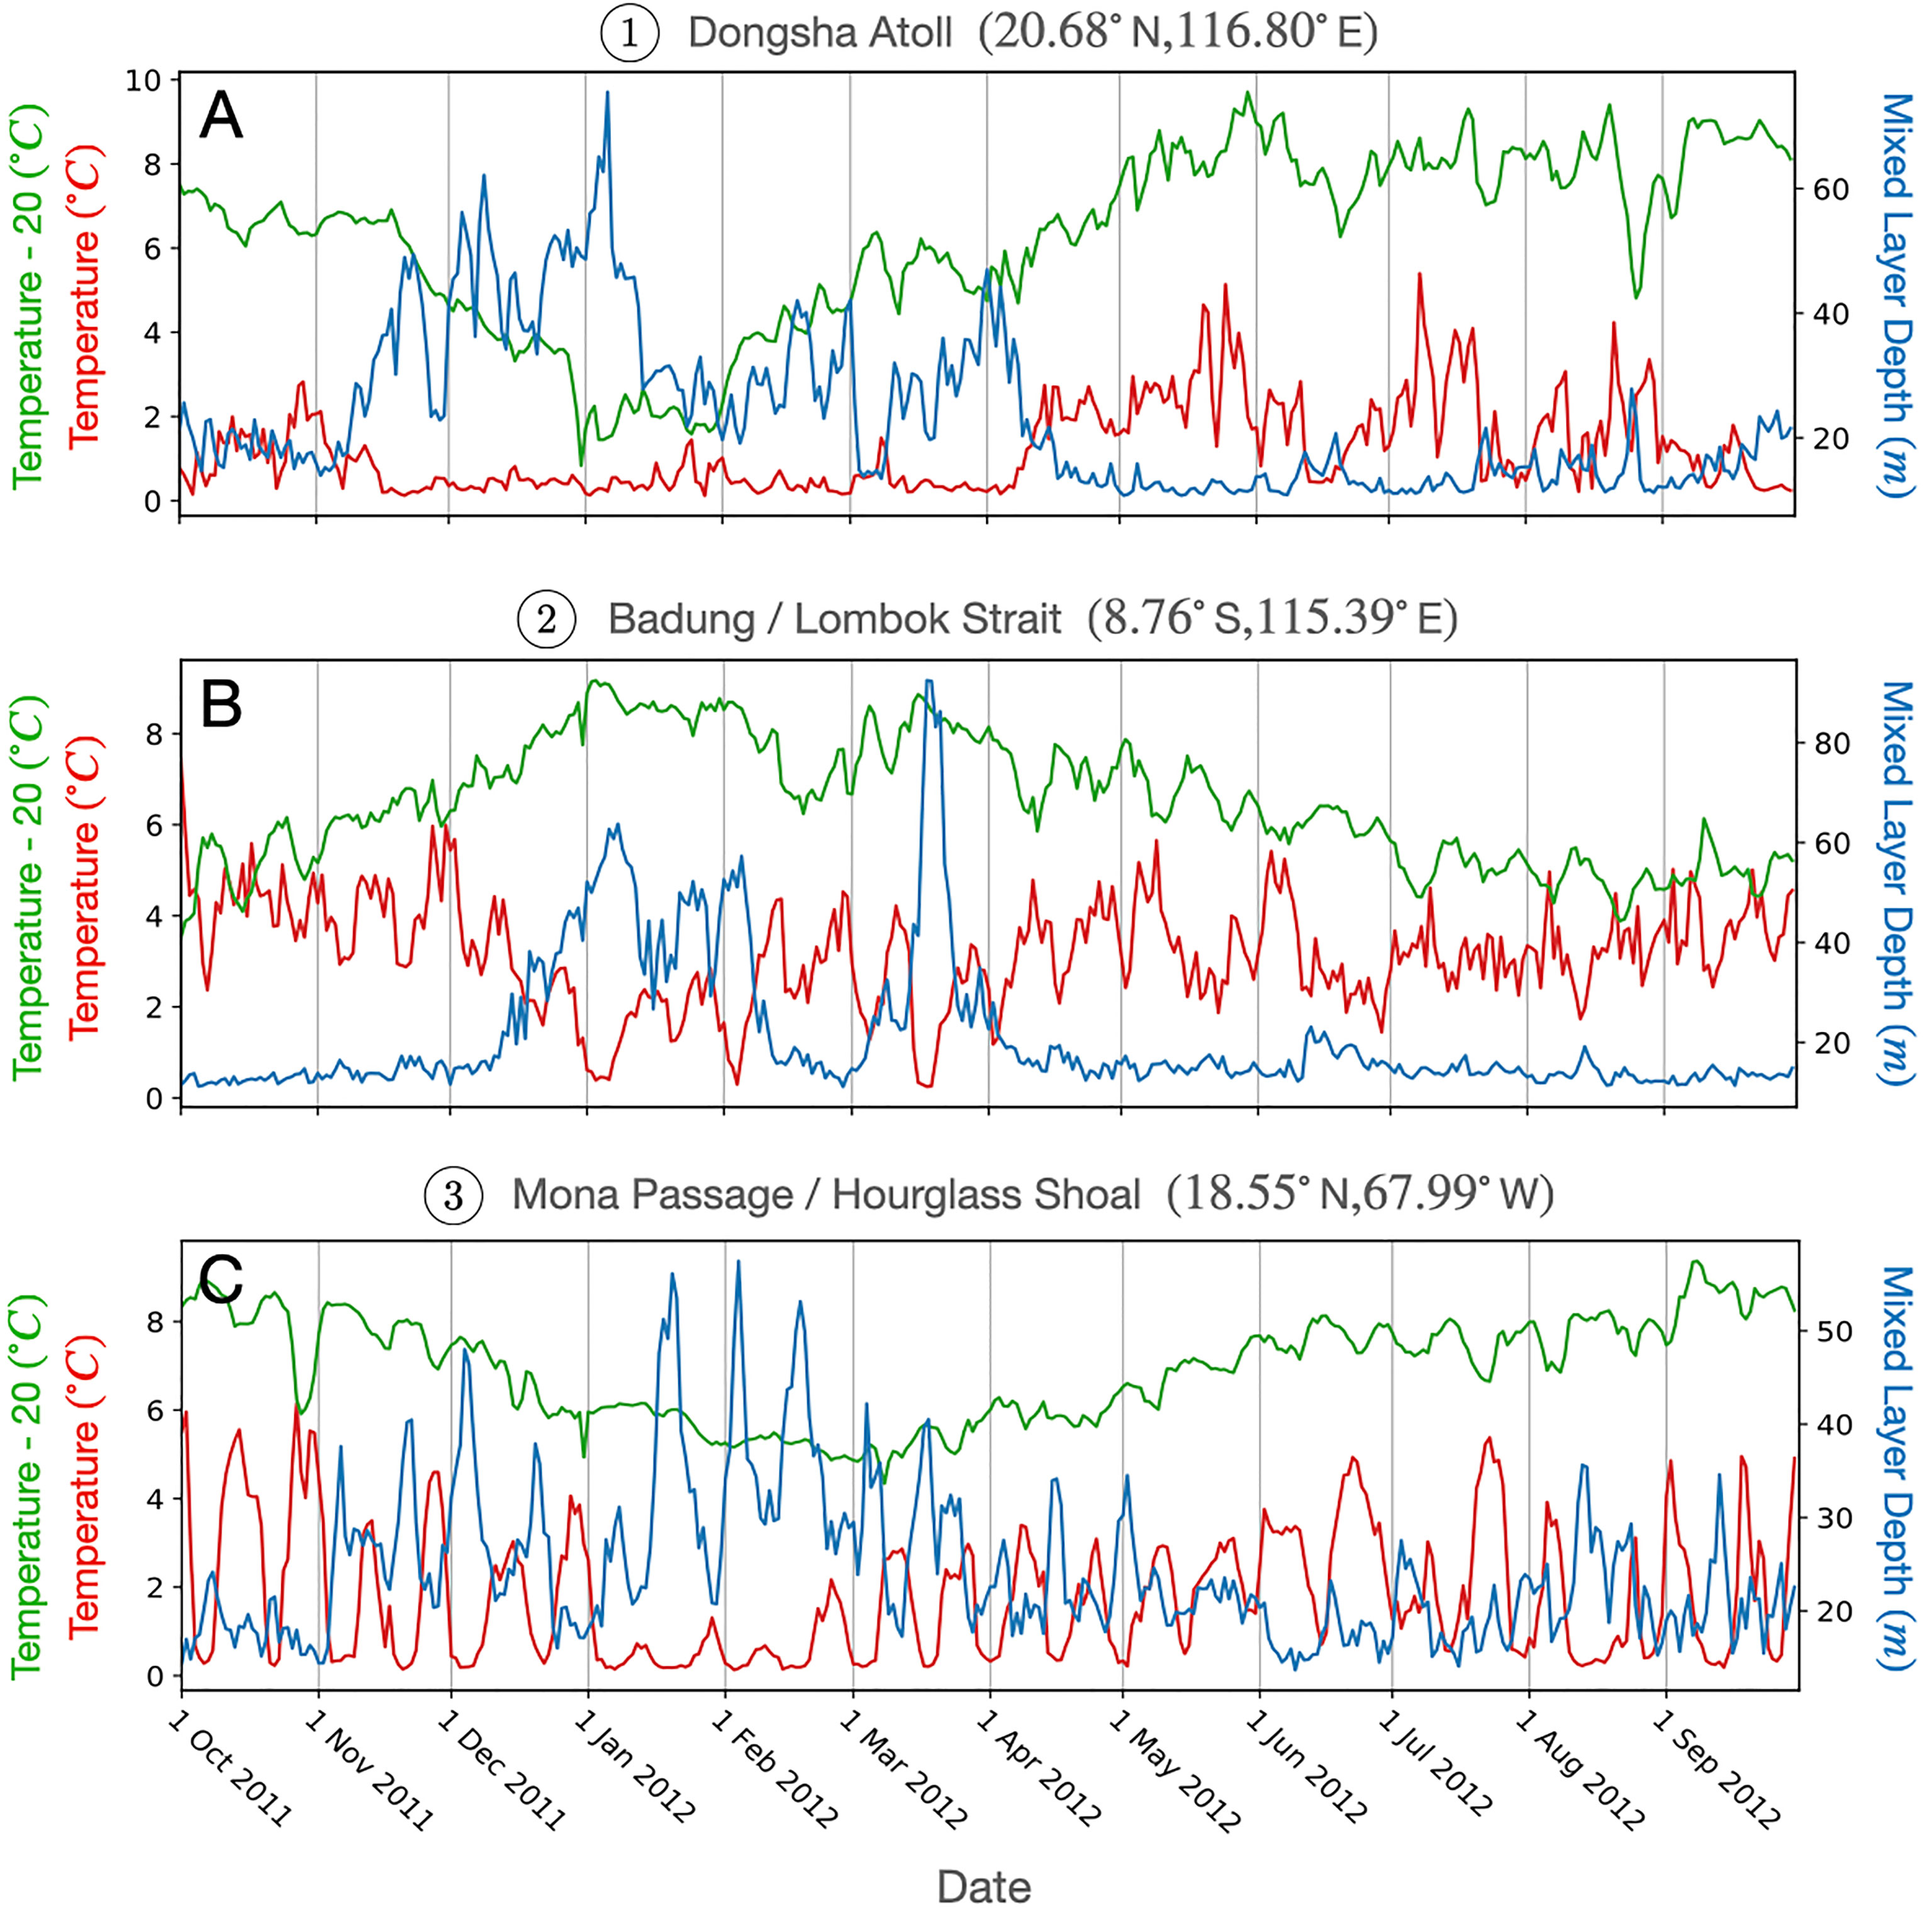
Figure 5 Time series of sea surface temperature (SST, green), daily temperature variation at 10 m (red), and mixed layer depth (MLD, blue) for the locations indicated in Figure 4.
Given that subsurface observations are relatively sparse on a global scale while detailed surface observations can easily be obtained through remote sensing, it is natural to wonder whether thermal refugia can be reliably detected through surface observations. Put another way, is subsurface temperature variability reflected in the variability of the SST? To investigate this possibility, the Pearson correlation coefficient (r) between the time series of SST and 10 m temperature variability was measured for the three locations in Figure 5. The results showed very different behaviors from each location, with the temperatures showing moderate correlation at Dongsha Atoll (r = 0.51), negative correlation at Lombok Strait (r = - 0.57), and essentially no correlation at Mona Passage (r = 0.14). Given that these three samples are insufficient to draw any conclusions about whether these variables correlate more broadly, we similarly measured the correlation coefficients at every location from 40˚ S to 40˚ N where depth is < 500 m and average daily temperature range at 10m > 1.0˚ C, amounting to 63,782 locations in all (not shown). The mean r over all locations was 0.32, with a standard deviation of 0.36. Over 23,000 samples exhibited r > 0.5, but over 12,000 samples also showed r < 0.0. In all, though certain locations do exhibit very strong correlation between surface and subsurface temperature variability, these statistics suggest that surface variability is not a reliable indicator of thermal refugia. As a rule of thumb, a lack of surface variability does not mean a subsurface thermal refugium is absent (i.e. subsurface observations might be needed to confirm), but large surface variability likely means that there is also large variability below and a refugium is present.
Depth dependence of variability
Most projections of coral bleaching rely on modeled sea surface temperatures (van Hooidonk et al., 2013; Yara et al., 2014; Langlais et al., 2017; Kleypas et al., 2021) that do not resolve thermal refugia. The results from previous sections show that refugia can vary significantly in their strength and yearly timing, but there remain questions regarding how they vary with depth. Namely, do there exist refugia that affect only deeper parts of certain reefs, or would one expect that a refugium generally extends over all depths of a given reef? As with the previous results, it is easy to anticipate that the answer to these questions depends on location, timing, and the oceanic background state. To provide some insight we selected the six locations with largest daily temperature variability at 10 m and 50 m depths (Figures 6B, C, respectively) and analyzed the variability at four different depths at each location (surface, 10 m, 25 m, and 50 m). All twelve locations show that even very large subsurface variability projects weakly onto the SST (blue bars), in support of the results from the previous section. A systematic behavior among these locations is that large variability at 10 m (Figure 6B) also implies large deeper variability as well. Conversely, the locations with the largest 50 m variability can have quite weak variability at shallower depths (Figure 6C). A kinematic explanation for this behavior is that when cool water is able to move all the way up to 10 m depth it is also moving past the 50 m depth mark as well, implying similar variability at both depths. However, (Figure 6C) suggests that there are locations where IGWs can only move cold water up past 50 m depth but not all the way to 10 m depth. Granted, the depth of the thermocline and the background stratification of the ocean play an important role as well, so a purely kinematic explanation is inherently incomplete. In all, though, a conclusion one can draw from Figure 6 is that there can exist deep refugia that may not cover the depths of reef-building corals but may offer some benefit to deep-water reefs. Such refugia would naturally be more difficult to locate but may be worth investigating in the context of coral and biodiversity conservation.
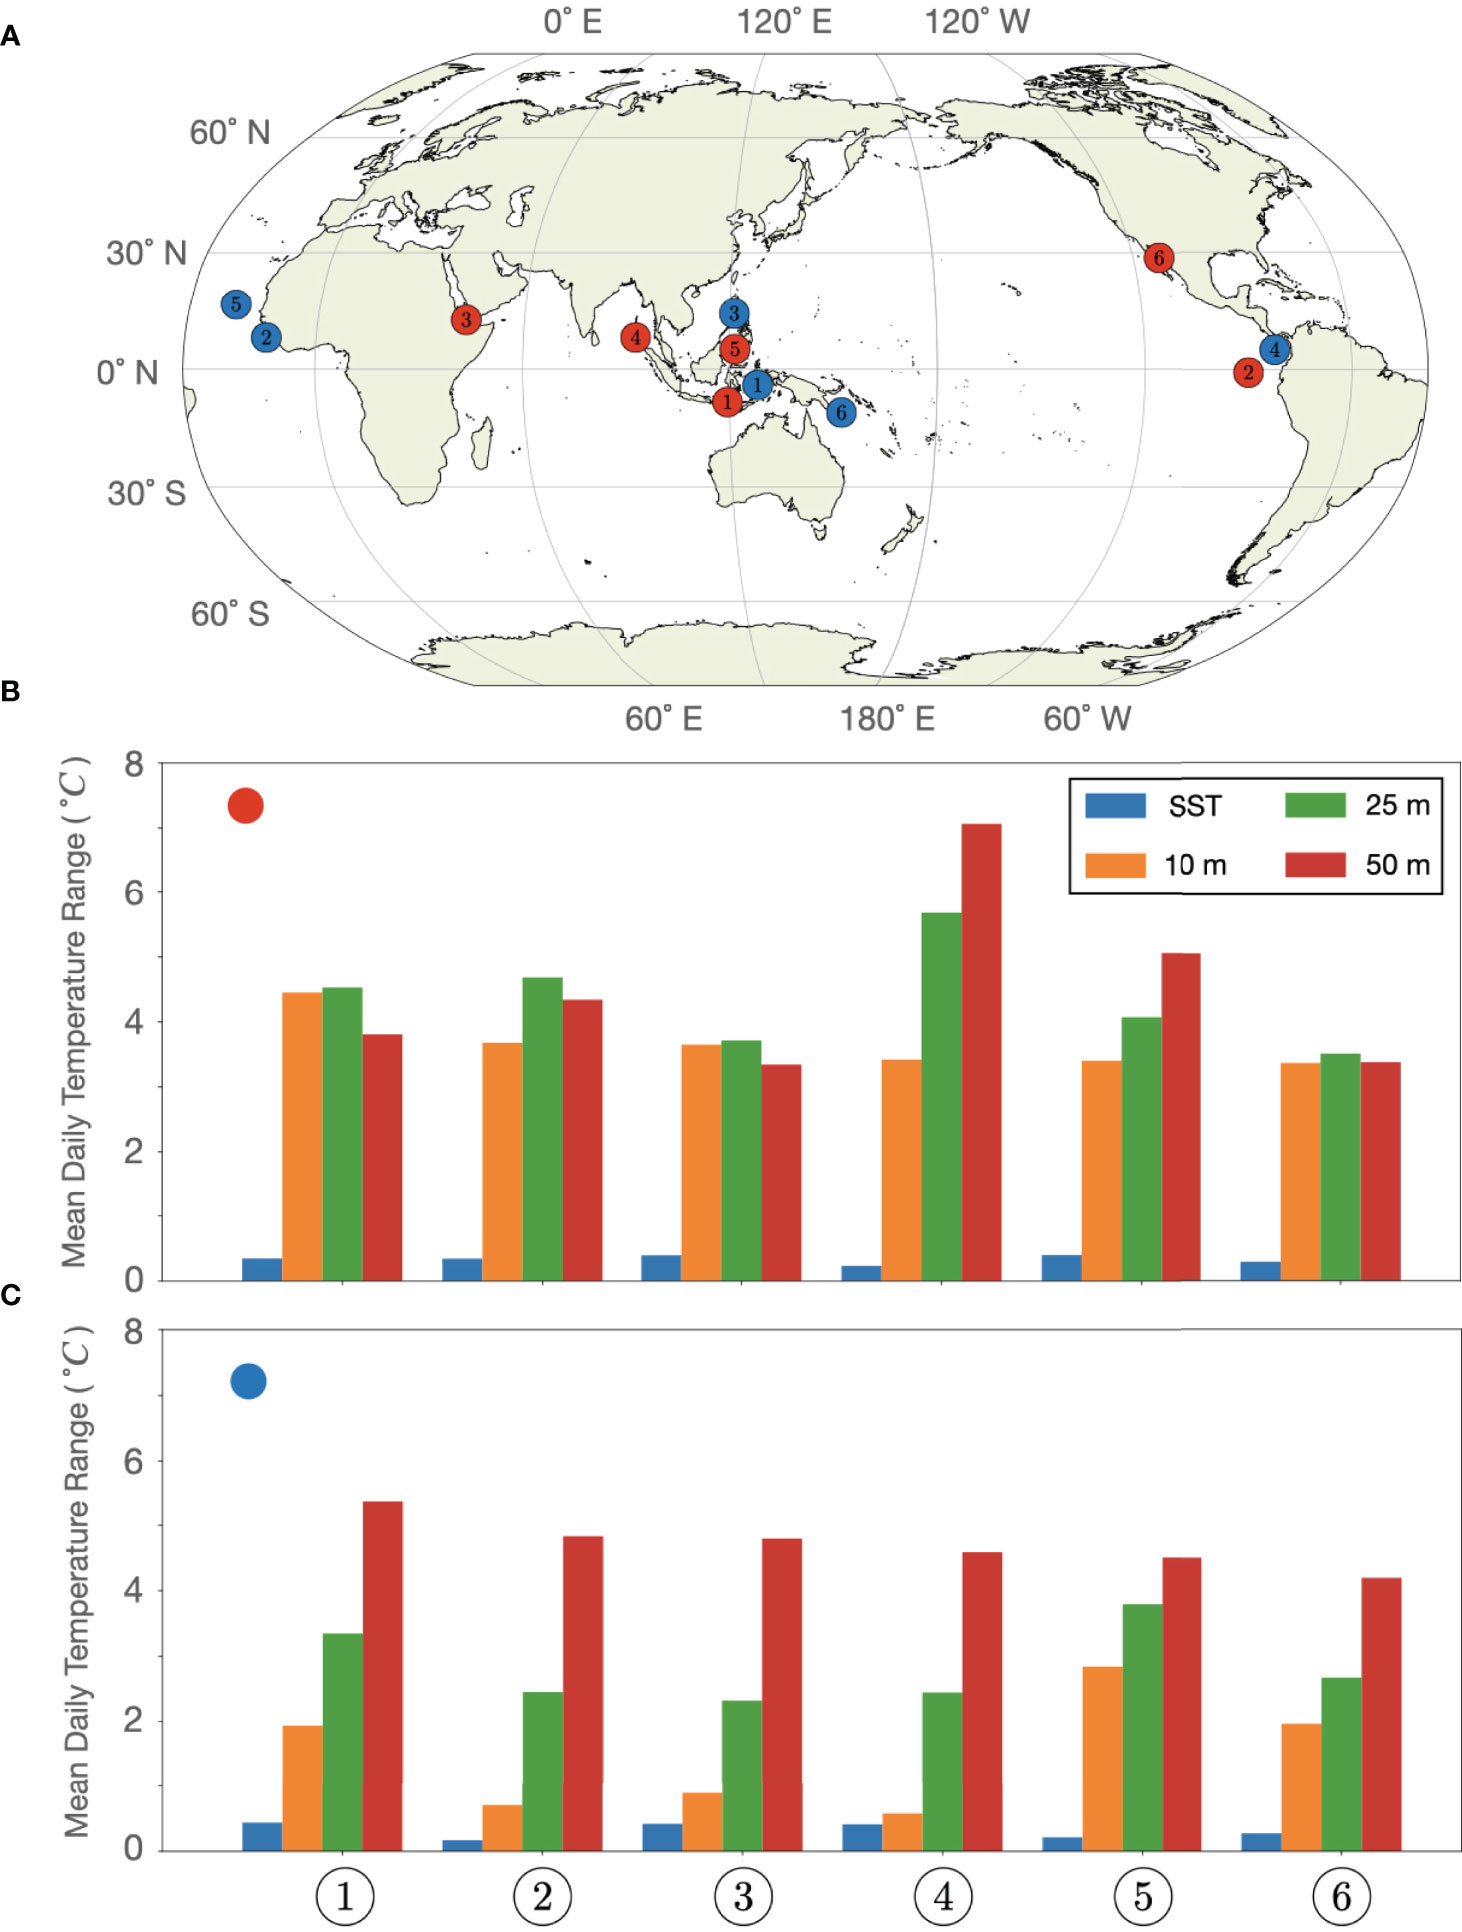
Figure 6 (A) Locations with largest mean daily temperature range at 10 m (red) and 50 m (blue) depths. Temperature ranges at the sea surface, 10 m, 25 m, and 50 m are shown for the red locations in (B) and blue locations in (C). Red: ①: Sape Strait, 8.56° S 119.23° E, ②: Galápagos Islands, 0.96° S 89.59° W, ③: Bab al-Mandab Strait, 12.64° N 43.39° E, ④: Andaman-Nicobar Ridge, 8.79° N 92.86° E, ⑤: Sulu Archipelago, 6.02° N 121.44° E, ⑥: Sea of Cortez, 28.76° N 112.49° W Blue: ①: Manipa Strait, 3.16° S 127.82° E, ②: Sierra Leone Rise, 8.35° N 14.32° W, ③: Verde Island Passage, 13.58° N 121.09° E, ④: Panama Fracture Zone, 5.20° N 81.93° W, ⑤: Cape Verde Islands, 16.63° N 24.61° W, ⑥: Pocklington Trough, 11.22° S 152.09° E.
Discussion
The identification of thermal refugia for coral reefs is a priority in guiding future efforts in reef conservation and restoration. Most attempts to do so have relied on sea surface temperature observations and projections, but recent efforts have explored IGWs for their potential to maintain conditions favorable for reef survival, at least at local scales.
When IGWs entrain deeper cooler water into coral reef habitats, the potential benefits to corals and other reef organisms are exposure not only to cooler temperatures and higher food supply, but also to daily fluctuations in temperature, which have been shown to increase coral resistance to bleaching (Safaie et al., 2018). The latter is important because the local conditioning of the corals promotes resistance to bleaching even during periods when IGW-induced conditions are absent.
Our analysis shows that high resolution ocean models can identify where IGWs are most likely to occur, with locations broadly consistent with those of Storlazzi et al. (2020). Their analysis projected the cooling effect of internal tides in extending coral reef survival over the next few decades. They applied a global map of Mode-1 M2 internal tides (Zhao et al., 2016) to estimate temperature fluctuations and cooling at various reef depths. Their analysis highlights those locations that benefit from internal tides are mostly concentrated in the Indian and central to western Pacific Oceans, and particularly in the Coral Triangle region.
Our global model analysis identified similar regions of interest, with the bathymetrically complex Coral Triangle region showing the most promise for finding thermal refugia. This is consistent with a recent high-resolution modeling study of the Coral Triangle that identified where tidally forced internal waves are generated (Bachman et al., 2020). Reefs of the Galápagos and the Pacific coast of Central America also experience high temperature variability.
This region is a good demonstration, however, that favorable conditions imposed by IGWs are not necessarily consistent year-round, because factors such as thermocline depth, tidal range, and other oceanic and atmospheric forcings also determine if and when thermal conditions are present at depths beneficial to reefs. IGWs can have detrimental effects on reefs as well, such as depressing coral growth (Schmidt and Richter, 2013) or limiting the maximum depth of reef development (Wyatt et al., 2020). The Galápagos and eastern Pacific locations, for example, experience a deepened thermocline during El Niño events so that IGW-induced cooling would be diminished. However, the high variability that local corals experience during non-El Niño months may condition them to be more resilient to the warming, or to recover more quickly if they build up energy reserves during periods when IGW conditions stimulate increased food availability.
In contrast to the Pacific and consistent with Storlazzi et al. (2020) and Chollett and Mumby (2013), few Atlantic reef locations were identified as likely candidates to be thermal refugia. Mona Passage between Dominican Republic and Puerto Rico is one such location where IGW generation appears to stimulate temperature variability within the depth range of reef growth. Cooling on reefs by internal waves has also been documented in the Florida Keys Leichter et al. (1996; 2005), but was not revealed in our analysis, perhaps because the temperature variability was too seasonal to produce a strong annual signal. A logical next step is therefore to take a closer look at where seasonal IGW temperature variability occurs, and particularly if it occurs during warming periods.
This analysis of a high-resolution global climate simulation such as the LLC4320 is the first to mechanistically confirm the presence of IGW-induced refugia for coral reefs. As shown in Figure 6, the temperature variability at depth is not reflected in SST or SST variability and should be considered despite the diminished potential of finding refugia based on SST alone (Dixon et al., 2022). Since high-resolution subsurface temperature observations on coral reefs are still relatively rare, ocean model simulations can provide guidance as to where such observations should be obtained.
The LLC4320 model provides the opportunity to identify globally those regions that show promise as thermal refugia. A global and zoomable map of these regions can be found at https://ncar.github.io/coral-viz/. The visualizations on this website are provided for the surface and at depths of 10 m, 25 m, and 50 m. These are meant as a visual guide for scientists, ecologists, conservationists, and other interested parties to understand how numerical models can aid in the effort to protect coral reefs. It is the authors’ hope that the website also spurs interest in conducting further studies, particularly of locations that show promise as refugia but have not been examined in detail by observations or numerical models.
The expense of running a high-resolution model limited the global model output to 1-year of data, but the methodologies presented here can be applied to high-resolution regional models that are run over longer periods, and with future climate forcing. The benefits of IGWs for coral reefs appear to be promising, but additional questions remain regarding their effectiveness in creating thermal refugia into the future. For example: (1) How durable will thermal refugia be with climate change? How will other forcings either increase or decrease their effectiveness (e.g. DeCarlo et al., 2015; Liu et al., 2022)? (2) How effective is conditioning by high-temperature variability in building coral reef resilience? (3) Do reefs affected by IGW favor coral species with traits that are more likely to benefit from IGW conditions (e.g., heterotrophy), and have those regions demonstrated greater resistance to warming events?
Data availability statement
The datasets presented in this study can be found in online repositories. The names of the repository/repositories and accession number(s) can be found below: The LLC4320 data can be directly accessed from the ECCO Data Portal (https://data.nas.nasa.gov/ecco/data.php), or conveniently downloaded using the xmitgcm package (https://xmitgcm.readthedocs.io/en/latest/index.html). Interactive maps of the filtered model output can be accessed at https://ncar.github.io/coral-viz/.
Author contributions
SB led the bulk of the modeling, analysis, and writing. JK contributed to the development of the research hypotheses and approach, analyses of observational data, and writing. ME and ES provided the in situ data for the Coral Triangle region and contributions to the text.
Funding
This material is based upon work supported by the National Center for Atmospheric Research (NCAR), which is a major facility sponsored by the National Science Foundation (NSF) under Cooperative Agreement 1852977. The in situ temperature monitoring in West Papua was supported through the financial support of the David and Lucile Packard Foundation’s Ecosystem-Based Management Program. The interactive global atlas was developed by Collin Sinclair, Matt Rehme, and Nihanth Cherukuru of NCAR’s Computational and Informational Systems Lab.
Acknowledgments
The authors wish to thank the Estimating the Circulation and Climate of the Oceans (ECCO) team (https://ecco.jpl.nasa.gov) and NASA High-End Computing (HEC) from the NASA Advanced Superconducting (NAS) Division at the Ames Research Center for the LLC4320 simulation data. We also wish to thank two anonymous reviewers for their constructive comments.
Conflict of interest
The authors declare that the research was conducted in the absence of any commercial or financial relationships that could be construed as a potential conflict of interest.
Publisher’s note
All claims expressed in this article are solely those of the authors and do not necessarily represent those of their affiliated organizations, or those of the publisher, the editors and the reviewers. Any product that may be evaluated in this article, or claim that may be made by its manufacturer, is not guaranteed or endorsed by the publisher.
References
Arbic B. K., Alford M. H., Ansong J. K., Buijsman M. C., Ciotti R. B., Farrar J. T., et al. (2018). Primer on global internal tide and internal gravity wave continuum modeling in HYCOM and MITgcm. New Front. Operation. Oceanogr. 1, 307–392. doi: 10.17125/gov2018.ch13
Bachman S. D., Shakespeare C. J., Kleypas J., Castruccio F. S., Curchitser E. (2020). Particle-based Lagrangian filtering for locating wave-generated thermal refugia for coral reefs. J. Geophys. Res.: Oceans. 125, e2020JC016106. doi: 10.1029/2020JC016106
Bay R. A., Rose N., Barrett R., Bernatchez L., Ghalambor C. K., Lasky J. R., et al. (2017). Predicting responses to contemporary environmental change using evolutionary response architectures. Am. Nat. 189, 463–473. doi: 10.1086/691233
Chollett I., Mumby P. J. (2013). Reefs of last resort: Locating and assessing thermal refugia in the wider Caribbean. Biol. Conserv. 167, 179–186. doi: 10.1016/j.biocon.2013.08.010
Davis K. A., Arthur R. S., Reid E. C., Rogers J. S., Fringer O. B., DeCarlo T. M., et al. (2020). Fate of internal waves on a shallow shelf. J. Geophys. Res.: Oceans. 125, e2019JC015377. doi: 10.1029/2019JC015377
DeCarlo T. M., Karnauskas K. B., Davis K. A., Wong G. T. F. (2015). Climate modulates internal wave activity in the northern South China Sea. Geophys. Res. Lett. 42, 831–838. doi: 10.1002/2014GL062522
Dixon A., Forster P., Heron S., Stoner A., Beger M. (2022). Future loss of local-scale thermal refugia in coral reef ecosystems. PloS Climate 1, e0000004. doi: 10.1371/journal.pclm.0000004
Fu K.-H., Wang Y.-H., Laurent L. S., Simmons H., Wang D.-P. (2012). Shoaling of large-amplitude nonlinear internal waves at Dongsha Atoll in the northern South China Sea. Continent. Shelf. Res. 37, 1–7. doi: 10.1016/j.csr.2012.01.010
Garrett C., Munk W. (1979). Internal waves in the ocean. Annu. Rev. Fluid. Mechanic. 11, 339–369. doi: 10.1146/annurev.fl.11.010179.002011
Green R. H., Jones N. L., Rayson M. D., Lowe R. J., Bluteau C. E., Ivey G. N. (2019a). Nutrient fluxes into an isolated Coral Reef atoll by tidally driven internal bores. Limnol. Oceanogr. 64, 461–473. doi: 10.1002/lno.11051
Green R. H., Lowe R. J., Buckley M. L., Foster T., Gilmour J. P. (2019b). Physical mechanisms influencing localized patterns of temperature variability and coral bleaching within a system of reef atolls. Coral. Reef. 38, 759–771. doi: 10.1007/s00338-019-01771-2
Hoegh-Guldberg O., Jacob D., Taylor M., Bindi M., Brown S., Camilloni I., et al. (2018). “Impacts of 1.5˚C global warming on natural and human systems,” in Global warming of 1.5˚C. an IPCC special report on the impacts of global warming of 1.5˚C above preindustrial levels and related global greenhouse gas emission pathways, in the context of strengthening the global response to the threat of climate change, sustainable development, and efforts to eradicate poverty. Eds. Masson-Delmotte V., Zhai P., Portner H.-O., Roberts D., Skea J., Shukla P., et al (IPCC), 175–311.
Hughes T., Kerry J., Baird A., Connolly S., Dietzel A., Eakin C., et al. (2018). Global warming transforms coral reef assemblages. Nature 556, 492–496. doi: 10.1038/s41586-018-0041-2
Kleypas J., Allemand D., Anthony K., Baker A. C., Beck M. W., Hale L. Z., et al. (2021). Designing a blueprint for coral reef survival. Biol. Conserv. 257, 109107. doi: 10.1016/j.biocon.2021.109107
Langlais C. E., Lenton A., Heron S. F., Evenhuis C., Sen Gupta A., Brown J. N., et al. (2017). Coral bleaching pathways under the control of regional temperature variability. Nat. Climate Change 7, 839+. doi: 10.1038/NCLIMATE3399
Leichter J. J., Deane G., Stokes M. (2005). Spatial and temporal variability of internal wave forcing on a coral reef. J. Phys. Oceanogr. 35, 1945–1962. doi: 10.1175/JPO2808.1
Leichter J. J., Stewart H. L., Miller S. L. (2003). Episodic nutrient transport to florida coral reefs. Limnol. Oceanogr. 48, 1394–1407. doi: 10.4319/lo.2003.48.4.1394
Leichter J. J., Wing S. R., Miller S. L., Denny M. W. (1996). Pulsed delivery of subthermocline water to conch reef (Florida Keys) by internal tidal bores. Limnol. Oceanogr. 41, 1490–1501. doi: 10.4319/lo.1996.41.7.1490
Li X., Jackson C. R., Pichel W. G. (2013). Internal solitary wave refraction at Dongsha Atoll, South China Sea. Geophys. Res. Lett. 40, 3128–3132. doi: 10.1002/grl.50614
Liu Y., Putchim L., Li K., Gao H., Sun L., Khokiattiwong S., et al. (2022). Late monsoon threatens coral refugia in the Andaman Sea. Environ. Res. Lett. doi: 10.1088/1748-9326/ac4a30
Logan C. A., Dunne J. P., Eakin C. M., Donner S. D. (2014). Incorporating adaptive responses into future projections of coral bleaching. Global Change Biol. 20, 125–139. doi: 10.1111/gcb.12390
Luecke C. A., Arbic B. K., Richman J. G., Shriver J. F., Alford M. H., Ansong J. K., et al. (2020). Statistical comparisons of temperature variance and kinetic energy in global ocean models and observations: Results from mesoscale to internal wave frequencies. J. Geophys. Res.: Oceans. 125, e2019JC015306. doi: 10.1029/2019JC015306
Marshall J., Adcroft A., Hill C., Perelman L., Heisey C. (1997). A finite-volume, incompressible navier–stokes model for studies of the ocean on parallel computers. J. Geophys. Res.: Oceans. 102, 5753–5766. doi: 10.1029/96JC02775
Matthews J., Aiki H., Masuda S., Awaji T., Ishikawa Y. (2011). Monsoon regulation of lombok strait internal waves. J. Geophys. Res.: Oceans. 116. doi: 10.1029/2010JC006403
Munk W. (1981). “Internal waves and small-scale processes,” in Evolution of physical oceanography, vol. chap. 9 . Eds. Warren B., Wunsch C. (MIT press), 264–291.
Nikurashin M., Ferrari R. (2011). Global energy conversion rate from geostrophic flows into internal lee waves in the deep ocean. Geophys. Res. Lett. 38. doi: 10.1029/2011GL046576
Ningsih N. S., Rachmayani R., Hadi S., Brodjonegoro I. S. (2010). Internal waves dynamics in the lombok strait studied by a numerical model. Int. J. Remote Sens. Earth Sci. (IJReSES) 5. doi: 10.30536/j.ijreses.2008.v5.a1226
Reid E. C., DeCarlo T. M., Cohen A. L., Wong G. T., Lentz S. J., Safaie A., et al. (2019). Internal waves influence the thermal and nutrient environment on a shallow coral reef. Limnol. Oceanogr. 64, 1949–1965. doi: 10.1002/lno.11162
Rocha C. B., Chereskin T. K., Gille S. T., Menemenlis D. (2016). Mesoscale to submesoscale wavenumber spectra in drake passage. J. Phys. Oceanogr. 46, 601–620. doi: 10.1175/JPO-D-15-0087.1
Roder C., Fillinger L., Jantzen C., Schmidt G., Khokiattiwong S., Richter C. (2010). Trophic response of corals to large amplitude internal waves. Mar. Ecol. Prog. Ser. 412, 113–128. doi: 10.3354/meps08707
Rosario-Llantín J.-A. (2000). Tidal currents in Mona passage, masters thesis. master’s thesis (University of Puerto Rico).
Safaie A., Silbiger N. J., McClanahan T. R., Pawlak G., Barshis D. J., Hench J. L., et al. (2018). High frequency temperature variability reduces the risk of coral bleaching. Nat. Commun. 9, 1–12. doi: 10.1038/s41467-018-04074-2
Savage A. C., Arbic B. K., Alford M. H., Ansong J. K., Farrar J. T., Menemenlis D., et al. (2017). Spectral decomposition of internal gravity wave sea surface height in global models. J. Geophys. Res.: Oceans. 122, 7803–7821. doi: 10.1002/2017JC013009
Schmidt G. M., Richter C. (2013). Coral growth and bioerosion of Porites lutea in response to large amplitude internal waves. PLoS One 8, e73236. doi: 10.1371/journal.pone.0073236
Schmidt G. M., Wall M., Taylor M., Jantzen C., Richter C. (2016). Large-Amplitude internal waves sustain coral health during thermal stress. Coral. Reef. 35, 869–881. doi: 10.1007/s00338-016-1450-z
Schoepf V., Jung M. U., McCulloch M. T., White N. E., Stat M., Thomas L. (2020). Thermally variable, macrotidal reef habitats promote rapid recovery from mass coral bleaching. Front. Mar. Sci. 7, 245. doi: 10.3389/fmars.2020.00245
Shakespeare C. J., Gibson A. H., Hogg A. M., Bachman S. D., Keating S. R., Velzeboer N. (2021). A new open source implementation of Lagrangian filtering: a method to identify internal waves in high-resolution simulations. J. Adv. Model. Earth Syst. 13, e2021MS002616. doi: 10.1029/2021MS002616
Shakespeare C. J., Hogg A. M. (2017). The viscous lee wave problem and its implications for ocean modelling. Ocean. Model. 113, 22–29. doi: 10.1016/j.ocemod.2017.03.006
Shakespeare C. J., Taylor J. (2014). The spontaneous generation of inertia–gravity waves during frontogenesis forced by large strain: Theory. J. Fluid. Mechanic. 757, 817–853. doi: 10.1017/jfm.2014.514
Smith K. A., Rocheleau G., Merrifield M. A., Jaramillo S., Pawlak G. (2016). Temperature variability caused by internal tides in the coral reef ecosystem of hanauma bay, hawai’i. Continent. Shelf. Res. 116, 1–12. doi: 10.1016/j.csr.2016.01.004
Smith J. E., Smith C. M., Vroom P. S., Beach K. L., Miller S. (2004). Nutrient and growth dynamics of Halimeda tuna on conch reef, Florida keys: Possible influence of internal tides on nutrient status and physiology. Limnol. Oceanogr. 49, 1923–1936. doi: 10.4319/lo.2004.49.6.1923
Storlazzi C. D., Cheriton O. M., Van Hooidonk R., Zhao Z., Brainard R. (2020). Internal tides can provide thermal refugia that will buffer some coral reefs from future global warming. Sci. Rep. 10, 1–9. doi: 10.1038/s41598-020-70372-9
Susanto R., Mitnik L., Zheng Q. (2005). Ocean internal waves observed. Oceanography 18, 80. doi: 10.5670/oceanog.2005.08
Su Z., Torres H., Klein P., Thompson A. F., Siegelman L., Wang J., et al. (2020). High-frequency submesoscale motions enhance the upward vertical heat transport in the global ocean. J. Geophys. Res.: Oceans. 125, e2020JC016544. doi: 10.1029/2020JC016544
van Hooidonk R., Maynard J., Planes S. (2013). Temporary refugia for coral reefs in a warming world. Nat. Climate Change 3, 508–511. doi: 10.1038/nclimate1829
Wall M., Putchim L., Schmidt G., Jantzen C., Khokiattiwong S., Richter C. (2015). Large-Amplitude internal waves benefit corals during thermal stress. Proc. R. Soc. B.: Biol. Sci. 282, 20140650. doi: 10.1098/rspb.2014.0650
Wang Y.-H., Dai C.-F., Chen Y.-Y. (2007). Physical and ecological processes of internal waves on an isolated reef ecosystem in the south China Sea. Geophys. Res. Lett. 34. doi: 10.1029/2007GL030658
Wyatt A. S., Leichter J. J., Toth L. T., Miyajima T., Aronson R. B., Nagata T. (2020). Heat accumulation on coral reefs mitigated by internal waves. Nat. Geosci. 13, 28–34. doi: 10.1038/s41561-019-0486-4
Yara Y., Fujii M., Yamano H., Yamanaka Y. (2014). Projected coral bleaching in response to future sea surface temperature rises and the uncertainties among climate models. Hydrobiologia 733, 19–29. doi: 10.1007/s10750-014-1838-0
Zaron E. D. (2019). Predictability of non-phase-locked baroclinic tides in the Caribbean Sea. Ocean. Sci. 15, 1287–1305. doi: 10.5194/os-15-1287-2019
Keywords: coral reefs, internal gravity waves, temperature variability, thermal refugia, global atlas
Citation: Bachman SD, Kleypas JA, Erdmann M and Setyawan E (2022) A global atlas of potential thermal refugia for coral reefs generated by internal gravity waves. Front. Mar. Sci. 9:921879. doi: 10.3389/fmars.2022.921879
Received: 16 April 2022; Accepted: 29 June 2022;
Published: 28 July 2022.
Edited by:
William F. Precht, Dial Cordy and Associates, Inc., United StatesReviewed by:
Salvatore Genovese, Boston University, United StatesAtsushi Fujimura, University of Guam, Guam
Copyright © 2022 Bachman, Kleypas, Erdmann and Setyawan. This is an open-access article distributed under the terms of the Creative Commons Attribution License (CC BY). The use, distribution or reproduction in other forums is permitted, provided the original author(s) and the copyright owner(s) are credited and that the original publication in this journal is cited, in accordance with accepted academic practice. No use, distribution or reproduction is permitted which does not comply with these terms.
*Correspondence: Scott D. Bachman, YmFjaG1hbkB1Y2FyLmVkdQ==