 Daoheng Zhu
 Rui Qi2†
- 1School of Electronics and Information Engineering, Guangdong Ocean University, Zhanjiang, China
- 2School of Big Data and Information Engineering, Guizhou University, Guiyang, China
Rip currents form on beaches worldwide and pose a potential safety hazard for beach visitors. Therefore, effectively identifying rip currents from beach scenes and providing real-time alerts to beach managers and beachgoers is crucial. In this study, the YOLO-Rip model was proposed to detect rip current targets based on current popular deep learning techniques. First, based on the characteristics of a large target size in rip current images, the neck region in the YOLOv5s model was streamlined. The 80 × 80 feature map branches suitable for detecting small targets were removed to reduce the number of parameters, decrease the complexity of the model, and improve the real-time detection performance. Subsequently, we proposed adding a joint dilated convolutional (JDC) module to the lateral connection of the feature pyramid network (FPN) to expand the perceptual field, improve feature information utilization, and reduce the number of parameters, while keeping the model compact. Finally, the SimAM module, which is a parametric-free attention mechanism, was added to optimize the target detection accuracy. Several mainstream neural network models have been used to train self-built rip current image datasets. The experimental results show that (i) the detection results from different models using the same dataset vary greatly and (ii) compared with YOLOv5s, YOLO-Rip increased the mAP value by approximately 4% (to 92.15%), frame rate by 2.18 frames per second, and the model size by only 0.46 MB. The modified model improved the detection accuracy while keeping the model streamlined, indicating its efficiency and accuracy in the detection of rip currents.
Introduction
Rip currents are a widely studied oceanic phenomenon defined as strong currents flowing from the beach to the sea (Brighton et al., 2013; Castelle et al., 2014). When waves break, they form a “nearshore circulation,” that is, lead to a rise in the mean water level. These nearshore currents can vary along the coastline depending on the height of the waves and topography of the seafloor. When the currents tend to flow along the coast from high- to low-wave areas, they accumulate as offshore currents that flow in a cross-shore direction. A combination of various factors—such as water depth, wave height and direction, tides, and beach topography—determine the location and intensity of rip currents. Rip currents can be transient or persistent in both space and time. Rip currents often found in the same location usually indicate a relatively stable bathymetric feature, such as a sandbar or reef, or a hard structure, such as an exposed rock or pier. These bathymetric features result in variations in wave breaking and formation, which tend to produce rip currents in the trench structures. Transient or flashing rip currents are independent of water depth and can move up and down the beach or appear or disappear.
Rip currents are a daily possibility on beaches worldwide. However, most of the time, they are so weak that swimmers rarely notice them. Beaches are a popular place to relax, especially during the summer; however, they also present the danger of the occurrence of rip currents. Most of the velocities of rip currents obtained by in situ observation and theoretical analysis are between 0.3 and 1 meter per second (Brander et al., 2011), but Short, 2007 has observed rip currents with velocities exceeding 2 meters per second and even reaching 3 meters per second. Once a rip current with excessive velocity is encountered, swimmers are at a risk of drowning (Buscombe et al., 2020). However, most beachgoers do not know how to recognize rip currents, and there is no reliable way to identify them. Globally, thousands of beach users drown each year because of rip currents (Da F. Klein et al., 2003). A 20-year study conducted by the United States Lifesaving Society showed that of the 37,000 beach rescues per year, 81.9% were caused by rip currents (Brewster et al., 2019). Despite the warning signs and educational materials, the number of associated drowning deaths has not decreased.
Beach lifeguards are frequently trained to recognize rip currents. However, most drownings occur on beaches where lifeguards are not trained (ASLS. 2019). Posted signs can provide warnings, but evidence suggests that most people do not consider existing signs to be helpful in identifying rip currents in real-world scenarios (Brannstrom et al., 2015). Experts from the National Oceanic and Atmospheric Administration (NOAA) have used images and videos to collect statistical data on rip currents. These data support the validation of rip current prediction models to alert people to potential hazards (Dusek and Seim, 2013). The most common method for visualizing rip currents from videos is time averaging, which summarizes the video into individual images (Holman and Stanley, 2007). This method is popular because time-averaged images are usually more easily observed by the human eye. Maryan et al. (2019) applied machine learning to identify riffle channels in time-averaged images. Nelko and Dalrymple (2011) also used time-averaged images and noted that prediction schemes developed for one beach may not be directly applicable to other beaches without modification. In contrast to these studies, de Silva et al. (2021) showed that the target detection performance on a single frame was better than that of the averaged time image. In an enhanced simple feature cascade (Rashid et al., 2021), machine-learning techniques are used to detect rip currents in time-averaged images. However, these temporal averages may be misinterpreted when evaluated manually. In addition, these data are neither easily accessible nor easily understood by the average beachgoer (Pitman et al., 2016). The process of calculating the averages removes the existing misunderstanding of information.
The most used methods for the study of rip currents are in situ observations or numerical simulations. With in-situ observation techniques, fluorescein dyes are usually released into the ocean and used to observe the morphology and dispersion of the rip current (Clark et al., 2010; Clark et al., 2014). Wave sensors, sound velocimeters, and current profilers can be deployed in specific locations (Elgar et al., 2001; Inch, 2014). Floats equipped with global positioning system (GPS) receivers have also been used to measure rip currents (Schmidt et al., 2003; Castelle et al., 2014). These methods are costly, time-consuming, require technical expertise, and are usually applicable only to highly localized instances in time and space.
In contrast, models such as SWAN (Dudkowska et al., 2020), FUNWAVE (Hong et al., 2021), SWASH (Wang et al., 2018; Chang et al., 2021), and XBEACH (Mouragues et al., 2021) are widely used for numerical simulations of rip currents. Although numerical simulations can visualize the characteristics of rip currents, the simulation results do not represent the actual situation because rip currents are transient and difficult to capture in real scenarios. This poses a significant challenge to observers.
The prediction model of rip currents was a hot issue that has been widely studied. Dusek and Seim, 2013 proposed a probabilistic rip current prediction model that predicted data observed at 19 stations, showing that wave height was the main driver of rip current occurrence. Wave direction, tide, and the wave post-wave event window were secondary factors. However, the accuracy of this calculation of rip current occurrence probability based on empirical equations was not high. Eom et al. (2014) developed a rip current forecasting system, the KMA, which predicted the occurrence of rip currents by analyzing hourly wave conditions and flow field changed and classified the danger level into four categories: safe, announcement, warning, and dangerous. However, this system suffered from a single type of forecast information, low accuracy, and an inability to guarantee real-time information. Because of these limitations, the applicability of the above methods for both public warning and model validation needed to be improved.
Mori et al. (2022) investigated the use of optical flow analysis techniques to detect rip currents in videos. By improving the flow field visualization method, a substantial improvement was achieved both in detecting fine rip currents and in the clarity of the visualization. Dense optical flows (Horn and Schunck, 1981) have also been used to detect rip currents in videos (Rashid et al., 2020). This method is highly superior because the optical flow field can be directly compared with the ground-truth flow field obtained from in situ measurements. Unfortunately, these methods are sensitive to camera interference and have difficulty in identifying regions that lack texture information. In contrast, de Silva et al. (2021) performed target detection on a single frame, outperforming previous optical flow-based methods.
In terms of rip detector development, Rashid et al., 2021 proposed a full convolutional autoencoder-based method for rip current recognition. When RipNet was compared with previous methods, RipNet showed a substantial improvement in accuracy, specificity, and sensitivity metrics for rip current recognition. Subsequently, they proposed a novel, fast, and lightweight Rip detection framework called RipDet. Rashid et al. (2021) trained Tiny-YOLOv3 on the COCO2017 dataset to obtain the initial values of the weights and fine-tune the structure of the Tiny-YOLOv3 network. The original dataset was first expanded, and the samples were trained by systematically adjusting the learning rate to make the weights of the model more sensitive to the rip region distribution. Finally, an mAP value of 98.13% was achieved on the benchmark dataset.
Certain types of rip currents have visible features of sediment plumes, which can be segmented based on color changes. For example, Liu and Wu (2019) used a thresholding method in the HSV color space to detect rip currents. However, not all rip currents contain features of sediment plumes. For example, the data we collected are real beach scene images, and it is difficult to effectively discriminate these features on beaches with wide tidal differences and broken wave bands.
The detection of targets from images has become a high priority in computer vision in recent years (Han et al., 2018), and these methods have been extended to detect targets in videos (Han et al., 2016). De Silva has attempted to identify rip currents as an object from an image, but few people have applied this technique to the marine domain. The ability to detect an indefinitely shaped “object” such as a rip current is inherently challenging, and there is a lack of publicly available datasets for training and testing.
We collected many beach photographs as a training set for rip current detection, partly from the web, partly from the dataset provided by de Silva et al. (2021), and partly from beach sites along the coast of South China. Based on our judgment, the regions that could be judged by the naked eye as cleavage currents were labeled. A set of beach photos is provided in Figure 1. We analyzed the most popular YOLOv5 model, proposed the YOLO-Rip network, and used it for rip-current target detection. Several different models were used for extensive training and testing of the data. The experimental results showed that YOLO-Rip provides a notable improvement in detection accuracy and speed compared with several other models, which verifies the effectiveness and accuracy of the method.
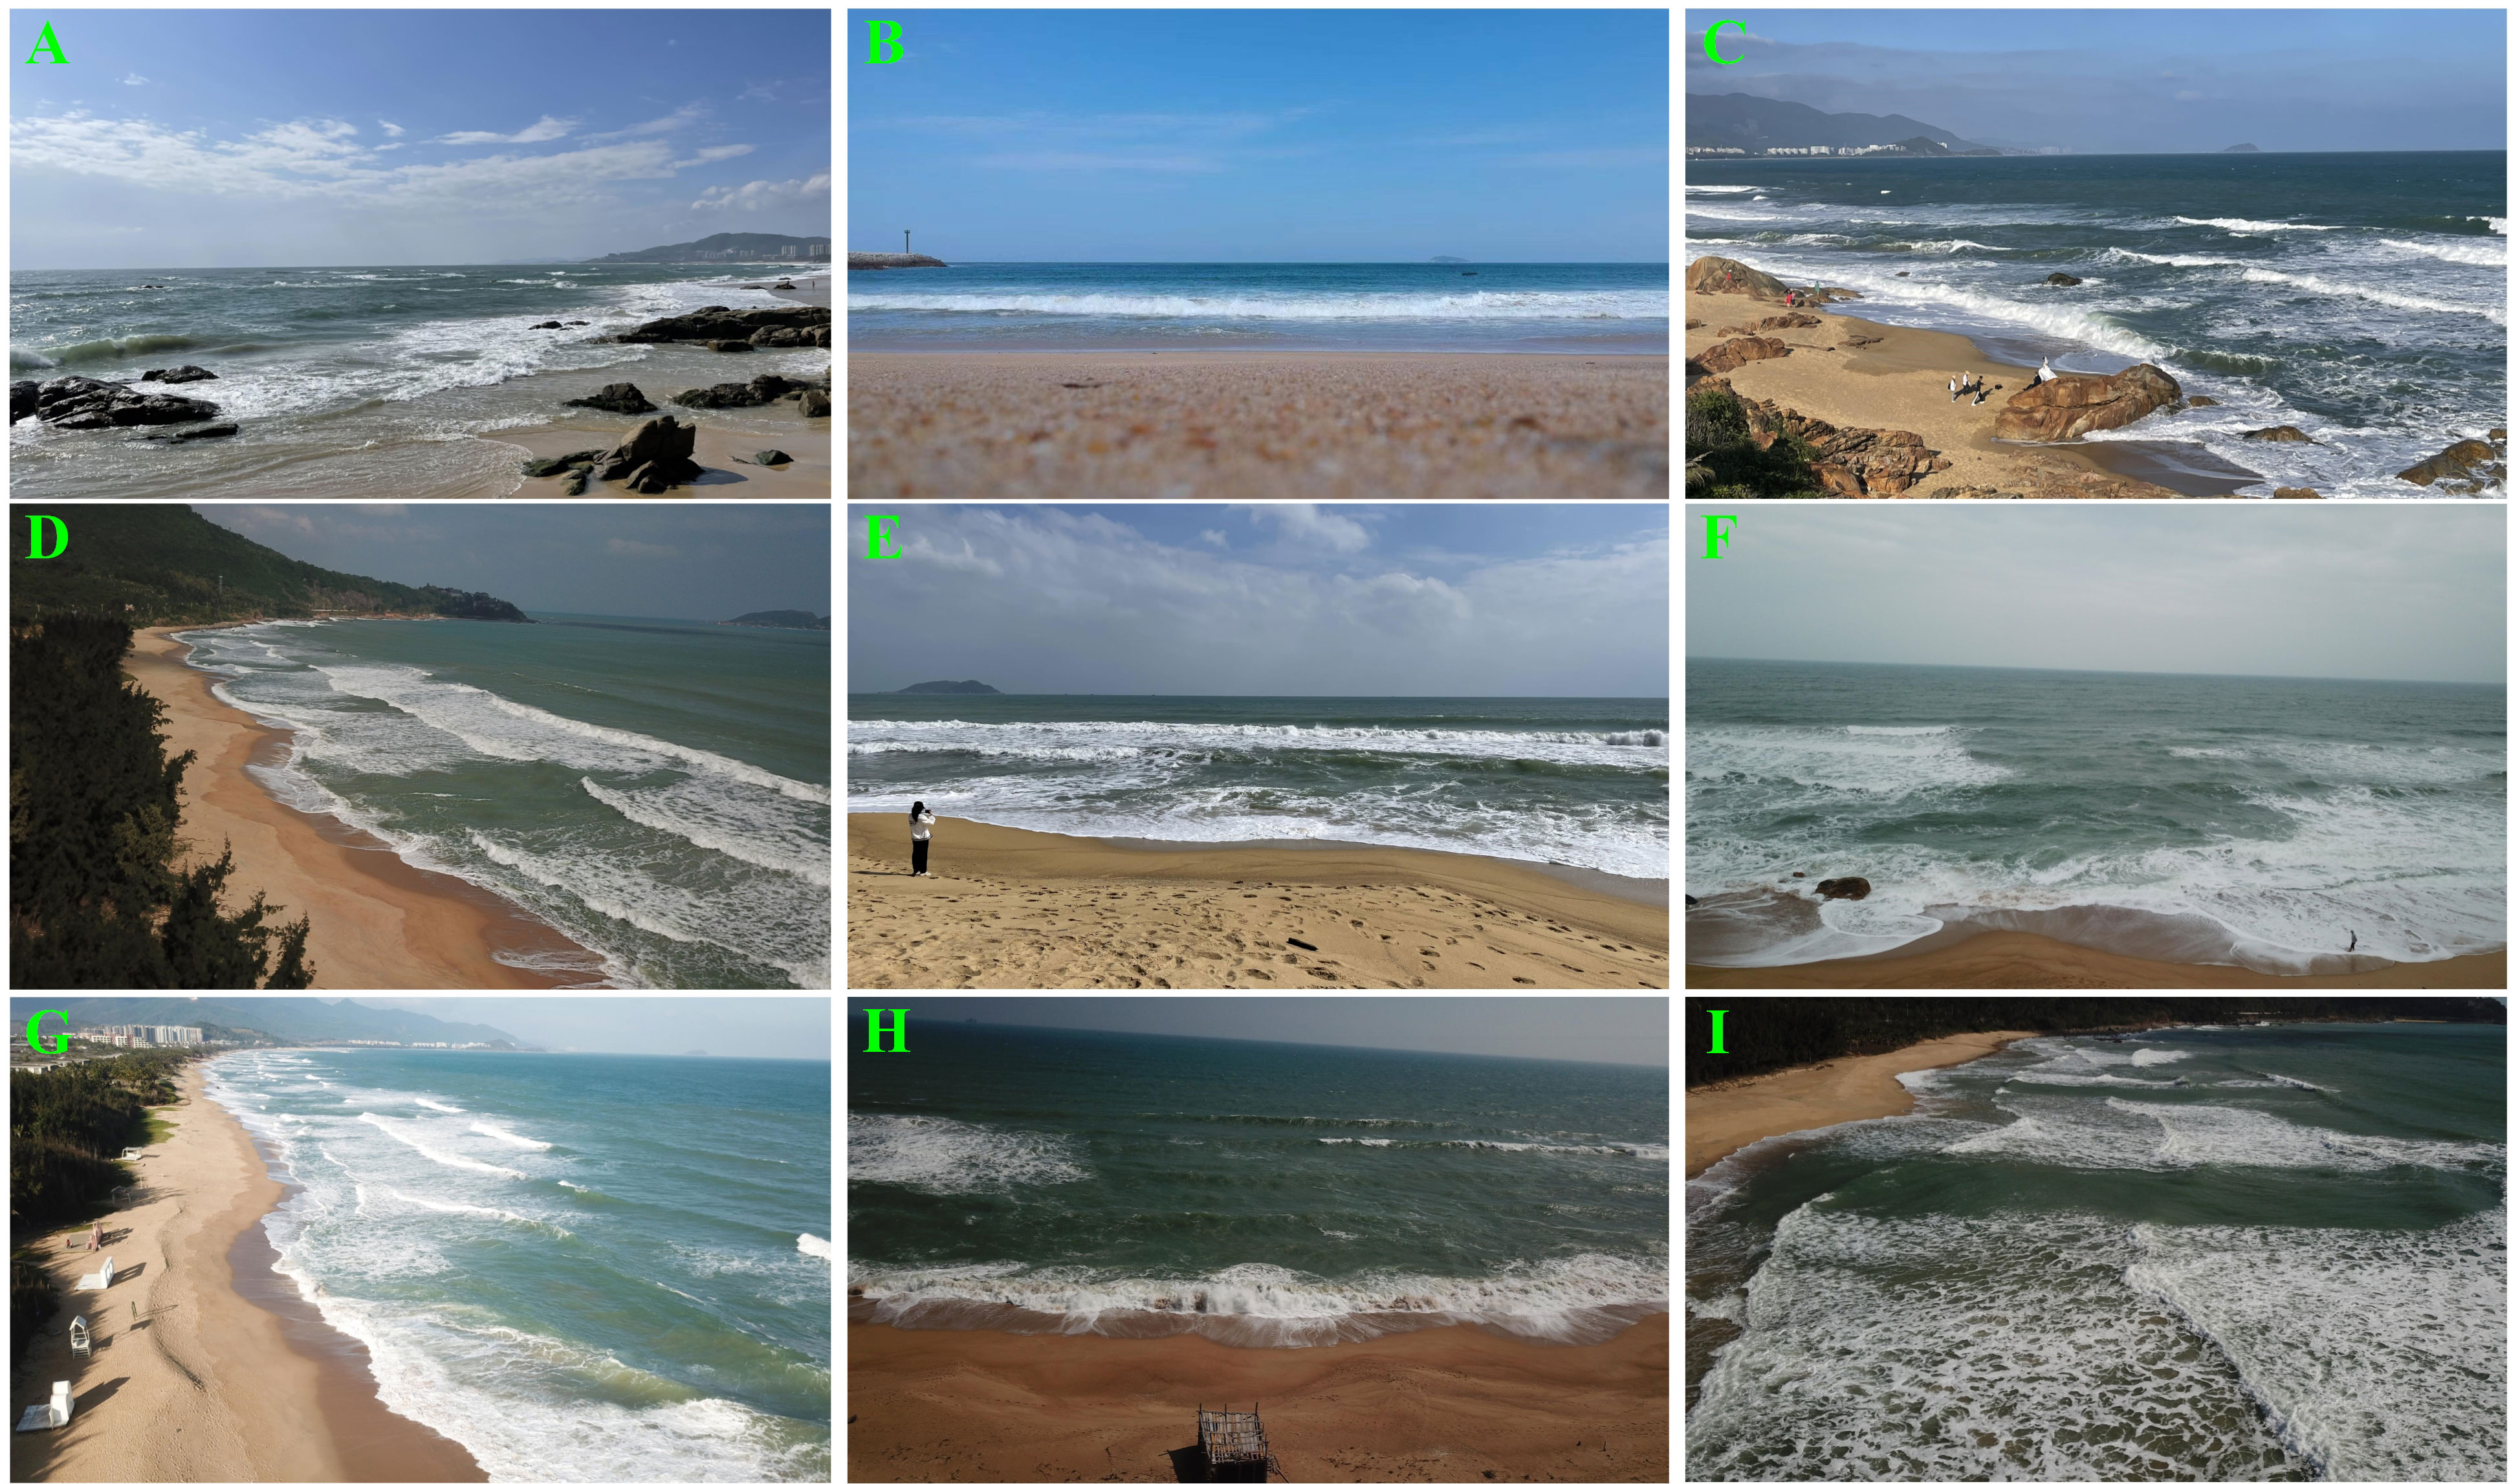
Figure 1 A collection of pictures of beach scenes. According to our observations, there are clear rip currents in pictures (D, F, I), while there are no clear rip currents in pictures (A-C, E, G, H). But the vast majority of people do not understand rip currents and they have difficulty in detecting them, these targets do not have a clear shape.
The main contributions of this study are as follows. (i) The YOLO-Rip model was proposed for the detection of rip currents, and the effectiveness of the method was verified. (ii) A comparison of several currently popular target detection algorithms showed that YOLO-Rip has a higher detection accuracy and detection speed. The remainder of this paper is organized as follows. In Section 2, we show how the data were collected and describe our approach in Section 3. The experimental results are analyzed in Section 4, and the results are discussed in Section 5. In Section 6, we summarize this work.
Models and data
Joint dilation convolution module
In rip current images, the size of the rip current target is generally large. Therefore, it is important to extract more rip current features for the inference of the network. This requires extending the perceptual field of the model. There are two methods to scale: (i) downsampling the image, which results in the loss of some feature information, and (ii) increasing the number of convolutional layers. The superposition of convolutional layers will extend the perceptual field. However, as the number of layers increases, the amount of network computation will also increase substantially, which will inhibit the computational speed of the model.
Dilated convolution has been proposed to extend the perceptual field (Yu and Koltun, 2015). Dilated convolution adds voids to the normal convolution; that is, a 0-fill operation is performed between every two parameters of the base convolution, the dilation rate parameter is used to control the number of intervals, and the size of the dilated convolution kernel is calculated as in Equation (1).
where f is the expanded convolutional kernel size, d the expansion rate, and k the original convolutional kernel size. When the expansion rate was 2, the 3 × 3 convolutional kernels expanded into 5 × 5 convolutional kernels, effectively expanding the receptive field while keeping the parameters unchanged (Figure 2A). When the convolutional kernels are superimposed, it is possible to expand the perceptual field without losing the size of the feature map. However, when all the superimposed kernels have the same expansion rate, the spacing between the parameters leads to a discontinuity in the overall feature map based on the center of the convolution, and a “checkerboard” effect occurs, showing a grid that expands outward from the center of the convolution (Figure 2B).
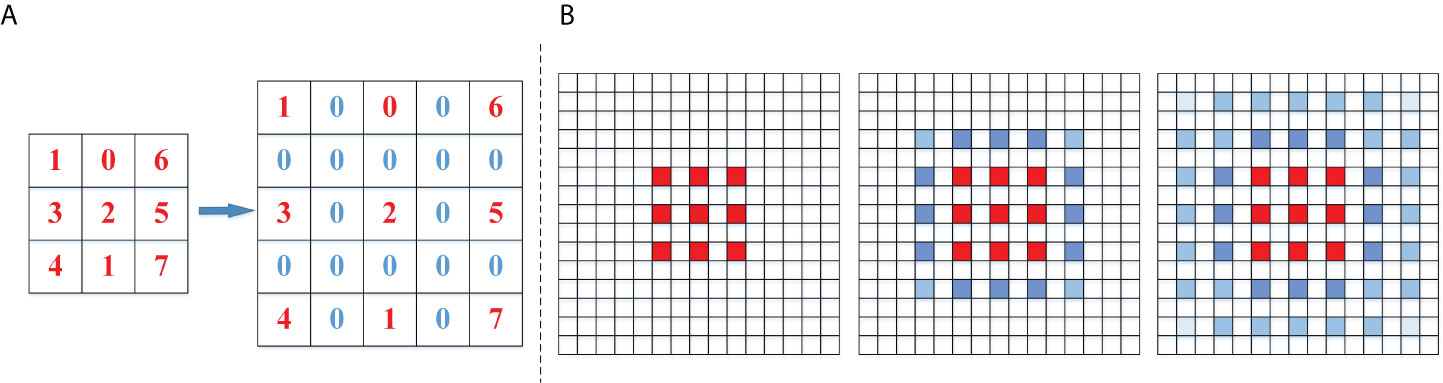
Figure 2 (A) schematic showing the grid size change with an expansion rate of 2 and (B) checkerboard pattern resulting from a uniform expansion rate.
For the characteristics of dilation convolution, we designed a joint dilated convolution (JDC) module. The module adopts three kinds of convolution kernels: 1 × 1, 3 × 3, and 5 × 5 sizes to convolve in three groups of channels, as shown in Figure 3. The 1 × 1 convolution kernel in the structure is a reduced dimension operation to reduce the number of parameters, while the 3 × 3 and 5 × 5 convolution kernels are expanded convolutions superimposed for feature extraction operation. The 1 × 1 convolution kernel is used to reduce the number of parameters by reducing the dimensionality. The 3 × 3 and 5 × 5 convolution kernels are used to extract features by superimposing the dilation convolution. The dilation rate of the two dilation convolution layers of 3 × 3 and 5 × 5 was set to d = [2,3], and the padding was set to [2,3] and [4,6], respectively. The last three groups of channels were spliced and then output.
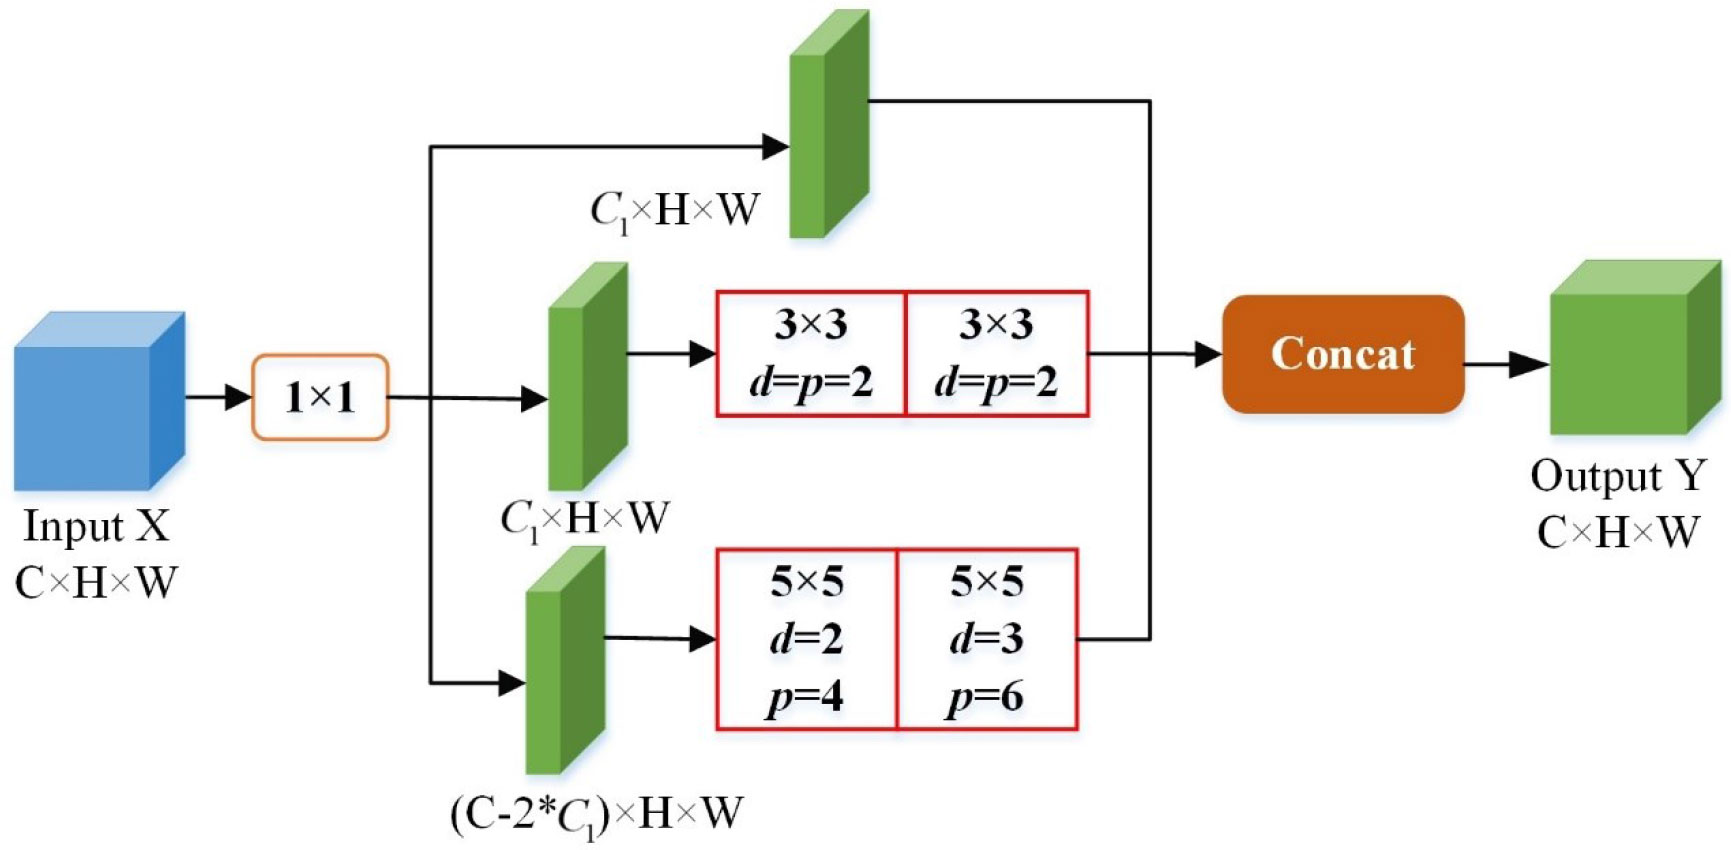
Figure 3 Schematic showing the convolution kernels adopted by the JDC module Structure of JDC module, where C is the number of channels, H is the height of the feature map, W is the width of the feature map, d refers to dilation rate, and p refers to padding.
We embedded the JDC module into the lateral connection of FPN in the backbone and neck regions. This can fully extend the perceptual field and increase the adaptability of the network to the desired scale while reducing the number of parameters. It can effectively extract features and fuse them to improve the detection accuracy.
SimAM module
The block attention module (BAM) and convolutional block attention module (CBAM) (Woo et al., 2018) combine spatial and channel attention in parallel or serially, respectively. However, these two types of attention in the human brain tend to work in concert. By analyzing existing attention modules (e.g., spatial and channel attention), Yang et al. (2021) proposed a 3D attention module and designed an energy function to calculate the attention weights. The following energy function is defined in Equation (2).
where is the linear transformation of the target neurons t and xi in the same channel as the input feature, wt and bt are the weights and biases at the linear transformation, and i is the index of the spatial dimension. M is the number of neurons on that channel, y0 and yt are two different values. The minimization Eq. (2) is equivalent to training the linear differentiability between neuron t and the other neurons in the same channel. After replacing y0 and yt with binary labels and adding regular terms, the final energy function is defined by Equation (3).
Theoretically, each channel has an M = H × W energy function. The above equation has the following analytical solution.
where . Therefore, the minimum energy can be obtained using Equation (5).
Eq. (5) shows that the lower the energy, the more the neuron t is distinguished from the surrounding neurons, and the higher its importance. Therefore, the importance of a neuron can be determined using . According to the definition of the attention mechanism, features must be augmented.
YOLO-rip model structure
The YOLOv5 model was divided into four versions according to the depth and width of the network: YOLOv5x, YOLOv5l, YOLOv5m, and YOLOv5s. Most target detection networks find a balance between detection accuracy and detection speed. Among the four versions of YOLOv5, YOLOv5s is the network with the smallest depth and the smallest width of the feature map, which agrees with the lightweight characteristics of the network. Compared with other networks in the YOLO series, it greatly reduces the training time and increases the inference speed based on no less than the average accuracy of detection and can meet the basic requirements of real-time detection. Therefore, we chose YOLOv5s as the base network to study and improve.
YOLOv5s is structurally divided into four parts: input, backbone, bottleneck, and detection head. The backbone includes four modules: Focus, Convolution + Batch normalization + Leaky_relu (CBL), Cross stage partial networks (CSP), and Spatial pyramid pooling (SPP) (He et al., 2015).
On the input side, it connects a focus module, which expands the input channels by four times through slicing operations, and then obtains a two-fold downsampling feature map without information loss through convolution operation. This effectively improves the detection speed while reducing the computation. Feature extraction uses the CBL module for convolution, normalization, and activation, and the C3 (CBL + Bottleneck + Concat) module to enhance feature extraction and optimize the gradient to speed up network inference. Finally, the SPP module unifies the network output size to reduce the impact of inconsistent input image size and resizing.
In the neck region, it uses a combination of FPN and path aggregation network (PAN) (Lin et al., 2017; Liu et al., 2018), where the FPN upsamples the image from the top down and combines the extracted features with the features extracted from the backbone to enhance feature information. Finally, we divided the images into three grid sizes, 20 × 20, 40 × 40, and 80 × 80, for detecting large, medium, and small targets, respectively.
Because the target of the rip current occupies a large area in the image, it can be considered a large target to reduce the number of anchor boxes. Therefore, we removed the detection of small targets and the 80 × 80 feature map branches that were suitable for small targets, to reduce the complexity of the model. Similarly, the default data enhancement method of YOLOv5s is Mosaic. One image is selected along with three other random images for random cropping. Then, they are stitched onto one image and input to the network as training data. This enriches the target background and increases the number of small targets to achieve a balance between differing scale criteria. After removing the branch that detects small sizes, we did not enable Mosaic, considering that its presence was redundant.
Finally, we embedded the JDC into the FPN lateral connection of YOLOv5s after connecting it to the SimAM module to obtain the improved network model shown in Figure 4. This model, which we call YOLO-Rip, was used to detect rip currents.
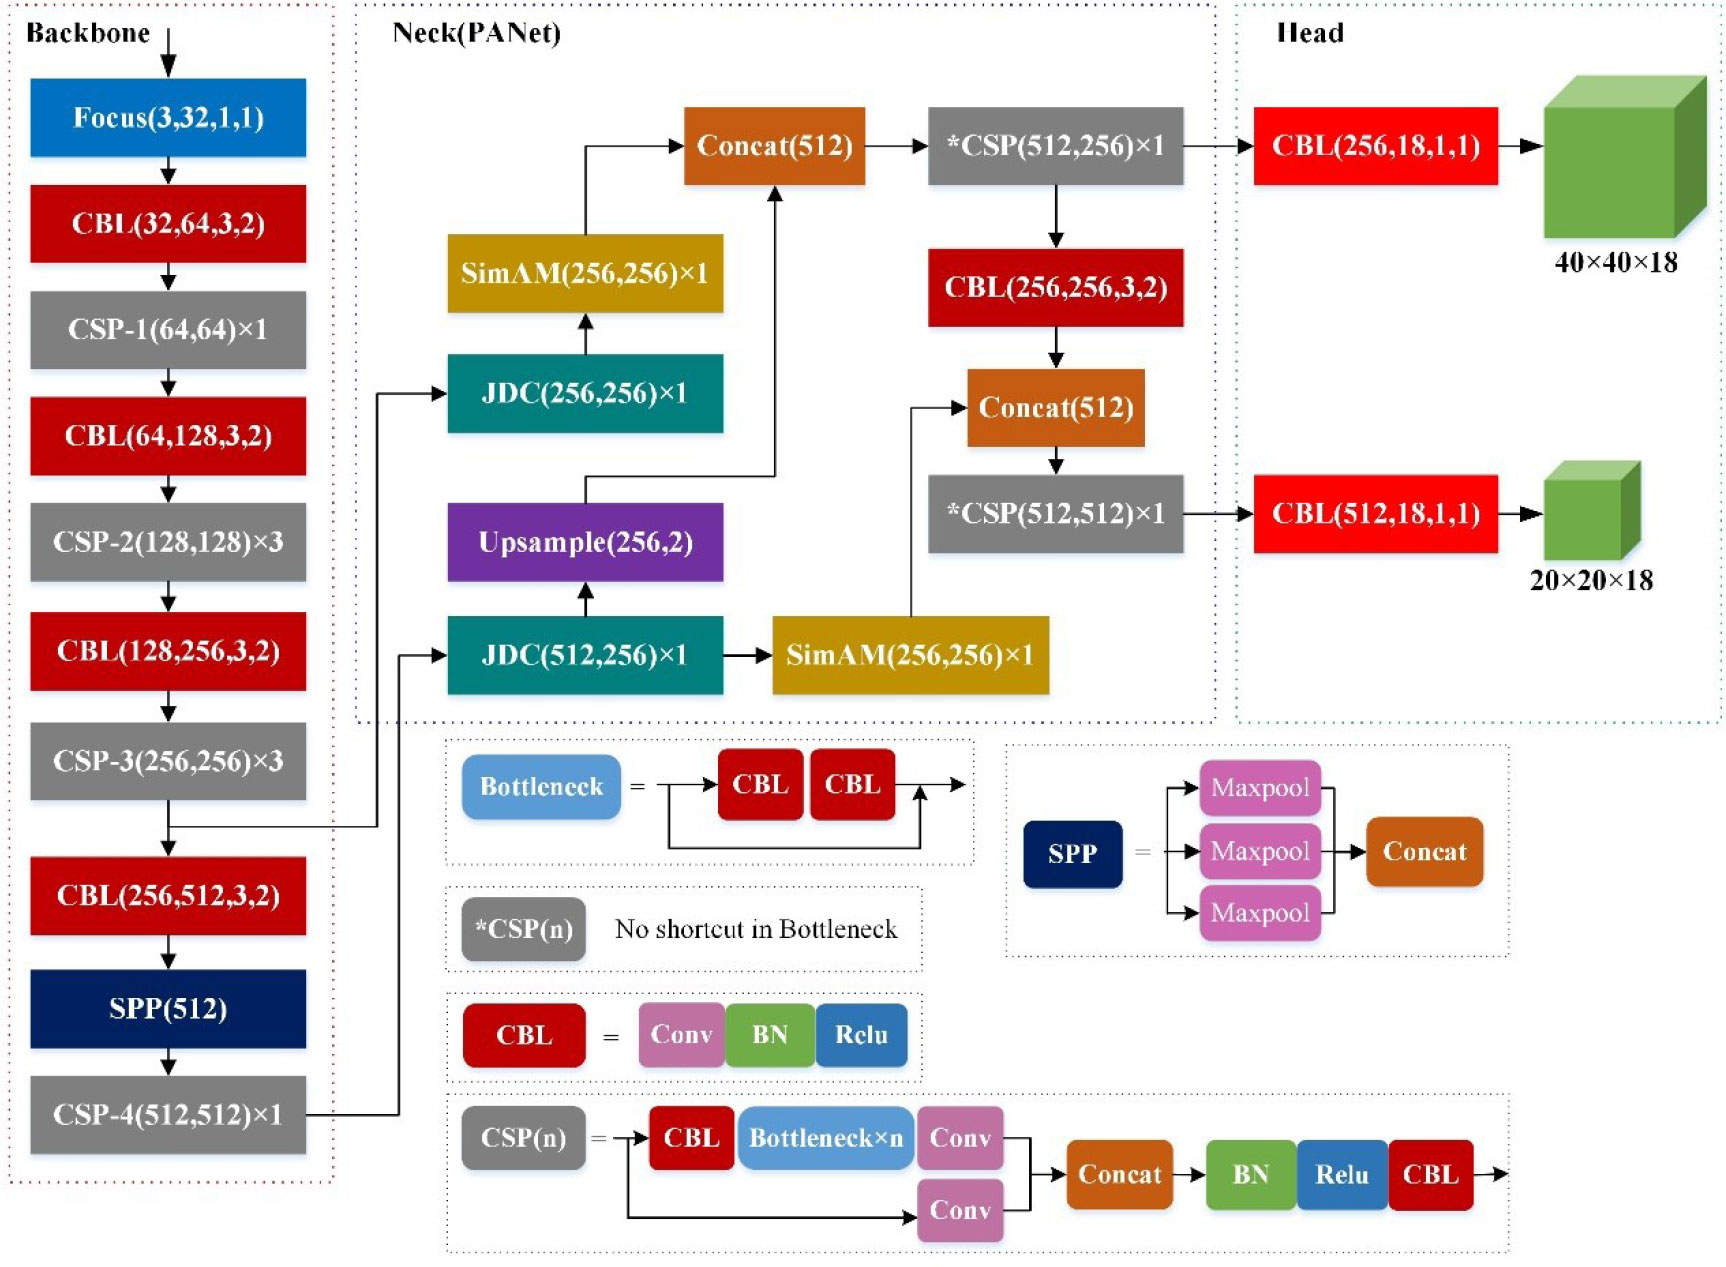
Figure 4 Schematic of the improved network model, YOLO-Rip.
Dataset
Rip-current detection is a new problem in the field of computer vision. The only available public data is the database provided by de Silva et al. (2021). This database contains 1740 images with rips and 700 images without rips. Because the images in the dataset are all aerial images, the image types are not rich enough, and there is a lack of images of real-time beach scenes. This poses a great challenge for beachgoers to accurately identify rip currents from diverse types of images. We took several sets of real beach scene photographs on beaches along the coast of South China. We selected 1352 high-resolution images, of which 746 had rips and 606 did not. The size of these images ranged from 4000 × 2250 to 480 × 360 pixels. After processing, the images had a uniform size of 640 × 640 pixels. We used axis-aligned bounding boxes to label the rip boundaries in the images containing the rip currents, where the x- and y-axes of the bounding boxes were aligned on the x- and y-axes of the images, respectively. An example of a set of training and test data is shown in Figure 5.
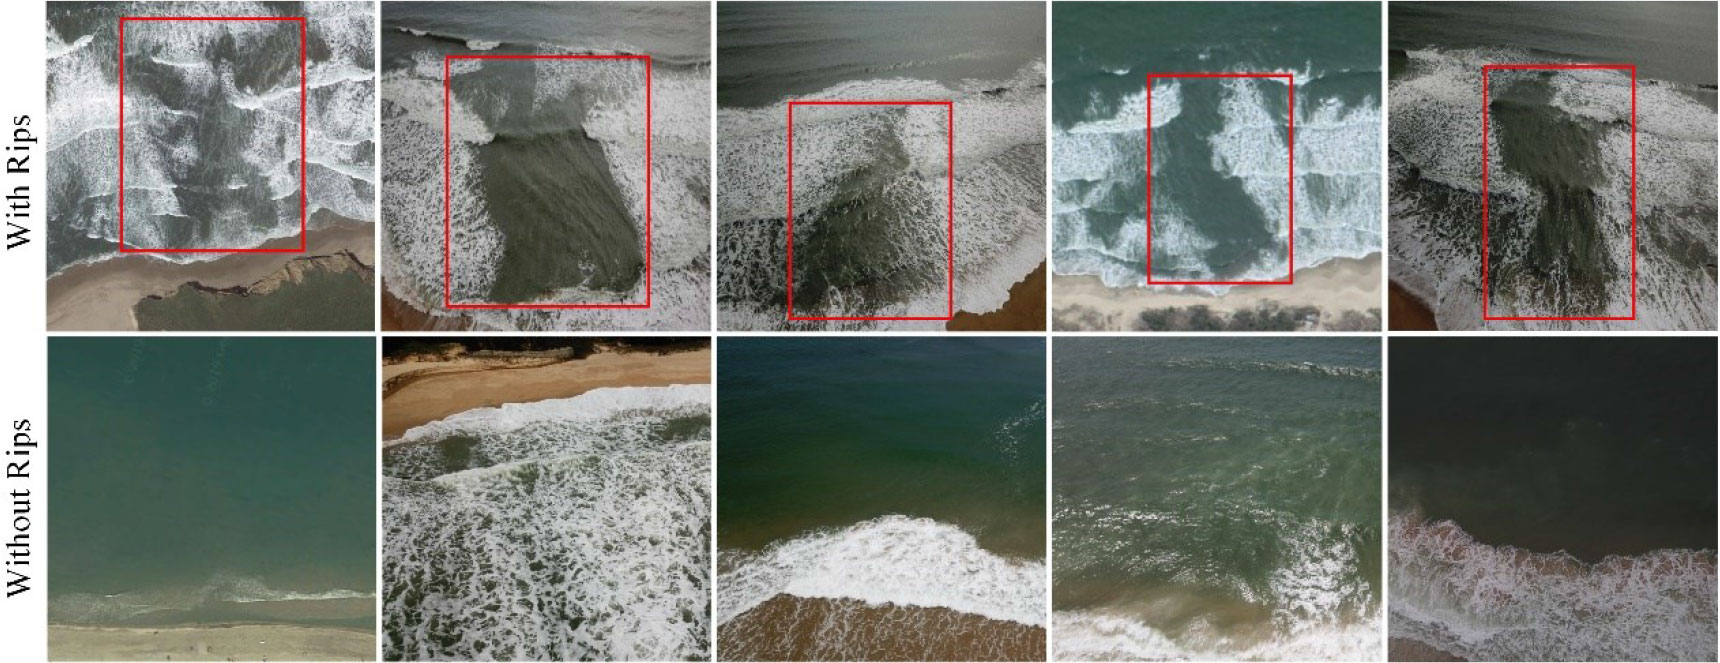
Figure 5 A set of images in the training set. The upper part of the images all contained rip currents, and red boxes indicate the boundaries of the rips. The lower part of the images did not contain rips.
Experiments
Experimental environment and parameters
The hardware environment for this experiment included an Intel(R) Core (TM) i5-10400F CPU @ 2.90 GHz with 16 GB of RAM and an 8 GB graphics card and an NVIDIA GeForce RTX 3060Ti GPU. The software environment was Windows 10 and the deep learning framework used was PyTorch 1.9.0, Python version 3.7, and CUDA version 7.6.5. The model input image size was 640 × 640 pixels, and the number of channels was three. The model training was set with a momentum coefficient of 0.937, weight decay coefficient of 0.0005, learning rate of 0.01, and batch size of 32, and 300 training iterations (Table 1).
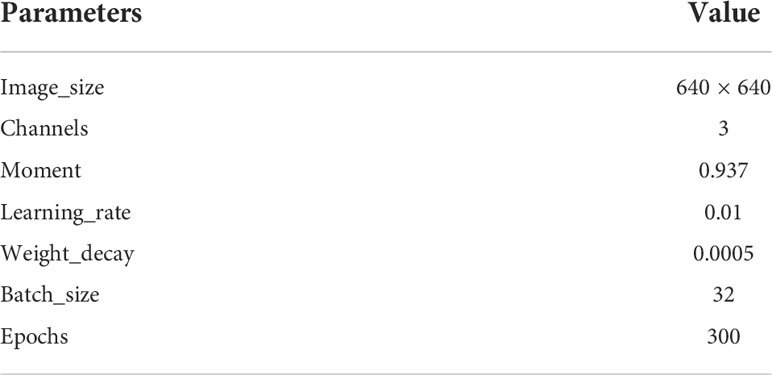
Table 1 Experimental parameter setting.
Evaluation indicators
To verify the performance and detection effectiveness of the YOLO-Rip model, we selected four common evaluation metrics (Precision [P], Recall [R], mean Average Precision [mAP], and Frame Per Second [FPS]) (Liu, 2009). The formulas for precision, recall, and mean average precision are given in Equations (7), (8), and (9).
where TP denotes the number of correctly detected targets, FP the number of incorrectly detected targets, FN the number of missed targets, and N the number of target categories. The mAP is a composite measure of the overall average accuracy of the model recognition. Typically, a higher mAP value represents a better detection performance of the model. The average of the previous 30 epochs was used as the result for all evaluation metrics. The detection speed of the model was measured by FPS, which indicates the number of images processed by the model per second. The larger the fps value, the faster the model processed the images.
Results
Results of different testing scales
In Section 1.3, we discussed the removal of the 80 × 80 feature map branches in the YOLOv5s network to detect small targets and the retention of the 20 × 20 and 40 × 40 feature map branches. In this section, multiple sets of training experiments were conducted on the YOLOv5s and YOLO-Rip networks to obtain the results shown in Figure 6. After removing the 80 × 80 feature map branch, the model size was reduced by 0.54 MB, the mAP decreased by 0.33%, and the detection speed reached a maximum of 49.63 frames per second. This is an improvement of 3.58 compared to the original network. This proves that the YOLO-Rip network structure improves the detection speed. The slight decrease in the mAP value was acceptable in exchange for a substantial improvement in speed.
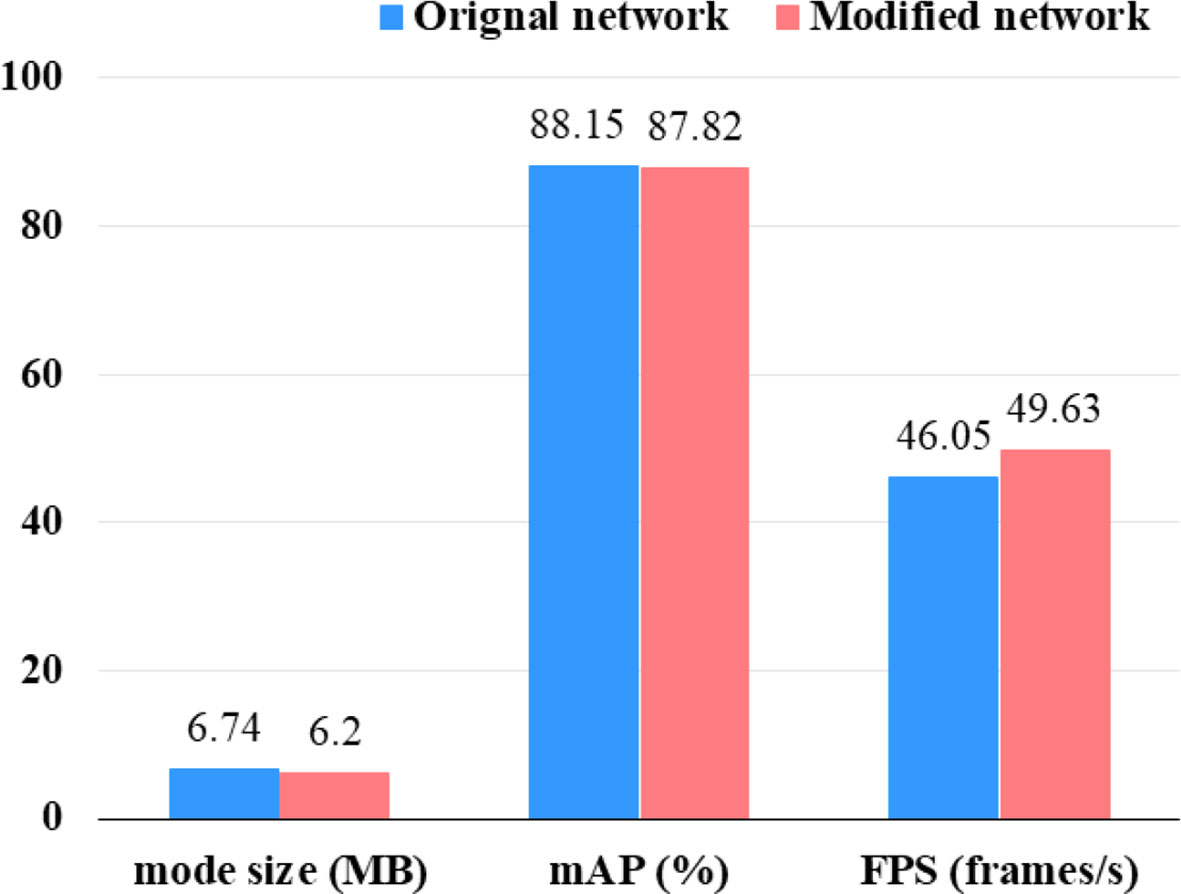
Figure 6 Comparison of the original and modified network parameters.
Training results for various JDCs
To verify the effect of the joint dilation convolution designed in this study on the model detection performance under various combinations, we added three additional dilation convolution structures for testing. The three joint dilation convolution structures are shown in Figure 7. Various joint dilation convolutional structures were applied to the network model with the 80 × 80 feature map branches removed for testing. The experimental results in Table 2 show that although the various joint expanded convolutional approaches made the model larger, they each enhanced the detection ability of the model, and the mAP and FPS values were improved. Among them, the original JDC structure controlled the model enlargement best, increasing it by only 0.46 MB. Concurrently, the mAP value increased 2.99% to 91.14%, and the FPS increased by 2.05, which was the best performance among all schemes. Therefore, we selected an initial JDC structure embedded in the neck region.
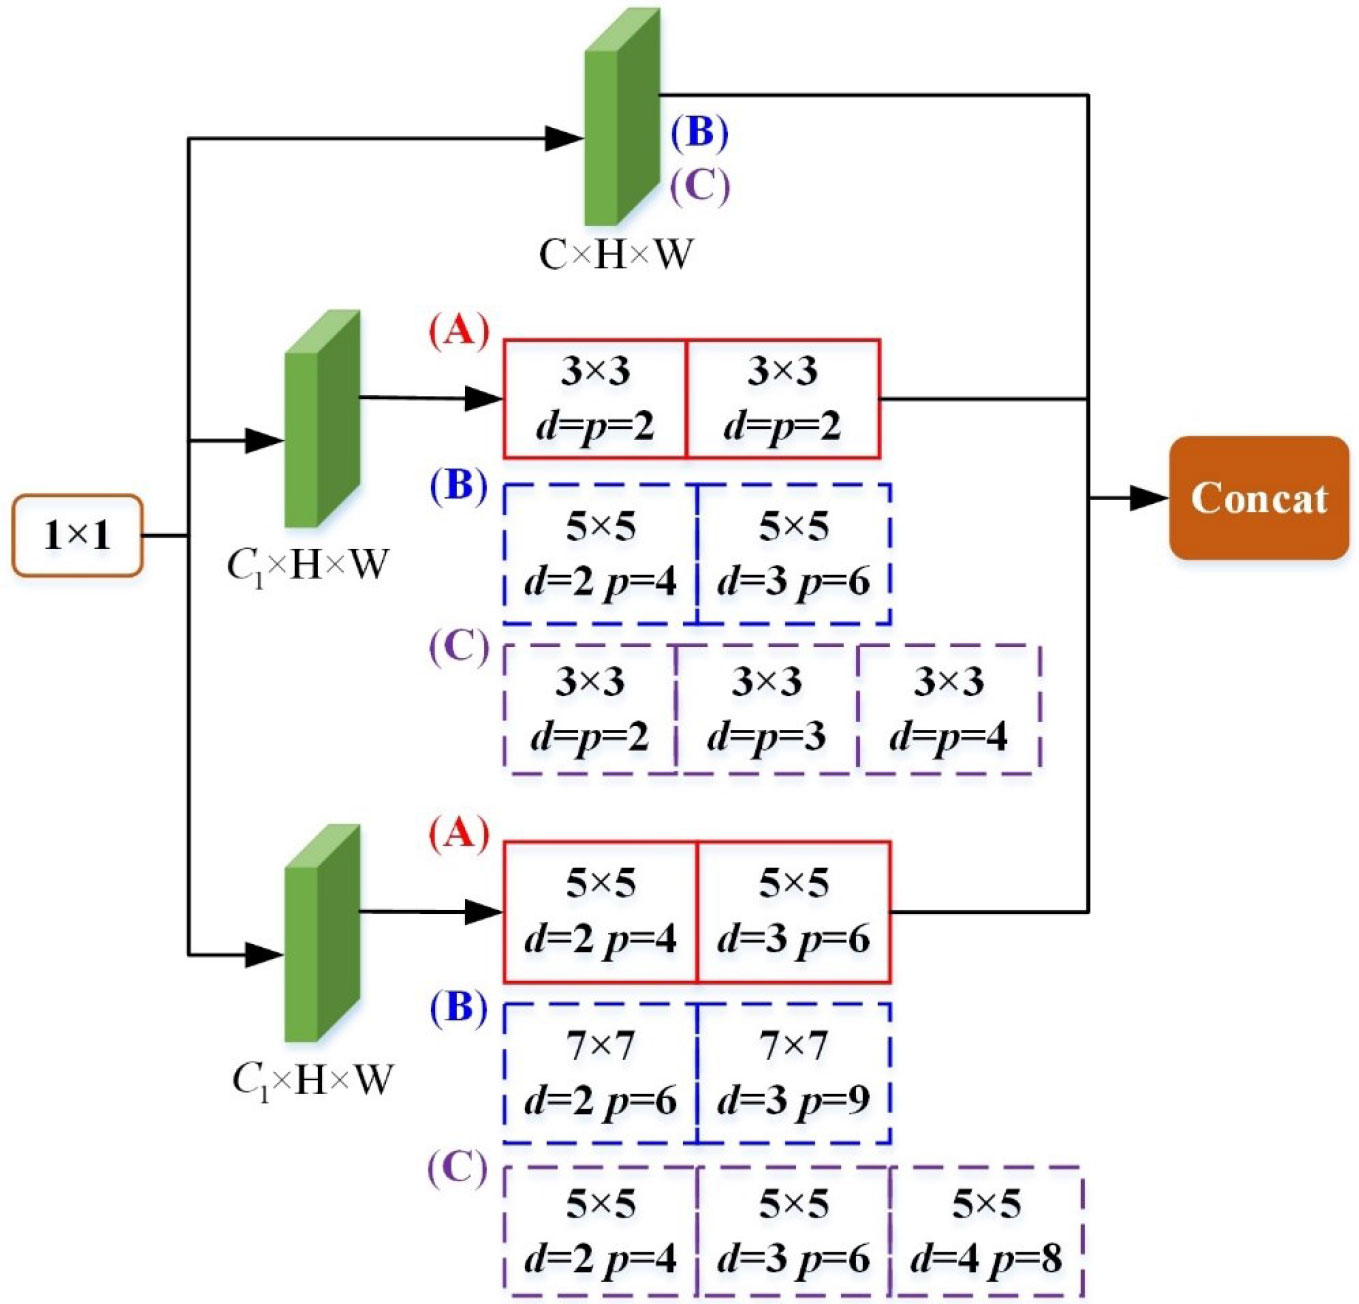
Figure 7 Schematic of three joint dilation convolution structures, where C is the number of channels, H is the height of the feature map, W is the width of the feature map, d refers to dilation rate, and p refers to padding. (A) is the structure of JDC1, with the parameters of JDC1 in the red solid box, (B) is the structure of JDC2, with the parameters of JDC2 in the blue dashed box, and (C) is the structure of JDC3, with the parameters of JDC3 in the purple dashed box.

Table 2 Results of training with various JDC structures.
Comparison of different attention mechanisms
We used the fused attention mechanism CoordAttention and CBAM to conduct comparison experiments to verify the compatibility of SimAM with the model. The experimental results are shown in Table 3. CBAM could capture the local correlation of feature information. However, it was difficult to capture the dependence on large areas. The convolution operation in CoordAttention further expands the perceptual field. Location information is embedded in the channel attention for small targets, and coordinate attention is generated to enhance feature aggregation. Adding CoordAttention and CBAM modules can improve the detection accuracy of small targets. However, neither is suitable for large targets such as rip currents. Introducing additional parameters to increase the number of network layers or convolution operations beyond the optimal field of perception will result in lower mAP and FPS values. In contrast, SimAM does not combine spatial attention with channel attention but explores the importance of each neuron to generate attention weights. Moreover, it does not introduce additional parameters compared with CoordAttention and CBAM. After adding the SimAM module, the mAP value was improved by 1.01% and the FPS value was increased by 0.13 compared to the original network Table 3.
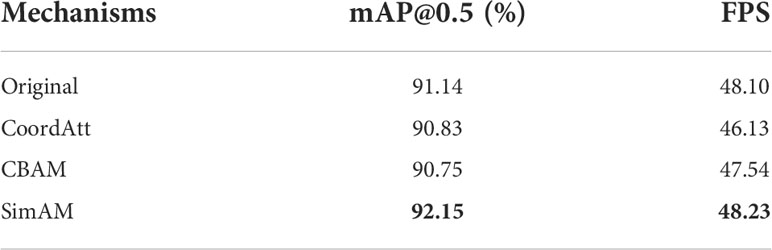
Table 3 Model training results when various attention mechanisms were used.
Ablation experiments
With the above scheme, we designed the YOLO-Rip model and completed the training task for the dataset, and obtained the experimental results in Table 4.
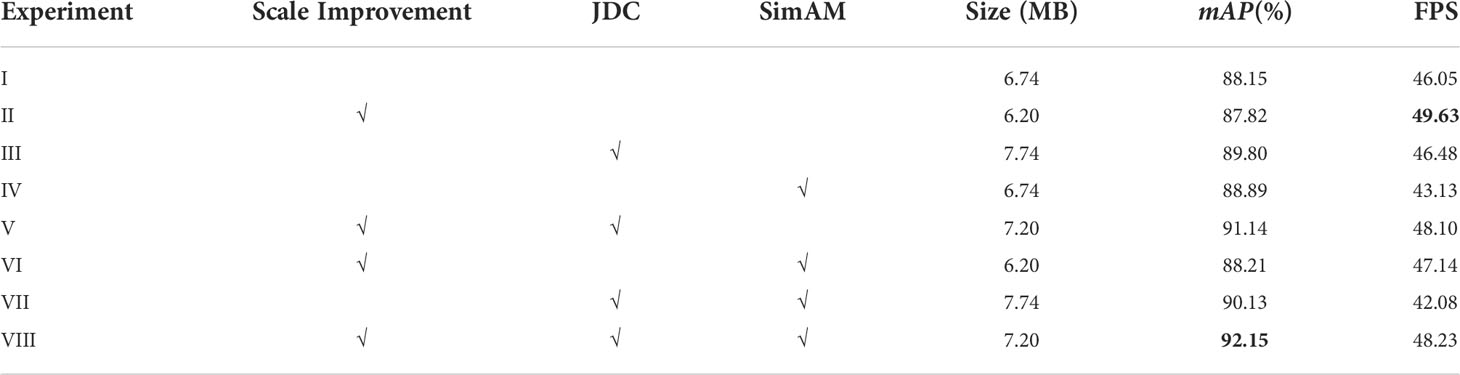
Table 4 Results of ablation experiments.
The results of Experiment III show that mAP and FPS increased by 1.65% and 0.63, respectively. However, the FPS improvement was not significant without scale improvement. By adding the scale improvement in Experiment V, the model size was reduced by 0.54 MB and the FPS was increased by 1.62 compared with Experiment III. Concurrently, mAP increased by 1.34%, indicating that removing the redundant network detection branches can improve the detection capability of the network. Finally, in Experiment VIII, SimAM, a simple, parameter-free attention module, was added to further enhance the feature processing capability of the network. Compared with Experiment V, the model size remained the same, mAP improved by 1.01%, and FPS improved by 0.13. Overall, compared to YOLOv5s, YOLO-Rip increased in size by only 0.46 MB while increasing the mAP value by 4% and the detection rate by 2.18 frames per second.
Training results on different models
We trained the same dataset on several mainstream detection models and obtained the training results listed in Table 5. Compared with the other networks, YOLO-Rip had the highest mAP value of 92.15% for detection. The FPS value was 48.23, which was larger than that of YOLOX-s and YOLOv3-tiny. The model size was 15.3 MB, which was larger than that of YOLOX-s and YOLOv5s, and mainly depended on the structure of the model. Among the balanced mAP and FPS values, YOLO-Rip was the best choice.
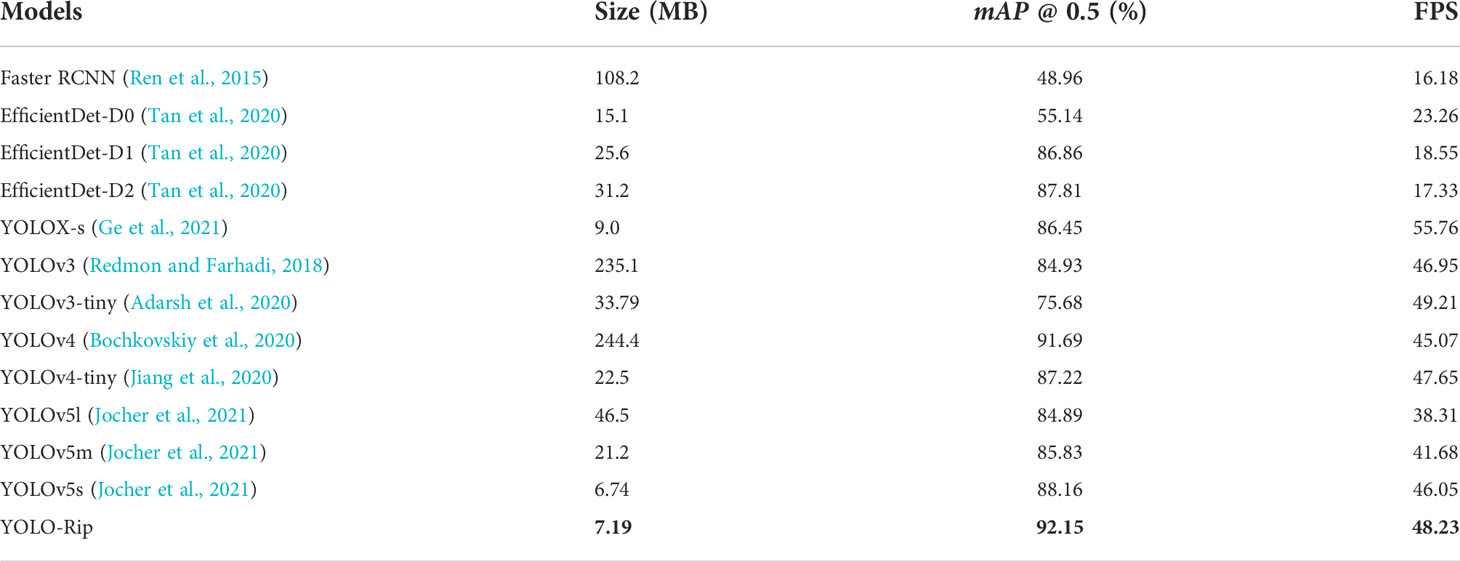
Table 5 Results of the number of parameters and mAP values on the training dataset of various models.
Figure 8 shows the detection performance of the YOLO-Rip model on a set of test images. It detected rip currents completely in most cases where they were present and achieved a high intersection over union (IOU) value (Jiang et al., 2018). Images that did not contain rip currents were virtually free of false positives.
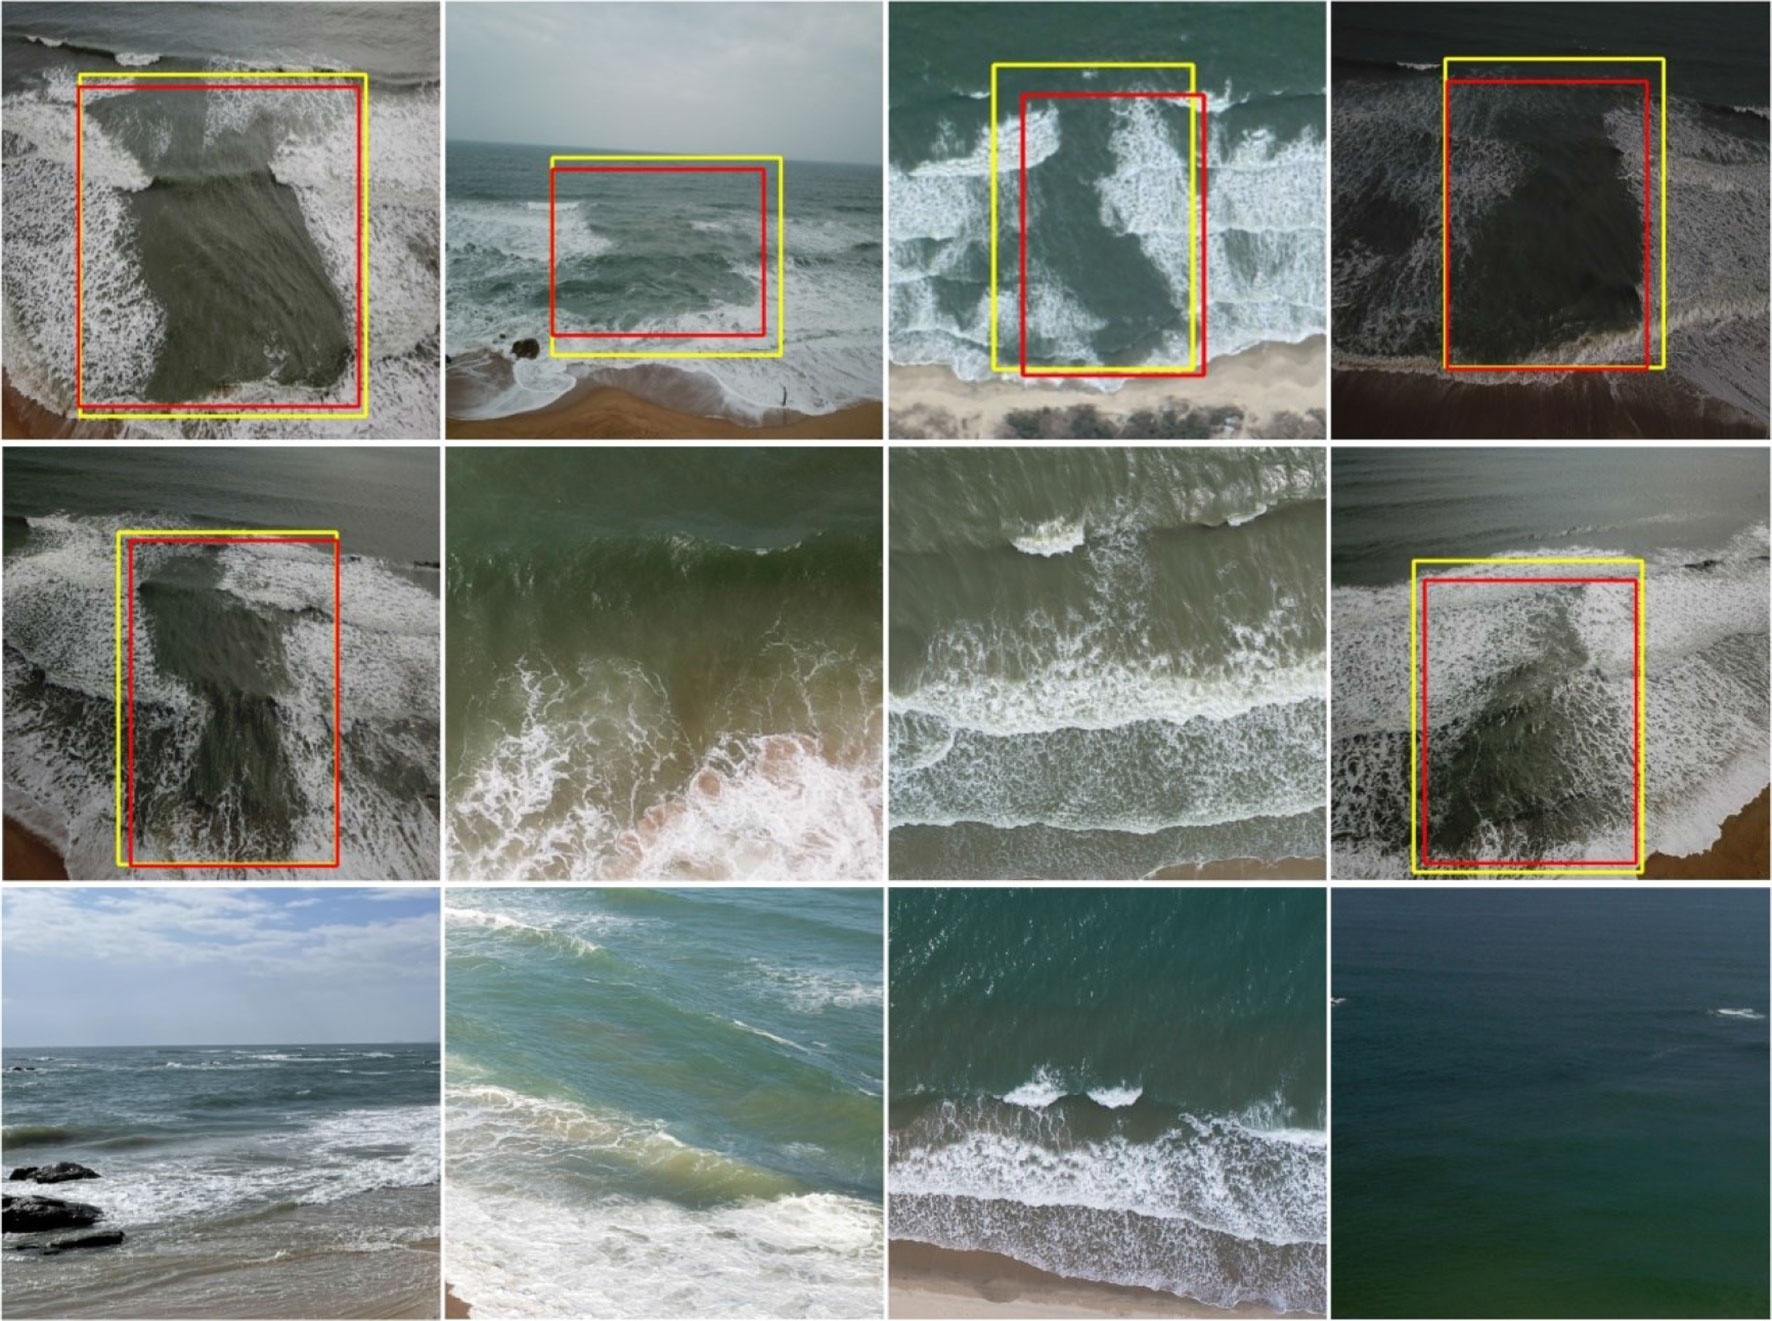
Figure 8 Detection performance of YOLO-Rip. The red bounding boxes represent manually defined rips, and the yellow bounding boxes depict rips detected by the model. The absence of bounding boxes in the image indicates the absence of rip current.
Discussion
Detection model
For a target recognition task, the choice of recognition model is critical. de Silva et al. (2021) trained a self-built dataset using Faster R-CNN and used temporal smoothing to qualify the anchor frame to obtain average accuracy. Satisfactory results have been achieved in detecting rip currents characterized by a gap in the breaking waves. However, Faster RCNN is a two-stage detection algorithm. When the dataset reached a certain size, the detection time increased rapidly. Field detection has a high requirement for real-time performance, and rip currents are highly transient. Therefore, if the occurrence of rip currents is not detected in a timely manner, there is greater risk to swimmers. It is difficult for beach managers to achieve real-time forecasting of sea surface conditions in the nearshore area. We used the state-of-the-art YOLO detection framework, which has pronounced advantages over the Faster RCNN framework.
The YOLO framework is a one-stage detection algorithm, where YOLOv4 uses class label smoothing; a regularization method (Bochkovskiy et al., 2020). If the neural network is overfitted and/or overconfident, we can attempt to smoothen the labels. That is, the labels may be incorrect at the training time and we may “over” trust the labels of the training samples and fail to recognize the complexity of other predictions. Therefore, to avoid overconfidence, it is more reasonable to encode the class label representation to evaluate uncertainty. YOLOv4 uses class smoothing and selects a model with a correct prediction probability of 0.9.
The advantages of YOLOv5 are even more evident. YOLOv5 has a faster training speed than the Darknet framework used by YOLOv4 (Jocher et al., 2021). In particular, the object recognition speed of YOLOv5s of up to 140 fps is very impressive. Figure 9 shows that YOLOv5s has the smallest model size of several models (YOLOv3, YOLOv4, and YOLOv5). If the intention is to deploy the model as part of an early warning system, then model size is a concern, and YOLOv5s has clear advantages.
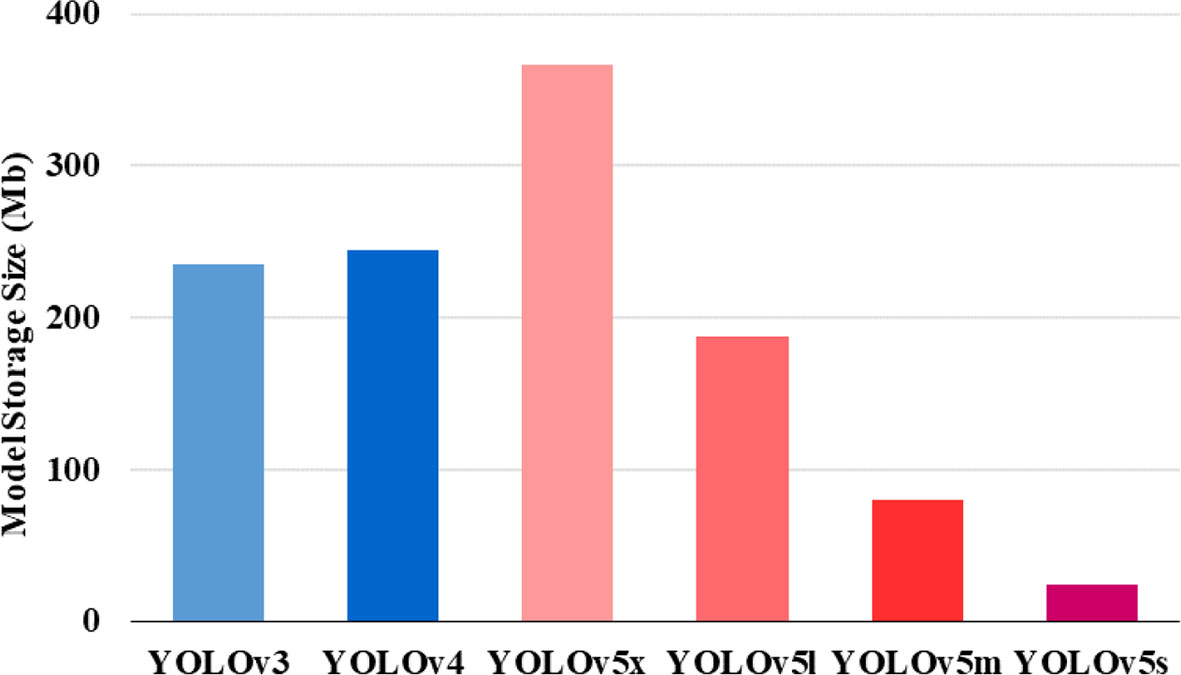
Figure 9 Comparison of the size of various models.
Detection effect
Although it is difficult to make a fair comparison between different target detectors, in some specific scenarios, for “object” such as rip current, in addition to the accuracy, the detection speed also needs to be considered. Therefore, we did a lot of training on different detection models. In order to balance accuracy and speed, we finally selected YOLOv5s as a benchmark for comparison because of its excellent performance (Table 5).
A comparison of the mAP values obtained on the training set before and after model improvement is shown in Figure 10 which shows that YOLO-Rip has a notable improvement in mAP compared to YOLOv5s, and the specific mAP values are partially listed in Table 6. This indicates that YOLO-Rip has better performance.
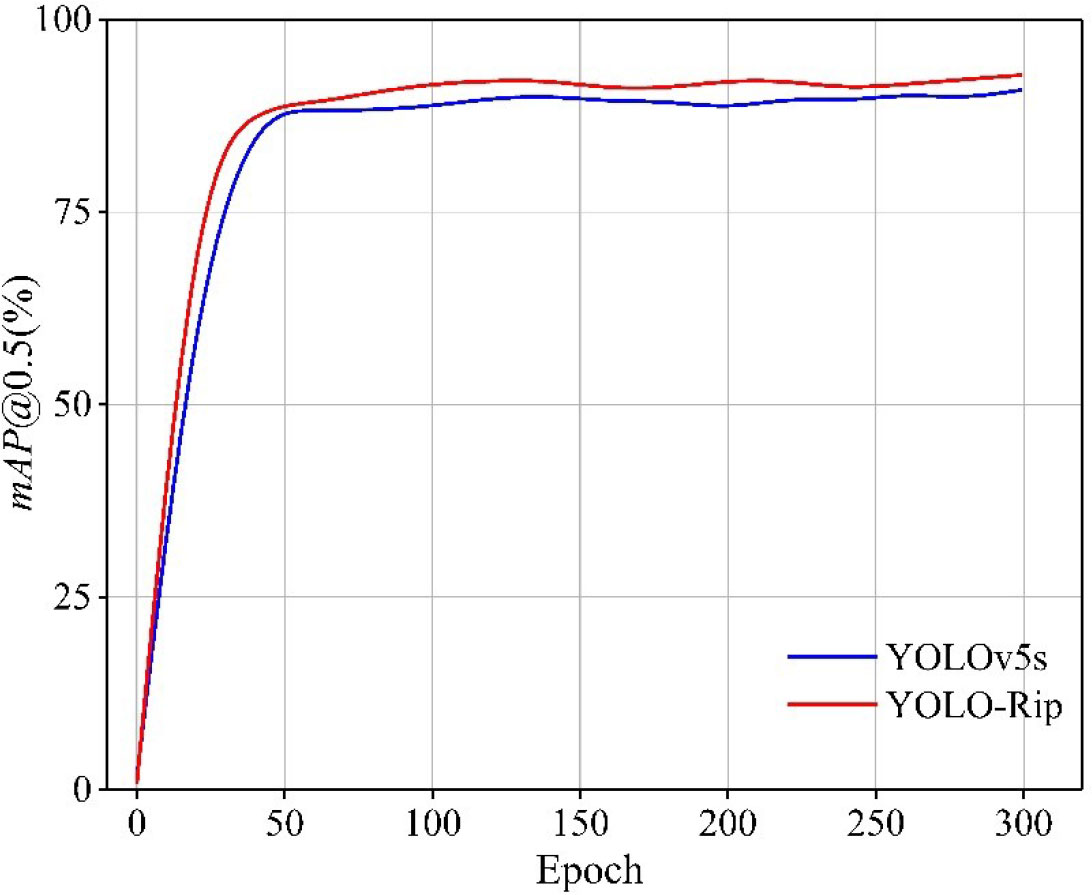
Figure 10 Comparison of mAP values between YOLOv5s and YOLO-Rip training datasets.
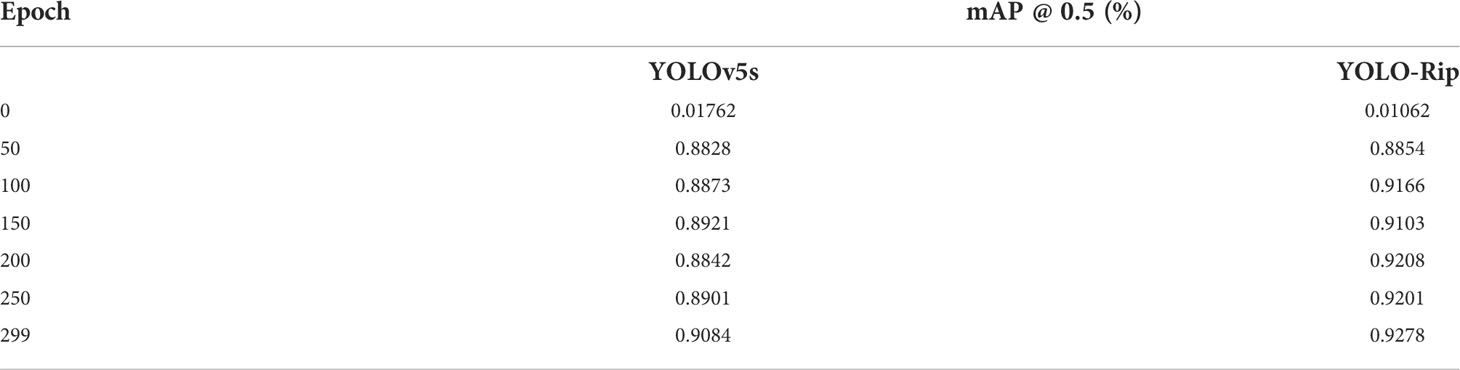
Table 6 Comparison of mAP values between YOLOv5s and YOLO-Rip training datasets.
In addition, we tested YOLOv5s and YOLO-Rip on a publicly available video. YOLOv5s occasionally mis detected (Figure 11A1), missed (Figures 11C1, E1, F1), and overlapped markers in the same region (Figures 11B1, D1) during the test. However, YOLO-Rip performed well in avoiding these problems (Figures 11A2, B2, C2, E2, and F2). This may be a result of the distinct signal strengths generated by the features in each frame. Therefore, we attempted to compare feature images with the same number of frames. de Silva et al. (2021) obtained high detection accuracy using time averaging in the Faster RCNN model. However, it has a two-stage structure and the detection speed was not high (Table 5), which substantially increased the training time (usually by 3–6 days) and GPU resources. It is impractical to train the Faster RCNN model using multiple types of target detection methods.
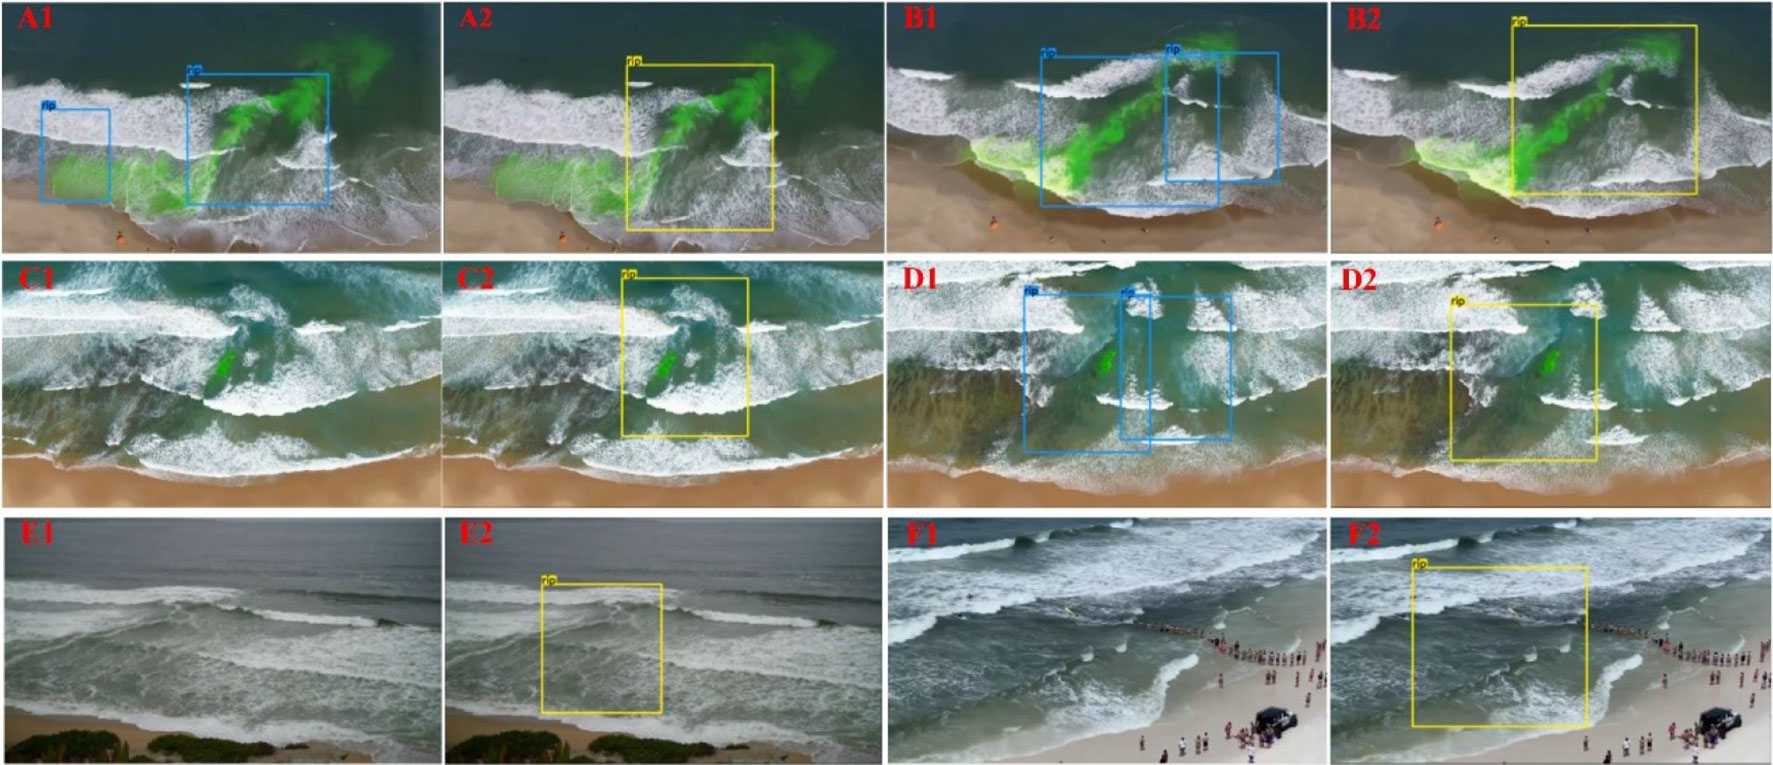
Figure 11 Actual detection results of YOLOv5s (blue boxes in A1, B1, C1, D1, E1, F1) and YOLO-Rip (A2, B2, C2, D2, E2, F2) in selected video frames. In groups A, B, C, and D, dye was used to track rip currents and enhance the visual effect, but did not affect the detection of rip currents by the model. (Video from de Silva et al.).
Future work
Although deep learning is an important approach to machine learning with numerous achievements in object detection, image processing, and machine translation, there are few cases and applications in ocean observation. After studying the existing literature, we realized that it is difficult to find previous work for comparison in the field of rip current recognition due to the lack of a baseline. The current dataset that can validate our proposed model is limited and not general. As with other machine learning models, YOLO-Rip sometimes failed to detect during training. Our training data mainly consisted of groove-type and depth-controlled rip currents (Leatherman, 2013), which are typically characterized by clear wave-breaking gaps and visually distinct color changes. Although some other metrics may be neglected, such as the length and width of the breakwater, these metrics should be considered in the next step of the study.
Future research should focus on building a rich database of rip current images to include more beach scenes so that the results can be generalized. The publicly available dataset and methodology of de Silva et al. (2021) provide a successful reference case for those working on rip-current research. This study extended the rip current image dataset by delving into the problems of neural network models in identifying indefinite targets and presenting a new detection model in this study.
Some factors, such as weather conditions and artificial photography, should be considered and discussed in the study of target sample detection because they play a vital role in the detection effectiveness of rip current targets and the robustness of the model (Laroca et al., 2018). In addition, research on deep learning techniques for rip current target detection has just begun, and further research is still needed for diverse types of rip current characteristics. When acquiring images of rip currents, factors such as sea wind and waves can make the images appear exposed to varying degrees and can lead to problems such as missed targets. These issues remain to be solved. In addition, further depth detection of rip currents in complex backgrounds, including operations such as preprocessing and reconstruction of image data, is also a research direction that needs attention.
Conclusion
We presented a neural network model for identifying rip currents, YOLO-Rip, based on the YOLOv5 detection framework. The aim of the study was to effectively extract features of rip current targets and perform multi-scale fusion. This was accomplished by designing a joint dilated convolution module to extend the perceptual field and solve the problem of a substantial increase in the number of parameters or feature losses when extending the perceptual field. To simplify the model and speed up detection, the branching structure for detecting small targets was removed. This allowed the model to adapt to the detection of large targets such as rip currents. Finally, to further improve the accuracy, the parameter-free attention mechanism, SimAM, was added. This can enhance the extraction of effective features without introducing additional parameters. Several mainstream target detection models were trained on the extended dataset, and the results showed that the average detection accuracy of YOLO-Rip reached 92.15%, and the detection rate reached 48.23 frames per second. This is an increase of 4% and 2.18 frames per second, respectively, compared with the YOLOv5s model. The average detection accuracy was the highest compared to other neural networks, demonstrating the accuracy and efficiency of YOLO-Rip. The training and test data are included in the supplementary material.
Data availability statement
The datasets presented in this study can be found in online repositories. The names of the repository/repositories and accession number(s) can be found in the article/supplementary material.
Author contributions
DZ conceived, designed and performed the designs and drafted this paper. RQ completed the experimental verification, PH, QS, and XQ reviewed and edited this paper. ZL provided the design ideas and reviewed this paper. All authors contributed to the article and approved the submitted version.
Funding
This work was supported in part by the National Natural Science Foundation of China under Grant 42176167, and the Innovation Project Foundation of Guangdong Ocean University under Grant 18307.
Acknowledgments
The authors would like to thank the Key Laboratory of public Big Data of Guizhou University for technical support, and all members of our team for their contributions to the collection of rip currents images. Especially, the authors would like to thank Akila de Silva et al. for providing the publicly available dataset.
Conflict of interest
The authors declare that the research was conducted in the absence of any commercial or financial relationships that could be construed as a potential conflict of interest.
Publisher’s note
All claims expressed in this article are solely those of the authors and do not necessarily represent those of their affiliated organizations, or those of the publisher, the editors and the reviewers. Any product that may be evaluated in this article, or claim that may be made by its manufacturer, is not guaranteed or endorsed by the publisher.
References
Adarsh P., Rathi P., Kumar M. (2020). “YOLO v3-tiny: Object detection and recognition using one stage improved model,” in 2020 6th international conference on advanced computing and communication systems (ICACCS) (IEEE), 687–694. doi: 10.1109/ICACCS48705.2020.9074315
Australia, S.L.S (2019) National coastal safety report. Available at: https://issuu.com/surflifesavingaustralia/docs/ncsr2019.
Bochkovskiy A., Wang C. Y., Liao H. Y. M. (2020). Yolov4: Optimal speed and accuracy of object detection. arXiv preprint arXiv:2004.10934. doi: 10.48550/arXiv.2004.10934
Brander R. W., Bradstreet A., Sherker S., MacMahan J. (2011). Responses of swimmers caught in rip currents: Perspectives on mitigating the global rip current hazard. Int. J. Aquat. Res. Educ. 5 (4), 11. doi: 10.25035/ijare.05.04.11
Brannstrom C., Brown H., Houser C., Trimble S., Santos A. (2015). “You can’t see them from sitting here”: Evaluating beach user understanding of a rip current warning sign. Appl. Geogr. 56 (10), 61–70, 11. doi: 10.1016/j.apgeog.2014.10.011
Brewster B. C., Gould R. E., Brander R. W. (2019). Estimations of rip current rescues and drowning in the united states. Natural Hazard. Earth Syst. Sci. 19 (2), 389–397. doi: 10.5194/nhess-19-389-2019
Brighton B., Sherker S., Brander R., Thompson M., Bradstreet A. (2013). Rip current related drowning deaths and rescues in Australia 2004–2011. Natural Hazard. Earth Syst. Sci. 13 (4), 1069–1075. doi: 10.5194/nhess-13-1069-2013
Buscombe D., Carini R. J., Harrison S. R., Chickadel C. C., Warrick J. A. (2020). Optical wave gauging using deep neural networks[J]. Coast. Eng. 155, 103593. doi: 10.1016/j.coastaleng.2019.103593
Castelle B., Almar R., Dorel M., Lefebvre J. P., Senechal N., Anthony E. J., et al. (2014). Rip currents and circulation on a high-energy low-tide-terraced beach (Grand popo, Benin, West Africa). J. Coast. Res. 70 (10070), 633–638. doi: 10.2112/SI70-107.1
Chang S. Y., Kim J. H., Lee H. S., Kim I. (2021). Mechanism of rip current generation at deoksan beach, south Korea. J. Coast. Res. 114 (SI), 295–299. doi: 10.2112/SIJCR-SI114-060.1
Clark D., Feddersen F., Guza R. (2010). Cross-shore surfzone tracer dispersion in an alongshore current. J. Geophys. Res. (Ocean.) 115(C10), 115. doi: 10.1029/2009JC005683
Clark D. B., Lenain L., Feddersen F., Boss E., Guza R. (2014). Aerial imaging of fluorescent dye in the near shore. J. Atmosph. Ocean. Technol. 31, 1410–1421. doi: 10.1175/JTECH-D-13-00230.1
Da F. Klein A. H., Santana G. G., Diehl F. L., De Menezes J. T. (2003). Analysis of hazards associated with sea bathing: results of five years work in oceanic beaches of Santa catarina state, southern Brazil. J. Coast. Res. 35, 107–116.
de Silva A., Mori I., Dusek G., Davis J., Pang A. (2021). Automated rip current detection with region based convolutional neural networks. Coast. Eng. 166, 103859. doi: 10.1016/j.coastaleng.2021.103859
Dudkowska A., Boruń A., Malicki J., Schönhofer J., Gic-Grusza G. (2020). Rip currents in the non-tidal surf zone with sandbars: numerical analysis versus field measurements. Oceanologia 62 (3), 291–308. doi: 10.1016/j.oceano.2020.02.001
Dusek G., Seim H. (2013). A probabilistic rip current forecast model. J. Coast. Res. 29 (4), 909–925. doi: 10.2112/Jcoastres-D-12-00118.1
Elgar S., Raubenheimer B., Guza R. T. (2001). Current meter performance in the surf zone. J. Atmosph. Ocean. Technol. 18, 1735–1746. doi: 10.1175/1520-0426(2001)018<1735:cmpits>2.0.co;2.n/a
Eom H., Yun J. H., Jeong C. K., Seo J. W., You S. H. (2014). Introduction to KMA operational forecasting system for rip current. J. Coast. Res. 72 (10072), 63–68. doi: 10.2112/SI72-012.1
Ge Z., Liu S., Wang F., Li Z., Sun J. (2021). Yolox: Exceeding yolo series in 2021. 08430. doi: 10.48550/arXiv.2107.08430
Han W., Khorrami P., Paine T. L., Ramachandran P., Babaeizadeh M., Shi H., et al. (2016) Seq-NMS for video object detection. Available at: http://arxiv.org/abs/1602.08465.
Han J., Zhang D., Cheng G., Liu N., Xu D. (2018). “Advanced deep-learning techniques for salient and category-specific object detection: A survey,” in IEEE Signal processing magazine, vol. 35. , 84–100. doi: 10.1109/MSP.2017.2749125
He K., Zhang X., Ren S., Sun J. (2015). “Spatial pyramid pooling in deep convolutional networks for visual recognition,” in IEEE Transactions on pattern analysis and machine intelligence, vol. 37 (9), 1904–1916. doi: 10.1109/TPAMI.2015.2389824
Holman R. A., Stanley J. (2007). The history and technical capabilities of Argus. Coast. Eng. 54, 477–491. doi: 10.1016/j.coastaleng.2007.01.003
Hong X., Zhang Y., Wang B., Zhou S., Yu S., Zhang J. (2021). Numerical study of rip currents interlaced with multichannel sandbars. Natural Hazard. 108 (1), 593–605. doi: 10.1007/s11069-021-04696-8
Horn B. K., Schunck B. G. (1981). Determining optical flow. Artif. Intell. 17, 185–203. doi: 10.1016/0004-3702(81)90024-2
Inch K. (2014). “Surf zone hydrodynamics: Measuring waves and currents,” in Geomorphological techniques, 1–13. https://www.researchgate.net/publication/311536127_Surf_Zone_Hydrodynamics_Measuring_Waves_and_Currents
Jiang B., Luo R., Mao J., Xiao T., Jiang Y. (2018). “Acquisition of localization confidence for accurate object detection,” in Proceedings of the European conference on computer vision (ECCV), 784–799. doi: 10.48550/arXiv.1807.11590
Jiang Z., Zhao L., Li S., Jia Y. (2020). Real-time object detection method based on improved YOLOv4-tiny. doi: 10.48550/arXiv.2011.04244
Jocher G., et al. (2021) yolov5. Available at: https://github.com/ultralytics/yolov5.
Laroca R., Severo E., Zanlorensi L. A., Oliveira L. S., Gonçalves G. R., Schwartz W. R., et al. (2018). “A robust real-time automatic license plate recognition based on the YOLO detector,” in 2018 international joint conference on neural networks (ijcnn). (IEEE), 1–10. doi: 10.1109/IJCNN.2018.8489629
Leatherman S. P. (2013). Rip currents. In Coastal Hazards. (Dordrecht: Springer), 811–31. doi: 10.1007/978-94-007-5234-4_26
Lin T. Y., Dollár P., Girshick R., He K., Hariharan B., Belongie S. (2017). “Feature pyramid networks for object detection,” in Proceedings of the IEEE conference on computer vision and pattern recognition, IEEE. 2117–2125. doi: 10.48550/arXiv.1612.03144
Liu T. Y. (2009). “Learning to rank for information retrieval,” in Foundations and trends® in information retrieval. 3 (3), 225–331. doi: 10.1561/1500000016
Liu S., Qi L., Qin H., Shi J., Jia J. (2018). “Path aggregation network for instance segmentation,” in Proceedings of the IEEE conference on computer vision and pattern recognition, 8759–8768. doi: 10.48550/arXiv.1803.01534
Liu Y., Wu C. H. (2019). Lifeguarding operational camera kiosk system (LOCKS) for flash rip warning: Development and application. Coast. Eng. 152, 103537. doi: 10.1016/j.coastaleng.2019.103537
Maryan C., Hoque M. T., Michael C., Ioup E., Abdelguerfi M. (2019). Machine learning applications in detecting rip channels from images. Appl. Soft. Comput. 78, 84–93. doi: 10.1016/j.asoc.2019.02.017
Mori I., De Silva A., Dusek G., Davis J., Pang A. (2022). Flow-based rip current detection and visualization. (IEEE Access) 10, 6483–95. doi: 10.1109/ACCESS.2022.3140340
Mouragues A., Bonneton P., Castelle B., Martins K. (2021). Headland rip modelling at a natural beach under high-energy wave conditions. J. Mar. Sci. Eng. 9 (11), 1161. doi: 10.3390/jmse9111161
Nelko V., Dalrymple R. A. (2011). “‘Rip current prediction in ocean city, Maryland,” in Rip currents: Beach safety, physical oceanography, and wave modeling (Florida: CRC Press International), 45–57.
Pitman S., Gallop S. L., Haigh I. D., Mahmoodi S., Masselink G., Ranasinghe R. (2016). Synthetic imagery for the automated detection of rip currents. J. Coast. Res. 75 (10075), 912–916. doi: 10.2112/SI75-183.1
Rashid A. H., Razzak I., Tanveer M., Robles-Kelly A. (2020). “RipNet: A lightweight one-class deep neural network for the identification of rip currents,” in International conference on neural information processing (Cham: Springer), 172–179. doi: 10.1007/978-3-030-63823-8_21
Rashid A. H., Razzak I., Tanveer M., Robles-Kelly A. (2021). “RipDet: A fast and lightweight deep neural network for rip currents detection,” in 2021 international joint conference on neural networks (IJCNN). (IEEE), 1–6. doi: 10.1109/IJCNN52387.2021.9533849
Redmon J., Farhadi A. (2018). Yolov3: An incremental improvement. Computer Vision and Pattern Recognition. doi: 10.48550/arXiv.1804.02767
Ren S., He K., Girshick R., Sun J. (2015). “Faster r-cnn: Towards real-time object detection with region proposal networks,” in Advances in neural information processing systems, vol. 28. doi: 10.1109/tpami.2016.2577031
Schmidt W. E., Woodward B. T., Millikan K. S., Guza R. T., Raubenheimer B., Elgar S. (2003). A GPS-tracked surf zone drifter. J. Atmosph. Ocean. Technol. 20 (7), 1069–1075. doi: 10.1175/1460.1
Short A. D. (2007). Australian Rip systems–friend or foe? J. Coast. Res, 7–11. Available at: https://www.jstor.org/stable/26481546
Stephen P. (2012). “Break the grip of the rip,” in Laboratory for coastal research (Florida International University). Leatherman.
Tan M., Pang R., Le Q. V. (2020). “Efficientdet: Scalable and efficient object detection,” in Proceedings of the IEEE/CVF conference on computer vision and pattern recognition. 2020, 10781–10790. doi:10.48550/arXiv.1911.09070
Wang H., Zhu S., Li X., Zhang W., Nie Y. (2018). Numerical simulations of rip currents off arc-shaped coastlines. Acta Oceanol. Sin. 37 (3), 21–30. doi: 10.1007/s13131-018-1197-1
Woo S., Park J., Lee J. Y., Kweon I. S. (2018). “CBAM: Convolutional block attention module,” in Proceedings of the European conference on computer vision (ECCV). 2018, 3–19. doi: 10.48550/arXiv.1807.06521
Yang L., Zhang R. Y., Li L., Xie X. (2021). “Simam: A simple, parameter-free attention module for convolutional neural networks,” in International conference on machine learning, PMLR, 2021, 11863–11874. Available at: https://proceedings.mlr.press/v139/yang21o.html
Keywords: rip currents, deep learning, joint dilated convolution module, multi-scale fusion, detection algorithm
Citation: Zhu D, Qi R, Hu P, Su Q, Qin X and Li Z (2022) YOLO-Rip: A modified lightweight network for Rip currents detection. Front. Mar. Sci. 9:930478. doi: 10.3389/fmars.2022.930478
Received: 28 April 2022; Accepted: 15 July 2022;
Published: 09 August 2022.
Edited by:
Ronan Fablet, IMT Atlantique Bretagne-Pays de la Loire, FranceReviewed by:
Vagner Ferreira, Hohai University, ChinaDuane Edgington, Monterey Bay Aquarium Research Institute (MBARI), United States
Copyright © 2022 Zhu, Qi, Hu, Su, Qin and Li. This is an open-access article distributed under the terms of the Creative Commons Attribution License (CC BY). The use, distribution or reproduction in other forums is permitted, provided the original author(s) and the copyright owner(s) are credited and that the original publication in this journal is cited, in accordance with accepted academic practice. No use, distribution or reproduction is permitted which does not comply with these terms.
*Correspondence: Zhiqiang Li, cWlhbmd6bDE5NzRAMTYzLmNvbQ==
†These authors share first authorship