 He Xu1,2,3,4
 Xiyong Hou1,3,4*
 Dong Li1,3,4
 Xiaoli Wang1,3,4
 Chao Fan1,2,3,4Peipei Du1,2,3,4Baiyuan Song5
- 1Yantai Institute of Coastal Zone Research, Chinese Academy of Sciences, Yantai, China
- 2University of Chinese Academy of Sciences, Beijing, China
- 3CAS Key Laboratory of Coastal Environmental Processes and Ecological Remediation, Yantai Institute of Coastal Zone Research, Chinese Academy of Sciences, Yantai, China
- 4Shandong Key Laboratory of Coastal Environmental Processes, Yantai, China
- 5Shanghai Tongji Urban Planning Design Research Institute, Shanghai, China
Among the climate change-induced threats to coastal regions, coastal flooding caused by sea level rise (SLR) is considered one of the most serious and presents an intensifying trend over time. The negative impacts and risks associated with coastal flooding are difficult to visualize spatially and cause great inconvenience to policy-makers in understanding the distribution of different risk levels and developing adaptation policies. Our study proposes a framework for coastal flood risk (CFR) based on the hazard, exposure & sensitivity, and adaptive capacity of China’s coastal zone (CCZ) and maps the spatial distribution of CFR by GIS in 2030, 2050, and 2100 under RCP2.6-SSP1, RCP4.5-SSP2, and RCP8.5-SSP5, respectively. Our results reveal that (1) low-lying coastal areas with densely populated, economically developed, or industrially diverse are faced with serious CFRs, such as the Yellow River Delta, the Yangtze River Delta, the Pearl River Delta, and the coastal areas in Jiangsu. (2) The area of “Very high” CFR level in the CCZ reaches a peak of 44.10×10³ km2 in 2100 under RCP8.5-SSP5. And under the higher emission scenario, the areas of five CFR levels would change dramatically in the future. (3) The coastal area of Guangdong is significantly faced with the massive expected population and GDP affected due to CFR among scenarios and years. (4) As threatened by CFR mostly, built-up and farmland are particularly required to guard against the negative impact of coastal flooding, especially in Guangdong and Jiangsu. Results in this study are expected to provide the intuitive information and basis for governments, policy-makers, and local communities in addressing the increased CFR over the CCZ. Besides, our framework of CFR and methodology are flexible and can be adapted for other countries facing the threat of SLR.
1 Introduction
In the context of global warming, coastal flooding caused by sea level rise (SLR) has become one of the major risks worldwide, with substantial effects on socio-economic development and natural ecosystems in the coastal area (Nicholls and Cazenave, 2010; Tadesse and Wahl, 2021). For example, it can not only damage the infrastructure by inundation, such as buildings and roads, and damage the tourism and fishery, causing huge economic losses and human casualties (Hallegatte et al., 2013; Fang et al., 2016; Vousdoukas et al., 2018), but also lead to the serious damage to the ecological environment of coral reefs, mangroves, and coastal wetlands (Lovelock et al., 2015). In the past decades, the frequent occurrence of severe coastal floods has gained widespread attentions (Gornitz, 1991; Thumerer et al., 2000; Nadal et al., 2010; Toimil et al., 2020), such as those in the U.S. Atlantic and Gulf coasts (Sajjad et al., 2020), northwestern Europe (Ganguli et al., 2020), southeastern Australia (Asbridge et al., 2021), and East Asia (Fang et al., 2020). As climate change progresses and sea level rises, the coastal flood risk (CFR) is expected to become more serious across the planet in the future (Woodruff et al., 2013). According to the series of reports from the Intergovernmental Panel on Climate Change (IPCC), the United Nations Office for Disaster Risk Reduction (UNISDR), and the Ministry of Natural Resources of the People’s Republic of China (MNR), (UNISDR, 2017; IPCC, 2019; IPCC, 2021; MNR, 2022), the rate of SLR in China’s adjacent seas was 3.4 mm/a from 1980-2021, which was higher than the global average for the same period and may continue to rise in the future. This means that CFR will be increased significantly correspondingly in China’s coastal zone (CCZ). However, the CCZ is recognized as an important population and economic center in China, e.g., over 40% of China’s population lives in coastal provincial administrative regions, and the region contributes nearly 60% of the national gross domestic product (GDP) (Du et al., 2022). Obviously, coastal flooding poses a serious threat to coastal societies (Fang et al., 2020). Therefore, it is crucial to analyze the future impacts of coastal flooding in China at different levels of SLR under socio-economic change scenarios, which is beneficial for policy-makers to draw up proper the coastal urban planning and formulate scientific disaster prevention and adaptation policies in the future.
Risk refers to the potential for adverse consequences for human and ecological systems (IPCC, 2022). Recently, a growing number of studies have examined methods for assessing flood risk (Yang et al., 2015; Chakraborty and Mukhopadhyay, 2019; Lin et al., 2020), mainly including the subjective assessment, the objective assessment, and a combination of both. The subjective assessment approach (such as the analytical hierarchy process, AHP) assigns weights to indicators based on experts’ experience, which has the advantages of being close to reality and flexibility, but lacks the reflection of actual data. Hadipour et al. (2020) used the AHP and fuzzy AHP models to assess the social vulnerability to SLR and flooding in the coastal area of Abbas city, southern Iran. The objective assessment approach (such as the Shannon’s entropy and entropy weight method, EW) automatically assigns weights to indicators based on the amount of information contained in the actual data of indicators (without manual setting). Al-Hinai and Abdalla (2021) used Shannon’s entropy model to predict the factors that cause flooding in the Governorate of Muscat, Sultanate of Oman. Nevertheless, the combined subjective and objective approach (such as the AHP-EW combined method) reduces the subjectivity of weight setting and improves the scientific nature of the assessment by combining the advantages of subjective and objective approaches. For example, Wu et al. (2017) employed the AHP-EW combined method to assess the temporal variation of flood risk in the Huaihe River Basin, China. And Xiao et al. (2022) used the AHP-entropy weight method to obtain an overall evaluation of coastal water quality in Yangjiang, China. Overall, the combination of subjective and objective methods avoids the one-sidedness caused by using only one weight calibration method in the risk assessment and becomes widely used gradually (Wu et al., 2017).
Due to the serious threat of coastal flooding in the CCZ, various studies have assessed the CFR in the CCZ at various scales (Huang et al., 2017; Liao et al., 2019; Xu et al., 2021). For example, Fang et al. (2016) created a GIS-based dataset of major coastal tourist attractions in the coastal area of Zhejiang province, China, to assess their potential flood risk by using a simple inundation model and a risk matrix. Li et al. (2017) simulated and mapped the comprehensive risk of surge floods in Yuhuan county, China. Shi et al. (2020) assessed the risk level distribution of storm surges in Jinshan District, Shanghai in light of the hazard and vulnerability levels to the disasters. Overall, these studies highlight the assessment of CFRs at provincial and sub-provincial scales. However, for policy-makers, the detailed information on national-scale flood risk assessment is important to support the national policy development, especially in the urban cluster planning, disaster prevention construction, and coastal wetland protection (Kourgialas and Karatzas, 2017). Thus far, only a few studies have attempted to evaluate the national CFR in China. For example, Fang et al. (2020) tried to fill the gap in national coastal flood impact assessment by quantifying potential damage and adaptation costs of coastal flooding in China over the 21st century, but did not give a CFR distribution map to better support the identification of risk zones and the development of specific adaptation strategies. The above studies have generally contributed positively to the assessment of CFR in parts of CCZ, however, there is still a lack of studies focusing specifically on the spatial assessment of CFR, mapping the different CFR levels, and analyzing the possible socio-economic impact of CFR in the entire CCZ, with the integration of the hazard, exposure & sensitivity, and adaptive capacity at the pixel-scale.
The National Disaster Risk Assessment from UNISDR divided the risk assessment exercises into two stages: a preliminary flood risk assessment (PFRA) and a final, more detailed, flood risk assessment (FRA) (UNISDR, 2017). The PFRA is mainly focused on the detailed coastal flood inundation modeling to identify the inundation areas, which is suitable for hazard assessment rather than the assessment of exposure and vulnerability. After the PFRA, the FRA is mainly to quantitatively assess the comprehensive risk based on hazard, exposure & sensitivity, and adaptive capacity. Referring to the above steps, this study aims to fill the gap in the future CFR spatial assessment in the CCZ by integrating a wide range of hazard, exposure & sensitivity, and adaptive capacity by considering three Representative Concentration Pathways (RCP2.6, 4.5, and 8.5) and three Shared Socioeconomic Pathways (SSP1, 2, and 5) combinations representing climate change and socio-economic change, respectively (see chapter 2.2.2). This is achieved by three objectives: 1) to develop a spatial assessment framework of CFR for CCZ with reference to SLR; 2) to estimate the temporal and spatial characteristics of CFR in the future under different scenarios; and 3) to quantify the number of the expected socio-economic affected in the typical areas of CFR. The findings of this study shed new light on the spatial assessment of CFR with high spatial resolution in the entire CCZ in order to inform the professionals in the field of risk planning/management to develop more comprehensive and proper decisions.
The paper is structured as follows. Section 2 describes the geography of the study area, the assessment framework of CFR, the selection of scenarios and CFR indicators, and the methods of CFR assessment indicator weights. Section 3 shows the results of the characteristics of CFR. Section 4 discusses the CFR by considering various dimensions. Conclusions are presented in Section 5.
2 Materials and methods
2.1 Study area
China’s coastal zone (CCZ) is bounded by the great Eurasian continent in the west and the vast Pacific Ocean in the east, including the mainland part, offshore islands, and shallow/offshore waters. From north to south, CCZ covers 14 administrative regions, including Liaoning, Hebei, Tianjin, Shandong, Jiangsu, Shanghai, Zhejiang, Fujian, Taiwan, Guangdong, Hong Kong, Macau, Guangxi, and Hainan, as well as the waters and islands under their jurisdiction.
CCZ is densely populated and has superior natural location conditions, abundant natural resources, and a well-developed and convenient transportation network, making it one of the fastest-growing economies in the country and the world. Moreover, China’s mainland coastline is over 18,000 km long and the total area of the marginal seas is more than 4.73 × 10⁶ km2 (Figure 1). The topography of CCZ, divided by Hangzhou Bay, differs significantly from north to south: the northern coastal zone is dominated by low hills and plains, with average elevation below 200 m. The southern coastal zone is dominated by low hills and terraces, with average elevation of less than 500 m (Wang et al., 2017). There are many islands and indirectly distributed estuarine delta plains. Overall, wide seas, long shorelines, and well-developed population and economic agglomerations have resulted in the CCZ being one of the world’s most severely at CFR from SLR.
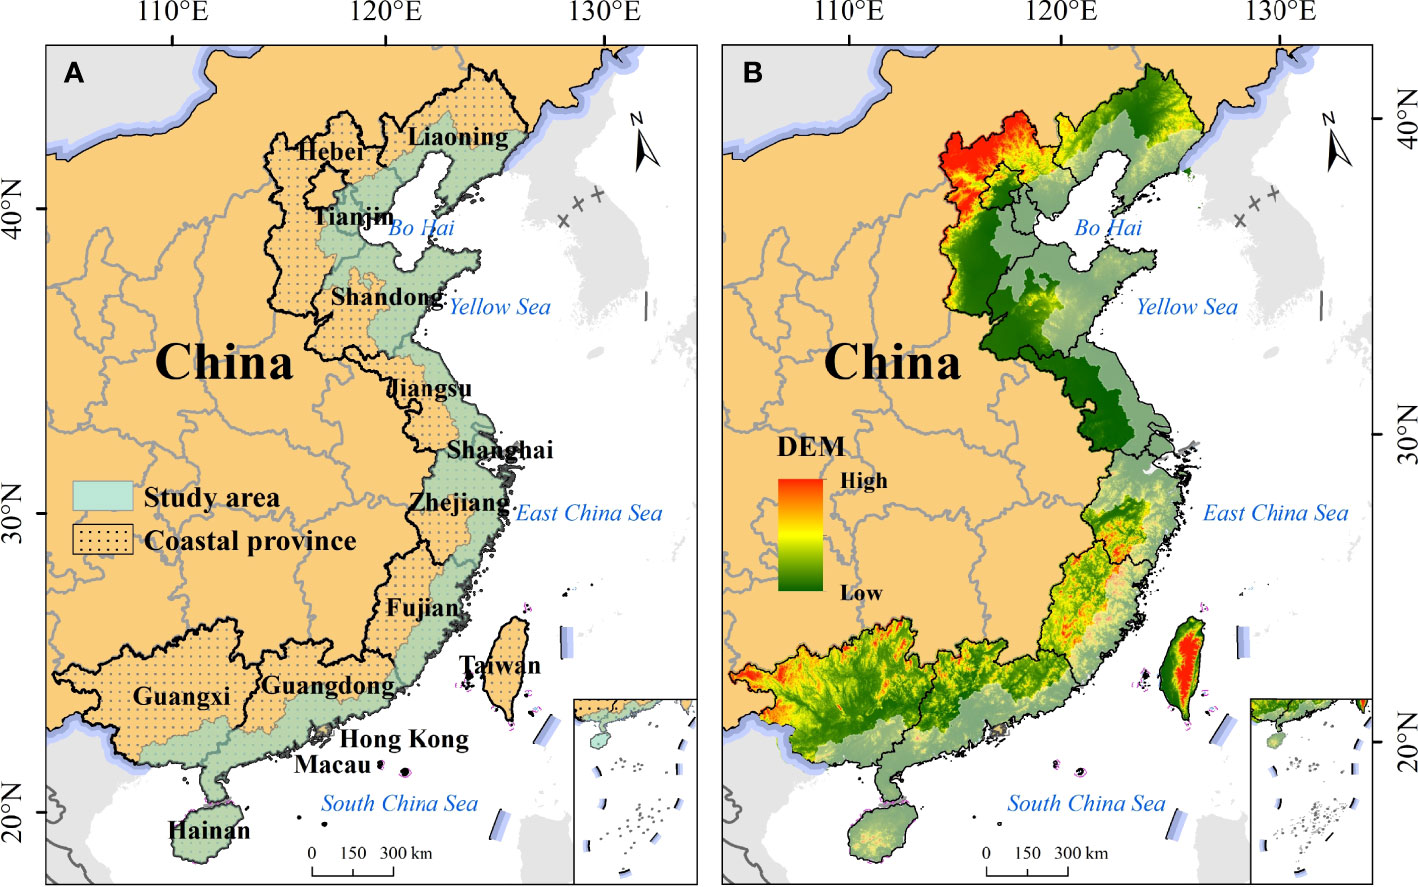
Figure 1 Location and elevation of the study area (China’s coastal zone).
In this paper, the study area is selected based on the administrative divisions of prefecture-level cities along the eastern coast of mainland China. Due to the absence of demographic and economic data, Hong Kong, Macao, Taiwan, and the islands in the South China Sea are excluded from the CFR assessment. Therefore, this study area covers a total of 11 coastal provinces (autonomous regions and municipalities). In addition, the six prefecture-level cities those are close to the coastline but not directly adjacent to the sea (which are more influenced by the sea), such as Anshan, Dezhou, Linyi, Huzhou, Foshan, and Yulin, are included in the study area (Figure 1).
2.2 Methods
2.2.1 Assessment framework of CFR
The IPCC AR6 explained the risk from flooding to human and ecological systems is caused by the flood hazards, the exposure of the system affected, and the vulnerability of the system (IPCC, 2022). The flood hazard is “A flood process or phenomenon that may cause loss of life, injury or other health impacts, property damage, social and economic disruption, or environmental degradation” (e.g., the frequency and/or depth of flooding) (UNISDR, 2017). The exposure is the nature and degree to which systems are exposed to flooding (e.g., the population, GDP, Land use/cover (LULC), or infrastructure potentially affected by flooding). Besides, the vulnerability also includes the sensitivity and the adaptive capacity. The sensitivity is the degree to which a human-environmental system is affected by flooding either adversely or beneficially (e.g., proximity to the coastline and the density of infrastructure development). The exposure and sensitivity are determined by the features of extreme occurrences and their interaction with system characteristics. They all represent intricately related properties of the system or community under the influence of the exact hazard. Therefore, they are frequently grouped together (Smit and Wandel, 2006; Nguyen et al., 2019). Here, dimensions of exposure and sensitivity include the physical, economic, and social sensitivity, transportation junction location and types, and livelihoods. In addition, the adaptive capacity is the potential to implement planned adaptation measures, mainly to lessen the effects of negative impacts and to take advantage of any opportunities (e.g., disaster shelters, disaster response agencies, and post-disaster reconstruction capabilities) (IPCC, 2014). Based on these concepts above mentioned, changes in CFR in the future periods cannot be uniquely determined by changes in flood depth or frequency, but also by changes in exposure and vulnerability of the overall assessment system. For example, if there are future economic setbacks, population decreases, or effective flood adaptation measures are implemented, then damage from flooding may also be reduced. Overall, future changes in CFR will inevitably depend on concurrent socio-economic changes.
In this paper, the assessment framework of CFR in the CCZ is referred to Nguyen et al. (2019) and incorporated a series of sub-indicators adapted from Yin et al. (2013), Weis et al. (2016), and Zhang et al. (2021) (Figure 2 and Table 1) to measure the degree of CFR under future multi-scenarios. As indicated in Equation (1), the CFR assessment framework encompasses hazard, exposure & sensitivity, and adaptive capability. However, this equation isn’t meant to represent a mathematical function; rather, it’s meant to highlight the relationship between the elements of risk assessment. According to the equation, it can be found that CFR increases when hazard, exposure, and sensitivity increase, and decreases as adaptive capacity increases.
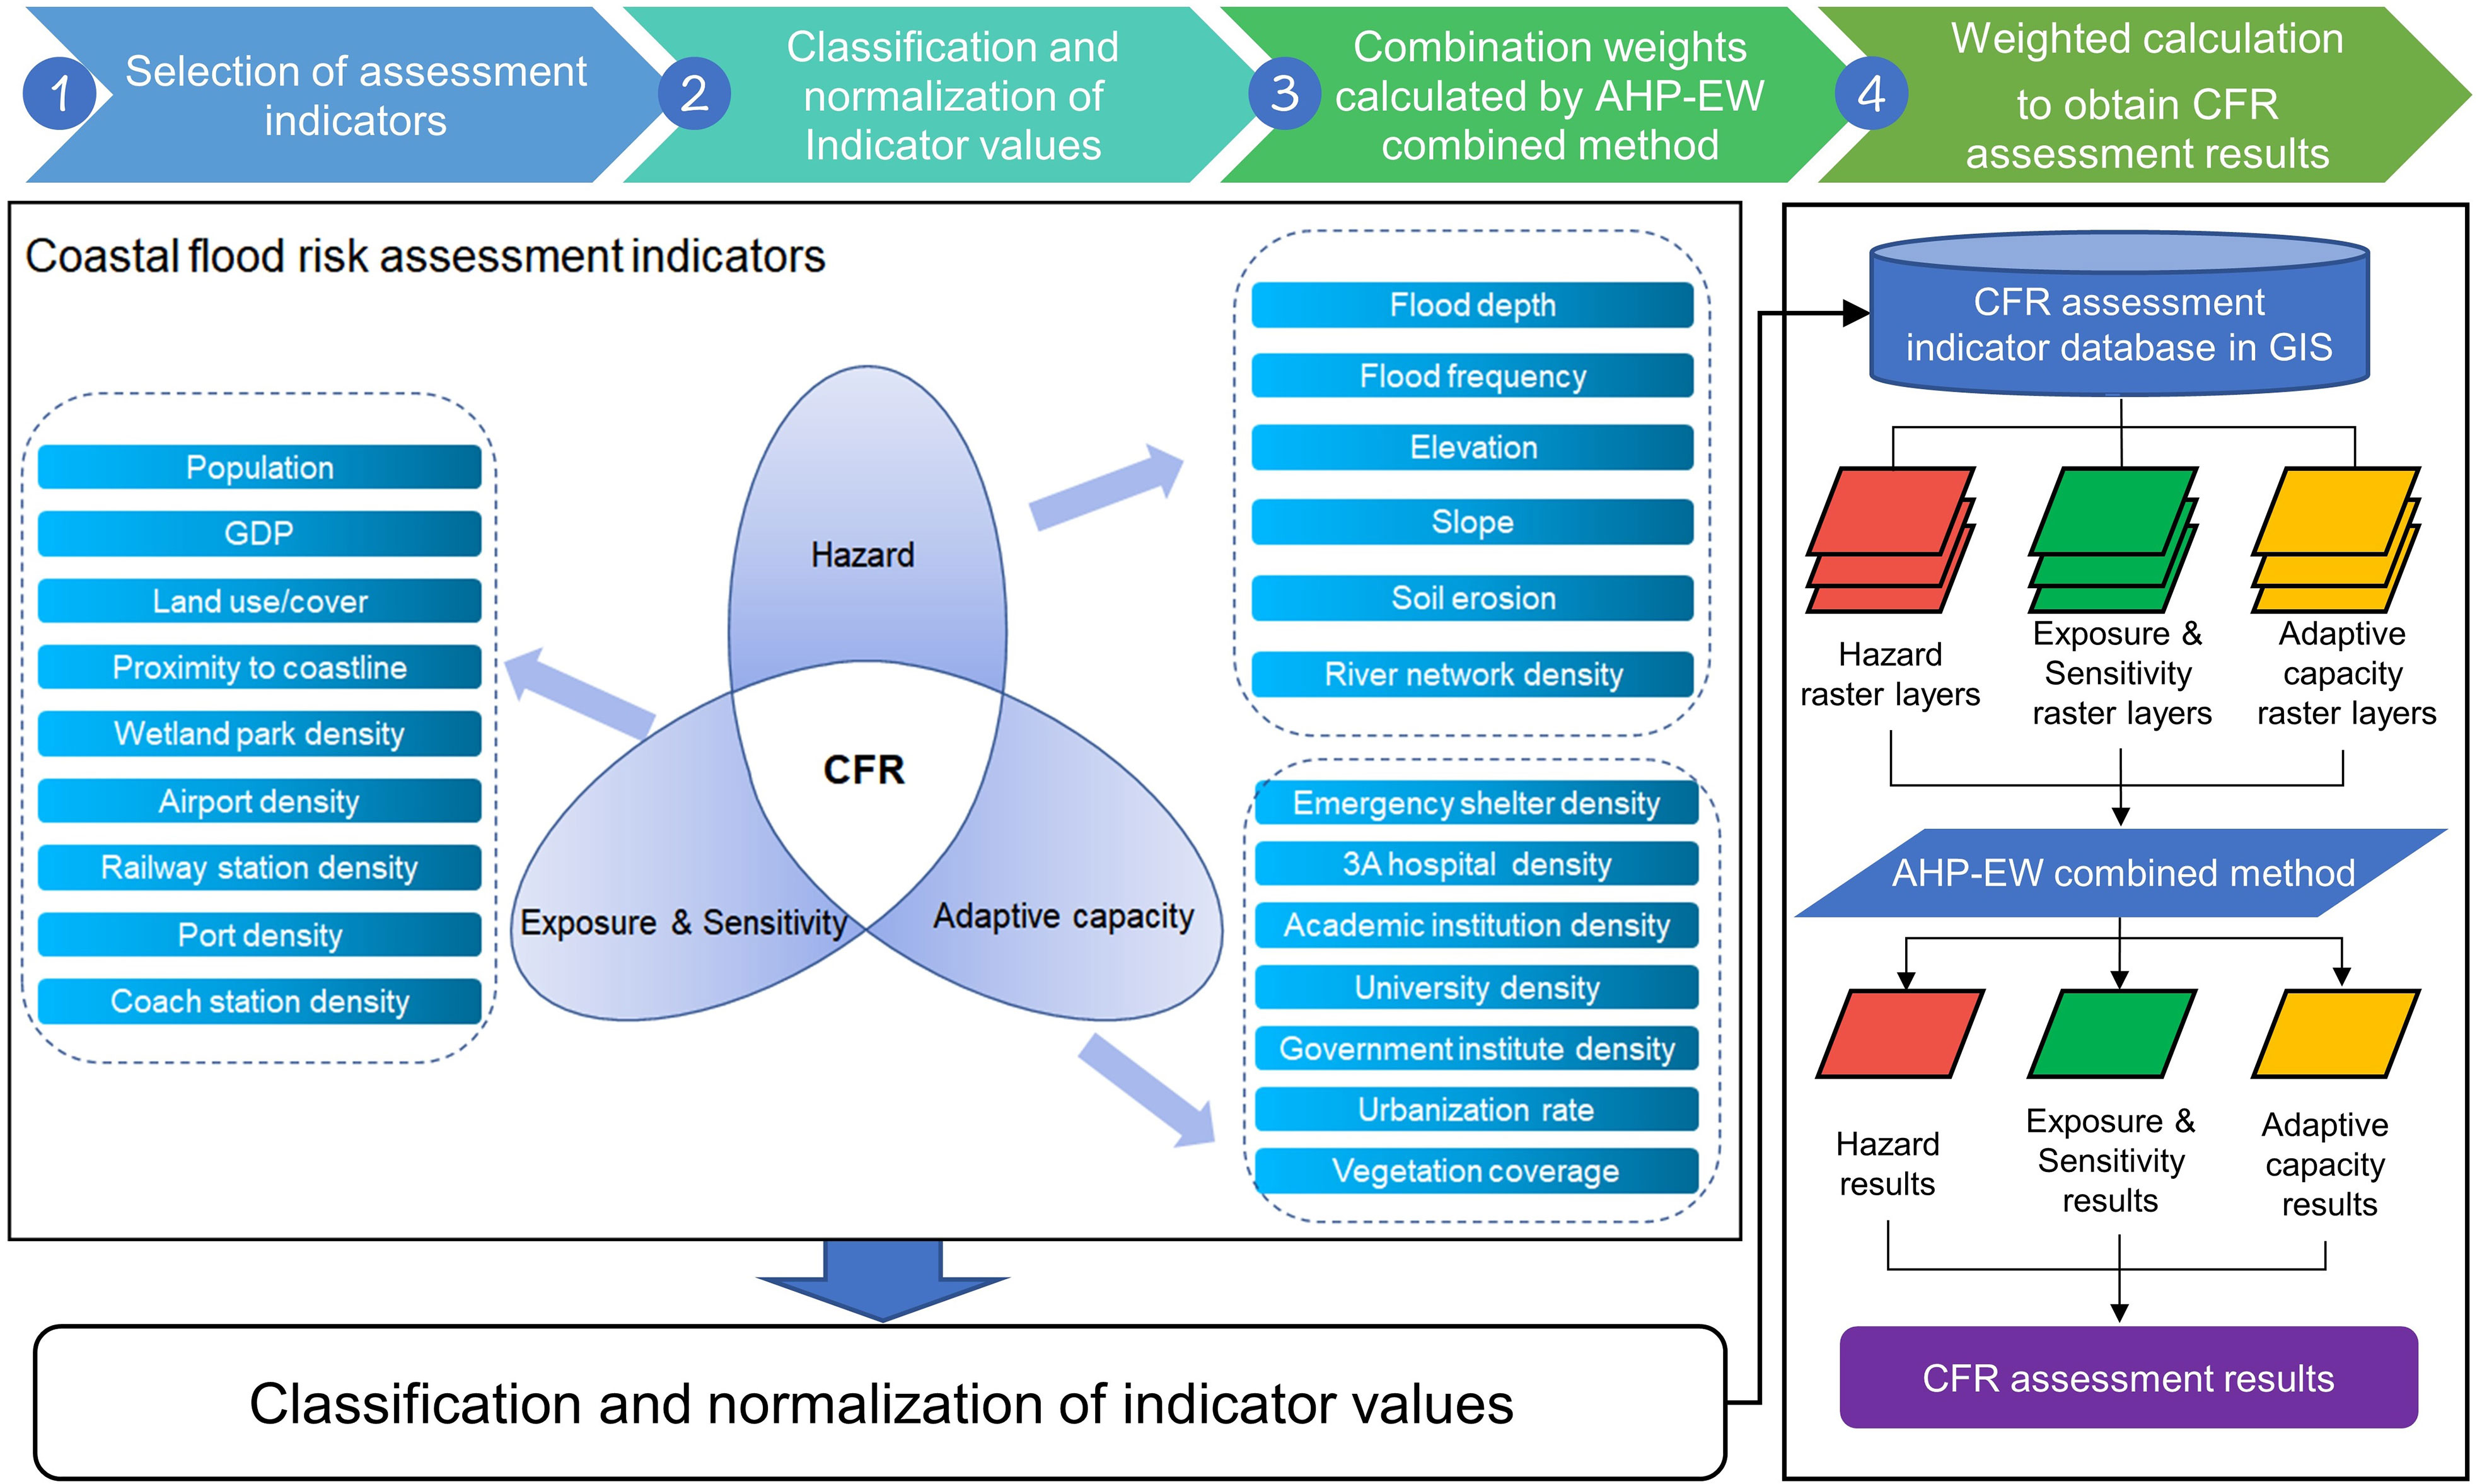
Figure 2 An assessment framework for coastal flood risk caused by SLR in the CCZ.
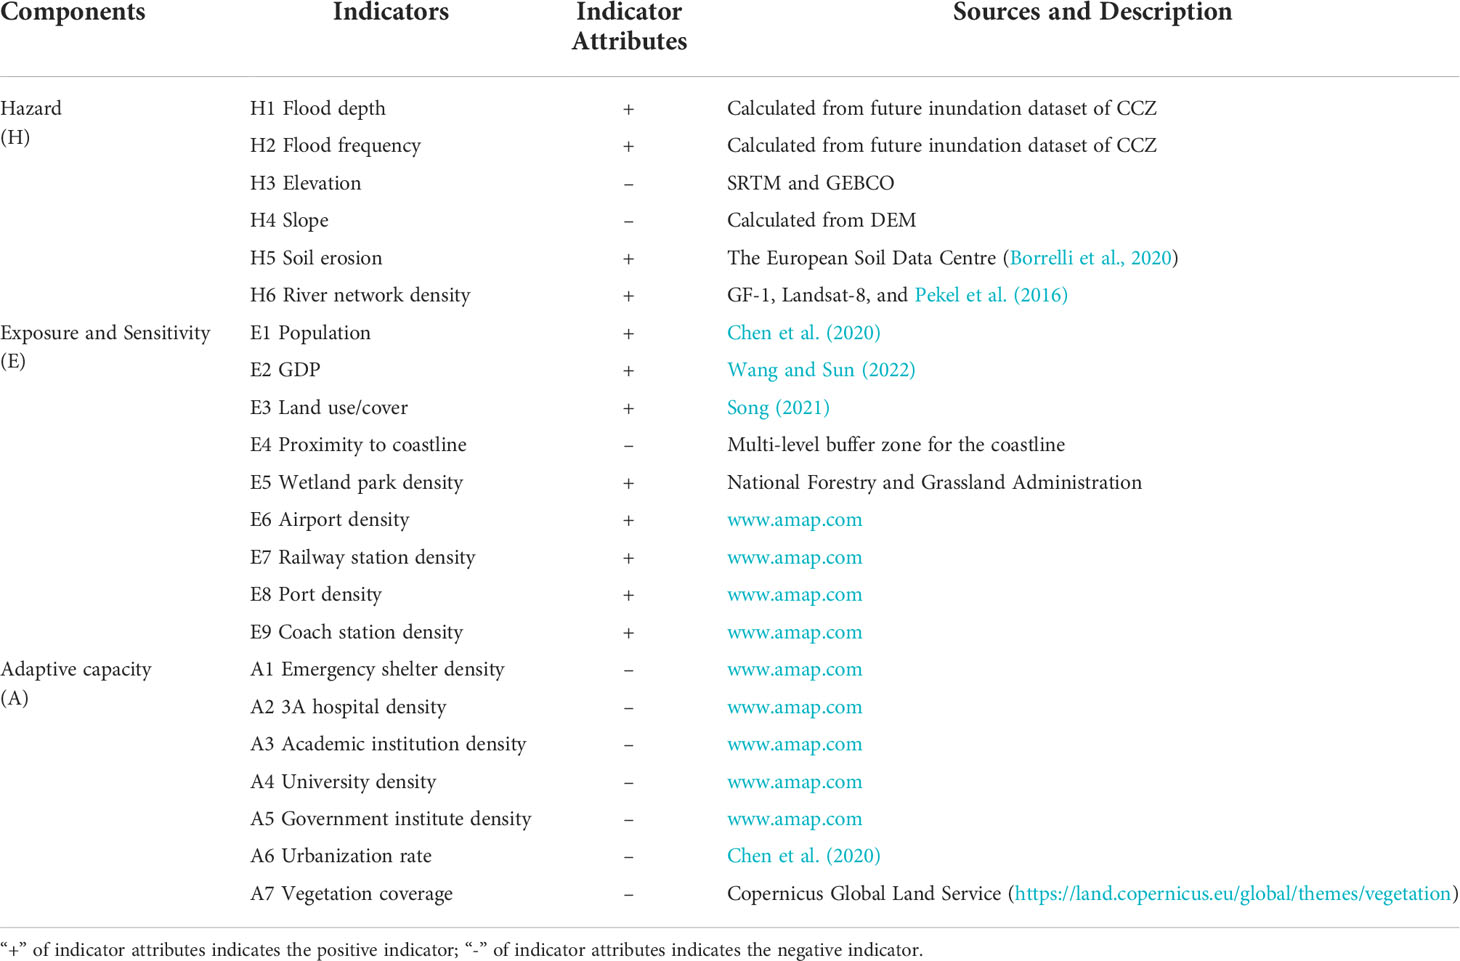
Table 1 Components and indicators used to determine hazard, exposure & sensitivity, and adaptive capacity to SLR in the CCZ.
Overall, within the risk assessment framework (Figure 2), the CFR assessment follows these steps: firstly, the CFR assessment indicators are selected based on their availability and attribute characteristics; secondly, the value of each indicator is reclassified and normalized to establish the spatial database based on a Geographic Information System (i.e., ArcGIS software); thirdly, the AHP-EW combined method is used for calculating the combined weight of each indicator layer; finally, the indicators are weighted and stacked for obtaining the values of the hazard, exposure & sensitivity, and adaptive capacity, respectively, and further weighted by 50%, 30%, and 20% for hazard, exposure & sensitivity, and adaptive capacity, respectively, to calculate the CFR values. These weight values were converted from the qualitative judgment of six experts (see chapter 2.2.4.2) based on their scientific knowledge, work experience, and understanding of the CFR assessment framework. In addition, in order to make the results easily comparable across scenarios and years, a combined manual and equal interval classification methods are employed to rank the final composite risk values after observing the distribution of CFR values (Yin et al., 2013). Based on the values of CFR, five ranked levels e.g., “Very low” (0-0.2), “Low” (0.2-0.3), “Medium” (0.3-0.4), “High” (0.4-0.5), and “Very high” (>0.5) are designated. Moreover, the CFR map is visualized using ArcGIS software to represent the spatial distribution of the five CFR levels.
2.2.2 Selection of scenarios
Scenarios describe the likelihood of future development changes and assumptions about important drivers and relationships, following the principles of coherence and internal consistency. Projecting future global and regional climate change requires the construction of a range of scenarios, such as greenhouse gas emissions and socioeconomics, which require quantitative or qualitative descriptions of various development possibilities (Rounsevell and Metzger, 2010).
In order to assess the change of CFR caused by SLR in the future, two kinds of future scenarios were considered: Representative Concentration Pathways (RCPs) and Shared Socioeconomic Pathways (SSPs). RCPs are consistent with a wide range of possible changes in future anthropogenic carbon emissions and aim to represent their radiative forcing. SSPs reflect the correlation between radiative forcing and socio-economic development and describe global development in the future. According to the recommended combination for climate and socio-economic scenarios (Engström et al., 2016; Deng et al., 2021), in this study, three combinations of future scenarios (named RCP2.6-SSP1, RCP4.5-SSP2, and RCP8.5-SSP5) are used. The RCP2.6-SSP1 scenario describes future scenarios under low mitigation pressure and low radiative forcing, also regarded as sustainability scenarios. The RCP4.5-SSP2 scenario describes future scenarios under moderate radiative forcing, referring to scenarios that maintain current socio-economic, scientific, and technological trends. The RCP8.5-SSP5 scenario describes future scenarios under high radiative forcing, referring to a high fossil fuel-based development pathway. In addition, according to Tebaldi et al. (2012) and Spirandelli et al. (2016) for the division of development stages in the future period, 2030, 2050, and 2100 are defined as near-term, mid-term, and long-term, respectively.
2.2.3 Selection of CFR indicators
Indicators are actually simple numbers and inherent features of a system that reflect reality and quantitatively estimate the state of a system (Balica et al., 2012; Chakraborty and Mukhopadhyay, 2019). In this study, the indicators selected represent the hazard, exposure & sensitivity, and adaptive capacity that define the CFR. And the following sections describe the reasons for the selection and treatment of each indicator.
2.2.3.1 Hazard sub-indicators
Six sub-indicators were utilized to describe the pattern of coastal flood hazards across the CCZ: (1) Flood depth; (2) Flood frequency; (3) Elevation; (4) Slope; (5) Soil erosion; and (6) River network density. In this paper, coastal flood inundation caused by SLR is the dominant risk source. And flood depth and flood frequency are important indicators to indicate the degree of inundation (Stephens et al., 2017; Dandapat and Panda, 2018). We used a high spatial resolution dataset of future inundation area in the CCZ under multi-scenarios for sub-indicators 1 and 2. This coastal flood inundation dataset was established by two detailed operation steps: firstly, simulating the local sea levels in China’s adjacent seas by the Finite Volume Coast and Ocean Model (FVCOM, a physical ocean model) in a super-computing platform based on the regional sea level data of the Integrated Climate Data Center (ICDC), the University of Hamburg, from 2021-2100 under RCP2.6, 4.5, and 8.5 scenarios (Church et al., 2013); secondly, calculating the flood inundation characteristics, such as flood area, flood frequency, and flood depth, by the improved hydraulic connectivity model. This dataset has the advantages of high spatial resolution (100 m), high temporal resolution (year-by-year from 2021 to 2100), and multiple scenario simulations (RCP2.6, 4.5, and 8.5). The flood depth was gained by subtracting the land elevation value from the simulated water level value in 2030, 2050, and 2100 under different scenarios, respectively. The flood frequency was calculated by counting the number of inundations per pixel in 2021-2030, 2041-2050, and 2091-2100 under different scenarios, respectively. Elevation and slope indicators (3 and 4) were derived based on DEM data (SRTM, https://earthexplorer.usgs.gov/; GEBCO, https://www.gebco.net/data_and_products/gridded_bathymetry_data/). Soil erosion (5) was collected from the European Soil Data Centre (Borrelli et al., 2020). Since this dataset only provides baseline data for 2015 and multi-scenario projection data for 2070, we used the soil erosion data in 2015 for the near and mid-term erosion conditions, and used the soil erosion data in 2070 for the long-term erosion condition. For sub-indicator 6, we captured the distribution of river networks in the CCZ using global water distribution data (Pekel et al., 2016), which were visually interpreted and supplemented by using medium- and high spatial resolution satellite images such as Landsat-8 and Gaofen-1. After converting the rasters to vectors and calculating the kernel density in ArcGIS software, we obtained the density distribution data of river networks in the CCZ.
2.2.3.2 Exposure and sensitivity sub-indicators
The exposure and sensitivity pattern of coastal flood across CCZ was represented by nine sub-indicators, such as (1) Population; (2) GDP; (3) LULC; (4) Proximity to coastline; (5) Wetland park density; (6) Airport density; (7) Railway station density; (8) Port density; and (9) Coach station density. Generally, areas with a large population and high GDP will cause a large number of casualties and property losses in the face of flood inundation. In this paper, the projection data of population obtained from Chen et al. (2020) estimates China’s provincial population from 2010 to 2100 under SSPs. And this data is allocated to spatially explicit population grids for each year at 30 arc-seconds spatial resolution based on RCP urban grids and historical population grids. The projection data of GDP obtained from Wang and Sun (2022) includes a set of comparable spatially explicit global gridded GDP for future projections from 2030 to 2100 at a ten-year interval for all five SSPs. In addition, different LULC types could cause different losses when faced with the coastal flood. For example, the economic loss of built-up land is greater than that of grassland when faced with the same level of coastal flood. Thus, we used the future LULC data which were simulated by the SD-FLUS model from 2021 to 2100 under RCP2.6-SSP1, RCP4.5-SSP2, and RCP8.5-SSP5 from Song (2021). The LULC data includes eight types, including farmland, inland freshwater, constructed wetland, forest, coastal wetland, grassland, shallow water, and unused. As the areas located nearer to the coastline are generally more frequently affected by coastal flooding than areas farther away, for sub-indicator 4, the distances from the coastline across the CCZ were calculated in ArcGIS. Moreover, the areas with the concentrated distribution of ecological protection, transportation, and other infrastructures are usually more affected by flooding, leading to the destruction of the original ecological environment, difficulties in the evacuation of people, and transportation of rescue supplies. Therefore, the location data of wetland parks, airports, railway stations, ports, and coach stations were downloaded from China’s leading digital map content, navigation, and location service solution provider (GaoDe, https://www.amap.com/). In addition, the density of these location data was calculated based on the kernel density tool in ArcGIS.
2.2.3.3 Adaptive capacity sub-indicators
The ability of a human system to cope with harsh occurrences was referred to as adaptive capacity. To describe the extent and spatial distribution of the adaptive capacity of the CCZ to cope with the CFR, seven sub-indicators were chosen, which are dimensions in the social or economic domain, such as: (1) Emergency shelter density; (2) 3A hospital density; (3) Academic institution density; (4) University density; (5) Government institute density; (6) Urbanization rate; and (7) Vegetation coverage. Among them, 3A hospital is the high-level hospital in China that can provide high-level medical and health care services to its region and the surrounding radiation area, as well as perform higher education and scientific research. Urbanization rate is the urbanization rate of the population, i.e., the proportion of the urban population to the total population. For sub-indicators 1 and 2, Emergency shelters and 3A hospitals can provide the shelter and treatment for humans in the event of a flood, respectively, in order to reduce mortality and improve adaptive capacity. In general, the more academic research institutions, universities, and government agencies in a region mean that the region has a stronger research power and organizational capacity, which will help prevent coastal flooding, post-disaster reconstruction planning, and improve regional disaster resilience. In this paper, the location data of emergency shelters, 3A hospitals, academic institutions, universities, and government institutions were downloaded from GaoDe, and the density of these location data were calculated by using the kernel density tool in ArcGIS. For sub sub-indicators 6, an area with high urbanization rate can reduce the social vulnerability and increase the adaptive capacity by improving health conditions and social welfare for all people, especially the poor and marginalized. Referring to the literature review by Nur and Shrestha (2017), the poor and marginalized are the most vulnerable groups since their entitlement to resources is low. The vulnerable do not only require structural measures to lessen flood excess but they demand an improved adaptive capacity to maintain their livelihood sustainability before and after flooding. In addition, an area with high vegetation coverage rate can effectively slow down the rate of flood inundation. Therefore, we used urbanization rate projection data from Chen et al. (2020) and vegetation coverage data from Copernicus Global Land Service (https://land.copernicus.eu/global/products/fcover) as the adaptive capacity sub-indicator 6 and 7, respectively.
2.2.4 Calculation of CFR assessment indicator weights
The reasonable setting of indicator weights has a significant impact on the assessment results. In this paper, the reasonableness and accuracy of indicator weights were improved by taking the subjective judgment of multiple experts as well as the information about indicator values into account, which was achieved by four steps: (1) Classification and normalization of each indicator; (2) Calculation of subjective weight for each indicator based on experts’ judgments by the Analytic Hierarchy Process method (AHP); (3) Calculation of objective weight for each indicator based on the indicator information by the Entropy Weight method (EW); and (4) Calculation of the combination weights by the AHP-EW combined method and the CFR values among years and scenarios.
2.2.4.1 Classification and normalization of each indicator
The 22 indicators were classified into positive and negative indicators based on their association with CFR (Table 1). Positive indicators are positively correlated with the value of CFR, and negative indicators are negatively correlated with the value of CFR. Moreover, referring to previous studies and expert judgments (Lopes et al., 2017; Nguyen et al., 2019), each indicator was classified into five ranks, such as “Very low”, “Low”, “Medium”, “High”, and “Very high”, using the qualitative classification method or the Jenks natural break technique in ArcGIS (Table S1) and these ranked levels were labeled by the numbers 1, 2, 3, 4, and 5, respectively. Then, in order to normalize all indicators within the range of 0-1, the linear scale transformation for positive indicators in Equation (2) and for negative indicators in Equation (3) were used.
where N+ is the normalized value of the positive indicator, N- is the normalized value of the negative indicator. Pvalue is the value of the pixel. In addition, min and max are denoted the minimum or maximum value of each indicator, respectively.
2.2.4.2 Subjective weights calculated by AHP
The Analytic Hierarchy Process (AHP) is used for scientific decision-making on complex problems and is now widely used in decision-making and evaluation work in various fields (Saaty, 1988). The AHP is a subjective empowerment method and can be used to determine the weights of evaluation indicators based on expert experience and knowledge. In this paper, six experts from the fields of climate change response, ecological protection, and remote sensing monitoring of coastal zone with extensive experience in risk assessment made qualitative judgments on 22 CFR indicators and constructed a two-by-two comparison matrix for the indicators using a 9-point scale developed by Saaty (2008) (Table S2). Moreover, a standard AHP linear scale was then applied to integrate individuals’ judgments and the weight of each indicator (WAHP) was calculated (Table S3). Finally, a consistency ratio (CR) was computed to justify the evaluation of experts in the pairwise comparison matrix. The consistency will be acceptable if the CR value is <0.1. CR was calculated by using Equation (4) (Table S3):
where RI represents the random index, and CI represents the consistency index as calculated:
where λmax refers to the largest eigenvalue of the matrix and n represents the order of the matrix.
2.2.4.3 Objective weights calculated by EW
The Entropy Weight method (EW) is an objective evaluation method for the indicator weight based on the principle of information entropy (Shannon, 1948). If the information entropy of an assessment indicator is smaller, it will indicate that the greater the amount of information provided by the indicator, the greater the role played in the comprehensive evaluation of the system, the greater the weight value should be assigned. In this paper, it is assumed that there are m pixels in the CCZ to calculate the EW, and each pixel is designed with n indicators, and Xij represents the j-th assessment value of the i-th pixel (i=1,2,3…m, j=1,2,3…n). The Equation (2) or Equation (3) was used to normalize Xij to gain Nij. The feature weight (Qij) of the i-th pixel under the j-th indicator was calculated by using Equation (6). The entropy value (ej) was calculated by using Equation (7). The variability coefficient (gj) was calculated by using Equation (8). Equation (9) was used to calculate the weight of each assessment indicator (WEW) (Table S4).
2.2.4.4 Combination weights calculated by AHP-EW combined method
In order to reflect both the expert’s subjective judgment about CFR and the information entropy characteristics of the objective data, the linear combination method was used to derive the combination weights (Wz) for CFR assessment after using the AHP method to derive the subjective weights (WAHP) and the EW method to derive the objective weights (WEW). The calculation formula is as follows:
where Wz represents the linear combination weights of AHP and EW, α and β represent their weight coefficients, respectively, and α + β =1.
The distance function was used to match the degree of difference between the WAHP and WEW weight values with the degree of difference between their corresponding distribution coefficients α and β. This helped to remove data disturbances with large fluctuations and improve the accuracy of the composite weights. The calculation formula is as follows:
where d (WAHP,WEW) represents the distance between WAHP and WEW, D represents the difference between the distribution coefficients.
Based on the definitions of Equation (10-12), the system of equations was constructed as Equation (13). The α and β of the distribution coefficients for each weight were derived by solving Equation (13) (Liu et al., 2020), and the distribution coefficients were brought into Equation (10) to estimate the combination weights (Wz) (Table S5).
3 Results
3.1 Temporal and spatial characteristics of CFR
3.1.1 Spatial characteristics of CFR at key time nodes
Figure 3 shows the spatial distribution of CFR in 2030, 2050, and 2100 under RCP2.6-SSP1, RCP4.5-SSP2, and RCP8.5-SSP5, respectively. Overall, the spatial patterns of CFR in the CCZ are similar among scenarios and years. The regions with “High” level are mainly distributed around the regions with “Very high” level. And they are mainly distributed in the southern coastal area of Liaoning, the coastal area from eastern Hebei to northwestern Shandong, the Jiaozhou Bay area in southeastern Shandong, the northern to central Jiangsu, the Yangtze River Delta (southern Jiangsu, Shanghai, and northern Zhejiang), and the Pearl River Delta (southeast Guangdong), which are low-lying coastal areas with densely populated, economically developed, or industrially diverse. By contrast, the CFR level in inland mountainous or hilly areas with higher elevations is “Very low”, such as the northeastern part of the coastal zone in Liaoning, the western part of the coastal zone in Zhejiang and Fujian, and the southern part of Hainan. Moreover, the regions with “Low” CFR level are primarily concentrated in the coastal areas of Hebei and Tianjin, the eastern part of the coastal area in Shandong and Zhejiang, the central part of the Guangxi coastal zone, and the northeastern part of Hainan. In addition, the regions with “Medium” CFR level are mainly distributed in the central part of the Liaoning coastal area, the northwestern part of Shandong, the southwestern part of the Jiangsu coastal area, and the central part of the Zhejiang coastal zone.
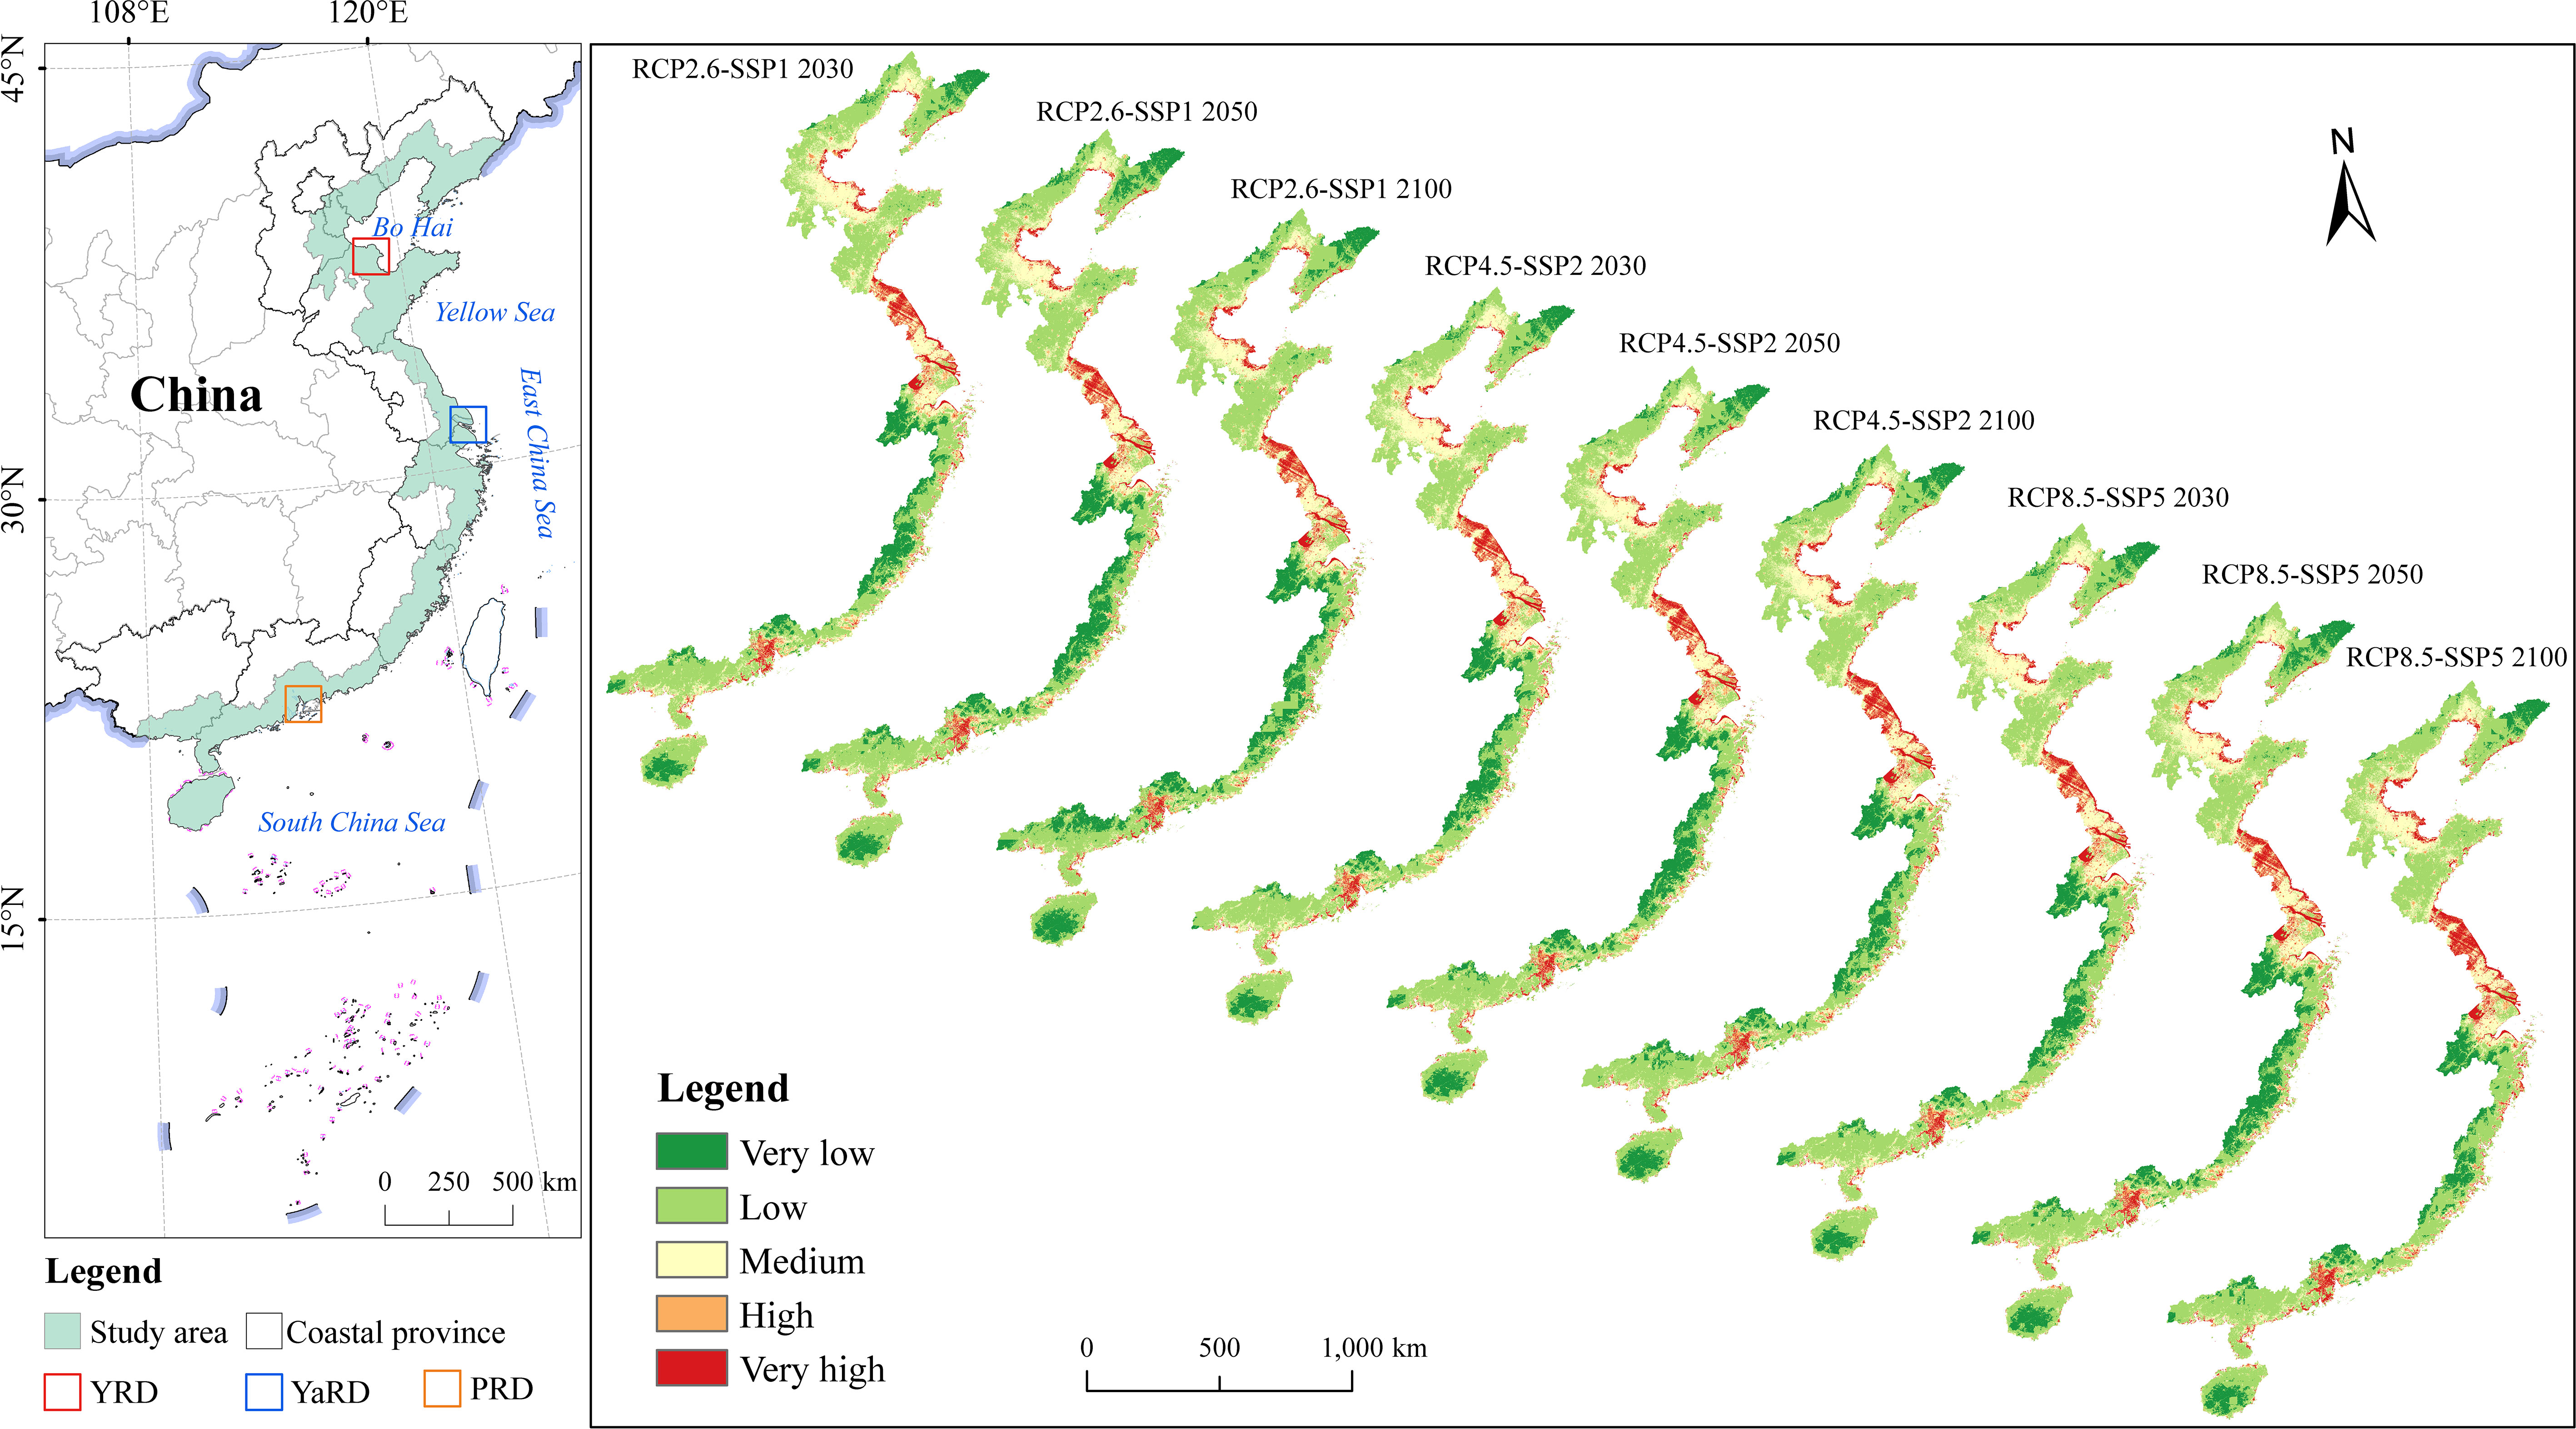
Figure 3 Spatiotemporal distribution of the CFR in 2030, 2050, and 2100 under RCP2.6-SSP1, RCP4.5-SSP2, and RCP8.5-SSP5, respectively. YRD, YaRD, and PRD represent the Yellow River Delta, Yangtze River Delta, and Pearl River Delta, respectively.
3.1.2 Area changes of CFR under different scenarios
Figure 4 shows the variation of area and area change rate for the five CFR levels among scenarios and years. In contrast to the spatial distribution, the temporal change in CFR was clearly different among scenarios and years. For example, from near-term to long-term, under RCP2.6-SSP1, the area of the “Very Low” level is dramatically increased, from 74.86×10³ km2 in 2030 to 100.68×10³ km2 in 2100, with an area change rate of 34.50%; At the same period, the area of “Medium” level is gradually decreased, from 128.51×10³ km2 in 2030 to 97.33×10³ km2 in 2100, with an area change rate of -24.27%; The areas of “Low” and “Very high” levels are slightly increased, whereas the area of “High” level is slightly decreased. Under RCP4.5-SSP2, the areas of “Very low” and “Very high” are significantly increased, from 72.21×10³ km2 and 35.59×10³ km2 in 2030 to 82.75×10³ km2 and 40.17×10³ km2 in 2100, respectively. The area of “Medium” level is significantly decreased, from 131.00×10³ km2 in 2030 to 111.21×10³ km2 in 2100, with the area change rate of -15.10%; The areas of the “Low” and “High” levels are slightly increased and decreased, respectively. Under RCP8.5-SSP5, the area of “Very High” level is sharply increased, from 35.82×10³ km2 in 2030 to 44.10×10³ km2 in 2100, with the area change rate of 23.13%; Except for the small increase in the area of the “Low” level, the areas of the “Very low”, “Medium”, and “High” level are all markedly decreased. By comparing the three scenarios, it is found that although the area of the five CFR levels in 2030 is similar to the three scenarios, the area of “Very high” level under RCP8.5-SSP5 increases the most during 2030-2100, followed by RCP4.5-SSP2 and RCP2.6-SSP1.
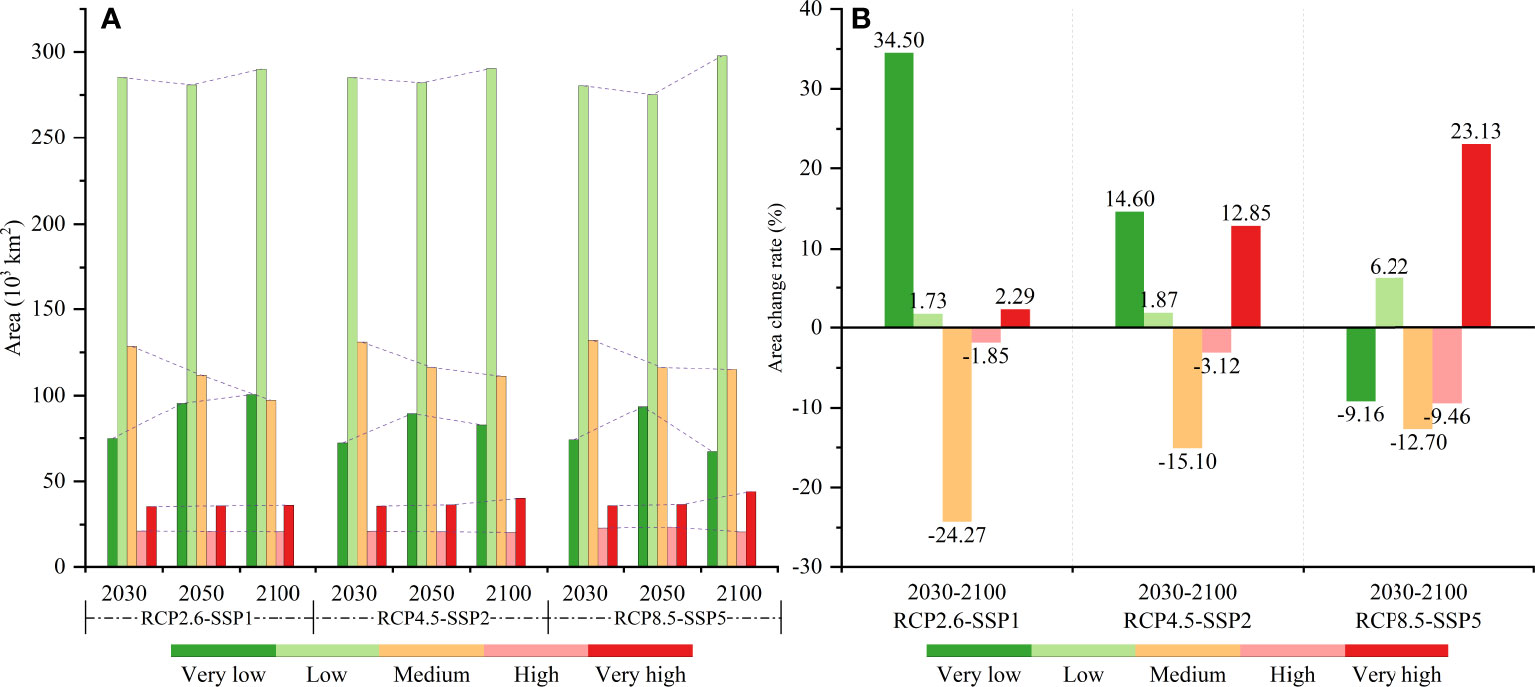
Figure 4 Area and area change rate of the five CFR levels among scenarios and years. (A) Is the area of the five CFR levels in 2030, 2050, and 2100 under RCP2.6-SSP1, RCP4.5-SSP2, and RCP8.5-SSP5, respectively. (B) Is the area change rate of the five CFR levels from 2030 to 2100 among scenarios.
3.2 Characteristics of CFR at provincial level
3.2.1 Area proportion change of CFR in different provinces
As shown in Figure 5, the area proportions of five CFR levels in 11 coastal provinces are different among scenarios and years. In general, if the area proportions of the higher CFR levels in a certain province are significantly bigger than in other provinces, the province will be faced with the more obvious threat of coastal flooding. For example, among different scenarios and years, Jiangsu, Shanghai, and Guangdong have higher area proportions of “High” and “Very high” levels than other coastal provinces. Especially in Jiangsu, the total area proportion of the two levels reaches a peak of 54.01% in 2100 under RCP8.5-SSP5. In addition, Fujian, Zhejiang, and Hainan have higher area proportions of “Very low” level. Especially in Fujian, the area proportion of “Very low” level reaches a high point of 49.00% in 2050 under RCP2.6-SSP1.
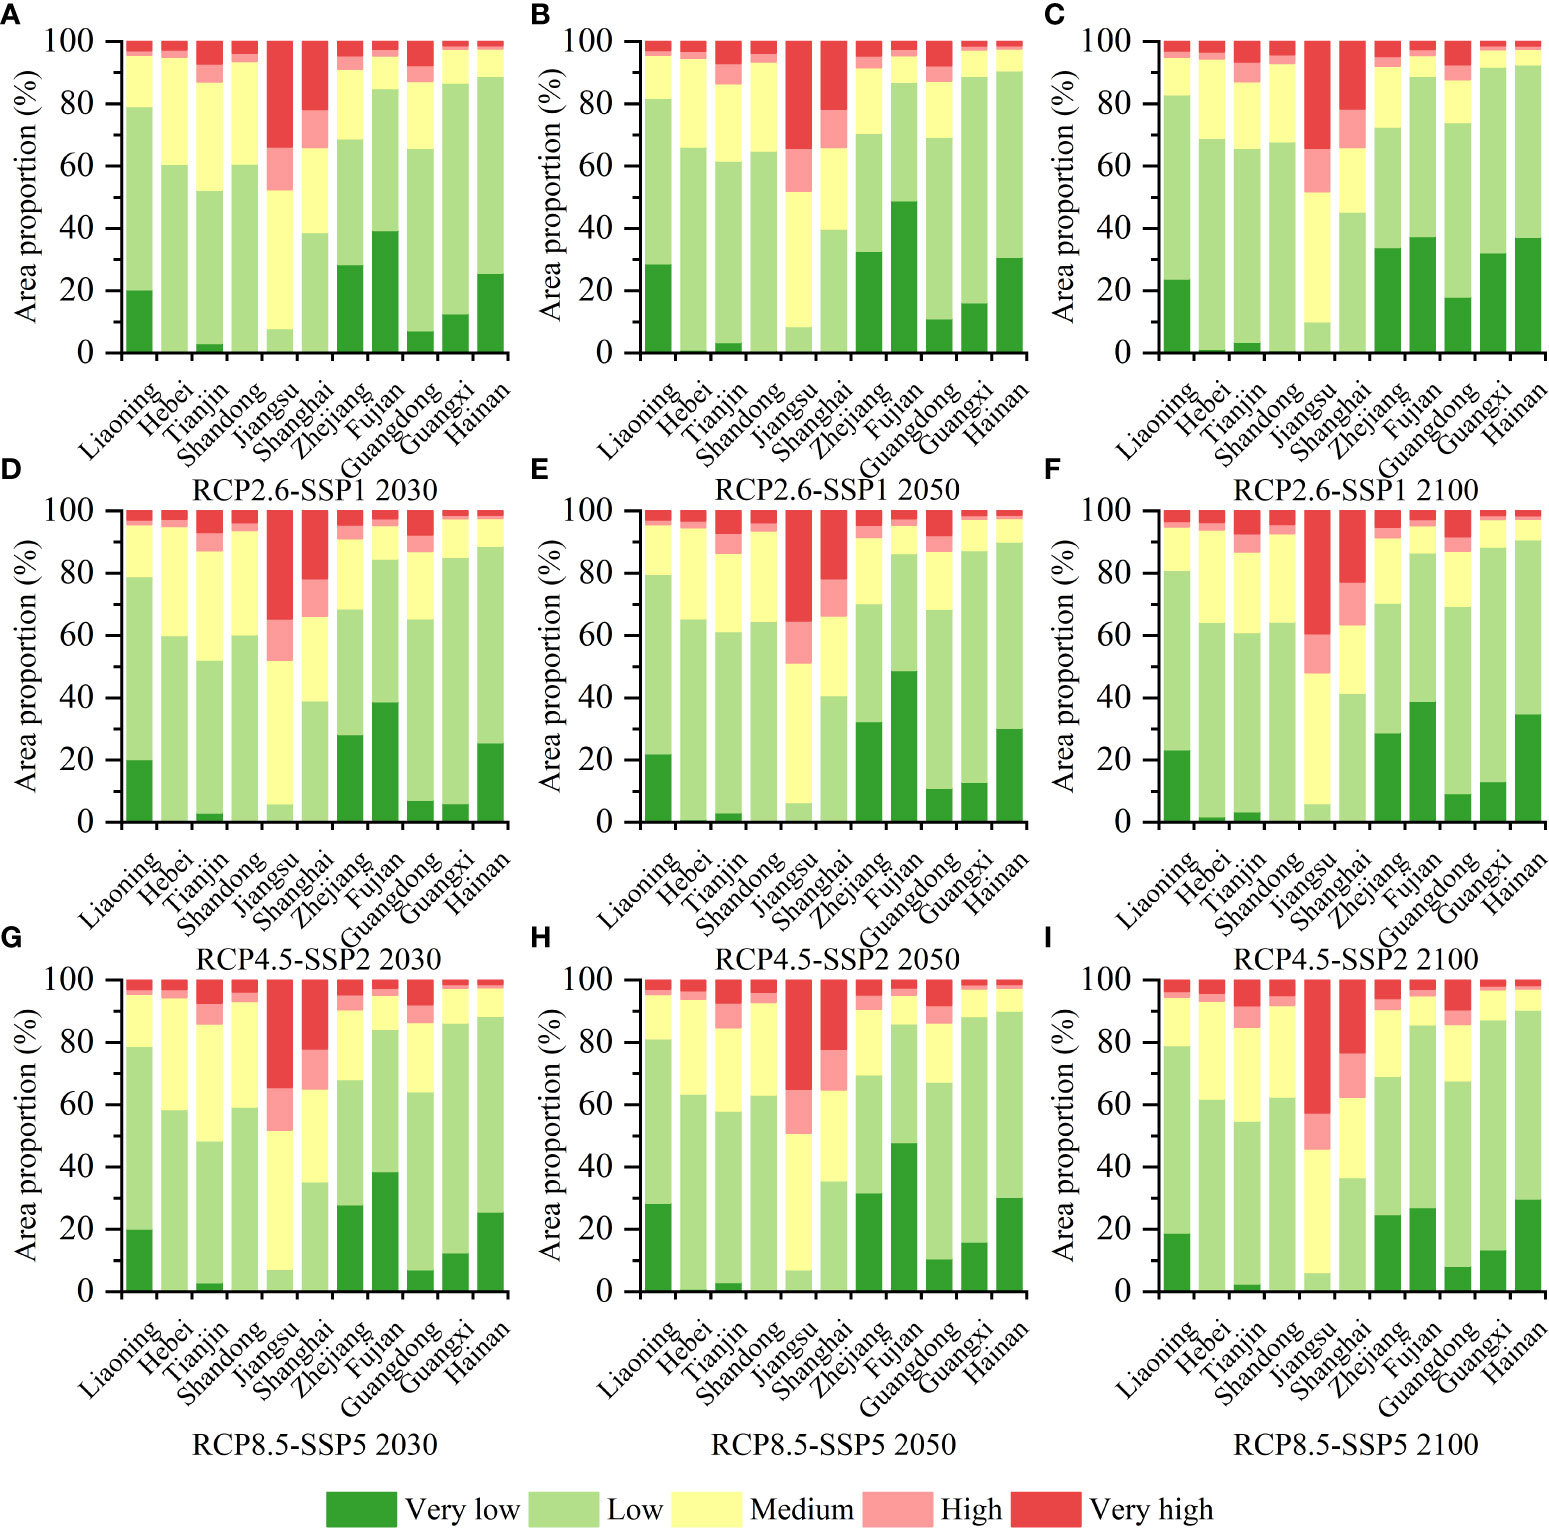
Figure 5 Area proportions of five CFR levels in 11 coastal provinces in 2030, 2050, and 2100 under RCP2.6-SSP1, RCP4.5-SSP2, and RCP8.5-SSP5, respectively. (A–I) Represent the area proportion of five CFR levels for the 11 provinces from 2030 to 2100 under RCP2.6-SSP1, RCP4.5-SSP2, and RCP8.5-SSP5, respectively.
Further analysis of the data reveals that the area proportion change of each CFR level in the same province varies markedly among scenarios and years. If a certain province is under a high emissions scenario, the area proportion of each CFR level in that certain province will be changed sharply, otherwise, it will be changed slightly. For example, under RCP2.6-SSP1, the area proportion of “Very high” level in Jiangsu is increased from 33.78% in 2030 to 34.12% in 2100, with an increase of 0.34; Under RCP4.5-SSP2, the area proportion of “Very high” level is increased from 34.58% in 2030 to 39.32% in 2100, with an increase of 4.75; Whereas the area proportion of “Very high” level is increased from 34.28% in 2030 to 42.48% in 2100, with an increase of 8.20 under RCP8.5-SSP5. Although, under RCP2.6-SSP1, the area proportions of “Very high” level in Guangdong, Guangxi, Shanghai, and Tianjin are slightly decreased by 0.24, 0.04, 0.14, and 0.54, respectively, under the other two scenarios, the area proportions of all provinces are increased.
3.2.2 Area changes of typical CFR in different provinces
In the assessment of CFR, the risk levels of “High” and “Very high” are needed for special attention (called the typical CFR levels). Due to the large differences in the area between the coastal provinces, the area proportion does not reflect the magnitude and variation of area for the typical CFR level in each province. To assess the area size and change of the typical CFR level, the areas of “High” and “Very high” levels in 11 coastal provinces among scenarios and years are calculated, as shown in Figure 6. As can be seen from the figure, there are significant interprovincial differences in the area of “High” and “Very high” levels. Overall, among different scenarios and years, Jiangsu, Guangdong, Shandong, and Zhejiang have larger areas of “High” and “Very high”, with Jiangsu ranking first among the 11 provinces, whereas Guangxi and Hainan have the smallest areas.
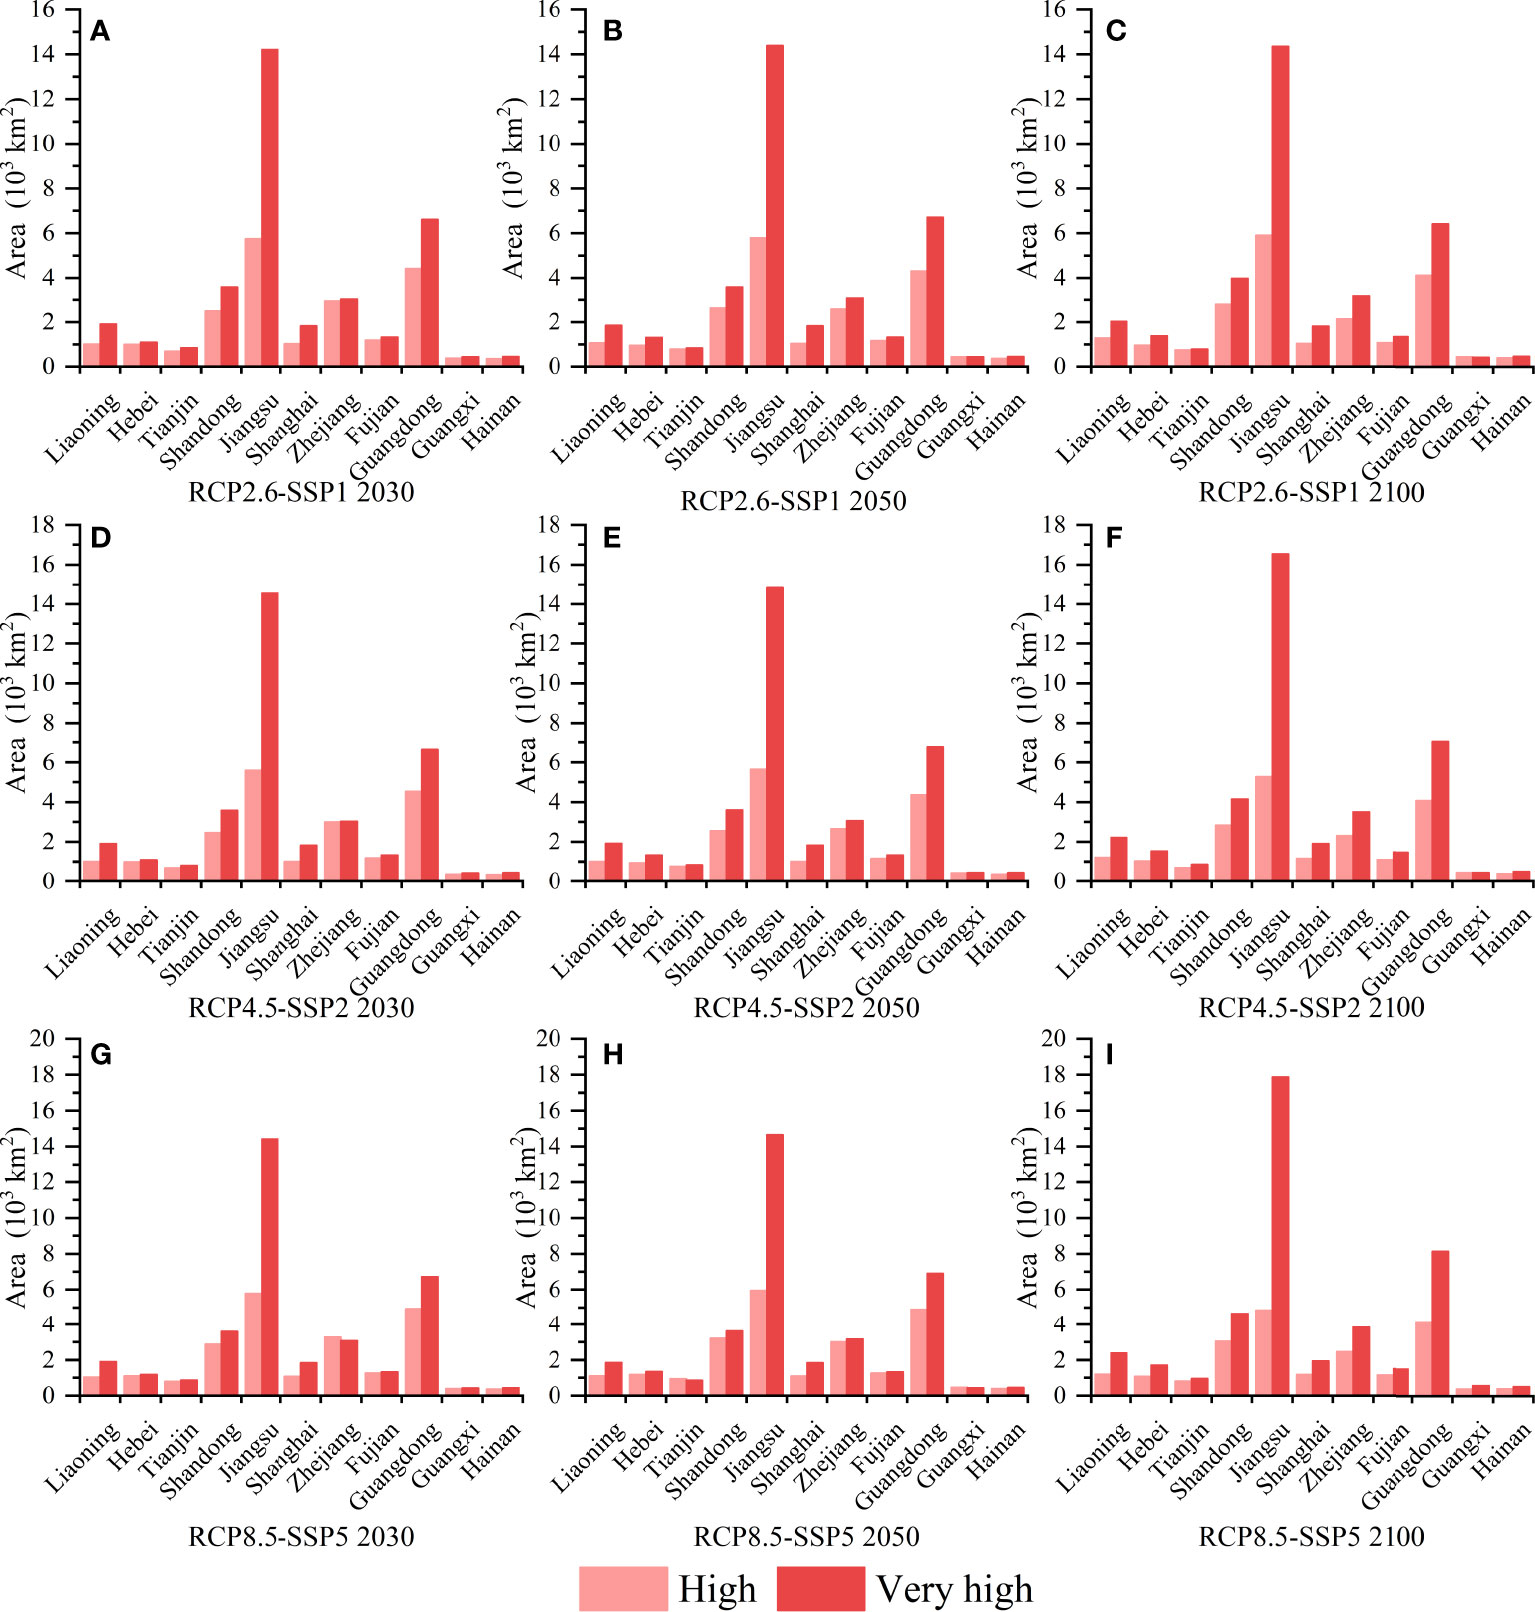
Figure 6 Area of typical CFR levels in 11 coastal provinces in 2030, 2050, and 2100 under RCP2.6-SSP1, RCP4.5-SSP2, and RCP8.5-SSP5, respectively. (A–I) Represent the area of typical CFR levels for the 11 provinces from 2030 to 2100 under RCP2.6-SSP1, RCP4.5-SSP2, and RCP8.5-SSP5, respectively.
Similar to the variation pattern of the area proportion of the typical CFR level, under the higher emission scenario, the area change of the typical CFR is more dramatic for the coastal provinces. For example, in Jiangsu, under RCP2.6-SSP1, the total area of typical CFR levels is increased from 19.96×10³ km2 in 2030 to 20.25×10³ km2 in 2100, with an area change rate of 1.47%; Under RCP4.5-SSP2, the total area is increased from 20.14×10³ km2 in 2030 to 21.80×10³ km2 in 2100, with an area change rate of 8.26%; And under RCP8.5-SSP5, the total area is increased from 20.20×10³ km2 in 2030 to 22.71×10³ km2 in 2100, with an area change rate of 12.47%. In addition, although the area proportion of typical CFR levels in Shanghai is significantly high in Figure 5, the area of typical CFR levels in Shanghai is obviously low. By contrast, the area proportion of typical CFR levels in Guangdong is low in Figure 5. The area of typical CFR levels in Guangdong is high in Figure 6.
3.3 Expected socio-economic damage in typical CFR areas
3.3.1 Expected population and GDP affected in typical CFR areas
In the typical CFR areas, there are significant differences in the expected population and GDP affected among scenarios and years, as shown in Figure 7A. Under the three scenarios, the numbers of the expected population affected rise to a high point and peak in 2050, with a maximum of 202.82 million (RCP2.6-SSP1), 195.91 million (RCP4.5-SSP2), and 199.74 million (RCP8.5-SSP5), respectively, and then fell to a low point in 2100, with 119.71 million (RCP2.6-SSP1), 136.72 million (RCP4.5-SSP2), and 120.81 million (RCP8.5-SSP5), respectively. As for the expected GDP affected, under RCP2.6-SSP1, the number of expected GDP affected peaks at 15.97 trillion USD in 2050 and then fell to 12.62 trillion USD in 2100. However, under RCP4.5-SSP2 and RCP8.5-SSP5, the numbers of expected GDP affected reach a peak in 2100 at 13.37 trillion USD and 22.31 trillion USD, respectively.
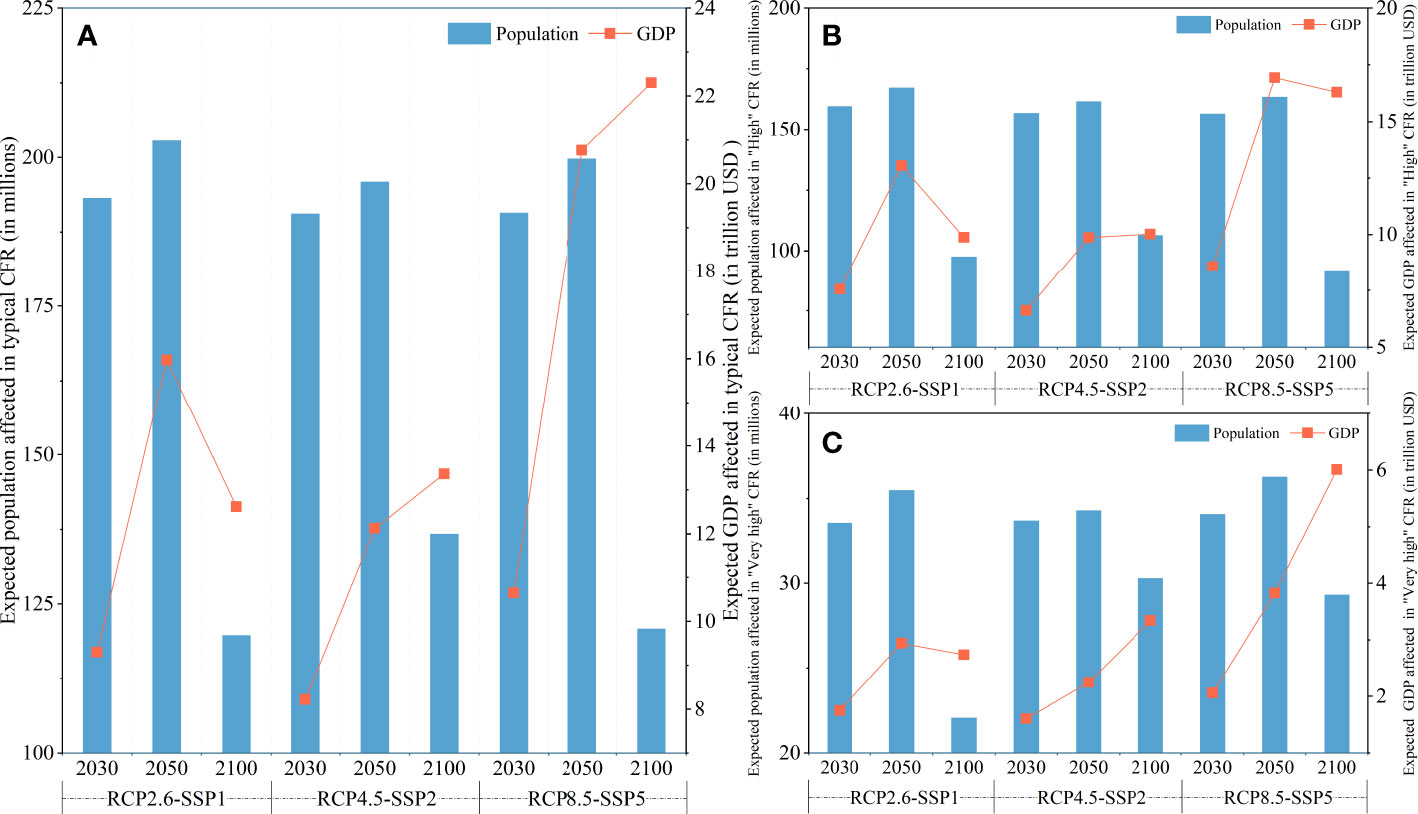
Figure 7 Number of expected population and GDP affected in typical CFR areas in 2030, 2050, and 2100 under RCP2.6-SSP1, RCP4.5-SSP2, and RCP8.5-SSP5, respectively. (A) is the total number of the expected population and GDP affected in the typical CFR areas, (B) is the number of the expected population and GDP affected in the “High” CFR area, and (C) is the number of the expected population and GDP affected in the “Very high” CFR area.
In addition, the differences in the expected population and GDP affected between the “High” and “Very high” CFR areas are significant, as shown in Figures 7B, C. Although the area of “Very high” level is larger than the “High” level under the three scenarios as shown in Figure 6, the numbers of the expected population and GDP affected in the “High” CFR area are much higher than those in the “Very high” CFR area (Figures 7B, C). For example, in the “High” CFR area, the numbers of the expected population and GDP affected in 2100 under the three scenarios are 97.64 million (9.88 trillion USD), 106.43 million (10.03 trillion USD), and 91.49 million (16.30 trillion USD), respectively. Whereas in the “Very high” CFR area, the numbers of the expected population and GDP affected in 2100 under the three scenarios are 22.07 million (2.74 trillion USD), 30.29 million (3.34 trillion USD), and 29.32 million (6.01 trillion USD), respectively. Moreover, the numbers of the expected GDP affected in the “High” CFR area under the three scenarios basically reach their peaks in 2050. By contrast, the expected GDP affected in the “Very high” CFR area under RCP4.5-SSP2 and RCP8.5-SSP5 reach their peaks in 2100.
Figure 8 shows the expected population and GDP affected in the typical CFR areas of the 11 coastal provinces among scenarios and years. In general, Guangdong’s GDP and population are expected to be the most affected in the coastal provinces, with an affected GDP of 7914.96 billion USD (RCP8.5-SSP5 2100) and an affected population of 68.30 million (RCP2.6-SSP1 2050), followed by Zhejiang. Moreover, Guangxi and Hainan have the lowest expected effects on population and GDP in the coastal provinces among scenarios and years.
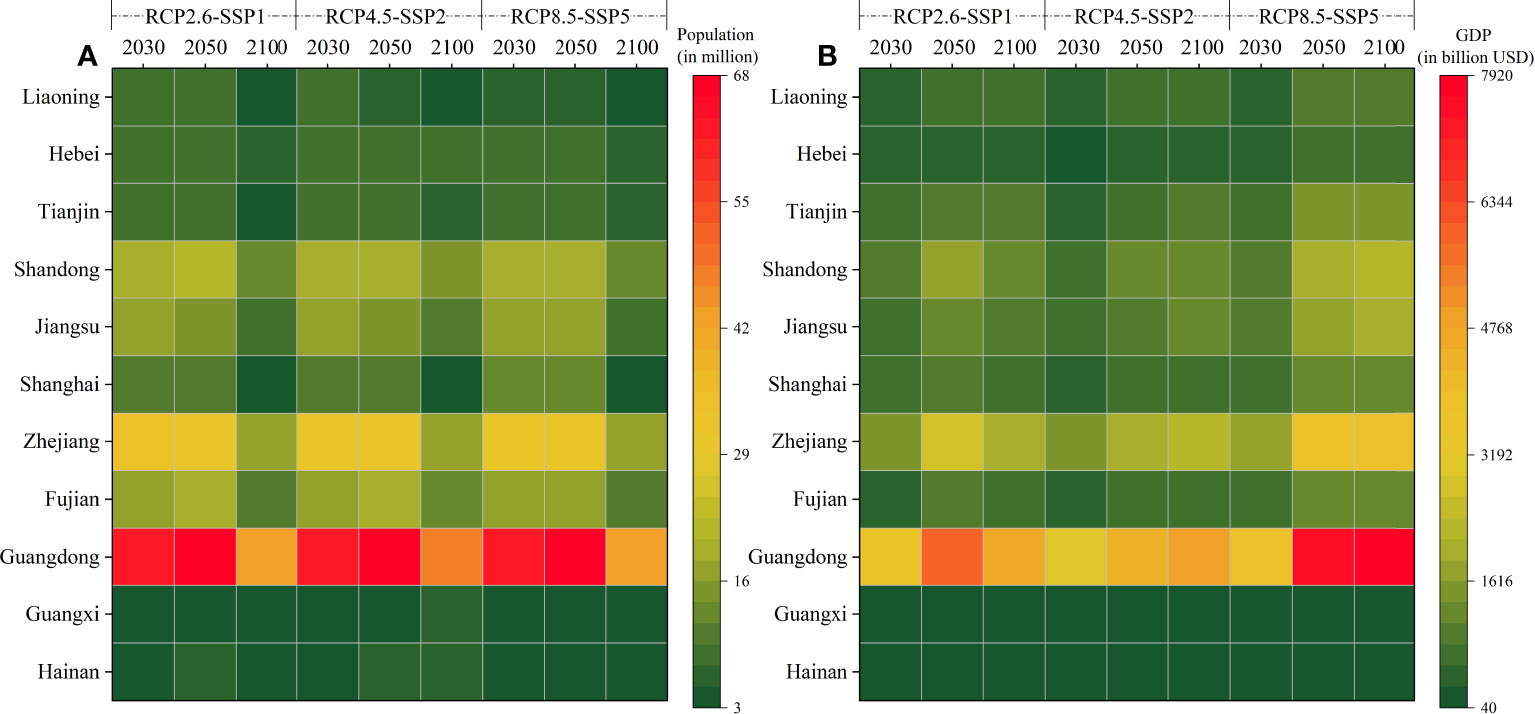
Figure 8 Number of expected population and GDP affected in typical CFR areas of the 11 coastal provinces in 2030, 2050, and 2100 under RCP2.6-SSP1, RCP4.5-SSP2, and RCP8.5-SSP5, respectively. (A) Is the number of the expected population affected in the typical CFR areas of 11 coastal provinces. (B) Is the number of the expected GDP affected in the typical CFR areas of 11 coastal provinces.
3.3.2 Expected LULC losses in typical CFR areas
Further analysis of the expected LULC losses in the area of “High” and “Very high” CFR areas is shown in Figures 9A, B. As can be seen from the figures, in the “High” CFR area, the types of expected LULC losses are similar among scenarios and years. The LULC with the highest area proportion is built-up, whose area proportions exceeded 40% among all scenarios and years, followed by the farmland (which exceeded 30%). By contrast, in the “Very high” CFR area, the types of expected LULC losses are significantly different among scenarios and years. For example, under RCP2.6-SSP1, the constructed wetland, built-up, and coastal wetland become the third major loss type in 2030, 2050, and 2100, respectively; Under RCP4.5-SSP2, built-up overtakes constructed wetland as the third major loss type in 2050. Under RCP8.5-SSP5, built-up overtakes inland freshwater as the second major loss type, and inland freshwater as the third major loss type after 2050. In addition, the area proportions of farmland are the highest and exceeded 30% among scenarios and years, followed by the inland freshwater or built-up.
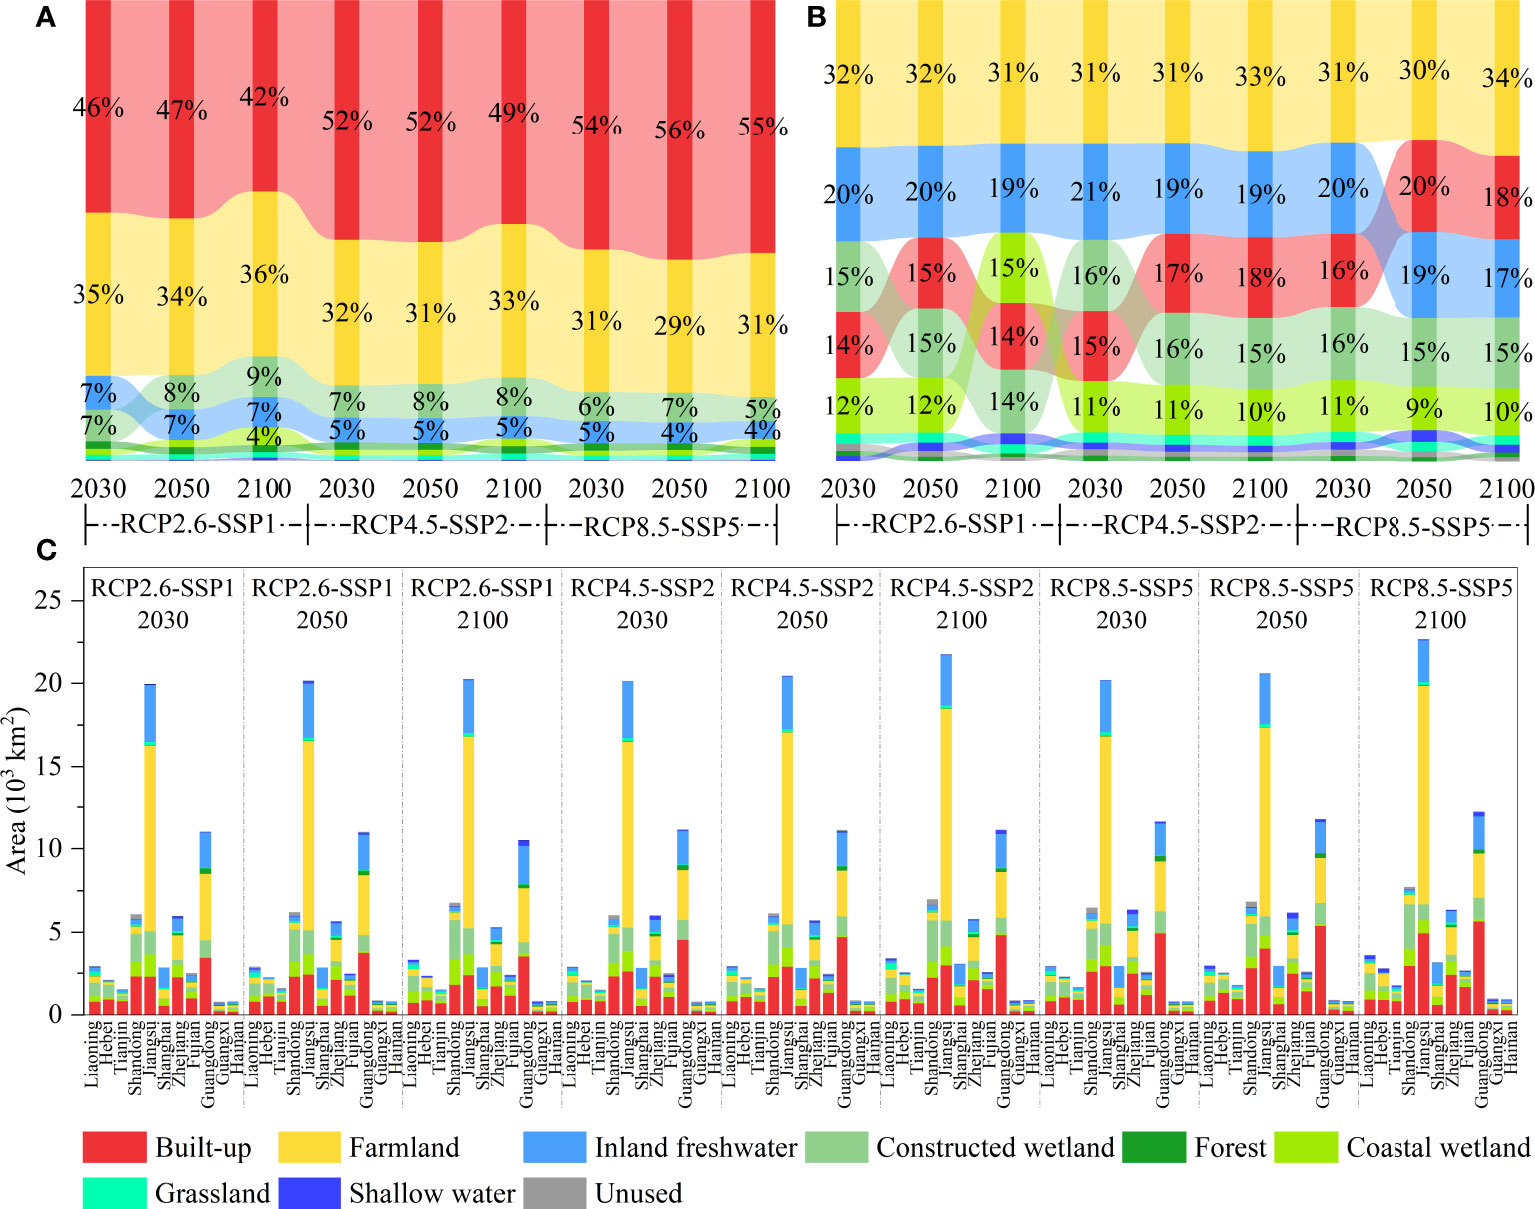
Figure 9 Area proportion and area of expected LULC losses in the typical CFR areas in 2030, 2050, and 2100 under RCP2.6-SSP1, RCP4.5-SSP2, and RCP8.5-SSP5, respectively. (A) Is the area proportion of expected LULC losses in the “High” CFR area. (B) Is the area proportion of expected LULC losses in the “Very high” CFR area. (C) Is the area of expected LULC losses in the typical CFR areas of 11 coastal provinces.
Figure 9C shows the area change of each type of expected LULC loss in the typical CFR areas of 11 coastal provinces among scenarios and years. It is found that the total area of the typical CFR areas in Jiangsu is the largest among scenarios and years, and its LULC losses type with the largest area is mainly farmland, followed by inland freshwater and built-up. Although Guangdong’s total areas of typical CFR areas are slightly smaller than Jiangsu’s, the main type of expected LULC losses is built-up, followed by farmland and inland freshwater, and the area loss of built-up in Guangdong is the largest in all coastal provinces, followed by Jiangsu, Shandong, and Zhejiang. In addition, the expected loss of constructed wetland in Shandong is the largest in all coastal provinces among scenarios and years.
4 Discussion
CFR spatial assessment is eagerly necessary to improve the understanding of the risk of climate change and develop proper flood adaptation measures. In this study, we developed a CFR spatial assessment framework for CCZ by combining three categories of hazard, exposure & sensitivity, and adaptive capacity (22 sub-indicators in total). It is meaningful to combine the three categories for an integrated spatial assessment of CFR under climate change (Nguyen et al., 2019). Then, each indicator was assigned a weight value by the AHP-EW combined method in order to calculate the value of CFR. The AHP-EW combined method considered both the subjective judgment of multiple experts and the information entropy contained in indicator values. Therefore, the weight values calculated by this method would be more scientific (Hu et al., 2019). Finally, the values of CFR were divided into five risk levels and shown in risk maps (Figure 3). To the best of our knowledge, it is the first time that CFR assessment maps (with 100 m spatial resolution) have been conducted in China’s coastal zone. This improves the understanding of the differences in the spatial distribution of CFR at the regional scale. The clear mappings and geo visualizations allow researchers and policy-makers to easily compare CFR in the coastal zone and help understand which areas should be focused on for disaster planning in the future.
The results of this study indicate that the CCZ is faced with different levels of CFR and those areas with higher risk levels will be extensive in the future under different scenarios. For example, a large number of coastal low-lying areas with densely populated and economically developed have been identified as “High” and “Very high” risk, such as the Yellow River Delta, the Yangtze River Delta, the Pearl River Delta, and the coastal areas in Jiangsu (Figure 3). Some inland hilly or mountainous areas are less affected by coastal floods due to their topography, such as the inland areas of Liaoning, Zhejiang, Fujian, and Hainan. These results are consistent with previous studies showing that coastal flood is one of the most serious hazards and deeply affected by the SLR under climate change (Zuo et al., 2013; Fang et al., 2020). In addition, because of the large variation in the area across provinces, it is necessary to consider both the area proportion and area of each CFR level. For example, although the area proportions of “High” and “Very High” CFR levels in Shanghai and Tianjin are higher than in many provinces, the area of these two levels is very small. This also suggests that Shanghai and Tianjin are facing the CFR with urgency (Figure 5 and 6). It is consistent with previous reports by Yan et al. (2016); Cui et al. (2018), and Du et al. (2020). Across the CCZ, one interesting finding is that although the area of “Very high” level is larger than that of “High” level, the expected losses of GDP and population in “High” CFR areas are much larger than that in “Very high” level (Figures 4A, 7B, C). This result may be explained by the fact that the LULU types in “Very high” CFR areas are mainly farmland, inland freshwater, and built-up, where the sum of socio-economic activity in the areas is less; the LULC types in “High” CFR areas are mainly built-up, farmland, and constructed wetland, where the sum of socio-economic activity in the areas is more (Figures 9A, B). Similarly, the area and area proportion of typical CFR in Jiangsu are higher than that in Guangdong, whereas the expected GDP and population affected in Guangdong are higher than that in Jiangsu. This finding could be due to the main LULC type of typical CFR areas in Guangdong is built-up with densely populated and economically developed. Nevertheless, the main LULC type of typical CFR areas in Jiangsu is farmland (Figures 5, 6, 8 and 9C). By comparing the three scenarios, the different emission scenarios lead to different performances of CFR characteristics, demonstrating a trend suggesting that the high emission scenario leads to a larger spatial area of higher CFR levels, more losses in GDP, population, and LULC, followed by the medium and low emission scenarios, which is consistent with the findings of Taherkhani et al. (2020). These results provide further support for the hypothesis that humans should choose to follow a low emission development path as much as possible to avoid the risks of serious coastal flooding in the future.
In this study, the high spatial resolution CFR maps under different scenarios throughout the 21st century can provide policy-makers at different levels with intuitive and detailed decision support for adaptation strategies. For example, policy-makers at the national level should not only focus on economically developed and densely populated provinces such as Guangdong, Jiangsu, and Shanghai, which are indeed facing potentially significant demographic, economic and ecological losses due to the CFR, but also on the high risk area in the less economically developed provinces, such as Guangxi and Hainan, which should receive more attention in terms of their current disaster adaptation capability, early warning system, public disaster prevention education, and future urban agglomeration planning. In addition, policy-makers at the city level, such as Shanghai and Guangzhou, should consider their high urbanization rates to develop efficient countermeasures. For instance, with reference to high spatial resolution risk maps, governments should take hard measures such as reinforcing tidal sluices, floodwalls, and seawalls at critical locations to effectively block the spread of floods (Du et al., 2020), and soft measures such as building and protecting coastal wetlands at general locations to make wave attenuation, reduce hydrodynamics, and increase the bed surface elevation to offset some of the effects of SLR (Yang et al., 2012; Shi et al., 2014; Yang et al., 2020).
Although a large number of indicators with physical and social attributes are considered in the CFR spatial assessment of this study, it is possible that 22 indicators may not cover the complete spectrum of influences on CFR in the CCZ. For example, if the projection data could provide a more precise age structure of the population, the number of children, women, and elderly, and primary, secondary, and tertiary GDP data, the exposure analysis could be more accurate. And the materials of buildings and roads, year of construction, and use in the coastal zone area have a significant impact on the analysis of sensitivity or adaptive capacity. In addition, if the spatial density changes of schools, hospitals, evacuation sites, government agencies, etc. could be predicted, it would further improve the analysis of adaptive capacity. Obviously, due to a lack of data, it was not possible to include much more detail or a wider range of indicators in the CFR assessment at this time. Moreover, it is inevitable that there is uncertainty in every projected data, such as the future inundation area, inundation frequency, and the growth of GDP and population, etc., because what happens in the future is unknown and can only be speculated on based on known rules (Yin et al., 2019; Liu and Chen, 2021). However, as researchers study the development patterns of human society and the natural environment in greater depth and data sharing between scientific research institutions as well as free downloads of open source data are increasingly frequent and encouraged, this situation should gradually improve over time (Aitsi-Selmi et al., 2016). Nevertheless, in spite of any limitations, our findings are of great value for the understanding and reduction of CFR in China’s coastal zone. This is primarily because the current work is a spatial assessment of coastal flood risk with a high spatial resolution and the integrated consideration of hazard, exposure & sensitivity, and adaptive capacity at the macro-scale.
5 Conclusion
This paper investigates the future coastal flood risk caused by SLR in China’s coastal zone based on the hazard, exposure & sensitivity, and adaptive capacity by developing a CFR assessment framework, using the AHP-EW combined method to calculate the weight values, calculating the values of CFR in 2030, 2050, and 2100 under RCP2.6-SSP1, RCP4.5-SSP2, and RCP8.5-SSP5 scenarios, respectively, and displaying CFR values using risk maps. The results show that low-lying coastal areas with densely populated, economically developed, or industrially diverse are faced with serious coastal flood risks, such as the Yellow River Delta, the Yangtze River Delta, the Pearl River Delta, and the coastal areas in Jiangsu. The area of “Very High” CFR level reaches a peak of 44.10×10³ km2 in 2100 under RCP8.5-SSP5. The area proportion and area of typical CFR levels in the coastal areas of Jiangsu and Guangdong are significantly larger than those in other provinces. In the typical CFR areas, the number of the expected population affected rises to a high point and peaks in 2050, with a maximum of 202.82 million under RCP2.6-SSP1, and the expected GDP affected reaches a peak in 2100, with 22.31 trillion USD under RCP8.5-SSP5. In addition, in the “High” and “Very high” CFR areas, the LULC types of built-up and farmland are most affected, respectively. As the provinces most threatened by CFR, Guangdong and Jiangsu are required to guard against the impact of coastal flooding on built-up and farmland, respectively. This study will provide the intuitive information and basis for governments, policy-makers, and local communities to address the increased coastal flood risk.
Data availability statement
The raw data supporting the conclusions of this article will be made available by the authors, without undue reservation.
Author contributions
HX planned the study, collected, and analyzed the data, and wrote the manuscript. XH improved the research design and research model. CF, PD and BS co-analyzed the data and co-improved the research design. DL and XW did the main manuscript revision and editing. All authors listed have made a substantial, direct, and intellectual contribution to the work, and approved it for publication.
Funding
This work was supported by the Strategic Priority Research Program of the Chinese Academy of Sciences (grant No. XDA19060205) and the National Natural Science Foundation of China (grant No. 42176221).
Conflict of interest
The authors declare that the research was conducted in the absence of any commercial or financial relationships that could be construed as a potential conflict of interest.
Publisher’s note
All claims expressed in this article are solely those of the authors and do not necessarily represent those of their affiliated organizations, or those of the publisher, the editors and the reviewers. Any product that may be evaluated in this article, or claim that may be made by its manufacturer, is not guaranteed or endorsed by the publisher.
Supplementary material
The Supplementary Material for this article can be found online at: https://www.frontiersin.org/articles/10.3389/fmars.2022.945901/full#supplementary-material
References
Aitsi-Selmi A., Murray V., Wannous C., Dickinson C., Johnston D., Kawasaki A., et al. (2016). Reflections on a science and technology agenda for 21st century disaster risk reduction. Int. J. Disast. Risk Sci. 7 (1), 1–29. doi: 10.1007/s13753-016-0081-x
Al-Hinai H., Abdalla R. (2021). Mapping coastal flood susceptible areas using shannon’s entropy model: The case of Muscat governorate, Oman. ISPRS. Int. J. Geo-Inf. 10 (4), 252. doi: 10.3390/ijgi10040252
Asbridge E. F., Low Choy D., Mackey B., Serrao-Neumann S., Taygfeld P., Rogers K. (2021). Coastal flood risk within a peri-urban area: Sussex inlet district, SE Australia. Nat. Hazard. 109 (1), 999–1026. doi: 10.1007/s11069-021-04865-9
Balica S. F., Wright N. G., van der Meulen F. (2012). A flood vulnerability index for coastal cities and its use in assessing climate change impacts. Nat. Hazard. 64 (1), 73–105. doi: 10.1007/s11069-012-0234-1
Borrelli P., Robinson David A., Panagos P., Lugato E., Yang Jae E., Alewell C., et al. (2020). Land use and climate change impacts on global soil erosion by water, (2015-2070). Proc. Natl. Acad. Sci. U. S. A. 117 (36), 21994–22001. doi: 10.1073/pnas.2001403117
Chakraborty S., Mukhopadhyay S. (2019). Assessing flood risk using analytical hierarchy process (AHP) and geographical information system (GIS): application in coochbehar district of West Bengal, India. Nat. Hazard. 99 (1), 247–274. doi: 10.1007/s11069-019-03737-7
Chen Y., Guo F., Wang J., Cai W., Wang C., Wang K. (2020). Provincial and gridded population projection for China under shared socioeconomic pathways from 2010 to 2100. Sci. Data 7 (1), 83. doi: 10.1038/s41597-020-0421-y
Church J. A., Clark P. U., Cazenave A., Gregory J. M., Jevrejeva S., Levermann A., et al. (2013). "Sea level change", in Climate change 2013: the physical science basis. contribution of working group I to the fifth assessment report of the intergovernmental panel on climate change. Eds. Stocker T. F., Qin D., Plattner G.-K., Tignor M., Allen S. K., Boschung J., Nauels A., Xia Y., Midgley V.B.&P. M. (Cambridge, United Kingdom and New York, NY, USA: Cambridge University Press).
Cui Q., Xie W., Liu Y. (2018). Effects of sea level rise on economic development and regional disparity in China. J. Clean. Prod. 176, 1245–1253. doi: 10.1016/j.jclepro.2017.11.165
Dandapat K., Panda G. K. (2018). A geographic information system-based approach of flood hazards modelling, Paschim Medinipur district, West Bengal, India. Jàmbá.: J. Disast. Risk Stud. 10 (1), a518. doi: 10.4102/jamba.v10i1.518
Deng J., Che T., Jiang T., Dai L. (2021). Suitability projection for Chinese ski areas under future natural and socioeconomic scenarios. Adv. Clim. Change Res. 12 (2), 224–239. doi: 10.1016/j.accre.2021.03.007
Du P., Hou X., Xu H. (2022). Dynamic expansion of urban land in China's coastal zone since 2000. Remote Sens. 14 (4), 916. doi: 10.3390/rs14040916
Du S., Scussolini P., Ward P. J., Zhang M., Wen J., Wang L., et al. (2020). Hard or soft flood adaptation? advantages of a hybrid strategy for Shanghai. Glob. Environ. Change-Hum. Policy Dimens. 61, 102037. doi: 10.1016/j.gloenvcha.2020.102037
Engström K., Olin S., Rounsevell M. D. A., Brogaard S., Van Vuuren D. P., Alexander P., et al. (2016). Assessing uncertainties in global cropland futures using a conditional probabilistic modelling framework. Earth Syst. Dynam. 7 (4), 893–915. doi: 10.5194/esd-7-893-2016
Fang J., Lincke D., Brown S., Nicholls R. J., Wolff C., Merkens J. L., et al. (2020). Coastal flood risks in China through the 21st century - an application of DIVA. Sci. Tot. Environ. 704, 135311. doi: 10.1016/j.scitotenv.2019.135311
Fang Y., Yin J., Wu B. (2016). Flooding risk assessment of coastal tourist attractions affected by sea level rise and storm surge: a case study in Zhejiang province, China. Nat. Hazard. 84 (1), 611–624. doi: 10.1007/s11069-016-2444-4
Ganguli P., Paprotny D., Hasan M., Güntner A., Merz B. (2020). Projected changes in compound flood hazard from riverine and coastal floods in northwestern Europe. Earth Future 8 (11), e2020EF001752. doi: 10.1029/2020EF001752
Gornitz V. (1991). Global coastal hazards from future sea level rise. Paleogeogr. Paleoclimatol. Paleoecol. 89 (4), 379–398. doi: 10.1016/0921-8181(91)90118-G
Hadipour V., Vafaie F., Kerle N. (2020). An indicator-based approach to assess social vulnerability of coastal areas to sea-level rise and flooding: A case study of Bandar abbas city, Iran. Ocean. Coast. Manage. 188, 105077. doi: 10.1016/j.ocecoaman.2019.105077
Hallegatte S., Green C., Nicholls R. J., Corfee-Morlot J. (2013). Future flood losses in major coastal cities. Nat. Clim. Change 3 (9), 802–806. doi: 10.1038/nclimate1979
Huang Y., Zhang T., Wu W., Zhou Y., Tian B. (2017). Rapid risk assessment of wetland degradation and loss in low-lying coastal zone of Shanghai, China. Hum. Ecol. Risk Assess. 23 (1), 82–97. doi: 10.1080/10807039.2016.1223536
Hu Y., Li W., Wang Q., Liu S., Wang Z. (2019). Evaluation of water inrush risk from coal seam floors with an AHP–EWM algorithm and GIS. Environ. Earth Sci. 78 (10), 290. doi: 10.1007/s12665-019-8301-5
IPCC (2014). "Climate change 2014: Impacts, adaptation, and vulnerability. part a: Global and sectoral aspects. contribution of working group II to the fifth assessment report of the intergovernmental panel on climate change", Eds. Field C. B., Barros V. R., Dokken D. J., Mach K. J., Mastrandrea M. D., Bilir T. E., Chatterjee M., Ebi K. L., Estrada Y. O., Genova R. C., Girma B., Kissel E. S., Levy A. N., MacCracken S., Mastrandrea P. R., White L. L. (Cambridge, United Kingdom and New York: Cambridge University Press).
IPCC (2019). "IPCC special report on the ocean and cryosphere in a changing climate". Eds. Pörtner H.-O., Roberts D. C., Masson-Delmotte V., Zhai P., Tignor M., Poloczanska E., Mintenbeck K., Alegría A., Nicolai M., Okem A., Petzold J., Rama B., Weyer N. M. (Cambridge, UK and New York, NY, USA: Cambridge University Press).
IPCC (2021). "Climate change 2021: The physical science basis. contribution of working group I to the sixth assessment report of the intergovernmental panel on climate change". Eds. Masson-Delmotte V., Zhai P., Pirani A., Connors S. L., Péan S. B. C., Caud N., Chen Y., Goldfarb L., Gomis M. I., Huang M., Leitzell K., Lonnoy E., Matthews J. B. R., Maycock T. K., Waterfield T., Yelekçi O., Yu R., Zhou B. (Cambridge, UK and New York, NY, USA: Cambridge University Press).
IPCC (2022). "Climate change 2022: Impacts, adaptation, and vulnerability. contribution of working group II to the sixth assessment report of the intergovernmental panel on climate change". Eds. Pörtner H.-O., Roberts D. C., Tignor M., Poloczanska E. S., Mintenbeck K., Alegría A., Craig M., Langsdorf S., Löschke S., Möller V., Okem A., Rama B. (Cambridge, UK and New York, NY, USA: Cambridge University Press).
Kourgialas N. N., Karatzas G. P. (2017). A national scale flood hazard mapping methodology: The case of Greece – protection and adaptation policy approaches. Sci. Tot. Environ. 601-602, 441–452. doi: 10.1016/j.scitotenv.2017.05.197
Liao Q., Yu G., Jiang W., Lu C., Ma Y., Liu K., et al. (2019). Research on the risk assessment of Qingdao marine disaster based on flooding. Sustainability 11 (2), 468. doi: 10.3390/su11020468
Lin W., Sun Y., Nijhuis S., Wang Z. (2020). Scenario-based flood risk assessment for urbanizing deltas using future land-use simulation (FLUS): Guangzhou metropolitan area as a case study. Sci. Tot. Environ. 739, 139899. doi: 10.1016/j.scitotenv.2020.139899
Liu Y., Chen J. (2021). Future global socioeconomic risk to droughts based on estimates of hazard, exposure, and vulnerability in a changing climate. Sci. Tot. Environ. 751, 142159. doi: 10.1016/j.scitotenv.2020.142159
Liu Y., Wang S., Wang X., Jiang D., Ravindranath N. H., Rahman A., et al. (2020). Flood risk assessment in Bangladesh, India and Myanmar based on the AHP weight method and entropy weight method. Geogr. Res. 39 (8), 1892–1906. doi: 10.11821/dlyj020190679
Li M., Wu W., Wang J., Che Z., Xie Y. (2017). Simulating and mapping the risk of surge floods in multiple typhoon scenarios: a case study of Yuhuan county, Zhejiang province, China. Stoch. Environ. Res. Risk Assess. 31 (3), 645–659. doi: 10.1007/s00477-016-1238-2
Lopes C. L., Alves F. L., Dias J. M. (2017). Flood risk assessment in a coastal lagoon under present and future scenarios: Ria de aveiro case study. Nat. Hazard. 89 (3), 1307–1325. doi: 10.1007/s11069-017-3025-x
Lovelock C. E., Cahoon D. R., Friess D. A., Guntenspergen G. R., Krauss K. W., Reef R., et al. (2015). The vulnerability of indo-pacific mangrove forests to sea-level rise. Nature 526 (7574), 559–563. doi: 10.1038/nature15538
MNR (2022) China’s Sea Level Bulletin 2021. Available at: http://gi.mnr.gov.cn/202205/t20220507_2735509.html (Accessed 2022-04-08).
Nadal N. C., Zapata R. E., Pagan I., Lopez R., Agudelo J. (2010). Building damage due to riverine and coastal floods. J. Water Resour. Plan. Manage.-ASCE. 136 (3), 327–336. doi: 10.1061/(asce)wr.1943-5452.0000036
Nguyen K. A., Liou Y. A., Terry J. P. (2019). Vulnerability of Vietnam to typhoons: A spatial assessment based on hazards, exposure and adaptive capacity. Sci. Tot. Environ. 682, 31–46. doi: 10.1016/j.scitotenv.2019.04.069
Nicholls R. J., Cazenave A. (2010). Sea-Level rise and its impact on coastal zones. Science 328 (5985), 1517–1520. doi: 10.1126/science.1185782
Nur I., Shrestha K. K. (2017). An integrative perspective on community vulnerability to flooding in cities of developing countries. Proc. Eng. 198, 958–967. doi: 10.1016/j.proeng.2017.07.141
Pekel J. F., Cottam A., Gorelick N., Belward A. S. (2016). High-resolution mapping of global surface water and its long-term changes. Nature 540 (7633), 418–422. doi: 10.1038/nature20584
Rounsevell M. D. A., Metzger M. J. (2010). Developing qualitative scenario storylines for environmental change assessment. WIRE. Climate Change 1 (4), 606–619. doi: 10.1002/wcc.63
Saaty T. L. (1988). "What is the analytic hierarchy process?" in Mathematical models for decision support. Eds. Mitra G., Greenberg H. J., Lootsma F. A., Rijkaert M. J., Zimmermann H. J. (Springer Berlin Heidelberg), 109–121.
Saaty T. L. (2008). Decision making with the analytic hierarchy process. Int. J. Services. Sci. 1 (1), 83–98. doi: 10.1504/IJSSci.2008.01759
Sajjad M., Lin N., Chan J. C. L. (2020). Spatial heterogeneities of current and future hurricane flood risk along the U.S. Atlantic and gulf coasts. Sci. Tot. Environ. 713, 136704. doi: 10.1016/j.scitotenv.2020.136704
Shannon C. E. (1948). A mathematical theory of communication. Bell. Syst. Tech. J. 27 (3), 379–423. doi: 10.1002/j.1538-7305.1948.tb01338.x
Shi X., Qiu J., Chen B., Zhang X., Guo H., Wang J., et al. (2020). Storm surge risk assessment method for a coastal county in China: case study of Jinshan district, Shanghai. Stoch. Environ. Res. Risk Assess. 34 (5), 627–640. doi: 10.1007/s00477-020-01791-3
Shi B. W., Yang S. L., Wang Y. P., Yu Q., Li M. L. (2014). Intratidal erosion and deposition rates inferred from field observations of hydrodynamic and sedimentary processes: A case study of a mudflat–saltmarsh transition at the Yangtze delta front. Cont. Shel. Res. 90, 109–116. doi: 10.1016/j.csr.2014.01.019
Smit B., Wandel J. (2006). Adaptation, adaptive capacity and vulnerability. Glob. Environ. Change-Hum. Policy Dimens. 16 (3), 282–292. doi: 10.1016/j.gloenvcha.2006.03.008
Song B. (2021). Multi-scenario simulation of LUCC in China’s coastal zone based on SD-FLUS model. master, University of Chinese Academy of Sciences (Yantai Institute of Coastal Zone Research). doi: 10.27841/d.cnki.gytha.2021.000026
Spirandelli D. J., Anderson T. R., Porro R., Fletcher C. H. (2016). Improving adaptation planning for future sea-level rise: understanding uncertainty and risks using a probability-based shoreline model. J. Plan. Educ. Res. 36 (3), 290–303. doi: 10.1177/0739456X16657160
Stephens S. A., Bell R. G., Lawrence J. (2017). Applying principles of uncertainty within coastal hazard assessments to better support coastal adaptation. J. Mar. Sci. Eng. 5 (3), 40. doi: 10.3390/jmse5030040
Tadesse M. G., Wahl T. (2021). A database of global storm surge reconstructions. Sci. Data 8 (1), 125. doi: 10.1038/s41597-021-00906-x
Taherkhani M., Vitousek S., Barnard P. L., Frazer N., Anderson T. R., Fletcher C. H. (2020). Sea-Level rise exponentially increases coastal flood frequency. Sci. Rep. 10 (1), 6466. doi: 10.1038/s41598-020-62188-4
Tebaldi C., Strauss B. H., Zervas C. E. (2012). Modelling sea level rise impacts on storm surges along US coasts. Environ. Res. Lett. 7 (1), 14032. doi: 10.1088/1748-9326/7/1/014032
Thumerer T., Jones A. P., Brown D. (2000). A GIS based coastal management system for climate change associated flood risk assessment on the east coast of England. Int. J. Geogr. Inf. Sci. 14 (3), 265–281. doi: 10.1080/136588100240840
Toimil A., Losada I. J., Nicholls R. J., Dalrymple R. A., Stive M. J. F. (2020). Addressing the challenges of climate change risks and adaptation in coastal areas: A review. Coast. Eng. 156, 103611. doi: 10.1016/j.coastaleng.2019.103611
UNISDR (2017). "National disaster risk assessment", in Governance system, methodologies, and use of results (United Nations Office for Disaster Risk Reduction). Available at: https://www.undrr.org/publication/words-action-guidelines-national-disaster-risk-assessment.
Vousdoukas M. I., Mentaschi L., Voukouvalas E., Verlaan M., Jevrejeva S., Jackson L. P., et al. (2018). Global probabilistic projections of extreme sea levels show intensification of coastal flood hazard. Nat. Commun. 9 (1), 1–12. doi: 10.1038/s41467-018-04692-w
Wang X., Hou X., Wang Y. (2017). Spatiotemporal variations and regional differences of extreme precipitation events in the coastal area of China from 1961 to 2014. Atmos. Res. 197, 94–104. doi: 10.1016/j.atmosres.2017.06.022
Wang T., Sun F. (2022). Global gridded GDP data set consistent with the shared socioeconomic pathways. Sci. Data 9 (1), 221. doi: 10.1038/s41597-022-01300-x
Weis S. W. M., Agostini V. N., Roth L. M., Gilmer B., Schill S. R., Knowles J. E., et al. (2016). Assessing vulnerability: an integrated approach for mapping adaptive capacity, sensitivity, and exposure. Clim. Change 136 (3), 615–629. doi: 10.1007/s10584-016-1642-0
Woodruff J. D., Irish J. L., Camargo S. J. (2013). Coastal flooding by tropical cyclones and sea-level rise. Nature 504 (7478), 44–52. doi: 10.1038/nature12855
Wu Y., Zhong P. A., Xu B., Zhu F., Ma B. (2017). Changing of flood risk due to climate and development in Huaihe River basin, China. Stoch. Environ. Res. Risk Assess. 31 (4), 935–948. doi: 10.1007/s00477-016-1262-2
Xiao K., Tamborski J., Wang X., Feng X., Wang S., Wang Q., et al. (2022). A coupling methodology of the analytic hierarchy process and entropy weight theory for assessing coastal water quality. Environ. Sci. pollut. Res. 29 (21), 31217–31234. doi: 10.1007/s11356-021-17247-2
Xu L., Cui S., Wang X., Tang J., Nitivattananon V., Ding S., et al. (2021). Dynamic risk of coastal flood and driving factors: Integrating local sea level rise and spatially explicit urban growth. J. Clean. Prod. 321, 129039. doi: 10.1016/j.jclepro.2021.129039
Yang S. L., Luo X., Temmerman S., Kirwan M., Bouma T., Xu K., et al. (2020). Role of delta-front erosion in sustaining salt marshes under sea-level rise and fluvial sediment decline. Limnol. Oceanogr. 65 (9), 1990–2009. doi: 10.1002/lno.11432
Yang L., Scheffran J., Qin H., You Q. (2015). Climate-related flood risks and urban responses in the Pearl River Delta, China. Reg. Envir. Change 15 (2), 379–391. doi: 10.1007/s10113-014-0651-7
Yang S. L., Shi B. W., Bouma T. J., Ysebaert T., Luo X. X. (2012). Wave attenuation at a salt marsh margin: A case study of an exposed coast on the Yangtze estuary. Estuar. Coast. 35 (1), 169–182. doi: 10.1007/s12237-011-9424-4
Yan B., Li S., Wang J., Ge Z., Zhang L. (2016). Socio-economic vulnerability of the megacity of Shanghai (China) to sea-level rise and associated storm surges. Reg. Envir. Change 16 (5), 1443–1456. doi: 10.1007/s10113-015-0878-y
Yin Q., Wang J., Ren Z., Li J., Guo Y. (2019). Mapping the increased minimum mortality temperatures in the context of global climate change. Nat. Commun. 10 (1), 4640. doi: 10.1038/s41467-019-12663-y
Yin J., Yin Z., Xu S. (2013). Composite risk assessment of typhoon-induced disaster for China’s coastal area. Nat. Hazard. 69 (3), 1423–1434. doi: 10.1007/s11069-013-0755-2
Zhang Y., Wu T., Arkema K. K., Han B., Lu F., Ruckelshaus M., et al. (2021). Coastal vulnerability to climate change in China’s bohai economic rim. Environ. Int. 147, 106359. doi: 10.1016/j.envint.2020.106359
Keywords: sea level rise, coastal flood risk, China’s coastal zone, temporal and spatial characteristics, spatial assessment
Citation: Xu H, Hou X, Li D, Wang X, Fan C, Du P and Song B (2022) Spatial assessment of coastal flood risk due to sea level rise in China’s coastal zone through the 21st century. Front. Mar. Sci. 9:945901. doi: 10.3389/fmars.2022.945901
Received: 17 May 2022; Accepted: 25 July 2022;
Published: 29 August 2022.
Edited by:
Lorenzo Mari, Politecnico di Milano, ItalyReviewed by:
Ivan Sekovski, Priority Actions Programme/Regional Activity Centre (PAP/RAC), CroatiaBenwei Shi, East China Normal University, China
Copyright © 2022 Xu, Hou, Li, Wang, Fan, Du and Song. This is an open-access article distributed under the terms of the Creative Commons Attribution License (CC BY). The use, distribution or reproduction in other forums is permitted, provided the original author(s) and the copyright owner(s) are credited and that the original publication in this journal is cited, in accordance with accepted academic practice. No use, distribution or reproduction is permitted which does not comply with these terms.
*Correspondence: Xiyong Hou, eHlob3VAeWljLmFjLmNu