 Eurico Mesquita Noleto-Filho
 Adriana Rosa Carvalho1,2,3
 Ronaldo Angelini
- 1Triatlas Project, Federal University of Rio Grande do Norte, Natal, RN, Brazil
- 2Department of Ecology, Federal University of Rio Grande do Norte, Natal, RN, Brazil
- 3Fishing Ecology Management and Economics (FEME), Universidade Federal do Rio Grande do Norte (UFRN), Depto. de Ecologia, Natal, RN, Brazil
- 4Fishing and Aquaculture Department, Universidade Federal de Sergipe (UFS), São Cristóvão, SE, Brazil
- 5Department of Civil Engineering, Federal University of Rio Grande do Norte, Natal, RN, Brazil
Small-scale fisheries (SSFs) play essential economic, social, and cultural roles for many fleets in the Atlantic region. The basis of fisheries assessment and management is the landings reported by observers or fishers. Even though the information from the landings is essential, it can be subject to a fisher’s bias, such as the tendency to inflate catches and the refusal to fill the logs. The feasibility for managers using field surveys to validate these datasets is held up by the high costs, shortage in monitoring, and the lack of prior information. Alternatively, Benford analysis overcomes those limitations since it can be applied directly on the logbook data. This method is growing in popularity, underlining its suitability to many economic and biological fields. Hence, in this study, we inspected small-scale fisheries data by the Benford’s distribution, aiming to validate fish landing data from 27 points in Brazil’s northeastern region over 3 years. Our results suggest that 20% of landings data are considered highly imprecise (misinformation), especially from non-motorized canoes. Also, harbors in remote locations provide poorer quality data, specifically monthly catch values reported by several boats. The way we mine our data affects the sensitivity of the analysis, with monthly data being less prone to be accessed by this method than daily information. As the results match our prior knowledge on the location, we endorse the suitability of the method and reliability for assessing accuracy in fishing data. Hence, we recommend that it ought to be used as an audit tool for SSF landing data aiming to enlighten data reliance and support managers for planning management actions.
Introduction
Small-scale fisheries (SSFs) are essential for economic, social, and cultural purposes contributing to half of the world’s fish catches and employing more than 90% of the fisheries worker force (Wyman, 2008; Ramos et al., 2017; FAO, 2020). In addition, it is an important income source for developing countries that experience high unemployment levels (FAO, 2020). However, the SFF’s economic sustainability relies on the appropriate management of fish stocks, avoiding collapse and keeping the activity profitable.
The basis of fisheries assessment and management is the landings reported by observers or fishers. Even though the information from the landings is essential, it can be subject to fisher’s bias, such as the tendency to inflate catches and the refusal to fill the logs (Jiorle et al., 2016). Hence, validating the landing data is essential to support fisheries assessment and management. Managers can verify these datasets with field surveys, knowledge of the species biology, and data from similar regions (Ivashchenko and Clapham, 2015; Mamula et al., 2020; Suuronen and Gilman, 2020). However, the feasibility of these types of validation is restricted by high costs, hence the scarcity of field surveys, and by a general lack of biological and ecological information.
Benford’s method is a statistical analysis intended to test whether the observed data are reliable without requiring any additional information for validation. This method was first developed by Newcomb (1881) and reorganized by Benford (1938). Economists mainly use the method to detect tax evasion in national and international trades (Nigrini, 2012). However, its suitability for identifying anomalies in datasets is also growing in popularity to validate global temperature, global infectious diseases, wildlife telemetry, and fisheries data (Sambridge et al., 2010; Nigrini, 2012; Joannes-Boyau et al., 2015; Pröger et al., 2021; Graham et al., 2009).
Benford analysis assumes that the first numerical digit in a series follows a logarithmic distribution where the smaller numeric digits are more frequent than the bigger ones (1 out of 9) (Newcomb, 1881; Benford, 1938). Hence, if a dataset shows significant departures from this distribution, possible data construction is indicated and further investigation is suggested as there are likely biased and suspicious data entries requiring deeper investigation (Nigrini, 2012). The Benford rule can validate landings, particularly when scientific surveys are lacking (Graham et al., 2009). This method also identifies the potential source of error, such as fishermen who have likely provided biased data, and thus lays out the basis for improvement in data recording and for open dialogs between the fishing community, scientists, and managers.
Considering the importance of small-scale fisheries activities for the world’s fisheries economics, knowledge of the quality of SSF landing data is crucial for improving the accuracy and trust among fishing communities, scientists, and managers. In this sense, in this study, we inspected small-scale fisheries data according to Benford’s distribution, aiming to validate landing data from 27 harbors in Brazil’s northeastern region over 3 years. This method provides a robust diagnosis to point out whom or which information in the dataset is more likely to offer a biased report and improves the estimates of data uncertainty.
Material and methods
Study area
The study area comprises the continental shelf of Sergipe’s state, Brazil, which has approximately 163 km of coastline (Figure 1) with exposed sandy beaches and high-water turbidity (da Silva et al., 2010). It is the narrowest portion of the continental shelf of the country, ranging between 12 and 34.90 km, with a gentle slope with 50 m depth in the shelf break, approximately, which can be considered shallow compared to other areas (Silva et al., 2019).
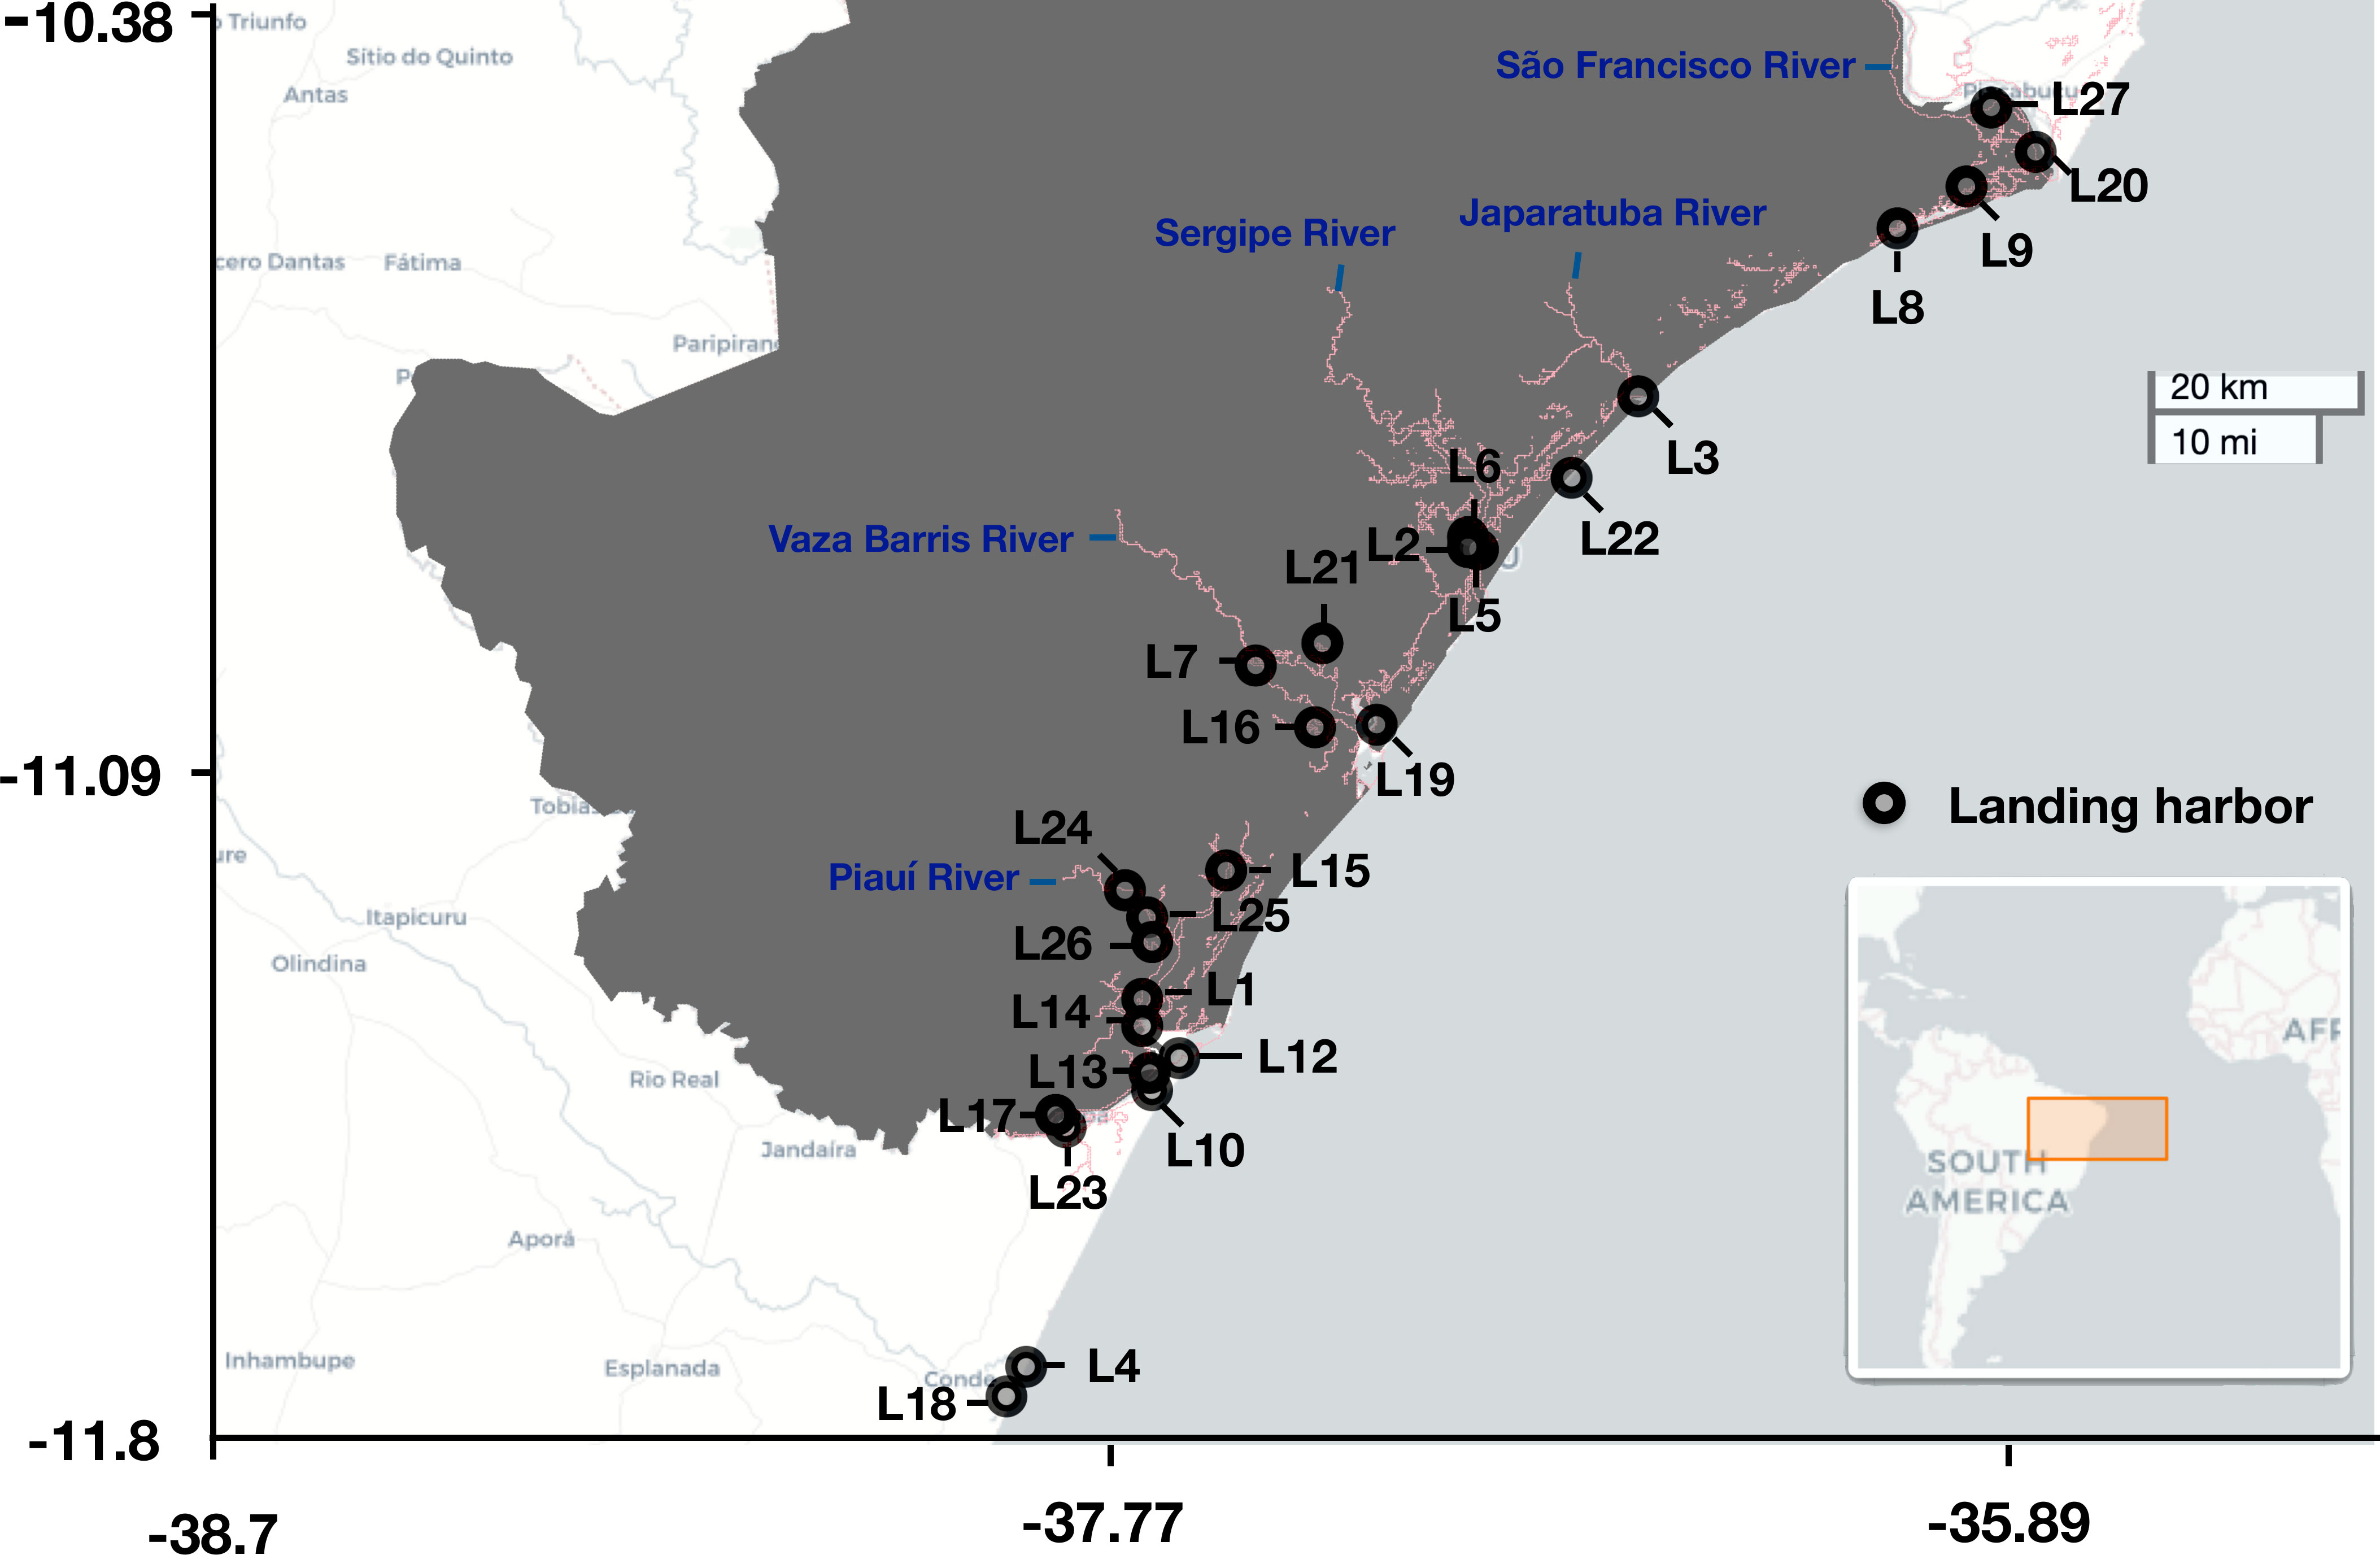
Figure 1 Study area on Sergipe State (Brazil) with locations of the 27 landing harbors for small-scale fisheries.
Data
We used the database supported by “Projeto de Monitoramento Participativo do Desembarque Pesqueiro” (PMPDP) (Participatory Fishing Landing Monitoring Project). This project has monitored daily landings from January 2014 to December 2016 at 27 harbors of small-scale fisheries (Figure 1). The information was collected at landing sites by trained observers. It was composed of date, vessel identification, landing site, species name, and catch in kilograms. The observers were not involved directly in the landing’s measuring process. They only filled the forms with the information provided by the fishers. Under this arrangement, the fishers hold the responsibility for the quality of the data.
Statistical analysis
Benford’s law was first reported by Newcomb (1881) and then rediscovered in Benford (1938). The law establishes that the probability of the first digit of numbers being between 1 and 9 is not the same. Instead, it conforms to the following formula:
Where Fa is the frequency of the first digit a.
We applied Benford analysis to test if the first numerical digit in a time series follows a particular distribution. It could reveal a possible data fabrication if it has significant departures from this distribution (Nigrini, 2012). Such departures can be visually identified and Figure 2 explains how: in panel (A), the data conform to Benford analysis because the bars (observed data) have a similar pattern to the line (expected Benford distribution), while in panel (B), there is no agreement with the Benford distribution as the empirical data show higher or lower values than expected (Nigrini, 2012). To corroborate our results, we performed two additional statistical tests. First, the overall goodness of fit of the data (Eq. 2) with the Benford frequencies was evaluated using a chi-squared test, a standard analysis to measure deviations in data (Kossovsky, 2021). This method tests how well the landings data fit an expected distribution of numbers (Graham et al., 2009). For our case, Benford’s logarithm distribution was compared with the distribution of landings.
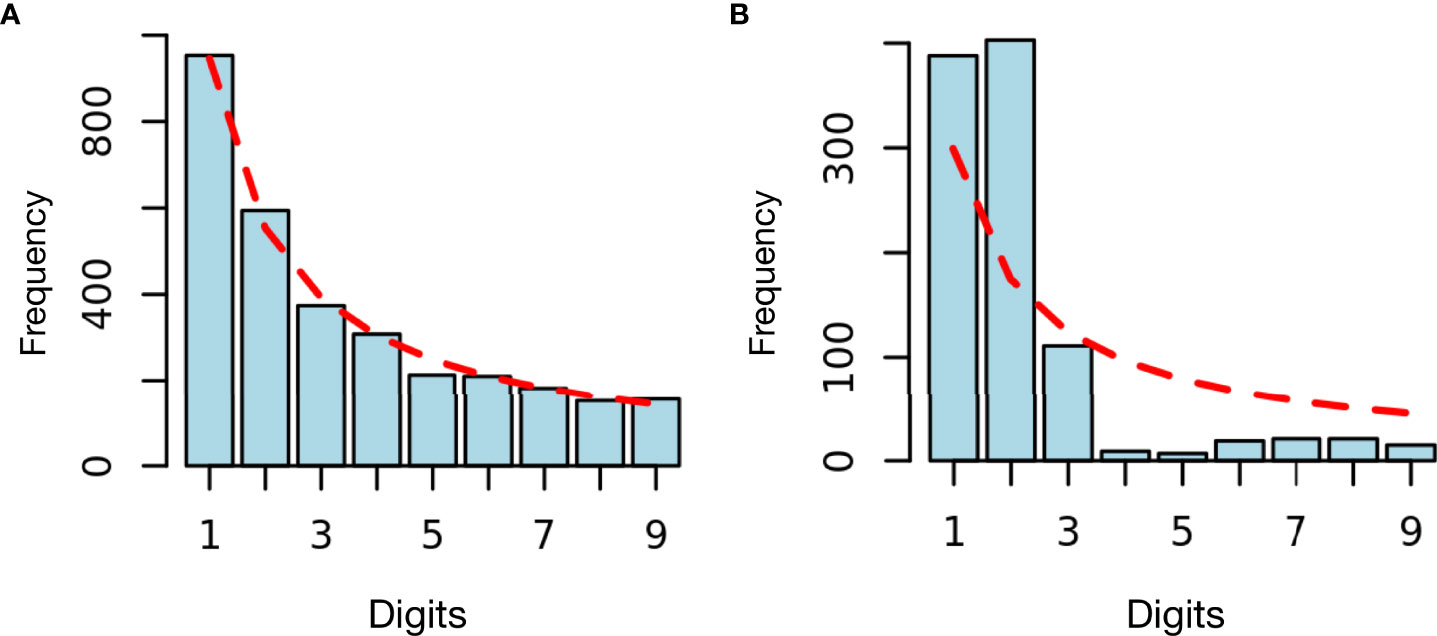
Figure 2 Two hypothetical first-digit distributions. The first (A) conforms to the Benford distributions and the second (B) does not. The blue bars are the observed hypothetical data, and the red dashed lines are the expected Benford distribution.
Where x2 is the overall goodness of fit, o is the observed data, and t is the theoretical data expected by the Benford logarithmic distribution.
Also, the mean absolute deviation (MAD) (Eq. 3) was used to measure the difference between absolute and expected proportions of the first digit and weighted based on the number of bins (Nigrini, 2012). This analysis is more suitable for dealing with large sample sizes than the chi-squared test (Kossovsky, 2021).
Where MAD is the mean absolute deviation, o is the landings data, t is the theoretical data expected by the Benford logarithmic distribution, s is the sample size, and nd is the number of digits.
We categorized the landing data into landings from motorized vessels (canoes), non-motorized vessels, and non-motorized boats to consider their technological infrastructure and catch capacities. We applied Benford analysis to each category. When the data did not conform with the Benford distribution, we distinguished the digits groups that do not have the expected proportions and identified all the other information related to these landing records within the dataset, such as species, harbors, and vessels. In that sense, we quantified how many species were reported, how often the same vessel is likely to misreport landings across the years, which harbors are more likely to present more misreported data, and if there was a correlation (Pearson test) among these variables. In order to test the efficacy and sensitivity of the Benford analysis, first, we applied Benford analysis to daily landing records. Then, we aggregated the data by month and repeated the analysis. In addition, since one of our authors (MT-S) was the PMPDP project manager in the evaluated period, we matched his knowledge on data samplings with our model’s results.
We used the “benford.analysis” statistical package (Cinelli, 2018) through the R software (R Development Core Team, 2016) to estimate the Benford frequencies. Also, we used the get.Suspects function from the same package to identify the landing records from the digits groups that did not conform with the Benford distribution. The maps and graphs were generated with the package ggplot2 (Wickham, 2016). A Pearson correlation test was performed using the R base package.
Results
The data analyzed comprised 192,276 landings of 4,237 vessels (61% motorized canoes, 31% non-motorized canoes, and 5% motorized boats) at 27 harbors. Along the 3 years of landing data, the catch totalizes 6,365 tons (33% motorized canoes, 10% non-motorized canoes, and 56% motorized boats) composed of 80 species (fish and invertebrates, mainly shrimps). Overall, 20% of the landings data were classified as likely biased by our model.
Daily catches by year
When daily landing records were used, data from almost all vessel types did not conform to Benford’s law (Figure 3). The only exceptions were the motorized canoes for 2016 and the motorized boats for all the years, which conformed to Benford’s law, according to the MAD index but not for the chi-squared test (Figure 3).
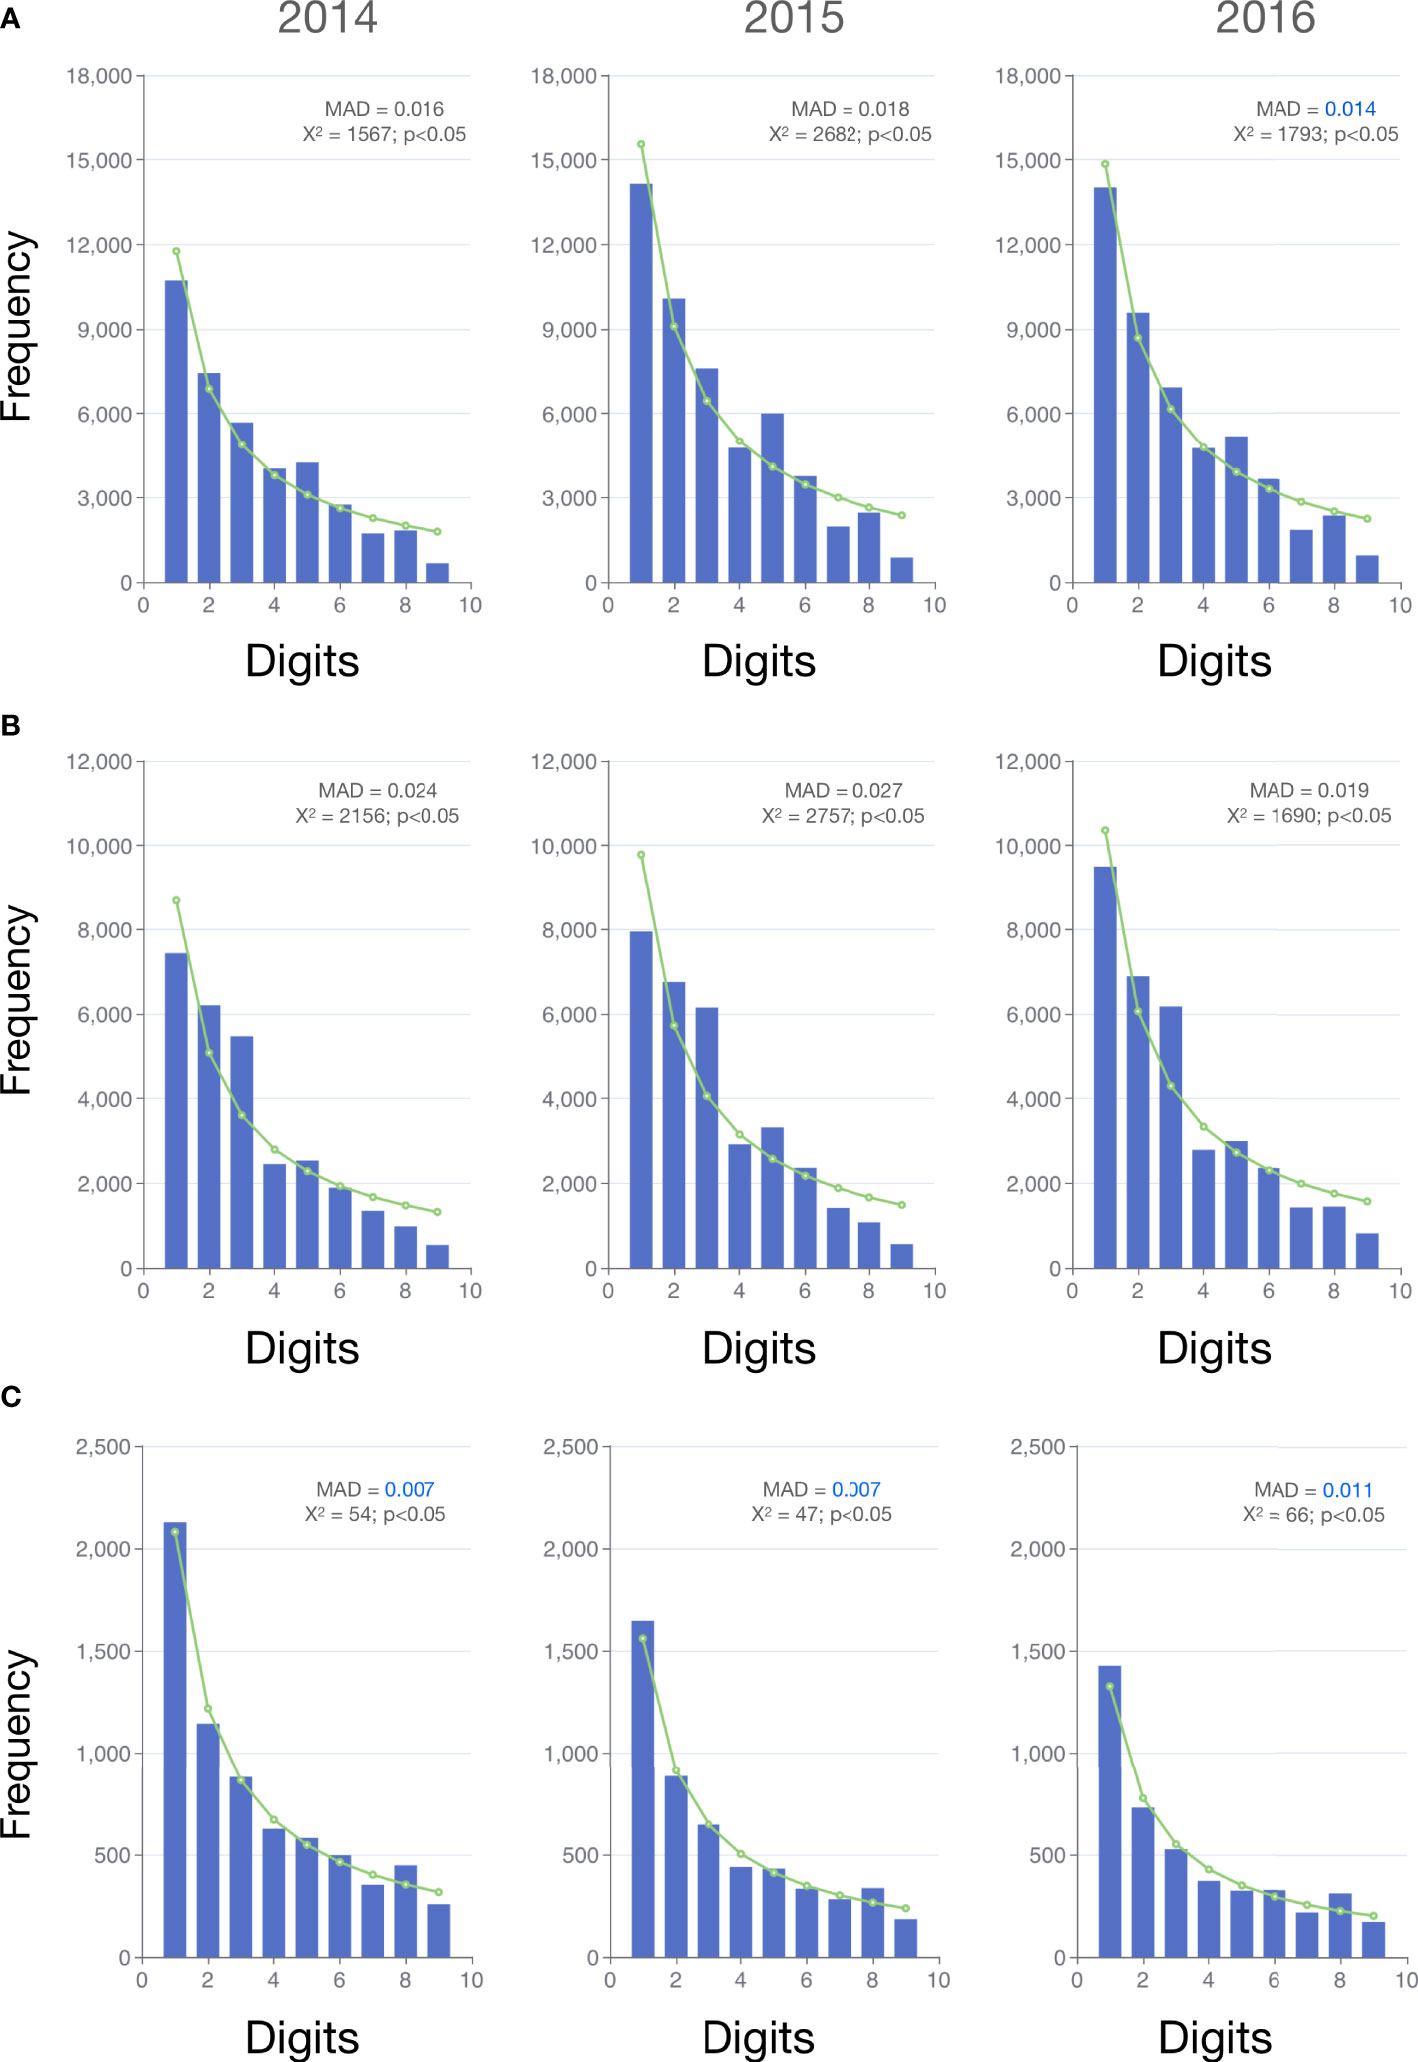
Figure 3 Daily frequency distribution of the first digits, for each year, of motorized canoes (A), non-motorized canoes (B), and motorized boats (C) (blue bars), and the expected Benford distribution (green line). MAD values higher or equal to 0.015 do not conform with Benford’s law (Nigrini, 2012).
Data analysis of non-motorized canoes indicated that 5,472, 6,151, and 6,183 reports were likely biased for 2014, 2015, and 2016, respectively. These values represent ~28%, ~30%, and ~30% of all suspect data of each of these years. Most of these statistics were from the same canoes identified multiple times as suspects in the dataset. Indeed, almost 60% of the canoes had a frequency of occurrence between 2 and 20 times each year (Figure 4A). However, an expressive number of canoes also occurred only once in the data, representing 33% (2014) and 35% (2015 and 2016) of all suspect data records.
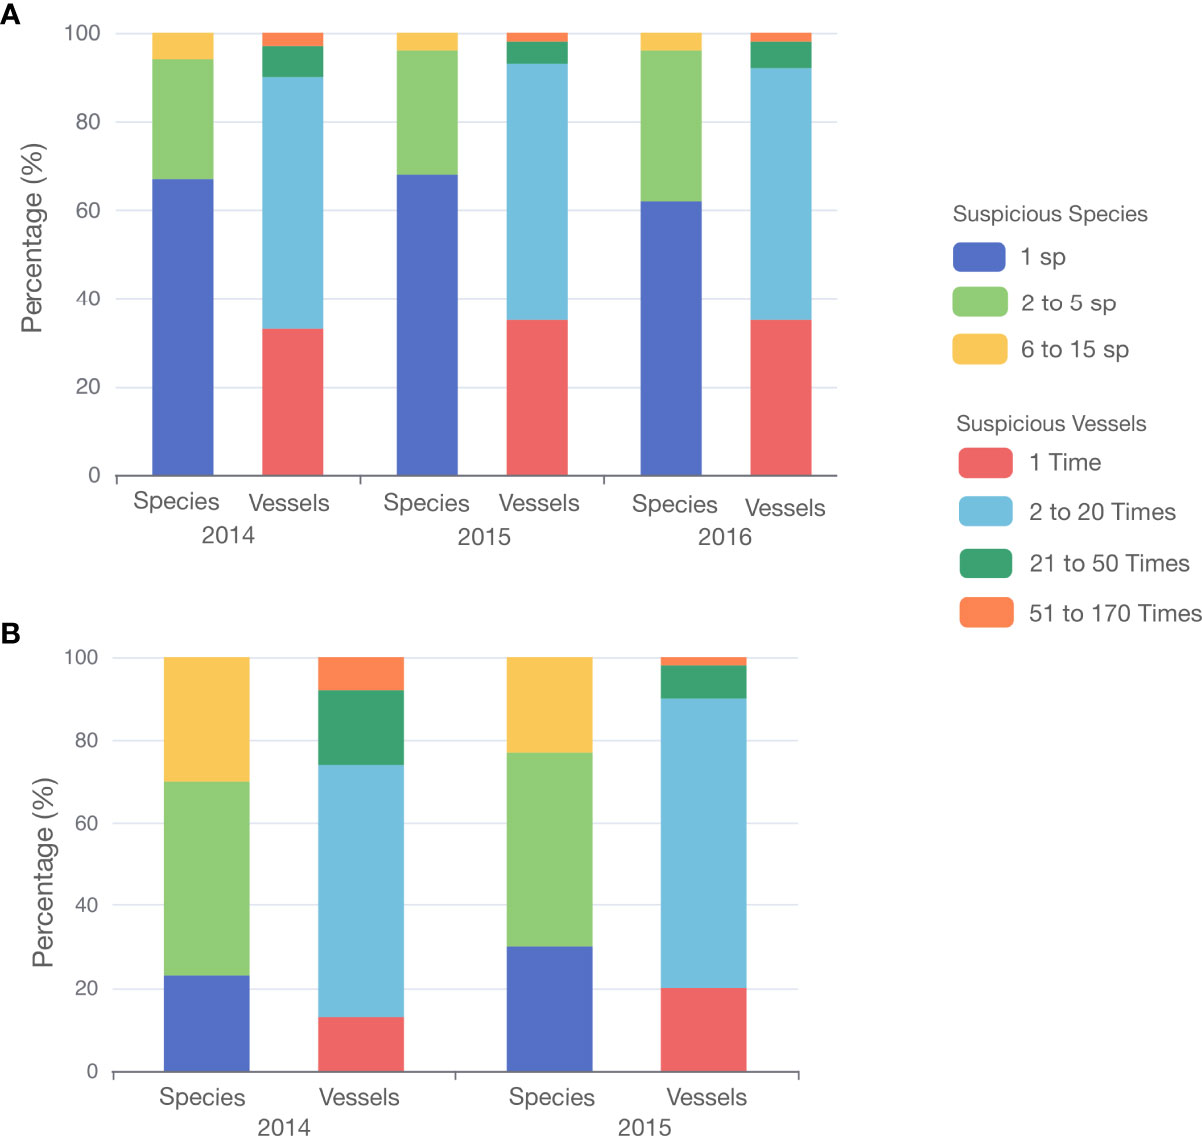
Figure 4 Percentage of how many times the same vessel is accused as suspicious and how many species from the same vessel are regarded as suspicious for non-motorized (A) and motorized (B) canoes.
The number of species from the same vessel accused as likely biased ranged from 1 to 15 species. However, most of the vessel’s suspect data are from one species (which is not necessarily the same for all the canoes). The non-motorized canoes represented from 62% to 68% of all the likely biased information gathered across the years. Yet, there is also a considerable proportion of vessels which misreported between 2 and 5 species (~27%). There is also a smaller part of non-motorized canoes which misreported between 6 and 15 species (~4%) (Figure 4B). The Macrobrachium spp. are the species that are more likely to have likely biased data (32%, 22%, and 15% for the years 2014, 2015, and 2016, respectively), followed by Goniopsis cruentata (~8% for each of the years; see Supplementary Material, Figure SM1). Comparing which canoes are suspect across the years, 60% appear in 1 year, 23% in 2 years, and 17% in the whole study period. Finally, while calculating which harbors are more likely to have a larger amount of likely biased data, we discovered that two places (L23 and L7) are more likely the sites of misreporting (17% in 2014 and 14% in 2015 and 2016) (Figure 5A).
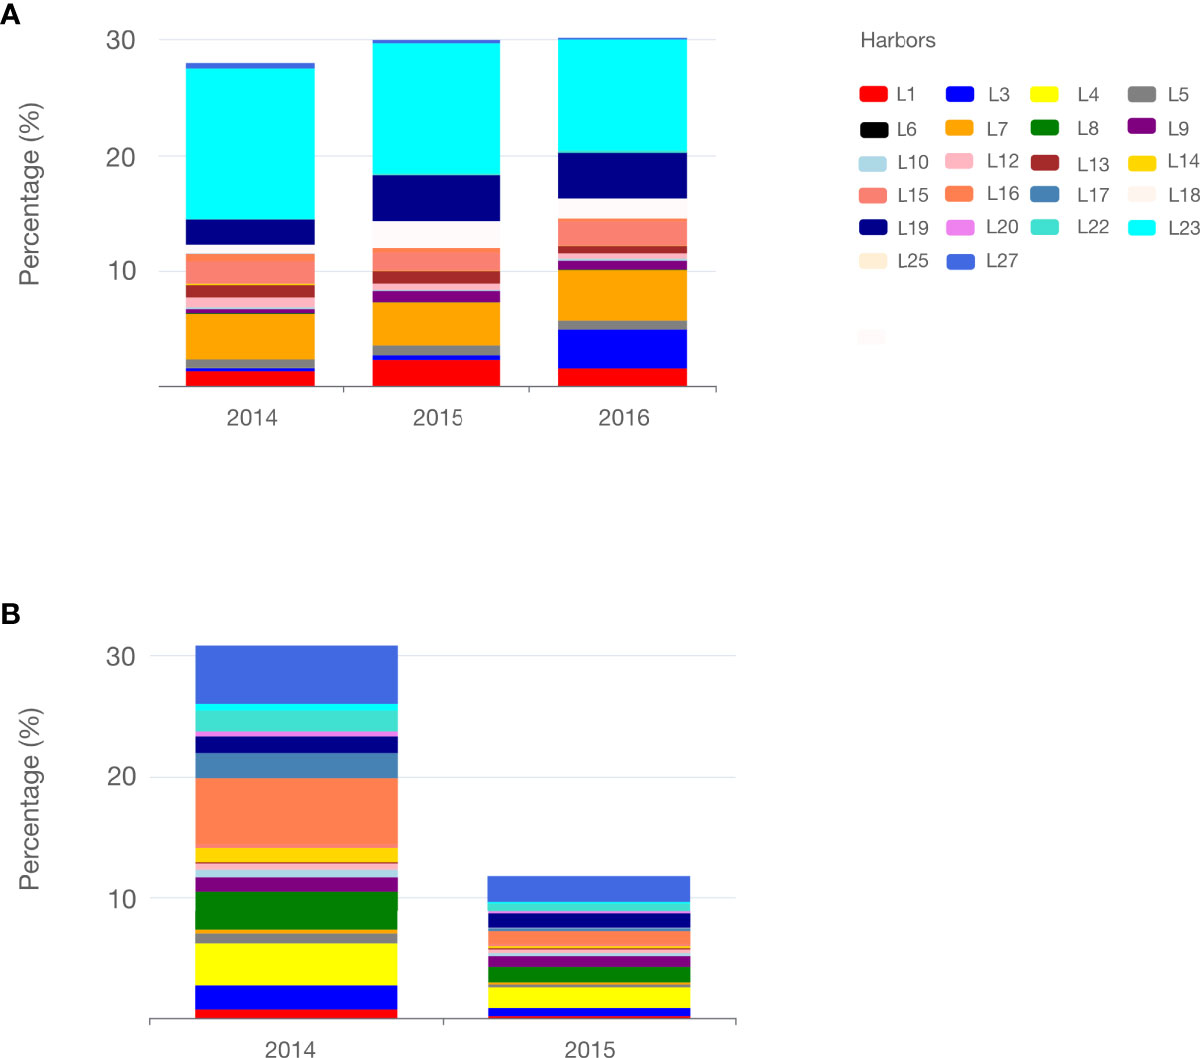
Figure 5 Percentage of suspect data for each harbor relative to each year for non-motorized (A) and motorized (B) canoes. No suspect data were found from the harbors L2, L11, L21, L24, and L26; hence, these sites are not shown in the graph.
Although the number of suspect data correlated with the number of suspect vessels of each harbor (year 2014: r = 0.59, t = 3.28, df = 20, p< 0.003; year 2015: r = 0.57, t = 3.17, df = 20, p< 0.004; year 2016: r = 0.64, t = 3.75, df = 20, p< 0.001), the localities with the highest number of suspect data did not present the highest number of suspect vessels (Figures 6A, B, 7B), which can be seen in the model’s outliers (Figure 7A). Also, the total catch values of each locality positively correlated with the number of suspect data for all the years (year 2014: r = 0.60, t = 3.39, df = 20, p< 0.002; year 2015: r = 0.68, t = 4.24, df = 20, p< 0.0003; year 2016: r = 0.50, t = 2.38, df = 20, p< 0.02) (Figures 6C, 7A).
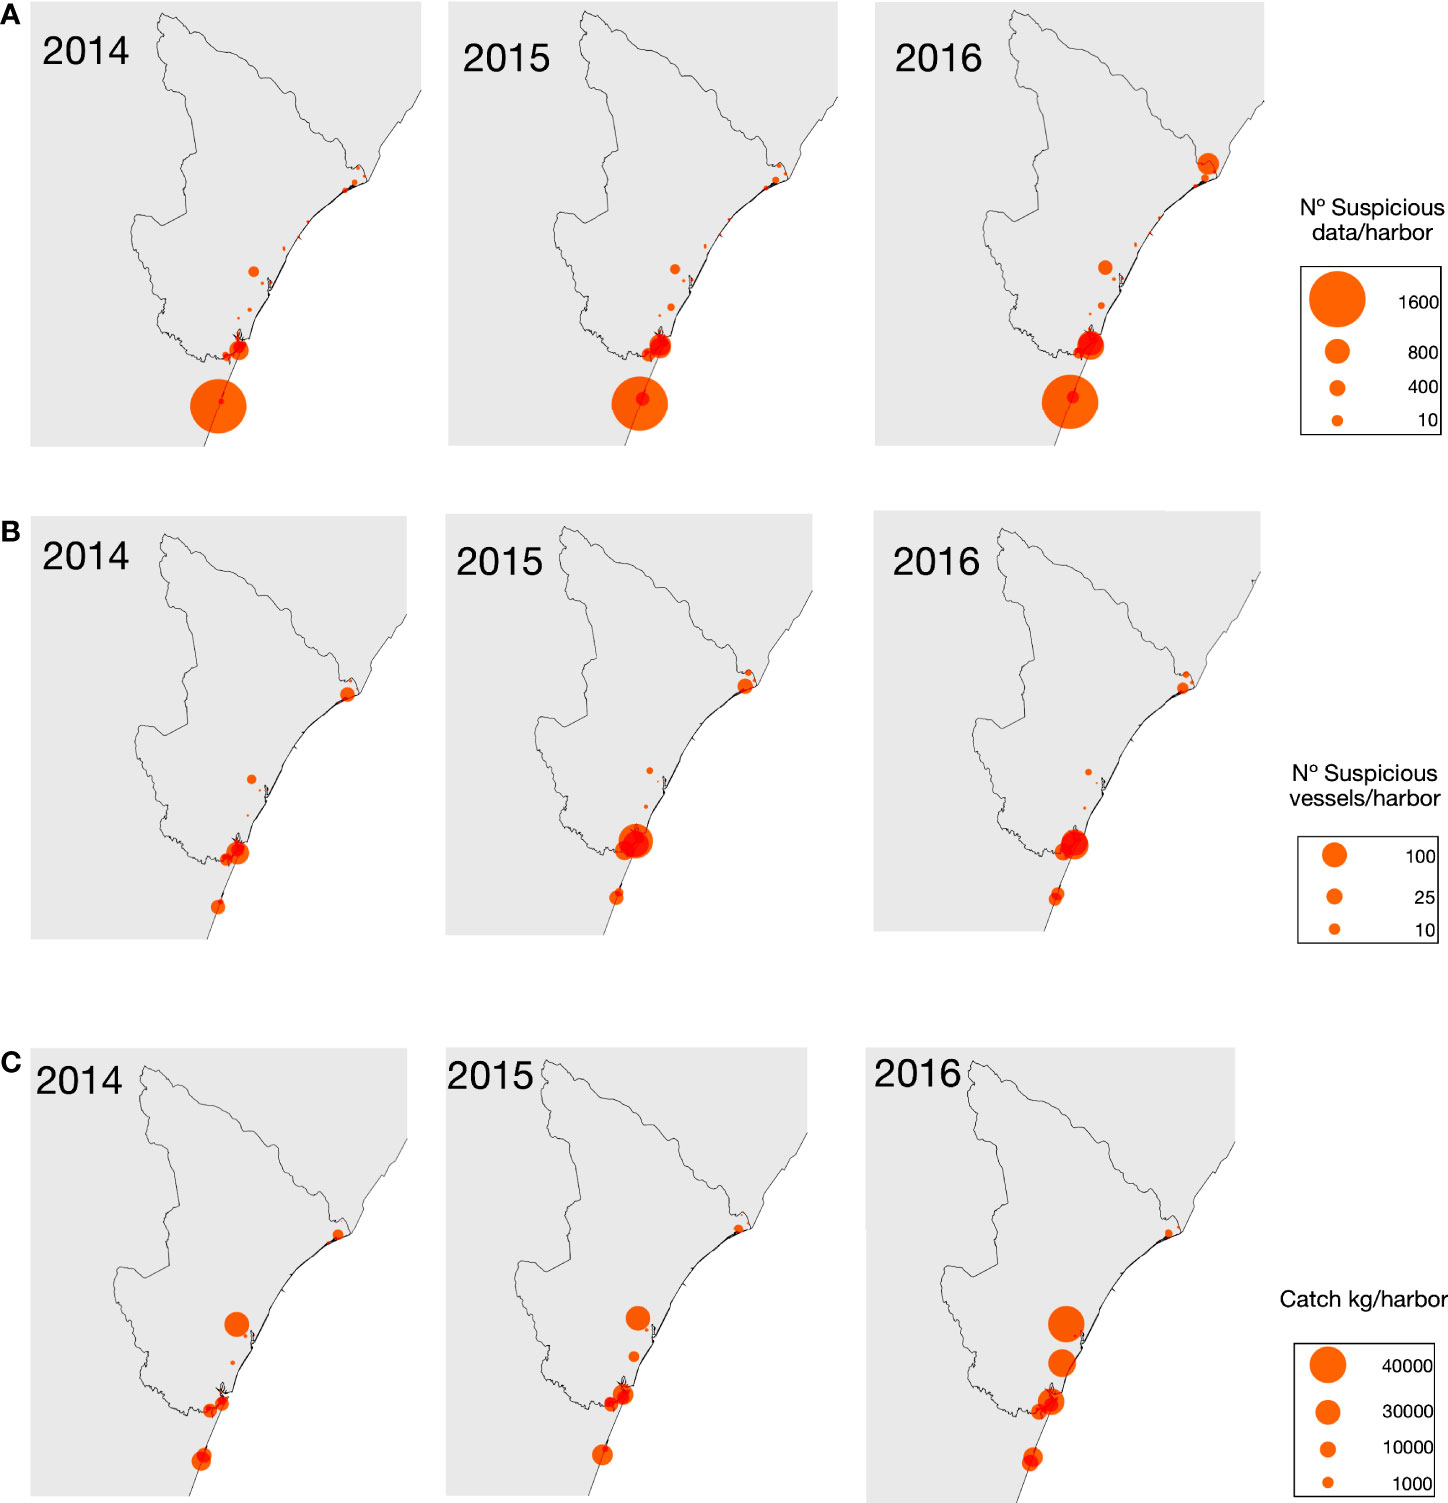
Figure 6 Scatter map of suspicious data of non-motorized canoes (A), suspicious vessels (B), and total catch (C) for each harbor in 3 years of the study. Circle size is related to the magnitude of the number of suspect data, suspect vessels, and catch size (kg).
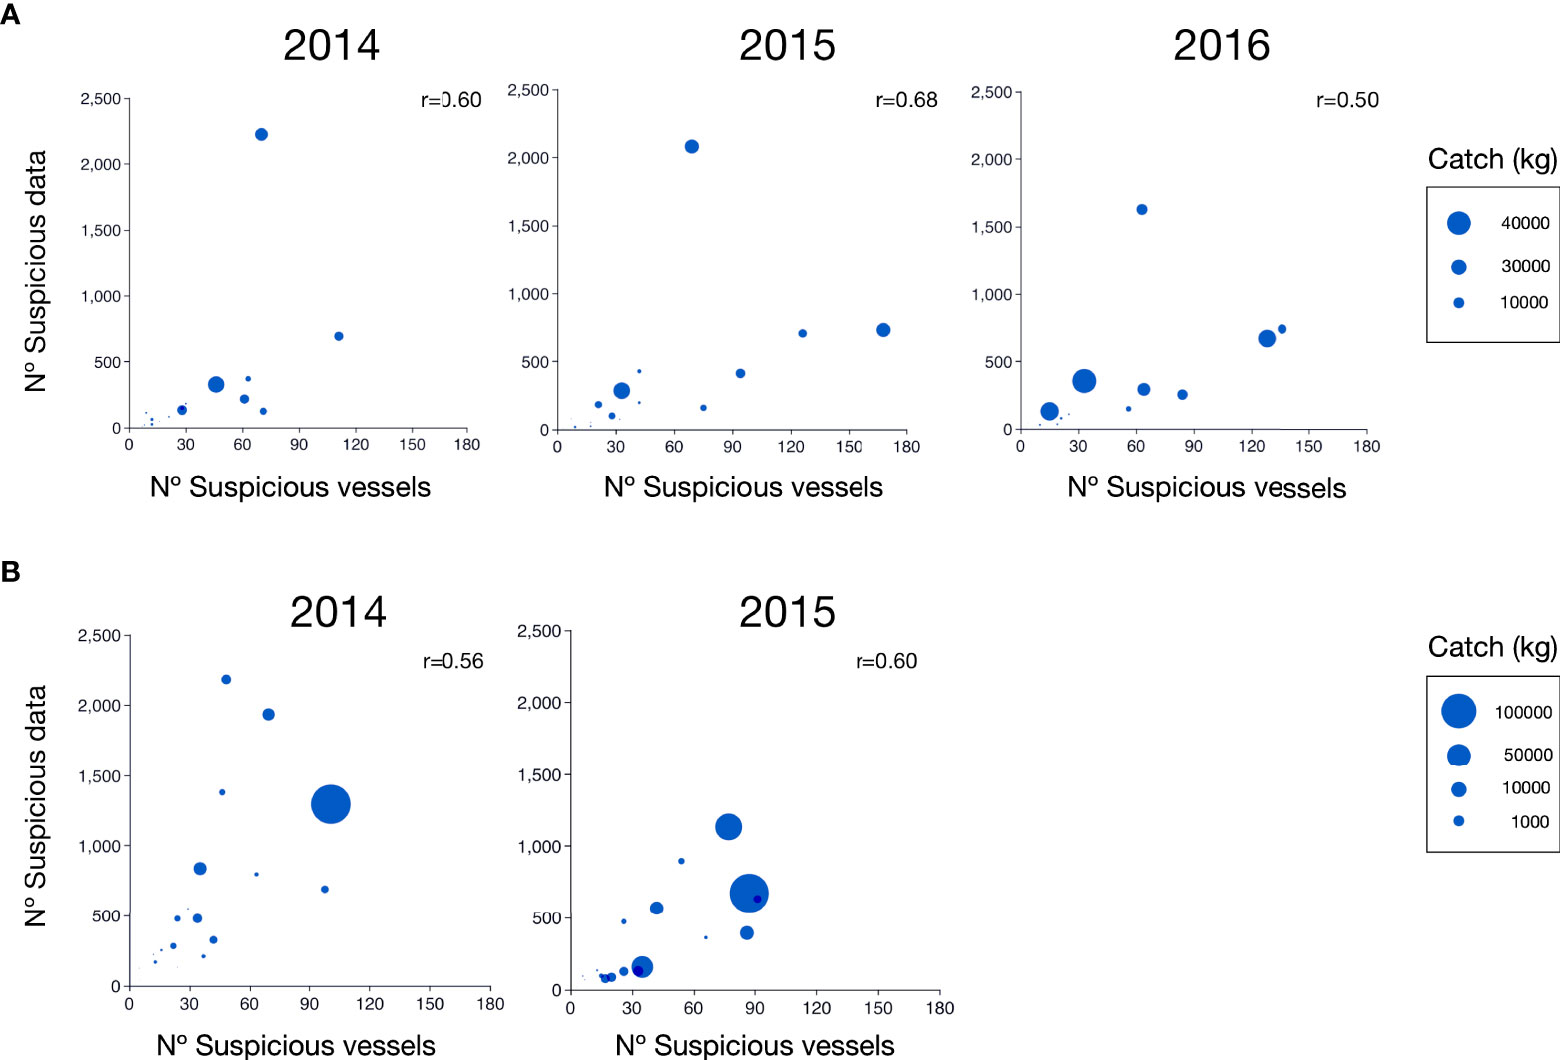
Figure 7 Scatter plot between suspicious data and Suspicious vessels for each harbor of non-motorized (A) and motorized (B) canoes. Circle size is related to the size of the total catch in kilograms.
The reports of motorized canoes showed 14,378 and 7,290 data classified as likely biased for 2014 and 2015, respectively. These values represent ~31% and ~12% of all suspect data for each of these years. Like the non-motorized canoes, most vessels had a frequency of occurrence between 2 and 20 times (61% and 70% for 2014 and 2015, respectively) (Figure 4B). However, unlike the non-motorized canoes, there were no high frequencies of a single appearance (13% and 20% for 2014 and 2015, respectively).
The number of species from the same vessel accused as likely biased ranged from 1 to 15. Unlike the non-motorized canoes, the highest proportion of the motorized canoes has 2 to 5 different species, representing 47% in each of the years (Figure 4B). The motorized canoes with one species composed 23% and 30% of the data from 2014 and 2015, respectively. Unlike the non-motorized canoes, there were no species that presented a high proportion of suspect data over the years (<5%; see Supplementary Material, Figure SM2). Comparing which motorized canoes are suspect across the years, 51% only appear in 1 year and 49% in 2 years. Also, four localities are more likely to have suspicious information (L4, L8, L16, and L27) (Figure 5B).
In the case of motorized canoes, although the number of suspicious data correlated with the number of suspect vessels for each harbor (year 2014: r = 0.67, t = 4.13, df = 20, p< 0.0005; year 2015: r = 0.79, t = 5.81, df = 20, p< 0.0001), the localities with the highest number of suspect data did not present the highest number of motorized canoes (Figures 7B, 8A, B), as also seen in the model’s outliers (Figure 7B). Yet, the total catch values of each locality positively correlated with the number of suspect data for all the years (year 2014: r = 0.56, t = 3.07, df = 20, p< 0.005; year 2015: r = 0.60, t = 3.38, df = 20, p< 0.003) (Figures 7B, 8C).
Figure 8 Scatter map of suspicious data of motorized canoes (A), suspicious vessels (B), and total catch (C) for each harbor in 3 years of the study. Circle size is related to the magnitude of the number of suspect data, suspect vessels, and catch size (kg).
Monthly catches by year
When monthly landing records were used, data from all vessel types in all the years conformed to Benford’s distribution (Figure 9). Yet, these categories only conformed according to the MAD index, but not for the chi-squared test (p< 0.05).
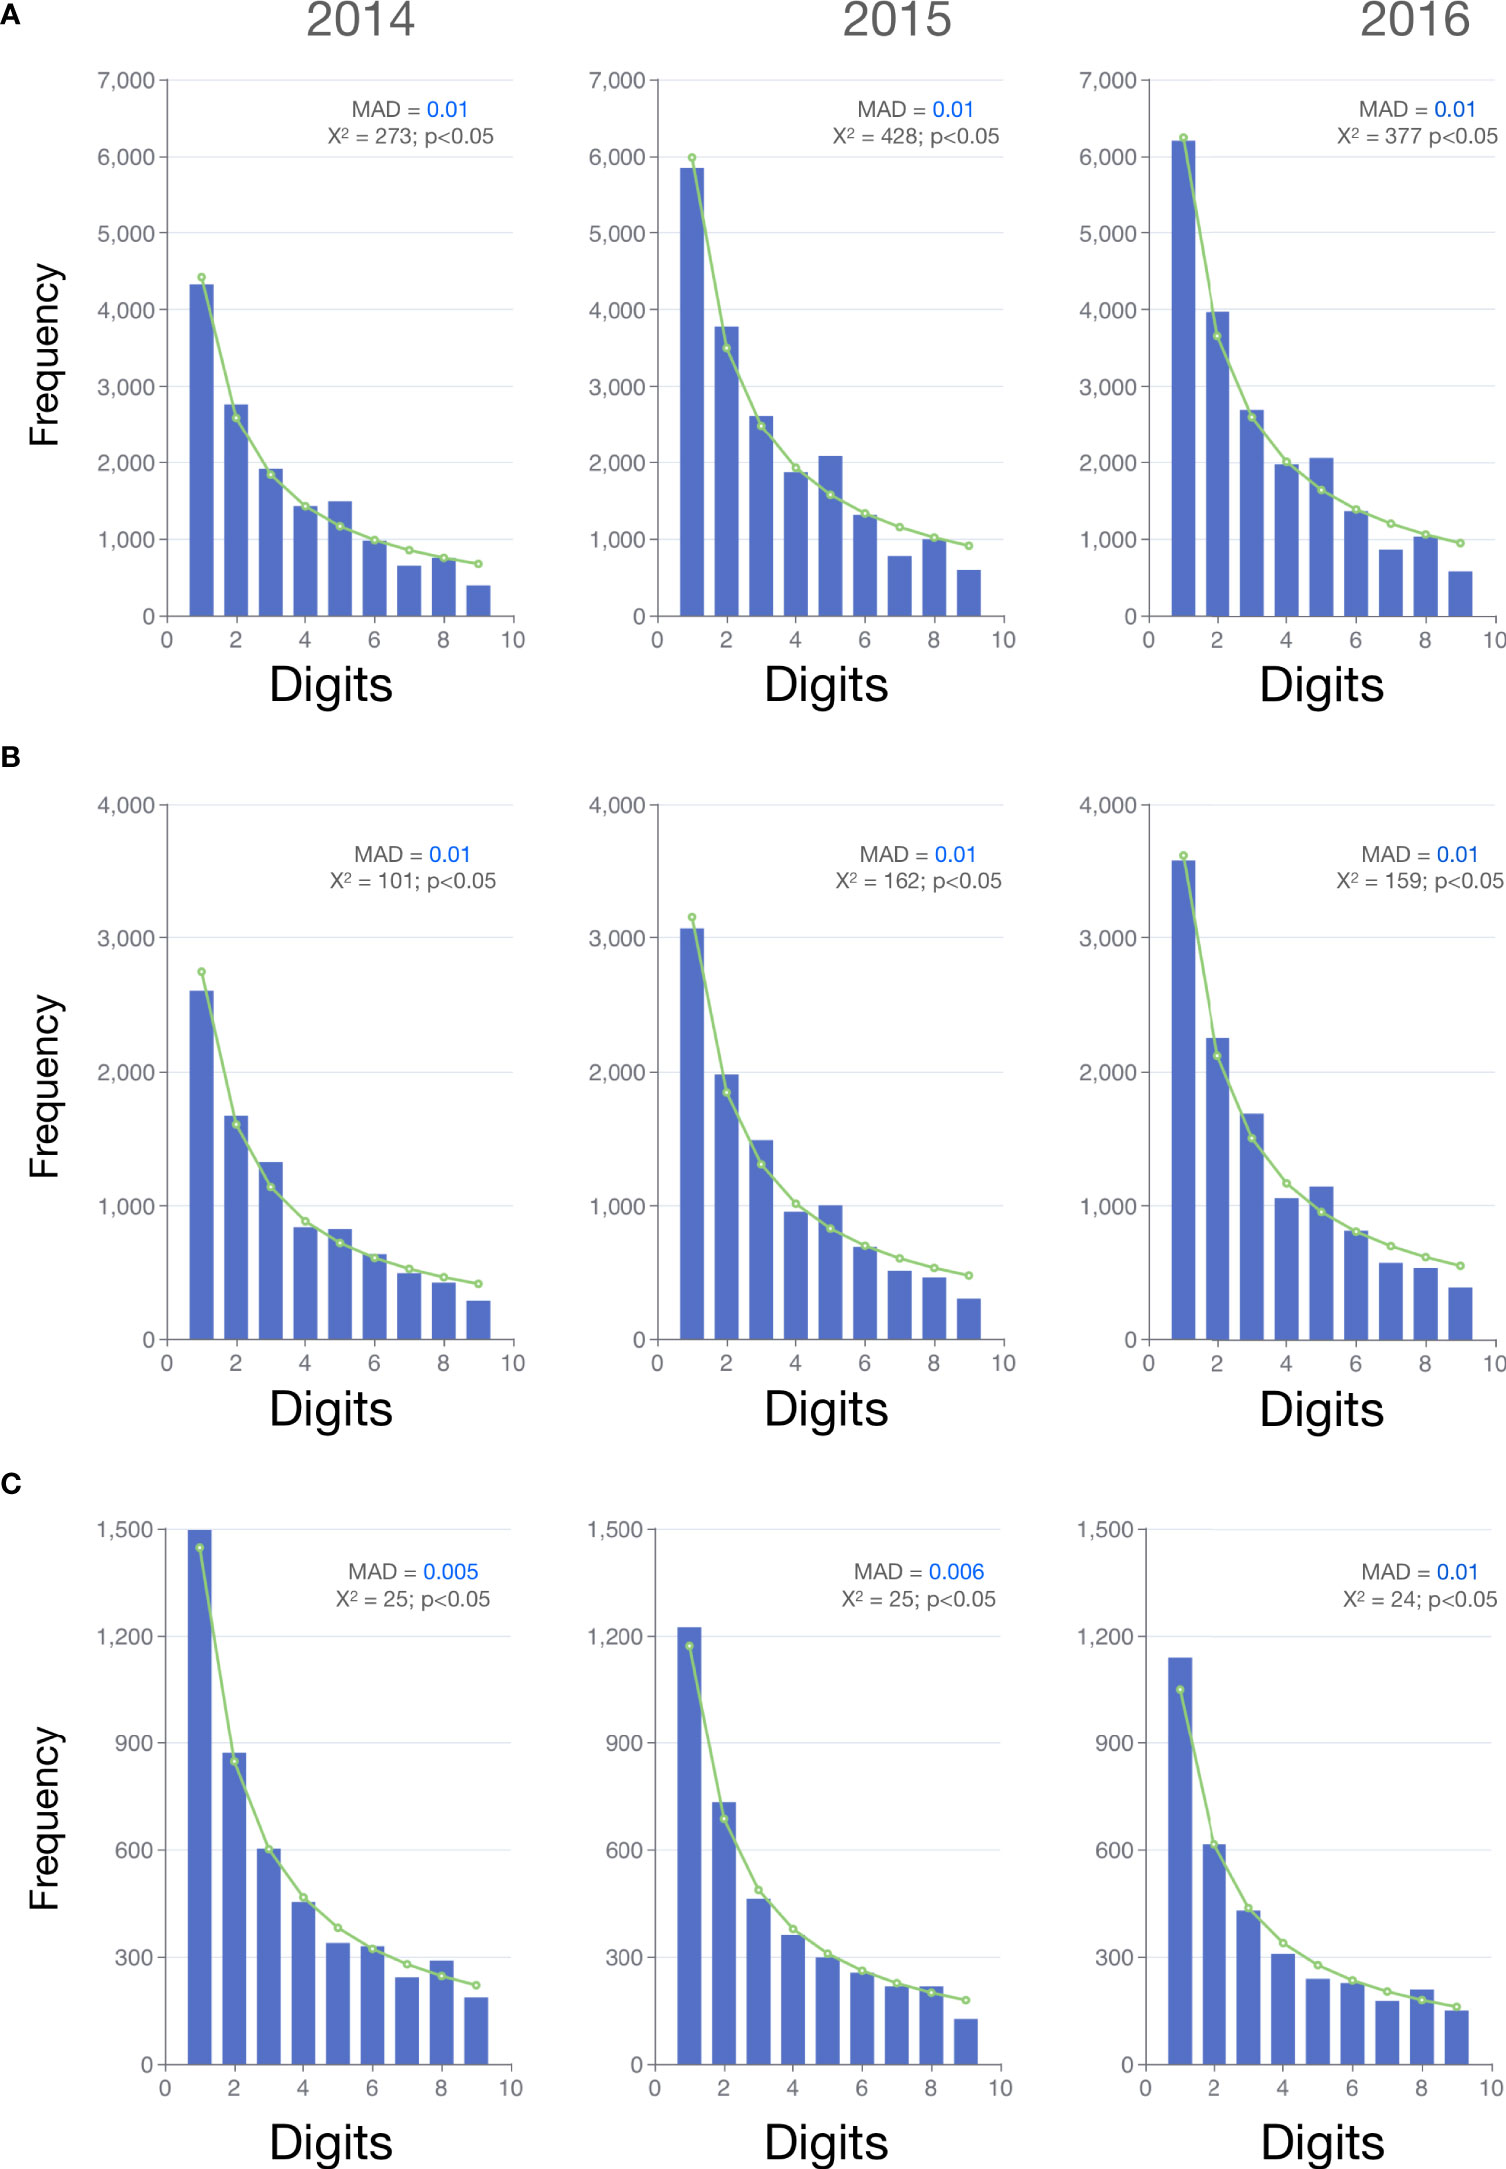
Figure 9 Monthly data frequency distribution of the first digits of motorized canoes (A), non-motorized canoes (B), and motorized boats (C) (blue bars) and the expected Benford distribution (green line) for each of the study years. MAD values higher or equal to 0.015 are considered as not in conformity with Benford’s law (Nigrini, 2012).
Discussion
Data accuracy by Benford analysis: Reply to monitor and management
The knowledge of data accuracy at each location is essential to steer funds and resources, markedly for small-scale fisheries, which target multiple species and the landings of which are scattered over large areas and distant harbors, making data collection burdensome (De Graaf et al., 2015). Developing countries on the Atlantic Ocean are prone to concentrate knowledge-poor fisheries in the poorest segments of societies. Loopholes in data gathering and insertion in databases, shortage in long-term monitoring programs, and the lack of personnel overtly contribute to the lack of reliable information (Andrew et al., 2007; Franco et al., 2020).
In the Southwest Atlantic, 59% of the assessed stocks are known to be unsustainably exploited, and there is little information to support fisheries management and to understand the effect of climate change on fish and fisheries (FAO, 2020; Franco et al., 2020; Van Anrooy et al., 2022). In near-shore southeast Brazil, for instance, a “tropicalization” of fish fauna has been reported, a phenomenon that may be underreported in other regions by data gaps or uncertain data (Araújo et al., 2018). Such a phenomenon requires management decisions as to whether the budget should be directed to ports/vessels reporting the data accurately or whether efforts (and funds) should be allocated to improve the quality of the likely biased data. These are hard-fought decisions that may be guided by Benford analysis. If fishing managers aim to improve the information recorded, the use of Benford analysis unveils where data are flawed and provides guidance on where to focus efforts to improve data gathering and monitoring.
As fishing data are regularly reported during landings in dock areas, amid the trade of catches, and after fishing hours at sea, multiple factors may affect data collection and accuracy. Despite the paramount meaning of fisheries for food security, in many developing countries, fisheries remain data-limited (Hilborn et al., 2020), lacking landing monitoring programs (Berkes et al., 2014) and mandatory fishery statistics (Pitcher, 2004). Consequently, fishing data collection in most of these countries consistently relies on data filled by fishers or collected by local monitors somehow trained to cooperate in short-lived independent projects (Andrew et al., 2007; Carvalho et al., 2009; Le Fur et al., 2011). Under these conditions, inaccurate short-term memory, rough estimates, and limited infrastructure are deterrents for fishers to provide, monitor, and extract good information before the fish is marketed. However, there is evidence that the higher the catches, the more reliable the data (Damasio et al., 2015). Also, those high catches reflect more comprehensive fishing infrastructure development (Hilborn et al., 2020).
In this paper, the assessment of daily catch per year (raw data) revealed at which ports inaccurate data were most frequently recorded (farther ones), which vessels regularly provided misinformed records (non-motorized canoes), and to which species likely biased data are often recorded. Overall, the boat type’s data with the higher catches were the only category to conform to Benford’s distribution in all the years, supporting such evidence (Damasio et al., 2015). Yet, for those boat types that did not fit Benford’s distribution (motorized and non-motorized canoes), there was a positive correlation between catch and the number of likely biased data (places with higher catches have more likely biased data). Thus, the catch amount may not be directly related to the data reliability. Unlike canoes, motorized boats use more advanced gear and propulsion technology. Also, motorized boats have higher storage capacity, which explains the more accurate data and higher catches. Conversely, some canoes had no scales, and the weight estimates relied only on the fisher’s experience and eye estimation. Therefore, the relationship between catch size and data reliability may be spurious. The boat’s gear technology is probably a more important consideration for obtaining accurate reports.
In addition, remote harbors are outliers in the positive correlation between catch and likely biased data. These harbors do not dock more vessels or obtain higher production, but they supply poorer information of fish species usually caught, reporting similar monthly catch values among vessels. Also, they are harder to visit or monitor and are explicitly used by non-motorized boats. Between two and four remote harbors were identified as hot spots for misreporting data accounting for more than 50% of those data (L23 and L7 for non-motorized canoes and L4, L8, L16, and L27 for motorized canoes). The most reported as likely biased species were Macrobrachium spp., G. cruentata, Ucides cordatus, and Callinectes danes. Indeed, it makes sense since the estimate for these species was usually based on fisher’s eye evaluation because of their low catch rates (information provided by the project managers).
The percentage of suspect data for each harbor did not change among years for non-motorized canoes (~30%). However, for motorized canoes, Benford analysis indicated an improvement in the monitoring system. Likely biased data reduced from 30% in 2014 to 12% in 2015, reaching total conformity in 2016. Indeed, monitoring quality can be improved over the years by enhancing social engagement, infrastructure, and observer’s experiences (Freed et al., 2016; Sbragaglia et al., 2022). However, since most likely biased data from non-motorized canoes are from remote harbors, it is harder to improve monitoring quality over time. Conversely, in the case of motorized canoes, managers were able to reduce the likely biased data from 2014 to 2015 and achieve full acceptable conformity in 2016, underlining the potential of Benford analysis for tracking data quality over the monitoring period.
The overall findings indicated that 20% of landings data are somehow misinformed and related to low catches since such error represents up to 3% of the total catch over all boat types. Also, this error is concentrated in smaller and farther dock areas used precisely by non-motorized boats. The awareness provided by Benford analysis supplies a compelling point for improving the monitoring system and management decisions in remote harbors, for example, by delivering scales to fishers to weigh the production before landing.
Data fitting, prospects, and caveats of Benford analysis
Fisheries scientists and managers are constantly investigating the health of fish stocks, relying on many fishing datasets from different sources and levels of reliability. We applied Benford analysis to detect the accuracy of data from small-scale fishing as a strategy to enhance the chance for a clear understanding of the status of fish stocks. The monthly pooled data conformed better to Benford’s logarithmic distribution (skewed to the left and with the mean higher than the median) (Busta and Weinberg, 1998; Durtschi et al., 2004) than if applied to raw daily data, according to the MAD index. However, this does not mean that the monthly data are more suitable for management than the daily data. Instead, it is less appropriate because average values hide error trends and misinformed records. Benford analysis is not sensitive to work with this type of data, generating false-positive results. Furthermore, as the chi-squared test is not sensitive enough to large sample sizes (da Silva et al., 2017), it produces unreliable results when Benford’s distribution is applied to large datasets. Therefore, the temporal resolution of the data effects certainly influences the analysis performance and results produced.
Inspection of fishing data reliability is crucial. These data are unlikely to provide standardized observations with no bias, mainly when informed by fishers, and expecting otherwise is a false assumption critical to fisheries management (Strieder Philippsen et al., 2017). Furthermore, it is crucial to bear in mind that the pandemic COVID-19 circumstances affecting the world since 2020 reduced fishing activity (Bennett et al., 2020), reducing landing data collection. The implication of such an unprecedented period should be considered with caution when examining fishing data in pandemic years, to avoid duplicate or misreported data, inaccurate memories of catches, or misinterpretation of valid zeros.
Distortion in data gathering could be reduced by allowing fishers to register landings through technological tools, such as an app on a cell phone, even during the fishing trip. In addition, a digital transformation strategy could involve fishers, researchers, and managers to increase participation, share responsibility, and improve the quality of data reporting, automatically by fishers (Noleto-Filho et al., 2021). Also, Benford analysis can be an additional asset for the existing self-reporting applications such as Abalobi (https://abalobi.info), iAngler (Jiorle et al., 2016), eCatch (Merrifield et al., 2019), and Shiny4SelfReport (Noleto-Filho et al., 2021), since it is an accessible method that can be applied directly to logbook data. Beyond, Benford analysis is a valuable detection tool of data accuracy for fisheries management that does not require any other data complement. The analysis provides a complete diagnostic for accessing data reliability (species, fisher, harbor), assisting in catching better quality data, improving fishery monitoring, and better informing management decisions.
However, Benford analysis is only indicative, being susceptible to producing false-negative and false-positive results. There is a chance, for example, that one group of collectors will be more rigorous than another, providing more accurate data regardless of the informant’s trustfulness. Likewise, in the dataset used here for Benford analysis, motorized boats, which have a more extensive commercial range, detain more attention and rigor by harbor supervisors, improving data-reported precision. Yet, Benford analysis does not precisely indicate fraud (Nigrini, 2012). Other methods like machine learning techniques or population models from field surveys are necessary for more accurate validations (Graham et al., 2009; Ivashchenko and Clapham, 2015; Di Minin et al., 2019; Mamula et al., 2020).
Data availability statement
The raw data supporting the conclusions of this article will be made available by the authors, without undue reservation.
Author contributions
EN-F, RA, and AC contributed to the conception and design of the study. MT-S organized the database. EN-F performed the statistical analysis. EN-F wrote the first draft of the manuscript. RA and AC wrote sections of the manuscript. All authors contributed to manuscript revision and read and approved the submitted version.
Funding
This study has received funding from the European Union’s Horizon 2020 research and innovation program under grant agreement number 817578. AC is grateful to a research productivity scholarship provided by the Brazilian National Council for Scientific and Technological Development (CNPq—No. 313334/2018-8). This study used data produced through the PMPDP performed by the UFS/PETROBRAS/FAPESE and demanded by the Brazilian Environmental Agency (IBAMA) in areas where there is oil and gas exploitation in the Sergipe-Alagoas Basin.
Conflict of interest
The authors declare that the research was conducted in the absence of any commercial or financial relationships that could be construed as a potential conflict of interest.
Publisher’s note
All claims expressed in this article are solely those of the authors and do not necessarily represent those of their affiliated organizations, or those of the publisher, the editors and the reviewers. Any product that may be evaluated in this article, or claim that may be made by its manufacturer, is not guaranteed or endorsed by the publisher.
Supplementary material
The Supplementary Material for this article can be found online at: https://www.frontiersin.org/articles/10.3389/fmars.2022.947503/full#supplementary-material
References
Andrew N. L., Béné C., Hall S. J., Allison E. H., Heck S., Ratner B. D. (2007). Diagnosis and management of small-scale fisheries in developing countries. Fish Fish. 8, 227–240. doi: 10.1111/j.1467-2679.2007.00252.x
Araújo F. G., Teixeira T. P., Guedes A. P. P., de Azevedo M. C. C., Pessanha A. L. M. (2018). Shifts in the abundance and distribution of shallow water fish fauna on the southeastern Brazilian coast: a response to climate change. Hydrobiologia 814, 205–218. doi: 10.1007/s10750-018-3537-8
Benford F. (1938). “The law of anomalous numbers.” Proceedings of the American philosophical society, vol. 78(4), pp. 551–72. JSTOR, Available at: http://www.jstor.org/stable/984802
Bennett N. J., Finkbeiner E. M., Ban N. C., Belhabib D., Jupiter S. D., Kittinger J. N., et al. (2020). The COVID-19 pandemic, small-scale fisheries and coastal fishing communities. Coast. Manage. 48, 336–347. doi: 10.1080/08920753.2020.1766937
Berkes F., Mahon R., McConney P. (2014). Managing small-scale fisheries: Alternative directions and methods (Ottawa: International Development Research Centre).
Busta B., Weinberg R. (1998). Using benford’s law and neural networks as a review procedure. Managerial Auditing J. 13, 356–366. doi: 10.1108/02686909810222375
Carvalho A. R., Williams S., January M., Sowman M. (2009). Reliability of community-based data monitoring in the olifants river estuary (South Africa). Fish. Res. 96, 119–128. doi: 10.1016/j.fishres.2008.08.017
Cinelli C. (2018). Benford.analysis: Benford analysis for data validation and forensic analytics. Available at: R package version 0.1.5, https://CRAN.R-project.org/package=benford.analysis.
Damasio L., de M. A., Lopes P. F. M., Guariento R. D., Carvalho A. R. (2015). Matching fishers’ knowledge and landing data to overcome data missing in small-scale fisheries. PloS One 10, e0133122. doi: 10.1371/journal.pone.0133122
da Silva A. C. C. D., Comin de Castilhos J., Pinheiro dos Santos E. A., Brondízio L. S., Bugoni L. (2010). Efforts to reduce sea turtle bycatch in the shrimp fishery in northeastern Brazil through a co-management process. Ocean Coast. Manage. 53, 570–576. doi: 10.1016/j.ocecoaman.2010.06.016
da Silva W. B., Travassos S.K. de M., Costa J.I. de F., Universidade Federal de Pernambuco, Brazil, Faculdade de Ciências Sociais Aplicadas, Brazil, and Tribunal de Contas do Estado de Pernambuco, Brazil (2017). Using the newcomb-benford law as a deviation identification method in continuous auditing environments: A proposal for detecting deviations over time. Rev. Contabilidade Finanças 28, 11–26. doi: 10.1590/1808-057x201702690
De Graaf G., Bartley D., Jorgensen J., Marmulla G. (2015). The scale of inland fisheries, can we do better? alternative approaches for assessment: ASSESSING THE SCALE OF INLAND FISHERIES. Fish. Manage. Ecol. 22, 64–70. doi: 10.1111/j.1365-2400.2011.00844.x
Di Minin E., Fink C., Hiippala T., Tenkanen H. (2019). A framework for investigating illegal wildlife trade on social media with machine learning. Conserv. Biol. 33, 210–213. doi: 10.1111/cobi.13104
Durtschi C., Hillison W., Pacini C. (2004). The effective use of benfords law to assist in detecting fraud in accounting data. J. Forensic Accounting 5, 17–34.
FAO (2020). The state of world fisheries and aquaculture (SOFIA). 2020:244 p. (Rome, Italy: FAO). doi: 10.4060/ca9229en
Franco B. C., Defeo O., Piola A. R., Barreiro M., Yang H., Ortega L., et al. (2020). Climate change impacts on the atmospheric circulation, ocean, and fisheries in the southwest south Atlantic ocean: a review. Climatic Change 162, 2359–2377. doi: 10.1007/s10584-020-02783-6
Freed S., Dujon V., Granek E. F., Mouhhidine J. (2016). Enhancing small-scale fisheries management through community engagement and multi-community partnerships: Comoros case study. Mar. Policy 63, 81–91. doi: 10.1016/j.marpol.2015.10.004
Graham S. D. J., Hasseldine J., Paton D. (2009). Statistical fraud detection in a commercial lobster fishery. New Z. J. Mar. Freshw. Res. 43, 457–463. doi: 10.1080/00288330909510014
Hilborn R., Amoroso R. O., Anderson C. M., Baum J. K., Branch T. A., Costello C., et al. (2020). Effective fisheries management instrumental in improving fish stock status. Proc. Natl. Acad. Sci. 117, 2218–2224. doi: 10.1073/pnas.1909726116
Ivashchenko Y. V., Clapham P. J. (2015). What’s the catch? validity of whaling data for Japanese catches of sperm whales in the north pacific. R. Soc. Open Sci. 2, 150177. doi: 10.1098/rsos.150177
Jiorle R. P., Ahrens R. N. M., Allen M. S. (2016). Assessing the utility of a smartphone app for recreational fishery catch data. Fisheries 41, 758–766. doi: 10.1080/03632415.2016.1249709
Joannes-Boyau R., Bodin T., Scheffers A., Sambridge M., May S. M. (2015). Using benford’s law to investigate natural hazard dataset homogeneity. Sci. Rep. 5, 12046. doi: 10.1038/srep12046
Kossovsky A. E. (2021). On the mistaken use of the chi-square test in benford’s law. Stats 4, 419–453. doi: 10.3390/stats4020027
Le Fur J., Guilavogui A., Teitelbaum A. (2011). Contribution of local fishermen to improving knowledge of the marine ecosystem and resources in the republic of Guinea, West Africa. Can. J. Fish. Aquat. Sci. 68, 1454–1469. doi: 10.1139/f2011-061
Mamula A., Thomas-Smyth A., Speir C., Kosaka R., Pearson D. (2020). Matching vessel monitoring system data to trawl logbook and fish ticket data for the pacific groundfish fishery Vol. 76 (Santa Cruz, CA, USA: US Department of Commerce, NOAA). Technical Memorandum NMFS-SWFSC-623. doi: 10.25923/7aq1-af45
Merrifield M., Gleason M., Bellquist L., Kauer K., Oberhoff D., Burt C., et al. (2019). eCatch: Enabling collaborative fisheries management with technology. Ecol. Inf. 52, 82–93. doi: 10.1016/j.ecoinf.2019.05.010
Newcomb S. (1881). Note on the frequency of use of the different digits in natural numbers. Am. J. Mathematics 4, 39. doi: 10.2307/2369148
Nigrini M. J. (2012). Benford’s law: Applications for forensic accounting, auditing, and fraud detection (Hoboken, NJ, USA: John Wiley & Sons, Inc.). doi: 10.1002/9781119203094
Noleto-Filho E. M., Angelini R., Steenbeek J., Carvalho A. R. (2021). New, flexible and open-source fisheries self-reporting app: The Shiny4SelfReport. SoftwareX 16, 100843. doi: 10.1016/j.softx.2021.100843
Pitcher T. J. (2004) Back to the future : advances in methodology for modelling and evaluating past ecosystems as future policy goals. Available at: https://open.library.ubc.ca/soa/cIRcle/collections/facultyresearchandpublications/52383/items/1.0074780.
Pröger L., Griesberger P., Hackländer K., Brunner N., Kühleitner M. (2021). Benford’s law for telemetry data of wildlife. Stats 4, 943–949. doi: 10.3390/stats4040055
Ramos J., Caetano M., Himes-Cornell A., Santos M. N. (2017). Stakeholders’ conceptualization of offshore aquaculture and small-scale fisheries interactions using a Bayesian approach. Ocean Coast. Manage. 138, 70–82. doi: 10.1016/j.ocecoaman.2017.01.008
R Development Core Team, R (2016) R: The r project for statistical computing. Available at: https://www.r-project.org/.
Sambridge M., Tkalčić H., Jackson A. (2010). Benford’s law in the natural sciences: BENFORD’S LAW. Geophysical Res. Lett. 37, n/a–n/a. doi: 10.1029/2010GL044830
Sbragaglia V., Espasandín L., Coco S., Felici A., Correia R. A., Coll M., et al. (2022). Recreational angling and spearfishing on social media: insights on harvesting patterns, social engagement and sentiments related to the distributional range shift of a marine invasive species. Rev. Fish Biol. Fish. 32, 687–700. doi: 10.1007/s11160-022-09699-7
Silva S. L. R. D., Santos R. D. C., Costa R. C., Hirose G. L. (2019). Growth and population structure of the seabob shrimp xiphopenaeus kroyeri (Decapoda: Penaeidae) on the continental shelf of sergipe, Brazil. J. Mar. Biol. Assoc. United Kingdom 99, 81–92. doi: 10.1017/S0025315417002041
Strieder Philippsen J., Minte-Vera C. V., Okada E. K., Carvalho A. R., Angelini R. (2017). Fishers’ and scientific histories: an example of consensus from an inland fishery. Mar. Freshw. Res. 68, 980. doi: 10.1071/MF16053
Suuronen P., Gilman E. (2020). Monitoring and managing fisheries discards: New technologies and approaches. Mar. Policy 116, 103554. doi: 10.1016/j.marpol.2019.103554
Van Anrooy R., Espinoza Córdova F., Japp D., Valderrama D., Gopal Karmakar K., Lengyel P., et al. (2022). World review of capture fisheries and aquaculture insurance 2022 (Rome, Italy: FAO). doi: 10.4060/cb9491en
Wickham H. (2016). ggplot2: Elegant graphics for data analysis (New York: Springer-Verlag). Available at: https://ggplot2.tidyverse.org.
Keywords: fisheries management, data bias, landing monitoring, Brazil, auditing
Citation: Noleto-Filho EM, Carvalho AR, Thomé-Souza MJF and Angelini R (2022) Reporting the accuracy of small-scale fishing data by simply applying Benford’s law. Front. Mar. Sci. 9:947503. doi: 10.3389/fmars.2022.947503
Received: 18 May 2022; Accepted: 26 July 2022;
Published: 02 September 2022.
Edited by:
Lynne Jane Shannon, University of Cape Town, South AfricaReviewed by:
Camilla Novaglio, Oceans and Atmosphere (CSIRO), AustraliaTing-Chun Kuo, National Taiwan Ocean University, Taiwan
Copyright © 2022 Noleto-Filho, Carvalho, Thomé-Souza and Angelini. This is an open-access article distributed under the terms of the Creative Commons Attribution License (CC BY). The use, distribution or reproduction in other forums is permitted, provided the original author(s) and the copyright owner(s) are credited and that the original publication in this journal is cited, in accordance with accepted academic practice. No use, distribution or reproduction is permitted which does not comply with these terms.
*Correspondence: Eurico Mesquita Noleto-Filho, ZXVyaWNvbm9sZXRvQGhvdG1haWwuY29t