 Lian E. Kwong
 Alexis A. Bahl
 Evgeny A. Pakhomov
- 1Department of Earth, Ocean and Atmospheric Sciences, University of British Columbia, Vancouver, BC, Canada
- 2Institute for the Oceans and Fisheries, University of British Columbia, Vancouver, BC, Canada
- 3Hakai Institute, Heriot Bay, BC, Canada
Micronekton were sampled off the southwest coast of Oahu in October of 2004 as part of the North Pacific Marine Sciences Organization (PICES) Micronekton Sampling Gear Intercalibration experiment (MIE-1). The initiative employed three different micronekton sampling gears: the Cobb Trawl, Isaacs–Kidd midwater trawl (IKMT), and Hokkaido University frame trawl (HUFT). Micronekton catches from the three sampling gears were used to quantify the rates of active carbon transport. We evaluate the differences in total active carbon transport assessed using the data collected by the three gears, with a particular emphasis on taxa- and length-specific differences across gears. The estimates of total active carbon transport derived from the HUFT were significantly lower than those derived from the IKMT. We detected no significant difference between estimates derived using the IKMT and Cobb and the Cobb and HUFT. Dominant groups contributing to active carbon transport varied across sampling gears (Cobb: myctophids and cephalopods; HUFT: decapods and stomatopods; IKMT: cephalopods, myctophids, and decapods); however, no significant differences in the contribution of individual taxa to active carbon transport across sampling gears were detected (e.g., the myctophid active carbon transport contribution for the Cobb was not significantly different from that of the IKMT). Pairwise ratios revealed size-specific differences in the contribution to total flux across gears. As expected, the HUFT and IKMT estimates of active carbon transport were higher for smaller size classes, while estimates from the Cobb were more evenly distributed across size classes. These findings suggest that the differences in total active carbon transport from the three sampling gears are driven primarily by size-based sampling biases, which produce significant differences in biomass estimates. This study provides a foundation upon which future active carbon transport studies may be adjusted to address sampling gear biases.
1 Introduction
The world’s oceans play a key role in global carbon cycling, transporting CO2 from the atmosphere into the deep ocean actively and passively (Sabine et al., 2004). Approximately 2.5 ± 0.5 PgCyr-1 of atmospheric CO2 is absorbed into the ocean’s surface by way of diffusion, which is roughly 27% of the total anthropogenic carbon emissions (Andres et al., 2013). This CO2 is then transported to the deep ocean by way of the lipid pump (e.g., organismal seasonal vertical migration where carbon-rich lipids accumulate at depth), solubility pump (e.g., vertical mixing), and biological pump (e.g., organismal consumption and remineralization of particulate organic carbon; Boyd et al., 2019). The latter involves uptake by phytoplankton during photosynthesis to produce organic and calcium carbonate particles, which can then be transported to the deep ocean by gravitational settling (e.g., passive carbon transport) or during animal diel vertical migrations (DVMs; referred to as active carbon transport) (Broecker, 1983; Volk and Hoffert, 1985; Steinberg et al., 2000). Mesopelagic ecosystems rely heavily on DVM-mediated active carbon transport to accelerate the redistribution of biogeochemical properties (e.g., nutrients, carbon, and oxygen) to depth (Drazen and Sutton, 2017); however, key knowledge gaps remain to be resolved.
Micronekton—fishes, cephalopods, and crustaceans ranging in size from 20 to 100 mm (Brodeur et al., 2005)—are active swimmers found throughout the world’s midwater pelagic zone that can undergo extensive DVMs (Hernández-León et al., 2019; Cotté et al., 2022). After feeding in the highly productive surface waters (0–200-m depth) at night, some micronekton migrate to the mesopelagic zone (200–1,000 m; Baird et al., 1975; Kaartvedt et al., 2012; Irigoien et al., 2014) during the day where they reside (Brodeur et al., 2005; Kloser et al., 2009; Young et al., 2015) and release metabolized materials through respiration, excretion, gut flux, and mortality (Baird et al., 1975; Clarke, 1983; Longhurst et al., 1990). Due to their long gut passage time (4–10 h; Pakhomov et al., 1996), the excreted gut contents at depth (Kobari et al., 2008) are hypothesized to support deep benthos food supply and demand (Drazen & Sutton, 2016). However, most past carbon-export-focused studies ignore active carbon transport and solely report on the direct estimates of passive export retained from sediment traps, thorium disequilibrium techniques, and/or underwater imaging systems (Falkowski et al., 2003; Davison et al., 2013; Aumont et al., 2018). When active carbon transport is included, the focus has been on zooplankton rather than micronekton (Longhurst et al., 1990; Zhang & Dam, 1997; Steinberg et al., 2008). This has the potential of underestimating the global active carbon flux by 18%, as predicted by the modeling study of Aumont et al. (2018), which includes an explicit description of micronekton migration.
Recently referred to as a “black box” and mechanistic nescience in our assessment of the biological pump (Hernández-León et al., 2019), much uncertainty in active carbon estimates originates from the varying estimates of micronekton biomass (Kaartvedt et al., 2012) suggested to be underestimated by a factor of ~2.4 (Anderson et al., 2018; Dornan et al., 2022) to sometimes up to an order of magnitude (Irigoien et al., 2014). This is because biomass data are primarily collected with acoustic and/or net-sampling methods prone to selectivity and catchability biases (Kloser et al., 2009). For nets, the mesh size and towing speed determine the size class sampled (i.e., size-selective bias), while patchy species distribution, net avoidance, and limited spatial resolution inherent with net sampling introduce catchability bias (Kloser et al., 2009). Acoustic methods have provided a viable, cost-effective solution for ground-truthing in situ data (Stanton et al., 1996), in which the backscattering layer intensity is reflected to produce an echo-integration biomass estimate (Kloser et al., 2009). However, the effectiveness of acoustics in estimating micronekton biomass is reliant on the target strength criteria adjustments that distinguish between taxa (Kloser et al., 2002; Davison et al., 2015). This is evident for undersampled groups such as siphonophores, which reflect an increased target strength when insonified at 38 kHz leading to increased resonance on echograms and an unreliable measure of biomass (Proud et al., 2019). This, in turn, requires the knowledge of micronekton swimbladder morphology due to the intra- and interspecific variability found across species (Marshall, 1960; Dornan et al., 2019). Without specific target strength information, backscatter data are converted to biomass based on the species sampled with the nets (Klevjer et al., 2019). Considering that nets underestimate the actual micronekton biomass by a factor of 5–58 (Kloser et al., 2009), the bias becomes cyclical because the net data will only reflect the sampled size class, which is dependent on the net type used. Despite new sampling techniques (e.g., eDNA and optical devices), these inherent limitations have resulted in uncertain estimates of actual micronekton biomass that remain challenging to compare spatially and temporally (Dornan et al., 2022), thereby producing variable active carbon transport estimates.
Discrepancies are further compounded when particular fluxes (e.g., respiration, excretion, gut, and mortality or migratory) specific to active carbon transport estimates are excluded, and/or individual groups or sizes of animals are not represented, rendering the allometrically derived physiological flux estimates wide-ranging, as has been the case with previous studies (Zhang and Dam, 1997; Kobari et al., 2008; Darnis and Fortier, 2012; Davison et al., 2013; Ariza et al., 2015; Pakhomov et al., 2018; Figure 1). The evidence of this was found when consolidating all past studies (e.g., 13 in total) that have focused on micronekton active carbon transport (Figure 1). Specifically, there is significant variability in the net types used, as well as variance in the fluxes considered when estimating active carbon transport (see Section 4.1). In fact, it is more common for studies to estimate two-to-three rate fluxes to look at the entire micronekton community rather than account for all five (Figure 1).
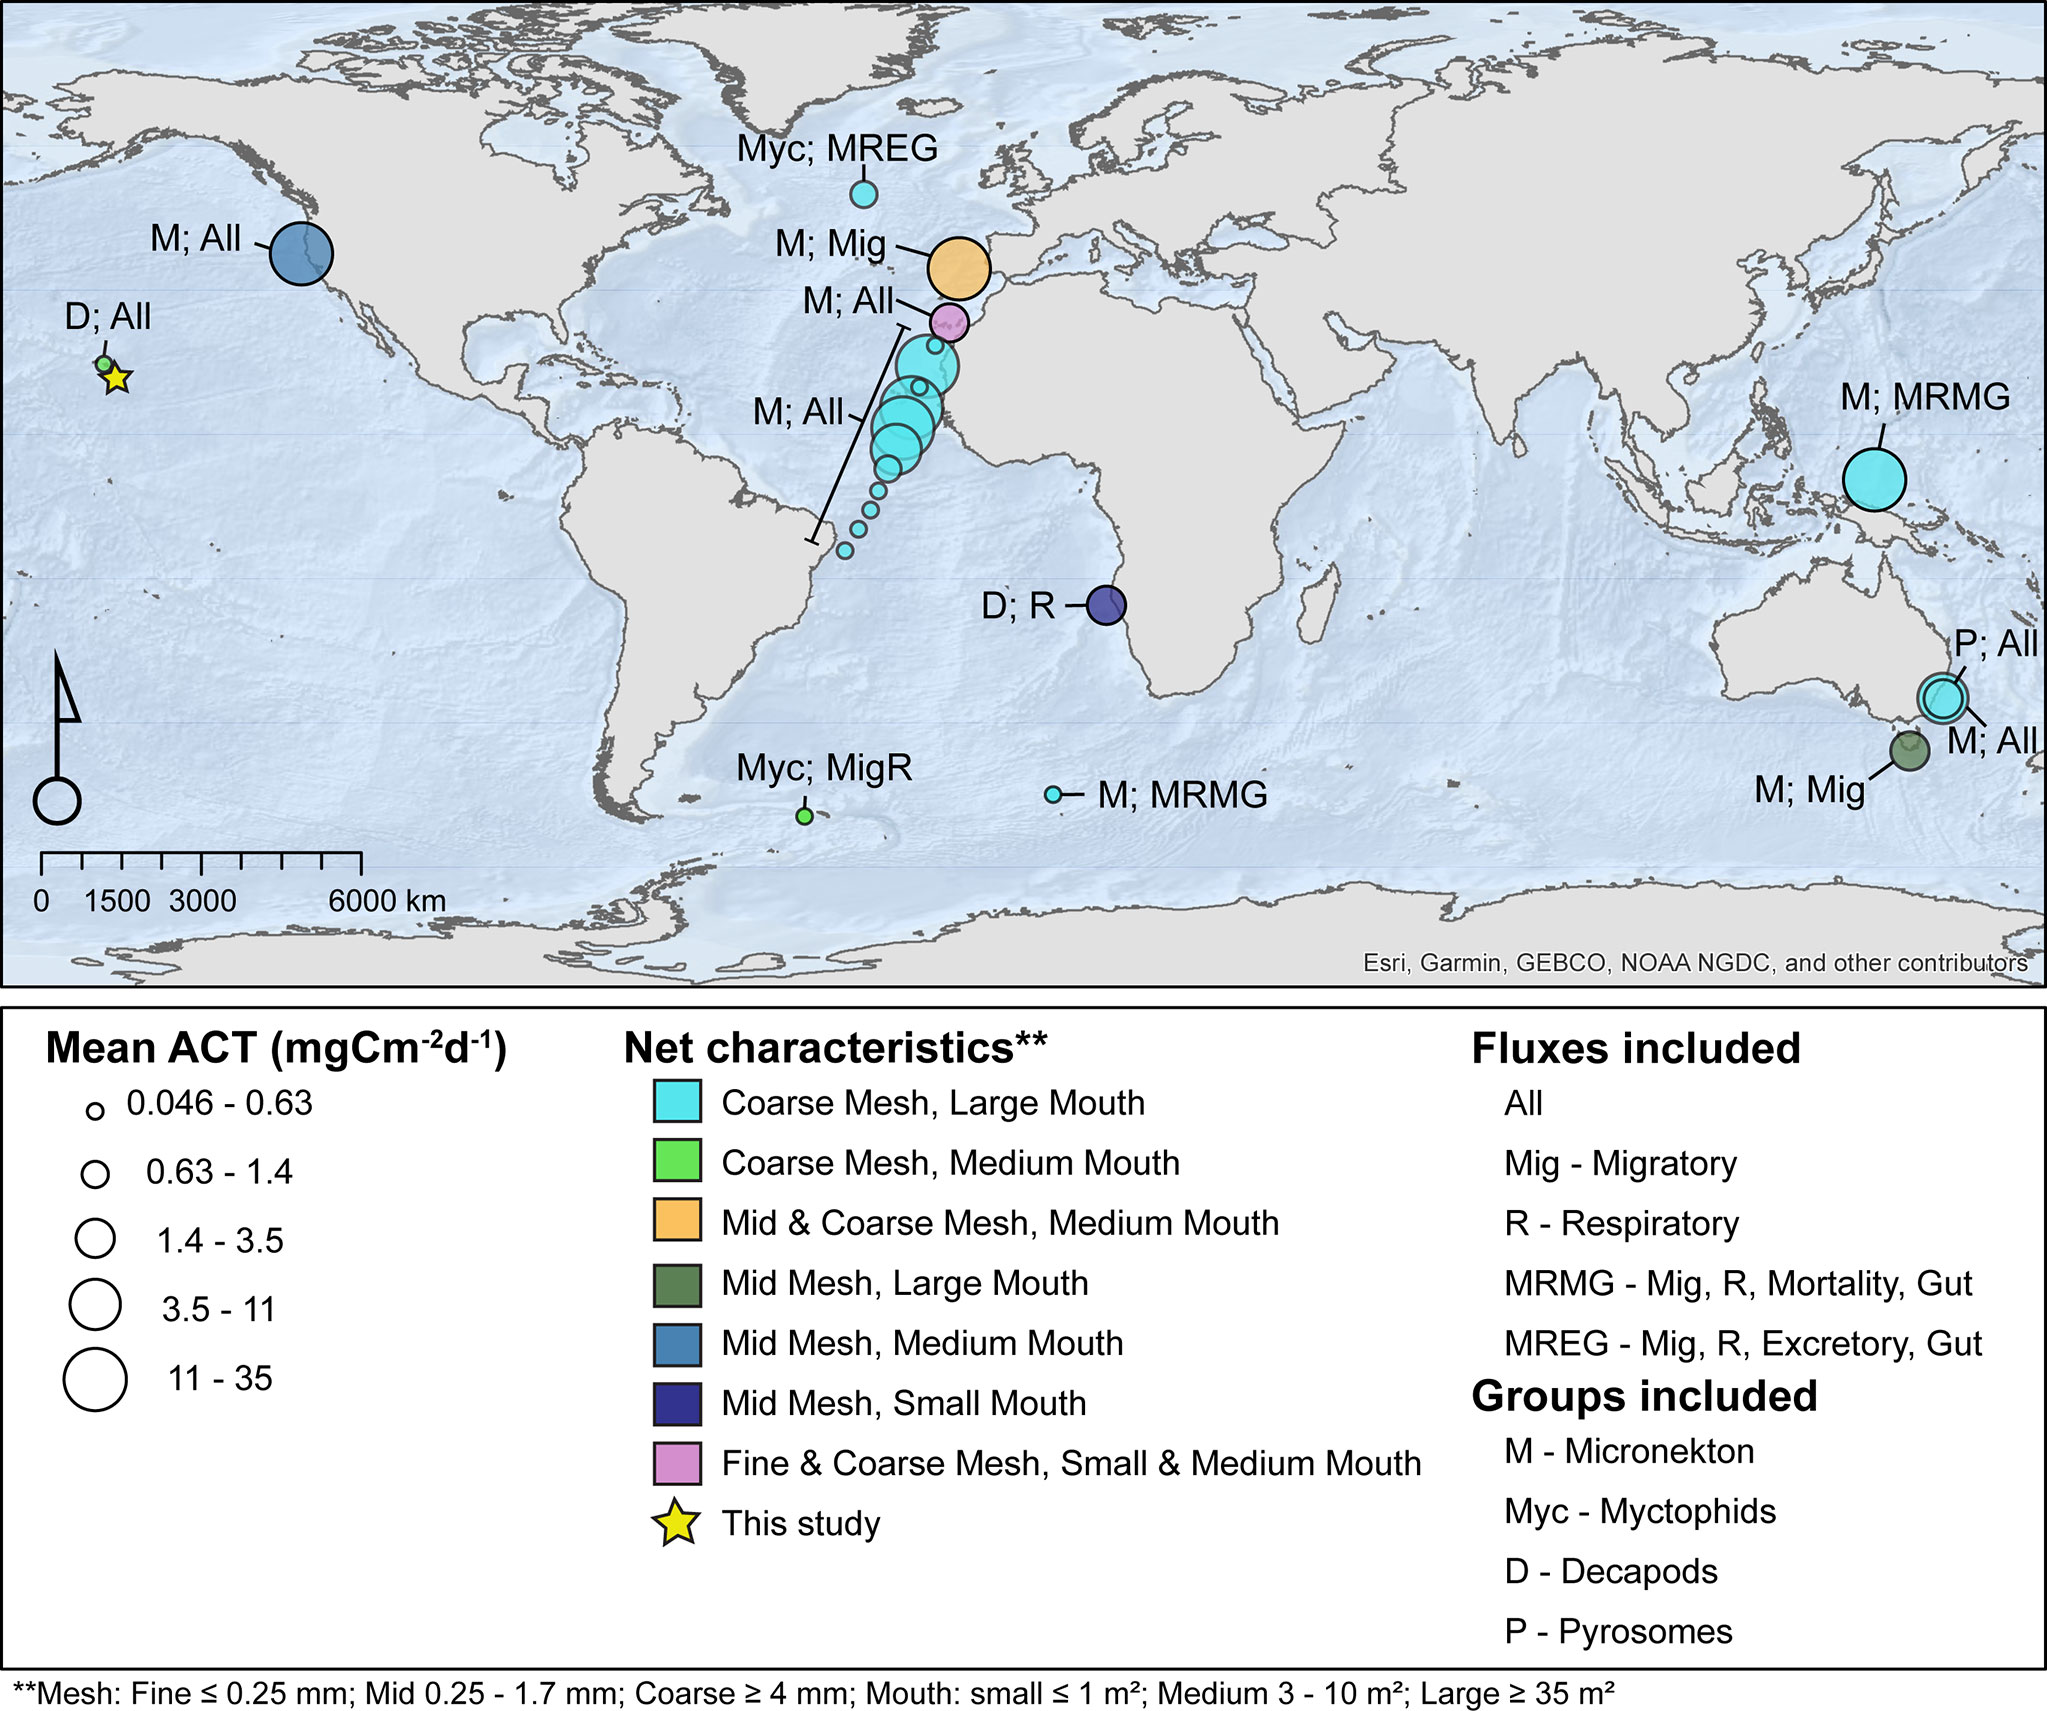
Figure 1 Summary of past micronekton active carbon transport (ACT) studies globally (N = 12) where the size of symbol indicates total flux, color indicates net characteristics (i.e., the mesh and mouth size of the sampling gear), and fluxes and groups included are indicated with letters. Nets with two mesh and/or two mouth sizes indicate that two different sampling gears were used. Williams and Koslow, 1997; Angel and Pugh, 2000; Hidaka et al., 2001; Davison et al., 2013; Schukat et al., 2013; Hudson et al., 2014; Ariza et al., 2015; Pakhomov et al., 2018; Belcher et al., 2019; Henschke et al., 2019; Hernández-León et al., 2019 (the study includes multiple stations), Kwong et al., 2020; Cotté et al., 2022.
Considering the structure of pelagic food webs is largely size dependent (Sheldon et al, 1977; Sheldon et al., 1972; Platt and Denman, 1977a; Silvert and Trevor, 1978); an additional approach to estimating micronekton active carbon transport includes size spectra, a size-based approach, as explored in Kwong et al. (2020). Results have shown that the size spectra shape (i.e., intercept and slope) can be used to determine ecological rates (i.e., respiration, mortality, excretion, growth, and gut flux) for whole communities pertaining to active carbon flux (Zhou and Huntley, 1997; Kerr and Dickie, 2001; Zhou, 2006; Zhou et al., 2010). A feature termed the “Biomass Spectra Theory,” in which the abundance or normalized biomass of organisms is plotted against the organism size (e.g., length/biomass in equal logarithmic size bins) and exhibits a linear relationship with a slope close to -1. Previous studies have reported changes in microzooplankton size spectra during DVM (Rodriguez and Mullin, 1986a, RodriguezMullin, 1986b, Thompson et al., 2013), reporting less negative slopes (closer to 0) during DVM and suggesting that larger zooplankton move into the epipelagic zone during the night. Suthers et al. (2006) suggested that myctophids and gonostomatids, which numerically dominate the mesopelagic zone, facilitate a steepening of the zooplankton biomass size spectra by preferentially preying on larger zooplankton (>0.2 mg). As such, size-based approaches provide a relatively straightforward approach by which the active carbon flux can be estimated.
Here, we derive micronekton-species estimates of active carbon transport for three different net types (also referred to herein as sampling gears) to show where discrepancies lie and illustrate how a size-based approach can produce a promising intercalibration reconstruction method. This paper builds on the findings of Kwong et al. (2018) and thus contributes further to the North Pacific Marine Science Organization (PICES) intercalibration experiments conducted between 2004 and 2007 (Pakhomov and Yamamura, 2010). The present study employs data from the first Micronekton Inter-calibration Experiment (MIE-1); however, two additional experiments were conducted. MIE-2 was conducted off Hokkaido Island, Japan, and employed two Multiple Opening/Closing Net and Environmental Sensing Systems (MOCNESS) with varying mouth and mesh sizes, two frame trawls with varying mouth and mesh sizes, a Matsuda–Oozeki–Hu Trawl (MOHT), and an otter trawl (Pakhomov and Yamamura, 2010). The final experiment, MIE-3, was conducted in the eastern Berring Sea and employed an MOHT and IKMT. This initiative provides a wealth of information on macrozooplankton and micronekton in the North Pacific and also highlights the importance of intercalibrating gears other than the three employed here.
Using data from MIE-1, we address the following questions: how do active carbon transport estimates vary by the net type used? What differences exist between the taxa-specific estimates of active carbon transport? Lastly, what is the length-specific relationship for mesopelagic active carbon transport estimates, if any? As there is a need for a better understanding of pelagic ecosystem services, the present study provides a foundation upon which future spatial and temporal comparisons of micronekton active carbon transport may be derived.
2 Methods
Specific field methods and sample processing are described in detail in Kwong et al. (2018) and briefly summarized below.
2.1 Field methods
Samples were collected in 2004 from 6 to 12 October, off the southwest coast of Oahu Island using the National Oceanic and Atmospheric Administration (NOAA) research ship Oscar Elton Sette (R/V Sette) (Figure 2). Three different micronekton sampling gears (Table 1) were used to conduct 53 successful net tows.
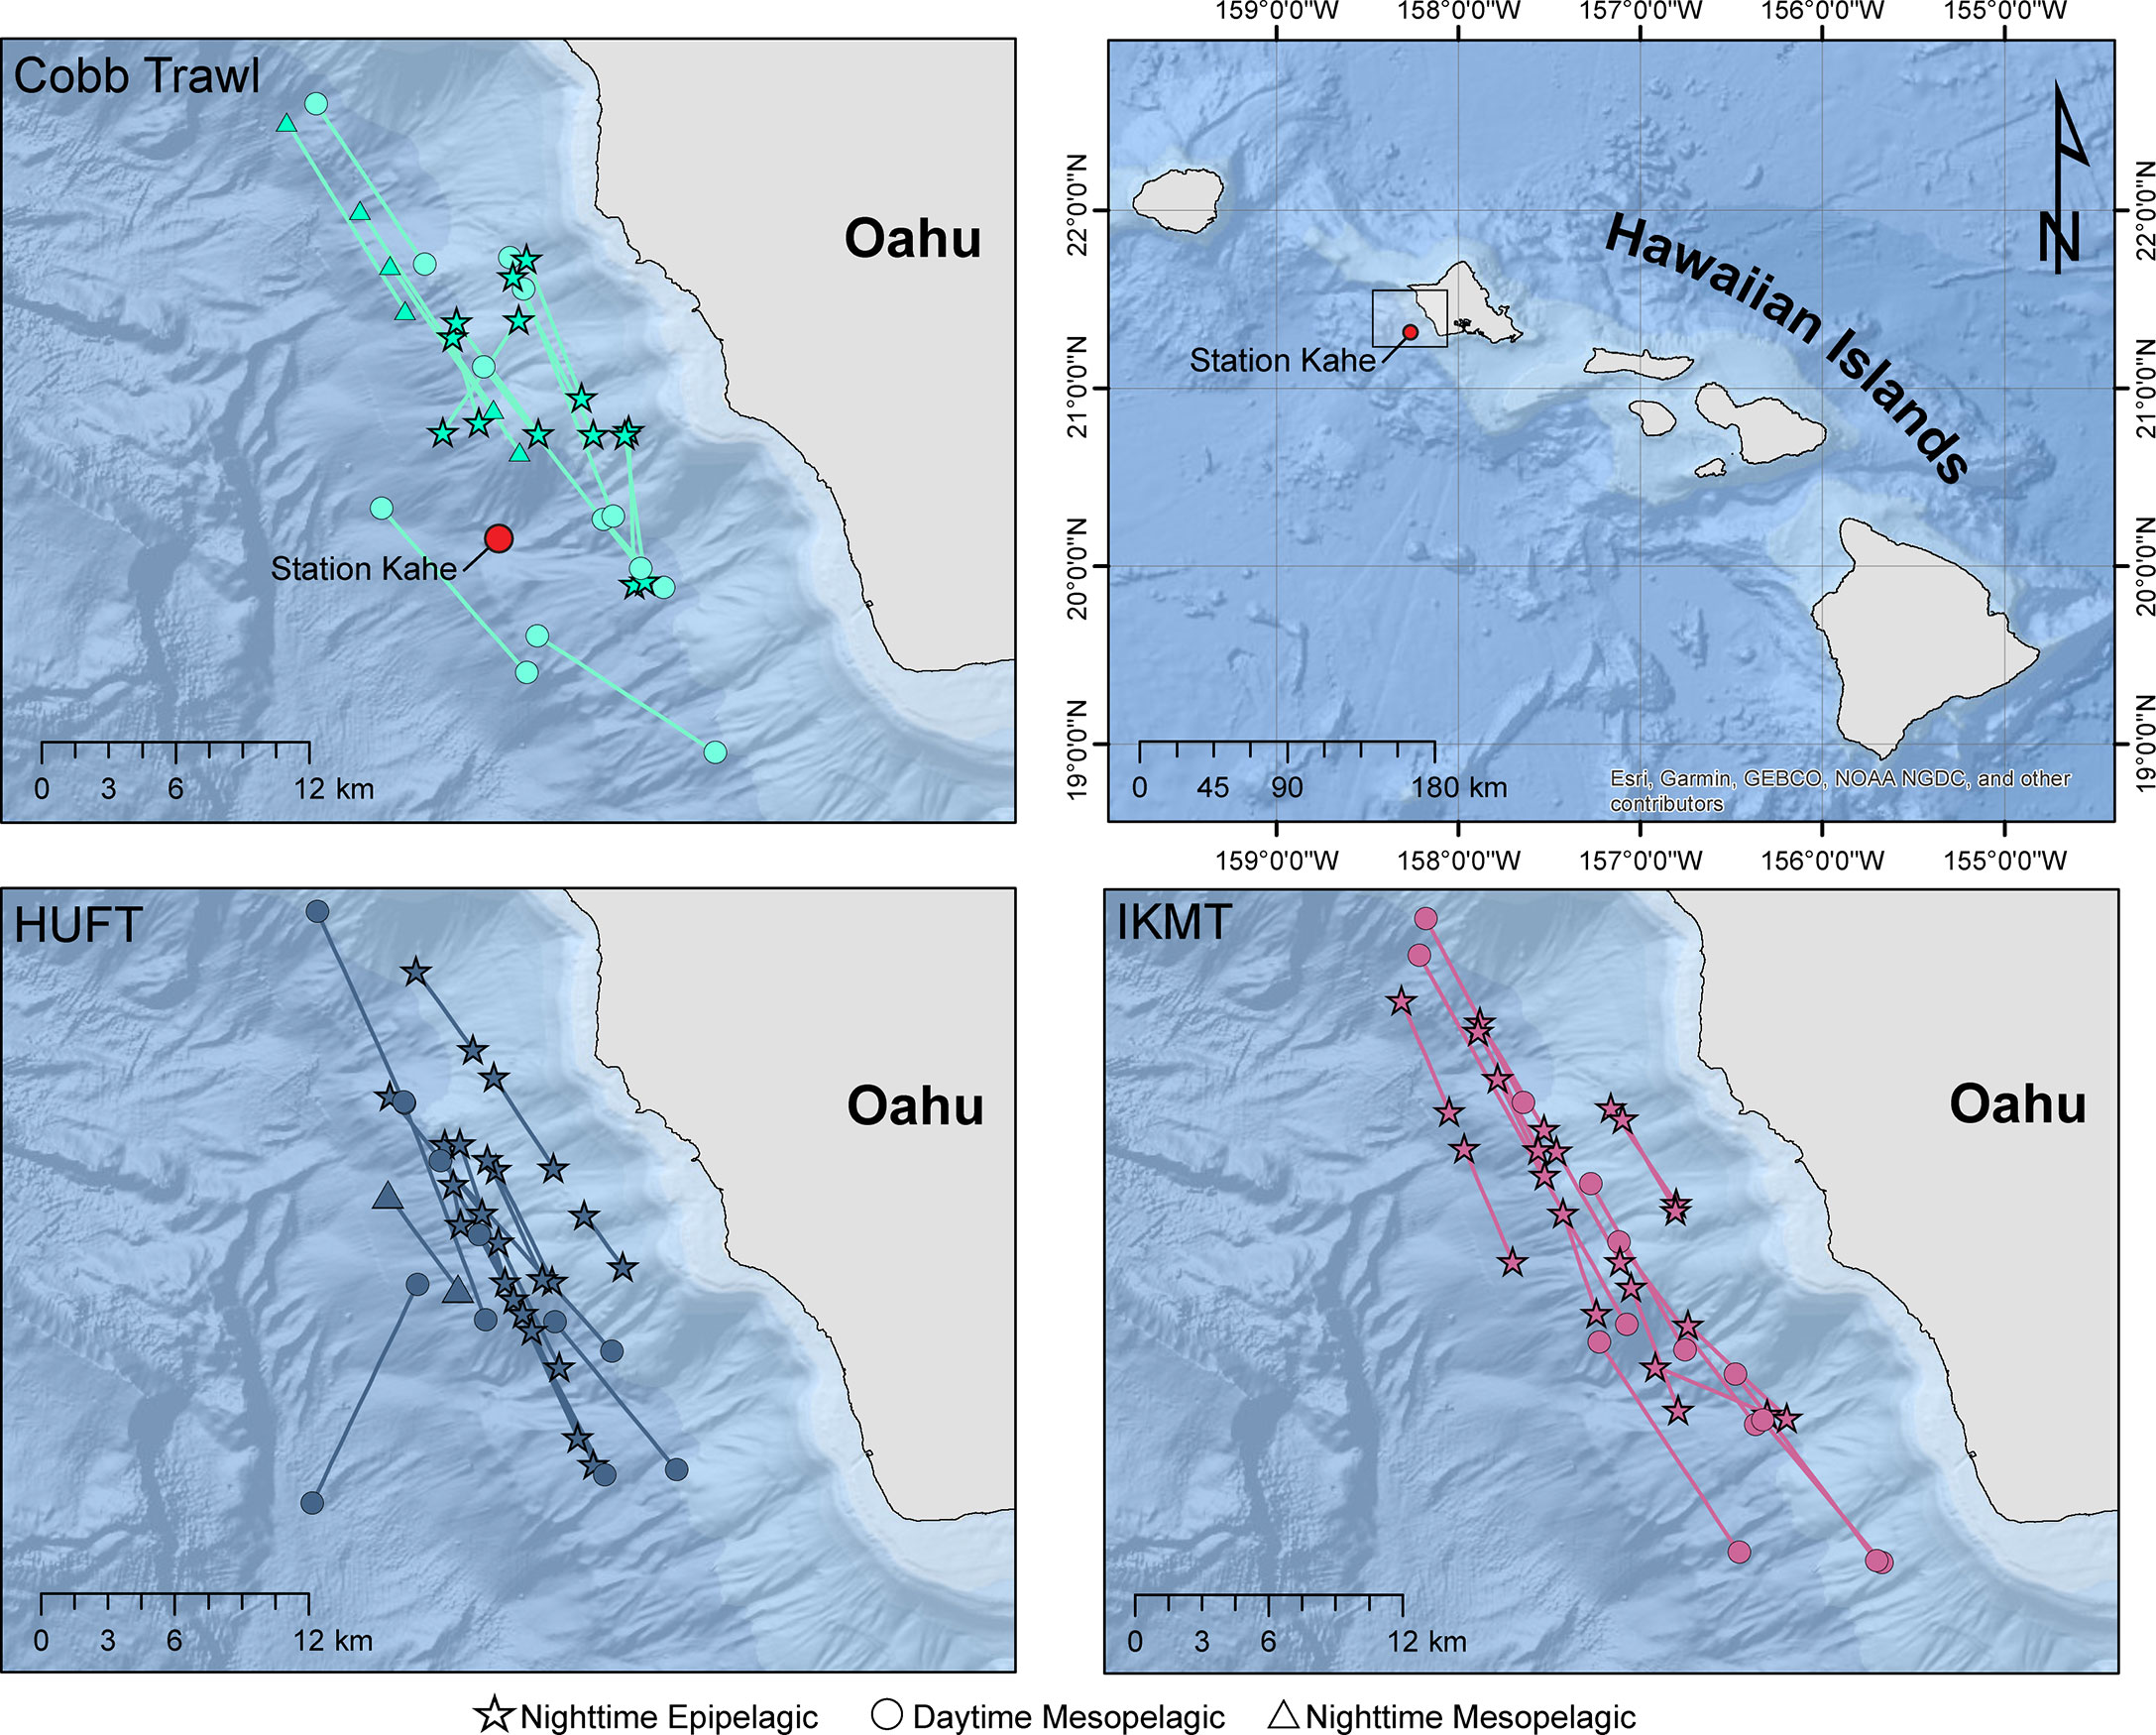
Figure 2 Location of Cobb, HUFT, and IKMT oblique (epipelagic) and horizontal (mesopelagic) net tows on the southwest coast of Oahu Island, Hawaii. Symbols indicate whether the transects were nighttime epipelagic (☆), nighttime mesopelagic (∆), and daytime mesopelagic (O). In the top two panels, the point indicates Station Kahe (21° 20.6’N, 158° 16.4’W) from the Hawaiian Ocean Time-Series (https://hahana.soest.hawaii.edu/hot/).
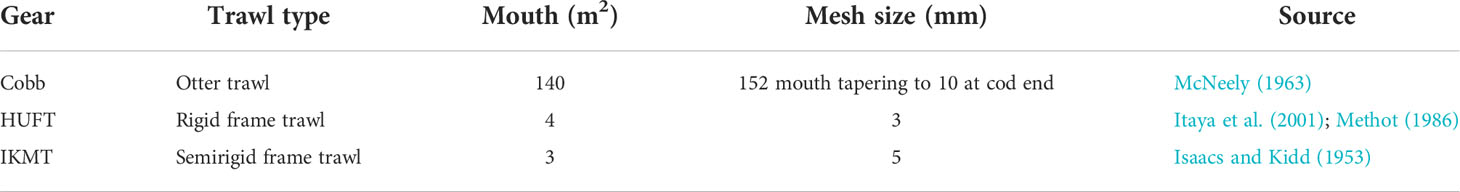
Table 1 Gear dimensions for the Cobb trawl, Hokkaido University frame trawl (HUFT), and Isaacs–Kidd midwater trawl (IKMT).
A hull-mounted, dual-frequency, split-beam Simrad EK60 echosounder operating at frequencies of 38 and 120 kHz was used to detect the depth of the surface scattering layer (SSL) and deep scattering layer (DSL), corresponding to the epipelagic and mesopelagic layers (Domokos et al., 2010). Here, the epipelagic layer was defined as the region extending from 0- to 150-m depth (i.e., SSL), and the mesopelagic layer as the region below 150-m depth. Except for a single IKMT tow on 7 October, which was removed from our analyses, no tows were conducted during the crepuscular (05:30–07:00 and 17:30–19:00) as micronekton are in flux during this period. The epipelagic layer was obliquely sampled at night (between 20:00 and 05:00 local time), while the mesopelagic layer was sampled horizontally (550–650 m, corresponding to the DSL) during the day (between 08:00 and 17:00) and night (Table 2). Each tow was conducted at a speed of 1.5 m/s (ship speed plus cable retrieval speed) and lasted 1–2 h depending on the depth (i.e., epipelagic or mesopelagic) of the tow (Table S-1). The precise tow depth was determined using a depth sensor on each net. Tows were conducted back to back, and the estimates of abundance, biomass, and active carbon transport were derived for each individual tow. Surface net tows and acoustics suggested no significant presence of micronekton in the epipelagic layer during the day (as reported in Pakhomov and Yamamura, 2010); therefore, in this study, we do not discuss tows conducted in the epipelagic during the day further.
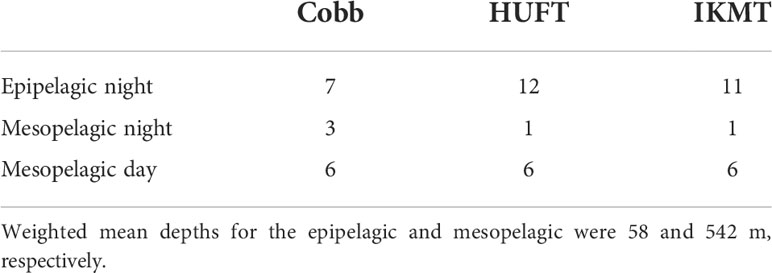
Table 2 Number of tows conducted using each sampling gear off the southwest coast of Oahu in between 6 and 12 October 2004 where epipelagic tows were oblique from 115 to 0 m and mesopelagic tows were horizontal between 485 and 656 m depending on the depth of the scattering layer immediately prior to sampling.
The volume filtered was calculated using the nominal mouth opening of the net and the distance traveled through the water column. For horizontal tows, the distance traveled through the water column was calculated by taking the geographic coordinates when the net reached the target depth and again at the end of the tow (before retrieval). For oblique tows, the distance traveled through the water column was calculated using the wire angle, length of wire out, depth of trawl, and horizontal distance traveled as described in Kwong et al. (2018). This approach leads to some uncertainty as it does not account for changes in the mouth opening, angle, and speed that may arise throughout the tow, the effects of which are particularly pronounced for large trawls like the Cobb trawl. Furthermore, because our sampling gears could not be closed, samples could have been collected during both the descent and ascent at any depth where the net was present.
Oceanographic data (temperature, salinity, and oxygen) were obtained from the Hawaii Ocean Time Series (https://hahana.soest.hawaii.edu/hot/) Station Kahe (Figure 2), which falls well within our sampling region. Station Kahe was sampled between 27 September and 1 October 2004, as part of the HOT (HOT-163). Oceanographic data are provided in the supplemental (Figure S-1).
2.2 Sample processing
Nets were searched for entangled animals, and samples were then immediately sorted onboard. Rare and large species were removed, counted, measured, weighed, and preserved in a 6% formalin seawater (FSW) solution. The remaining sample was thoroughly mixed and one-half to one-fourth of the total weight removed using a balance for further sorting into main taxonomic groups (fishes, decapods, euphausiids, tunicates, etc.), and then preserved in 6% FSW solution.
Fishes, decapods, and squids were identified to the lowest taxonomic level possible, counted, and measured (length in millimeters). Fishes were grouped as follows: gonostomatids, myctophids, and “other fishes.” The latter included 14 families, each of which contributed<5% to the total abundance (Kwong et al., 2018). Zooplankton were identified to major taxonomic group (chaetognaths, copepods, mollusks, etc.), counted, and measured (length in millimeters). Before analysis, all rare and large specimens were readded to the totals.
The abundance of organisms (ind. m-2) captured in each tow was calculated using the number of individuals in each tow (N), volume of water filtered (VF; expressed in cubic meters), and thickness of the scattering layer (SL thickness, in meters), as follows:
Individual lengths were used to calculate carbon weight (mgC) according to Kwong et al. (2020), which compiled length–weight relationships (LWRs) for the species, genus, or family using global lengths and weights from the literature. Where LWRs were not available from Kwong et al. (2020), relationships were taken from the literature or FishBase Bayesian LWR (Froese et al., 2014). Thus, these estimates are not region specific.
SL thickness was taken as the mean thickness of the backscattering layers during the day in the mesopelagic and at night in the epi- and mesopelagic (100–120 m; Kwong et al., 2018) and therefore may not capture changes in the SL that may occur throughout a tow. This introduces some uncertainty in our estimates; however, throughout our sampling period, average SL thickness was relatively consistent between the SSL (thickness = 100–120 m) and DSL (thickness = 100 m) [reported in Domokos et al. (2010)].
Biomass (mgC m-2) was calculated using the total biomass (Btc; in mgC) captured in each tow, VF, and SL thickness:
It should be noted that no adjustments for sampling efficiency were applied here.
2.3 Active carbon transport
Active fluxes were calculated following the same methodology as Kwong et al. (2020) and are briefly summarized here. We use micronekton collected at night in the epipelagic layer to quantify active carbon transport and assume that all these organisms migrate into the mesopelagic during the day. This assumption is supported by surface net tows conducted in the epipelagic during the day, which captured no organisms, and acoustics, which suggested no significant presence of micronekton (Pakhomov and Yamamura, 2010). Acoustic analyses revealed that ≤16% of micronekton may have remained in the epipelagic layer during the day (Domokos et al., 2010). Here, we do not apply a correction factor for these non-migratory daytime epipelagic residents, which leads to some uncertainty in our estimates.
2.3.1 Respiration
Respiratory oxygen uptake (RO; µL O2 ind. -1 h-1) was calculated using size-, temperature-, and taxa-specific rate equations (Supplementary Table S-2; Donnelly and Torres, 1988; Ikeda, 2013, Ikeda, 2014; Ikeda, 2016; Henschke et al., 2019) and then converted into the respiratory carbon equivalent (RC; µg C ind.-1 d-1) as follows:
where RQ is the taxon respiratory quotient (Supplementary Table S-2), 12 is the molar weight of carbon (g mol-1), 22.4 is the molar volume (mol L-1) of an ideal gas at standard pressure and temperature, and TD is the time spent at depth, which was estimated based on the acoustic backscatter from the onboard EK60 (Pakhomov and Yamamura, 2010). Community respiration () was the sum of individual respiration rates within the mesopelagic layer.
2.3.2 Mortality
We calculate the mortality flux () from growth (), assuming that the system is in a steady state (i.e., ) as in Hernández-León et al. (2019) using a growth/metabolism ratio of 0.66 from Brett and Groves (1979) such that:
The community mortality flux (Mhat) was then calculated as the sum of individual mortality (M).
2.3.3 Excretion
Based on Steinberg et al. (2000), dissolved organic carbon (DOC) excretion was assumed to be 31% of CO2 respiration. The authors reported that the average excretion was 31% of respired CO2 (µg C) [hereafter referred to as the excretory ratio (ER)] and found a similar variation regardless of temperature, weight, and species for crustaceans, which included euphausiids, copepods, amphipods, and shrimp. We apply the same relationship across all taxa, acknowledging that DOC excretion estimates for myctophids may vary. However, estimates for fishes are lacking in the literature (Hudson et al., 2014). To address uncertainties associated with calculating excretion, we apply a range of values from Steinberg et al. (2000) (i.e., ER = 5, 31 [mean], 42%).
The community excretory flux () was the sum of the individual excretory flux (E).
2.3.4 Gut flux
Organisms migrating into the surface waters at night were assumed to feed to complete satiation. The taxon-specific estimates of the mean index of stomach fullness (ISF; the dry weight of stomach contents/dry weight of organism) from the literature (Table S-3), were combined with the organism size (DW; mg) to calculate the size-specific food ball dry weight (FB; mg) as in Kwong et al. (2020):
The food ball dry weight was then converted to carbon units assuming a carbon-to-dry weight ratio of 0.4 (Parsons et al., 1984; Steinberg et al., 2000). Assimilation efficiencies are likely to show variation across taxa based on prey items and environmental conditions. Specifically, high food availability or differences in the prey type may reduce/change assimilation efficiencies. Dilling et al. (1998) demonstrated that euphausiids grazing on marine snow composed of dinoflagellates had a higher assimilation efficiency than those feeding on marine snow composed of diatoms/larvaceans, 83% and 64%–75%, respectively. Studies to date report assimilation efficiencies for midwater fishes ranging from 84% to 88% (Childress and Nygaard, 1973; Hopkins and Baird, 1977; Drazen et al., 2007), while those for crustaceans (euphausiids and copepods) range from 64% to 90%, with the majority above 80% (Lasker, 1966, Alvarez and Matthews 1975, Dilling et al., 1998; Chen et al., 2014). Therefore, to calculate the daily egested material (E; mg C d-1), we assumed an assimilation efficiency of 88% from Hopkins and Baird (1977) for midwater fishes, as this efficiency falls well within the range of estimates for both crustaceans and midwater fishes. Assuming that the egestion is constant throughout the day, daily egestion (E) was divided by 24 h to obtain an hourly egestion rate. In order for egested material to contribute to downward carbon export, the gut passage time (Table S-3) must exceed the amount of time spent on downward migration (DM; h). Where this is not the case (i.e., GPT ≤ DM), the gut flux was automatically set to zero, as the egested material is likely to have been consumed during the downward migration or at depth. The time spent on downward migration (0.75 h), at depth (TD), and at the surface were estimated based on the acoustic backscatter from the onboard EK60 (Pakhomov and Yamamura, 2010). The individual downward gut flux was then calculated as:
Gut passage times (GPT; h) for the various taxa captured were compiled from the literature (Supplementary Table S-3). The community gut flux () was the sum of individual gut flux (GF).
2.3.5 Total downward flux
Micronekton present in the epipelagic during the night were assumed to be vertically migrating to depth during the day and thus contributing to carbon export below the mixed-layer depth (MLD). The total active carbon flux from the epipelagic to mesopelagic was calculated as follows:
Active carbon transport was expressed in mgC m-2 day-1, as well as unitless by dividing the total active carbon transport by the total biomass in each net tow.
2.4 Data analysis
Data analysis was performed using R Statistical Software (R Core Team, 2017). We compared the mean estimates of active carbon transport obtained using the three different sampling gears. To test the differences in micronekton active carbon transport across sampling gears, size-bins, and taxonomic groups, we use the analysis of variance (ANOVA). We first tested the assumptions using Levene’s test for the homogeneity of variance and the Shapiro–Wilk normality test (Table S-4). All statistical values are reported in the Supplemental.
3 Results
3.1 Active carbon transport net comparison
Micronekton active carbon transport varied across the net and size class. In addition, the dominant taxonomic groups contributing to downward flux varied across nets. The estimates of micronekton active carbon transport were highest using the Cobb trawl (1.31 ± 0.66 mgC m-2 day-1), followed by the IKMT (0.98 ± 0.35 mgC m-2 day-1), and HUFT (0.38 ± 0.19 mgC m-2 day-1; Table 3; Figure 3). Differences in active carbon transport were statistically significant (p << 0.005; F2,133 = 8.43; ANOVA), with estimates from the IKMT being significantly higher than the HUFT (p = 0.001; Tukey post-hoc). No significant differences between the Cobb and the two other nets were detected (p > 0.05; Tukey post-hoc), as the spread of estimates from the Cobb was large (Figure 3; Table S-5; Table S-6). Mean active carbon transport per unit biomass from the Cobb and IKMT was the same under all three excretion scenarios, remaining higher than the HUFT by 0.001 (difference = 6%) (Table 3).
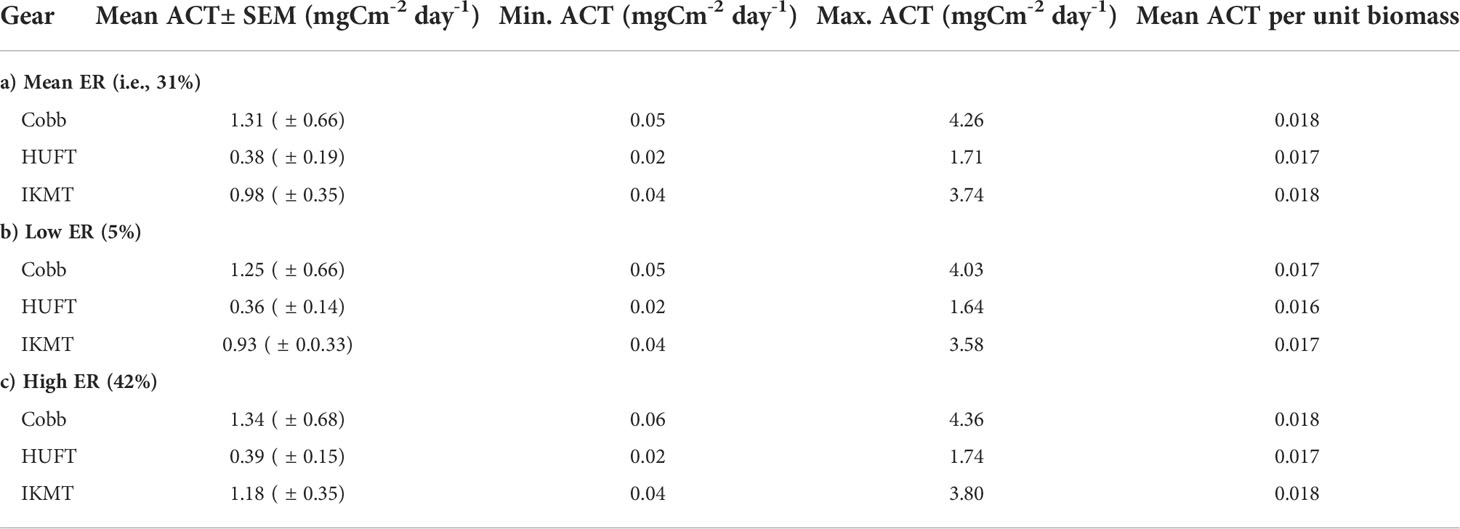
Table 3 Micronekton mean, minimum, and maximum active carbon transport [ACT; ± standard error of the mean (SEM)] and mean ACT per unit biomass using the Cobb (N = 7), HUFT (N = 12), and IKMT (N = 11), calculated using three different excretory ratios [i.e., 31%, 5%, and 42%; as per Steinberg et al., 2000].
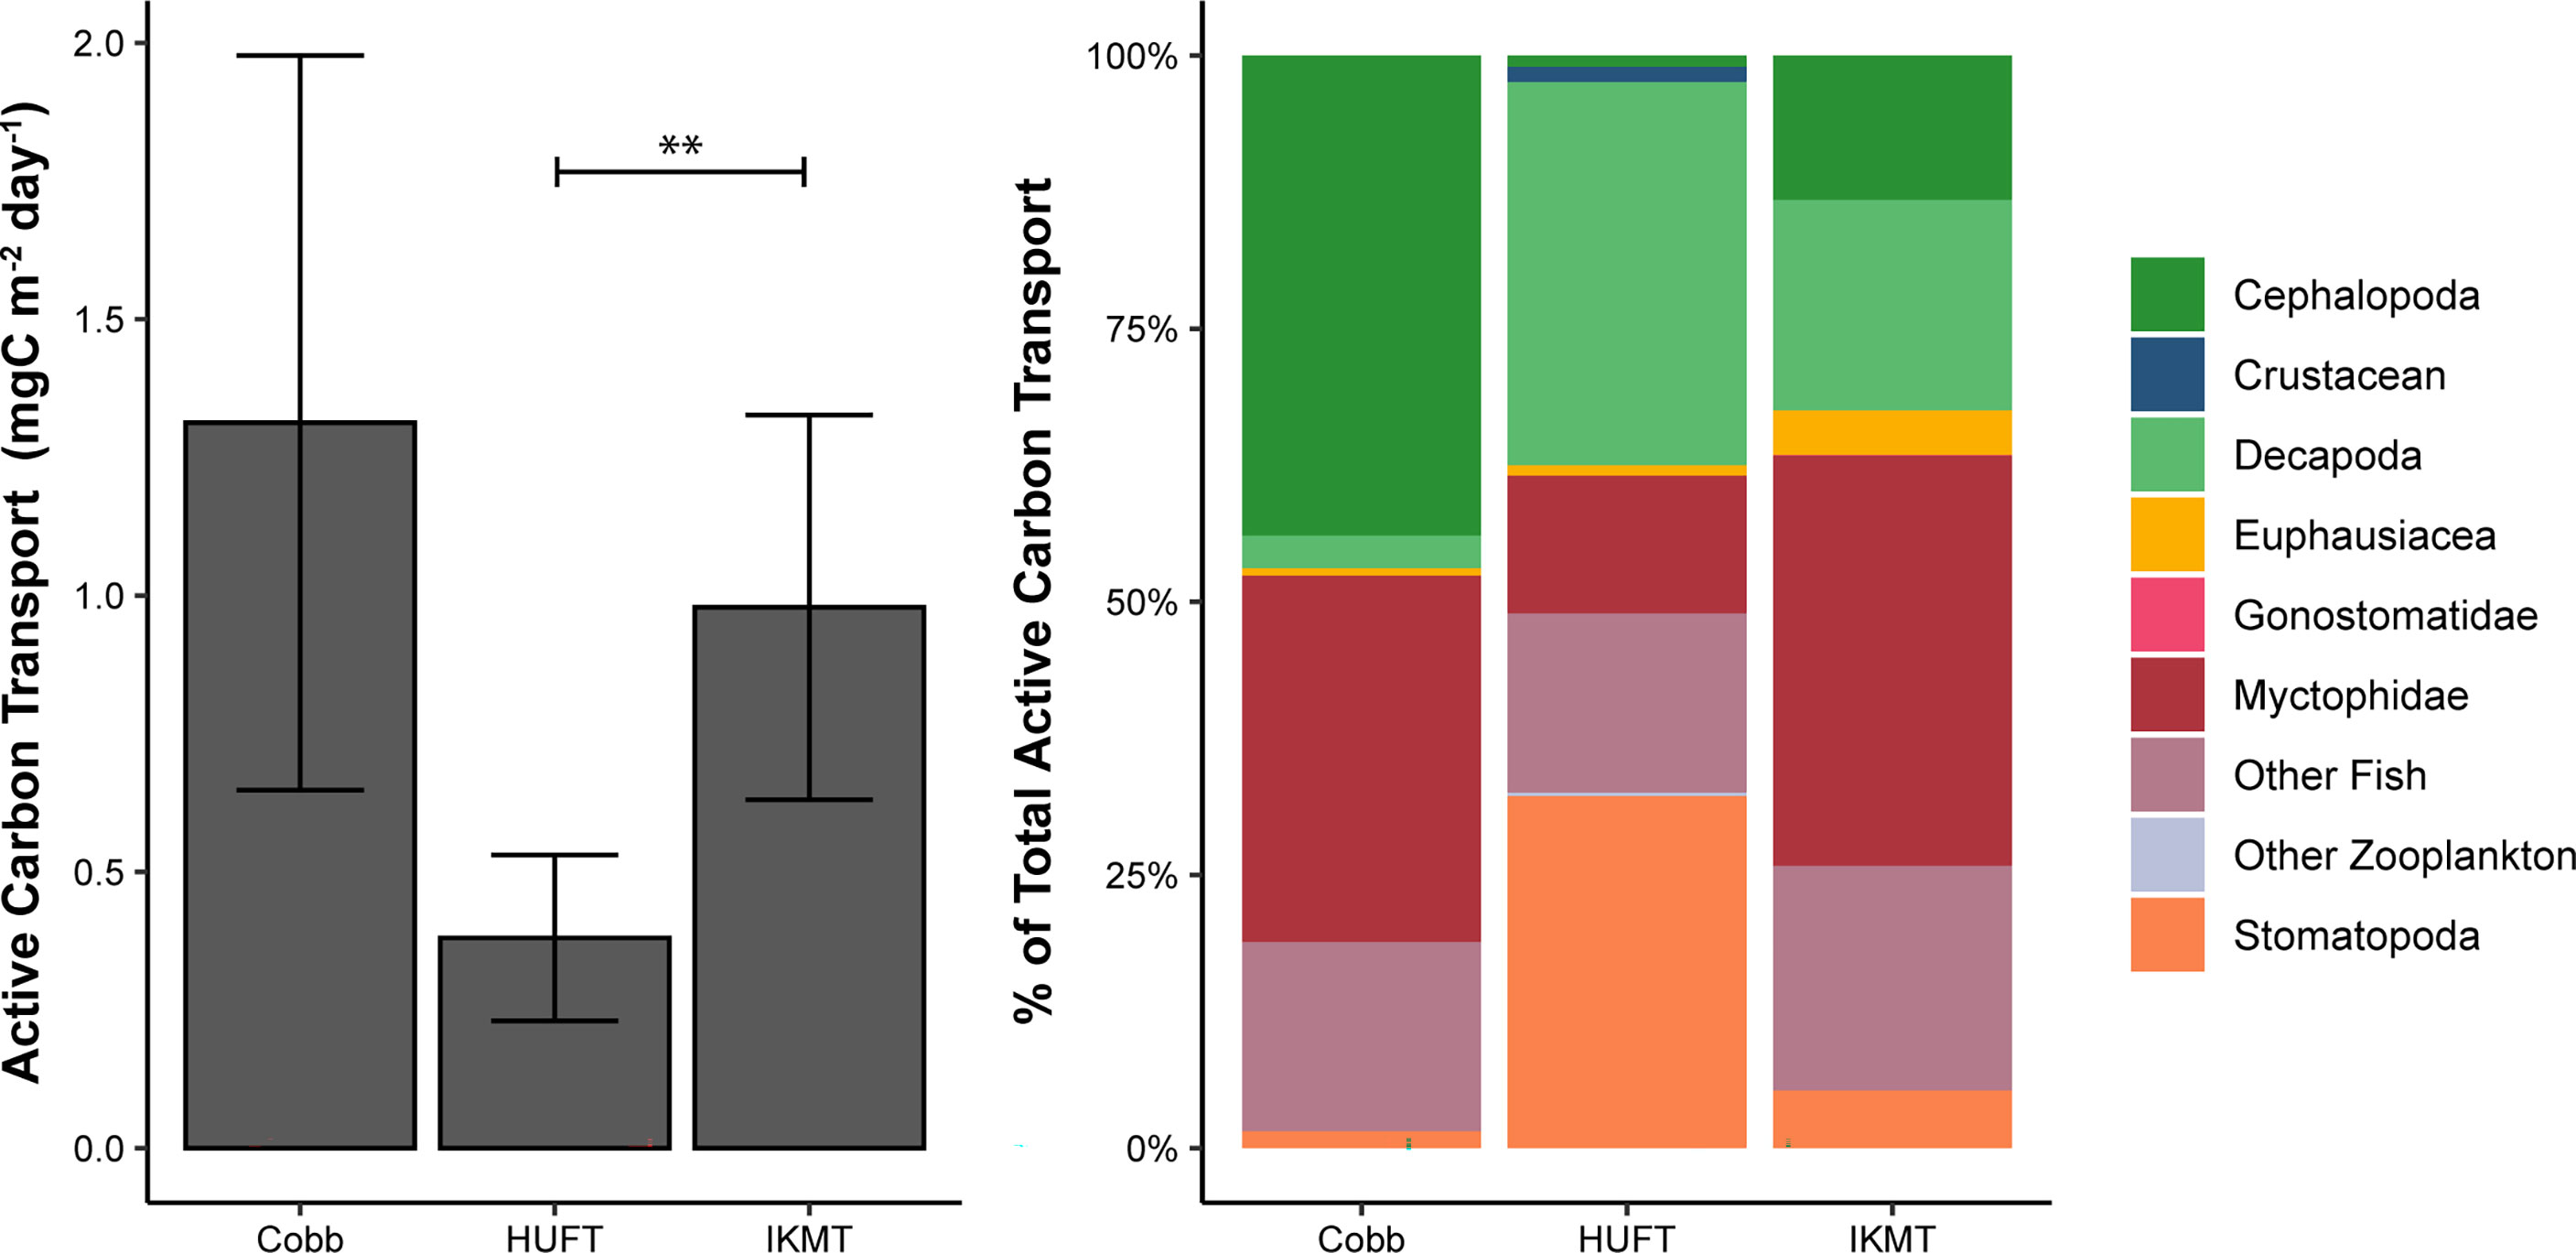
Figure 3 Left: Mean active carbon transport by the sampling gear (i.e., Cobb, HUFT, and IKMT). Bars indicate ± standard error of the mean. The horizontal bar indicates a statistically significant difference (α = 0.05) between the HUFT and IKMT (where ** indicates p = 0.001); Right: Percent contribution of taxonomic groups to total active carbon transport by sampling gear (See Table 4 for total active carbon transport by gear and taxonomic group).
3.1.1 Taxonomic contributions to active carbon transport
The greatest contributors to the active carbon flux were cephalopods and myctophids for the Cobb trawl (0.58 and 0.44 mgC m-2 day-1, respectively); decapods and stomatopods for the HUFT (0.13 and 0.12 mgC m-2 day-1, respectively); and myctophids, other fish, and decapods for the IKMT (0.37, 0.20, and 0.19 mgC m-2 day-1, respectively) (Figure 3). A significant interaction between taxonomic groups and the gear type was detected (p = 0.003; F12,133 =1.837; ANOVA; Table S-5). This interaction highlighted differences in the contribution of taxa to the total carbon flux by a single gear (i.e., for the Cobb trawl cephalopods that contributed more than euphausiids) but did not reveal significant differences in the contribution of individual taxa across sampling gears (e.g., the myctophid contribution to active carbon transport from HUFT was not significantly different from that of IKMT or Cobb; p > 0.05; Tukey HSD; Table S-6). Differences in taxonomic contributions within each gear were most notable for the Cobb trawl (Figure 3). Specifically, for the Cobb trawl, cephalopods contributed more to active carbon transport than euphausiids, gonostomatids, and stomatopods (p ≤ 0.02; Tukey HSD), and other fish contributed significantly more than euphausiids and stomatopods (p ≤ 0.03; Tukey HSD). Decapods, myctophids, stomatopods, euphausiids, and other fish contributed more significantly to active carbon transport than gonostomatids (p < 0.005; Tukey HSD). A similar pattern was observed for the IKMT and HUFT, with all taxa contributing significantly more to active carbon transport than gonostomatids (p < 0.02; Tukey HSD). Active carbon transport by stomatopods was significantly higher than that of other zooplankton using the HUFT (p = 0.04; Tukey HSD).
Mean active carbon transport per unit biomass revealed both differences and similarities in taxa across gears. Specifically, cephalopod mean active carbon transport per unit biomass was 0.021 for the HUFT but only 0.015 and 0.016 for the IKMT and Cobb, respectively (Table 4). Large differences were also observed for gonostomatids, with the Cobb, HUFT, and IKMT returning mean active carbon transport per unit biomass estimates of 0.096, 0.104, and 0.039, respectively. However, we also noted striking similarities for euphausiids (Cobb = 0.022; HUFT = 0.022; IKMT = 0.18), myctophids (Cobb= 0.02; HUFT = 0.019; IKMT = 0.018), other fish (Cobb = 0.02; HUFT = 0.018; IKMT = 0.019), and stomatopods (Cobb= 0.019; HUFT = 0.016; IKMT = 0.018) (Table 4).
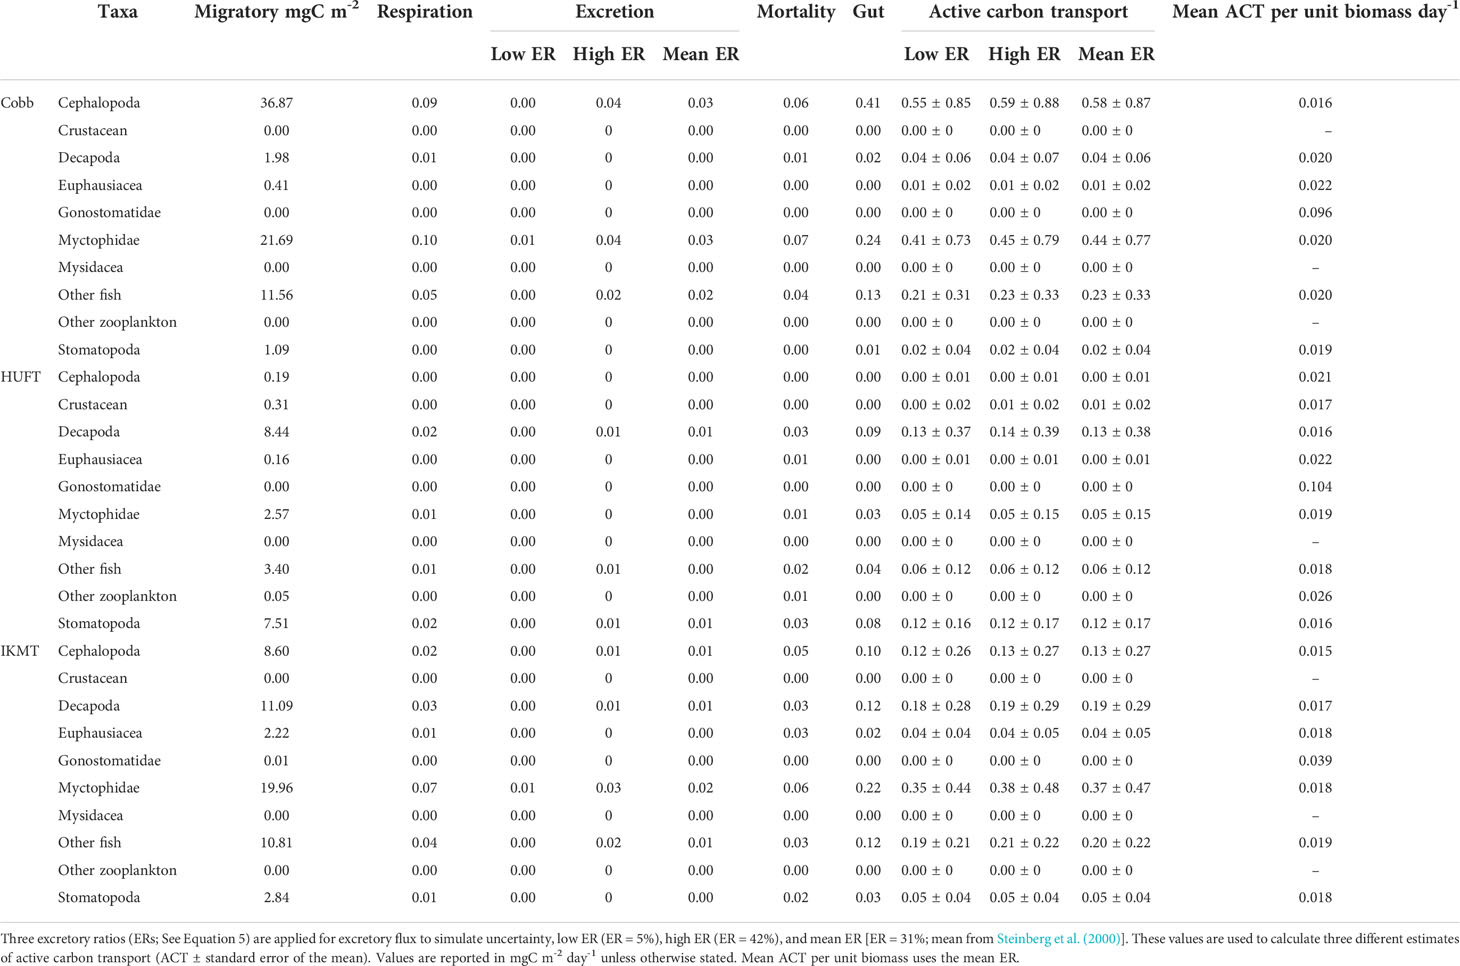
Table 4 Mean carbon fluxes by trawl type and taxa.
3.1.2 Size comparison
The contribution of micronekton by size class to active carbon transport estimates varied across sampling gears. Specifically, estimates derived from the HUFT were relatively low, with smaller size classes contributing the most to overall carbon transport (Figure 4). IKMT contributions were similarly dominated by smaller size classes, although estimates from the IKMT were generally higher than that of the HUFT. Estimates derived using the Cobb were more evenly distributed across micronekton size classes, although the IKMT returned higher estimates for smaller-size classes (Figure 4).
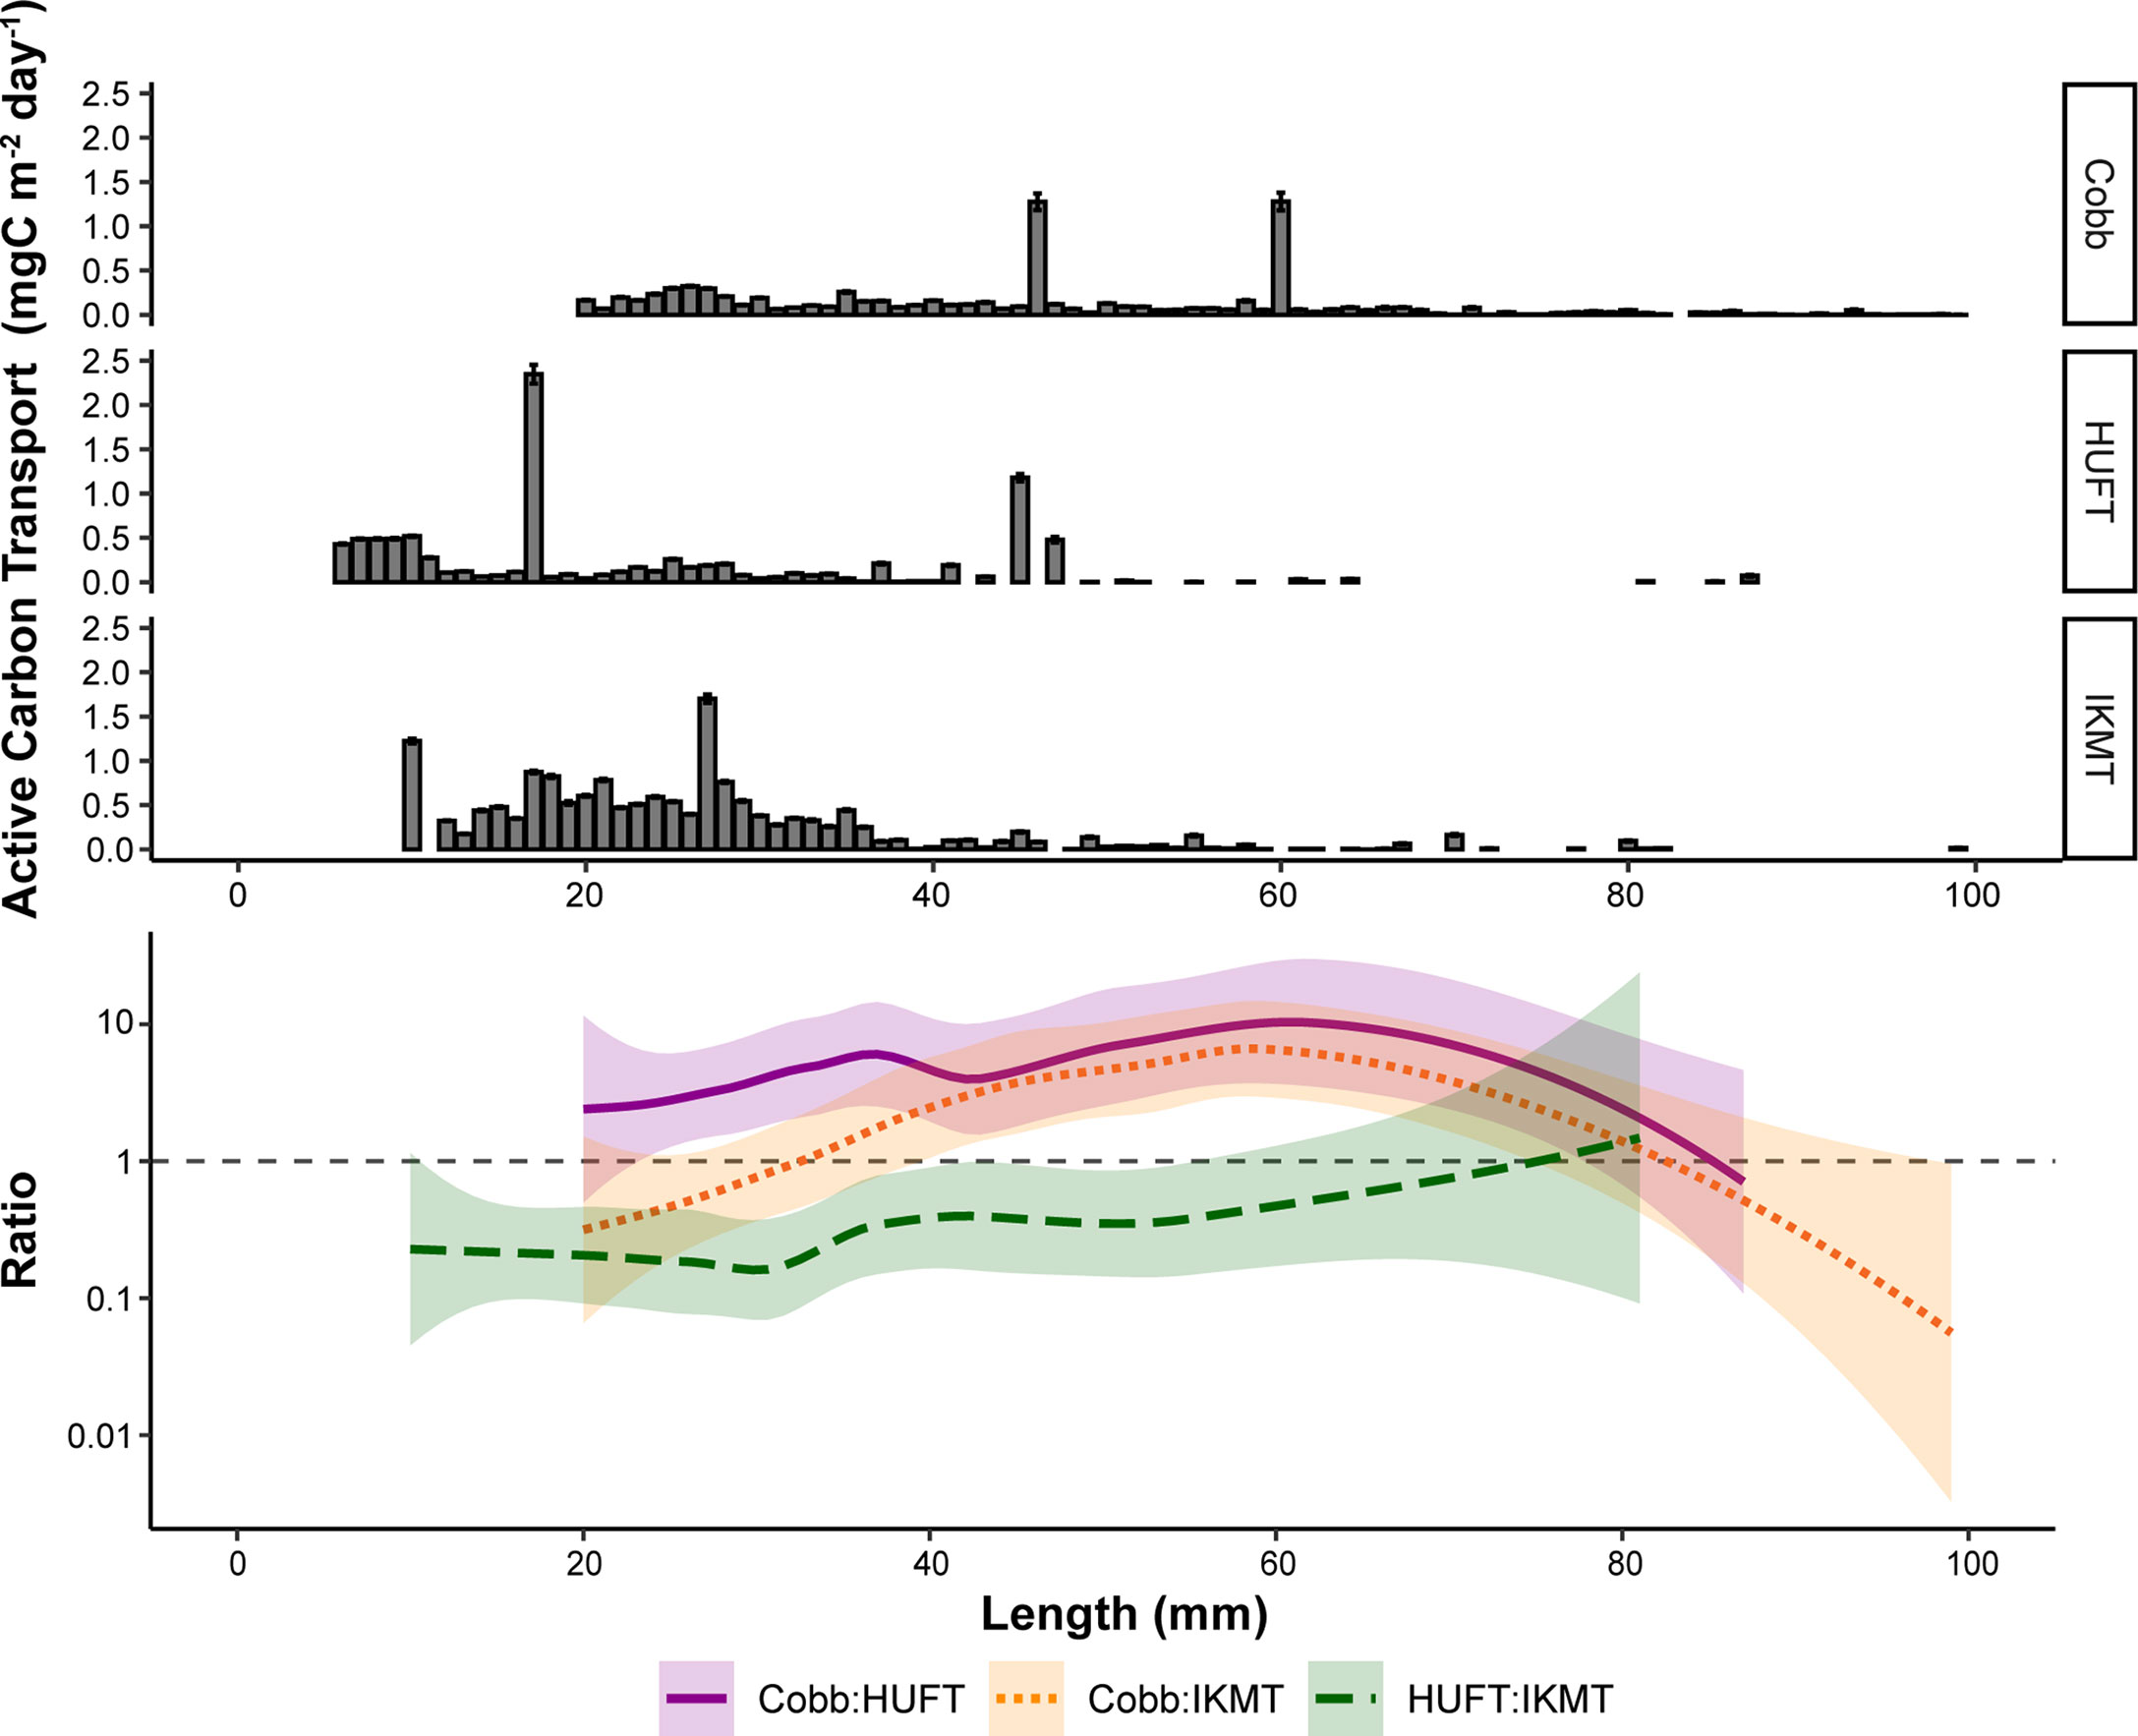
Figure 4 Top: Mean active carbon transport of micronekton by length for the three different sampling gears (Cobb, HUFT, IKMT); bars indicate ± standard error of the mean. Bottom: log10-transformed pairwise ratios of total active carbon transport between the three different sampling gears by length with a LOESS (locally estimated scatterplot smoothing) fit. Shaded areas represent 95% confidence intervals, while the dashed gray line represents a pairwise ratio of 1 (i.e., estimates from both gears are equal).
Length-specific pairwise ratios were used to further evaluate these differences (Figure 4). Ratios varied by up to three orders of magnitude (Figure 4). In most cases, pairwise ratios for animals greater than 80 mm were not possible as the HUFT and IKMT rarely captured organisms beyond the 80 mm total length. Generally, the estimates of active carbon transport were consistently higher when derived from the Cobb (Figure 4). However, for smaller-size classes (i.e., ≤ 30 mm) the IKMT returned higher estimates of active carbon transport than the Cobb. When comparing the HUFT and IKMT, pairwise ratios revealed that the IKMT-derived estimates of active carbon transport were consistently higher (Figure 4).
A detailed gear comparison of abundance and biomass catches for the three gears is provided in Kwong et al. (2018). Here, biomass was grouped into logarithmically equal size bins and expressed against size [i.e., geometric mean length (GML); mm] (Figure 5). Only the HUFT captured biomass within the 5.6 mm GML bin (range = 4–8 mm). Both the HUFT and IKMT captured biomass within the 11.3 mm GML bin (range = 8–16 mm), although the IKMT yielded a higher mean biomass (Figure 5). The IKMT and HUFT both yielded their highest mean biomass within the 22.6 mm GML bin (range = 16–32 mm). The Cobb trawl captured the greatest mean biomass within the 45.3 mm GML bin (range = 32–64 mm). All three gears showed a decrease in mean biomass with increasing size, except for the HUFT in the 181 mm GML (range = 128–256 mm).
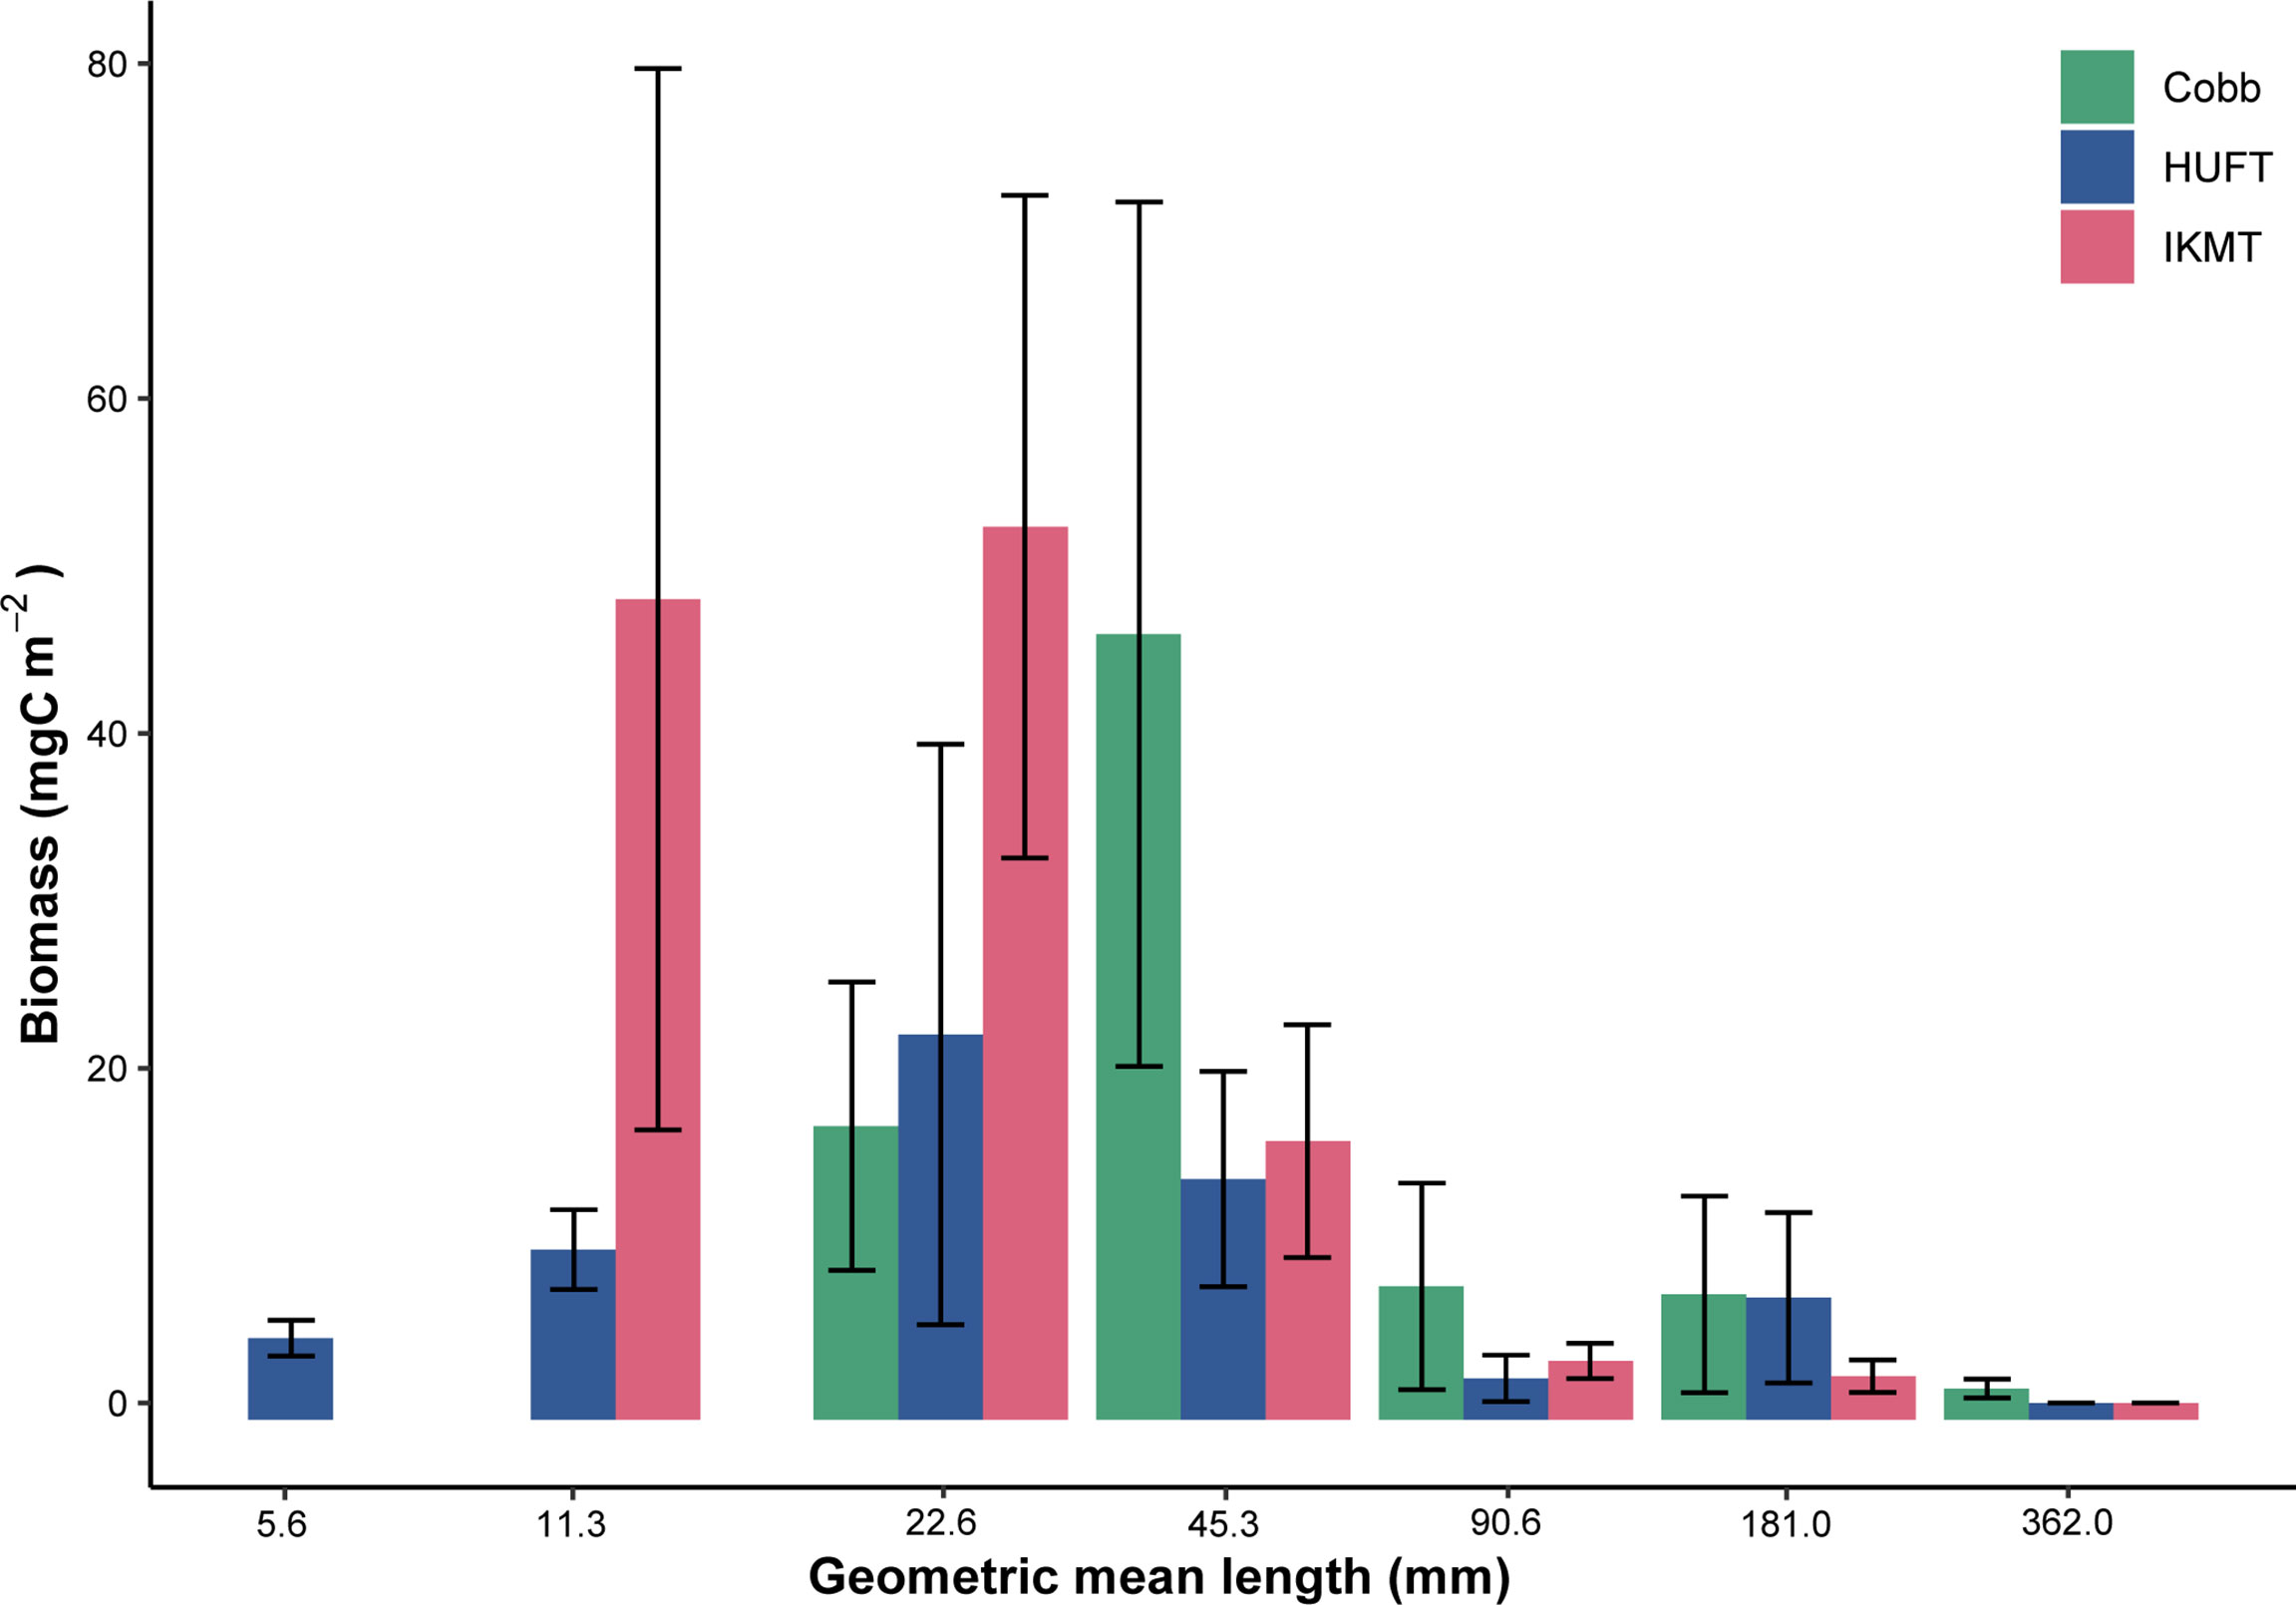
Figure 5 Total biomass by geometric mean length for the Cobb, HUFT, and IKMT at night in the epipelagic, October 2004, where biomass is expressed in carbon units and organisms are grouped into log-2 size bins. Bars indicate mean ± standard error of the mean.
4 Discussion
This study set out to investigate how the derived estimates of micronekton active carbon transport vary by net type using a taxa- and size-specific model. The active carbon transport estimates derived from the Cobb trawl, IKMT, and HUFT resulted in significant differences, with the Cobb trawl and IKMT producing the mean estimates of active carbon transport 3 and 2.5 times greater than the HUFT, respectively. However, this difference between the Cobb trawl and HUFT was not statistically significant due to the large spread of active carbon transport estimates across tows. The contribution by different taxa to total active carbon transport varied for each gear, although no differences in taxonomic contributions were observed across gears. Mean active carbon transport per unit biomass was similar across gears for dominant taxa. Previous studies have evaluated the effects of different sampling gears on estimates of total micronekton abundance and biomass (e.g., Gjøsaeter and Kawaguchi, 1980; Angel & Pugh, 2000; Nishikawa et al., 2001; Brodeur & Yamamura, 2005). However, to our knowledge, no studies have evaluated how these differences may impact the net-based estimates of micronekton rate processes, instead inferring that these differences would simply be perpetuated. Below, we discuss our findings in the context of current literature.
4.1 Illustrating the implications of net type on micronekton active carbon fluxes
Between the three sampling gears investigated in this study (e.g., Cobb, HUFT, and IKMT), as expected, the large mouth- (140 m2) and mesh-size (152 mm at the mouth decreasing to 10 mm) of the Cobb trawl provided the greatest coverage of the micronekton community, particularly for larger size classes generally associated with net avoidance (Kaardvedt et al., 2012; Skjoldal et al., 2013). Estimates derived from the IKMT (0.98 mgC m-2 day-1; range: 0.04–3.74 mgC m-2 day-1); and Cobb trawl (1.31 mgC m-2 day-1; range: 0.05–4.26 mgC m-2 day-1) were similar; however, studies employing smaller nets like the HUFT (0.38 mgC m-2 day-1; range: 0.02–1.71 mgC m-2 day-1) and IKMT to quantify micronekton active carbon transport face considerable limitations when it comes to capturing larger, more mobile organisms. As a result of the wide spread of estimates in active carbon transport by the Cobb trawl, it was not possible to detect statistically significant differences in total active carbon transport between the Cobb trawl and the other two gears. This finding suggests that estimates of active carbon transport can range by up to two orders of magnitude over a matter of days, highlighting the effects of patchiness on active carbon transport estimates.
To further investigate the use of different nets on active carbon transport estimates, we explore potential parallels between our findings and that of 13 previous studies (Figure 1). Each study utilizes net-sampling data, where four of the studies (Angel and Pugh, 2000; Davison et al., 2013; Hudson et al., 2014; Ariza et al., 2015) employ two net types with different mouth and mesh sizes, while the remaining account for nine different net types used. First, Angel and Pugh (2000) reported a mean migratory micronekton estimate ranging from 12.5 to 58 mgC m-2 when using an RMT(1 + 8) on a single frame. A similar two-net methodology undertaken by Davison et al. (2013) derived a mean flux estimate of 23 mgC m-2 day-1 using IKMT (mouth 3 m-2, mesh size 1.7 mm) and MOHT (mouth 5 m-2, mesh size 1.7 mm) net types. Hudson et al. (2014) reported a mean flux estimate of 1.41 mgC m-2 day-1 for three species of myctophids when using a midwater trawl (mouth 36 m-2, mesh size 6 mm) and Akra net (mouth 36 m-2, mesh size 22 mm), while Ariza et al. (2015) reported a mean micronekton flux of 2.9 mgC m-2 day-1 derived from a WP-2 (mouth 0.25 m-2, mesh size 0.1 mm) and an MOHT (mouth 5 m-2, mesh size 4 mm). These studies are in line with the range of numbers reported here; however, they do not incorporate all taxa and/or components of the active flux (i.e., respiration, excretion, gut, mortality, and migratory fluxes).
For example, during the winter in the western equatorial Pacific, Hidaka et al. (2001) assessed micronekton mortality, respiration, and the gut downward flux while using gears comparable to our study (e.g., otter trawl equipped with a mouth size of 400 m-2 and mesh size of 8 mm). Hudson et al. (2014) evaluated the excretory, respiratory, and gut flux of myctophids with an 11–67 mm total length reporting the active carbon transport estimates of 0.02 and 0.17 mgC m-2 day-1 for a migratory biomass of 5.2 and 40 mgC m-2 (uncorrected for sampling efficiency), at two locations along the northern Mid-Atlantic Ridge. In our study, the estimates of myctophid active carbon transport (including the excretory, respiratory, and gut flux) and migratory biomass from the HUFT, IKMT, and Cobb trawl were 0.04 mgC m-2 day-1 and 2.57 mgC m-2, 0.31 mgC m-2 day-1 and 19.96 mgC m-2, and 0.37 mgC m-2 day-1 and 21.69 mgC m-2, respectively (Table 4). Davison et al. (2013) evaluated the contribution of micronekton to active carbon transport in the highly productive California Current region and included all single flux estimates (22–24 mgC m-2 day-1), reporting values that were six times greater than the range of estimates we generated using the Cobb trawl (Figure S-2). Considering the similarities in sampling methodologies from Davison et al. (2013) that offer a more direct comparison to our study, this suggests that these discrepancies are likely attributed to differences in study environments rather than the inherent sampling biases. Lastly, the aforementioned studies calculate their flux rates based on temperature dependency, similar to our approach, thus highlighting the differences study environments procure.
Due to the vast spatial and temporal scales, varying environmental conditions, sampling methodologies, and fluxes included, we do not expect our net-derived estimates of active carbon transport to align with the aforementioned studies, nor do we encourage a statistical comparison of these studies. Nonetheless, highlighting the variable micronekton active carbon transport estimates procured from these studies illustrates the significance of methodological approaches, as well as the scarcity of information on micronekton active flux estimates. It can be seen in Siegel et al. (2014) how modeling studies reproduce field observations and/or utilize empirical flux values found in the literature to assess global or regional carbon export. Thus, without a holistic assessment of micronekton flux estimates (i.e., all fluxes, species, and full-size range), our uncertainties become magnified when considering the projected changes in environmental factors (e.g., temperature, salinity, prey type and availability, and light) that are known to influence biological processes (e.g., standing stock, composition, and patchniness) (Saba et al., 2021).
4.2 Effects of net biases
Several modeling approaches have been used to estimate the contribution of micronekton to active carbon transport. However, the previous estimates of micronekton biomass (required for quantifying active carbon transport) were largely based on net sampling, which is documented in some cases to underestimate biomass by an order of magnitude (Koslow et al., 1997; Kloser et al., 2009; Pakhomov and Yamamura, 2010; Kaardvedt et al., 2012; Irigoien et al., 2014). For this study, we employ three different sampling gears with variable mouth and mesh sizes: the Cobb, HUFT, and IKMT (Table 1). Gears with larger mouth and mesh sizes retain larger, more active organisms that would otherwise avoid smaller nets (Clarke, 1973; Clarke, 1974; Pearcy, 1983). Furthermore, when equipped with a tapering mesh (e.g., Cobb trawl), large sampling gears capture fewer smaller organisms/weaker swimmers as they escape at the mouth where the mesh size is larger, while larger organisms may be “herded” toward the end of the net (Gødø et al., 1994; Koslow et al., 1997; Voronina and Pakhomov, 1998). The effective size range of capture by nets can be demonstrated by evaluating the distribution of biomass by size class (e.g., normalized biomass size spectra; Figure 5). The three sampling gears used here achieve maximum yield at different size classes (Kwong et al., 2018). For example, when biomass is grouped into logarithmically equal size bins, the HUFT and IKMT capture the greatest biomass within the 8–16 mm size range (i.e., geometric mean length = 22.6 mm), while the Cobb trawl captures the greatest biomass within the 32–64 mm size range (i.e., geometric mean length = 45.3 mm; Figure 5). This point of maximum capture indicates the smallest size class efficiently captured, while biomass will typically decrease in larger size bins. As demonstrated in Kwong et al. (2018), the IKMT had a higher total catch than the HUFT in the 40–60 mm size range. This difference is likely attributable to a combination of mesh size and patchiness. Pearcy (1983) evaluated catch composition of two IKMTs with different mouth sizes and the same mesh size. The study reported that the smaller IKMT captured more plankton per cubic meter due to a higher surface-area-to-mouth-area ratio. While smaller nets may underrepresent larger, more mobile micronekton, larger trawls are more difficult to deploy and there is more uncertainty associated with estimating the volume filtered. Here, we calculated the volume filtered using the nominal mouth opening and distance traveled through the water column. However, larger trawls (e.g., Cobb trawl), may undergo large changes in the mouth opening throughout a tow, leading to a great deal of uncertainty in volume-filtered estimates. Combined with patchiness, this may contribute to the wide spread of active carbon transport estimates obtained using the Cobb trawl. This makes it particularly difficult to compare catches; however, comparison studies report that the Cobb trawl more effectively captures larger organisms and those species that are rare or absent in IKMT catches (Clarke, 1973; Clarke, 1974). The authors note that the higher abundances of certain groups caught by the IKMT are likely due to the smaller, and therefore, less detectable nature of the IKMT. Therefore, it is evident that a combination of nets is required to quantify active carbon transport for the entire micronekton community.
4.3 Sampling limitations
A full report on the acoustics and how they compared to the nets used in this study can be found in Domokos et al. (2010). The authors reported that ≤16% of micronekton during our study remained in the epipelagic layer during the day. However, the acoustics targeted small fishes with swim bladders, which made up between 10%–42% and 16%–47% of the total abundance and biomass captured in our nets at night in the epipelagic layer (Kwong et al., 2018). These fish are likely the most undersampled by our sampling gears due to their highly mobile nature and ability to avoid nets (Kaardvedt et al., 2012), making it likely that we underestimate the contribution of mesopelagic fishes to active carbon transport. Decapod biomass increased at night in both the epipelagic and mesopelagic layers based off net samples (Kwong et al., 2018). However, because the DSL was identified using acoustics targeting larger micronekton with swim bladders (Domokos et al., 2010), and sampling involved horizontal tows, it is possible that decapods were undersampled during the day in the mesopelagic compared to fishes. This would explain the notably lower estimate of active carbon transport by decapods (i.e., 0.04–0.19 mgC m-2 day-1) when compared to Pakhomov et al. (2018), which estimated the export production of decapods to be 0.625 mgC m-2 day-1 near our sampling region at the Aloha Station. However, it should be noted that the authors use a different sampling design. Horizontal tows become problematic in the presence of mesopelagic layering, whereby the DSL is composed of more than one prominent layer and, within each layer, numerous layers with varying acoustics characteristics can be detected. This was observed during our sampling program in Domokos et al. (2010), indicating that each layer likely had a different micronekton composition/density. Thus, unlike in the epipelagic, some micronekton in the mesopelagic layer could have been undersampled and/or missed entirely by the horizontal tows.
These discrepancies could be further explained by diel horizontal migration (Reid et al., 1991; Benoit-Bird and Au, 2001), non-migratory organisms, and/or deep-sea flux originating from the deeper mesopelagic and bathypelagic zones. Using relative micronekton densities calculated acoustically, one can assume that the relative abundance and biomass of migratory micronekton moving into the SSL during the night should be roughly equivalent to the nighttime SSL minus the daytime SSL. As no consistent comparable daytime epipelagic tows were conducted, we assume that micronekton present in the epipelagic layer at night were undergoing diel vertical migrations. This assumption is supported by acoustics data operating at 38- and 120-kHz frequencies in an effort to target larger individuals with swim bladders, as well as net tows in the epipelagic during the day that came up empty (Pakhomov & Yamamura, 2010). It is important to first acknowledge that this approach is not exact as the organism size is not accounted for, which contributes to changes in acoustic density. Consistent with Klevjer et al. (2016) in a variety of oceanographic regimes including our study area, this accounted for 50 ± 11% and 45 ± 11% of total micronekton abundance and biomass undergoing DVM. This should also be equivalent to the percent change in relative abundance and biomass between the daytime DSL and nighttime DSL. Instead, the percent decrease in abundance and biomass in the DSL between day and night is 30% and 31%, while the percent increase in both abundance and biomass in SSL between day and night is 502% and 507%. Thus, the decrease in DSL abundance and biomass between day and night is not sufficient to drive the increase in SSL at night suggesting that a portion of migratory micronekton appearing in the SSL at night did not originate from the DSL. This supports the hypothesis that there is a component of diel horizontal migration and/or deep-sea influx occurring in the sampling area (Benoit-Bird and Au, 2001), which may contribute to an increase in abundance and biomass in both the DSL and SSL at night. Although it is not possible to quantify the effects on our estimates of active carbon transport specifically, we do not expect that this effect would have a large impact on our overall estimate of active carbon transport. These organisms are likely still migrating below the mixed layer during the day and thus contributing to downward active carbon transport.
4.4 Model uncertainty
Organisms were individually measured to the nearest millimeter, and taxa-specific length–weight relationships were applied allowing for more accurate estimates of individual biomass for organisms captured in the three sampling gears. These values were combined with empirical equations from the literature to calculate rate processes on an individual basis, thus accounting for both size and temperature. However, it is important to recognize the uncertainties associated with each of the models applied. Respiration was estimated using size-, temperature-, and taxa-specific rate equations from the literature, which reported that size and temperature explained 87%–95% of the variation in respiratory oxygen uptake (Ikeda, 2014; Ikeda, 2016; Donnelly and Torres, 1988; Ikeda, 2013; Henschke et al., 2019). Therefore, the uncertainty associated with respiration is likely minimal. Excretion was estimated based on Steinberg et al. (2000), which reported that the excretory flux was consistently ~31% of the respiratory flux for crustaceans. By applying a range of values for excretory flux (i.e., 5%, 31%, and 42%; Tables 3, 4), we observed a maximum decrease of 6% in mean active carbon transport estimates when the excretory flux was assumed to be 5% of the respiratory flux. Thus, the uncertainty with this estimate had little effect on our final estimates of active carbon transport. Uncertainties also arise with the calculation of the mortality flux and gut flux, attributed to the growth/metabolism ratio (0.66) and assimilation efficiency (0.88), which were assumed to be the same for all taxa. To address the unquantified uncertainties associated with these values and improve our estimates of mortality and gut flux, additional studies are required.
5 Conclusions
Over the last two decades, estimating the influence of micronekton biomass on active carbon export for the surface layers has received increasing attention. This study contributes to this discussion by highlighting the limitations associated with using a single micronekton sampling gear to quantify active carbon transport. The total-, size- and taxa-specific differences in active carbon transport derived using the IKMT and HUFT, along with the wide range of estimates derived by the Cobb trawl, highlight net-specific sampling biases and the need for replication when it comes to quantifying rate processes for these highly patchy organisms. The differences in size range, taxonomic groups, location, time, depth, and sampling methodologies applied to quantify active carbon transport continues to make global comparisons difficult. This study underlines the need for standardized approaches using micronekton size distributions, while providing a foundation for the future intercomparisons of carbon transport estimates. We recommend that future studies employ two sampling gears with different effective size ranges, which ideally overlap in the upper/lower ends to target the entire micronekton community (e.g., the HUFT and Cobb trawl together). A size- and taxa-based approach can then be taken, averaging organism abundance and biomass in the overlapping size classes. More specifically, the gear-specific capture efficiency for each taxa within each size class can be used to establish a weighted average in overlapping size classes to combine samples from different gears. This will allow for more accurate whole community estimates of micronekton active carbon transport. However, additional studies focusing on standardizing gears, sampling methods, and incorporating acoustic to improve biomass estimates are required to correct for gear biases. In doing so, we can begin to address the poor representation of micronekton in global biogeochemical models.
Data availability statement
The original contributions presented in the study are included in the article/Supplementary Material. Further inquiries can be directed to the corresponding author.
Ethics statement
Ethical review and approval was not required for the animal study because as these samples were collected in 2004, no animal permits were required at the time.
Author contributions
LK led the design, analysis, interpretation, and writing. AB contributed to interpretation and writing. EP participated in field sampling, and contributed to conceptualization, interpretation, and writing. All authors contributed to the article and approved the submitted version.
Funding
This work was supported by: The Pacific Islands Fisheries Science Center in Honolulu, HI (NOAA); Harbor Branch Oceanography Institute, Fort Pierce, FL; National Research Council, Northwest Fisheries Sciences Center (NOAA); the University of British Columbia; and the Natural Sciences and Engineering Research Council of Canada (NSERC).
Acknowledgments
We are grateful to the officers and crew of the NOAA Ship Oscar Elton Sette, Dr. Michael Seki and his lab, and the Pacific Islands Fisheries Science Center in Honolulu, Hawaii (NOAA) for securing funds and ship time for this study. We are indebted to Dr. Seki, Dr. Richard Brodeur, Dr.Andrei Suntsov, and Larysa Pakhomova for their assistance in sorting micronekton samples during the voyage and in the laboratory. Special thank you to PICES for overseeing the logistics associated with the intercomparison study data used in this analysis. Finally, we would like to thank our two reviewers Réka Domokos and Anna Belcher for providing detailed and thoughtful reviews.
Conflict of interest
The authors declare that the research was conducted in the absence of any commercial or financial relationships that could be construed as a potential conflict of interest.
Publisher’s note
All claims expressed in this article are solely those of the authors and do not necessarily represent those of their affiliated organizations, or those of the publisher, the editors and the reviewers. Any product that may be evaluated in this article, or claim that may be made by its manufacturer, is not guaranteed or endorsed by the publisher.
Supplementary material
The Supplementary Material for this article can be found online at: https://www.frontiersin.org/articles/10.3389/fmars.2022.948485/full#supplementary-material
References
Anderson T. R., Martin A. P., Lampitt R. S., Trueman C. N., Henson S. A., Mayor D. J. (2018). Quantifying carbon fluxes from primary production to mesopelagic fish using a simple food web model. ICES J. Mar. Sci. 76, 690–701. doi: 10.1093/icesjms/fsx234
Angel M., Pugh P. R. (2000). Quantification of diel vertical migration by micronektonic taxa in the northeast Atlantic. Hydrobiologia 440, 161–179. doi: 10.1023/A:1004115010030
Ariza A., Garijo J. C., Landeira J. M., Bordes F., Hernández-León S. (2015). Migrant biomass and respiratory carbon flux by zooplankton and micronekton in the subtropical northeast Atlantic ocean (Canary islands). Prog. Oceanography 134, 330–342. doi: 10.1016/j.pocean.2015.03.003
Aumont O, Maury O, Lefort S, Bopp L. Evaluating the Potential Impacts of the Diurnal Vertical Migration by Marine Organisms on Marine Biogeochemistry. Global Biogeochemical Cycles (2018) 32, 1622–43. doi: 10.1029/2018GB005886
Baird R. C., Hopkins T. L., Wilson D. F., Bay Y. (1975). Diet and feeding chronology of diaphus taaningi ( myctophidae ) in the cariaco trench. Am. Soc. Ichthyologists Herpetologists 1975, 356–365. doi: 10.2307/1442891
Belcher A., Saunders R. A., Tarling G. A. (2019). Respiration rates and active carbon flux of mesopelagic fishes (Family myctophidae) in the Scotia Sea, southern ocean. Mar. Ecol. Prog. Ser. 610, 149–162. doi: 10.3354/meps12861
Benoit-Bird K. J., Au W. W. L. (2001). Target strength measurements of Hawaiian mesopelagic boundary community animals. J. Acoust Soc. Am. 110, 812–819. doi: 10.1121/1.1382620
Boyd P. W., Claustre H., Levy M., Siegel D. A., Weber T. Multi-faceted particle pumps drive carbon sequestration in the ocean. Nature (2019) 568, 327–35. doi: 10.1038/s41586-019-1098-2
Brett J. R., Groves T. D. D. (1979). “Physiological energetics,” in Bioenergetics and growth. Eds. Hoar W. S., Randall D. J., Brett J. R. (New York: Academic Press), p 279–p 352.
Brodeur R., Seki M. P., Pakhomov E. A., Suntsov A v. (2005). Micronekton - what are they and why are they important? PICES Press 13, 7–11.
Chen X., Fisher N. S., Baines S. B. (2014). Influence of algal iron content on the assimilation and fate of iron and carbon in a marine copepod. Limnol. Oceaongr. 59 (1), 129–140. doi: 10.4319/lo.2014.59.1.0129
Childress J. J., Nygaard M. H. (1973). The chemical composition of midwater fishes as a function of depth of occurence off southern California. Deep Sea Res. 20 (12), 1093–1109. doi: 10.1016/0011-7471(73)90023-5
Clarke T. A. (1973). Some aspects of the ecology of lanternfishes (Myctophidae) in the pacific ocean near Hawaii. Fish. Bull. US. 71, 401–433.
Clarke T. A. (1974). Some aspects of the ecology of storniatoid fishes in the pacific ocean near Hawaii. Fish. Bull. US. 72, 337–351.
Clarke T. A. (1983). Comparison of abundance estimates of small fishes by three towed nets and preliminary results of the use of small purse seines as sampling devices. Biol. Oceanography 2, 311–340.
Cotté C., Ariza A., Berne A., Habasque J., Lebourges-Dhaussy A., Roudaut G., et al. (2022). Macrozooplankton and micronekton diversity and associated carbon vertical patterns and fluxes under distinct productive conditions around the kerguelen islands. J. Mar. Syst. 226, 1–18. doi: 10.1016/j.jmarsys.2021.103650
Darnis G., Fortier L. (2012). Zooplankton respiration and the export of carbon at depth in the amundsen gulf (Arctic ocean). J. Geophysical Research: Oceans 117, 1–12. doi: 10.1029/2011JC007374
Davison P. C., Checkley D. M., Koslow J a., Barlow J. (2013). Carbon export mediated by mesopelagic fishes in the northeast pacific ocean. Prog. Oceanography 116, 14–30. doi: 10.1016/j.pocean.2013.05.013
Davison P, Lara-Lopez A, Koslow J. Mesopelagic fish biomass in the southern California current ecosystem. Deep-Sea Res Part II: Topical Stud Oceanography (2015) 112, 129–42. doi: 10.1016/j.dsr2.2014.10.007
Dilling L., Wilson J., Steinberg D., Alldredge A. (1998). Feeding by the euphausiid euphausia pacifica and the copepod calanus pacificus on marine snow. Mar. Ecol. Prog. Ser. 170, 189–201. doi: 10.3354/meps170189
Domokos R., Pakhomov E. A., Suntsov A. V., Seki M. P., Polovina J. J. (2010). Acoustic characterization of the mesopelagic community off the leeward coast of Oahu island, Hawaii. PICES Sci. Rep. 38, 19–26.
Donnelly J., Torres J. J. (1988). Oxygen consumption of midwater fishes and crustaceans from the eastern gulf of Mexico. Mar. Biol. 97, 483–494. doi: 10.1007/BF00391044
Dornan T., Fielding S., Saunders R. A., Genner M. J. (2019). Swimbladder morphology masks southern ocean mesopelagic fish biomass. Proc. R. Soc. B: Biol. Sci. 286, 2–8.
Dornan T., Fielding S., Saunders R. A., Genner M. J. (2022). Large Mesopelagic fish biomass in the southern ocean resolved by acoustic properties. Proc. R. Soc. B: Biol. Sci. 289, 2–10. doi: 10.1098/rspb.2019.0353
Drazen J. C., Reisenbichler K. R., Robison B. H. (2007). A comparison of absorption and assimilation efficiencies between four species of shallow- and deep-living fishes. Mar. Biol. 151), 1551–1558. doi: 10.1007/s00227-006-0596-6
Drazen J. C., Sutton T. T. (2016). Dining in the deep: The feeding ecology of deep-Sea fishes. Annu. Rev. Mar. Sci. 9, 337–366. doi: 10.1146/annurev-marine-010816-060543
Drazen J. C., Sutton T. T. (2017). Dining in the deep: The feeding ecology of deep-Sea fishes. Annu. Rev. Mar. Sci. 9, 337–366. doi: 10.1146/annurev-marine-010816-060543
Falkowski P. G., Laws E. A., Barber R. T., Murray J. W. Phytoplankton and their role in primary, new, and export production. Ocean Biogeochemistry: Role Ocean Carbon Cycle Global Change (2003) 69, 5–24.
Froese R., Thorson J. T., Reyes R. B. (2014). A Bayesian approach for estimating length-weight relationships in fishes. J. Appl. Ichthyology 30, 78–85. doi: 10.1111/jai.12299
Gødø O. R., Valdemarsen J. W., Engas A. (1994). Comparison of efficiency of standard andexperimental juvenile gadoid sampling trawls. ICES Mar. Sci. Symp 196, 196–201.
Gjøsaeter J., Kawaguchi K. (1980). A review of the world resources of mesopelagic fish. FAO Fish Tech Pap 193, 0–151.
Henschke N., Pakhomov E. A., Kwong L. E., Everett J. D., Laiolo L., Coghlan A. R., et al. (2019). Large Vertical migrations of Pyrosoma atlanticum play an important role in active carbon transport. J. Geophysical Research: Biogeosciences 124, 2018JG004918. doi: 10.1029/2018JG004918
Hernández-León S., Olivar M. P., Fernández de Puelles M. L., Bode A., Castellón A., López-Pérez C., et al. (2019). Zooplankton and micronekton active flux across the tropical and subtropical Atlantic ocean. Front. Mar. Sci. 6, 1–20. doi: 10.3389/fmars.2019.00535
Hidaka K., Kawaguchi K., Murakami M., Takahashi M. (2001). Downward transport of organic carbon by diel migratory micronekton in the western equatorial pacific. Deep Sea Res. Part I: Oceanographic Res. Papers 48, 1923–1939. doi: 10.1016/S0967-0637(01)00003-6
Hopkins T. L., Baird R. C. (1977). “Aspects of the feeding ecology of oceanic midwater fishes,” in Oceanic sound scattering prediction. Eds. Andersen N. R., Zahuranec B. J. (New York: Plenum Press), p 325–p 260.
Hudson J. M., Steinberg D. K., Sutton T. T., Graves J. E., Latour R. J. (2014). Myctophid feeding ecology and carbon transport along the northern mid-Atlantic ridge. Deep-Sea Res. Part I: Oceanographic Res. Papers 93, 104–116. doi: 10.1016/j.dsr.2014.07.002
Ikeda T. (2013). Respiration and ammonia excretion of euphausiid crustaceans: Synthesis toward a global-bathymetric model. Mar. Biol. 160, 251–262. doi: 10.1007/s00227-012-2150-z
Ikeda T. (2014). Synthesis toward a global model of metabolism and chemical composition of medusae and ctenophores. J. Exp. Mar. Biol. Ecol. 456, 50–64. doi: 10.1016/j.jembe.2014.03.006
Ikeda T. (2016). Routine metabolic rates of pelagic marine fishes and cephalopods as a function of body mass, habitat temperature and habitat depth. J. Exp. Mar. Biol. Ecol. 480, 74–86. doi: 10.1016/j.jembe.2016.03.012
Irigoien X., Klevjer T. A., Røstad A., Martinez U., Boyra G., Acuña J. L., et al. (2014). Large Mesopelagic fishes biomass and trophic efficiency in the open ocean. Nat. Commun. 5, 3271. doi: 10.1038/ncomms4271
Isaacs J.D., Kidd L.W. (1953). Isaacs-Kidd midwater trawl: Final Report. Ref. 53-3. Scripps Institute of Oceanography, University of California. Available at: https://apps.dtic.mil/sti/pdfs/AD0895931.pdf
Itaya K., Fujimori Y., Shiode D., Aoki I., Yonezawa T., Shimizu S., et al. (2001). Sampling performance and operational quality of a frame trawl used to catch juvenile fish. Fish. Sci. 67, 436–443. doi: 10.1046/j.1444-2906.2001.00279.x
Kaardvedt S., Staby A., Aksnes D. L. (2012). Efficient trawl avoidance by mesopelagic fishes causes large underestimation of their biomass. Mar. Ecol. Prog. Ser. 2, 456. doi: 10.3354/meps09785
Kaartvedt S., Staby A., Aksnes D. L. (2012). Efficient trawl avoidance by mesopelagic fishes causes large underestimation of their biomass. Mar. Ecol. Prog. Ser. 456, 1–6. doi: 10.3354/meps09785
Kerr S. R., Dickie L. M. (2001). The biomass spectrum: A predator–prey theory of aquatic production (New York: Columbia University Press).
Klevjer T. A., Irigoien X., Røstad A., Fraile-Nuez E., Benítez-Barrios V. M., Kaartvedt. S. (2016). Large Scale patterns in vertical distribution and behaviour of mesopelagic scattering layers. Sci. Rep. 6, 1–11. doi: 10.1038/srep19873
Klevjer T. A., Melle W., Knutsen T., Strand E., Korneliussen R., Dupont N., et al. (2019). Micronekton biomass distribution, imporoved estimates across four north Atlantic basins. Deep. Res. Part II Top. Stud. Oceanogr. 180, 104691. doi: 10.1016/j.dsr2.2019.104691
Kloser RJ, Ryan T, Sakov P, Williams A, Koslow JA. Species identification in deep water using multiple acoustic frequencies. Can J Fish. Aquat. Sci (2002) 59, 1065–77. doi: 10.1139/f02-076
Kloser R. J., Ryan T. E., Young J. W., Lewis M. E. (2009). Acoustic observations of micronekton fish on the scale of an ocean basin: Potential and challenges. ICES J. Mar. Sci. 66, 998–1006. doi: 10.1093/icesjms/fsp077
Kobari T., Steinberg D. K., Ueda A., Tsuda A., Silver M. W., Kitamura M. (2008). Impacts of ontogenetically migrating copepods on downward carbon flux in the western subarctic pacific ocean. Deep-Sea Res. Part II: Topical Stud. Oceanography 55, 1648–1660. doi: 10.1016/j.dsr2.2008.04.016
Koslow A. J., Kloser R. J., Williams A. (1997). Pelagic biomass and community structure over the mid-continental slope off southeastern Australia based upon acoustic and midwater trawl sampling. Mar. Ecol. Prog. Ser. 146, 21–35. doi: 10.3354/meps146021
Kwong L. E., Henschke N., Pakhomov E. A., Everett J. D., Suthers I. M. (2020). Mesozooplankton and micronekton active carbon transport in contrasting eddies. Front. Mar. Sci. 6. doi: 10.3389/fmars.2019.00825
Kwong L. E., Pakhomov E. A., Suntsov A v., Seki M. P., Brodeur R. D., Pakhomova L. G., et al. (2018). An intercomparison of the taxonomic and size composition of tropical macrozooplankton and micronekton collected using three sampling gears. Deep-Sea Res. Part I: Oceanographic Res. Papers 135, 34–45. doi: 10.1016/j.dsr.2018.03.013
Lasker R. (1966). Feeding, growth, respiration, and carbon utilization of a euphausiid crustacean. J. Fisheries Res. Board Canada. 23 (9), 1291–1317. doi: 10.1139/f66-121
Andres RJ, Boden T, Conway T, Houghton RA, House JI, et al. (2013). The global carbon budget 1959–2011. Earth Syst. Sci. Data 5, 165–185. doi: 10.5194/essd-5-165-2013
Longhurst A. R., Beda A. W., Harrison W. G., Head E. J. H., Sameoto D. D. (1990). Vertical flux of respiratory carbon by oceanic diel migrant biota. Deep Sea Res. 37, 685–694. doi: 10.1016/0198-0149(90)90098-G
Marshall N. B. (1960). Swimbladder structure of deep-sea fishes in relation to their systematics and biology. Discovery Rep. 31, 1–122.
Methot R. D. (1986). Frame trawl for sampling pelagic juvenile fish. CalCOFI Rep. XXVII 267–278. Available at: http://www.calcofi.com/publications/calcofireports/v27/Vol_27_Methot.pdf
McNeely R. L. (1963). Development of the John M. Cobb pelagic trawl – A progress report. Commer. Fish. Rev. 25(7): 17–27. Available at: https://spo.nmfs.noaa.gov/sites/default/files/pdf-content/mfr2573.pdf
Nishikawa J., Nishida S., Moku M., Hidaka K., Kawaguchi K. (2001). Biomass, abundance, and vertical distribution of micronekton and large gelatinous zooplankton in the subarctic pacific and the Bering Sea during the summer of 1997. J. Oceanography 57, 361–375. doi: 10.1023/A:1012494931701
Pakhomov E. A., Perissinotto R., Mcquaid C. D. (1996). Prey composition and daily rations of myctophid fishes in the southern ocean. Mar. Ecol. Prog. Ser. 134, 1–14. doi: 10.3354/meps134001
Pakhomov E. A., Podeswa Y., Hunt B., Kwong L. E., Woodson C. B. (2018). Vertical distribution and active carbon transport by pelagic decapods in the north pacific subtropical gyre. ICES J. Mar. Sci 76 (3), 702–717. doi: 10.1093/icesjms/fsy134
Pakhomov E. A., Yamamura O. (2010). Report of the advisory panel on micronekton sampling inter-calibration experiment. PICES Sci. Rep. 38, 1–108.
Parsons T. R., Takahashi M., Hargrave B. (1984). Biological oceanographic processes (New York: Pergamon Press).
Pearcy W. G. (1983). Quantitative assessment of the vertical distributions of micronektonicfishes with opening/closing midwater trawls. Biol. Oceanogr. 2, 289–310. doi: 10.1080/01965581.1983.10749463
Platt T., Denman K. (1977a). Organisation in the pelagic ecosystem. Helgolander Wissenschaftliche Meeresunters 581, 575–581. doi: 10.1007/BF02207862
Proud R., Handegard N. O., Kloser R. J., Cox M. J., Brierley A. S. (2019). From siphonophores to deep scattering layers: uncertainty ranges for the estimation of global mesopelagic fish biomass. J. Mar. Sci. 76, 718–733. doi: 10.1093/icesjms/fsy037
R Core Team (2017). R: A language and environment for statistical computing (R Foundation for Statistical Computing).
Reid SB, Hirota J, Young RE, Hallacher LE (1991). Mesopelagic-boundary community in Hawaii: Micronekton at the inter-face between neritic and oceanic ecosystems. Mar. Biol. 109, 427–440. doi: 10.1007/BF01313508
Rodriguez J., Mullin M. M. (1986a). Diel and interannual variation of size distribution of oceanic zooplanktonic biomass. Ecology 67, 215–222. doi: 10.2307/1938521
Rodriguez J., Mullin M. M. (1986b). Relation between biomass and body weight of plankton in a steady state oceanic ecosystem. Limnol. Oceanogr. 31, 361–370.
Saba G. K., Burd A. B., Dunne J. P., Hernández-León S., Martin A. H., Rose K. A., et al. (2021). Toward a better understanding of fish-based contribution to ocean carbon flux. Limnology Oceanography 66, 1639–1664. doi: 10.1002/lno.11709
Sabine C. L., Feely R. A., Gruber N., Key R. M., Lee K., Bullister J. L., et al. (2004). The oceanic sink for anthropogenic CO2. Science 305 (1979), 367–371. doi: 10.1126/science.1097403
Schukat A., Bode M., Auel H., Carballo R., Martin B., Koppelmann R., et al. (2013). Pelagic decapods in the northern benguela upwelling system: Distribution, ecophysiology and contribution to active carbon flux. Deep-Sea Res. Part I: Oceanographic Res. Papers 75, 146–156. doi: 10.1016/j.dsr.2013.02.003
Sheldon R. W., Prakash A., Sutcliffe H. (1972). The size distribution of particles in the ocean. Limnology Oceanography XVII, 327–340. doi: 10.4319/lo.1972.17.3.0327
Sheldon R. W., Sutcliffe W. H., Paranjape M. A. (1977). Structure of pelagic food chain and relationship between plankton and fish production. J. Fisheries Res. Board Canada 34, 2344–2353. doi: 10.1139/f77-314
Siegel DA, Buesseler KO, Doney SC, Sailley SF, Behrenfeld MJ, Boyd PW. Global assessment of ocean carbon export by combining satellite observations and food-web models. Global Biogeochemical Cycles (2014) p, 1199–214. doi: 10.1002/2013GB004743.Received
Silvert W., Trevor P. (1978). Energy flux in the pelagic Ecosystem : A time-dependent equation. Limnology Oceanography 23, 813–816. doi: 10.4319/lo.1978.23.4.0813
Skjoldal H. R., Wiebe P. H., Postel L., Knutsen T., Kaartvedt S., Sameoto D. D. (2013). Intercomparison of zooplankton (net) sampling systems: Results from the ICES/GLOBEC sea-going workshop. Prog. Oceanography 108, 1–42. doi: 10.1016/j.pocean.2012.10.006
Stanton T. K., Chu D., Wiebe P. H. (1996). Acoustic scattering characteristics of several zooplankton groups. ICES J. Mar. Sci. 53, 289–295. doi: 10.1006/jmsc.1996.0037
Steinberg D. K., Carlson C. A., Bates N. R., Goldthwait S A., Madin L. P., Michaels A. F. (2000). Zooplankton vertical migration and the active transport of dissolved organic and inorganic carbon in the Sargasso Sea. Deep Sea Res. Part I: Oceanographic Res. 47, 137–158. doi: 10.1016/S0967-0637(99)00052-7
Steinberg DK, Cope JS, Wilson SE, Kobari T. A comparison of mesopelagic mesozooplankton community structure in the subtropical and subarctic North Pacific Ocean. Deep-Sea Res Part II: Topical Stud Oceanography (2008) 55, 1615–35. doi: 10.1016/j.dsr2.2008.04.025
Suthers I. M., Taggart C. T., Rissik D., Baird M. E. (2006). Day and night ichthyoplankton assemblages and zooplankton biomass size spectrum in a deep ocean island wake. Mar. Ecol. Prog. Ser. 322, 225–238. doi: 10.3354/meps322225
Thompson G. A., Dinofrio E. O., Alder V. A. (2013). Structure, abundance and biomass size spectra of copepods and other zooplankton communities in upper waters of the southwestern Atlantic ocean during summer. J. Plankton Res. 35, 610–629. doi: 10.1093/plankt/fbt014
Volk T., Hoffert M. I. (1985). The carbon cycle and atmospheric CO2: Natural variations archean to present, volume 32 ocean carbon pumps: Analysis of relative strengths and efficiencies in ocean-driven atmospheric CO2 changes. Geophysical Monograph Ser. 32, 99–110.
Voronina N. M., Pakhomov E. A. (1998). How accurate are trawl krill biomass estimates? Oceanology 38 (2), 211–212.
Williams A., Koslow J. A. (1997). Species composition, biomass and vertical distributionof micronekton over the mid-slope region offsouthern Tasmania, Australia. Mar. Biol. 130, 259–276. doi: 10.1007/s002270050246
Young J. W., Hunt B. P. V., Cook T. R., Llopiz J. K., Hazen E. L., Pethybridge H. R., et al. (2015). The trophodynamics of marine top predators: Current knowledge, recent advances and challenges. Deep-Sea Res. Part II: Topical Stud. Oceanography 113, 170–187.
Zhang X., Dam H. G. (1997). Downward export of carbon by die1 migrant mesozooplankton in the central equatorial pacific. Deep-Sea Res. Part II 44, 2191–2202. doi: 10.1016/S0967-0645(97)00060-X
Zhou M. (2006). What determines the slope of a plankton biomass spectrum? J. Plankton Res. 28, 437–448. doi: 10.1093/plankt/fbi119
Zhou M., Carlotti F., Zhu Y. (2010). A size-spectrum zooplankton closure model for ecosystem modelling. J. Plankton Res. 32, 1147–1165. doi: 10.1093/plankt/fbq054
Keywords: micronekton, size spectra, active carbon transport, sampling bias, net comparison
Citation: Kwong LE, Bahl AA and Pakhomov EA (2022) Variability in micronekton active carbon transport estimates on the Southwest Coast of Oahu using three different sampling gears. Front. Mar. Sci. 9:948485. doi: 10.3389/fmars.2022.948485
Received: 19 May 2022; Accepted: 16 August 2022;
Published: 26 September 2022.
Edited by:
Helena Hauss, Helmholtz Association of German Research Centres (HZ), GermanyReviewed by:
Réka Domokos, National Oceanic and Atmospheric Administration (NOAA), United StatesAnna Belcher, British Antarctic Survey (BAS), United Kingdom
Copyright © 2022 Kwong, Bahl and Pakhomov. This is an open-access article distributed under the terms of the Creative Commons Attribution License (CC BY). The use, distribution or reproduction in other forums is permitted, provided the original author(s) and the copyright owner(s) are credited and that the original publication in this journal is cited, in accordance with accepted academic practice. No use, distribution or reproduction is permitted which does not comply with these terms.
*Correspondence: Lian E. Kwong, bGt3b25nQGVvYXMudWJjLmNh