 Michael G. Novak1,2*
 Antonio Mannino1*
 J. Blake Clark1,3,4
 Peter Hernes5
 Maria Tzortziou6Robert G. M. Spencer7
 Anne M. Kellerman7Brice Grunert6,8
- 1Ocean Ecology Laboratory (Code 616), NASA Goddard Space Flight Center, Greenbelt, MD, United States
- 2Hydrosphere, Biosphere, and Geophysics (HBG) support services, Science Systems and Applications Inc, Lanham, MD, United States
- 3NASA Postdoctoral Program Goddard Space Flight Center, Universities Space Research Association, Greenbelt, MD, United States
- 4Goddard Earth Sciences Technology and Research II, University of Maryland, Baltimore County, MD, United States
- 5Department of Land, Air and Water Resources, University of California, Davis, CA, United States
- 6Department of Earth and Atmospheric Sciences, The City College of New York, The City University of New York, New York, NY, United States
- 7National High Magnetic Field Laboratory Geochemistry Group and Department of Earth, Ocean & Atmospheric Science Florida State University, Tallahassee, FL, United States
- 8Biological, Geological and Environmental Sciences, Cleveland State University Cleveland, OH, United States
Arctic landscapes are warming and becoming wetter due to changes in precipitation and the timing of snowmelt which consequently alters seasonal runoff and river discharge patterns. These changes in hydrology lead to increased mobilization and transport of terrestrial dissolved organic matter (DOM) to Arctic coastal seas where significant impacts on biogeochemical cycling can occur. Here, we present measurements of dissolved organic carbon (DOC) and chromophoric DOM (CDOM) in the Yukon River-to-Bering Sea system and two river plumes on the Alaska North Slope which flow into the Beaufort Sea. Our sampling characterized optical and biogeochemical properties of DOM during high and low river discharge periods for the Yukon River-Bering Sea system. The average DOC concentration at the multiple Yukon River mouths ranged from a high of 10.36 mg C L-1 during the ascending limb of the 2019 freshet (late May), 6.4 mg C L-1 during the descending limb of the 2019 freshet (late June), and a low of 3.86 mg C L-1 during low river discharge in August 2018. CDOM absorption coefficient at 412 nm (aCDOM(412)) averaged 8.23 m-1, 5.07 m-1, and 1.9 m-1, respectively. Several approaches to model DOC concentration based on its relationship with CDOM properties demonstrated cross-system seasonal and spatial robustness for these Arctic coastal systems despite spanning an order of magnitude decrease in DOC concentration from the lower Yukon River to the Northern Bering Sea as well as the North Slope systems. “Snapshot” fluxes of DOC and CDOM across the Yukon River Delta to Norton Sound were calculated from our measurements and modeled water fluxes forced with upstream USGS river gauge data. Our findings suggest that during high river flow, DOM reaches the delta largely unaltered by inputs or physical and biogeochemical processing and that the transformations of Yukon River DOM largely occur in the plume. However, during low summer discharge, multiple processes including local precipitation events, microbial decomposition, photochemistry, and likely others can alter the DOM properties within the lower Yukon River and Delta prior to flowing into Norton Sound.
Introduction
In recent decades, the Arctic has experienced rapid change, with surface air temperatures increasing at about twice the rate of the global average (Spielhagen et al., 2011; Schuur et al., 2015; Meredith et al., 2019). Consequently, sea-ice has decreased throughout the year, notably faster in late summer months (Goosse et al., 2018), and the open-water season in lakes and rivers in the Arctic have lengthened (Magnuson et al., 2000; Brabets and Walvoord, 2009; Meier and Dewes, 2020). Warming air temperature paired with changing precipitation patterns (Rawlins, 2010; Toohey et al., 2016) have implications for the Pan-Arctic hydrological system including increased river discharge (Q) to the Arctic Ocean (Peterson et al., 2002; Mcclelland et al., 2006; Feng et al., 2021). Typically, this leads to changes in riverine chemistry as the flow of materials off the landscape evolve, and this is especially true for dissolved organic matter (DOM). However, our knowledge of DOM dynamics downstream of gauging stations that can be 100+ river km upstream from Arctic river mouths is limited.
Current estimates of total organic carbon (TOC) stored in terrestrial soils of the Arctic circumpolar region are 1460-1600 Pg (Schuur et al., 2018; Meredith et al., 2019), which is more than double the amount of carbon found in the atmosphere (Tarnocai et al., 2009; Schaefer et al., 2014). The mobilization of northern latitude terrestrial carbon stocks through hydrological processes is a rich source of reduced carbon for microbial metabolism, the mineralization of which could be a significant source of CO2 to the atmosphere with global warming implications (Tarnocai et al., 2009; Biskaborn et al., 2019). As permafrost thaw expands the volume of the active layer and the magnitude and timing of riverine discharge change, the transport of dissolved organic carbon (DOC) through lacustrine and riverine systems to the coast can have significant effects on biogeochemical cycling in the Arctic Ocean (Peterson et al., 2002; Striegl et al., 2005; Spencer et al., 2008).
Hydrodynamics and DOM cycling are intrinsically linked, yet this relationship is more complex due to the unique characteristics of the water cycle in the Arctic region with respect to lower latitude systems. The Arctic Ocean receives ten percent of global freshwater discharge from rivers, yet the Arctic Ocean basin only accounts for one percent of total ocean volume (Holmes et al., 2011; Mcclelland et al., 2012). Hence, the Arctic coastal margin is generally fresher than other ocean margins. Arctic rivers have highly seasonal discharge patterns with low flow in the winter followed by a rapid increase to peak discharge during the freshet, with substantial interannual variability that is connected to snow and ice cover (Spencer et al., 2008; Mann et al., 2016). This large influx of freshwater to the coastal environment can generate estuarine-like characteristics that extend many kilometers from the coast into the Arctic Ocean (Mcclelland et al., 2012). At the outflow of rivers, extreme salinity gradients exist and specific transformations of DOM such as flocculation (Hernes and Benner, 2003; Asmala et al., 2014) and photochemical degradation occur (Grunert et al., 2021). Several studies have looked at DOC concentration and DOM chemical properties in the six largest Arctic rivers as part of the Arctic Great Rivers Observatory (Arctic-GRO) (Holmes et al., 2021a; Holmes et al., 2021b). Of these six great arctic rivers, the Yukon River is the fifth largest in terms of discharge and has been studied seasonally and throughout the stages of greatest variability in its hydrograph (Spencer et al., 2008; Stedmon et al., 2011; Mann et al., 2016). These previous works were centered on measurements made at Pilot Station, the furthest downstream Yukon River site that is gauged by the US Geological Survey (USGS) and sampled periodically by the Arctic-GRO program, as well as stations further upstream from Pilot Station. There is a fundamental gap in measurements and general knowledge on DOM sources, sinks and transformations in waters flowing downstream of Pilot Station through the delta, river mouths, proximate and distal areas of the river plume, and beyond to Norton Sound and northern Bering Sea. Similarly, measurements are lacking in many small Arctic rivers, plumes and adjacent seas such as those along the North Slope of Alaska including the Hulahula and Jago River systems.
A significant portion of newly mobilized aquatic carbon is comprised of plant-derived lignin and other high molecular weight aromatic molecules (Holmes et al., 2008; Hernes et al., 2009; Spencer et al., 2009). The aromaticity of these molecules is largely responsible for the light absorbing capabilities of chromophoric dissolved organic matter (CDOM), the optically active component of the DOM pool (Del Vecchio and Blough, 2004). The shape and magnitude of CDOM absorption spectra have been shown to contain valuable information about the quantity and composition of DOM (Helms et al., 2008; Hernes et al., 2009). Microbial and photochemical processes break down these molecules into smaller compounds, changing the magnitude and optical signature of CDOM and its relationship to DOC concentration (Hernes and Benner, 2006; Tzortziou et al., 2008; Grunert et al., 2021). Despite such changes between CDOM optical properties and DOC concentration, CDOM can be directly related to DOC concentration in lakes, rivers, estuaries, and coastal ocean waters (Spencer et al., 2013; Mannino et al., 2014; Cao et al., 2018). Optical instruments on remote sensing platforms can be used to retrieve CDOM absorption and spectral slope from the observed water-leaving radiances. Development and application of algorithms (e.g. statistical relationships) that can estimate DOC concentration from the remotely sensed CDOM optical properties can greatly increase the temporal and spatial coverage of DOC and CDOM measurements (Mannino et al., 2008; Fichot et al., 2013; Mannino et al., 2016).
To investigate DOM properties and transport across the river to sea interface of a major Arctic River system, we collected and analyzed optical measurements and water samples from multiple channels within the Yukon River delta and adjacent Norton Sound in 2018 and 2019. Pilot Station hydrographic data along with Arctic-GRO DOM measurements were used to model DOM at Pilot station during our Yukon field sampling and assess whether DOM transformations were occurring downstream. To identify whether changes in the timing and magnitude of discharge that could affect biogeochemical cycling were occurring, a trend analysis of the Pilot Station hydrographic time series from 1976-2020 was carried out. Additionally, to ascertain whether these observed DOM properties are consistent across broad sampling regions in the Arctic, the outflows of two smaller river systems located on the North Slope near Kaktovik, Alaska were sampled in August 2019. The objectives of this study were: (1) to examine how CDOM absorption characteristics relate to DOC concentration and how this relationship changes temporally and spatially in these highly dynamic systems; (2) to assess how seasonal processes in the Yukon River-Norton Sound system -including river discharge patterns -impact DOC concentrations as well as CDOM properties, and identify how these DOM constituents change while transiting across the salinity gradient; (3) to investigate whether the lower Yukon watershed, river, and delta contribute to or transform DOM flowing downstream from Pilot Station; and (4) to estimate the magnitude of DOM fluxes from the lower Yukon River to Norton Sound. This study presents new and unique measurements within the lower Yukon River located far downstream from Pilot Station and extends across the salinity gradient into the Norton Sound as well as the coastal area between the outflows of the Jago and Hulahula rivers and the Beaufort Sea. Our study builds on prior work characterizing DOC to CDOM relationships and investigates the robustness of these relationships in our particular study regions. Furthermore, we provide an assessment of four different modeling approaches to derive DOC concentration from CDOM optical properties and tailored the wavelengths to be more amenable to remote sensing applications. While prior work through Arctic-GRO and other projects have studied DOC concentrations and CDOM optical properties within the Yukon River at Pilot Station and upstream sites (Spencer et al., 2008; Mann et al., 2016), this study fills a much-needed gap in our understanding of DOM properties in dynamic areas not sampled in prior studies along the land-ocean continuum in these rapidly changing Arctic ecosystems.
Methods
Study sites
Water samples and optical measurements were collected throughout the Yukon River Delta and adjacent Norton Sound during field campaigns conducted in 2018 and 2019 (Figure 1, Table 1). The Yukon River drains a catchment area of 853,300 km2 underlain by several types of permafrost and classes of dominant vegetation (Spencer et al., 2008). The 3340 km length river stretches from northwestern Canada across Alaska, draining into the Bering Sea via Norton Sound (Figure 1A). Many of the tributaries feeding the Yukon River are blackwater rivers that carry high concentrations of DOC and CDOM and originate from permafrost wetlands or predominately peat vegetation (Striegl et al., 2007). The USGS has maintained a long-term stream gauge on the Yukon River at Pilot Station (61.9344° N, -162.881° W, #15565447) located about 190 km upstream from the Yukon River mouths (Figure 1B). The river splits off into three main channels downstream from Pilot Station, the North, Middle, and South Mouths. For this research the main stems of the Middle and South Mouths were sampled; however, a smaller channel slightly to the east of the main North Mouth output was sampled to represent the North Mouth. It will be referred to as the north mouth alternative channel (NAC) for the remainder of this article. Two smaller channels, the Alakanuk and Emmonak Channels, were included in this survey (Figure 1B).
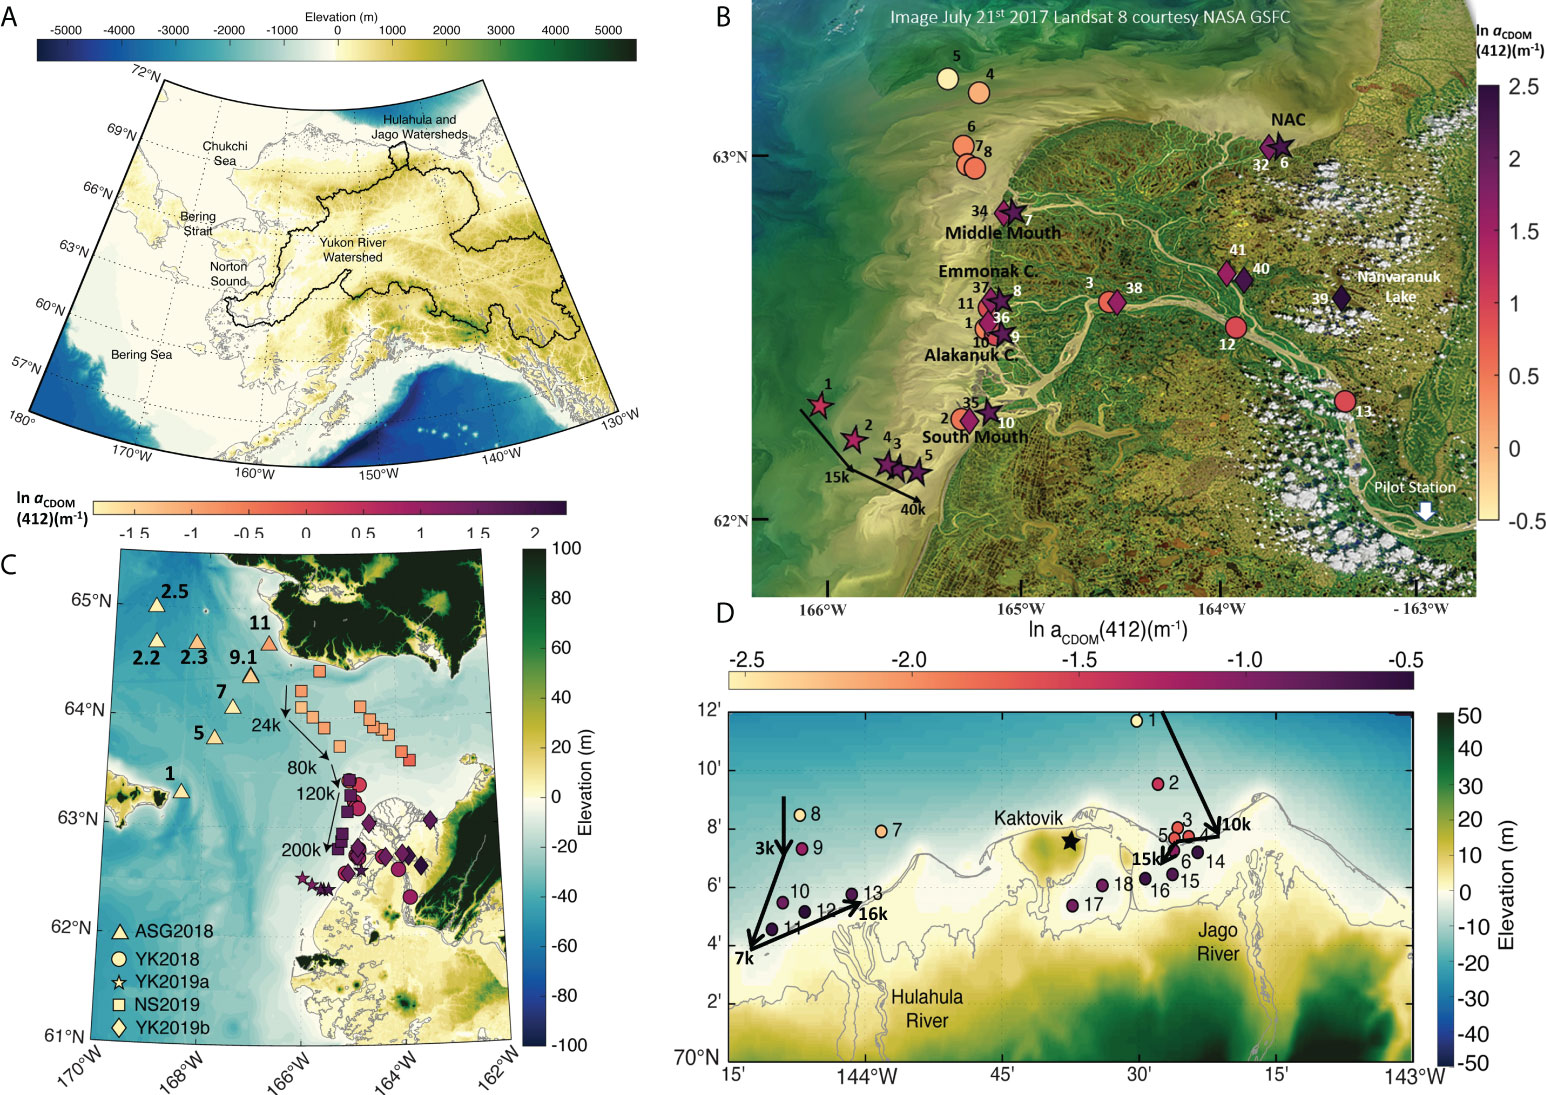
Figure 1 (A) Elevation map showing the location of the study regions with the extent of their watersheds outlined in black (B) natural log of CDOM absorption coefficient at 412 nanometers (nm) (ln aCDOM(412)(m-1)) for the Yukon River, delta and plume overlain a Landsat 8 RGB image from July 21st 2017. The arrows illustrate the direction and distance traveled during the South Mouth transect and correspond to the FDOM cross section depicted in Figure 4A. (C) ln aCDOM(412)(m-1)) measured 2018 in the Bering Sea and 2019 in the Norton Sound. The arrows show the distance of the Norton Sound transect and correspond to the FDOM cross section shown in Figure 4B. (D) ln aCDOM(412)(m-1)) from the Kaktovik field deployments on the North Slope. The arrows illustrate the distance traveled during the Jago and Hulahula River transects correspond to the FDOM cross sections depicted in Figures 5A, 5B respectively.
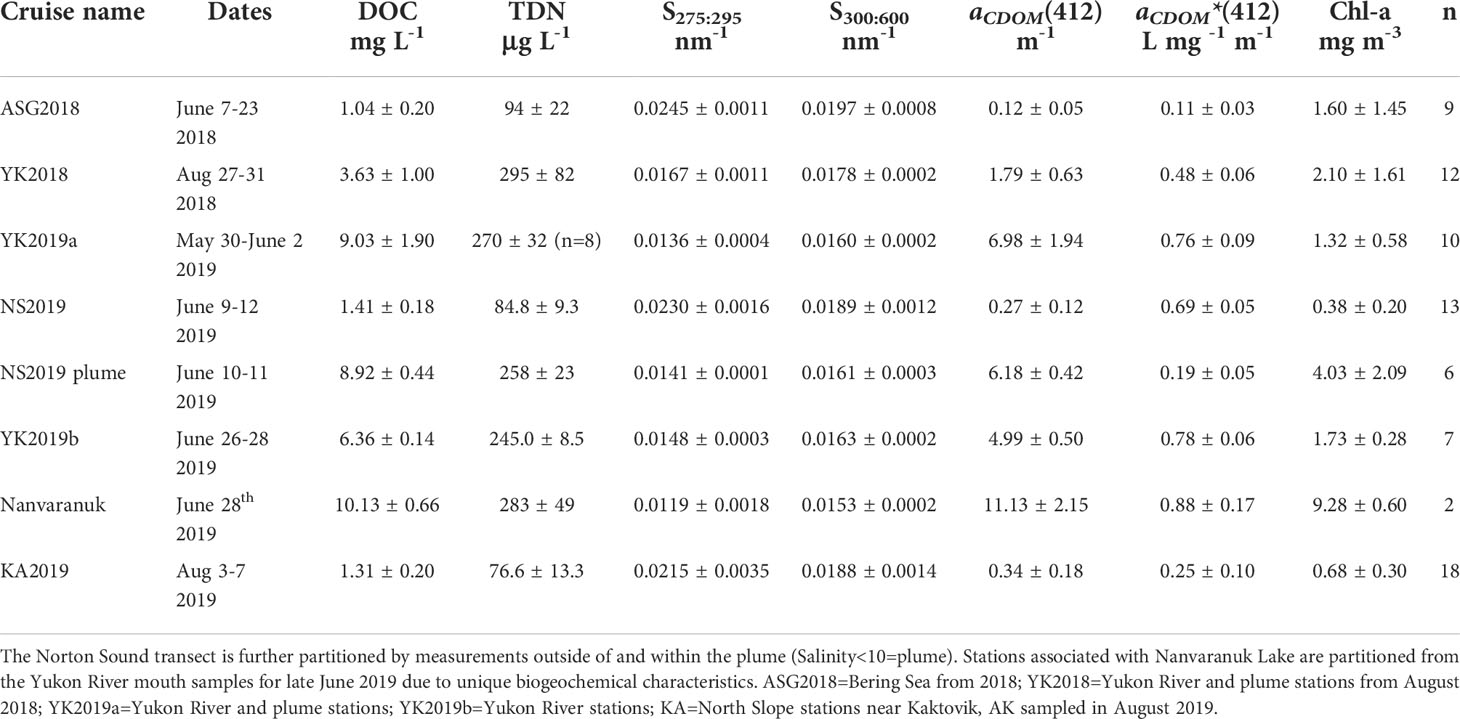
Table 1 Means and standard deviations of biogeochemical (dissolved organic carbon [DOC mg L-1], total dissolved nitrogen [TDN μg L-1 ], Chl a [chlorophyll-a mg m-3] and CDOM optical properties (CDOM spectral slope between 275-295 nm [S275:295 nm-1], and 300-600 nm [S300:600 nm-1], and aCDOM(412)(m-1) by region and field deployment.
All field sampling was carried out by members of our research team with the exception of the fieldwork in June of 2018. DOM samples were collected in collaboration with the Arctic Shelf Growth, Advection, Respiration and Deposition (ASGARD) project in the Bering Sea to the west of the Norton Sound and South of the Bering Strait (Figure 1C). The samples were collected following our protocols and analyzed by our instruments, to ensure consistency across the dataset. Also of note, there was a heavy localized rainfall event that occurred during the 2018 Yukon Delta sampling, stations 10-13 were sampled immediately after the rainfall while all other stations during this deployment preceded the rainfall event.
Additionally, in August of 2019, a research team deployed from Kaktovik, AK located in the North Slope borough of Alaska adjacent to the Beaufort Sea in collaboration with the U.S. National Science Foundation’s Long-Term Ecological Research (LTER) Beaufort Sea Lagoons: An Arctic Coastal Ecosystem in Transition project. Large portions of the North Slope of Alaska are lined with shallow lagoons that are isolated from the Beaufort Sea by barrier islands. The coastlines are vulnerable to high rates of erosion which exposes the continuous land permafrost and is subsequently inundated (Pedrazas et al., 2020). Sampling occurred between the Hulahula and Jago River deltas including their lagoon systems and offshore into the Beaufort Sea (Figure 1D; Table 1). The lagoons near Kaktovik are separated from the Beaufort Sea by Barter and Arey Islands, as well as several other unnamed shoals. The headwaters of each river originate from the eastern Alaskan portion of the Brooks Range and flow through the Arctic National Wildlife Refuge (ANWR), traveling approximately 150 km before reaching the Beaufort Sea.
Sample collection
Discrete surface samples were collected for biogeochemical and optical analyses by pumping near-surface water (~10-30 cm) with a peristaltic pump into acid-cleaned and sample-rinsed polypropylene or polyethylene bottles. A Seabird SBE25 was used to measure vertical profiles of conductivity, temperature, and depth (CTD) at each station. In addition, a SeaBird Scientific ECO triplet was deployed on the optics-CTD package with one of the channels configured to measure DOM fluorescence (FDOM) using excitation/emission wavelengths of 370nm/460nm, respectively. The instrument was calibrated to quinine sulfate units reported in parts per billion (ppb). Quinine sulfate fluoresces similarly to FDOM and expresses a linear response with concentration. However, the relationship between CDOM absorption and fluorescence is not always linear and can be dependent on the source of carbon (Oestreich et al., 2016). Therefore, this measurement was used only as a proxy for DOM properties and can only provide qualitative insights into the distributions of DOM in the water column. Downcasts of each profile were used in final data processing, and measurements were binned into 0.1-meter increments. The profiles were imported into the Ocean Data View (ODV, https://odv.awi.de, 2021) software package designed for viewing and analyzing oceanographic data (Schlitzer, 2021). Vertical distributions of FDOM were interpolated using Data-Interpolating Variational Analysis (DIVA) that allows for manipulation of the results based on coastlines, basins, and other features.
DOM analysis
Samples were collected from near surface waters using a peristaltic pump with an inline Geotech 0.45-micron Versapor polyethersulfone (PES) capsule filter (Yukon delta and Norton Sound) or Saint-Gobain 0.2-micron PureFlo Z series (PES) capsule filter (Kaktovik region) directly into combusted amber glass 125 ml bottles for CDOM and into 40ml vials for DOC. DOC samples were collected in duplicate or triplicate at all stations, whereas periodic duplicate CDOM samples were collected (~10%). Filters were rinsed copiously with sample water prior to rinsing and filling sample containers. On the ASGARD cruise, GF-75 disk glass fiber filters with 0.3-micron nominal pore size were used to filter for DOM samples directly into sample containers using a Kontes vacuum filtration dome. All amber bottles were combusted at 450◦ C for 8 hours before going to the field. CDOM samples were stored cold (~4◦C) and in the dark until analyzed within a month of collection. DOC sample vials were amended with a small volume of 6 N hydrochloric acid (ACS+ grade or better; 30 microliters) and stored cold (~4◦C) and then frozen at <0◦C upon reaching shore. DOC samples were analyzed within 4 months of collection apart from DOC samples from YK2019a, which were stored for over a year. The DOC value from station 8 collected on YK2019a in the Emmonak channel was corrected with archived CDOM and DOC samples (See Supplemental Section for details).
In the laboratory, DOC samples were thawed and then sonicated for 20 minutes in a ultrasonic bath sonicator before analysis. A Shimadzu TOC-L or TOC-V using the high temperature combustion catalytic oxidation method equipped with a total nitrogen unit was used to measure dissolved organic carbon (DOC) and total dissolved nitrogen (TDN) concentrations (Mannino et al., 2008; Mannino et al., 2016). The carbon standard potassium hydrogen phthalate (KHP) and nitrogen standard potassium nitrate (KNO3) were used to generate calibrations curves before each instrument run. Due to the broad range of DOC values, two five-point calibration curves were performed on approximately 4 parts per million (ppm) and 10 ppm KHP standards. For nitrogen, a five-point calibration curve from approximately 4 ppm TN was measured to determine TDN concentration. Ultrapure water blanks (ultraviolet oxidized Milli-Q) were measured every three samples in the analysis queue to assess the instrument carbon blank, and the average water blank was subtracted from all sample values. Several check standards of single concentration KHP and KNO3 were interspersed among samples per sample batch. Deep seawater (DSR) consensus reference material (CRM; Rosenstiel School Hansell Organic Biogeochemistry Lab) was analyzed several times throughout each instrument sample batch run to verify measurement accuracy. The carbon and nitrogen DSR materials measured with these samples were within reported values (DSR lot 10-17; 43.18 +/- 1.07 μM C and 31.22 +/- 1.62 μM N; n=19). The average concentration of carbon measured in the ultrapure water blanks throughout these analyses was 5.4 ± 1.39 μM C. The average percent coefficient of variation (% cv) between the measured and actual KHP and KNO3 check standards were -1.4 ± 2.6% and -1.5 ± 4.8% respectively.
CDOM samples were warmed to room temperature and re-filtered through 47mm 0.2-micron PES disc filters using glass filter funnels and stems directly into sample amber glass bottle with a vacuum filtration dome. A Cary 100 UV-VIS dual beam spectrophotometer was used to measure CDOM absorbance in the wavelength range of 250-800 nm at a scan speed of 100 nm/min and a slit bandwidth of 4 nm (Mannino et al., 2008; Mannino et al., 2014). Samples were analyzed in a 10 cm Suprasil quartz cuvette that was rinsed three times with sample before filling, and ultrapure water was concurrently measured in the reference beam. Absorbance values were converted to Napierian absorption using Equation 2 where A corresponds to the absorbance value measured at a specific wavelength and L refers to the pathlength of the sample cuvette (10 cm).
The slope parameter was calculated by applying a non-linear iterative fitting routine that finds the best fit based on least squares regression between the measured and modeled data. Equation 3 was used with the MATLAB nlinfit.m function where a(λ) and a(λ0) refer to the absorption coefficients at λ and a reference wavelength λ0 and S is the slope of the fit. The value of the spectral slope calculation is strongly dependent upon the wavelength range over which it is calculated, and different spectral regions have been shown to correlate with various properties of DOM (Helms et al., 2008; Fichot and Benner, 2012). Therefore, the slope of the CDOM absorption spectra were calculated over several different wavelength ranges (i.e. 275:295nm, 300:600nm). The vast majority of the CDOM absorption spectra did not require correction for any baseline offsets; however, there were two samples from the Norton Sound that were generally low absorbing but had an offset due to scattering by small particles, microbubbles, or other unknown phenomena. These were corrected by adding a constant term K to the original equation and the fitted value for this term was subsequently subtracted from the entire spectra to correct for the offset (Stedman and Markager, 2003; Twardowski et al., 2004).
Two different labs measured CDOM absorbance, and we found excellent agreement among both labs [0.39% CV at aCDOM(412)].
DOC modeling
Four different mathematical approaches were investigated to relate DOC concentration to CDOM absorption properties. The CDOM absorption coefficient at 412nm (aCDOM(412)) was regressed against DOC concentration in mg L-1 and a linear relationship was fit to the data using a least squares type II linear regression model, which allows for variability in measurement error in both the X and Y parameters. The slope of the fit is derived from the geometric mean of the slopes calculated on the regression of Y on X and X on Y. Linear regression fits were applied to the entire data set as well as to subsets of the data partitioned by season or spatial region to evaluate the goodness of fit. The coefficients determined from the least squares fitting method were then used to model DOC concentration from CDOM absorption.
Following the methods described in Fichot and Benner, 2011, multiple linear regressions (MLR) of log transformed DOC to log transformed aCDOM(275) and aCDOM(295) were performed to derive DOC concentration using Equation 4 where A, B and C are the fitted coefficients while X and Z refer to aCDOM(275) and aCDOM(295), respectively. The data were first partitioned into two subsets based on the median of aCDOM(275) from the entire dataset. The median was 7.05 m-1 and the MLR was applied to the subsets of data below and above this value. The data were partitioned this way so that the MLR was not restrained by the large range of DOC values in this study (0.85-11.94 mg L-1) (Fichot and Benner, 2011).
The CDOM specific absorption coefficient (aCDOM*(412)) was calculated by dividing aCDOM(412) by the concentration of DOC in mg L-1. The slope parameter was determined using Equation 2 over the wavelength range of 275-295 nm (S275:295) and then regressed against aCDOM*(412). Non-linear fits to the regression were carried out with MATLAB software using nlinfit.m to determine the coefficients of a power model and an exponential model (Equations 5, 6) where y is equal to aCDOM*(412), x is equal to S275:295 and A, B, C and D are the derived fitting coefficients relevant to each model (Fichot and Benner, 2012; Mannino et al., 2016).
Each of the equations described above was rearranged to solve for DOC concentration with the derived fitting coefficients. The equations and fitted coefficients are all shown in Table 2. The skill of the models to predict DOC from CDOM properties was assessed using several statistical metrics where n is the number of observations and Mi and Oi are the modeled and observed values respectively at the ith observation. Previous research found that the most appropriate statistical parameters for assessing Ocean Color models with data that has outliers and non-Gaussian distribution were mean absolute error (MAE) and bias (Seegers et al., 2018; Mckinna et al., 2021). Therefore, the DOC models with the lowest MAE and absolute bias were considered “the best” in this study. Other statistics are reported for further insight into the model skill (Table 2).
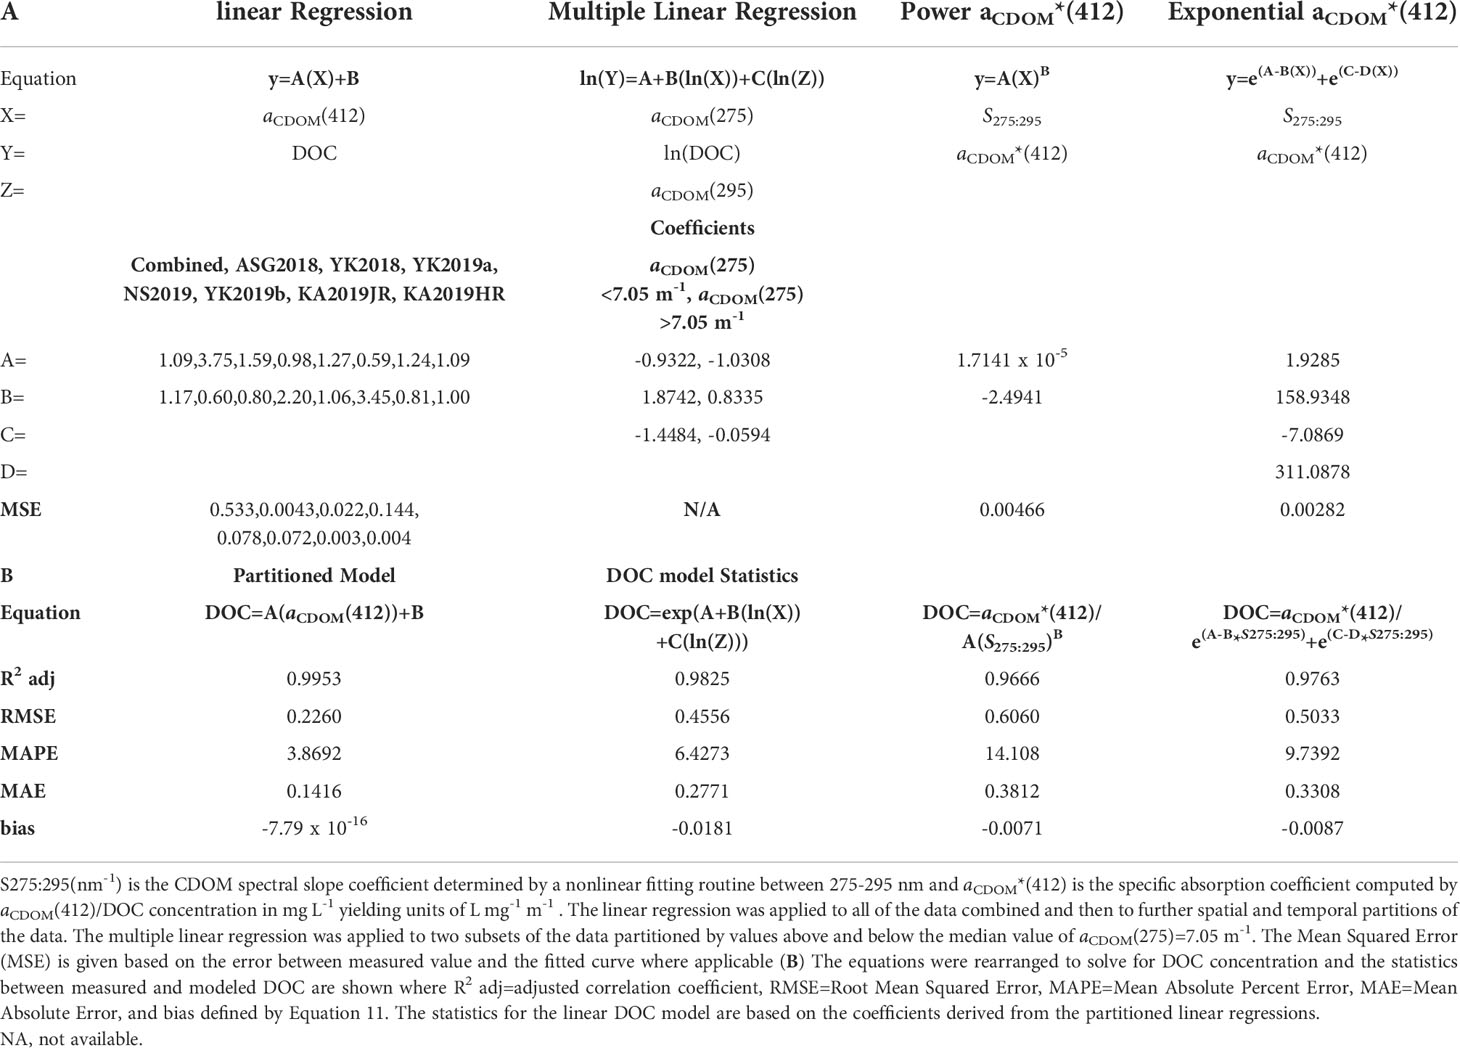
Table 2 (A) Equations used to relate CDOM optical properties to DOC concentrations (mg L-1) and the coefficients derived from the fitting routines where aCDOM(412), aCDOM(275), and aCDOM(295), refer to the absorption of CDOM (m-1) at 412, 275, and 295 nanometers (nm) respectively.
Phytoplankton pigment analysis
Whole water samples were either pumped from the surface waters into Nalgene pre-rinsed bottles or the bottle itself was inverted and submerged below the surface layer. Once below the surface, the bottle was tilted upwards and allowed to fill without influence from the surface boundary layer. The bottles were stored on ice until filtered onto glass fiber filters (Advantec GF-75; 0.3-micron nominal pore size) using a manifold with plastic filter funnels under low vacuum pressure, usually within 8 hours of collection. The filters were folded in half and then placed in aluminum foil pouches before flash freezing in a liquid nitrogen dry shipper.
Chlorophyll-a concentration (Chl a), along with a suite of other phytoplankton pigments, were quantified using High Performance Liquid Chromatography (HPLC) following established protocols (Van Heukelem and Thomas, 2001; Hooker et al., 2005). The samples were measured on an Agilent RR1200 equipped with a 4.6 x 150 mm HPLC Eclipse XDB-C8 column. The calibration for the instrument was performed with individual pigment standards. Their concentrations were determined spectrophotometrically using absorption coefficients in common with those used by most other laboratories (Hooker et al., 2005). On average, chlorophyll-a measurement uncertainty for our samples was 1.6%, which is within the range of typical uncertainties for HPLC pigment measurements of our laboratory (Thomas unpublished).
Stream gauge analysis
Daily average discharge values measured at Yukon River Pilot Station (USGS) were downloaded on June 10, 2021 from the USGS website (https://waterdata.usgs.gov/nwis/inventory/?site_no=15565447). The data set spans the years 1977-2020 with a gap in the data between the years 1996-2000 due to the instrument being offline. Dates were converted to “day of year” in order to compare multiple years of data. Leap years were handled by averaging the leap day discharge value with the preceding day’s discharge value and then removing the leap day from the time series to preserve continuity. Daily Volume was calculated from daily discharge using Equation 12 where V is equal total volume in km3, Q corresponds to the average daily discharge reported in m3 s-1, t refers to time (in this case day of year), and n is the number of observations within the desired time period.
The freshet start was calculated using a slightly modified method first described by (Cayan et al., 2001). Average flow was calculated over a defined portion of the year encompassing low flow winter discharge through the days where the spring snowmelt considerably affects discharge. Cayan et al., 2001 used days 9-208 (Jan 9-July 27), whereas this study extended the end of the period to day 212 (Jan 9-July 31) to more efficiently include the freshet period within the calculations. The difference between the average Q calculated over this period and each daily Q value was calculated, and the day where the absolute value of the difference was smallest was defined as the start of the freshet. Intuitively this was the day when the magnitude of daily Q was closest to the average Q within this period. The days following this date in the period defined will all be higher than the average flow calculated over the defined period (Cayan et al., 2001; Stewart et al., 2005).
The end of the freshet was defined following the method described in (Ahmed et al., 2020) where the timing of the center of mass calculated from the annual hydrograph as the end of the freshet. The center of mass was calculated using the following equation:
Where the Cm is the day in which the center of mass occurs and ti and Qi refer to the day of year and discharge on that day in m3 s-1, respectively. Both the freshet start date and calculated center of mass date were plotted on the hydrograph for each year and visually inspected to assure that the mathematical methods were producing subjectively certifiable start and end dates for the spring freshet. The only year that failed to pass the visual inspection was 1981 due to a very large peak in the hydrograph in August that was almost as high as the spring pulse (data not shown). This year, along with years that had less than 365 days of data, were not included in the relevant trend analyses. The computed start and end dates of the freshets in 2018 and 2019 were May 13 and 11 and July 25 and 24, respectively (Figure 2). For comparison, the start and end dates of the freshet for 1992, which represents the median freshet start data between 1976-1999 were May 24 and July 21.
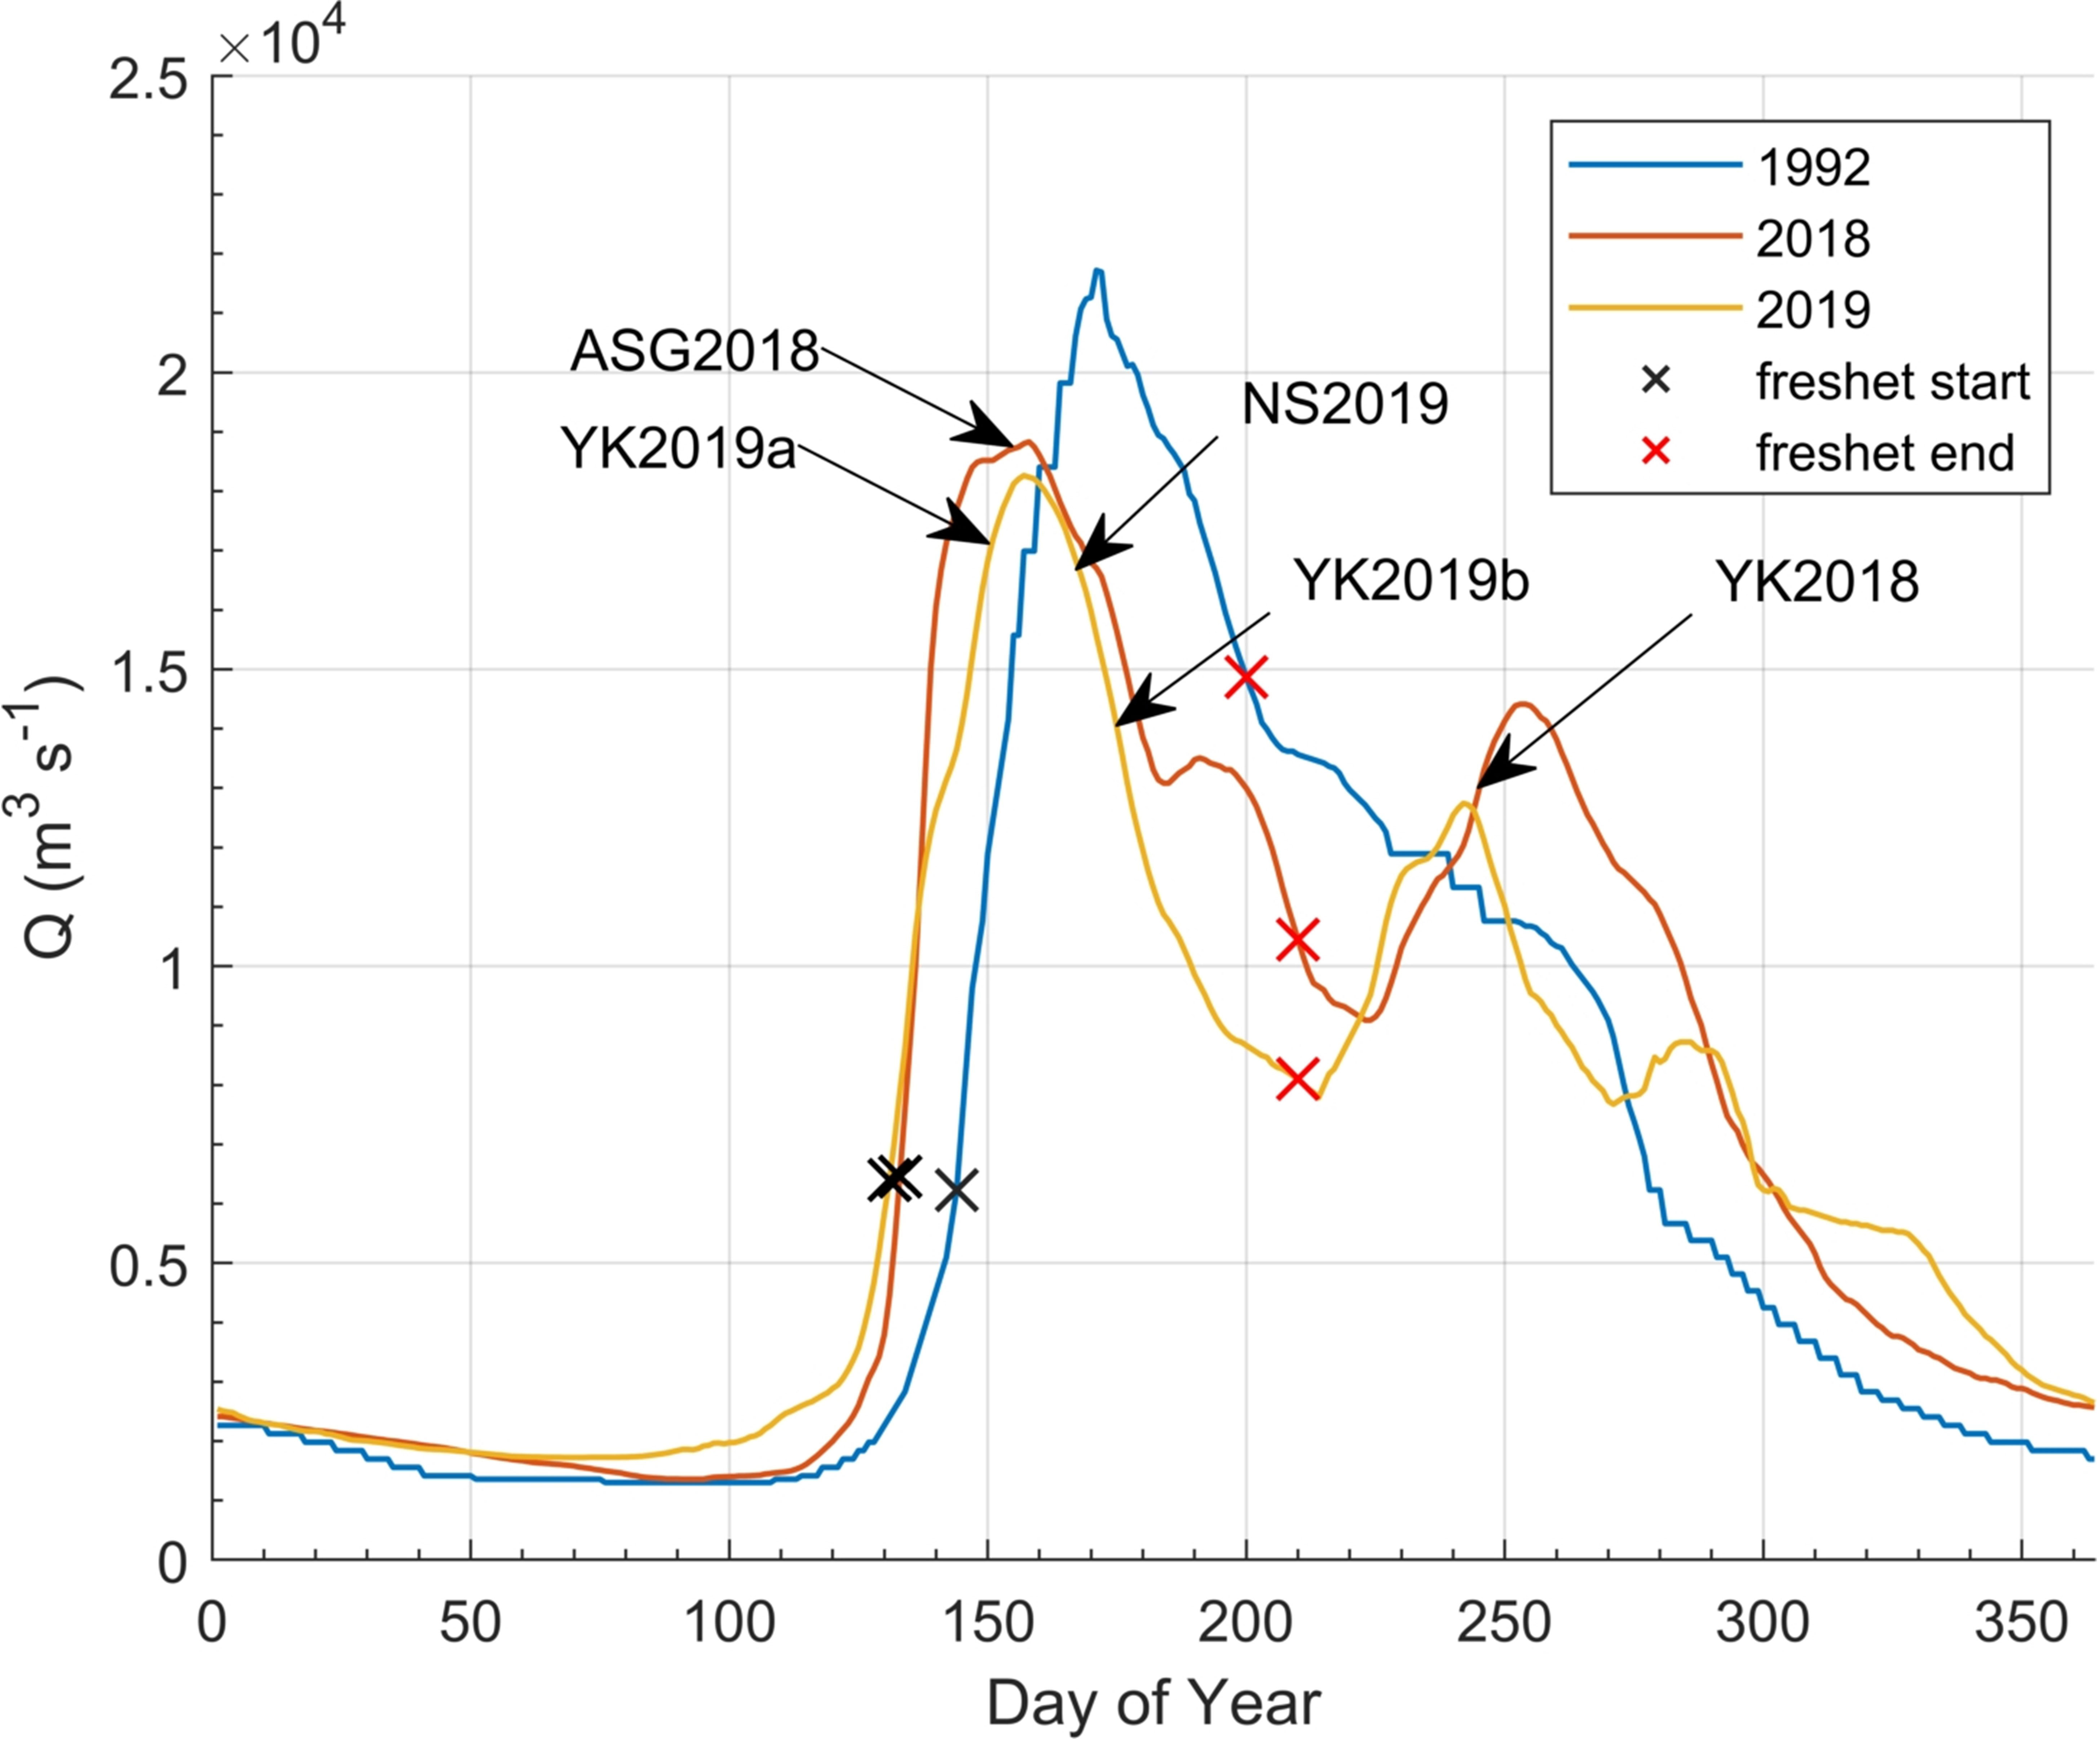
Figure 2 Yukon River annual hydrographs at Pilot Station, AK for the years 1992, 2018 and 2019 for daily mean streamflow (Q m3 s-1). The arrows mark the field deployment start dates for 2018 and 2019. The black X’s refer to the computed start of the freshet determined from the modified Cayan et al., 2001 method and the red X’s show the end of the freshet determined from the centroid of the hydrograph computed by equation 13 (See methods for details). The year 1992 represents the median freshet start date for years prior to (1976-1999).
Trends in the hydrograph data were identified using a Matlab file exchange script titled “ktaub” that evaluates the Mann-Kendall non-parametric test to identify the strength and direction of trends in the data along with Sen’s slope to calculate the magnitude of the trend (Berkey, 2006). The null hypothesis states that there were no trends identified in the data and was rejected if the p-value was less than an alpha value of 0.1 (10%). However, in most cases where the null hypothesis was rejected, the p value was less than 0.05 or 5% alpha. The strength of the trend is gauged by the magnitude of the Taub number. In this analysis, Taub values <= ± 0.19 are considered weak, values >= ± 0.20 & <= ± 0.29 are moderate, while values >= ± 0.30 are considered strong (Mastrothanasis, 2020).
Modeling DOM at pilot station and delta flux estimates
The Load Estimator (LOADEST) USGS water resources application package (Runkel et al., 2004) was used to estimate DOC mass flux at Pilot Station, AK. aCDOM and DOC data collected periodically at Pilot Station, AK were downloaded from the Arctic Great Rivers Observatory online data access portal on Dec 23rd, 2021 (Holmes et al., 2021a; Holmes et al., 2021b). These data were input into LOADEST to calibrate and generate a regression model that could predict aCDOM and DOC concentrations based on daily flow measurements. LOADEST model six was utilized as this has been shown to produce the most consistent and reliable mass flux predictions in other Arctic systems and avoids spurious trends that can emerge when other models are used (Mcclelland et al., 2016). LOADEST predicted mass flux (kg d-1) was converted to daily average concentration by dividing the total mass flux by the total water flux for each day over 2018 and 2019.
In addition, a regional implementation of the Finite Volume Community Ocean Model (Chen et al., 2003) was used to estimate the water flux at the mouths of the river delta during 2018 and 2019 at the time of sample collection. The Yukon River FVCOM (YukonFVCOM) has shown good ability at recreating hydrodynamic properties in the delta and coastal ocean across seven years of implementation (Clark and Mannino, 2021). YukonFVCOM uses a sophisticated numerical scheme to predict the exact time- and volume-integrated water flux across transects that the user can define in the model domain following methodology developed in another FVCOM implementation in the Salish Sea (Khangaonkar et al., 2017). The total volume of water ± 3 days from sampling was then multiplied by the measured concentration at the river mouth locations to provide a first-order approximation of the daily DOC and TDN mass flux and aCDOM load at the time of sampling.
Results
Spatial and temporal variability in the quantity and quality of DOM
DOM samples were collected at five river mouths within the Yukon Delta system. Three of the mouths (South Mouth, Alakanuk Channel, and Emmonak Channel) were sampled during all three Yukon field deployments, but the North Mouth Alternative Channel (NAC) and Middle Mouth were only sampled during the 2019 field deployments (Table 3, Figure 3). CDOM absorption and DOC concentration at all river mouths were greatest during the ascending limb of the freshet in 2019 (late May/June, YK2019a) while S275:295 and S300:600 values were lowest during this period (Table 3). When the river mouths were sampled again in 2019 during the descending limb of the freshet (late June; YK2019b), the average aCDOM(412) and DOC measurements were 38% less than the average values measured during the ascending limb of the freshet (Table 3). Average S275:295 and S300:600 values were respectively 9% and 2% higher during the descending limb as compared to the ascending limb. The average aCDOM*(412) at the river mouths during each 2019 freshet sampling event were identical (0.79 L mg-1 m-1), yet aCDOM*(412) at the NAC with respect to each deployment was higher than the other mouths (Table 3). During the late August 2018 sampling (YK2018), the Yukon River Q was considerably lower than the 2019 ascending limb of the freshet period and marginally lower than the descending limb of the freshet (YK2019b) (Figure 2). However, DOC concentrations in this period were 63% and 40% less than the rising and ascending limbs of the freshet respectively and aCDOM(412) values were 77% and 62% lower respectively. Average S275:295 values in August 2018 were 21% higher than the ascending limb of the 2019 freshet and 11% higher than the descending limb. Average S300:600 values were 14% less than the ascending limb and 11% less than the descending limb. Average aCDOM*(412) at the river mouths in 2018 was 38% lower than the freshet sampling average (Table 3). Although measurements are from different years, the river discharge profiles from these years are similar, and it is likely that the patterns observed would not be vastly different if the sampling occurred in the same year (Figure 2).
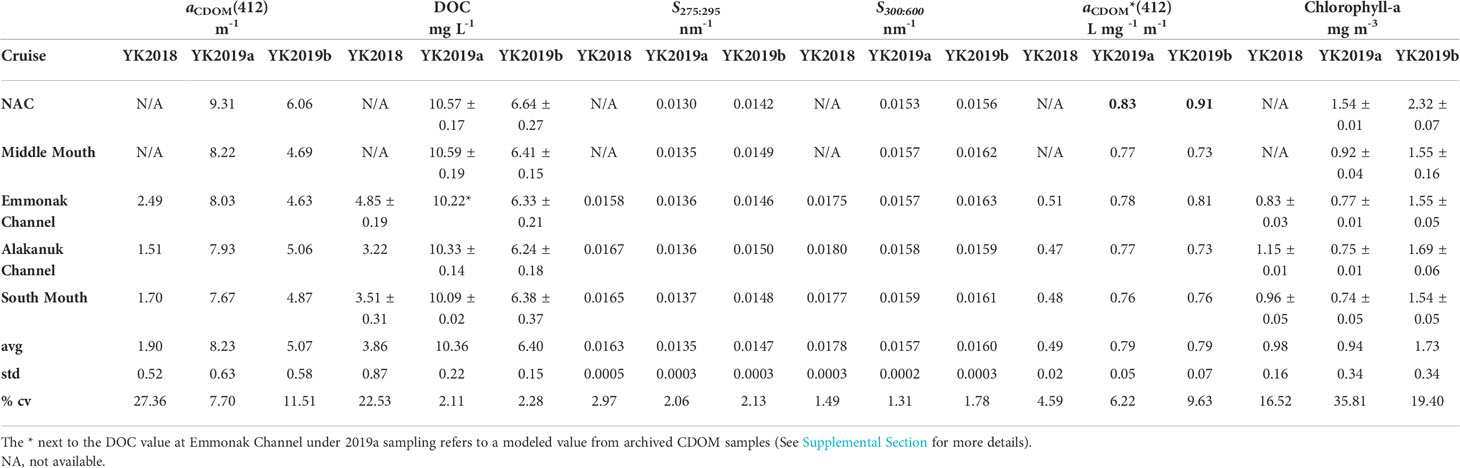
Table 3 (A) Means and standard deviations of biogeochemical (dissolved organic carbon [DOC mg L-1], Chl a [chlorophyll-a mg m-3] and CDOM optical properties (CDOM spectral slope between 275-295 nm [S275:295 nm-1], and 300-600 nm [S300:600 nm-1], and aCDOM(412)(m-1) by river mouth and field deployment where NAC refers to North Mouth Alternative Channel.
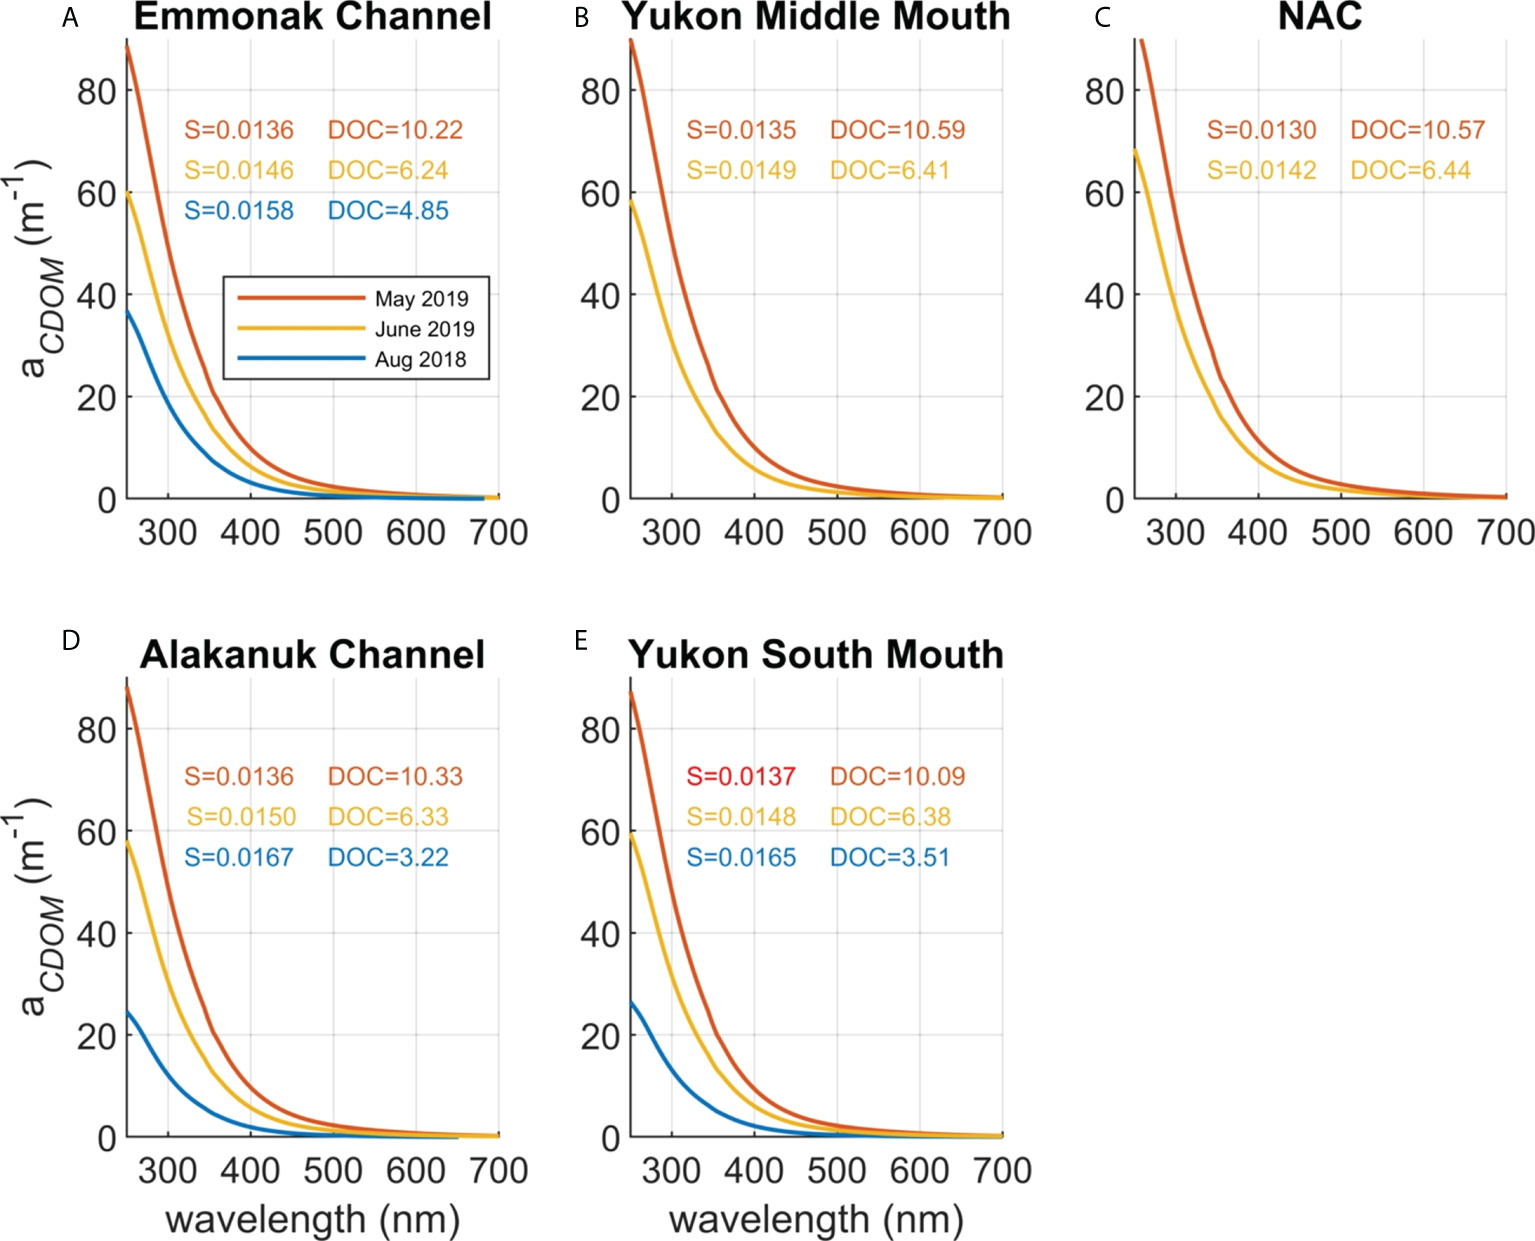
Figure 3 CDOM absorption spectra (λ (m-1)), spectral slope (S275-295 (nm-1)), and DOC concentration in mg L-1 measured at the (A) Emmonak Channel, (B) Yukon Middle Mouth, (C) North Mouth Alternative Channel (NAC), (D) Alakanuk Channel, and (E) Yukon South Mouth.
During the ascending limb of the freshet in 2019, DOC concentrations at all the river mouths were quite similar (10.36 ± 0.22 mg C L-1). In contrast, CDOM property values differed between the river mouths. The highest river mouth aCDOM(412) value (9.31 m-1) and the lowest river mouth S275:295 and S300:600 values were measured at the NAC (Table 3). The second highest aCDOM(412) of 8.22 m-1 was measured at the Middle Mouth and aCDOM(412) decreased steadily, but at smaller increments, from the Middle Mouth to the Emmonak and Alakanuk Channels and finally to the South Mouth where the lowest aCDOM(412) value of 7.67 m-1 was measured. Apart from the NAC, S275:295 and S300:600 at the river mouths during the ascending limb of the freshet were similar to each other and within one standard deviation of the mean with respect to each spectral slope range (Table 3). Similar patterns were observed during descending limb of the freshet. The DOC concentrations at all the river mouths were essentially the same (6.40 ± 0.03 mg C L-1). At the NAC, aCDOM(412) was considerably higher (6.1 m-1) than aCDOM(412) at the other river mouths (Table 3). As with the rising limb of the freshet, S275:295 and S300:600 values were lowest at the NAC, and the slope values at the other mouths were all similar. Among the three river mouths sampled in August 2018, the Alakanuk Channel and South Mouth had similar aCDOM(412) values and DOC concentrations; however, DOC and aCDOM(412) within the Emmonak Channel were over 30% higher than the values observed at the other mouths (Table 3).
CDOM samples collected at Nanvaranuk Lake and its tributary to the Yukon (Stations 39 and 40) during the descending limb of the freshet (YK2019b) were the highest absorbing CDOM samples measured in this study. The aCDOM(412) values at station 39 and 40 were 12.65 and 9.61 m-1 respectively. The lowest S275:295 value (0.0106 nm-1) and the most concentrated DOC sample in this study (10.59 mg C L-1) were measured at station 39 in the lake (Figure 1B). Several weeks earlier during the ascending limb of the freshet, aCDOM(412) was considerably less and S275:295 was considerably higher at the river mouths as compared to the Nanvaranuk Lake values during the descending limb of the freshet (Table 1). However, the DOC concentrations at the river mouths at the ascending limb of the freshet (10.36 mg C L-1) were quite similar to the concentration at the lake (Tables 1, 3). The average aCDOM*(412) at the lake and its tributary was 11% lower than the average of all of the other stations measured during the ascending limb of the freshet.
The variability of DOM measurements in the Norton Sound transect (NS2019) was high due to the sharp gradient found while sampling within and outside of the plume. Samples with salinity less than 10 were considered as being within the plume and most directly influenced by the river delta outflow (Table 1). The average aCDOM(412) value and average DOC concentration outside the plume were 0.27 ± 0.12 m-1 and 1.41 ± 0.18 mg C L-1 respectively, while their averages within the plume were 6.18 ± 0.42 m-1 and 8.92 ± 0.44 mg C L-1. Average S275:295 and S300:600 within the plume were 0.0141 nm-1 and 0.0159 nm-1, respectively, and outside of the plume averages were 0.0230 nm-1 and 0.0200 nm-1. Outside of the plume, average aCDOM*(412) was 0.69 L mg -1 m-1, and within the plume the average was 0.19 L mg-1 m-1 (Table 1).
The ASGARD DOM samples collected in the Bering Sea (ASG2018) had the lowest average DOC concentration and aCDOM(412) values and the highest average S275:295 values measured during any of the field deployments (Figure 1C, Table 1). In general, the measurements were quite uniform with the exception of the three stations located closest to the coast (stations 11, 2.3, and 9.1). Station 11 DOC concentration, aCDOM(412), and S275:295 were 1.52 mg C L-1, 0.25 m-1, and 0.0220 nm-1 respectively, and were quite similar to the average DOM measurements collected outside the plume during the Norton Sound Transect in 2019 from the same time of year. S275:295 values were lower than S300:600 in the Bering Sea and Norton Sound outside of the plume, whereas the opposite was true for slope measurements within the plume and Yukon Delta (Table 1).
Overall CDOM absorption and DOC concentrations on the North Slope in August were lower than measurements from any of the Yukon deployments, and CDOM slope values calculated over both ranges were higher than the Yukon deployments (Tables 1, 3). In general, aCDOM(412) was higher and S275-295 and S300:600 were lower near the barrier islands and within the lagoon systems. However, aCDOM(412) was considerably lower (Figure 1D) and S275-295 and S300:600 were considerably higher at the furthest offshore stations (data not shown).
Spatial and temporal variability of TDN
The highest average concentrations of TDN were measured within the Yukon River channels and particularly during the YK2018 fieldwork (295 ± 82 μg N L-1). During the ascending limb of the freshet in 2019, the average TDN concentrations were 270 ± 32 μg N L-1 and similar to the average TDN concentration measured in the Plume waters of the Norton Sound transect (258 ± 23 μg N L-1). Average TDN concentration decreased from the ascending limb to the descending limb of the freshet to 245.0 ± 8.5 μg N L-1. Although DOC concentrations at Nanvaranuk Lake were anomalously high with respect to the surrounding delta stations, the TDN measurements were only slightly higher than the average TDN measured in the delta during that time (Table 1). The lowest average concentration of TDN was measured at the North Slope region with an average of 76.6 ± 13.3 μg N L-1, and similar to slightly higher values were found outside the plume during the Norton Sound transect (84.8 ± 9.3 μg N L-1) and in the northern Bering Sea with an average TDN concentration of 94 ± 22 μg N L-1 (Table 1).
Vertical and horizontal distributions of salinity and FDOM
For the South Mouth transect sampled in 2019 (YK2019A; stations 5 to 1; Figure 1B), the influence of the river plume was most pronounced at the three nearshore stations where surface salinity was between 1 and 3 and rapidly increased one meter below the surface to greater than 20 at 2 m depth (Figure 4A). FDOM was greatest at the surface at these stations ranging from ~50 ppb to ~80 ppb and decreased rapidly below 1 meter to less than 20 ppb at 2 m depth. Further offshore, the influence of the river plume is still apparent, but less so at depth. Surface salinity and FDOM concentration in this region were between 13-16 and 40-50 ppb, respectively. FDOM decreased with depth to about 20 ppb at 2 m and was less than 10 ppb below 4 m. The vertical salinity gradient was not as sharp in the first meter as it was in the inshore region (Figure 4A).
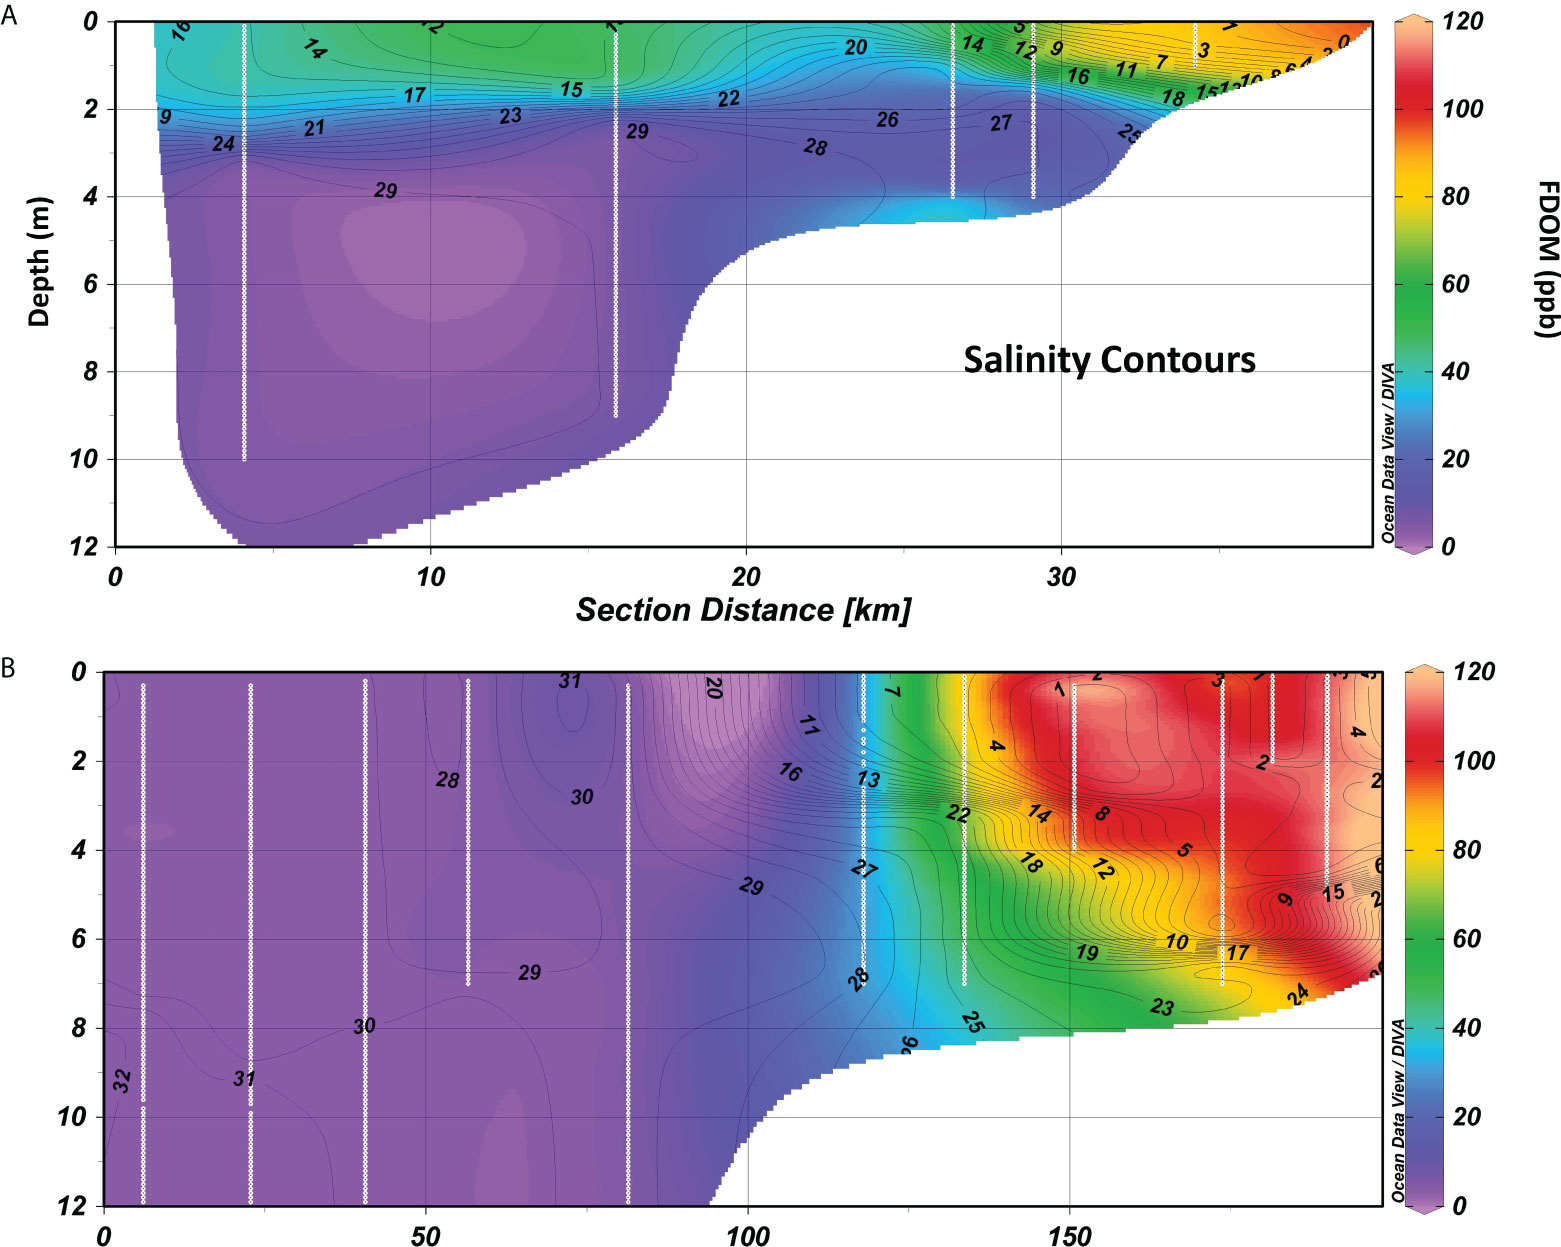
Figure 4 (A) Cross section of FDOM concentration (ppb quinine sulfate) interpolated from CTD profiles during the South Mouth transect in 2019. The contours refer to salinity (PSU) and the white lines indicate the location of the CTD profiles which correlate to the stations shown in Figure 1B. (B) Cross section of FDOM concentration interpolated from CTD profiles during the Norton Sound transect in 2019. White lines indicate the location of the CTD profiles and correlate to the stations shown in Figure 1C.
The salinity and FDOM distributions on the 2019 Norton Sound transect (NS2019; Figure 1C) showed an intense Yukon River plume that extended beyond 50 km from shore (Figure 4B). At the northern stations of Norton Sound, salinity at the surface was approximately 29 and was vertically mixed until about 8 meters depth where salinity increased to 30. FDOM was less than 5 ppb and vertically homogenous in this region. The influence of the river plume becomes apparent approximately 120 km into the section where surface salinity dropped to about 8 and FDOM doubled to about 30 ppb. The remainder of the stations along the transect were within the plume where surface salinities were 1-2, and FDOM was over 100 ppb. In general, the FDOM concentrations followed the salinity distributions with lower FDOM underneath the plume where salinity below 2 meters rapidly increased from 2 to over 20. Within the river plume, FDOM remained high at depth even where salinity increased and was vertically homogenous at the 200 km end of the section (Figure 4B). Both salinity and FDOM spatial patterns reveal influence of the middle mouth (~160 km) and the Emmonak and Alakanuk Channels and South Mouth (~200-210 km) with low salinity and high FDOM. The FDOM in this portion of the plume was more concentrated than what was measured in the South Mouth plume ~10 days earlier (Figures 4A, B).
The influence of the smaller Jago and Hulahula Rivers on the two transects carried out near Kaktovik were much less pronounced than in the Yukon system (Figures 5A, B; Table 1). Salinity was fairly stable along the Jago River transect and was close to 30 at surface and depth. The only exception was at the station nearest to the shore located within the Jago Lagoon. The surface salinity in the lagoon was about 27 and increased to about 29.5 near the bottom. FDOM displayed very different behavior than salinity. Although surface values were slightly higher at inshore stations, FDOM was consistently lower at the surface and markedly higher at depth everywhere apart from the furthest offshore station where DOM was around 5 ppb or less throughout the entire water column. Within the lagoon and extending slightly offshore there was a layer of elevated FDOM concentration above the seabed greater than 100 ppb (Figure 5A).
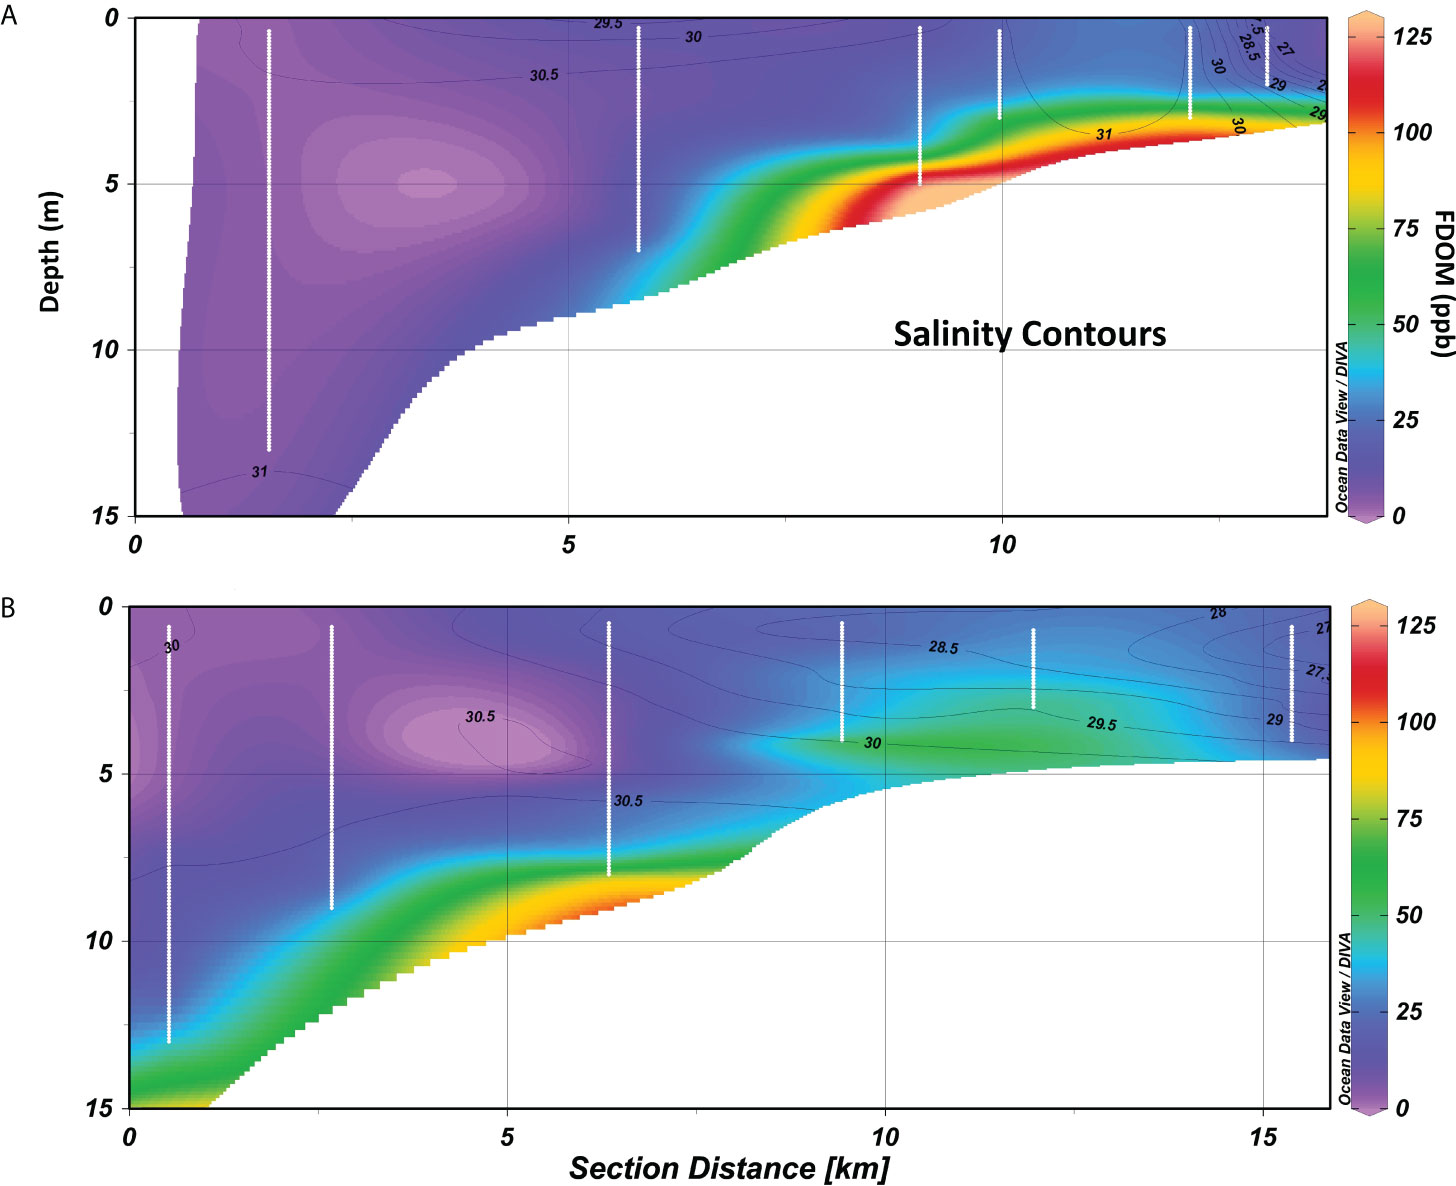
Figure 5 (A) Cross section of FDOM concentration (ppb quinine sulfate) interpolated from CTD profiles during the Jago River outflow transect in 2019. The contours refer to salinity (PSU) and the white lines indicate the location of the CTD profiles and correlate to the stations shown in Figure 1D. (B) Cross section of FDOM concentration interpolated from CTD profiles during the Hulahula River outflow transect in 2019. White lines indicate the location of the CTD profiles and correlate to the stations shown in Figure 1D.
The salinity vertical structure near the Hulahula River outflow was more stratified than near the Jago River outflow. Surface salinity close to the river mouth ranged from about 27-28 and increased to approximately 30 at depth (Figure 5B). Moving offshore, salinity throughout the water column was close to 30. There was a similar layer of elevated FDOM concentration observed near the bottom in Hulahula system as well. Overextrapolation in the contouring algorithm may exaggerate the magnitude and extent of the elevated bottom layer of FDOM shown in Figures 5A, B. However, the CTD profiles carried out in these regions all measured rising FDOM concentration as the package approached the bottom (Supplementary Figures 2, 3).
Employing the relationships between CDOM optical properties and DOC concentration to develop DOC models
Strong linear relationships between aCDOM(412) and DOC concentration were found for all of the combined samples collected in this study as well as when stations were partitioned by region and time of field sampling (Figure 6A). When a linear fit is applied to all the data, the values are strongly correlated with an R2 of 0.95 and a MSE of 0.53 (y=1.09X+1.17). However, when linear fits are applied to the data partitioned by field deployment, the relationships become stronger, and the MSE is reduced, apart from the ASGARD and Kaktovik data. Upon further inspection, a subset of the Kaktovik data shows that the relationships become much stronger and MSE is reduced when station data are grouped to their respective river systems (Figure 6B). The slopes of the linear fits to each subset of the data vary from about 0.6-3.7 with the steepest slope measured in June 2018 from the offshore ASGARD stations while the shallowest came from the later June Yukon deployment in 2019 (YK2019b) (Table 2). The data points that have the greatest influence on the slope from this deployment were the two lake stations.
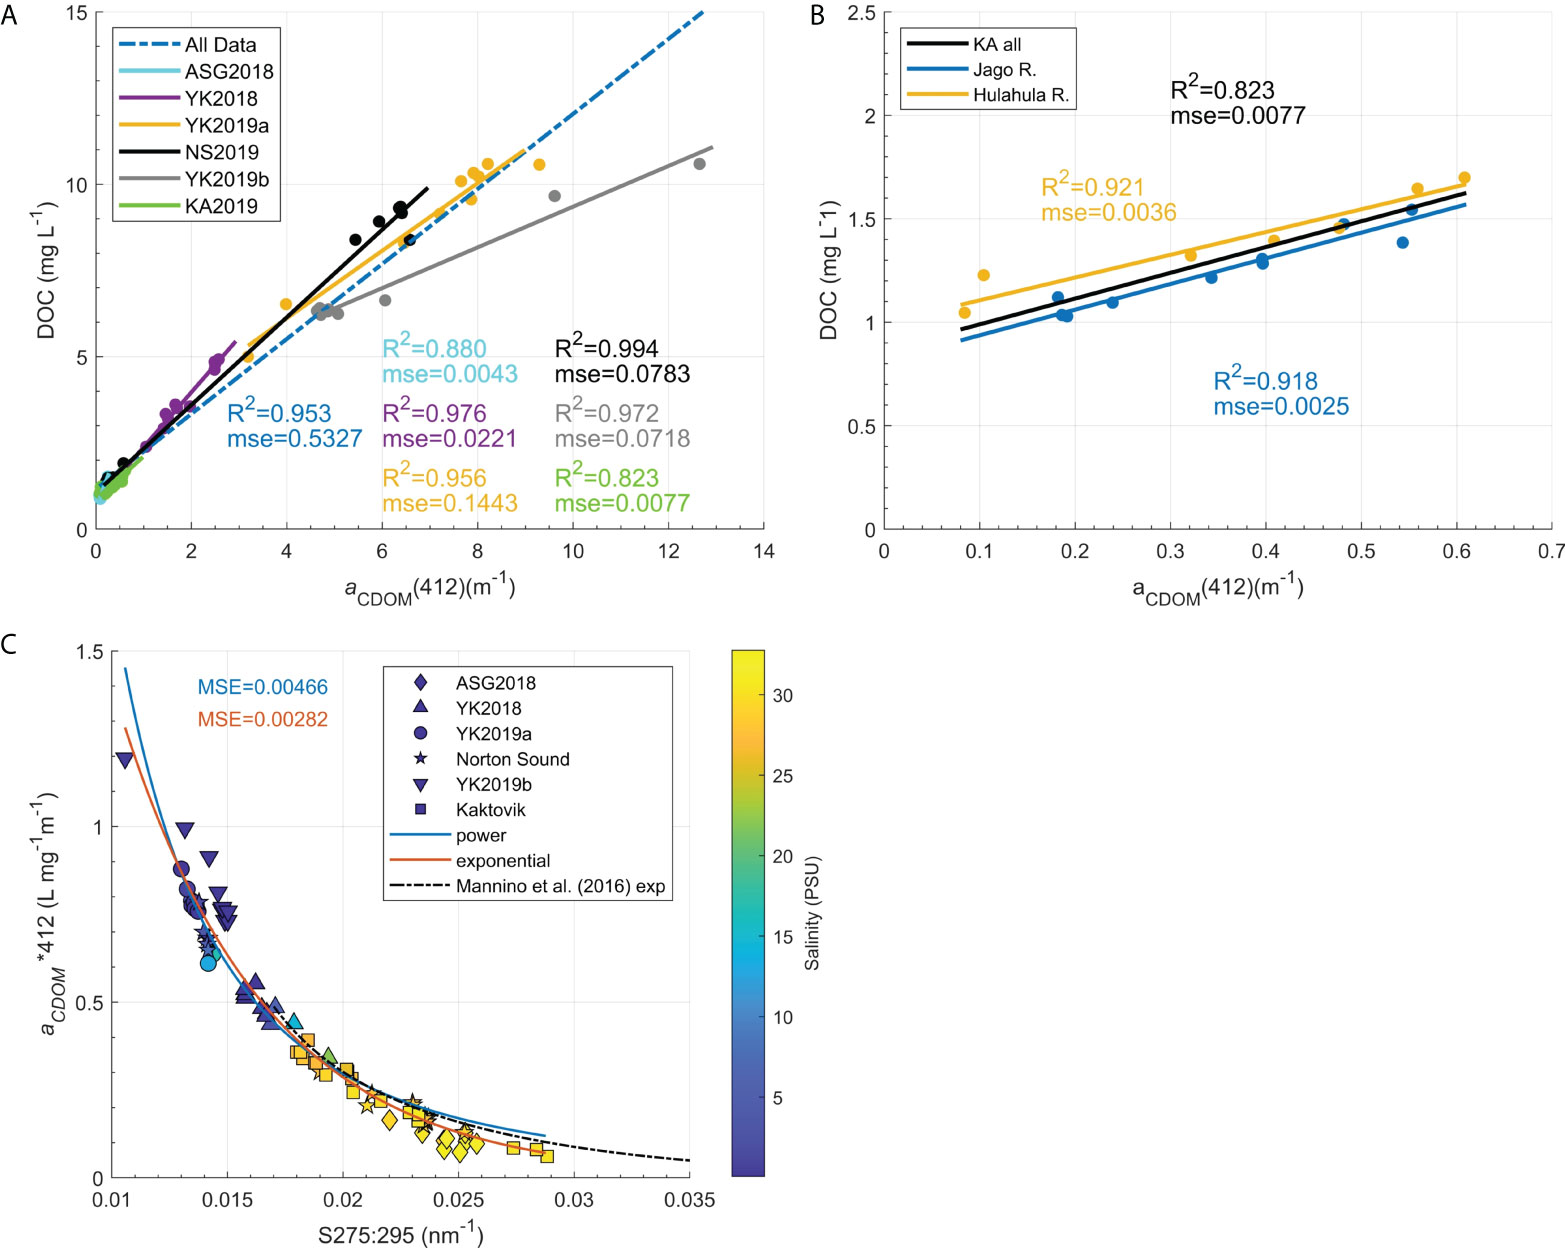
Figure 6 (A) Linear Relationships of aCDOM(412)(m-1) versus DOC concentrations (mg L-1). The blue dashed line is a single fit to all the data where the other lines are fits partitioned by field deployment. (B) Subset of Kaktovik aCDOM(412)( m-1) versus DOC (mg L-1) Linear Relationships further partitioned by proximity to the Jago and Hulahula Rivers. (C) Non-linear fits to the relationship of S275:295(nm-1) and aCDOM*412(L mg-1 m-1) where the symbols correspond to each field deployment and the salinity (PSU) at each point defined by its color. Solid blue and red curves are power and exponential fits to RSWQ data respectively, while the dashed line is an exponential fit derived from the Mannino et al. (2016) data set.
In addition to these linear, nonlinear regressions of S275:295 and aCDOM*(λ) were examined. A power and exponential fit to the data were applied based on equations 5, 6 respectively. The mean squared error (MSE) calculated between the modeled and measured aCDOM*(412) was used to assess the goodness of fit to the data along with the regression coefficients (Table 2). Both the exponential and power fits represent the Yukon-Norton Sound system and North Slope data well; however, at stations with higher salinity and S275:295 values, the exponential model fit the data better overall and had a slightly lower MSE than the power fit (Figure 6C). For comparison, a curve generated using the parameters derived from an exponential fit to data collected in the Mid Atlantic Bight and Gulf of Maine from Mannino et al. (2016) is shown, though this relationship does not extend to the high values observed in the Yukon River-delta-plume system. Regardless, in the regions where the S275:295 values overlap from each study, the Alaska data fall close to the Mannino et al. (2016) fit, demonstrating the robustness of this approach across very different aquatic systems and different seasons (Mannino et al., 2016; Cao et al., 2018; Valerio et al., 2018). Several other wavelengths (380, 355, and 300 nm) were used to calculate aCDOM* and regressed against S275:295. These models also yielded strong relationships; nevertheless, the RMSE and MAE calculated from the aCDOM*(412) relationship (0.523 and 0.339, respectively) were lower than the values calculated using the other wavelengths (data not shown; RMSE>0.539 and MAE>0.348).
Due to the limited number of samples and lack of ancillary data in the region, there were not enough data points to derive the models on a subset of data and evaluate the DOC models on an independent set of measurements aside from the independence afforded by evaluating the Mannino et al. (2016) model. Nevertheless, the statistics between the measured and modeled DOC data can provide evidence that the models are outperforming or underperforming the statistics of their fitting parameters. The relationships derived from the linear and non-linear fits to CDOM optical parameters and DOC concentration were used to predict DOC from measured CDOM optical properties. The relationship between the measured and modeled data was strong for DOC concentrations derived from the single relationship of aCDOM(412) to DOC calculated from all of the data combined (Figure 7A); however, the MAE was relatively high (0.425 mg C L-1). The linear aCDOM(412) to DOC relationships partitioned by location and sampling event (Figures 6A, B) yielded a stronger predictive capability for DOC concentration than the linear aCDOM(412) to DOC model with all data combined (Figure 7A). At DOC concentrations less than 2 mg C L-1, there was very little variability between the modeled and measured data. At higher concentrations, particularly above 6 mg C L-1, the model was less accurate. Overall, the bias in the data was extremely low (-9.96 x 10⁻¹⁷), and the MAE was reduced to 0.142 mg C L-1.
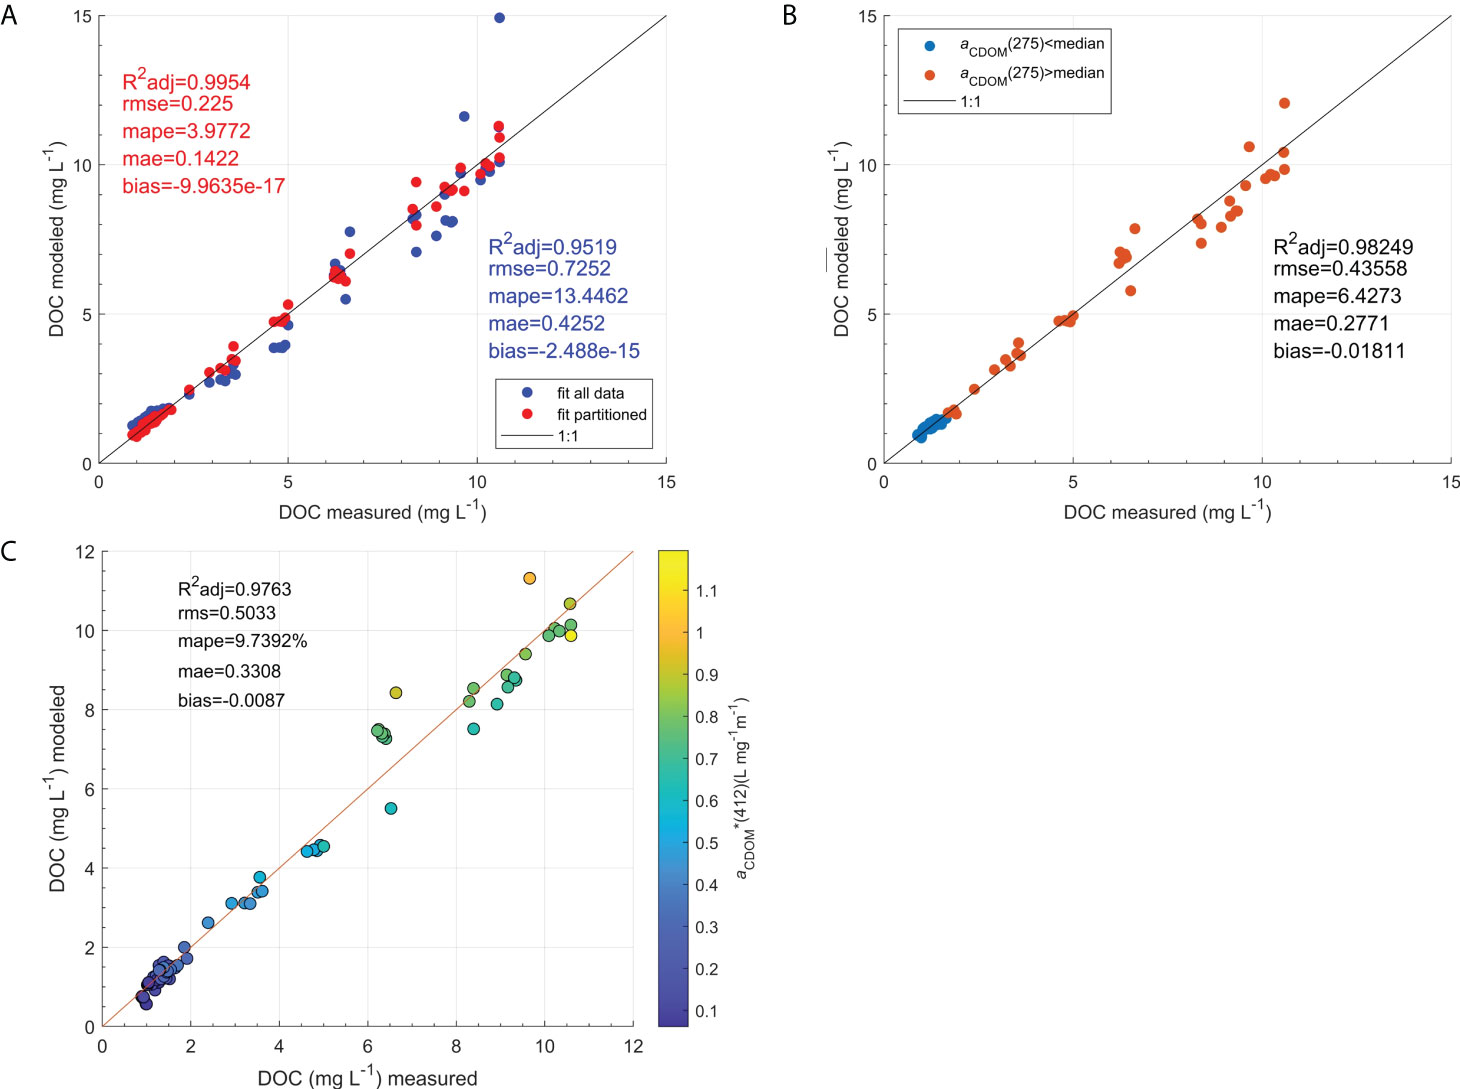
Figure 7 (A) DOC derived from the linear relationship of aCDOM(412)(m-1) to DOC (mg L-1) where: The modeled DOC represented by blue points were calculated from a single fit to all the data and the red points are modeled from the relationships partitioned seasonally and spatially (Figures 6A, B). (B) DOC modeled from the MLR approach. The data were partitioned based on aCDOM(275)(m-1) values above and below the median of aCDOM(275)(m-1) =7.05 (m-1). A MLR was applied to each subset to derive the coefficients to model DOC. (C) DOC modeled from the Exponential fit to the regression of S275:295(nm-1) versus aCDOM*(412)(L mg-1 m-1) (Figure 6C). The color of the markers refers to the magnitude of aCDOM*(412).
Fichot and Benner (2011) developed a multiple linear regression (MLR) approach to derive DOC concentration from the relationship of natural log transformed aCDOM(275) and aCDOM(295) to the natural log of DOC concentration (Equation 4). Following the same methods, coefficients for the MLR approach were derived on two subsets of the data separated by values above and below the median aCDOM(275). The fitted coefficients were used to model DOC and the results were compared to the measured DOC concentration in Figure 7B. The MLR performed similarly to the partitioned linear model approach in that the lower DOC values were represented more accurately than higher concentrations. There was a slight negative bias in the MLR compared to the linear approach. While the adjusted R2 values were high for both the MLR and the partitioned linear model, the MAE and RMSE were both much lower for the partitioned linear model indicating that MLR was not as good of a predictor of DOC than the spatially and temporally partitioned linear model (Table 2).
The nonlinear regression models fit to the relationship of S275:295 and aCDOM*(412) were able to sufficiently predict DOC concentration, but not as effectively as the partitioned linear approach or MLR based on the multiple statistics reported. The exponential model performed better than the power model with a slightly lower MAE. As with the other models, the variability between measured and modeled data using the exponential fit was greater at higher DOC concentrations and very low at concentrations less than 2 mg C L-1 (Figure 7C). The power model did not perform as well at the high and lower ends of DOC concentration and had higher bias, RMSE and MAE than the exponential model (Table 2).
Salinity-based mixing plots of DOC and aCDOM(412)
Salinity is considered a conservative constituent of water in riverine influenced coastal areas, therefore comparing salinity to a potentially non-conservative constituent can provide insight on sources and losses of DOM along freshwater to seawater gradients. If the data points fall above or below the regression line between the endmembers, it provides evidence that there is a source or a sink of the constituent (Harvey and Mannino, 2001; Stedmon and Markager, 2003; Tzortziou et al., 2011). Due to wind and weather constraints, there were only two offshore transects carried out near the Yukon delta. One was near the Middle Mouth during the 2018 sampling (Figure 1B) and the other near the South Mouth during the freshet sampling in 2019 (Figure 1C). The range of salinity in 2018 was from 1-22 while in 2019 the range was from 1-17.
The end-member mixing approach with modeled data from Pilot Station representing the freshwater endmember and the highest salinity station of the offshore transect as the marine endmember for each respective sampling event, indicates a net loss of DOC and aCDOM(412) for August 2018 (Figure 8). During the freshet sampling of 2019, however, we found conservative behavior for aCDOM(412) and a small net loss of DOC between the delta and plume waters. The value of aCDOM(412) at NAC was considerably higher than any of the other stations (Figure 8A). However, aCDOM(412) at all other stations was within the margin of error for the modeled value at Pilot Station with the exception of the South Mouth (station 10) where aCDOM(412) was lower and outside the error of the value at Pilot Station. Overall, chlorophyll-a concentration was much higher at higher salinities for the Yukon 2018 transect (especially at stations 6 and 7) than in 2019, but there are no apparent appreciable inputs of DOC from phytoplankton production related to chlorophyll-a that can be discerned (Figure 8B).
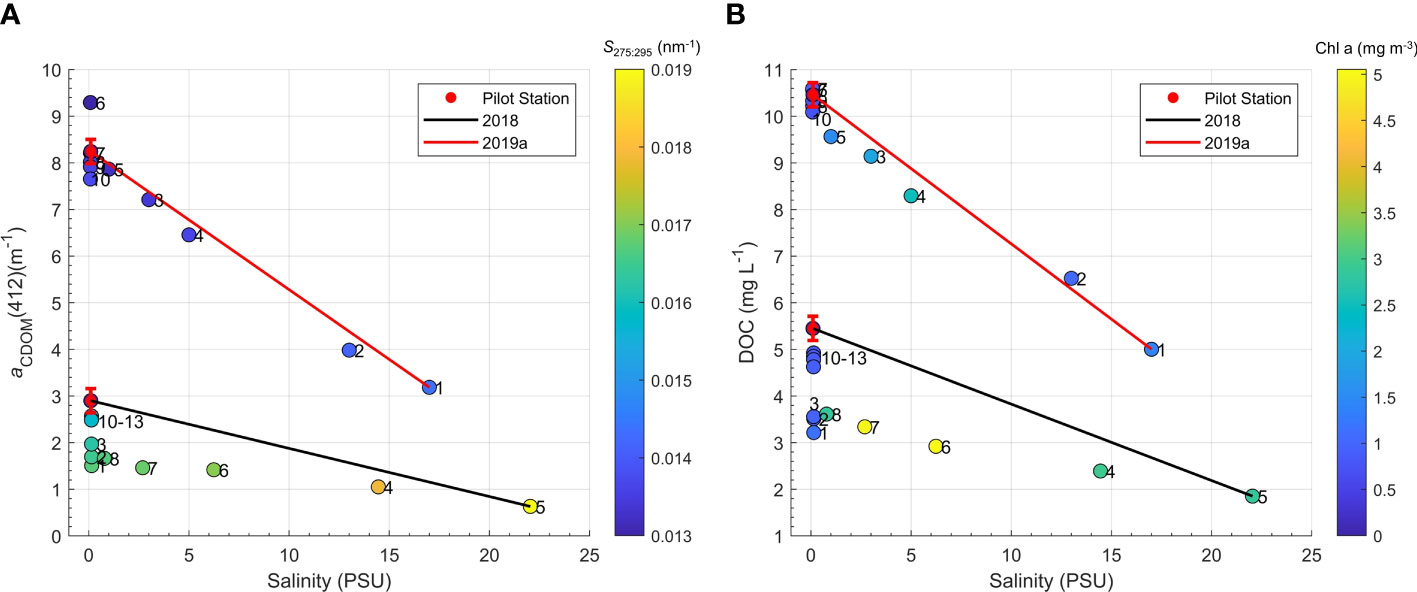
Figure 8 (A) Salinity regressed against aCDOM(412)(m-1) for the offshore transects carried out in 2018 and 2019 where the color of the marker is represented by the value of the spectral slope coefficient calculated between 275-295 (nm-1). The red and black lines represent the hypothetical mixing lines between the saltwater endmember and modeled aCDOM(412)(m-1) at Pilot Station. The standard error bars for the modeled results at Pilot station are shown in red. The percent error from aCDOM(412)(m-1) replicates from this study were typically less than 1% and not shown on this figure. (B) Salinity regressed against DOC concentration (mg C L-1) for the offshore transects carried out in 2018 and 2019 where the color of the marker is represented by chlorophyll-a concentration (mg m-3). The standard error bars for the modeled results at Pilot station are shown in red. The percent error from DOC replicates was typically less than 2.5% and not shown on this figure.
Biogeochemical flux estimates from yukon river mouths to the norton sound
The YukonFVCOM hydrodynamic model (Clark and Mannino, 2022) was used to determine the proportion of the water volume measured at Pilot Station that passes through the primary river mouths and Emmonak Channel. The model assumes that on average no water is gained (lower watershed inflow) or lost (e.g., evaporation) during passage from Pilot Station to the delta. Alakanuk Channel was not included in this analysis due to lack of ancillary data in this region. The percentage of water from Pilot Station that branches off to each of the channels was calculated from the volume measured at Pilot Station two and a half days before the modeled values at the mouths. Approximately 75% of the water measured at Pilot Station exits the delta through the South Mouth, whereas the North Mouth, Middle Mouth, and Emmonak Channel receive approximately 6%, 12%, and 3% of the flow respectively. The volume and fluxes for the North Mouth were calculated slightly upstream of both the North Mouth main channel and the NAC to represent the North Mouth. The daily fluxes of biogeochemical constituents were calculated from the discrete measurements at these mouths using the modeled water flux values. This approach can only provide the flux of a constituent on the day of sampling (i.e. “snapshot” flux estimates) and was applied to the three main channels of the Yukon River (North, Middle, and South Mouths) as well as the Emmonak Channel (Table 4). The reported biogeochemical flux errors are conservative determinations derived by multiplying the standard deviation of the model water flux and the constituent measurement error.
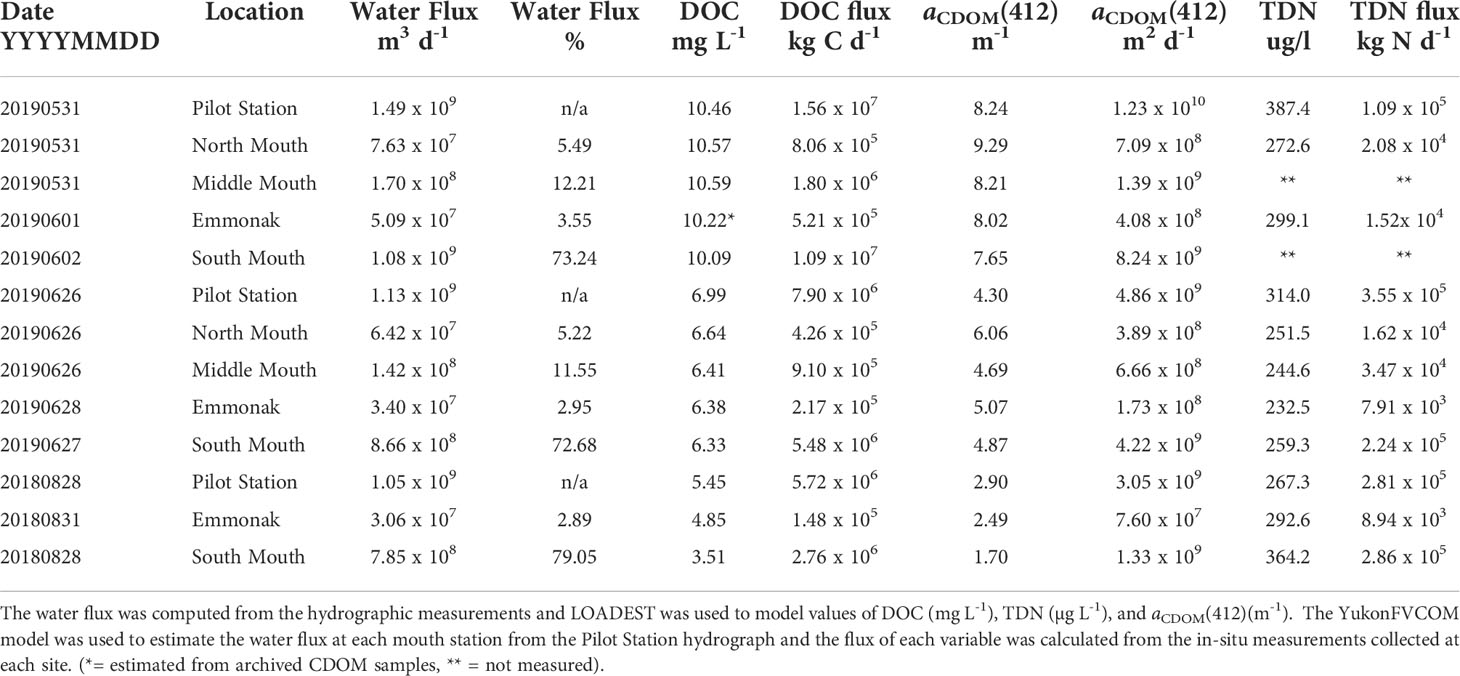
Table 4 Flux of biogeochemical variables DOC (kg C d-1) and TDN (kg N d-1) and CDOM absorption aCDOM(412)(m2 d-1) at Pilot Station.
On the days of sampling during the ascending limb of the freshet period, the South Mouth introduced 1.09 x10⁷ ± 3.06 x 10² kg C d-1 of DOC into the Norton Sound. The North Mouth and Emmonak channel exported over an order of magnitude less DOC (8.06 x 10⁵ ± 3.36 x 10³ and 5.21 x 10⁵ ± 2.16 x 10² kg C d-1 respectively) than the South Mouth, and the Middle Mouth exported six times less DOC than the South Mouth (1.80 x 10⁶ ± 3.46 x 10³ kg C d-1). The estimated total daily mass of DOC transported to Norton Sound from the three primary Yukon River mouths and Emmonak Channel at the time of sampling during the ascending limb of the freshet (YK2019a) was 1.40 x 10⁷ ± 4.41 x 10³ kg C d-1 (Table 4). Over the same period the estimated DOC input from Pilot Station was 1.56 x 10⁷ kg C d-1.
The water flux at the North and Middle Mouths was reduced by about 16% from the ascending limb to the descending limb of the freshet sampling (late June 2019); whereas at the Emmonak Channel and South Mouth, the water flux was 33% and 20% less, respectively. DOC concentration measured at the river mouths during the descending limb was about 38% less than DOC concentration measured during the ascending limb. When comparing the DOC flux from each river mouth during the ascending and descending limb of the freshet, the percent reduction ranged from 47% to 58%, relatively greater than the total water flux. The total daily mass of DOC transported to Norton Sound during the descending limb of the freshet (YK2019b) at the time of sampling was 7.03 x 10⁶ ± 1.63 x 10⁴ kg C d-1which was almost exactly 50% less than what was estimated for the ascending limb of the freshet (Table 4). This lower DOC flux was due the combined lower DOC concentrations (37-40% less) and water volume flux at the river mouths.
Of the relevant river mouths where water flux could be calculated, only the South Mouth and Emmonak Channel were sampled during the late summer 2018 fieldwork. The flux of water in August 2018 was less than the flux during the descending limb of the freshet, but only by a modest amount (10%). However, the concentration of DOC measured at the South Mouth in August 2018 was 45% less than what was measured during the descending limb (post-freshet) in 2019, whereas DOC was 25% less at the Emmonak Channel. The fluxes of DOC at the South Mouth and Emmonak Channel yielded a combined DOC mass flux from these river mouths of 2.91 x 10⁶ ± 2.05 x 10³ kg C d-1 (Table 4). Compared to the flux of DOC at these two river mouths during the ascending and descending limbs of the-freshet, there was about 75% less DOC exported in August 2018 compared to the ascending limb of the freshet, and 49% less DOC exported when compared to the descending limb of the freshet.
During the ascending limb of the freshet, the loads of aCDOM(412) computed at the North and Middle Mouth were 7.09 x 10⁸ ± 2.2 x 10⁶ m2 d-1 and 1.39 x 10⁹ ± 4.32 x 10⁶ m2 d-1, respectively. The loads of aCDOM(412) computed at the Emmonak Channel and South Mouth were 4.08 x 10⁸ ± 1.7 x 10⁶ m2 d-1 and 8.24 x 10⁹ ± 2.55 x 10⁷ m2 d-1, respectively. The combined daily load of aCDOM(412) transported from the river mouths during this sampling was 1.07 x 10¹⁰ ± 3.33 x 10⁷ m2 d-1, which is very close to the estimated daily load from Pilot Station (1.23 x 10¹⁰ m2 d-1) (Table 4). Similar to DOC, when comparing the descending limb of the freshet load of aCDOM(412) at each individual mouth to the ascending limb loads, the percent reduction ranged from 45-57%. However, the combined load of aCDOM(412) during the descending limb of the freshet sampling was 5.45 x 10⁹ ± 1.6 x 10⁷ m2 d-1, which was close to 50% less than what was observed during the ascending limb and 12% greater than estimated for Pilot Station (Table 4).
In 2018, the combined load of aCDOM(412) at the Emmonak Channel and the South Mouth was 1.41 x 10⁹ ± 4.37 x 10⁶ m2 d-1 (Table 4). Compared to the observations at these mouths during the ascending and descending limbs of the freshet, there was 84% less aCDOM(412) transported with respect to the ascending limb and 68% less than what was transported during the descending limb.
During the descending limb of the freshet sampling, the combined flux of TDN from all the river mouths was 2.83 x 10⁵ ± 1.02 x 10³ kg N d-1 (Table 4). The combined flux from the South Mouth and Emmonak Channel was 2.32 x 10⁵ ± 3.79 x 10² kg N d-1. When compared to the combined flux at these mouths during 2018 (2.95 x 10⁵ ± 9.51 x 10³ kg N d-1), there was about 21% more TDN transported in late August 2018 than the descending limb of the freshet due to the higher late summer TDN concentrations (Table 4). For the ascending limb of the freshet sampling, TDN was only measured at the NAC, Alakanuk and Emmonak Channels. Therefore, TDN fluxes were not computed for the Middle and South mouths.
Hydrographic time series trends at pilot station (1977-2020)
The annual volume measured at the USGS Pilot Station stream gauge between 1977 and 2020 ranges from a minimum of 156.5 km3 recorded in 1978 to a maximum of 247.3 km3 measured in 2005. The average and standard deviation of yearly discharge for the time series was 208.7 ± 18.9 km3. A Mann-Kendall test was performed and detected a significant trend of increasing annual volume (p=0.059). Based on the Sen’s slope analysis, the total annual volume at Pilot Station has increased by 0.460 km3 per year or approximately 4.5 km3 per decade (Figure 9A).
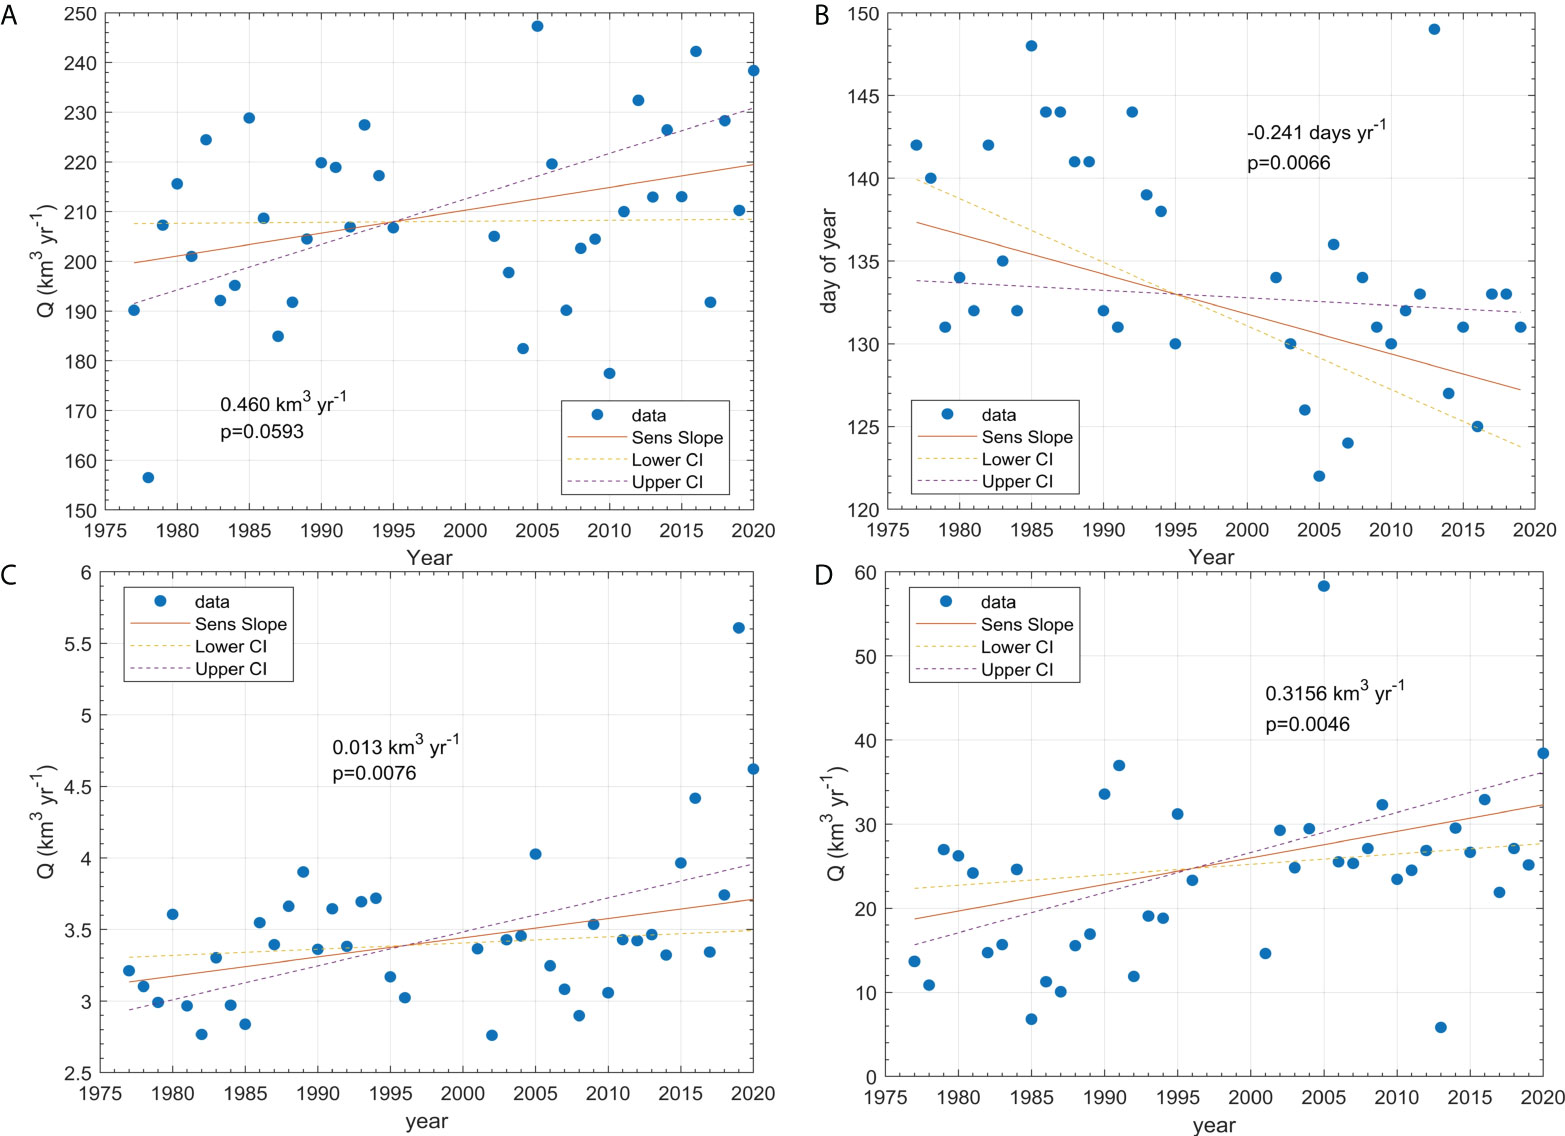
Figure 9 Mann-Kendall analysis of hydrographic trends at Pilot Station, AK from 1976-2020. The trend lines are shown in red and the upper and lower confidence intervals of the trends are represented by the dotted lines. The magnitude of the slope derived from the analysis and its corresponding p-value are presented on each graph for (A) annual discharge, (B) freshet start date, (C) total volume calculated for April, and (D) total volume calculated for May.
The day of year in which the start of the freshet occurred, as defined by the modified method of Cayan et al., 2001 ranged from day 122 (May 2nd) recorded in 2005 to day 149 (May 29th) recorded in 2013. Of note, 2013 was an anomalous year in the examined period with respect to years >2001. The average and standard deviation of the start date for these later years in the time series (1997-2020) were 131.8 ± 6.7 days while the period before 1997 had an average and standard deviation of 137.5 ± 5.7 days. The Mann-Kendall test identified a significant negative trend with respect to the start date of the freshet (p-value=0.007). Based on the Sen’s slope analysis, and over the 1976-2020 period, the spring freshet of in the Yukon River at Pilot Station has been having an earlier start, at a rate of 0.241 days yr-1 or approximately 2.4 days per decade (Figure 9B).
The day of year that the end of the freshet occurred, as defined by the center of mass of the hydrograph, ranged from July 12th to Aug 14th with a mean and standard deviation of July 24th ± 6 days. There was a weak positive correlation between the freshet start date and the freshet end date (R2 = 0.22); however, there was no significant trend identified in the timing of the end of the freshet using the Mann-Kendall test. The volume of the freshet was also calculated using equation 2, and the Mann-Kendall test found no significant trend (data not shown).
Water volume flux was calculated on a monthly basis over the time series, and the Mann-Kendall trend test was evaluated for each set of monthly observations. A significant trend of increasing water volume fluxes was detected in the months of September to February, as well as April and May (p-value <0.03) and to a lesser degree in March and November (p-value<0.09). June, July, and August were the only months where no significant trend was detected (Table 5). April and May had the greatest Taub values of 0.29 and 0.31 respectively indicating minimal variability around the trend line (Figures 9C, D; Table 5). The Taub values for September and October were 0.24 and 0.25 respectively, the trend is significant (p<.03), yet the strength is moderate, and the data points were noisier around the trend line (data not shown).
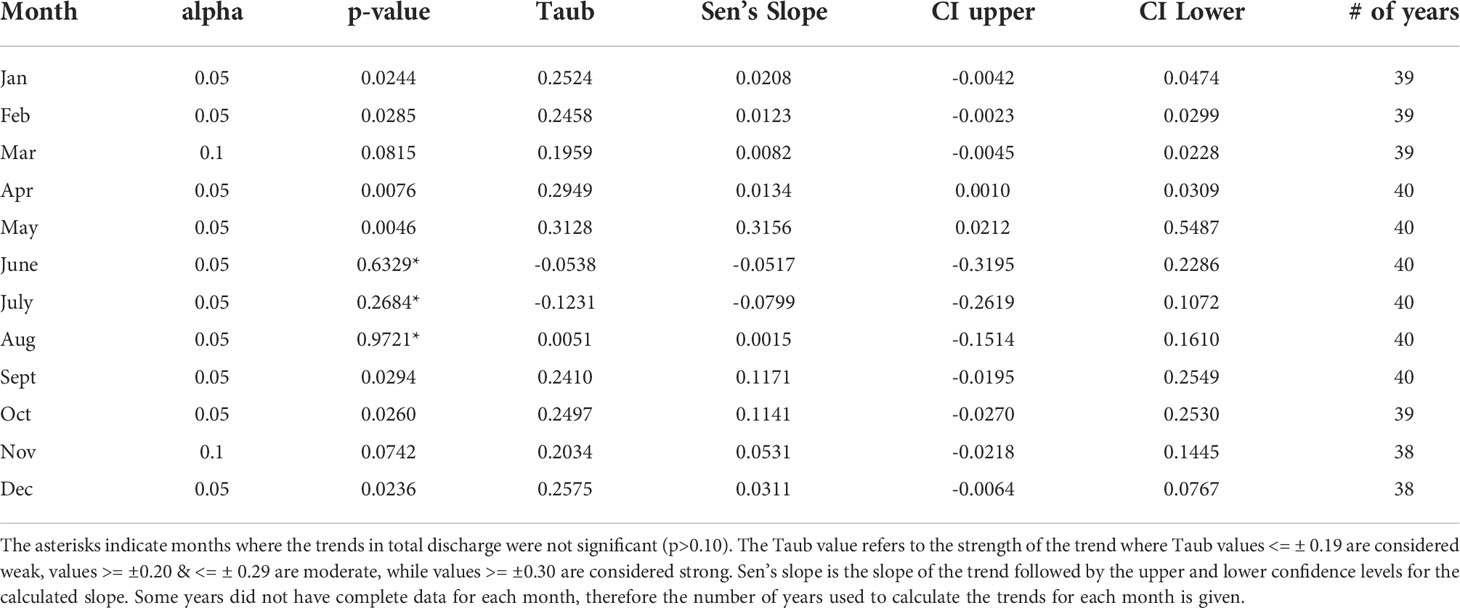
Table 5 Mann-Kendall trend statistics from monthly volume analysis.
Discussion
This study aims to characterize DOC concentrations and DOM optical properties across river deltas to coastal seas for understudied Arctic systems, specifically the Yukon River-Norton Sound system and the Hulahula River- and Jago River-Beaufort Sea systems. Based on current knowledge of river dominated coastal margins, we would predict the following findings. As in the vast majority of river-to-sea gradients, DOC concentrations and CDOM absorption ought to demonstrate strong linear relationships per system and season(e.g.,Blough et al., 1993; Del Castillo and Miller, 2008; Fichot and Benner, 2011; Mannino et al., 2016; Matsuoka et al., 2017; Cao et al., 2018). The magnitude and seasonal patterns of river discharge regulate the fluxes of DOM and other constituents across land-sea margins, especially for rivers with very high discharge such as the Yukon River. Furthermore, high-discharge rivers such as the Yukon River are more likely to transport DOM to the sea with little to no transformation, particularly during freshet and other high discharge events. Therefore, significant changes in DOM chemical and optical properties would be predicted along the estuarine-gradient from the Yukon River delta to the marine waters of the Bering Sea.
DOC concentrations and CDOM optical properties from river deltas to coastal seas of the Yukon River, Hulahula River, and Jago River systems
This study provides the most comprehensive to date spatial and seasonal characterization of DOC concentrations and DOM optical properties of the river-to-sea region spanning the Yukon River delta, plume, Norton Sound and northern Bering Sea. Furthermore, the measurements of DOC and CDOM optical properties and their relationships described herein are the only known for Alaska’s North Slope region extending from the Hulahula River and Jago River deltas to the inner shelf of the Beaufort Sea.
DOC models derived from the optical properties of CDOM
Several modeling approaches to retrieve DOC concentration from the optical properties of CDOM were developed from the measurements collected in our study and were shown to have strong predictive capability based on the statistics reported (Table 2). This work builds upon the extensive research on Arctic rivers by Mann et al. (2016) that showed CDOM optical proxies derived in the ultraviolet (UV) are an efficient and reliable method for estimating DOC concentration. However, the relationships derived in this study were for CDOM absorption at 412 nm, within the visible wavelength portion of CDOM, as opposed to wavelengths in the UV. This was primarily to better enable the quantification of DOC from ocean color satellite remote sensing data, the vast majority of which measure ocean color in visible wavelengths. There are several operational satellites with ~1km2 spatial resolution (MODIS Aqua, MODIS Terra, and VIIRS) that have daily overpasses in this region. Additionally, newer generation satellites like Sentinel-3 and SGLI have spatial resolutions of 250 and 300 m respectively whereas Landsat 8 and 9 both have a spatial resolution of 30 m. These multiple missions increase the chance of cloud free overpasses and the higher spatial resolutions are advantageous for monitoring the highly dynamic coastal regions in the Arctic.
From the multiple DOC-CDOM relationships explored, the linear relationships of aCDOM(412) to DOC concentration partitioned on a temporal and spatial basis were the least biased and had the lowest MAE between measured and modeled DOC compared to all other models. The large range of aCDOM(412) to DOC slopes indicate a complex relationship between the proportions of the DOM pool that are photometrically active and the total DOC concentration (Table 2). A substantial limitation of this approach is the difficulty of sampling in remote regions on a seasonal basis. Alternatively, using the MLR approach of Fichot and Benner (2011) to model DOC based on aCDOM(275) and aCDOM(295) is an efficient way to retrieve DOC concentrations without the limitations of seasonality and regional characteristics of the DOM pool. The method can model DOC concentrations almost as well as the linear approach within the highly dynamic Yukon Delta and Norton Sound region and the North Slope study area, which is an entirely different watershed-river-coastal sea system (Figure 7B). The CDOM signal is quite strong in this region of the UV spectrum, therefore measurements can be collected with less sensitive instrumentation, and offers the potential for obtaining a continuous time series through moored sensors when appropriate sensors become available. In addition, equitable partnerships can be established with locals to collect DOM samples and make spectrophotometric measurements regularly.
Nonlinear DOC models between S275:295 and aCDOM*(412) performed quite well and were applicable across temporal and spatial domains. Additionally, there is the added benefit of having one model that has good predictive capacity across locations and seasons, reducing the total number of coefficients and thus the potential for overfitting. Fichot et al., 2013 developed empirical algorithms to derive S275:295 from satellite measurements of ocean color with high accuracy throughout many different Arctic water types. Additionally, several researchers have retrieved S275:295 from ocean color measurements in estuarine and coastal systems (Mannino et al., 2014; Cao et al., 2018). The advantage of this work is that the models in our study were derived from the specific absorption coefficient at 412 nm, which is a heritage wavelength band for many satellites. Aligning the CDOM wavelength used to develop these models to the spectral band of a satellite sensor has great potential for improving the retrieval of DOC concentration in the coastal Arctic with satellite remote sensing.
A recommendation of which modeling approach to follow would be reliant upon a research group’s scientific objectives and field sampling approach. In Arctic regions that can be sampled at high frequencies seasonally and spatially, the linear based applications would be recommended for the most accurate predictions of DOC between sampling periods. However, due to the remoteness and difficulty of reaching Arctic field sites, the MLR approach would be recommended when sampling frequency is limited due to the model’s independence of seasonal and temporal limitations. Researchers that would like to develop remote sensing techniques to model and monitor DOM in the Arctic would benefit the most from the non-linear approach that utilizes both S275:295 and aCDOM(412) since these parameters have been retrieved in the past from satellite and other remote sensing applications (Mannino et al., 2014; Mann et al., 2016; Cao et al., 2018).
Spatial patterns of DOM properties in the north slope study area
The influence of the Jago and Hulahula Rivers was revealed by the strengthening of the relationship of aCDOM(412) to DOC when Beaufort Sea stations were partitioned based on their respective river system (Figures 1D and 6B). This characteristic adds to the uncertainty in predicting DOC using the linear aCDOM(412) to DOC relationship since there would likely be seasonal variations in addition to the spatial variations observed in this study. However, the MLR and non-linear DOC models yielded robust relationships for this region despite the spatial variability, and both approaches have been shown to be robust across seasons (Mannino et al., 2016; Cao et al., 2018). The lower DOC concentrations found here are in the range where the models perform particularly well and could be a powerful tool for modeling DOM distributions in the region (Figures 7B, C) and more broadly along the Beaufort Sea coast.
Based on the FDOM profiles, there appears to be a layer of elevated FDOM in the deeper water layer that extends several kilometers offshore (Figure 5). The composition of the layer cannot be determined from the FDOM measurements and may also detect other non-carbon-based fluorescing detrital compounds. Indeed, beam attenuation (beam-c) measurements from a WETLabs ac-s instrument deployed with the fluorometer indicate high particle loads in the bottom layer at these stations (see Supplemental Section). This is likely due to the resuspension of sediments that entrain pore water DOM into the bottom layer of the water column.
Spatial and seasonal patterns of DOM properties in the yukon river-norton sound system
During the ascending limb of the freshet, a large pulse of terrestrial organic matter characterized by high CDOM and DOC and low S275-295 was transported through the delta and entrained with marine waters in Norton Sound. During the South Mouth coastal transect, the plume was detectable at the surface through DOM and FDOM measurements over 25 km from shore. However, salinity increased and FDOM concentration decreased dramatically below 2 meters depth indicating the presence of marine waters beneath a strong pycnocline (Figures 1B and 4A). When the plume was sampled during the Norton Sound transect about ten days later, the hydrograph had already peaked at Pilot Station (Figure 2). Because of the lag time in water transport between Pilot Station and Norton Sound (~11-13 days for plume region and ~3 days to the Yukon Delta during peak freshet (Clark and Mannino, 2022), this approximate ten-day period was likely when the greatest amount of DOM was transported from the river channels to a great distance into Norton Sound (Figures 1C and 4B).
The South Mouth receives about 75% of the flow from Pilot Station and the DOM signal of the main flow of the Yukon River seems to dominate over any smaller inputs from the surrounding delta. Evidence of this can be seen when comparing the extremely high aCDOM(412) and DOC concentration values at Station 40, measured in the outflow from Nanvaranuk Lake, to station 41 that was sampled very close to where that tributary empties into the Yukon River (Figure 1B). The DOM values measured at station 41 were considerably lower than the tributary and much closer to the values measured at the South Mouth and the Main stem of the Yukon River (Table 1). However, discharge at the North Mouth is considerably lower than the other Yukon River mouths and the input from many small tributaries and lakes in this region could influence the DOM measurements at the NAC to have the signature of inputs from the surrounding delta. The average aCDOM*(412) during the ascending and descending limbs of the freshet were identical, and DOC concentrations at the river mouths with respect to each limb were very similar. However, aCDOM*(412) at the NAC was considerably higher and S275-295 was considerably lower than the other mouths during each limb indicating a compositional difference in the DOM.
The salinity-based conservative mixing lines between the Yukon River and Norton Sound endmembers provides evidence that DOC and aCDOM(412) behave relatively conservatively between Pilot Station and the various river mouths during the freshet and non-conservatively in late August (Figure 8). Exceptions during the 2019 freshet include a net increase and a net loss of aCDOM(412) between Pilot Station (8.24 m-1; Table 4) and the NAC (9.31 m-1; Table 3) and Pilot Station and the South Mouth (7.67 m-1; Table 3), respectively. Nevertheless, S275:295 between the Yukon River (0.0136 nm-1) and plume stations (0.0141 nm-1) were low and consistent, with the exception of the NAC (0.0130 nm-1), indicating that the material was likely from a similar terrestrial source (Tables 3, 4; Figure 8A). A net loss of DOC is apparent between the South Mouth and furthest offshore stations of the river plume during the freshet sampling (Figure 8A), which could be attributed to flocculation (river mouths to nearshore plume stations 3-5) or microbial processing, and dissolution processes (between stations 4 and 2) along the river to mesohaline salinity gradient.
Despite the short (~3 day) lag time of water flux from Pilot Station to the Yukon River mouths, the 30% reduction in TDN between Pilot Station and the river mouths at the ascending limb of the freshet and 20% reduction during the descending limb demonstrates significant microbial uptake of TDN or approximately 38 μg N L-1 d-1 during the ascending limb and 22 μg N L-1 d-1 during the descending limb (Table 4). TDN remains elevated within the Yukon River plume during the 2019 ascending limb freshet sampling in late May/early June and during the Norton Sound plume sampling on June 10-11 and is significantly lower by ~67% on average for Norton Sound stations outside of the plume (Tables 1, 4). During the late August 2018 sampling, TDN concentration at the river mouths was significantly higher than estimated at Pilot Station suggesting inputs of dissolved nitrogen to the river from (1) surface and groundwater transport of TDN into the river and/or (2) microbial processes within the rivers such as nitrogen fixation or degradation of particulate nitrogen into dissolved compounds.
During the late August 2018 sampling when river discharge was relatively low at Pilot Station (Table 4; Figure 2), both DOC and aCDOM(412) demonstrated a significant non-conservative decrease between Pilot Station and river mouths (Figure 8). DOC and aCDOM(412) were roughly conservatively distributed between the river mouths and marine endmember during the YK2018 sampling. The range of S275:295 values was much greater indicating changes in the composition of the DOM pool within the Yukon Delta and between the river mouths and plume stations. At this time, the discharge at Pilot Station was beginning to increase just a few weeks after the lowest discharge for the ice-free season was recorded. The magnitude of discharge between YK2018 and YK2019b was not considerably different (Figure 2); however, aCDOM(412) and DOC measured on YK2018 where over 50% less than the measurements from YK2019b. Also, both S275:295 and S300:600 values were much higher during YK2018 than the descending limb freshet sampling in 2019 (Tables 1, 3), which suggest that portions of the DOM pool were derived from different source materials (Fichot and Benner, 2012; Pain et al., 2019).
Later in the summer season, the ground within the Yukon watershed has thawed and groundwater flow paths penetrate deeper into soil layers tapping an older, more degraded source of DOM (Holmes et al., 2008; Spencer et al., 2008; Mcclelland et al., 2012), which could partially explain the higher S275:295 and S300:600 values compared to other seasons sampled. Additionally, due to longer residence times, the period of sunlight exposure on the river waters flowing through the delta would have increased during the lower flow period allowing for greater photochemical transformations of DOM to occur. These results are consistent with other studies in these (Spencer et al., 2009; Grunert et al., 2021) and other complex coastal waters (Moran et al., 2000; Helms et al., 2008; Clark et al., 2019). Grunert et al. (2021) reported that CDOM collected from the Yukon River-delta system is quite photoreactive. They also found that although photochemical processing of river-, plume- and marine- DOM in this system did not significantly change its concentration, it did have a large impact on DOM composition. Photodegradation resulted in a significant increase in the CDOM absorption spectral slope (S275-295) and an increase in the microbial processing of humic DOM components.
Impact of a serendipitous rain event on DOM in the yukon delta
During the 2018 sampling, there was a one-day gap in sampling that occurred between the third and last day of sampling due to heavy rains and inclement weather. While DOM measured before the rain even at the South Mouth and Alakanuk Channel were similar, DOC and aCDOM(412) were more than 60% higher at the Emmonak Channel measured the day after the rain event. Many observations across the delta to capture specific phenomena (e.g. storms and groundwater input) are needed to quantify DOC inputs to the watershed below Pilot Station. However, to gain an understanding of how much rain fell on the Yukon Delta, we examined data from the Integrated Multi-satellitE Retrievals for global precipitation measurement (GPM-IMERG), a multi-satellite precipitation product provided by NASA Goddard Earth Sciences Data and Information Services Center (Huffman et al., 2019). A level 3, 1-day image was used to estimate 2.9 mm of rain fell on the watershed below Pilot Station (100460 km2). Before the rain event, Yukon DOC was 3.43 ± 0.19 mg C L-1 and after the rain DOC was 4.80 ± 0.13 mg C L-1. Similarly, the average aCDOM(412) before and after the rain event was 1.72 ± 0.23 m-1 and 2.51 ± 0.51 m-1, respectively. Applying the concentrations measured before and after the rain event, the flow at Pilot Station, and the estimated volumetric rain input to the delta (2.9 mm x 100460 km2 = 0.29 km3), a mass balance equation was used to calculate the runoff DOC concentration entering the Delta to be approximately 9.9 mg C L-1. This suggests that during rain events, a higher concentration of DOM entering the Yukon River from local Delta sources can be a significant contributor of DOM on short time scales. These findings are consistent with the pulse-shunt concept in which significant precipitation events export DOM from watersheds into rivers and transport this DOM swiftly downstream (Raymond et al., 2016).
Fluxes of DOC, TDN, and aCDOM(412) from the Yukon River mouths to Norton Sound
The DOC, aCDOM(412), and TDN daily fluxes presented here represent snapshots of the significant annual fluxes of these materials from the Yukon River to the sea (Table 4). Clearly, river discharge is the first order driver of the magnitudes of DOC, TDN, and aCDOM fluxes from the Yukon River to Norton Sound but differences in concentration across the hydrograph can modulate the flux. The contribution of local inputs may alter the composition of DOM while the net flux remains largely stable which requires further chemical and experimental analysis to assess. Studies of the Mackenzie River delta, which empties into the Arctic Ocean in the Northwest Territory of Canada (Emmerton et al., 2008; Tank et al., 2011; Kipp et al., 2020) and Sacramento/San Joaquin River Delta located approximately 75 km northeast of San Francisco, California (Eckard et al., 2007; Kraus et al., 2008) have observed deltaic inputs of DOC and other constituents to these rivers. Despite the short transport time between Pilot Station and the river mouths, net inputs and losses of DOC, CDOM and TDN occurred (Table 4).
Long term trends in yukon river discharge and implications for DOM biogeochemistry
The flux of water from watersheds into coastal seas is a primary factor in regulating the flux of constituents such as nutrients and DOM exported from the land through rivers to the sea. Furthermore, the timing and magnitude of river discharge influences the concentration and composition of DOM exported from the upper watersheds to the lower portions of the river and ultimately to the ocean. This is particularly relevant for the Yukon River watershed which is extensive in area (854,696 km2) and in length (3190km) (Brabets et al., 2000). Annual Yukon discharge measured at Pilot Station has increased by 0.46 km3 y-1 (p=0.059 Figure 9A). Mcclelland et al. (2006) reconstructed Yukon River discharge to the Bering Sea by extrapolating the data from upstream Yukon River hydrographs between the years 1964-2000 and did not find a significant trend in annual volume. However, they reported an 0.4 km3 yr-1 increase in volume based on a Mann-Theil robust line fit to the data (p=0.1) which is quite similar to the trend from 1977-2020 estimated from our analysis. Increasing annual precipitation in the Pan-Arctic region (Rawlins, 2010; Wendler et al., 2017) and decreasing land ice cover (Box et al., 2019) along with elevated groundwater input due to melting of permafrost (Walvoord and Striegl, 2007) are potential mechanisms for the observed trend.
Analysis of monthly discharge between 1977-2020 showed that only the summer months, June-August, did not exhibit a significant trend. This is similar to the findings of Ahmed et al. (2020) who investigated the four largest rivers draining into the Arctic (Mackenzie, Ob, Lena and Yenisei). All other months displayed significant trends of increasing Yukon River discharge with the strongest trends identified for the months of April and May (Figures 9C, D), followed by moderate strength trends in September and October, indicating earlier melting and later freeze up could be occurring in the Yukon Delta region (Table 5). Similar trends in the timing of ice formation and breakup have been idenitfied in several studies (Magnuson et al., 2000; Hinzman et al., 2005; Meier and Dewes, 2020). Furthermore, there was a significant trend of an earlier onset of freshet start date identified that supports earlier thawing occurring in the region (Figure 9B). While the timing of the freshet is occurring earlier, the total volume of water within the freshet is relatively stable.
As discussed in Striegl et al. (2005), increases in Arctic River discharge in summer and autumn do not necessarily correlate with greater loads of DOC delivered to the Arctic Ocean, due to changes in the flow path of groundwater from permafrost melting and greater microbial processing occurring on land. Yet, changes in the composition and lability of terrigenous DOM, as Arctic hydrological cycles change, could have important impacts on coastal Arctic biogeochemistry. The bioavailability and composition of Yukon River DOM will vary with season as the sources of DOM and provenance of water flowing into the Yukon River vary (Spencer et al., 2008; Spencer et al., 2012; Mann et al., 2016; Clark and Mannino, 2021). Shifts in the timing and magnitude of the freshet and increases in seasonal discharge patterns expected to have important ramifications for the composition and transformation pathways of DOC, dissolved nitrogen, and CDOM flowing through the Yukon delta and into Norton Sound and the Bering Sea.
Conclusions
Our sampling efforts characterized the optical and biogeochemical properties of DOM during high and low river discharge periods for the Yukon River-Beaufort Sea system. DOC concentrations at the multiple Yukon River mouths sampled ranged from a high of 10.36 ± 0.22 mg C L-1 during the ascending limb of the 2019 freshet (end of May), 6.4 ± 0.15 mg C L-1 during the descending limb of the 2019 freshet (late June), and a low of 3.86 ± 0.87 mg C L-1 during the low river discharge period in August 2018. CDOM absorption coefficient at 412 nm (aCDOM(412)) at the Yukon river mouths averaged 8.23 ± 0.63 m-1, 5.07 ± 0.58 m-1, and 1.9 ± 0.52 m-1, respectively. During the freshet, DOC and aCDOM(412) were only 7.5% (8.92 ± 0.44 mg C L-1) and 28.4% (6.18 ± 0.42 m-1) lower in the Yukon River plume region of Norton Sound than at the river mouths during ascending limb of freshet, and decreased significantly to 1.41 ± 0.18 mg C L-1 and 0.27 ± 0.12 m-1 outside the plume. DOC and aCDOM(412) in the Northern Bering Sea and adjacent Norton Sound were 1.04 ± 0.2 mg C L-1 and 0.12 ± 0.05 m-1 during the equivalent freshet period of 2018. During the August 2019 low river discharge sampling of the Beaufort Sea systems, DOC and aCDOM(412) were similar to Norton Sound values and averaged 1.31 ± 0.2 mg C L-1 and 0.34 ± 0.18 m-1. CDOM spectral slope values for the 275 to 295 nm spectral range (S275:295) indicate a predominantly terrigenous source of the DOM within the Yukon River delta (0.0135 to 0.0163 nm-1) and plume (0.0141 ± 0.0001 nm-1) and mixing with marine sources of DOM in Norton Sound beyond the plume (0.0230 ± 0.0016 nm-1) and northern Bering Sea (0.0245 ± 0.0011 nm-1).
As residence time increases within the lower Yukon River, there is greater opportunity for transformations of DOM between Pilot Station and the Yukon Delta. Greater residence time allows for the delta to imprint itself on the concentrations, optical and chemical composition and fluxes of DOM from the lower Yukon River to Norton Sound plume and beyond. Our findings suggest that regional factors within the lower watershed including localized rain events and exchange of dissolved materials with lakes and the delta landmass also contribute to the magnitude and composition of the DOM exported to Norton Sound. The Yukon River system appears to function largely, but not exclusively, as a pipe during the peak freshet flow period of late May to June whereby materials from the upper Yukon are transported through the Delta into Norton Sound with only modest imprinting by the lower Yukon watershed and Delta. During lower flow periods typical of July and August, various processes including precipitation events, microbial decomposition, photochemistry, and river bank erosion within the lower Yukon and Delta can transform the DOM concentration and properties prior to flowing into Norton Sound. During the peak flow of the freshet, the river plume region and adjacent waters of Norton Sound are where the primary transformations of river-borne DOM occur especially across the river plume-to-sea boundary. As the properties of the water masses change along the Delta to sea gradient in terms of salinity, light penetration, nutrients, and composition of phytoplankton and heterotrophic microbial communities, the DOC concentrations and CDOM chemical and optical properties are altered. During lower flow post-freshet periods, the transformations of DOM occur within the lower River, Delta and plume resulting in more degraded DOM reaching the Norton Sound waters beyond the river plume. As the long-term seasonal and interannual patterns of river discharge and precipitation continue to change, the DOC concentration, DOM composition, and fluxes will likely follow influencing the biogeochemical cycles within and between the Delta and northern Bering Sea and potentially the Chukchi and Beaufort Seas. We hypothesize that greater amounts of terrigenous DOM will enter the Yukon River and Delta from surrounding watersheds yielding higher concentrations and fluxes of DOC and aCDOM to and from the lower Yukon River and Delta and exported to Norton Sound and the northern Bering Sea.
Data availability statement
The datasets presented in this study can be found in online repositories. The names of the repository/repositories and accession number(s) can be found below: https://seabass.gsfc.nasa.gov/cruise/Arctic_RSWQ_Yukon; https://seabass.gsfc.nasa.gov/archive/NASA_GSFC/Arctic_RSWQ/Arctic_RSWQ_Norton_Sound/archive; https://seabass.gsfc.nasa.gov/archive/NASA_GSFC/Arctic_RSWQ/Arctic_RSWQ_Kaktovik/archive.
Author contributions
MN and AM contributed the bulk of the writing and interpretation of the manuscript with all other authors providing significant input and guidance in the final format. JC was solely responsible for all of the flux modeling sections and the writing associated with them. MN and AK carried out the laboratory analysis of DOM samples and provided the final quality-controlled data products. All authors contributed to the article and approved the submitted version.
Funding
Funding for this research was provided by NASA Grants 80NSSC18K0492 and 281945.02.14.04.75 through the RemoteSensing of Water Quality program.
Acknowledgments
We express our sincere gratitude to all of the scientists and friends that aided in bringing this work to fruition: Steven Baier and Mike Lomas for collecting samples on the ASGARD cruise, Jim McClelland and the Beaufort Sea Lagoon LTER for logistical support and taking us out on the Jago and Kaktovik lagoons. Adem Boeckman, captain of the Anchor Point, the fishing vessel that made the Norton Sound transect possible. Jennifer Bell of the Alaska Department of Fish and Game who provided valuable information and housing in Nome. Scott Freeman for designing and equipping CTD profiling packages with optical sensors and processing all of that data. Crystal Thomas and Chris Kenemer for the HPLC pigment analyses. Paul Sobchenko for his help in the lab and preparing for fieldwork. Augusta Edmund and the Indian General Assistance Program (IGAP) for provided housing in Alakanuk, AK and arranging boat support in the Yukon Delta. The people of the native Alaskan villages of Alakanuk and Emmonak for their support, curiosity, friendship, and acceptance into their communities.
Conflict of interest
Author Michael Novak was employed by Science Systems and Applications Inc.
The remaining authors declare that the research was conducted in the absence of any commercial or financial relationships that could be construed as a potential conflict of interest.
Publisher’s note
All claims expressed in this article are solely those of the authors and do not necessarily represent those of their affiliated organizations, or those of the publisher, the editors and the reviewers. Any product that may be evaluated in this article, or claim that may be made by its manufacturer, is not guaranteed or endorsed by the publisher.
Supplementary material
The Supplementary Material for this article can be found online at: https://www.frontiersin.org/articles/10.3389/fmars.2022.949034/full#supplementary-material
References
Ahmed R., Prowse T., Dibike Y., Bonsal B., O’neil H. (2020). Recent trends in freshwater influx to the Arctic ocean from four major Arctic-draining rivers. Water 12, 1–13. doi: 10.3390/w12041189
Asmala E., Bowers D. G., Autio R., Kaartokallio H., Thomas D. N. (2014). Qualitative changes of riverine dissolved organic matter at low salinities due to flocculation. J. Geophys. Res.: Biogeosci. 119, 1919–1933. doi: 10.1002/2014JG002722
Berkey J. (2006). " a non-parametric monotonic trend test computing Mann-Kendall tau, tau-b, and sen's slope". (King county, department of natural resources and parks, science and technical services section (Washington. USA: Seattle).
Biskaborn B. K., Smith S. L., Noetzli J., Matthes H., Vieira G., Streletskiy D. A., et al. (2019). Permafrost is warming at a global scale. Nat. Commun. 10, 264. doi: 10.1038/s41467-018-08240-4
Blough N. V., Zafiriou O. C., Bonilla J. (1993). Optical absorption spectra of waters from the Orinoco river outflow: Terrestrial input of colored organic matter to the Caribbean. J. Geophys. Res.: Ocean. 98, 2271–2278. doi: 10.1029/92JC02763
Box J. E., Colgan W. T., Christensen T. R., Schmidt N. M., Lund M., Parmentier F.-J. W., et al. (2019). Key indicators of Arctic climate change: 1971–2017. Environ. Res. Lett. 14, 1–18. doi: 10.1088/1748-9326/aafc1b
Brabets T. P., Walvoord M. A. (2009). Trends in streamflow in the Yukon river basin from 1944 to 2005 and the influence of the pacific decadal oscillation. J. Hydrol. 371, 108–119. doi: 10.1016/j.jhydrol.2009.03.018
Brabets T. P., Wang B., Meade R. H. (2000). “"Environmental and hydrologic overview of the Yukon river basin, Alaska and canada",” in Water-resources investigations report (U.S. Department of the Interior: U.S. Geological Survey).
Cao F., Tzortziou M., Hu C., Mannino A., Fichot C. G., Del Vecchio R., et al. (2018). Remote sensing retrievals of colored dissolved organic matter and dissolved organic carbon dynamics in north American estuaries and their margins. Remote Sens. Environ. 205, 151–165. doi: 10.1016/j.rse.2017.11.014
Cayan D. R., Kammerdiener S. A., Dettinger M. D., Caprio J. M., Peterson D. H. (2001). Changes in the onset of spring in the Western United States. Bull. Am. Meteorol. Soc. 82, 399–416. doi: 10.1175/1520-0477(2001)082<0399:CITOOS>2.3.CO;2
Chen Y., Miller J. R., Francis J. A., Russell G. L., Aires F. (2003). Observed and modeled relationships among Arctic climate variables. J. Geophys. Res. 108 (D24), 1–13. doi: 10.1029/2003JD003824
Clark J. B., Mannino A. (2021). Preferential loss of Yukon river delta colored dissolved organic matter under nutrient replete conditions. Limnol. Oceanog. 66, 1613–1626. doi: 10.1002/lno.11706
Clark J. B., Mannino A. (2022). The impacts of freshwater input and surface wind velocity on the strength and extent of a Large high latitude river plume. Front. Mar. Sci. 8. doi: 10.3389/fmars.2021.793217
Clark J. B., Neale P., Tzortziou M., Cao F., Hood R. R. (2019). A mechanistic model of photochemical transformation and degradation of colored dissolved organic matter. Mar. Chem. 214, 1–12. doi: 10.1016/j.marchem.2019.103666
Del Castillo C. E., Miller R. L. (2008). On the use of ocean color remote sensing to measure the transport of dissolved organic carbon by the Mississippi river plume. Remote Sens. Environ. 112, 836–844. doi: 10.1016/j.rse.2007.06.015
Del Vecchio R., Blough N. V. (2004). On the origin of the optical properties of humic substances. Environ. Sci. Technol. 38, 3895–3891. doi: 10.1021/es049912h
Eckard R. S., Hernes P. J., Bergamaschi B. A., Stepanauskas R., Kendall C. (2007). Landscape scale controls on the vascular plant component of dissolved organic carbon across a freshwater delta. Geochim. Cosmochim. Acta 71, 5968–5984. doi: 10.1016/j.gca.2007.09.027
Emmerton C. A., Lesack L. F. W., Vincent W. F. (2008). Nutrient and organic matter patterns across the Mackenzie river, estuary and shelf during the seasonal recession of sea-ice. J. Mar. Syst. 74, 741–755. doi: 10.1016/j.jmarsys.2007.10.001
Feng D., Gleason C. J., Lin P., Yang X., Pan M., Ishitsuka Y. (2021). Recent changes to Arctic river discharge. Nat. Commun. 6917, 1–9. doi: 10.1038/s41467-021-27228-1
Fichot C. G., Benner R. (2011). A novel method to estimate DOC concentrations from CDOM absorption coefficients in coastal waters. Geophys. Res. Lett. 38, 1–5. doi: 10.1029/2010GL046152
Fichot C. G., Benner R. (2012). The spectral slope coefficient of chromophoric dissolved organic matter (S275-295) as a tracer of terrigenous dissolved organic carbon in river-influenced ocean margins. Limnol. Oceanog. 57, 1453–1466. doi: 10.4319/lo.2012.57.5.1453
Fichot C. G., Kaiser K., Hooker S. B., Amon R. M., Babin M., Belanger S., et al. (2013). Pan-Arctic distributions of continental runoff in the Arctic ocean. Sci. Rep. 31053. doi: 10.1038/srep01053
Goosse H., Kay J. E., Armour K. C., Bodas-Salcedo A., Chepfer H., Docquier D., et al. (2018). Quantifying climate feedbacks in polar regions. Nat. Commun. 91919. doi: 10.1038/s41467-018-04173-0
Grunert B. K., Tzortziou M., Neale P., Menendez A., Hernes P. (2021). DOM degradation by light and microbes along the Yukon river-coastal ocean continuum. Sci. Rep. 11, 10236. doi: 10.1038/s41598-021-89327-9
Harvey H. R., Mannino A. (2001). The chemical composition and cycling of particulate and macromolecular dissolved organic matter in temperate estuaries as revealed by molecular organic tracers. Org. Geochem. 32, 527–532. doi: 10.1016/S0146-6380(00)00193-5
Helms J. R., Stubbins A., Ritchie J. D., Minor E. C., Kieber D. J., Mopper K. (2008). Absorption spectral slopes and slope ratios as indicators of molecular weight, source, and photobleaching of chromophoric dissolved organic matter. Limnol. Oceanog. 53, 955–969. doi: 10.4319/lo.2008.53.3.0955
Hernes P. J., Benner R. (2003). Photochemical and microbial degradation of dissolved lignin phenols: Implications for the fate of terrigenous dissolved organic matter in marine environments. J. Geophys. Res. 108. doi: 10.1029/2002JC001421
Hernes P. J., Benner R. (2006). Terrigenous organic matter sources and reactivity in the north Atlantic ocean and a comparison to the Arctic and pacific oceans. Mar. Chem. 100, 66–79. doi: 10.1016/j.marchem.2005.11.003
Hernes P. J., Bergamaschi B. A., Eckard R. S., Spencer R. G. M. (2009). Fluorescence-based proxies for lignin in freshwater dissolved organic matter. J. Geophys. Res. 114. doi: 10.1029/2009JG000938
Hinzman L. D., Bettez N. D., Bolton W. R., Chapin F. S., Dyurgerov M. B., Fastie C. L., et al. (2005). Evidence and implications of recent climate change in northern Alaska and other Arctic regions. Climat. Change 72, 251–298. doi: 10.1007/s10584-005-5352-2
Holmes R. M., Mcclelland J. W., Peterson B. J., Tank S. E., Bulygina E., Eglinton T. I., et al. (2011). Seasonal and annual fluxes of nutrients and organic matter from Large rivers to the Arctic ocean and surrounding seas. Estuar. Coast. 35, 369–382. doi: 10.1007/s12237-011-9386-6
Holmes R. M., Mcclelland J. W., Raymond P. A., Frazer B. B., Peterson B. J., Stieglitz M. (2008). Lability of DOC transported by alaskan rivers to the Arctic ocean. Geophys. Res. Lett. 35. doi: 10.1029/2007GL032837
Holmes R. M., Mcclelland J. W., Tank S. E., Spencer R. G. M., Shiklomanov A. (2021a). Arctic Great rivers observatory. absorbance dataset. Woodwell Climate Research Center, Inc. US.
Holmes R. M., Mcclelland J. W., Tank S. E., Spencer R. G. M., Shiklomanov A. (2021b). "Arctic great rivers observatory. water quality dataset". Woodwell Climate Research Center, Inc. US.
Hooker S. B., Heukelem L. V., Thomas C. S., Claustre H., Ras J., Barlow R., et al. (2005). "The second SeaWiFS HPLC analysis round-robin experiment (SeaHARRE-2)" (NASA: Goddard Space Flight Center).
Huffman G. J., Stocker E. F., Bolvin D. T., Nelkin E. J., Tan J. (2019). “GPM IMERG late precipitation L3 1 day 0.1 degree x 0.1 degree V06” in Goddard Earth sciences data and information services center (GES DISC): NASA Goddard space flight center).
Khangaonkar T., Long W., Xu W. (2017). Assessment of circulation and inter-basin transport in the salish Sea including Johnstone strait and discovery islands pathways. Ocean. Model. 109, 11–32. doi: 10.1016/j.ocemod.2016.11.004
Kipp L. E., Henderson P. B., Wang Z. A., Charette M. A. (2020). Deltaic and estuarine controls on Mackenzie river solute fluxes to the Arctic ocean. Estuar. Coast. 43, 1992–2014. doi: 10.1007/s12237-020-00739-8
Kraus T., Bergamaschi B., Hernes P., Spencer R., Stepanauskas R., Kendall C., et al. (2008). Assessing the contribution of wetlands and subsided islands to dissolved organic matter and disinfection byproduct precursors in the Sacramento–San Joaquin river delta: A geochemical approach. Org. Geochem. 39, 1302–1318. doi: 10.1016/j.orggeochem.2008.05.012
Magnuson J. J., Robertson D. M., Benson B. J., Wynne R. H., Livingstone D. M., Arai T., et al. (2000). Historical trends in lake and river ice cover in the northern hemisphere. Science 289. doi: 10.1126/science.289.5485.1743
Mannino A., Novak M. G., Hooker S. B., Hyde K., Aurin D. (2014). Algorithm development and validation of CDOM properties for estuarine and continental shelf waters along the northeastern U.S. coast. Remote Sens. Environ. 152, 576–602. doi: 10.1016/j.rse.2014.06.027
Mannino A., Russ M. E., Hooker S. B. (2008). Algorithm development and validation for satellite-derived distributions of DOC and CDOM in the U.S. middle Atlantic bight. J. Geophys. Res. 113. doi: 10.1029/2007JC004493
Mannino A., Signorini S. R., Novak M. G., Wilkin J., Friedrichs M. A. M., Najjar R. G. (2016). Dissolved organic carbon fluxes in the middle Atlantic bight: An integrated approach based on satellite data and ocean model products. J. Geophys. Res. Biogeosci. 121, 312–336. doi: 10.1002/2015JG003031
Mann P. J., Spencer R. G. M., Hernes P. J., Six J., Aiken G. R., Tank S. E., et al. (2016). Pan-Arctic trends in terrestrial dissolved organic matter from optical measurements. Front. Earth Sci. 4. doi: 10.3389/feart.2016.00025
Mastrothanasis K. (2020) How can I make interpretation of kendall's tau-b correlation magnitude? Available at: https://www.researchgate.net/post/How-can-I-make-interpretation-of-kendalls-Tau-b-correlation-magnitude/5fea3c6fb5d53e21916e64e8/citation/download.
Matsuoka A., Boss E., Babin M., Karp-Boss L., Hafez M., Chekalyuk A., et al. (2017). Pan-Arctic optical characteristics of colored dissolved organic matter: Tracing dissolved organic carbon in changing Arctic waters using satellite ocean color data. Remote Sens. Environ. 200, 89–101. doi: 10.1016/j.rse.2017.08.009
Mcclelland J. W., Déry S. J., Peterson B. J., Holmes R. M., Wood E. F. (2006). A pan-arctic evaluation of changes in river discharge during the latter half of the 20th century. Geophys. Res. Lett. 33. doi: 10.1029/2006GL025753
Mcclelland J. W., Holmes R. M., Dunton K. H., Macdonald R. W. (2012). The Arctic ocean estuary. Estuar. Coast. 35, 353–368. doi: 10.1007/s12237-010-9357-3
Mcclelland J. W., Holmes R. M., Peterson B. J., Raymond P. A., Striegl R. G., Zhulidov A. V., et al. (2016). Particulate organic carbon and nitrogen export from major Arctic rivers. Global Biogeochem. Cycle. 30, 629–643. doi: 10.1002/2015GB005351
Mckinna L. I. W., Cetinic I., Werdell P. J. (2021). Development and validation of an empirical ocean color algorithm with uncertainties: A case study with the particulate backscattering coefficient. J. Geophys. Res. Ocean. 126, e2021JC017231. doi: 10.1029/2021JC017231
Meier W. N., Dewes C. F. (2020). “"Nenana ice classic",” in Tanana river ice annual breakup dates, version 2 (NASA National Snow and Ice Data Center Distributed Active Archive Center).
Meredith M., Sommerkorn M., Cassotta S., Derksen C., Ekaykin A., Hollowed A., et al. (2019). “"IPCC special report on the ocean and cryosphere in a changing climate",” in Polar regions.
Moran M. A., Sheldon W. M., Zepp R. G. (2000). Carbon loss and optical property changes during long-term photochemical and biological degradation of estuarine dissolved organic matter. Limnol. Oceanog. 45, 1254–1256. doi: 10.4319/lo.2000.45.6.1254
Oestreich W. K., Ganju N. K., Pohlman J. W., Suttles S. E. (2016). Colored dissolved organic matter in shallow estuaries: relationships between carbon sources and light attenuation. Biogeosciences 13, 583–595. doi: 10.5194/bg-13-583-2016
Pain A. J., Martin J. B., Young C. R., Huang L., Valle-Levinson A. (2019). Organic matter quantity and quality across salinity gradients in conduit- vs. diffuse flow-dominated subterranean estuaries. Limnol. Oceanog. 64, 1386–1402. doi: 10.1002/lno.11122
Pedrazas M. N., Cardenas B. M., Demir C., Watson J. A., Connolly C. T., Mcclelland J. W. (2020). Absence of ice-bonded permafrost beneath an Arctic lagoon revealed by electrical geophysics. Sci. Adv. 6. doi: 10.1126/sciadv.abb5083
Peterson B. J., Holmes R. M., Mcclelland J. W., Vorosmarty C. J., Lammers R. B., Shiklomanov A. I., et al. (2002). “"Increasing river discharge to the Arctic ocean",” in Science. New York, Washington, DC: Advancement of Science (AAAS).
Rawlins M. A. E. A. (2010). Globally observed trends in mean and extreme river flow attributed to climate change. J. Climate 23, 5715–5737. doi: 10.1175/2010JCLI3421.1
Raymond P. A., Saiers J. E., Sobczak W. V. (2016). Hydrological and biogeochemical controls on watershed dissolved organic matter transport: Pulse-shunt concept. Ecology 97, 5–16. doi: 10.1890/14-1684.1
Runkel R. L., Crawford C. G., Cohn T. A. (2004) Load estimator (LOADEST): A FORTRAN program for estimating constituent loads in streams and rivers (usgs.gov: USGS). Available at: https://pubs.er.usgs.gov/publication/tm4A5 (Accessed 2021).
Schaefer K., Lantuit H., Romanovsky V. E., Schuur E. A. G., Witt R. (2014). The impact of the permafrost carbon feedback on global climate. Environ. Res. Lett. 9, 1–9. doi: 10.1088/1748-9326/9/8/085003
Schuur T., Mcguire A. D., Romanovsky V., Schädel C., Mack M., Cavallaro N., et al. (2018). “"Chapter 11: Arctic and boreal carbon",” in (Second state of the carbon cycle report (SOCCR2): A sustained assessment report: U.S. global change research program), Washington, United States.
Schuur E. A., Mcguire A. D., Schadel C., Grosse G., Harden J. W., Hayes D. J., et al. (2015). Climate change and the permafrost carbon feedback. Nature 520, 171–179. doi: 10.1038/nature14338
Seegers B. N., Stumpf R. P., Schaeffer B. A., Loftin K. A., Werdell P. J. (2018). Performance metrics for the assessment of satellite data products: An ocean color case study. Opt. Express. 26, 7404–7422. doi: 10.1364/OE.26.007404
Spencer R. G. M., Aiken G. R., Butler K. D., Dornblaser M. M., Striegl R. G., Hernes P. J. (2009). Utilizing chromophoric dissolved organic matter measurements to derive export and reactivity of dissolved organic carbon exported to the Arctic ocean: A case study of the Yukon river, Alaska. Geophys. Res. Lett. 36, 1–6. doi: 10.1029/2008GL036831
Spencer R. G. M., Aiken G. R., Dornblaser M. M., Butler K. D., Holmes R. M., Fiske G., et al. (2013). Chromophoric dissolved organic matter export from U.S. rivers. Geophys. Res. Lett. 40, 1575–1579. doi: 10.1002/grl.50357
Spencer R. G. M., Aiken G. R., Wickland K. P., Striegl R. G., Hernes P. J. (2008). Seasonal and spatial variability in dissolved organic matter quantity and composition from the Yukon river basin, Alaska. Global Biogeochem. Cycle. 22, 1–13. doi: 10.1029/2008GB003231
Spencer R. G. M., Butler K. D., Aiken G. I. (2012). Dissolved organic carbon and chromophoric dissolved organic matter properties of rivers in the USA. J. OF. GEOPHYS. Res. 117, 1–14. doi: 10.1029/2011JG001928
Spielhagen R. F., Werner K., Steffen A. S., Zamelczyk K., Kandiano E., Budeus G., et al. (2011). Enhanced modern heat transfer to the Arctic by warm Atlantic water. Science 331, 450–453. doi: 10.1126/science.1197397
Stedman C. E., Markager S. (2003). Behaviour of the optical properties of coloured dissolved organic matter under conservative mixing. Estaur. Coast. Shelf. Sci. 57, 973–979. doi: 10.1016/S0272-7714(03)00003-9
Stedmon C. A., Amon R. M. W., Rinehart A. J., Walker S. A. (2011). The supply and characteristics of colored dissolved organic matter (CDOM) in the Arctic ocean: Pan Arctic trends and differences. Mar. Chem. 124, 108–118. doi: 10.1016/j.marchem.2010.12.007
Stedmon C. A., Markager S. (2003). Behaviour of the optical properties of coloured dissolved organic matter under conservative mixing. Estuar. Coast. Shelf. Sci. 57, 973–979. doi: 10.1016/S0272-7714(03)00003-9
Stewart I. T., Cayan D. R., Dettinger M. D. (2005). Changes toward earlier streamflow timing across Western North America. J. Climate 18, 1136–1155. doi: 10.1175/JCLI3321.1
Striegl R. G., Aiken G. R., Dornblaser M. M., Raymond P. A., Wickland K. P. (2005). A decrease in discharge-normalized DOC export by the Yukon river during summer through autumn. Geophys. Res. Lett. 32, 1–4. doi: 10.1029/2005GL024413
Striegl R. G., Dornblaser M. M., Aiken G. R., Wickland K. P., Raymond P. A. (2007). Carbon export and cycling by the Yukon, tanana, and porcupine rivers, alaska 2001-2005. Water Resour. Res. 43, 1–9. doi: 10.1029/2006WR005201
Tank S. E., Lesack L. F. W., Gareis J. A. L., Osburn C. L., Hesslein R. H. (2011). Multiple tracers demonstrate distinct sources of dissolved organic matter to lakes of the Mackenzie delta, western Canadian Arctic. Limnol. Oceanog. 56, 1297–1309. doi: 10.4319/lo.2011.56.4.1297
Tarnocai C., Canadell J. G., Schuur E. A. G., Kuhry P., Mazhitova G., Zimov S. (2009). Soil organic carbon pools in the northern circumpolar permafrost region. Global Biogeochem. Cycle. 23, 1–11. doi: 10.1029/2008GB003327
Toohey R. C., Herman-Mercer N. M., Schuster P. F., Mutter E. A., Koch J. C. (2016). Multidecadal increases in the Yukon river basin of chemical fluxes as indicators of changing flowpaths, groundwater, and permafrost. Geophys. Res. Lett. 43, 12,120–112,130. doi: 10.1002/2016GL070817
Twardowski M. S., Boss E., Sullivan J. M., Donaghay P. L. (2004). Modeling the spectral shape of absorption by chromophoric dissolved organic matter. Mar. Chem. 89, 69–88. doi: 10.1016/j.marchem.2004.02.008
Tzortziou M., Neale P. J., Megonigal J. P., Pow C. L., Butterworth M. (2011). Spatial gradients in dissolved carbon due to tidal marsh outwelling into a Chesapeake bay estuary. Mar. Ecol. Prog. Ser. 426, 41–56. doi: 10.3354/meps09017
Tzortziou M., Osburn C. L., Neale P. J. (2008). Photobleaching of dissolved organic material from a tidal marsh-estuarine system of the Chesapeake bay. Photochem. Photobiol. 83 (4), 782–792. doi: 10.1111/j.1751-1097.2007.00142.x
Valerio A. M., Kampel M., Vantrepotte V., Ward N. D., Sawakuchi H. O., Less D., et al. (2018). Using CDOM optical properties for estimating DOC concentrations and pCO2 in the lower Amazon river. Opt. Express. 26, A657–A677. doi: 10.1364/OE.26.00A657
Van Heukelem L., Thomas C. S. (2001). Computer-assisted high-performance liquid chromatography method development with applications to the isolation and analysis of phytoplankton pigments. J. Chromatogr. 910, 31–49. doi: 10.1016/S0378-4347(00)00603-4
Walvoord M. A., Striegl R. G. (2007). Increased groundwater to stream discharge from permafrost thawing in the Yukon river basin: Potential impacts on lateral export of carbon and nitrogen. Geophys. Res. Lett. 34, 1–6. doi: 10.1029/2007GL030216
Keywords: arctic, colored dissolved organic matter (CDOM), yukon river, alaska, climate change, hydrology, dissolved organic carbon (DOC)
Citation: Novak MG, Mannino A, Clark JB, Hernes P, Tzortziou M, Spencer RGM, Kellerman AM and Grunert B (2022) Arctic biogeochemical and optical properties of dissolved organic matter across river to sea gradients. Front. Mar. Sci. 9:949034. doi: 10.3389/fmars.2022.949034
Received: 20 May 2022; Accepted: 26 July 2022;
Published: 02 September 2022.
Edited by:
Baoshu Yin, Chinese Academy of Sciences (CAS), ChinaCopyright © 2022 Novak, Mannino, Clark, Hernes, Tzortziou, Spencer, Kellerman and Grunert. This is an open-access article distributed under the terms of the Creative Commons Attribution License (CC BY). The use, distribution or reproduction in other forums is permitted, provided the original author(s) and the copyright owner(s) are credited and that the original publication in this journal is cited, in accordance with accepted academic practice. No use, distribution or reproduction is permitted which does not comply with these terms.
*Correspondence: Michael G. Novak, bWljaGFlbGdlemFAZ21haWwuY29t; Antonio Mannino, YW50b25pby5tYW5uaW5vQG5hc2EuZ292