 Xenophon Dimas1*
 Elias Fakiris1
 Dimitris Christodoulou1
 Nikos Georgiou1
 Maria Geraga1
 Vasillis Papathanasiou2
 Sotiris Orfanidis2
 Spyros Kotomatas3
 George Papatheodorou1
- 1Laboratory of Marine Geology and Physical Oceanography, Department of Geology, University of Patras, Rio Patras, Greece
- 2Benthic Ecology and Technology Laboratory, Fisheries Research Institute (Hellenic Agricultural Organization-DEMETER), Kavala, Greece
- 3World Wild Fund for Nature (WWF) Greece, Athens, Greece
The aim of this study is to present the results of the first complete marine habitat mapping through marine remote sensing techniques in Gyaros Island, a remote island in the Cyclades archipelago with a great historical and ecological value. Gyaros Island is of great biological importance and, for this reason, since 2011, is part of the NATURA 2000 network and, by 2019, is characterised as a marine protected area (MPA). More than 80 km2 of seafloor area were inspected through a multi-platform marine remote sensing technique survey through two individual expeditions in 2014 and 2017. The remote sensing survey was conducted utilising side scan sonar, sub bottom profiler and multi- and single-beam echosounders. In addition to the remote sensing survey, an extensive ground truth network was established utilising a underwater towed camera and VanVeen sediment grabber. These resulted in the area being fully covered with high-quality data. Through these, a classification of the area was performed based on three distinct seafloor habitat mapping schemes (Expert, European Nature Information System and NATURA HD). The survey and the classification revealed that over 50% of the seafloor is covered by Posidonia oceanica meadows and coralligenous and other calcareous bio-concretion priority habitats. Based on the results of this work, Gyaros MPA was also established and different protections and conservation zones were set.
Introduction
Recent studies estimate that oceans around the world are under stress due to humans, and almost half of them (41%) are strongly affected by multiple human activities (Halpern et al., 2008; Micheli et al., 2013; Halpern et al., 2015; Korpinen and Andersen, 2016). One of the most affected is the Mediterranean Sea, a marine system that has been the centre of human marine activities (trade, fishing and warfare) since the first humans inhabited its coasts and islands. The impacts of these activities are easily spotted in the habitats constituting the mosaic of the Mediterranean Sea ecosystem (Kiparissis et al., 2011; Coll et al., 2012; Telesca et al., 2015; Sini et al., 2017).
A habitat can be defined as “both the physical and environmental conditions that support a particular biological community together with the community itself” (Foster-Smith et al., 2008). Meadows formed by the seagrass Posidonia oceanica (Linnaeus) Delile 1883 and Coralligenous and other Calcareous Bio-Concretions (biogenic reefs, maerl and rhodolith beds) are two of the Mediterranean Sea’s most important shallow water marine habitats. P. oceanica meadows comprise one of the most studied biotopes of the Mediterranean littoral zone; early studies estimated that it covers more than 23% of the shallow (0–50 m) sea bottom (Pasqualini et al., 1998). More recently, it is estimated that it is found in 70% of Mediterranean’s coastline covering an area estimated to be 12,247 km2 (Telesca et al., 2015). P. oceanica contributes in numerous ways to the welfare of the littoral zone (de los Santos et al., 2020), while through photosynthesis, it oxygenates seawater. Its dense rhizome and leaf structure acts as a feeding, living and nursery ground for a wide range of marine biota like smaller invertebrates, epiphytes and fishes and also acts as major organic carbon storage (Buia et al., 1992; Gacia et al., 2002; Pergent-Martini et al., 2005; Gobert et al., 2006; Fourqurean et al., 2012). Moreover, thanks to its dense rhizome structure, it stabilises the seabed, accumulates considerable amounts of sediment and, in turn, protects from coastal erosion. This is further enhanced by the leaf canopy, which acts as a natural wave barrier during summer. During winter, the deciduous leaves end up at the beach and function as a ‘blanket’, often called banquettes, minimising sediment transport (Gacia and Duarte, 2001; De Falco et al., 2008). All this make P. oceanica meadows a great asset for the environment with its value estimated up to 51,500 €/km2/year (Campagne et al., 2015). Studies also treat the P. oceanica meadows as a quality element to assess the ecological status of the littoral zone through relevant biotic indices (Gerakaris et al., 2003). Posidonia is a deciduous plant, and thus, it is characterised by seasonality in its leaf growth, reaching its maximum height during the late summer months and its lowest during winter, following its reproduction cycle. Moreover, wave conditions strongly affect canopy height, especially in shallow water areas (Gobert et al., 2006; Montefalcone et al., 2013), where higher wave energy can decrease the phenomenal height (Fonseca et al., 1982; Vacchi et al., 2012).
Coralligenous and other calcareous bio-concretions grow across the Mediterranean Sea in many forms (Ballesteros, 2006). The most typical forms are the coralligenous reefs, rhodolithic beds (marine calcareous red algae that resemble in size and form big spherical or elongated pebbles) and maerl bed (formed in coarse clean sediments of gravels and clean sands, where, in marine conditions, the dominant maerl is typically Phymatolithon calcareum (Pallas) W.H.Adey & D.L.McKibbin ex Woelkering & L.M. Irvine, 1986. These formations play a crucial role in the welfare of the sea bottom as they act as an excellent feeding ground for many fishes and crustaceans and as a regulator of the carbon production in the sea (Martin et al., 2013). While many studies are dedicated to different species of corals found around the Mediterranean (Ballesteros, 2006; Blondel et al., 2006; Bartlett et al., 2009; Bonacorsi et al., 2012; Giakoumi et al., 2013; Martin et al., 2014; Ingrassia et al., 2019; Romagnoli et al., 2021; Pierdomenico et al., 2021; De Falco et al., 2022), only a few take note of the unique coralligenous formations found throughout the Aegean Sea, especially in the Cyclades archipelago. There is only one systematic study (Georgiadis et al., 2009) dedicated to the research and mapping of this unique east Mediterranean habitat.
Those two ecosystems are under heavy stress due to the destructive impact of human activities such as fishing, anchoring, the invasion of alien species, and environmental pollution (Leriche et al., 2006; Ceccherelli et al., 2007; Kiparissis et al., 2011; Coll et al., 2012; Giakoumi et al., 2013; Telesca et al., 2015). In view of these pressures, the European Union has taken protection measures over the last four decades in order to minimise the impact and raise public awareness. The first action was proclaiming ecosystems as priority habitats under the European Union’s Habitat Directive (92/43/CEE), which names P. oceanica beds and coralligenous formation as Habitat Type 1120 (P. oceanica beds) and Type 1170 (Reefs), respectively. More recently, P. oceanica beds and several species of corals were also given focused attention in the Barcelona Convention under the ‘Protocol concerning Specially Protected Areas and Biological Diversity in the Mediterranean’. The latest action taken to protect those habitats was the Marine Strategy Framework Directive (MFSD) (2008/56/EC). This directive forces each member state of the EU to achieve or maintain ‘Good Environmental Status’ in the marine environment. This must be done by mapping and monitoring the habitats of significant importance throughout their marine areas and by establishing marine protected areas (MPAs). Towards this goal-mapping and monitoring habitats of significant importance emerges as a key process, allowing more sparse information to be extrapolated into wider regions. This action also complies with the undergoing effort of the Mediterranean region nations to achieve and maintain a ‘Good Environmental Status of the Mediterranean Sea and coast through an Ecologically Representative and Efficiently Managed and Monitored Network of Marine Protected Areas’ as stated by the Integrated Monitoring and Assessment Programme (IMAP)–MPA project.
Marine habitat mapping is the first step to be taken in order to establish an MPA. It is crucial to map the areas where the habitats thrive as it is of top priority to know the exact extent of the habitats that are taken under conservation inside the MPA (Alexandridis et al., 2009; Brown et al., 2011; Levin et al., 2014; Gonzalez-Mirelis and Buhl-Mortensen, 2015; Gerovasileiou et al., 2019). Thus, marine habitat mapping can be explained as: ‘Plotting the distribution and extent of habitats to create a map with complete coverage of the seabed showing distinct boundaries separating adjacent habitats’ (Foster-Smith et al., 2008). While large-scale habitat mapping on land is a relatively straightforward procedure, in most cases, utilising aerial and satellite remote sensing techniques, the same cannot be stated for marine habitat mapping (Brown et al., 2012). While these two techniques can be used in the very shallow part of the seafloor (0–50 m depth) and especially in mapping P. oceanica meadows (Pasqualini et al., 1998; Pasqualini et al., 2005; Traganos et al., 2018; Poursanidis et al., 2018), their technical limitations do not allow the mapping of the deeper parts of the sea bottom. The most prominent method of mapping these parts of the bottom is by using marine remote sensing techniques.
Marine remote sensing is based on acoustic data collection, processing and interpretation to produce accurate maps of the seabed habitats. Towards that end, the main acoustic systems are the single-beam echo sounders (SBESs), sub-bottom profilers (SBPs), multi-beam echo sounder (MBES) and side scan sonar (SSS). While SBES and SBP provide data of high quality for the depth and habitat type (HT) of the seafloor and for the sediment accumulation, sediment type, lithology and habitat of the seafloor and below it (Fakiris et al., 2018), respectively, they lack spatial data coverage as such information is created in a line-based manner. The total coverage of the sea bottom is achieved by using MBES and SSS systems, which, through swath type scanning of the seafloor, can cover vast areas of the bottom in brief time. MBES is not only used primarily for collecting bathymetry data but, through the backscatter of the acoustic signal, may also produce information about the lithology and HT of the bottom equivalent, if not better, to those of the SSS (Collier and Brown, 2005; Le Bas and Huvenne, 2009; Di Maida et al., 2011; Papatheodorou et al., 2012; Innangi et al., 2015; Lacharité et al., 2018; Rocha et al., 2020; Prampolini et al., 2021). In order to produce the final map, this acoustic backscatter data have to be verified and linked to a habitat or bottom type (BT) by using ground-truthing data, like sediment and biota sampling and an underwater video (Kostylev et al., 2001; Solan et al., 2003; Hühnerbach et al., 2007; Innangi et al., 2019; Sañé et al., 2021). The most common classification schemes of habitat mapping are through segmenting the bottom based on previously established typologies like the European Nature Information System (EUNIS), NATURA and the Updated Classification of Benthic Marine Habitat Types for the Mediterranean Region system introduced by the Specially Protected Areas Regional Activity Centre (SPA/RAC) and UN Environment/Mediterranean Action Plan (MAP) (SPA/RAC-UN Environment/MAP, 2019) ones, while, in some cases, manual classification typologies used are based on expert judgement (Kostylev et al., 2001; Solan et al., 2003; Hühnerbach et al., 2007; Huvenne et al., 2007; Micallef et al., 2012; Henriques et al., 2015; Fakiris et al., 2018; Viala et al., 2021).
While many studies have been conducted in order to map these two habitats around the Aegean part of the Mediterranean Sea, these are either too broad scaled and the results are based on probability models and different levels of data quality and source (Giakoumi et al., 2013; Martin et al., 2014; Sini et al., 2017) or they are using only a limited set of data or techniques (Georgiadis et al., 2009). The aim of this study is to present the results of mapping the sea bottom of Gyaros Island, a remote island in the Cyclades archipelago with a great historical and ecological value, through the combined application of a wide range of acoustic (SBES, MBES, SBP, SSS), visual [underwater towed camera (UTC) footage] and sampling (sediment and biota samples) techniques.
This is the first study conducted in the Aegean Archipelago and especially at the Cyclades Plateau focused on mapping these habitats through a high level of accuracy and multi-platform acoustic data in an area of high ecological value as well as evaluating three different habitat classifications systems, EUNIS, NATURA and a research-specific classification scheme and their suitability as an important contribution to the development of a MPA’s conservation plan.
Materials and methods
Study area
Gyaros Island is a small island (surface area 17.5 km2) that, together with the two islets Glaronisi and Fouis, are located in the northern border of the Cyclades archipelago between the islands of Syros, Tinos, Kythnos, Kea and Andros (Figure 1). It is currently uninhabited but has been inhabited since ancient times and has a gruesome history; it was used as a political exile and concentration camp by the Romans as stated in one of the Juvenal quotes “Aude aliquid brevibus Gyaris et carcere dignum.” translated as “If you want to become someone worthy, dare to do something that will get you exiled and imprisoned in Gyaros” and more recently (in the 40s and 60s) and by the 70s, Greek military dictatorship. The island is barren of any arboreal vegetation and is characterised by steep cliffs that form the northern and southwestern coast of the island, while the rest is more accessible with small beaches and the small port at the east coast where the abandoned prison encampment is located. The whole island consists of schist rock and is part of the Attico-Cyclades massif. The prominent sea currents in the area are of the N-NE direction, and it is the northern part of a cyclonic gyre current created in the whole area of the Cyclades plateau (Olson et al., 2007). In 2001, Gyaros was characterised as a place of historical heritage (Greek Government Gazette No. 1680/β/17.12.2001), and since 2011, it has also been enlisted into Greece’s Natura 2000 list of protected areas. The endangered Mediterranean Monk Seal (Monachus monachus Hermann 1779) uses the island’s many caves as a breeding and nursing ground. The same applies to numerous seabirds, with the most notable a large colony of yelkouan shearwater (Puffinus yelkouan, Acerbi, 1827) and various migrating birds such as Falco eleonorae (Gene, 1839) falcon and Hiearraeteus fasciatos (Vieillot, 1822) eagle, while the Hierophis viridiflavus (Lacépède, 1789) snake can also be found on the island. Since 2013, a number of conservation actions have been implemented in Gyaros Island, under the coordination of World Wildlife Fund Greece (WWF Greece) through the European Union Cyclades Life “Integrated Monk seal conservation of Northern Cyclades” program that aimed at establishing a new model MPA around the Natura site of Gyaros. As a result, in 2015, the site was designated by the Greek competent authorities as the first marine Wildlife Reserve of the country and later, in 2019, was formally designated as an MPA according to the Greek Government Gazette No. 389/D/4.7.2019.
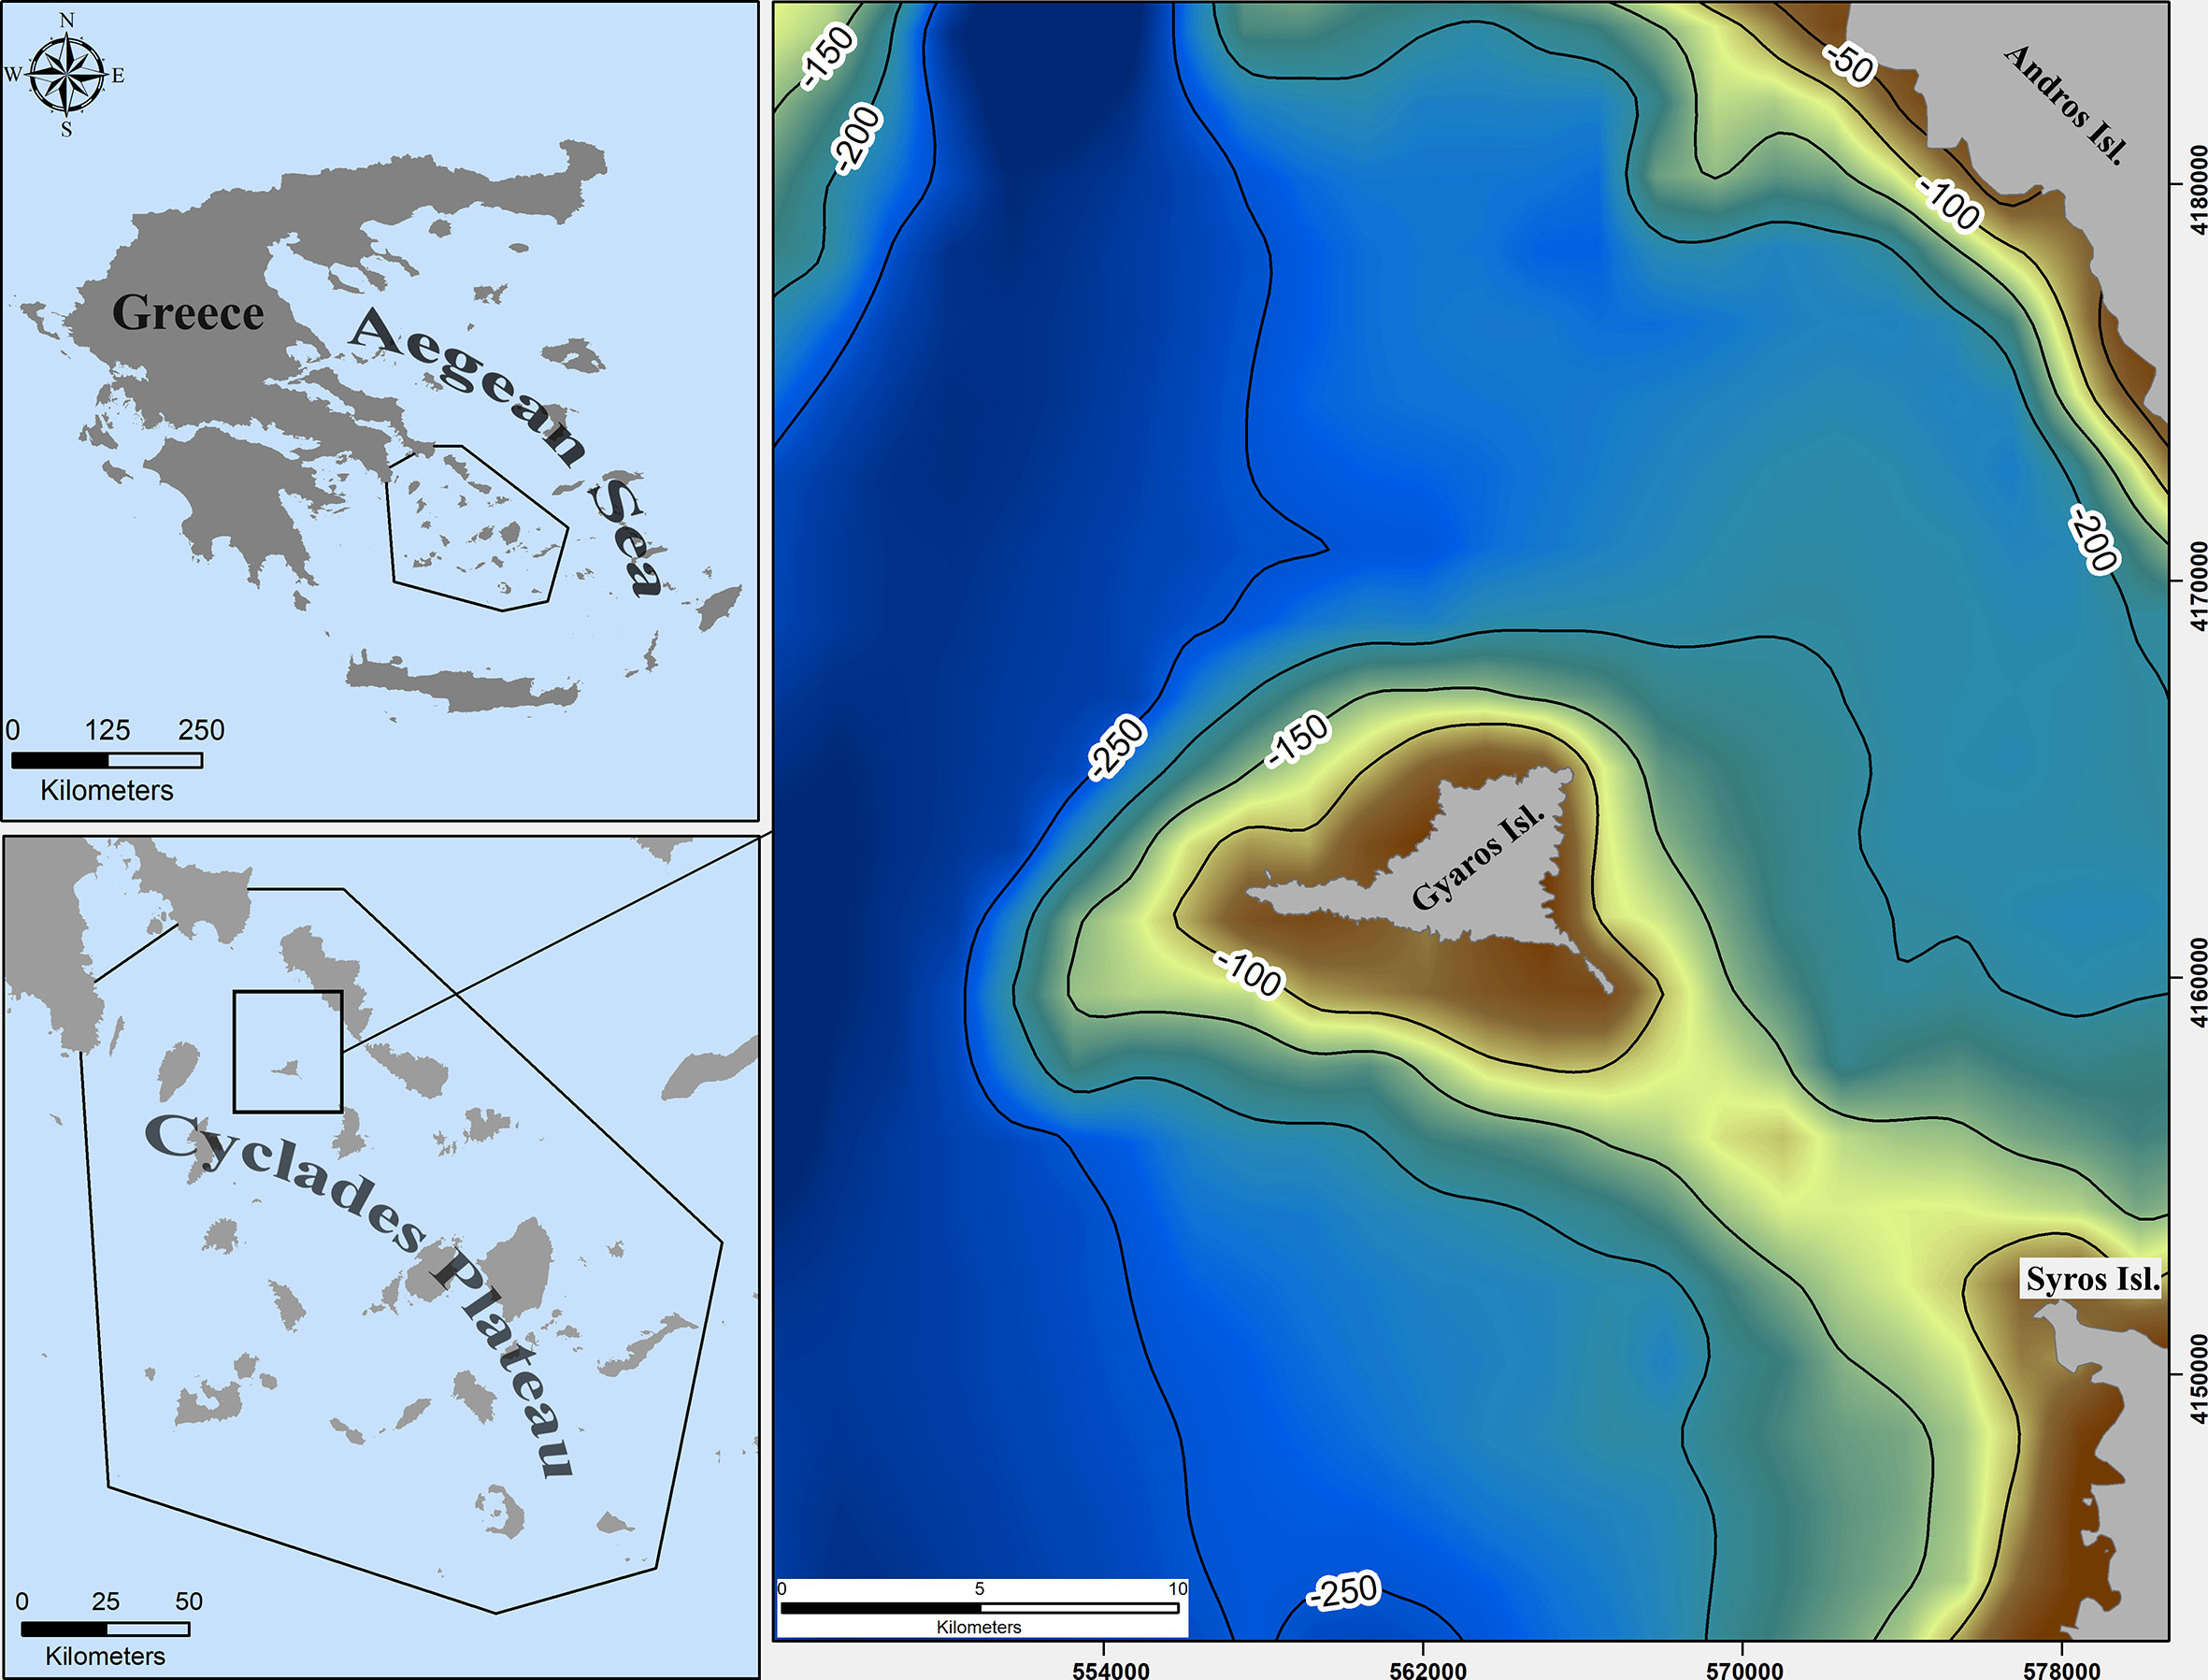
Figure 1 Gyaros Island location in the Cyclades plateau and the general bathymetry of the area.
Survey design and data acquisition
The survey was designed and conducted in two phases: (a) a detailed geophysical–marine remote sensing survey and (b) a ground-truthing survey, based on the results of the preliminary interpretation of the geophysical data. The acquisition of the data took place in two different expeditions in summer of 2014 and fall of 2017. While both of the expeditions were conducted in the same manner, different combination of equipment was used in each survey. In 2014 a SSS, a SBP, a SBES and an Aquatic habitat echosounder was the combination for the marine remote sensing survey. For the 2017 survey, the SBP and Aquatic habitat echosounder were swapped for an Interferometric Sonar MBES. For the Ground Truth survey an UTC and a grabber were used for both 2014 and 2017 surveys. To achieve a full coverage of acoustic data in the study area, a dense survey-line plan was carried out (Figure 2), and as a result, an area of 87.30 km2 was surveyed. A total of 146 survey lines were conducted (Figure 2), with their total length being 371.46 km. In both of the surveys and during each of the lines conducted, all of the marine remote sensing equipment was operated, and their respective data were collected and georeferenced, simultaneously.
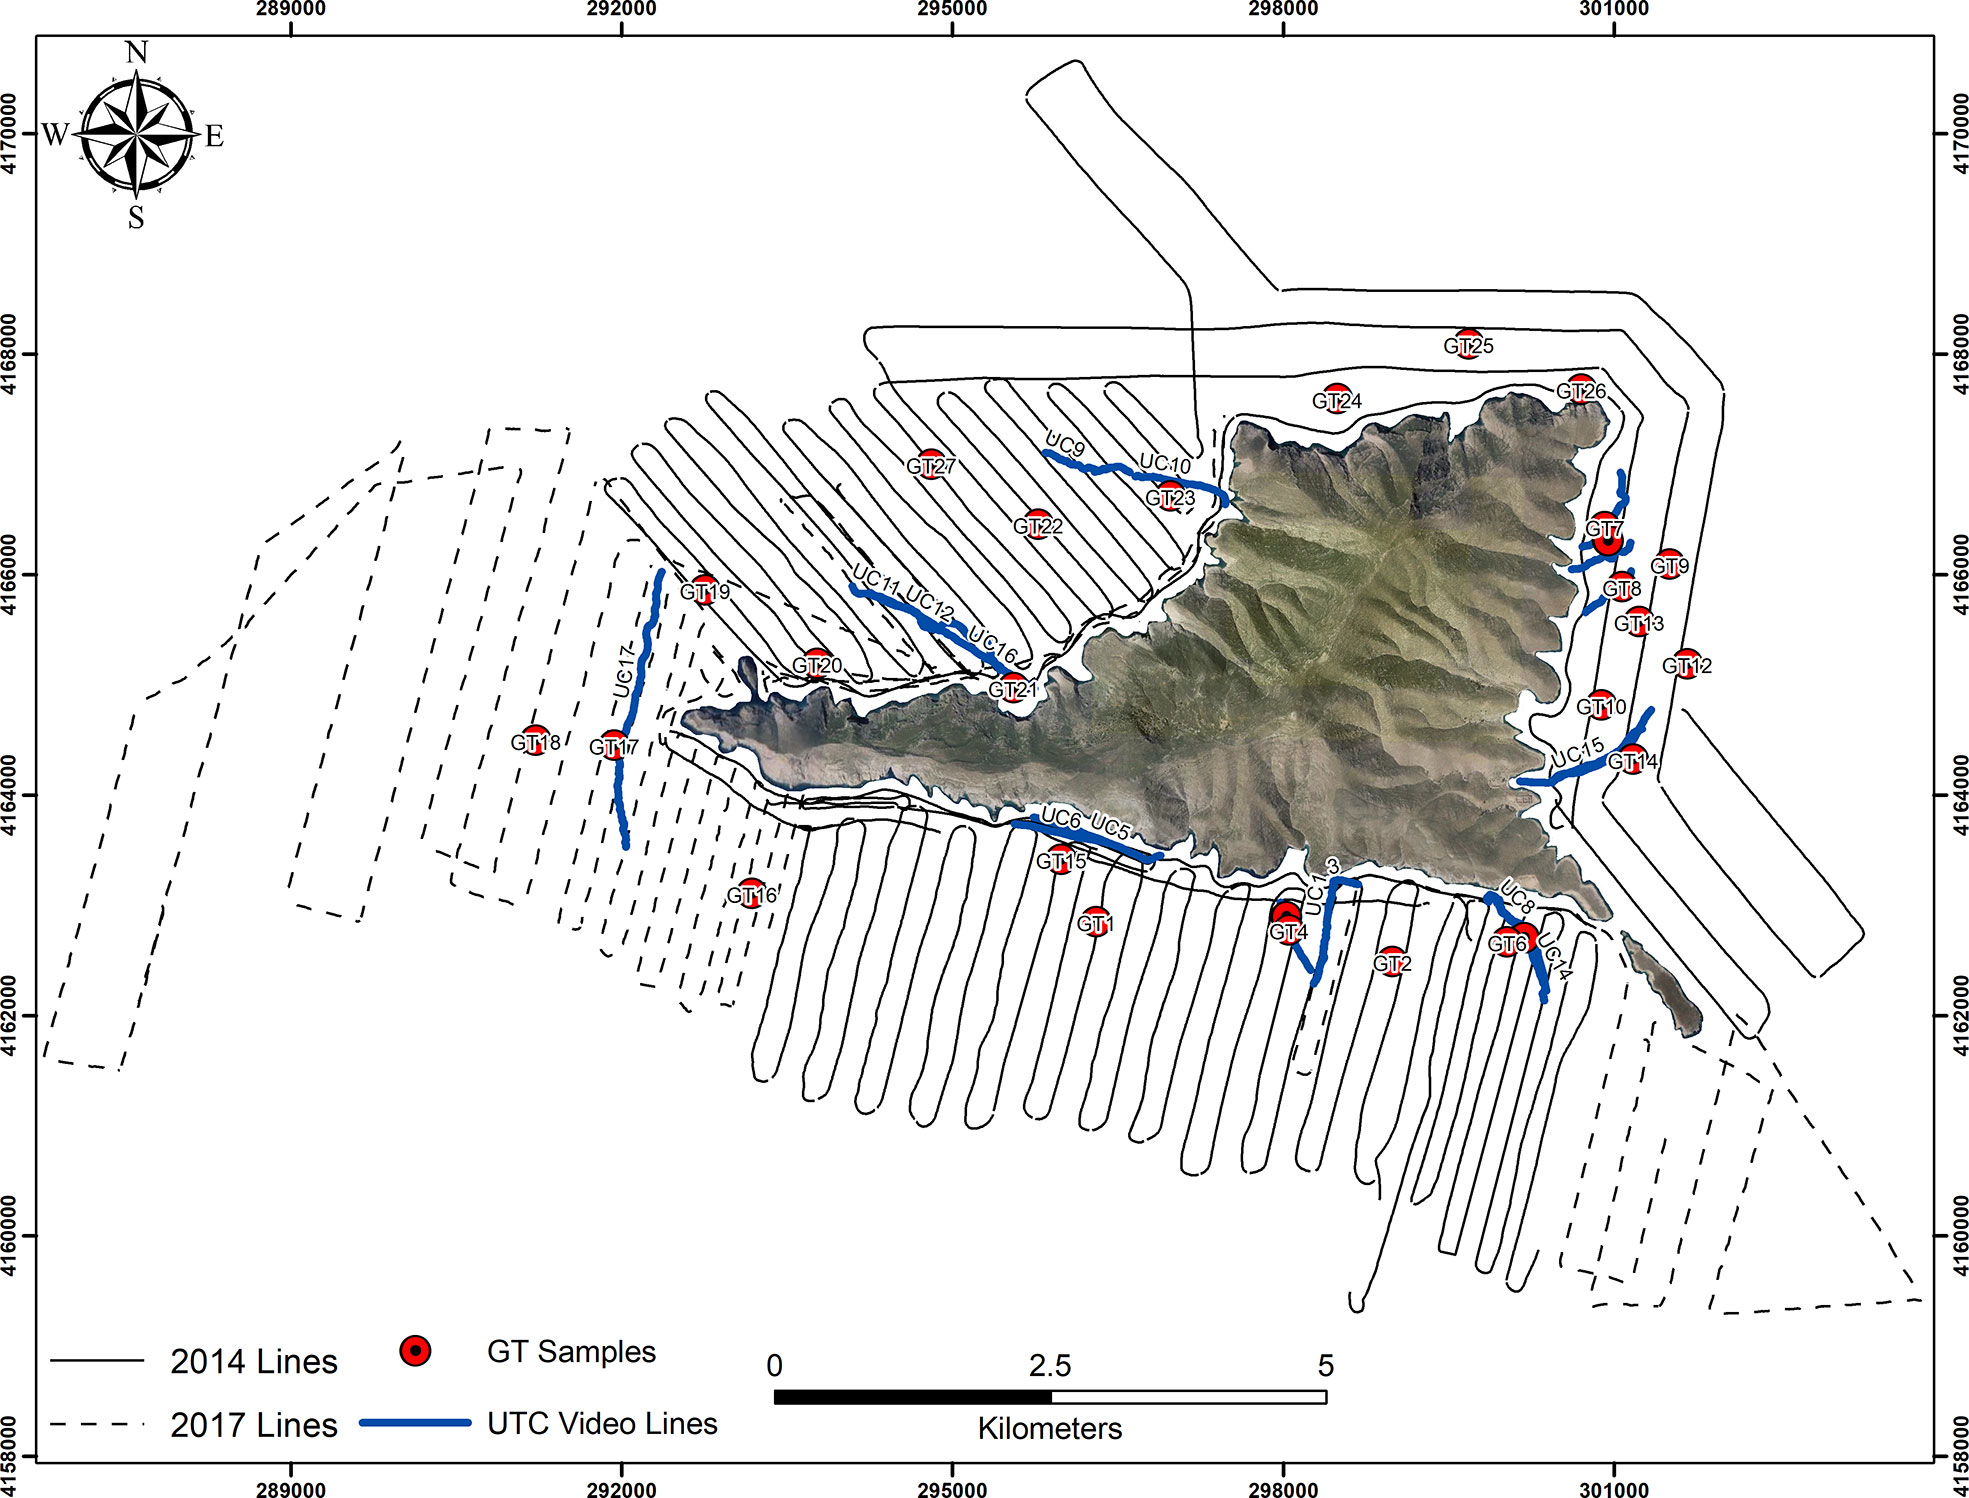
Figure 2 Map of the remote sensing and underwater video track lines and ground-truthing sample location.
The area was segmented into two zones; the first consisted of the eastern and northern parts of the island, and the second comprised the south and western parts. In the first area, the lines were conducted parallel to the shoreline, with the distance between them being 350 m. At the second area, the lines were conducted perpendicular to the shoreline and the distance between them was 250 m. Furthermore, in order to cover the very shallow areas (less than 10 m), additional parallel lines to the island’s shoreline were conducted.
Those lines were conducted using a dual-frequency Edgetech 4200 SP SSS, simultaneously transceiving 100 and 400 kHz. The SSS towfish was towed at variable length so as to keep a height above the seabed between 5 and 50 m. The slant range was set to 150 m per channel, and achieving resolution between 30 cm and 1 m. The system is comprised of the SSS towfish, a Kevlar cable of 150 m length that serves for both towing and data transfer and the Edgetech 4200P digital recording unit. A Kongsberg Chirp SBP was also used, emitting a multi-frequency between 2 and 11.5 kHz wave with the pulse length set to 1 ms, thus enabling a vertical resolution of 20 cm while retaining a high sampling rate. The system consists of an array of four underwater transceivers, the sealed digital processing unit and the recording unit. Data were also collected with a BioSonics MX Aquatic Habitat Echosounder, characterised by a very narrow (8.5°) conical beam of high frequency (214.8 kHz) and of very short pulse length (0.4 ms). An ELAC Hydrostar 4300 SBES operating at 30 and 200 kHz, achieving a depth resolution of almost 1 cm and a Bathyswath 1 Interferometric Sonar operating at 234 kHz were also used. MBES, SBES, SBP and the Aquatic Habitat Echosounder were pole-mounted to the side of the vessel with enough distance between them so as to prevent interference between them in regard to their emitting frequencies. In addition, based on the results of the SSS and SBP survey, a SeaViewer UTC was used to inspect the seafloor along 17 transects, while 27 bottom samples were collected using a Van Veen Hydro Bios Grabber as shown in Figure 2.
Data processing
Bathymetry and slope
The bathymetric map of the area was created by processing and combining the two datasets of bathymetrical data. The first dataset was the outcome of the 2014 survey using the ELAC Hydrostar 4300 SBES. This resulted in a XYZ file with depth points along the survey lines. The second dataset was collected during the 2017 survey using the Bathyswath 1 Interferometric Sonar. The swath bathymetrical data were processed through Hypack software MBMAX suite, applying ship motion, underwater sound velocity, tide and automated geometrical corrections, resulting in a grid of the XYZ data of high accuracy. Given the different resolution and coverage between the two datasets, their merging was based in the lower-resolution one (SBES) via the application of spatial interpolation methods (Kriging) in the Arc GIS suite. The final depth and slope rasters had a 20 m cell size resolution.
Side scan sonar
The raw SSS data were combined and reformed into a sonograph mosaic through the Sea View MOSAIC of Moga Software s.r.l. The data processing included the application of Automatic Gain corrections, destriping filters and slant range correction regarding the signal processing and layback corrections and spike removal regarding the navigation processing. The pixel resolution of the mosaic was 0.5 m. The high resolution enabled the identification of even the smallest targets lying on the bottom and discrimination of the borders between different neighbouring BTs based on their reflectivity. The areas of the seafloor with high reflectivity, for example, rocky outcrops, are depicted with light tone colours and areas with low reflectivity, for example, a muddy bottom with dark-tone colours, respectively.
Seismic stratigraphy
Seismic stratigraphy data were collected through Chesapeake Technology Inc. SonarWiz software and saved in an.sgy format. The data were processed through the SB-Interpreter software developed by Triton Imaging Inc. Time-varied gain (TVG), automatic gain control and swell correction filter corrections were applied to the data. The defining and picking of the seismic reflectors of the sediment layers and the bedrock were done based on their continuity, sharpness, distinctiveness and amplitude (Damuth, 1980). A XYZ file of the survey area’s sediment thickness was created.
P. oceanica meadows and canopy height detection
SSS is the prominent instrument used for detecting P. oceanica meadows (Kiparissis et al., 2011; Montefalcone et al., 2013) because of its ability to cover large areas in a short time with a very high detail. Although very efficient in mapping P. oceanica, in some cases, SSS cannot clearly distinguish a meadow from the matte or surrounding seafloor, especially when this is comprised of coarse sediments like sand and gravel (Pasqualini et al., 1998; Sánchez-Carnero et al., 2012). In addition, SSS also lacks the ability to estimate the canopy height of the plant itself. For this purpose, a BioSonics MX aquatic habitat echosounder was used to detect subsea plantation with great accuracy while also giving information about the seafloor composition and bathymetrical data of high accuracy. Although the instrument was originally designed to monitor the canopy height of lake or kelp forest marine vegetation with a stable canopy height, this is the first application in measuring P. oceanica canopy height. The instrument specifications of high frequency combined with the very narrow conical beam and short pulse length make it able to distinguish the canopy height of P. oceanica above the seafloor. The data processing was done through the Visual Habitat software developed by BioSonics, Inc. The data are depicted as two reflectors: the top one referring to the canopy height and a second one of the seafloor. The canopy reflector was manually picked, while the seafloor one was picked automatically using the bottom detection automated tool that is based on the reflector’s strength. The canopy height is found by subtracting the depth of the seafloor to the depth of the canopy limit. This resulted in an XYZ file for each line where Z is the canopy height. Finally, through the ArcGIS suite, the canopy height map was created.
Ground-truthing survey
In the lack of an underwater positioning system, the position of the TUC was approximated by using the vessel’s Global Positioning System fixes, the cable-out and the actual depth below the vessel, as presented in Fakiris et al. (2022). Although the cable-out was known during all stages of the field work, the exact position of the TUC cannot readily be known due to the along-track drag, sea currents and vessel speed changes that alter the cable-out needed to reach the desired depth. A convenient solution for precisely geolocating the TUC was found to be matching landmarks, such as targets and sharp material changes, visible in both the backscatter mosaic and the video footage. The position where the camera was during the survey was estimated for a number of occurrences, and the layback was approximated for all the mid-distances via X and Y interpolation in the time domain, using the piecewise cubic hermite interpolating polynomial. This way, we drastically increase the along-track position accuracy of the TUC, which is now dependent on the positional accuracy of the SSS backscatter mosaic.
The sediment samples were photographed during the acquisition and then evaluated through granulometry. For the granulometry comparison of the samples, the Wentworth size scale was used along with Folk’s nomenclature (Folk, 1974). For 5 out of the 27 samples collected, there was not enough material collected to perform any granulometry analysis. The remaining 22 samples were all dry- sieved using sieves ranging from 2 to -4 phi with 1-phi interval. Additionally, two samples with no significant component (<1%) of coarse sand were wet-sieved through a Malvern Mastersizer 2000 laser diffraction counter.
Data interpretation
Coralligenous formations identification through side scan sonar and sub-bottom profiler data
SSS and MBES backscatter analyses are the most prominent techniques of marine remote sensing used for the detection of coralligenous reefs (Roberts et al., 2005; Ballesteros et al., 2006; Collier and Humber, 2007; Le Bas and Huvenne, 2009; Cogan et al., 2009; Martin et al., 2014; Fakiris et al., 2019; Sañé et al., 2021). The acoustic signature of coralligenous reefs is similar to that of rocky outcrops as they both appear as features on the bottom of very high backscatter in the SSS and MBES data due to their hardness and rugosity. In the case of rhodolithic beds, their acoustic signature is almost identical to a bottom comprised of coarse sediments; thus, ground truth is necessary to properly identify and discriminate rhodolithic beds from coarse-grain-size beds (Brown et al., 2011).
While SSS and MBES are the most widespread methods to detect and map coralligenous reefs through this survey, SBP proved to be an extremely accurate method for the detection of reefs. The detection of coralligenous reefs through SBP has also been mentioned before (Georgiadis et al., 2009; Fakiris et al., 2018; Fakiris et al., 2019). The SBP lines were appropriately processed, applying TVG and amplitude signal enhancements in order to better highlight the area between 40 and 110 m of water depth. The reefs were identified as a low- amplitude acoustic reflector compared to the adjacent bottom reflector, which was either protruding from the bottom, forming a mound-like shape or being in the same level as the bottom. The reef reflector lacked any hyperbolic echoes, and no subsequent parallel reflectors were recorded. This sound reflection pattern can be attributed to the very composition of the reef, which is characterised by cavities and its irregular shape that does not reflect the soundwaves in a regular manner but instead, it scatters them (Georgiadis et al., 2009). The SBP was unable to detect the rhodolithic beds surrounding the reefs contrary to coralligenous reefs. This is because the rhodoliths are scattered on the sea bottom, and their small size places them below the detection limit of the SBP.
P. oceanica recognition through side scan sonar and sub-bottom profiler sonograph interpretation
In SSS sonographs, P. oceanica habitat is depicted as a heterogeneous area of relatively high backscatter with spotted and rugged texture while creating acoustic shadows on its far-range limits (Pasqualini et al., 1998; Kiparissis et al., 2011). The oxygen bubbles, produced during the photosynthesis, passing through the plant stem also further enhance its acoustic reflectivity (Hermand, 2003). In SBP profiles, P. oceanica meadows are presented as an enhanced bottom reflector of high backscatter with a jagged surface that does not permit sound wave propagation in the lower units (Fakiris et al., 2018).
Bottom types and seafloor classification schemes
The classification of the seabed in distinct BTs based on the acoustic characteristics and the HT present in the area is achieved through overlaying all the available data in a common map. The habitat mapping was performed by overlaying all these data layers in ArcMap GIS software and applying expert manual classification and the two other classification models based on the schemes of the NATURA HD and EUNIS network.
Expert classification is used in order to segment a survey area into distinct fragments that fully describe the area’s properties based on the geomorphological, biological and geological features of the bottom.
While expert classification possesses the advantage of segmenting the survey areas in many different BTs as to better describe its properties, it has limited applications as it is only relevant to each specific area (case specific). To overcome this issue, many classification schemes have been introduced as a guideline tool for habitat mapping. Three of these guidelines are the NATURA HABITAT DIRECTIVE-HD (92/43/EEC) and EUNIS schemes introduced by the EU and the SPA/RAC and MAP scheme that is a product of the ongoing effort of the Barcelona Convention (SPA/RAC-UN Environment/MAP, 2019).
The NATURA HD classification scheme was introduced through the Interpretation Manual of European Union Habitats in 1992 and was last revised in 2013 as a guidebook for the countries in order to better decipher the Habitat Directive of the EU and map their Natura 2000 areas based on this. Since then, few changes have been made to better characterise habitats.
The EUNIS for marine habitats was introduced in 2012 by the European Environment Agency and is the by-product of the conjunction of the Annex I of the EU Habitats Directive and the HTs in Resolution 4 of the Bern Convention. The EUNIS classification offers five distinct levels of classification, based on the amount of biological information at hand. Level 1 is the more generic category of marine benthic and pelagic ecosystems, and Level 5 is the highly detailed categories associated with different biocenosis and environmental conditions.
The classification scheme produced by the SPA/RAC and MAP was revised in 2019. The revision was done to implement changes and to include all the information derived from changes in classification systems (Natura, EUNIS, Corine, etc.) applied in the Mediterranean Sea as well as new studies regarding the habitats in it. The classification has a three-level system and follows the structure of the EUNIS scheme.
Since the Eunis and SPA/RAC and MAP classification systems share the same categories for the BTs regarded in this study, it has been decided that, for the presentation of the results, the EUNIS system is to be used while the correspondence between them is presented in Supplementary Material Table 1.
Results
Geophysical and ground-truthing survey results
Bathymetry and slope
The depth and slope range of the survey area are between 0 and 160 m (Figure 3A) and 0° and 25° (Figure 3B), respectively. In general, the island’s coastal area is characterised by very steep slopes and cliffs that are continued below the water level. The survey area can be segmented into three zones. The first zone, close to the coast, is between 0 and 40 m depth and is characterised by the highest slope (25°). The second zone is between 40 and 110 m depth where the slope gets smoother (5°), and the third zone is deeper than 110 m water depth where the slope is the lowest, forming an almost-horizontal bottom (2°). In detail, the highest slope is located at the southern and north-eastern coast of the island, where the landscape is comprised of cliffs that continue underwater, while the lower coastal ones are at the western and eastern parts, where beaches are formed. A key feature of the area is the horn-like western tip of the island continuation for up to 2 km off the coast down to 80 m water depth. There is also another extension of the island with the form of a small islet at the south-eastern edge of it, with a small extent (50–100 m) of continuity under the sea.

Figure 3 (A) Digital Elevation Model bathymetric model and (B) the slope map of the area.
Seabed morphology and acoustic patterns
The final mosaic of the study area is presented in Figure 4. The areas of the mosaic that are depicted in black and dark brown colours consist of mud sediments, while area of bright brown to white colours are areas where the bedrock is outcropping or a biogenic formation such as P. oceanica meadows or coralligenous reefs are present. The intermediate tones refer to bottom areas that are covered either by coarse sediments like sand or rhodolith
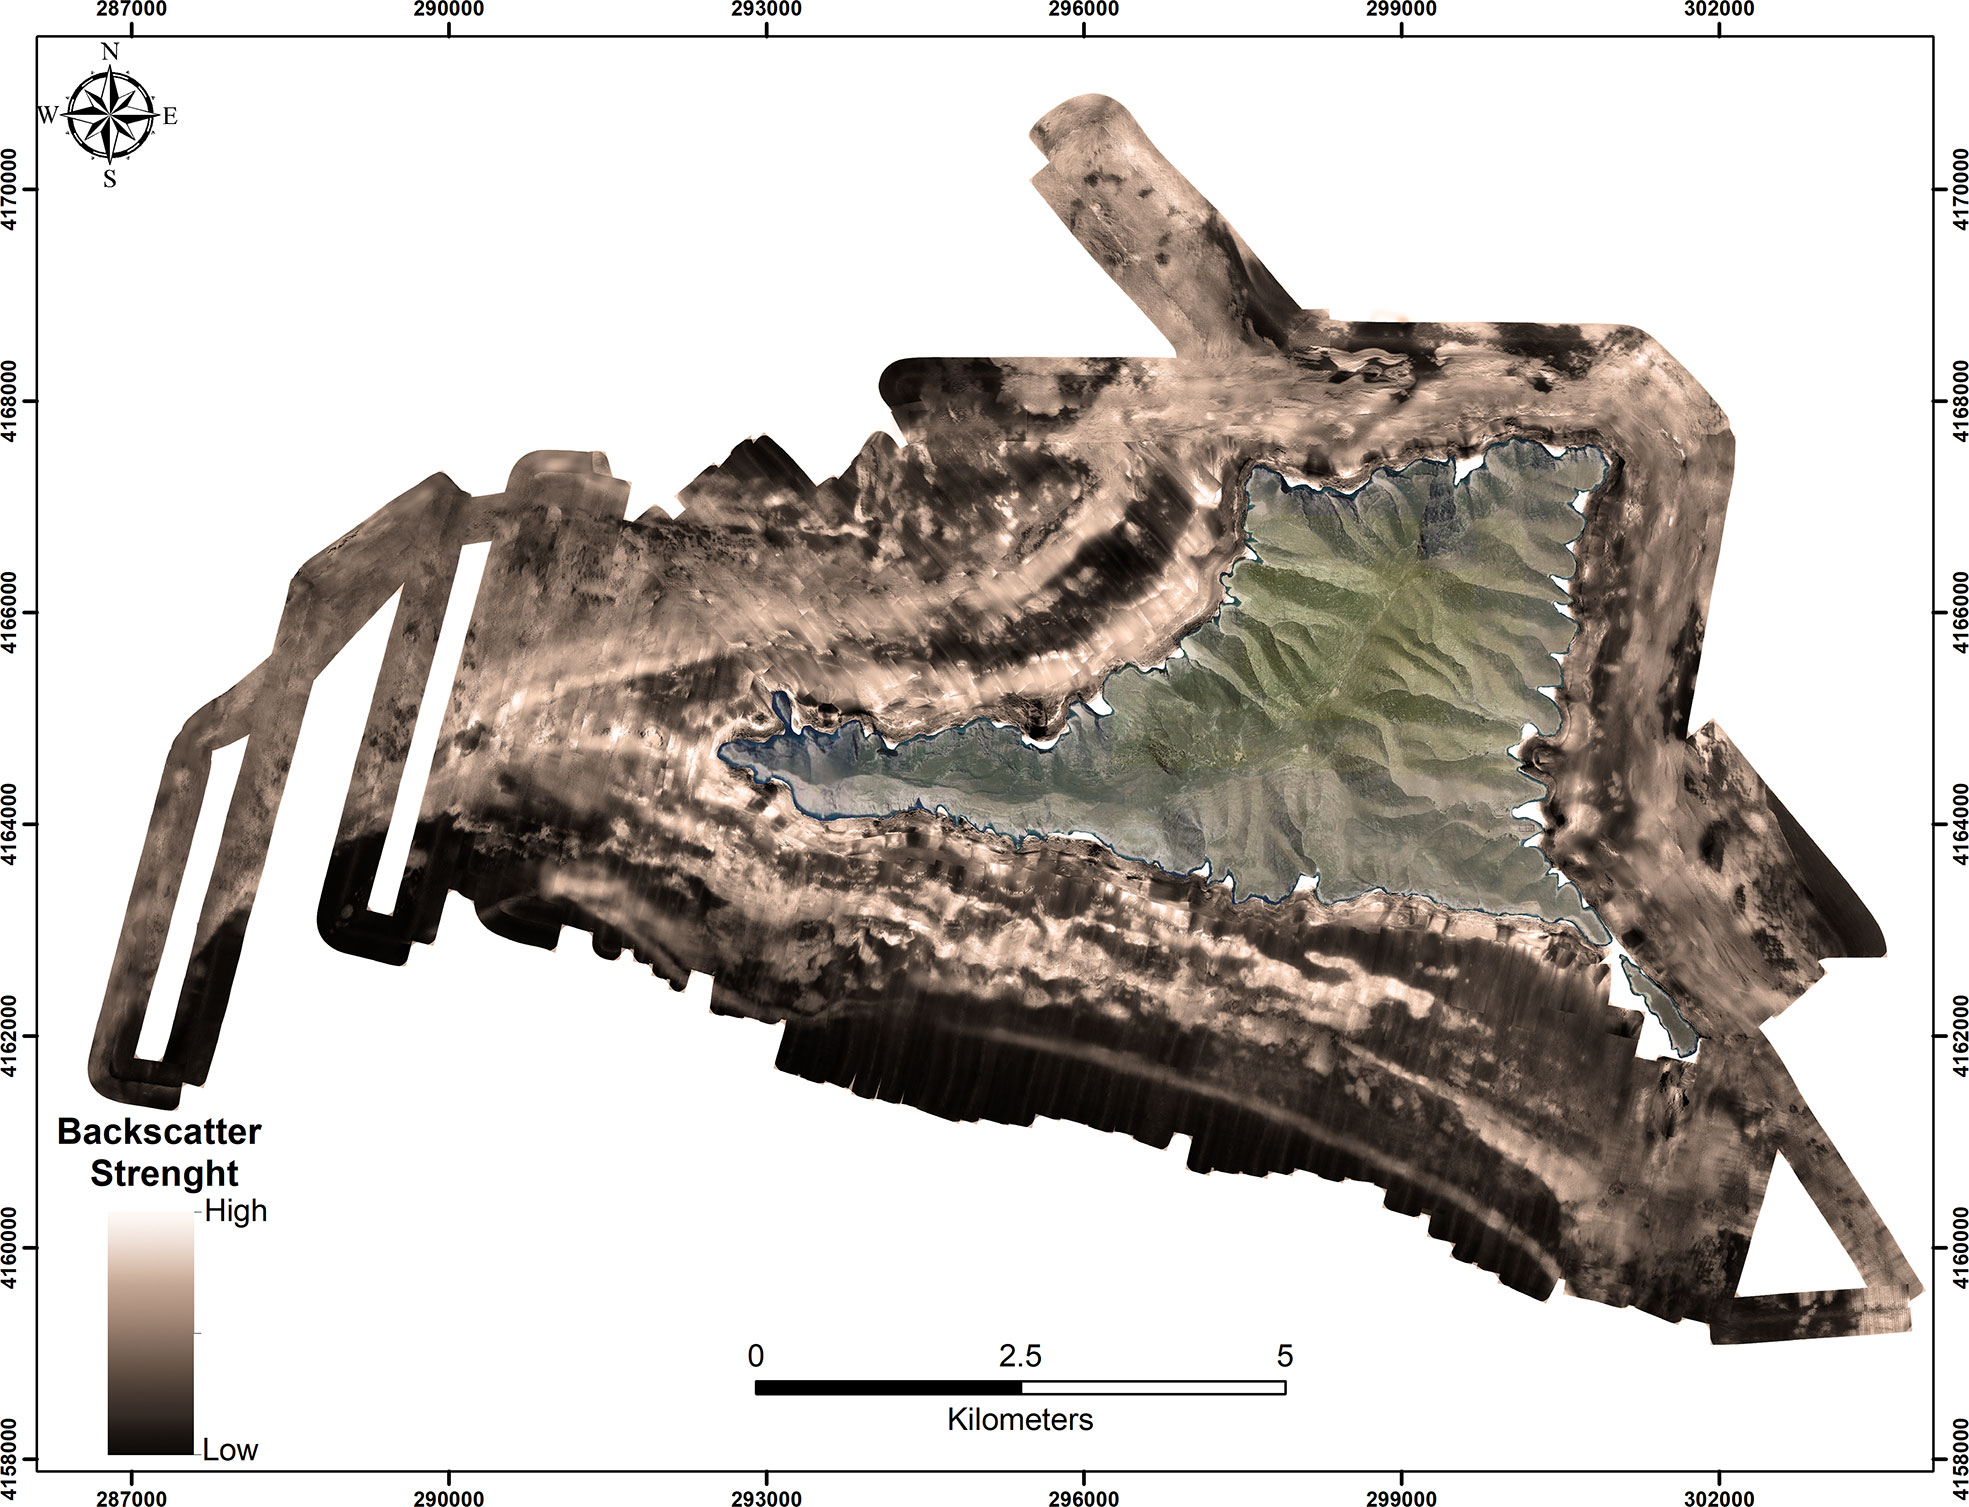
Figure 4 Mosaic map of the area.
Seismic stratigraphy and sediment thickness
As mentioned above in section 2.4.1, SBP provides valuable data for the detection and mapping of the coralligenous reefs. Moreover, SBP data have been used for: i) the better segmentation of the bottom into better-defined seabed types and ii) the identification of the substrate where the coralligenous formations are developed. In the study there were the two main seismic reflectors that were identified and mapped. Those were the bottom reflector and the bedrock reflector. That leads to the assumption that the area’s sediments were deposited through the last 10,000 years of the Holocene. The sedimentation is in close relation to the bathymetric profile of the area. It can also be segmented into three parts. The first part is close to shoreline and up to 40 m of water depth, where the sediment thickness is between a few centimetres where the bedrock is subcropping close to the bottom and a few metres (max 7 m), in places where small sediment basins are created through the erosion of the bedrock. The median thickness in this area is 4 m. The second part is between 40 and 110 m water depth, where the sediment thickness is between 0.5 and 2.5 m with a mean thickness of 1.5 m. The third part is in places where the water depth is greater than 110 m and is characterised by sediment thickness greater than 9.5 m (Figure 5).
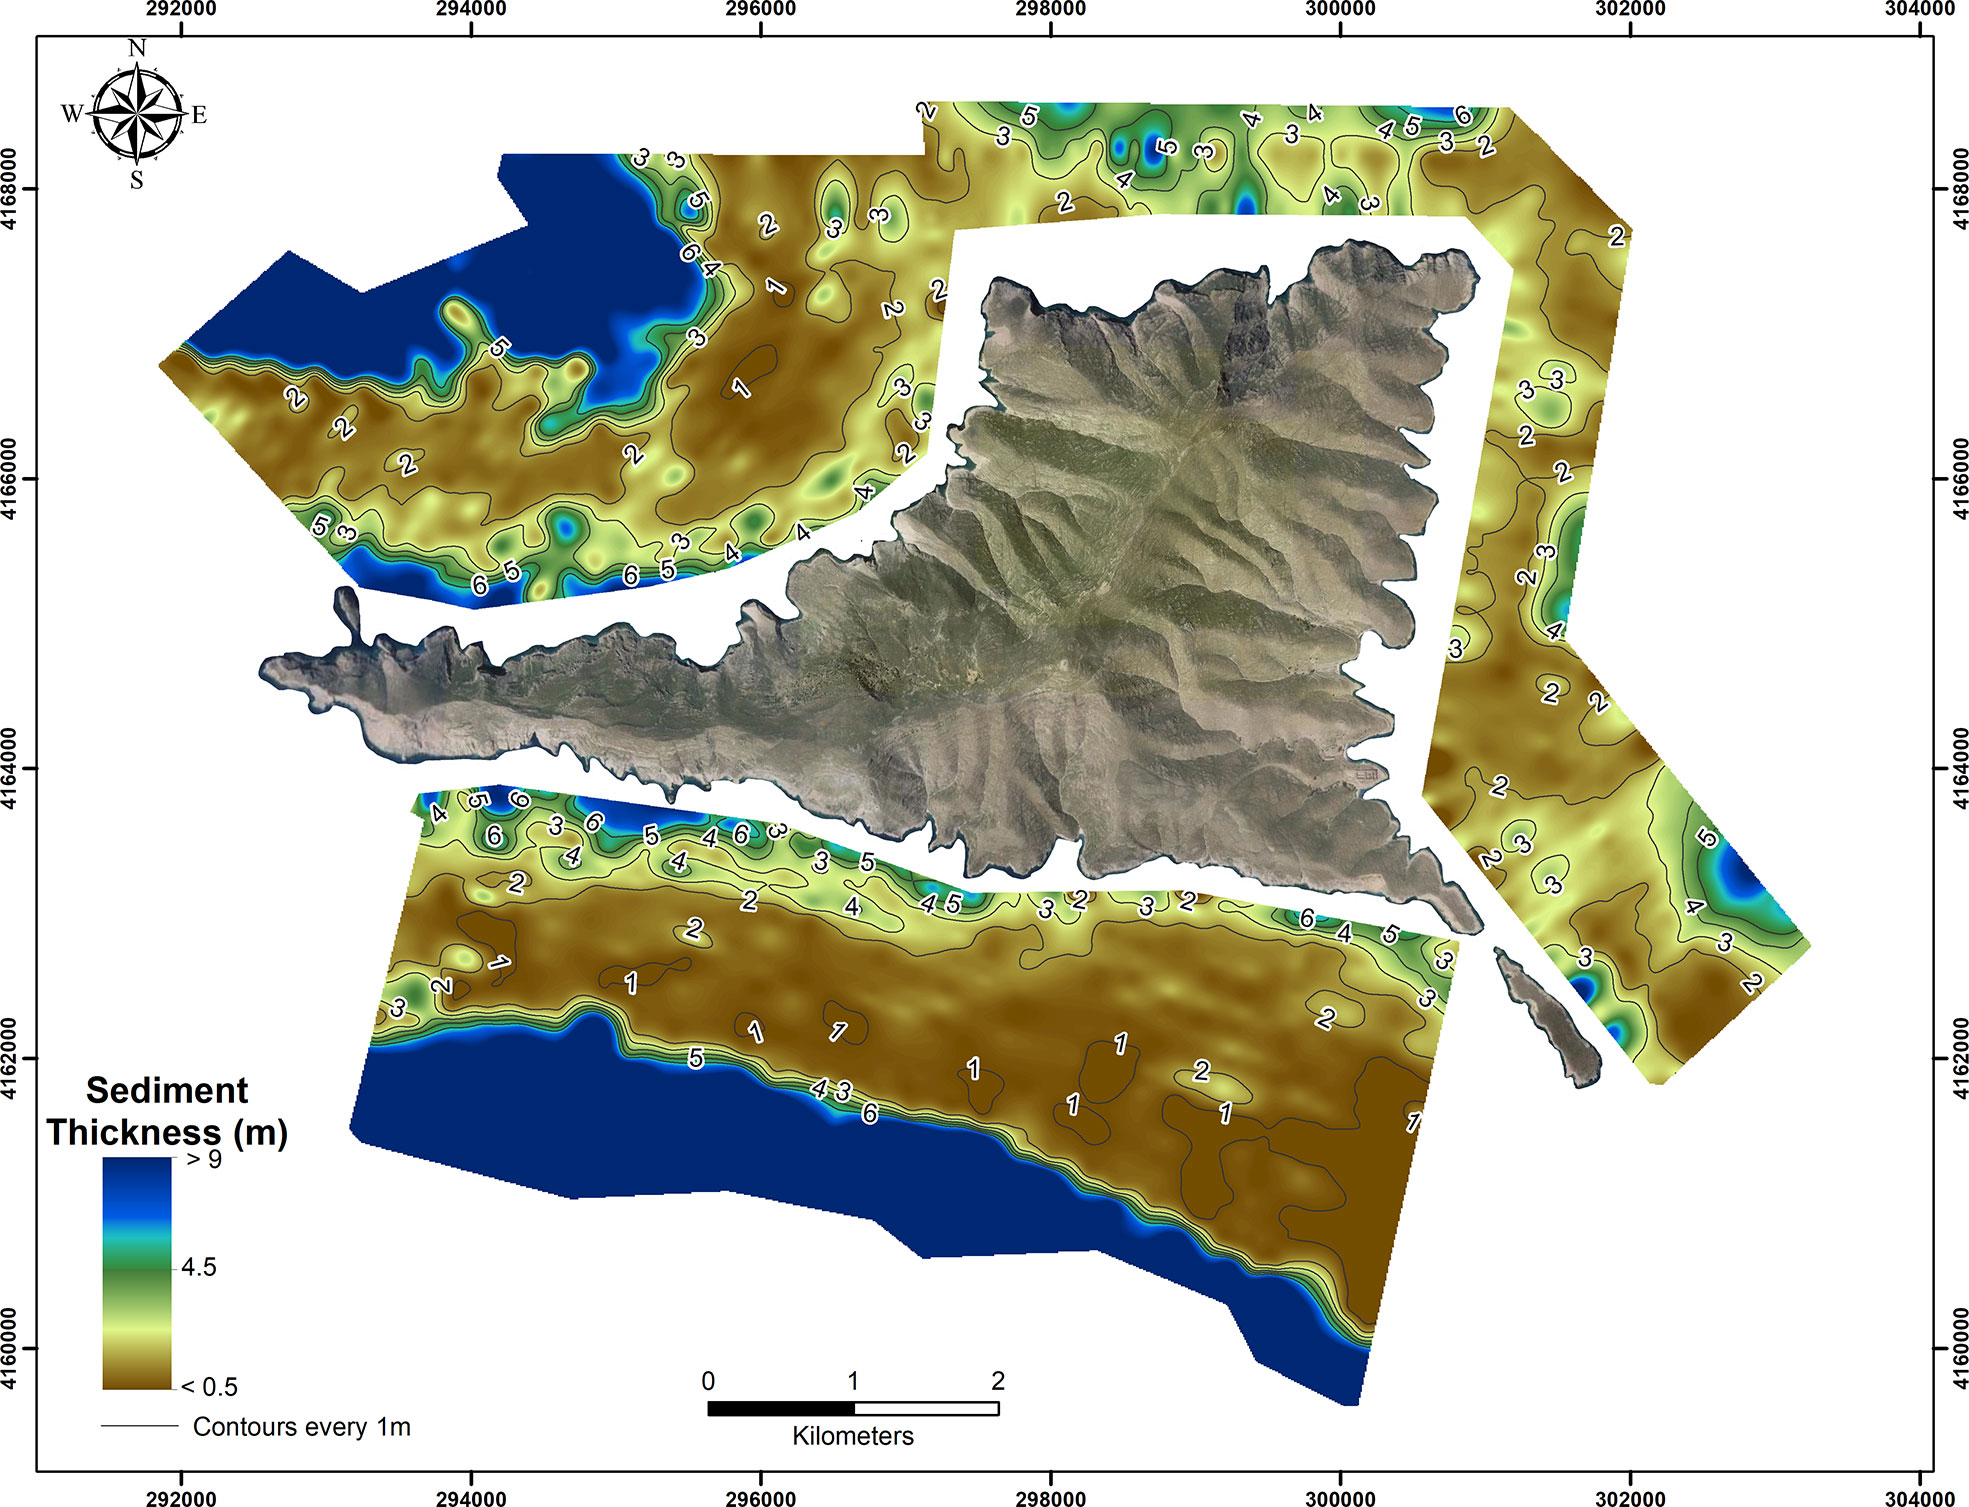
Figure 5 Map of the sediment thickness in the area.
Posidonia canopy height and distribution
The canopy height data are locally averaged using a grid of hexagonal geometrical elements with a side dimension of 75 m (Figure 6) The mean canopy height of P. oceanica in the whole area is 0.6 m, while the maximum height was over 1.2 m. Areas where the presence of P. oceanica through the geophysical and ground-truthing survey was verified, but its height was not measured, appear as No Data. The whole north-western coast of the island is the area where the most extended meadows are present. This is because the bathymetry of the area is smooth, creating a bathymetrical plateau between 10 and 40 m depth, thus leaving enough space for the meadows to grow. Second to this area, in regard of the meadows extended, are the west and east parts of the south coast. The patches of P. oceanica are found along the whole coast of the island with the only areas lacking any kind of growth being those of steep slopes and rocky substrates.
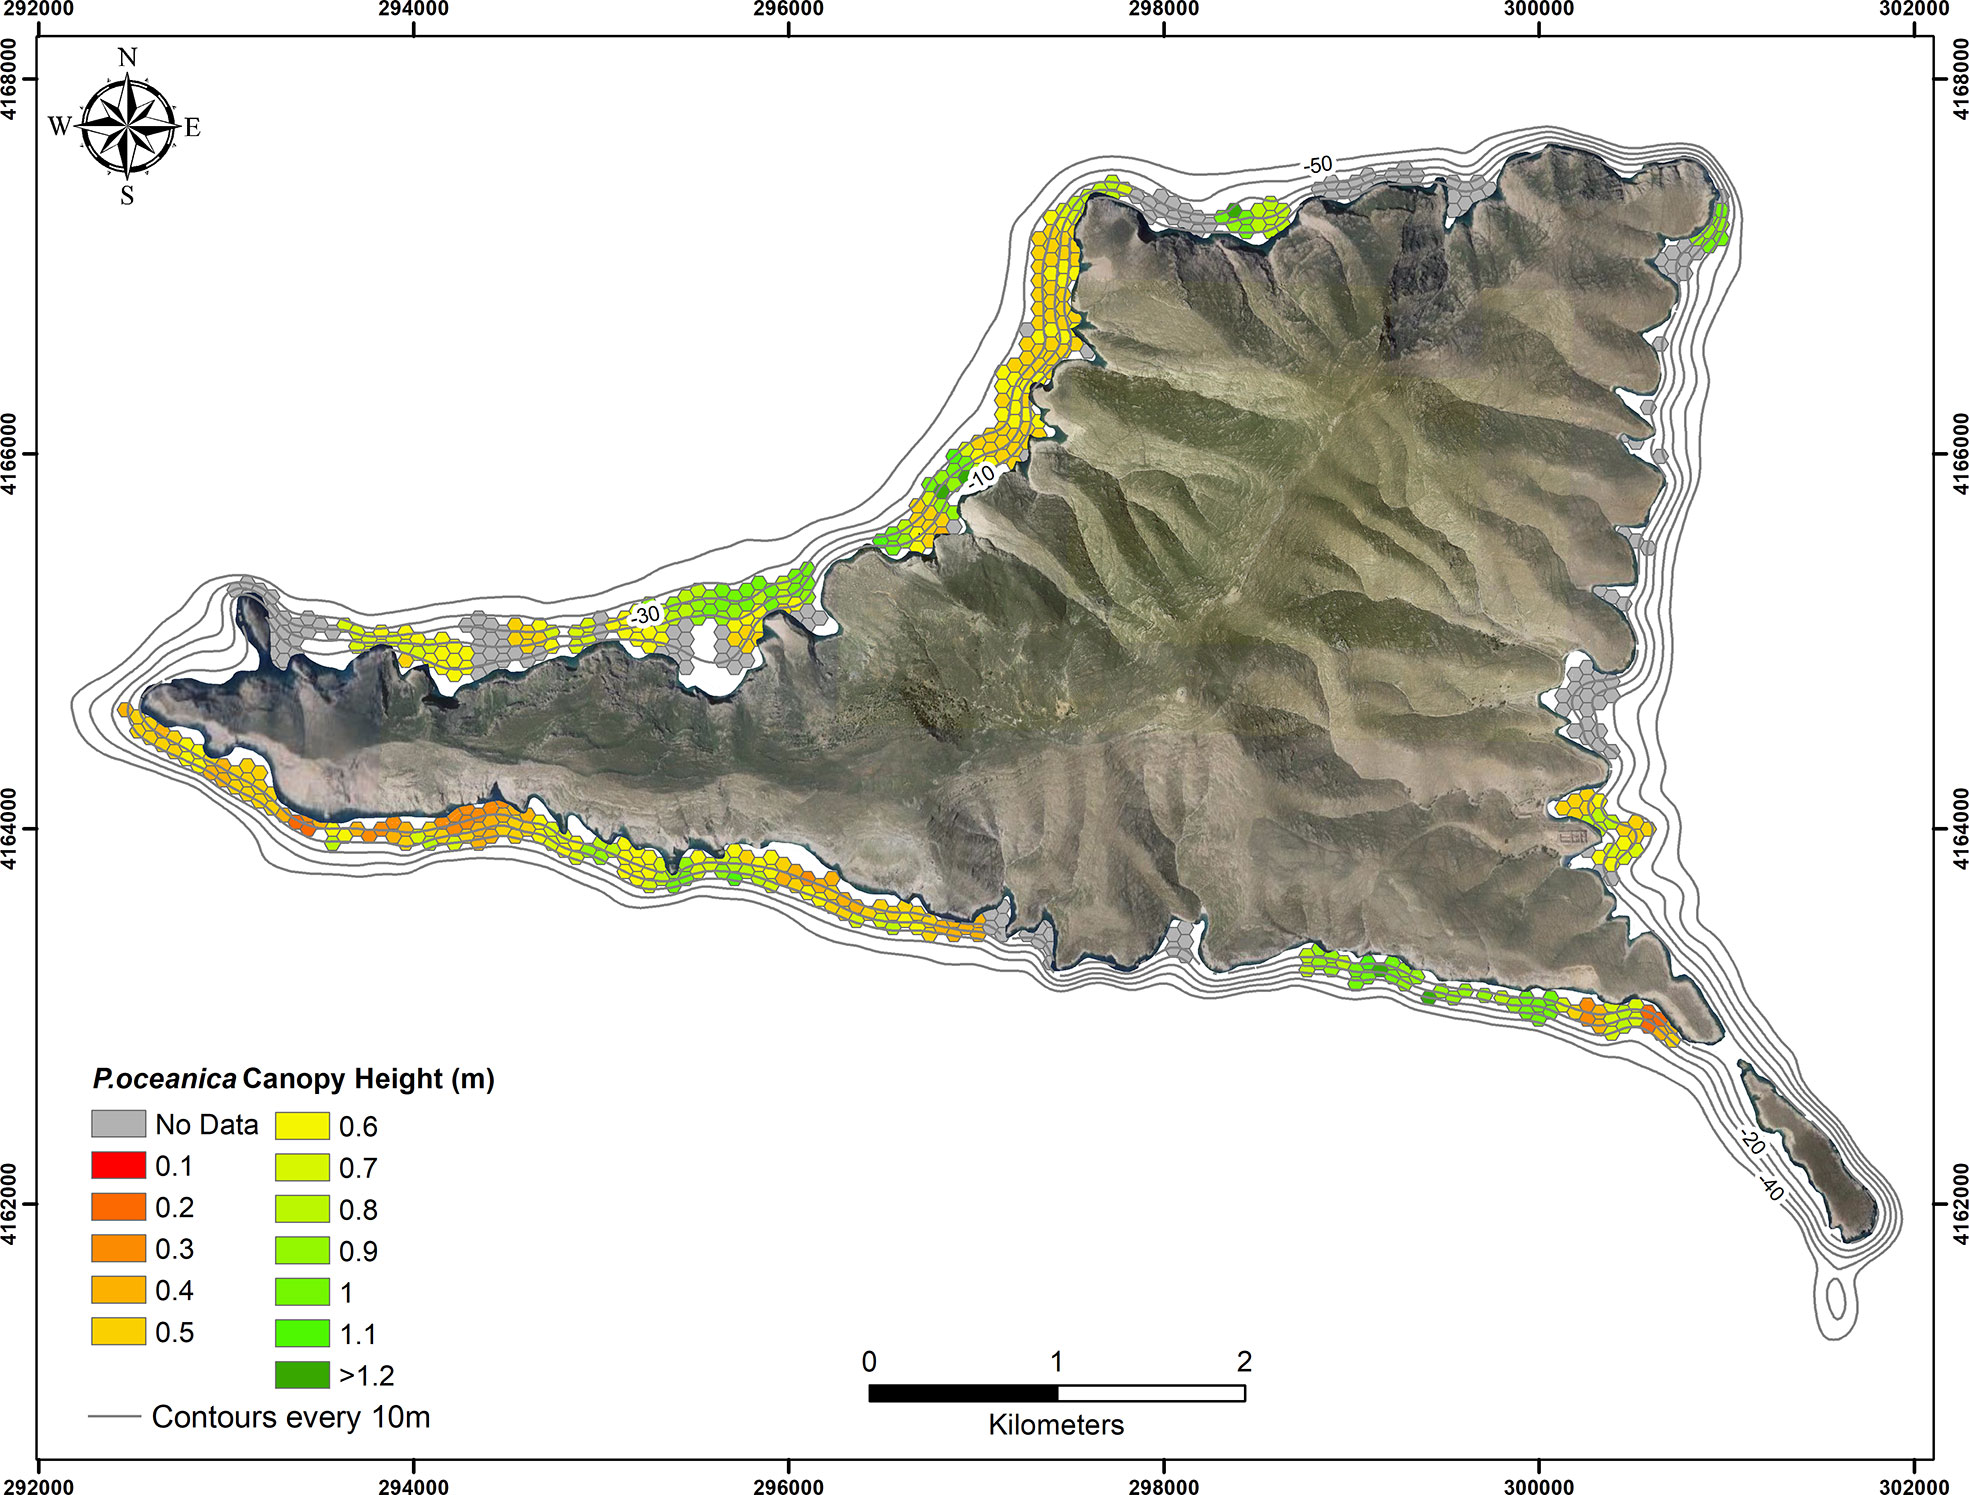
Figure 6 Map of P. oceanica canopy height and distribution.
Seafloor classification
By interpreting all the available data, the segmentation of the study area seafloor into distinct classes was possible. Through Expert classification, seven distinct BTs were identified. With the information gathered within this study, we matched the Expert classification scheme to seven level four EUNIS categories. Additionally, the same was done based on the NATURA HD classification scheme resulting in segmentation of the seafloor into four distinct HTs (Figure 7).
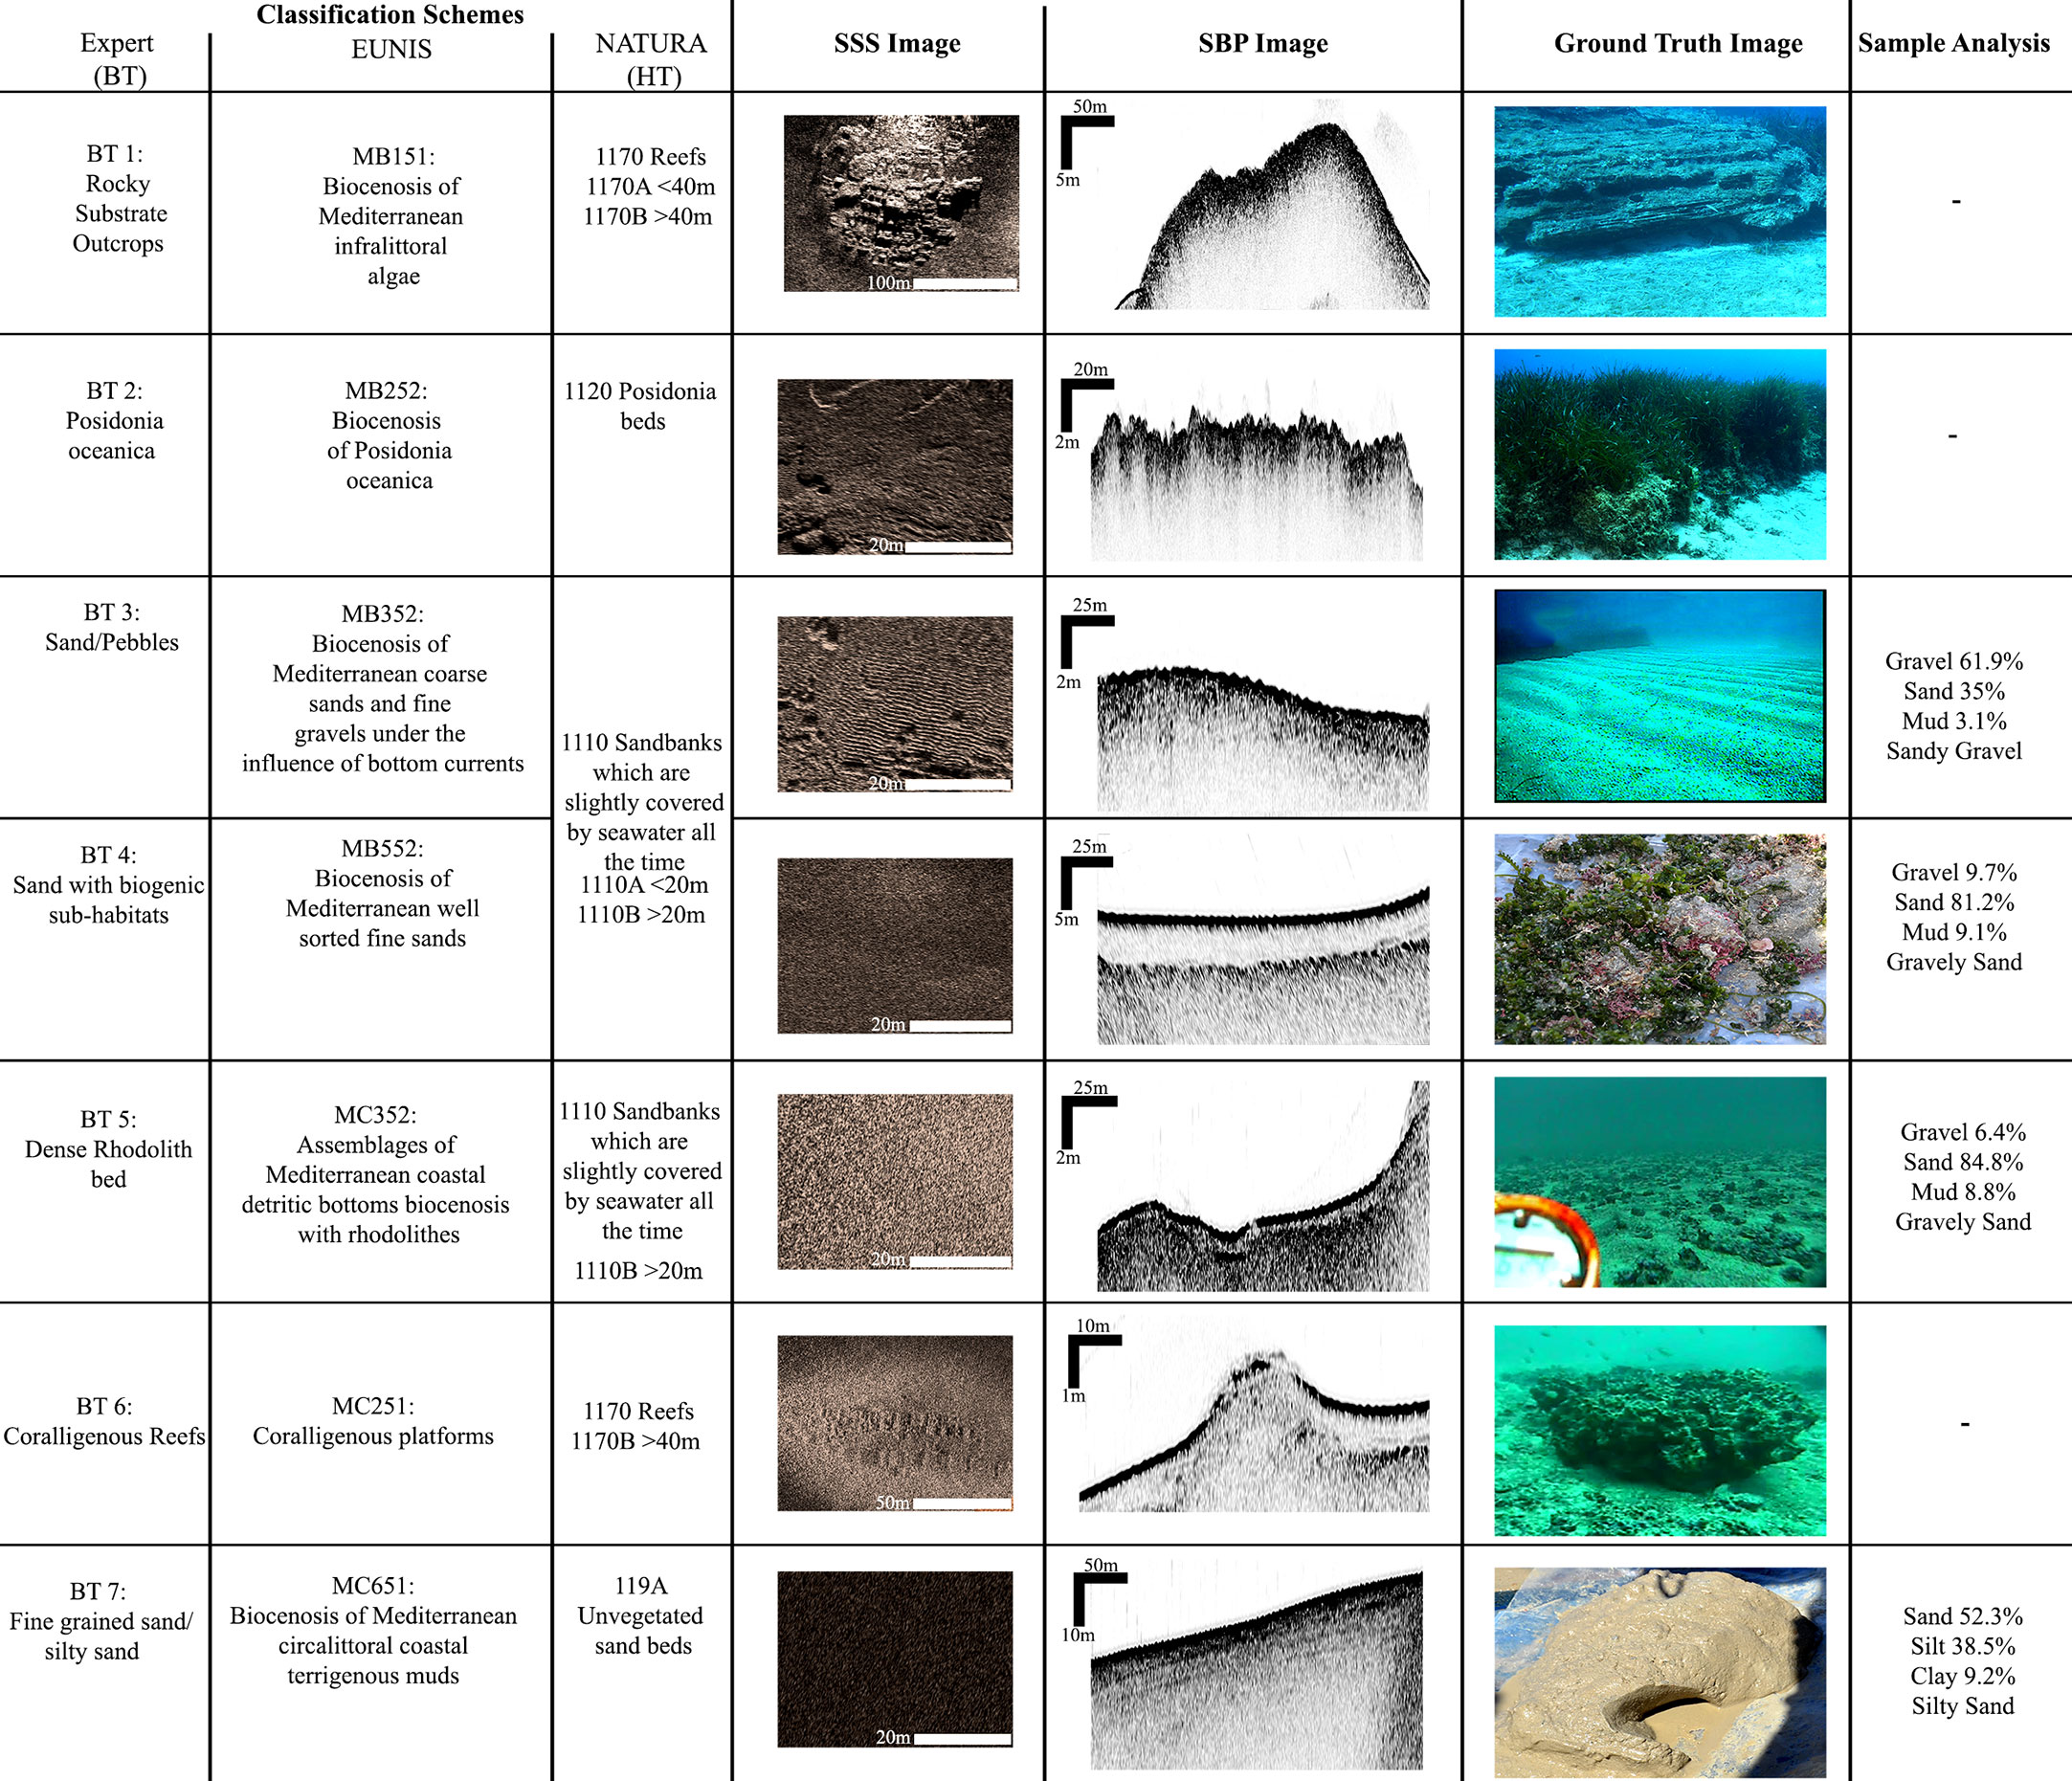
Figure 7 The three schemes (Expert, EUNIS and Habitat Type) used to create the classification map based on their characteristics as derived through the side scan sonar, sub-bottom profiler and GT data.
Applying the procedure for the creation of the classification map based on the three classifications schemes stated before, the final combined map was created (Figure 8). In general, the classes are allocated as buffer zones around the coastline in regard to the general bathymetry of the area (Figures 8B–D).
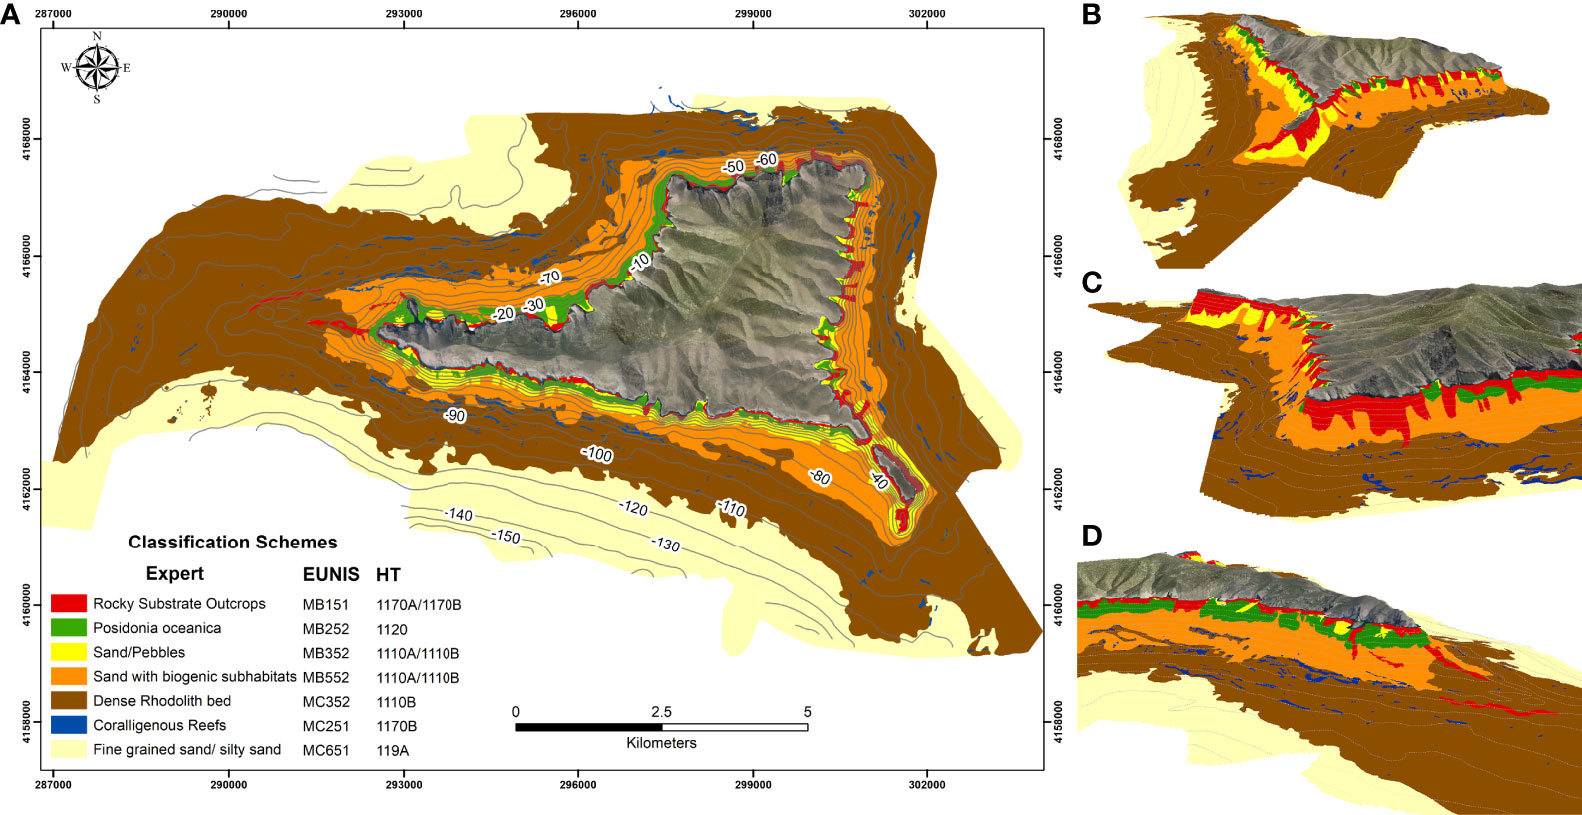
Figure 8 The classification map (A) of Gyaros seafloor and three-dimensional images (B–D) depicting the zonal distribution of the classes based on depth.
● BT 1 rocky substrate outcrops/EUNIS MB151: Biocenosis of Mediterranean infralittoral algae/NATURA 1170 reefs
This BT refers to the geological bedrock, consisting of the metamorphic rocks of the area propagating into the sea or outcropping the bottom surface (Figures 7, 8). Because of its high backscatter signal and the characteristic enhanced reflector on SSS and SBP profiles, respectively, the identification of this BT was straightforward. This BT corresponds to 2.2% of the total surveyed bottom area (2.32 km2). It is found on the depth ranging between 0 and 80 m and with the slope reaching up to 15°. The ground-truthing survey shows that this BT lacks any biogenic and morphological features.
Category MB151 focuses on the biocenosis of algae, grown on the infralittoral rock. Even though our methodology could not allow us to describe these communities in detail since no biological samples were collected, this class is broad enough to engulf all algae communities. As such, the BT1 of the Expert classification scheme can be described by MB151.
NATURA 1170 Reefs BT corresponds to any kind of hard bottom present in the area regardless of its origin. A further division of this HT was proposed based on depth, with rocky formations found at 0–40 m depth consisting of 1170A and those under 40 m 1170B. Category BT1 is divided based on depth, with 51% characterised as 1170A and 49% as 1170B.
● BT 2 P. oceanica/EUNIS MB252: Biocenosis of P. oceanica/NATURA 1120 Posidonia beds
This BT refers to the Posidonia meadows of the area (Figures 7, 8 and S5). This is the only BT that has the same spatial extent and characteristics in all three classification schemes. It refers to the appearance of P. oceanica as the predominant feature of the shallow parts of the area (>40 m), either as meadows or patches, taking root mostly on the sandy and gravelly substrate. The areas where P. oceanica is flourishing have a distinct acoustic signature and cover 1.99 km2, which corresponds to 2.21% of the total studied area, but it covers 33.11% of the area between 0 and 45 m water depth, which is the depth range of P. oceanica.
● BT 3 sand/pebbles/EUNIS MB352: Biocenosis of Mediterranean coarse sands and fine gravels under the influence of bottom currents/NATURA 1110: Sandbanks that are slightly covered by seawater all the time
This BT is allocated in areas of the seabed that are covered by homogenous coarse-grained sand and pebbles while lacking any other biogenic and morphologic feature (Figure 7, 8). It covers an area equal to 2.91% of the total bottom area (2.5 km2) and is allocated all around the survey area in depth ranging between 0 and 80 m (mean 35 m). Seafloor areas being covered by dead P. oceanica leaves were located in the south/southeast part of the island. This is a seasonal feature of the bottom as the leaves originate from the deciduous nature of P. oceanica; thus, they are only in place during the months that it occurs and being deposited in low-energy environments after the action of the local water circulation.
Class MB352 refers to the type of the sediment and the habitats formed on coarse sand and fine gravels, as are clearly mapped under BT3.
HT 1110 holds the misleading title of “Sandbanks which are slightly covered by seawater all the time”, which aims to describe the typical sandy environments of the Northern Sea. In order to better describe the Mediterranean benthic habitats, two sub-categories have been proposed. 1110A represents the shallow bottoms (<20 m) with distinctive sandbanks that can either be bare or covered with seagrass meadows Cymodocea nodosa (Ucria) Asch, 1870 and Halophila stipulacea (Forsskål) Ascherson, 1867. This HT is described by the category BT3 of the Expert classification, only for the part with depth smaller than 20 m. This means that BT3 needs to be divided into two categories, with those shallower than 20 m characterised as 1110A. Communities at depths under 20 m fall under the category 1110B, where sand can also be bare or covered with rhodolith beds (consisting of small or larger formations that do not form firm reefs) or other biological components.
● BT 4 Sand with biogenic sub-habitats/EUNIS MB552: Biocenosis of Mediterranean well- sorted fine sands/NATURA 1110: Sandbanks that are slightly covered by seawater all the time
This BT covers 12.3% of the bottom (10.59 km2), while the depth ranges between 13 and 95 m (mean 47 m). This BT is characterised by a thin sediment deposition of sand between 0- and 4 m thickness with a mean of 2.2 m. In the whole area of this specific BT, many different habitats can be found co-existing with each other. The evaluation of the density and state of each habitat was done by thoroughly analysing the UTC video footage along the Ground Truth transects. Red and green algae and Caulerpa racemosa (Forsskål) J.Agardh, 1873 sprouts are locally found throughout the study area, in addition to small rhodoliths of diverse sizes that are also found scattered around (Figures 7, 8 and SF4). Dense C. racemosa fields were found at the south-eastern area of the bottom. This BT can be characterised as the transitional zone between the shallow water (0–40 m) BT to deeper zones (>60 m) where coralligenous reefs and extensive rhodolith beds are found.
The biocenosis of well-sorted fine sands can be matched to BT4. The typology refers to finer sediments that can accommodate many biogenic HTs, such as seagrass or algae communities like C. racemosa. Within our data set, the category is marginally different from MB352 (BT3), mainly due to grain size differences and the presence of C. racemosa forests.
This BT’s characteristics match the type 1110 of the HT scheme and has the same attributes as described for BT3.
● BT 5 dense rhodolith bed/EUNIS MC352: Assemblages of Mediterranean coastal detritic bottoms biocenosis with rhodolithes/NATURA 1110: Sandbanks that are slightly covered by seawater all the time
This is the dominant BT of the area, covering 50.08% of the total bottom area (43.01 km2). This BT refers to the areas of the bottom that are covered by big-sized rhodoliths of high density (Georgiadis et al., 2009) (Figure 7, 8 and S3). This BT is the predominant BT in depths between 70 and 115 m, while in the eastern parts of the survey area, it was found in depths between 40 and 138 m. The median sediment thickness of this BT is 1.8 m with a very small thickness range between 1.3 and 2.7 m; a characteristic similar to the one described by Georgiadis et al. (2009) about the appearance of coralligenous reefs in areas where the thickness of the sediments is thin and overlaying the hard bedrock. The sediment’s grain size is characterised as fine sand/silt. The dense fields of rhodoliths were identified through UTC footage and in situ collected samples. BT MC352 is directly matched to BT5, which describes the extensive rhodolith beds found around the island.
The HT class allocated for this BT is 1110B. The deeper part of BT3, as well as most of BT4 and all of BT5, comprise this group in Gyaros Island, making it the highest in the cover category.
● BT 6 coralligenous reefs/EUNIS MC251: Coralligenous platforms/NATURA 1170 reefs
This BT refers to the well-formed coralligenous reefs found in the area (Figures 7, 8 and S2). Their presence is between 55 and 118 m water depth (mean 88 m). These reefs take up to 1.23 km2 of the bottom, which is 1.44% of the total area, but they add up to 4.91% of the bottom between 70 and 90 m water depth. The thickness of the sediments where the reefs are developed is between a few centimetres and 4.2 m, with the average being 2.5 m. The reefs are developed in a zonal distribution all around the island. The most well-developed reefs are formed between 70 and 90 m depth and was also found that their major length axis follows the morphology of the coastline. While coralligenous reefs appear throughout the survey area, in the north-western and southern parts of it, their spatial density is higher and in of bigger size. This implies that the environmental conditions in these areas are more suitable for the growth of the coralligenous reefs. The coralligenous reefs in category BT6 correspond to MC251 of EUNIS, which describes the coralligenous platforms that do not grow on hard substrata but instead create biogenic hard formations.
The deep and distinctive coralligenous reefs of BT6 of the Expert classification scheme fall entirely under the HT 1170B with their characteristics explained above.
● BT 7 fine-grained sand/silty sand/EUNIS MC651: Biocenosis of Mediterranean circalittoral coastal terrigenous muds/NATURA 119A unvegetated sand beds
This BT is found in depths greater than 100 m and is the deepest of the BTs. It defines the deep areas of the bottoms that are comprised of fine-grained sand and silty sand with the appearance of both terrigenous and biogenic fragments (Figures 7, 8). The thickness of those sediments was of great magnitude (>5 m), as depicted through the SBP. It can be determined as a continuation of BT5 and the physical boundary between shallow and deeper water environments. This BT comprises 28.6% of the total surveyed bottom area (24.64 km2). Category BT7 matches the description of MC651, which covers the muddy terrigenous sediments that cover the seafloor. This BT is not included in the HD Annex I and, despite having been used in earlier stages of the directive’s implementation, it is not in use anymore. However, BT7 cannot be matched to any of the other HTs, mainly due to the increased depth (>100 m) since the NATURA HD focuses on coastal habitats with open-sea ones being less described.
Bathymetric and sediment thickness distribution of the bottom types
Bathymetry and sediment thickness are two of the main variables that control the spatial extent of the BTs recognised (Figures 8, 9). The geological setting and the sedimentation processes of the Cyclades Plateau are the mechanisms that control the bathymetrical distribution of the rock outcrops and sub-crops in this part of the Aegean archipelago. Rock outcrops are found in the area at the shallow part around the circumference of the island between 0 and 20 m of water depth. An exception to this is an area at the western tip of the island at 40 to 80 m water depth. The P. oceanica meadows of the area flourish between 0 and 40 m water depth. The sediment thickness below P. oceanica meadows is between 3.5 and 9 m with an average of 5 m. Sand/pebble BT sediment thickness ranges between a few centimetres and 10 m. High accumulation of sediments in the nearshore area can be explained by the appearance of small depositional basins formed by the erosion of the geological bedrock. Rhodolith and living calcareous algae (referring to BT 5 and BT 6 of the Expert classification scheme) were mapped between the depths of 15 and 120 m, which are also found to be at their favourable bathymetrical range of growth and expansion (Basso, 1998; Basso et al., 2015). As for the coralligenous reefs; those were also found in a typical bathymetrical range (40 125 m depth) as has already been stated by previous research (Georgiadis et al., 2009) on the Cyclades Plateau. The area where the reefs are apparent can be characterised sub-cropping as the geological bedrock is covered by a very thin layer of sediments with a mean thickness of 1.8 m.
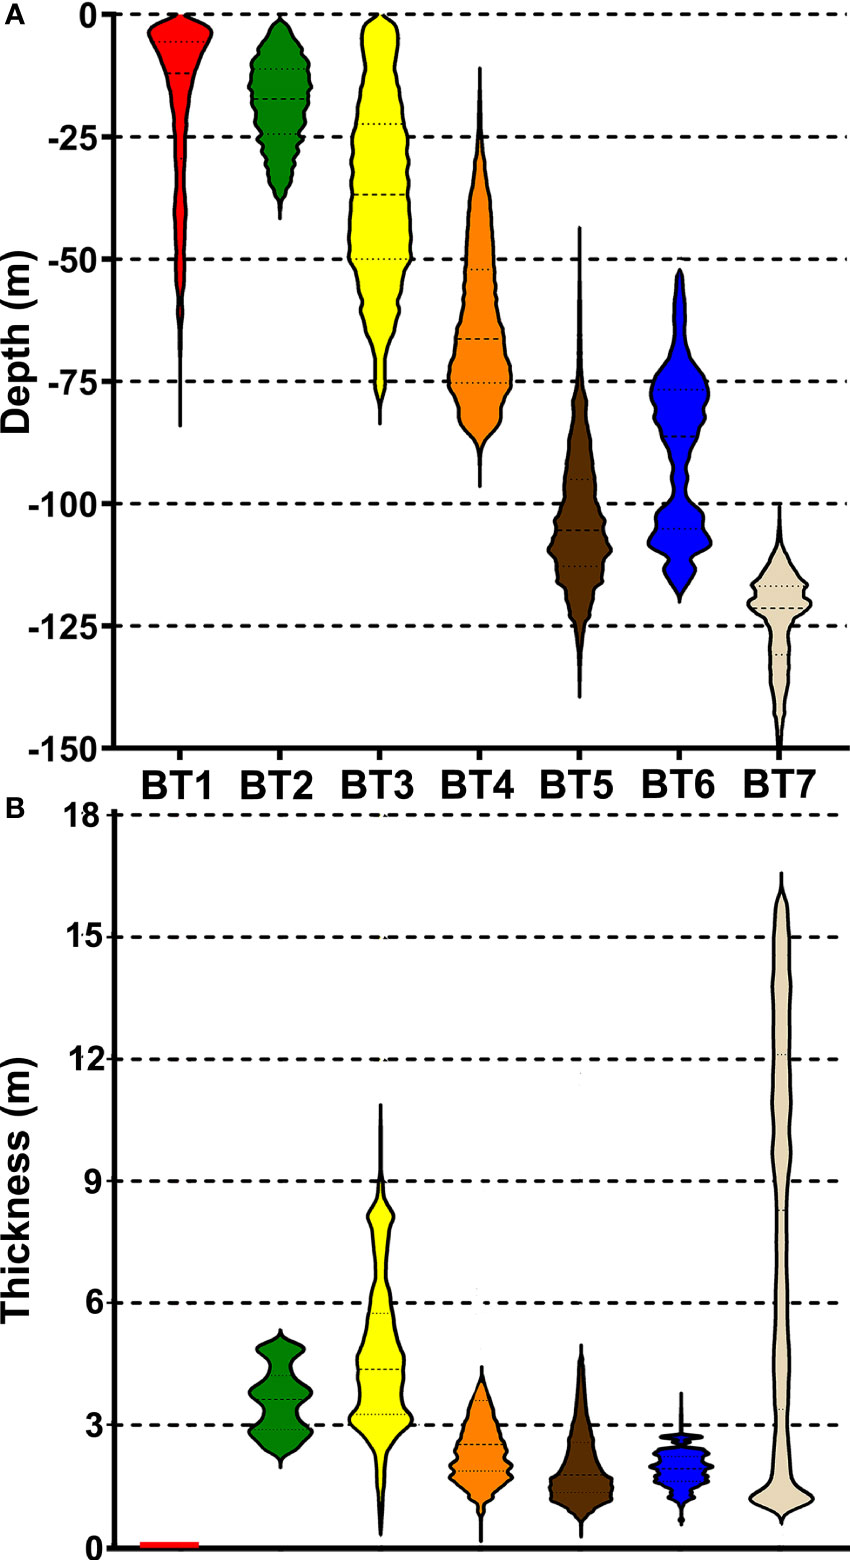
Figure 9 (A) Depth and (B) sediment thickness violin plots of the bottom types mapped at Gyaros seafloor.
Discussion
Gyaros Mediterranean conservation area and marine-protected area. Potential habitats spatial extents, importance, and state of preservation
In this study, the seafloor of Gyaros Island, an area of high ecological importance, was mapped through a multi-disciplinary use of well-known marine remote sensing techniques for inspecting the morphology of the seafloor (SSS, SBES, and MBES) and ground truthing (underwater video and sampling) techniques, used for habitat mapping (Huvenne et al., 2007; Le Bas and Huvenne, 2009; Fakiris et al., 2019). In addition, other rather uncommon marine remote sensing techniques (SBP) of habitat mapping and a method of P. oceanica canopy height detection through the use of a single-beam habitat echosounder utilising a new system were implemented and their effectiveness was tested and evaluated.
Gyaros Island is of high ecological importance due to the location of the island itself and the extensive, deep P. oceanica and coralligenous formations that are thriving on its seafloor. Additionally, while studies about the ecological status of the seafloor through experimental fishing surveys have been published (Damalas et al., 2022), this is the first study dedicated to mapping the seafloor of Gyaros. While the Aegean Sea is considered to have the highest accumulation and growth of coralligenous formations (reefs and rhodolith bed) of the Mediterranean Sea (Sini et al., 2017), an extensive study about the geographical extension and the importance of these formations has not been published yet, making it difficult, if not impossible, to create sufficient management plans for these quite often threaten ecosystems. The only exemption on this is Georgiadis et al., 2009 study, through a wide dataset of the marine geophysical data of the area of the Cyclades archipelago, which is the first study dedicated to the understanding and classification of these formations based on their acoustic signature interpretation and their location. Based on the survey findings, an area of 41.2 km2, which adds up to more than 50% of the seafloor mapped, is covered by P. oceanica meadows and coralligenous formations (reefs and the rhodolith bed) (Figure 8).
It is important to note that the results of this work and the detailed mapping produced were actively disseminated to all relevant bodies and stakeholders in the management of the area and were directly utilised in the process of the design of the MPA’s zoning system (Figure 8, Supplementary Material Figure 1) and of the relevant conservation and regulatory measures within the zones of the MPA. In fact, the resulted delineation of the marine zones designated within the MPA followed the specific distribution of P. oceanica meadows and coralligenous formation (reefs and rhodolith bed) as described in Greek Government Gazette No. 389/D/4.7.2019 (Supplementary Material Figure 1), while the specific fisheries restrictions and anchoring regulations adopted directly target the threats to these habitats. The marine area around Gyaros was segmented into three zones of increased protection measures based on the results of this survey. The first zone is the area from the shoreline and up to 450 m distance from it, and it encloses all the areas where P. oceanica meadows were mapped (Figure 8). At this zone, commercial fishing is still allowed but with high limitation regarding the nets and longlines used by the fishermen in addition to the special permit that must be issued by the local authorities. Boat cruising and anchoring are only allowed to specific locations. The second zone extends to 2.8 km from the shoreline and encloses almost the total area where the coralligenous and other calcareous bio-concretions formations were mapped. Commercial fishing is limited to only using longlines and again under a special permit. Vessels can travel through this area with limited speed (10 knots) while they are free of hazardous loads. The last zone extends to 5.5 km from the shoreline and corresponds mostly to areas where the depth is greater than 120 m. Commercial fishing is still under restriction regarding the size of nets and lines used, while vessel movement restriction remains almost the same as the intermediate zone. Additionally, in the decree, there is a special note that states that any alteration, damage, or destruction to the seafloor and habitats on it is not allowed and every such action is considered illegal (S1).
Lastly, the survey at Gyaros Island revealed interesting features about the area that may have direct relevance to the MPA’s management. The island is in a state of protection because of its high biological and historical importance. Still, through the TUC ground truth survey, the fields of the invasive species C. racemosa were found in the area (see BT five of the expert classification scheme). While the fields are present in the whole area the densest are located at the south-eastern part of the area where it is the only place where small boats anchor to visit the historical buildings on the area. It is found between 10 and 60m water depth and is mostly found in areas together with the red and green algae found in the area and the rhodoliths and not intertwined with the dense fields of P. oceanica. The impact of C. racemosa on the endemic habitats, especially on Posidonia, should thus be taken into consideration in the management of the MPA including the regulation of anchoring.
All the techniques and instrumentation used in this study and the detail of the seafloor classification that was the outcome of these can serve as a great example and tool for establishing and managing an MPA in other areas of the Mediterranean Sea. Such places are of great importance, making clear the need for establishing and upgrading the good ecological status. These actions and similarly designed and executed surveys are essential towards the goal of achieving a good ecological status as stated by the Integrated Monitoring and Assessment Programme (IMAP) that aims, among others, to enhance MPA management and support the conservation of biological diversity.
Another feature of the area is the bathymetric corridor linking Gyaros to Syros Island at the depths of 100 m (Figure 1). The depth of this corridor and the fact that at the south-eastern part of the area, the lower limit of the dense rhodolithic field and the coralligenous reefs were not reached suggest that the field could extend to Syros’ north-western end and create a link between these two islands. Thus, the potential spatial extent of the current conservation measures may be considered to ensure the protection of the entire dense rhodolith field and the coralligenous reefs.
Comparing and choosing habitat classification scheme. Pros, cons and management implications
The direct comparison between the classes of the three habitat classification schemes reveals their connections and provides a first assessment and some interesting inferences on how well those schemes can segment the seafloor into distinct and unique classes (Figures 7, 8).
The Expert classification “BT1 Rocky Substrate Outcrops” equivalent for the HT Scheme is the 1170 type that fails to separate the biogenic hard bottom (in this case, the coralligenous reefs) from geological substrate outcropping. The EUNIS scheme is more specific as the equivalent type is the MB151: Biocenosis of Mediterranean infralittoral algae but is still broad as it refers to algae growing on top of the rocky bottom.
The only BT that all three schemes can clearly and properly define is the one referring to the priority habitat found in the area, P. oceanica meadows (BT2 Posidonia oceanica for Expert, 1120 for HT and MB252 for EUNIS). Depth is one of the most important boundaries affecting P. oceanica distribution since it is linked directly to light availability, as seen in Gyaros Island’s case, where bathymetry appears to be the key factor controlling the species distribution towards the lower limit. The maximum depth reported that a meadow could grow in the Hellenic seas is at 40 m and, in very exceptional cases, down to 50 m (Gerakaris et al., 2021).The ability of the three schemes to distinguish P. oceanica from other habitats stems from the fact that it is one of the most protected and well-studied marine habitats; therefore, its clear identification and mapping as a distinct type is necessary in every classification scheme.
The 1110 class of HT refers to Sandbanks slightly covered by seawater all the time is the only type in this scheme that comes close to what is really apparent on the seafloor. To render the class description more precise, a segmentation into two sub-categories 1110A (between 0 and 20 m depth) and 1110B (deeper than 20 m), was introduced. Even with this segmentation, this type of the HT scheme overlaps with three types of the Expert classification (“BT3 Sand/Pebbles”, “BT4 Sand with biogenic sub-habitats” and “BT5 Dense Rhodolith bed”) and their equivalent in EUNIS (MB352, MB552 and MC352) scheme. More specifically, from the coast down to 80m water depth, the areas of the bottom lacking any special biogenic feature were mapped as “BT3 Sand/Pebbles” for Expert classification, considering as a key feature the seafloor’s sediment grain composition. The equivalent of this type for the EUNIS scheme is the MB352, which refers to seabed consisting of coarse sand and fine gravel. These two BTs match well between the two schemes.
The “BT4 Sand with biogenic sub-habitats” type of the Expert scheme corresponds to areas of the bottom where various kinds of biogenic habitats (rhodoliths, C. racemosa fields and red/green algae) co-exist in different relative analogies around the island. The EUNIS scheme counterpart type is the one of the MB552 referring to finer sediments that can accommodate many biogenic HTs, such as seagrass or algae communities like C. racemosa. While this EUNIS category is referred to be extending to 20–25 m depths, it might be proposed to be stretched to deeper limits.
The last bottom type of the Expert and EUNIS scheme that overlaps with the 1110 HT scheme is the “BT5 Dense Rhodolith bed” and MC352, respectively. These bottom types refer to seafloor areas characterised by dense populations of rhodoliths.
Another significant habitat found in the area is the coralligenous reefs, which cover an important area (1.23 km2) of the seafloor (Figure 8). The HT scheme completely fails to discriminate the reefs from the rock outcrops as both are characterised as hard bottom and named after class 1170. For better data visualisation, we deemed necessary to segment this type into two parts: (i) 1170A between 0 and 40 m water depth and (ii) 1170B deeper than 40 m water depth. This segmentation was implemented because of the fact that all of the coralligenous reefs are found deeper than 40 m. The EUNIS scheme classifies the reefs as MC251: Coralligenous platforms and the Expert scheme as “BT6 Coralligenous Reefs”. The main difference is that these formations have a reef-like growth and not a platform one. The EUNIS scheme lists them as corals that do not grow on hard substrata, which is compatible with the findings of our SBP survey and previous research (Georgiadis et al., 2009), but also, in some cases, it is evident that the reefs are attached to the underlying geological sub-crop. In the study area, the reefs were recorded in close proximity to the acoustic bottom, which is characterised by its prolonged reflectors and corresponds to the geological bedrock of the area, ranging between a few centimetres to 2 m sediment thickness with the mean thickness being 1.8 m. This can be explained by the need of the coralligenous reefs to be close to a hard substrate in order to attach to it and then expand. The most well-formed reefs were recorded in areas where the thickness of the sediments was between 1 and 2 m.
The deepest part (>100 m) of the survey area is void of any significant biota, and the seafloor is comprised by fine sediments. Thus, it is classified as “fine-grained sand/silty sand” in the expert scheme. The updated HT scheme does not include the areas of the bottom with such depth, and for this reason, the older type of 119A Unvegetated sand beds was used. The EUNIS scheme characterises this part of the bottom as MC651: Biocenosis of Mediterranean circalittoral coastal terrigenous muds.
Utilising the HT scheme is easy to interpret and create the final classification map. This is because the scheme is over-simplified. That, in many cases, is a drawback because within the same class, different habitats may co-exist, which should be discriminated as they are of significant importance on their own (e.g. Class 1170 where the geological outcrops are listed together with the coralligenous formation as hard seafloor). The EUNIS scheme is characterised by an elevated level of detail as it has five different stages of classification; 1–5 with 1 being the broader scale with low detail and 5 being the most detailed. The shortcoming of this scheme is that a relatively high amount of effort and experience is necessary in order to reach the authorities with a detailed seafloor classification map. It requires a highly detailed marine remote sensing survey and a very dense grid of sampling of biological indices and ground truthing in order to correctly identify the biota. This is not always achievable, especially in remote areas or when the survey area is of significant extent. Most of the level-5 classes also refer to very specific types found around the European coast, and if a new one is found, it must be revised by the scientific community before being implemented in the next revision of the scheme (the case of the BT 4 of the Expert scheme). We consider that the detailed Expert scheme, like the one proposed in this study, although harder to produce, is more suited for the conservation planning of areas of such importance like Gyaros Island. This is because the detail of this kind of habitat mapping is also related to the researcher’s experience. For the creation of the final classification map, the researcher must consider and evaluate all biological (through sampling and ground truthing), geological and oceanographical (through high-detail marine remote sensing survey that utilises all the available techniques such as MBES, SBES, SSS and SBP) data. If properly performed, the researcher can then provide to the authorities with a detailed map. Such detailed maps are crucial for the effective design and delineation of the zones of a MPA, the establishment of targeted conservation measures for the protection of the specific habitats and for the protection of specific habitats and for the overall effective management and the welfare of every MPA or marine(Brown et al., 2012; Coll et al., 2012).
Conclusions
Through this study, the Gyaros Island (Cyclades archipelago, Greece) seafloor area was mapped through a wide range of mariner remote sensing techniques. While all the traditional (SSS, MBES, SBES and GT) techniques had been applied in previous studies, two others (SBP and single-beam habitat echosounder) were also implemented in this work contributing added value on habitat classification. Through these it was discovered that more than 50% of the seafloor of Gyaros down to 150 m water depth is covered by P. oceanica meadows and a coralligenous and other calcareous bio-concretions formations. Both habitats are of immense important for the welfare of the marine ecosystem and thus they are under legal protection by the EU. The results of this work were directly utilised in the design of the MPA established in the area in 2019 and of the relevant conservation measures and protection zones to ensure the protection of these habitats from the main anthropogenic threats (i.e. fisheries and anchoring).
Another objective of this study was to put under direct comparison the two most used classification schemes used in Europe (NATURA HD and EUNIS) with the Expert classification scheme proposed. The results of this comparison are significant and clearly interpreted. EUNIS and NATURA HD schemes are easy to interpret and applicable in all cases but have strict limitations. NATURA HD lacks resolution as it is used for classifying wide areas of the seafloor, and thus it tends to homogenise the seafloor in wide areas merging different aspects of the seafloor into one bottom type. The EUNIS scheme, while able to reach high level of detail, it is either too costly to reach it or only refers to very specific and localised bottom types found. While Expert classification scheme is the hardest to produce, as it is associated with the available data and the scientist’s experience, it is the one better suited to fully describe the unique seafloor characteristics and set distinct boundaries between each bottom type while retaining high level of detail.
All in all, the survey results considering the extend of marine habitats and the presence of the invasive species C. racemosa in the seafloor and their direct relevance and importance in the design of the Gyaros MPA, highlight the need for a large-scale mapping of these habitats with the highest detail possible so as to provide the basis for the establishment of appropriately designed conservation measures to ensure their long-term protection. Additionally, the design and the results of this survey as well as the implementation of these results in the design of Gyaros MPA can serve as a reference for future MPA establishment in Greece and in the Mediterranean Sea in general.
Data availability statement
The raw data supporting the conclusions of this article will be made available by the authors, without undue reservation.
Author contributions
Conceptualisation, XD, EF, and GP; methodology, XD, EF, and VP; software, EF; validation, XD; fieldwork, XD, DC, EF, NG, and GP; data curation, XD; writing—original draft, XD; writing review and editing, DC, EF, NG, MG, GP, SO, VP, and SK; visualisation, XD; supervision, GP. All authors contributed to the article and approved the submitted version.
Funding
This study was conducted as part of the CYCLADES LIFE Nature project (Contract Number LIFE 12 NAT/GR/000688) and was co-financed by the LIFE financial instrument of the European Union, the Prince Albert ιι of Monaco Foundation and the WWF Greece Foundation. XD was financially supported by the Hellenic Foundation for Research and Innovation (HFRI) and the General Secretariat for Research and Technology (GSRT), under the HFRI Ph.D. Fellowship grant (GA. no. 2521).
Acknowledgments
We would like to thank Mr Klotzas Georgios and Mr Printezis Georgios, captains and owners of the vessels Ag. Georgios and Perla that were used for the surveys of 2014 and 2017, respectively. We are also grateful to Dr Zoura Despoina and Mr Georgiadis Michael for their contribution during the 2014 survey. Additionally, we would like to thank the divers Mentogianis Vasileios and Agathos Anastasios for their contribution as divers, underwater photographers and cinematographers during the 2014 survey. We would like to special thank Prof Tzanatos Evangelos for his corrections and for the helpful comments that significantly improved the quality of the manuscript. Lastly, we would like to thank Mr Leonidas Moforis and Ms Valentina Dima for their contribution as proofreaders.
Conflict of interest
The authors declare that the research was conducted in the absence of any commercial or financial relationships that could be construed as a potential conflict of interest.
Publisher’s note
All claims expressed in this article are solely those of the authors and do not necessarily represent those of their affiliated organizations, or those of the publisher, the editors and the reviewers. Any product that may be evaluated in this article, or claim that may be made by its manufacturer, is not guaranteed or endorsed by the publisher.
Supplementary material
The Supplementary Material for this article can be found online at: https://www.frontiersin.org/articles/10.3389/fmars.2022.953462/full#supplementary-material
Supplementary Figure 1 | Map of the established MPA area of Gyaros Island according to the Government Gazzete No. 389/Δ/04.07.2019 (in Greeks).
Supplementary Figure 2 | Underwater footage of a coralligenous reef (BT6 in the Expert Scheme) (A) and samples of it (B, C).
Supplementary Figure 3 | Underwater footage of a rhodolith bed (BT5 in the Expert Scheme) (A) and samples of them (B, C).
Supplementary Figure 4 | Underwater footage of the seafloor characterised as BT4 in the Expert Scheme (A) and samples of it (B, C).
Supplementary Figure 5 | Underwater photo of P. oceanica meadows (BT2 in the Expert Scheme) (A) and footage (B, C).
Supplementary Table 1 | Comparison between the Expert, European Nature Information System, NATURA and Specially Protected Areas Regional Activity Centre Classification schemes classes found in the area of Gyaros.
References
Alexandridis T. K., Lazaridou E., Tsirika A., Zalidis G. C. (2009). Using earth observation to update a natura 2000 habitat map for a wetland in Greece. J. Environ. Manage. 90 (7), 2243–2251. doi: 10.1016/j.jenvman.2007.06.024
Ballesteros E. (2006). Mediterranean Coralligenous assemblages: A synthesis of present knowledge. Oceanography Mar. Biol. 44, 123–195. doi: 10.1201/9781420006391.ch4
Bartlett C. Y., Manua C., Cinner J., Sutton S., Jimmy R., South R., et al. (2009). Comparison of outcomes of permanently closed and periodically harvested coral reef reserves. Conserv. Biol. 23 (6), 1475–1484. doi: 10.1111/j.1523-1739.2009.01293.x
Basso D. (1998). Deep rhodolith distribution in the pontian islands, Italy: A model for the paleoecology of a temperate sea. Palaeogeogr. Palaeoclimatol. Palaeoecol. 137 (1–2), 173–187. doi: 10.1016/S0031-0182(97)00099-0
Basso D., Babbini L., Kaleb S., Bracchi V. A., Falace A. (2015). Monitoring deep Mediterranean rhodolith beds. Aquat. Conserv. Mar. Freshw. Ecosyst. 26 (3), 549–561. doi: 10.1002/aqc.2586
Blondel P., Huvenne V., Huhnerbach V. (2006). Multi-frequency acoustics of deep-water coral habitats and textural characterisation. In, Jesus S. N., Rodriguez O. C. (eds.) Proceedings of the 8th European Conference on Underwater Acoustics, 12-15 Jun 2006. 8th European Conference on Underwater Acoustics Carvoeiro, Portugal, ECUA Secretariat, 379–384.
Bonacorsi M., Pergent-Martini C., Clabaut P., Pergent G. (2012). Coralligenous “atolls”: Discovery of a new morphotype in the Western Mediterranean Sea. C. R. Biol. 335 (10–11), 668–672. doi: 10.1016/j.crvi.2012.10.005
Brown C. J., Sameoto J. A., Smith S. J. (2012). Multiple methods, maps, and management applications: Purpose made seafloor maps in support of ocean management. J. Sea Res. 72, 1–13. doi: 10.1016/j.seares.2012.04.009
Brown C. J., Smith S. J., Lawton P., Anderson J. T. (2011). Benthic habitat mapping: A review of progress towards improved understanding of the spatial ecology of the seafloor using acoustic techniques. Estuar. Coast. Shelf Sci. 92 (3), 502–520. doi: 10.1016/j.ecss.2011.02.007
Buia M. C., Zupo V., Mazzella L. (1992). Primary production and growth dynamics in posidonia oceanica. Mar. Ecol. 13 (1), 2–16. doi: 10.1111/j.1439-0485.1992.tb00336.x
Campagne C. S., Salles J.-M., Boissery P., Deter J. (2015). The seagrass posidonia oceanica: Ecosystem services identification and economic evaluation of goods and benefits. Mar. pollut. Bull. 97 (1–2), 391–400. doi: 10.1016/j.marpolbul.2015.05.061
Ceccherelli G., Campo D., Milazzo M. (2007). Short-term response of the slow growing seagrass posidonia oceanica to simulated anchor impact. Mar. Environ. Res. 63 (4), 341–349. doi: 10.1016/j.marenvres.2006.10.004
Cogan C. B., Todd B. J., Lawton P., Noji T. T. (2009). The role of marine habitat mapping in ecosystem-based management. ICES J. Mar. Sci. 66 (9), 2033–2042. doi: 10.1093/icesjms/fsp214
Collier J. S., Brown C. J. (2005). Correlation of sidescan backscatter with grain size distribution of surficial seabed sediments. Mar. Geol. 214 (4), 431–449. doi: 10.1016/j.margeo.2004.11.011
Collier J. S., Humber S. R. (2007). Time-lapse side-scan sonar imaging of bleached coral reefs: A case study from the Seychelles. Remote Sens. Environ. 108 (4), 339–356. doi: 10.1016/j.rse.2006.11.029
Coll M., Piroddi C., Albouy C., Ben Rais Lasram F., Cheung W. W. L., Christensen V., et al. (2012). The Mediterranean Sea under siege: spatial overlap between marine biodiversity, cumulative threats and marine reserves. Glob. Ecol. Biogeogr. 21 (4), 465–480. doi: 10.1111/j.1466-8238.2011.00697.x
Damalas D., Stamouli C., Fotiadis N., Kikeri M., Kousteni V., Mantopoulou-Palouka D. (2022). The gyaros island marine reserve: A biodiversity hotspot in the eastern Mediterranean Sea. PloS One 17, 1–28. doi: 10.1371/journal.pone.0262943
Damuth J. E. (1980). Use of high-frequency (3.5–12 kHz) echograms in the study of near-bottom sedimentation processes in the deep-sea: A review. Mar. Geol. 38 (1–3), 51–75. doi: 10.1016/0025-3227(80)90051-1
De Falco G., Baroli M., Cucco A., Simeone S. (2008). Intrabasinal conditions promoting the development of a biogenic carbonate sedimentary facies associated with the seagrass posidonia oceanica. Cont. Shelf Res. 28 (6), 797–812. doi: 10.1016/j.csr.2007.12.014
De Falco G., Conforti A., Brambilla W., Budillon F., Ceccherelli G., De Luca M., et al. (2022). Coralligenous banks along the western and northern continental shelf of Sardinia island (Mediterranean Sea). J. Maps, 1–10. doi: 10.1080/17445647.2021.2020179
de los Santos C. B., Scott A., Arias-Ortiz A., Jones B., Kennedy H., Mazarrasa I., et al. (2020). “Seagrass ecosystem services: Assessment and scale of benefits,” in Out of the blue: The value of seagrasses to the environment and to people. Eds. Potouroglou M., Grimsditch G., Weatherdon L., Lutz S. (Nairobi, Kenya: UN Environment Programme), 21–35.
Di Maida G., Tomasello A., Luzzu F., Scannavino A., Pirrotta M., Orestano C., et al. (2011). Discriminating between posidonia oceanica meadows and sand substratum using multibeam sonar. ICES J. Mar. Sci. 68 (1), 12–19. doi: 10.1093/icesjms/fsq130
Fakiris E., Blondel P., Papatheodorou G., Christodoulou D., Dimas X., Georgiou N., et al. (2019). Multi-frequency, multi-sonar mapping of shallow habitats–efficacy and management implications in the national marine park of zakynthos, Greece. Remote Sens. 11 (4), 461. doi: 10.3390/rs11040461
Fakiris E., Papatheodorou G., Kordella S., Christodoulou D., Galgani F., Geraga M. (2022). Insights into seafloor litter spatiotemporal dynamics in urbanized shallow Mediterranean bays. an optimized monitoring protocol using towed underwater cameras. J. Environ. Manage 308, 114647. doi: 10.1016/j.jenvman.2022.114647
Fakiris E., Zoura D., Ramfos A., Spinos E., Georgiou N., Ferentinos G., et al. (2018). Object-based classification of sub-bottom profiling data for benthic habitat mapping. comparison with sidescan and RoxAnn in a Greek shallow-water habitat. Estuar. Coast. Shelf Sci. 208, 219–234. doi: 10.1016/j.ecss.2018.04.028
Fonseca M. S., Fisher J. S., Zieman J. C., Thayer G. W. (1982). Influence of the seagrass, zostera marina l., on current flow. Estuar. Coast. Shelf Sci. 15 (4), 351–364. doi: 10.1016/0272-7714(82)90046-4
Foster-Smith B., Connor D., Davies J. (2008). “MESH guide: What is habitat mapping?,” in MESH guide to habitat mapping: a synopsis, vol. p . Eds. Davies J., Young S. (Peterborough: Joint Nature Conservation Committee), 11–24.
Fourqurean J. W., Duarte C. M., Kennedy H., Marbà N., Holmer M., Mateo M. A., et al. (2012). Seagrass ecosystems as a globally significant carbon stock. Nat. Geosci. 5 (7), 505–509. doi: 10.1038/ngeo1477
Gacia E., Duarte C. M. (2001). Sediment retention by a Mediterranean posidonia oceanica meadow: The balance between deposition and resuspension. Estuar. Coast. Shelf Sci. 52 (4), 505–514. doi: 10.1006/ecss.2000.0753
Gacia E., Duarte C. M., Middelburg J. J. (2002). Carbon and nutrient deposition in a Mediterranean seagrass ( posidonia oceanica ) meadow. Limnol. Oceanogr. 47 (1), 23–32. doi: 10.4319/lo.2002.47.1.0023
Georgiadis M., Papatheodorou G., Tzanatos E., Geraga M., Ramfos A., Koutsikopoulos C., et al. (2009). Coralligène formations in the eastern Mediterranean Sea: Morphology, distribution, mapping and relation to fisheries in the southern Aegean Sea (Greece) based on high-resolution acoustics. J. Exp. Mar. Bio Ecol. 368 (1), 44–58. doi: 10.1016/j.jembe.2008.10.001
Gerakaris V., Panayotidis P., Vizzini S., Nicolaidou A., Economou-Amilli A. (2003). Effectiveness of posidonia oceanica biotic indices for assessing the ecological status of coastal waters in the saronikos gulf (Aegean Sea, Eastern Mediterranean). Mediterr. Mar. Sci. 4, 57–66. doi: 10.12681/mms.1893
Gerakaris V., Papathanasiou V., Salomidi M., Issaris Y., Panayotidis P. (2021). Spatial patterns of posidonia oceanica structural and functional features in the Eastern Mediterranean (Aegean and e. Ionian seas) in relation to large-scale environmental factors. Mar. Environ. Res. 165, 105222. doi: 10.1016/j.marenvres.2020.105222
Gerovasileiou V., Smith C. J., Sevastou K., Papadopoulou N., Dailianis T., Bekkby T., et al. (2019). Habitat mapping in the European seas - is it fit for purpose in the marine restoration agenda? Mar. Policy 106, 103521. doi: 10.1016/j.marpol.2019.103521
Giakoumi S., Sini M., Gerovasileiou V., Mazor T., Beher J., Possingham H. P., et al. (2013). Ecoregion-based conservation planning in the Mediterranean: Dealing with Large-scale heterogeneity. PloS One 8 (10), e76449. doi: 10.1371/journal.pone.0076449
Gobert S., Cambridge M. T., Velimirov B., Pergent G., Lepoint G., Bouquegneau J.-M., et al. (2006). “Biology of posidonia,” in SEAGRASSES: BIOLOGY, ECOLOGYAND CONSERVATION (Dordrecht: Springer Netherlands), 387–408.
Gonzalez-Mirelis G., Buhl-Mortensen P. (2015). Modelling benthic habitats and biotopes off the coast of Norway to support spatial management. Ecol. Inform. 30, 284–292. doi: 10.1016/j.ecoinf.2015.06.005
Halpern B. S., Frazier M., Potapenko J., Casey K. S., Koenig K., Longo C., et al. (2015). Spatial and temporal changes in cumulative human impacts on the world’s ocean. Nat. Commun. 6 (1), 7615. doi: 10.1038/ncomms8615
Halpern B. S., Walbridge S., Selkoe K. A., Kappel C. V., Micheli F., D’Agrosa C., et al. (2008). A global map of human impact on marine ecosystems. Science 319, 948–952. doi: 10.1126/science.1149345
Henriques V., Guerra M. T., Mendes B., Gaudêncio M. J., Fonseca P. (2015). Benthic habitat mapping in a Portuguese marine protected area using EUNIS: An integrated approach. J. Sea Res. 100, 77–90. doi: 10.1016/j.seares.2014.10.007
Hermand J. (2003). The effect of photosynthetic bubbles on underwater sound propagation in The 18th ICA (Kyoto-Japan:ICA). 2515–2518.
Hühnerbach V., Blondel P., Huvenne V. A. I., Freiwald A. (2007). Habitat mapping on a deep-water coral reef off Norway, with a comparison of visual and computer-assisted sonar imagery interpretation. In Mapping the Seafloor for Habitat Characterization Todd B., Greene G., Eds.; (Geological Association of Canada: St. John’s, NL, Canada) p. 12
Huvenne V. A. I., Huhnerbach V., Blondel P., Gomez Sichi O., Le Bas T. (2007). “Detailed mapping of shallow-water environments using image texture analysis on sidescan sonar and multibeam backscatter imagery,” in Proceedings of the International Conference “Underwater Acoustic Measurements: Technologies & Results, eds Papadakis J., Bjorno S., L. (Heraklion: Foundation for Research & Technology), 879–886.
Ingrassia M., Martorelli E., Sañé E., Falese F. G., Bosman A., Bonifazi A., et al. (2019). Coralline algae on hard and soft substrata of a temperate mixed siliciclastic-carbonatic platform: Sensitive assemblages in the zannone area (western pontine archipelago; tyrrhenian Sea). Mar. Environ. Res. 147, 1–12. doi: 10.1016/j.marenvres.2019.03.009
Innangi S., Barra M., Di Martino G., Parnum I. M., Tonielli R., Mazzola S. (2015). Reson SeaBat 8125 backscatter data as a tool for seabed characterization (Central Mediterranean, southern italy): Results from different processing approaches. Appl. Acoust. 87, 109–122. doi: 10.1016/j.apacoust.2014.06.014
Innangi S., Tonielli R., Romagnoli C., Budillon F., Di Martino G., Innangi M., et al. (2019). Seabed mapping in the pelagie islands marine protected area (Sicily channel, southern Mediterranean) using remote sensing object based image analysis (RSOBIA). Mar. Geophys. Res. 40 (3), 333–355. doi: 10.1007/s11001-018-9371-6
Kiparissis S., Fakiris E., Papatheodorou G., Geraga M., Kornaros M., Kapareliotis A., et al. (2011). Illegal trawling and induced invasive algal spread as collaborative factors in a posidonia oceanica meadow degradation. Biol. Invasions 13 (3), 669–678. doi: 10.1007/s10530-010-9858-9
Korpinen S., Andersen J. H. (2016). A global review of cumulative pressure and impact assessments in marine environments. Front. Mar. Sci. 3. doi: 10.3389/fmars.2016.00153
Kostylev V., Todd B., Fader G., Courtney R., Cameron G., Pickrill R. (2001). Benthic habitat mapping on the scotian shelf based on multibeam bathymetry, surficial geology and sea floor photographs. Mar. Ecol. Prog. Ser. 219, 121–137. doi: 10.3354/meps219121
Lacharité M., Brown C. J., Gazzola V. (2018). Multisource multibeam backscatter data: developing a strategy for the production of benthic habitat maps using semi-automated seafloor classification methods. Mar. Geophys. Res. 39 (1–2), 307–322. doi: 10.1007/s11001-017-9331-6
Le Bas T. P., Huvenne V. A. I. (2009). Acquisition and processing of backscatter data for habitat mapping – comparison of multibeam and sidescan systems. Appl. Acoust. 70 (10), 1248–1257. doi: 10.1016/j.apacoust.2008.07.010
Leriche A., Pasqualini V., Boudouresque C.-F., Bernard G., Bonhomme P., Clabaut P., et al. (2006). Spatial, temporal and structural variations of a posidonia oceanica seagrass meadow facing human activities. Aquat. Bot. 84 (4), 287–293. doi: 10.1016/j.aquabot.2005.10.001
Levin N., Coll M., Fraschetti S., Gal G., Giakoumi S., Göke C., et al. (2014). Biodiversity data requirements for systematic conservation planning in the Mediterranean Sea. Mar. Ecol. Prog. Ser. 508, 261–281. doi: 10.3354/meps10857
Martin S., Charnoz A., Gattuso J.-P. (2013). Photosynthesis, respiration and calcification in the Mediterranean crustose coralline alga lithophyllum cabiochae (Corallinales, rhodophyta). Eur. J. Phycol. 48 (2), 163–172. doi: 10.1080/09670262.2013.786790
Martin C. S., Giannoulaki M., De Leo F., Scardi M., Salomidi M., Knitweiss L., et al. (2014). Coralligenous and maërl habitats: Predictive modelling to identify their spatial distributions across the mediterranean sea. Sci. Rep. 4, 1–9. doi: 10.1038/srep05073
Micallef A., Le Bas T. P., Huvenne V. A. I., Blondel P., Hühnerbach V., Deidun A. (2012). A multi-method approach for benthic habitat mapping of shallow coastal areas with high-resolution multibeam data. Cont. Shelf Res. 39–40, 14–26. doi: 10.1016/j.csr.2012.03.008
Micheli F., Halpern B. S., Walbridge S., Ciriaco S., Ferretti F., Fraschetti S., et al. (2013). Cumulative human impacts on Mediterranean and black Sea marine ecosystems: Assessing current pressures and opportunities. PloS One 8 (12), e79889. doi: 10.1371/journal.pone.0079889
Montefalcone M., Giovannetti E., Morri C., Peirano A., Bianchi C. N. (2013). Flowering of the seagrass posidonia oceanica in NW Mediterranean: Is there a link with solar activity? Mediterr. Mar. Sci. 14 (2), 416. doi: 10.12681/mms.529
Montefalcone M., Rovere A., Parravicini V., Albertelli G., Morri C., Bianchi C. N. (2013). Evaluating change in seagrass meadows: A time-framed comparison of side scan sonar maps. Aquat. Bot. 104, 204–212. doi: 10.1016/j.aquabot.2011.05.009
Olson D. B., Kourafalou V. H., Johns W. E., Samuels G., Veneziani M. (2007). Aegean Surface circulation from a satellite-tracked drifter array. J. Phys. Oceanogr. 37 (7), 1898–1917. doi: 10.1175/JPO3028.1
Papatheodorou G., Avramidis P., Fakiris E., Christodoulou D., Kontopoulos N. (2012). Bed diversity in the shallow water environment of pappas lagoon in Greece. Int. J. Sediment Res. 27 (1), 1–17. doi: 10.1016/S1001-6279(12)60012-2
Pasqualini V., Pergent-Martini C., Clabaut P., Pergent G. (1998). Mapping ofPosidonia oceanicausing aerial photographs and side scan sonar: Application off the island of Corsica (France). Estuar. Coast. Shelf Sci. 47 (3), 359–367. doi: 10.1006/ecss.1998.0361
Pasqualini V., Pergent-Martini C., Pergent G., Agreil M., Skoufas G., Sourbes L., et al. (2005). Use of SPOT 5 for mapping seagrasses: An application to posidonia oceanica. Remote Sens. Environ. 94 (1), 39–45. doi: 10.1016/j.rse.2004.09.010
Pergent-Martini C., Leoni V., Pasqualini V., Ardizzone G. D., Balestri E., Bedini R., et al. (2005). Descriptors of posidonia oceanica meadows: Use and application. Ecol. Indic. 5 (3), 213–230. doi: 10.1016/j.ecolind.2005.02.004
Pierdomenico M., Bonifazi A., Argenti L., Ingrassia M., Casalbore D., Aguzzi L., et al. (2021). Geomorphological characterization, spatial distribution and environmental status assessment of coralligenous reefs along the latium continental shelf. Ecol. Indic. 131, 108219. doi: 10.1016/j.ecolind.2021.108219
Poursanidis D., Topouzelis K., Chrysoulakis N. (2018). Mapping coastal marine habitats and delineating the deep limits of the neptune’s seagrass meadows using very high resolution earth observation data. Int. J. Remote Sens. 36 (23), 8670–8687. doi: 10.1080/01431161.2018.1490974
Prampolini M., Angeletti L., Castellan G., Grande V., Le Bas T., Taviani M., et al. (2021). Benthic habitat map of the southern Adriatic Sea (Mediterranean Sea) from object-based image analysis of multi-source acoustic backscatter data. Remote Sens. 13 (15), 2913. doi: 10.3390/rs13152913
Roberts J. M., Brown C. J., Long D., Bates C. R. (2005). Acoustic mapping using a multibeam echosounder reveals cold-water coral reefs and surrounding habitats. Coral Reefs. 24 (4), 654–669.doi: 10.1007/s00338-005-0049-6
Rocha G. A., Bastos A. C., Amado-Filho G. M., Boni G. C., Moura R. L., Oliveira N. (2020). Heterogeneity of rhodolith beds expressed in backscatter data. Mar. Geol. 423, 106136. doi: 10.1016/j.margeo.2020.106136
Romagnoli B., Grasselli F., Costantini F., Abbiati M., Romagnoli C., Innangi S., et al. (2021). Evaluating the distribution of priority benthic habitats through a remotely operated vehicle to support conservation measures off linosa island (Sicily channel, Mediterranean Sea). Aquat. Conserv. Mar. Freshw. Ecosyst. 31 (7), 1686–1699. doi: 10.1002/aqc.3554
Sánchez-Carnero N., Rodríguez-Pérez D., Couñago E., Aceña S., Freire J. (2012). Using vertical sidescan sonar as a tool for seagrass cartography. Estuar. Coast. Shelf Sci. 115, 334–344. doi: 10.1016/j.ecss.2012.09.015
Sañé E., Ingrassia M., Chiocci F. L., Argenti L., Martorelli E. (2021). Characterization of rhodolith beds-related backscatter facies from the western pontine archipelago (Mediterranean Sea). Mar. Environ. Res. 169, 105339. doi: 10.1016/j.marenvres.2021.105339
Sini M., Katsanevakis S., Koukourouvli N., Gerovasileiou V., Dailianis T., Buhl-Mortensen L., et al. (2017). Assembling ecological pieces to reconstruct the conservation puzzle of the Aegean Sea. Front. Mar. Sci. 4. doi: 10.3389/fmars.2017.00347
Solan M., Germano J. D., Rhoads D. C., Smith C., Michaud E., Parry D., et al. (2003). Towards a greater understanding of pattern, scale and process in marine benthic systems: A picture is worth a thousand worms. J. Exp. Mar. Biol. Ecol. 285–286, 313–338. doi: 10.1016/S0022-0981(02)00535-X
SPA/RAC-UN Environment/MAP (2019). Updated classification of benthic marine habitat types for the Mediterranean region (Tunis).
Telesca L., Belluscio A., Criscoli A., Ardizzone G., Apostolaki E. T., Fraschetti S., et al. (2015). Seagrass meadows (Posidonia oceanica) distribution and trajectories of change. Sci. Rep. 5, 1–14. doi: 10.1038/srep12505
Traganos D., Aggarwal B., Poursanidis D., Topouzelis K., Chrysoulakis N., Reinartz P. (2018). Towards global-scale seagrass mapping and monitoring using sentinel-2 on Google earth engine: The case study of the Aegean and Ionian seas. Remote Sens. 10 (8), 1–14. doi: 10.3390/rs10081227
Vacchi M., Montefalcone M., Bianchi C. N., Morri C., Ferrari M. (2012). Hydrodynamic constraints to the seaward development of posidonia oceanica meadows. Estuar. Coast. Shelf Sci. 97, 58–65. doi: 10.1016/j.ecss.2011.11.024
Keywords: seafloor classification, marine priority area, Posidonia oceanica, EUNIS habitat classification, NATURA classification, coralligenous and other calcareous bio-concretions formations
Citation: Dimas X, Fakiris E, Christodoulou D, Georgiou N, Geraga M, Papathanasiou V, Orfanidis S, Kotomatas S and Papatheodorou G (2022) Marine priority habitat mapping in a Mediterranean conservation area (Gyaros, South Aegean) through multi-platform marine remote sensing techniques. Front. Mar. Sci. 9:953462. doi: 10.3389/fmars.2022.953462
Received: 26 May 2022; Accepted: 02 August 2022;
Published: 05 September 2022.
Edited by:
Lorenzo Mari, Politecnico di Milano, ItalyReviewed by:
Sara Innangi, Department of Earth System Sciences and Technologies for the Environment, (CNR), ItalyHocein Bazairi, Mohammed V University, Morocco
Dimitris Poursanidis, Terrasolutions Marine Environment Research, Greece
Copyright © 2022 Dimas, Fakiris, Christodoulou, Georgiou, Geraga, Papathanasiou, Orfanidis, Kotomatas and Papatheodorou. This is an open-access article distributed under the terms of the Creative Commons Attribution License (CC BY). The use, distribution or reproduction in other forums is permitted, provided the original author(s) and the copyright owner(s) are credited and that the original publication in this journal is cited, in accordance with accepted academic practice. No use, distribution or reproduction is permitted which does not comply with these terms.
*Correspondence: Xenophon Dimas, eGVuZGltYXNAdXBhdHJhcy5ncg==