 Laura Florentina Guşatu
 Christian Zuidema1
- 1Faculty of Spatial Sciences, Department of Planning, University of Groningen, Groningen, Netherlands
- 2Faculty of Science and Engineering, University of Groningen, Groningen, Netherlands
- 3TNO, Unit Energy Transition, Utrecht, Netherlands
Growing EU energy ambitions in the North Sea region are urging for an accelerated deployment of large-scale renewable energy (RE) infrastructure, with offshore wind farms (OWF) playing an essential role. However, implementing the current EU targets is limited by the competing spatial claims between existing sea uses and OWFs and uncertainties related to potential risks of interaction, creating important barriers to a swift roll-out of RE infrastructure. In tackling this issue, we are proposing a transparent and spatially explicit multi-criteria analysis tool to quantify and qualify the main risks and opportunities resulting from the interaction between OWFs and four other seas user groups (shipping, marine protected areas, fisheries and military activities). The multi-criteria analysis framework is accounting for sectoral activity specific risks of interaction with OWFs, classified through the respective available conflict resolution options, which allows for the quantification of the average conflict score (ACS) between the selected activities and OWFs. Using the resulting ACS and the geo-location of areas of interaction, we map areas of high and low conflict with OWFs and indicate management options for solving, minimizing or compensating the conflicts. Our results indicate that conflict resolution strategies in marine mammal’s habitats present the highest potential for unlocking medium value OWF sites both for the Dutch case (15.8 – 28 GWs) and English case (15.94-28.3 GWs), followed by pelagic fisheries in the Dutch case (15-26.9 GWs) and passenger/cargo routes in the English case (10.9-19.4 GWs). The strategic planning of increasingly larger and more complex OWF projects will require a better understanding not only of the level of conflict with the other sea users in relation to the valuable OWF sites, but also potential management options to solve, minimize or compensate those conflicts. As an example, accessing 6.8-12.3 GWs in high value OWF sites in the Dutch EEZ will require the relocating of military flying areas with forbidden access, while technical solutions such as “fill-in-the-gap” or relocation of lower airspace radars could unlock 10.25-18.16 GWs in the English EEZ. By avoiding high risk areas and prioritizing areas of low conflict, the bottlenecks, negative effects and inefficiencies related to space management options can be minimized, while synergies and positive effects of OWF deployment can be timely captured.
Introduction
The North Sea currently faces high ambitions for the deployment of offshore wind infrastructure (Government of The Netherlands, 2021a; Martínez-Gordón et al., 2022). The different North Sea countries contrast between each other regarding both installed and planned capacity for renewables offshore. For example, the total installed capacity of offshore wind in the Dutch EEZ was approx. 2.45 GWs in 2021 (Government of The Netherlands, 2021b), with a commitment towards 11.5 GWs by 2030 (Netherlands Enterprise Agency, 2022). Reaching the 2030 target will be realized in the currently designated areas for offshore wind (Government of The Netherlands, 2021b), with an approx. cumulated installed capacity of 9.6 GWs. Beyond 2030, the offshore wind deployment is subject to multiple future energy scenarios (Cleijne et al., 2020) indicating between 38 and 72 GWs of offshore wind energy (Netherlands Enterprise Agency, 2022), required to reach a climate-neutral energy system by 2050. With more ambitious OWF deployment targets, UK aims for an installed capacity of 40 GWs by 2030 (Department for Business E& IS, 2019) and between 75 (UK Department for Business Energy and Industrial Strategy [BEIS], 2020) and 108 GWs by 2050 (Aunedi et al., 2021), under different projections and energy demand scenarios. However, next to offshore wind, marine space faces increasing claims from users with different and competing interests, both from economic sectors (shipping, fisheries, oil and gas), and activities or services not tradable on economic markets (nature protected areas, military). Managing conflicts and dealing with potential trade-offs between different offshore users is, therefore, a prerequisite for reaching the EU 2050 energy goals for European marine basins.
Managing the offshore space in the EU reflects varying national political and strategic priorities (Suárez de Vivero et al., 2009), while no cross-sectoral marine basin strategy has been elaborated. Nevertheless, common objectives for the management of the marine resources can be identified in many national and EU strategies, such as sustainable economic development (EU Blue Economy (Directorate-General Maritime Affairs and Fisheries, 2020)) conservation and protection of the marine environment (EU Marine Strategy Framework Directive (European Parliament and Council, 2008)) or the realization of the renewable energy potential (Department for Environment Food and Rural Affairs, 2014a). In practice, the objectives established for using marine resources have been operationalized using management instruments, as marine spatial plans (MSP), to achieve sectoral goals and address conflicts between sectors sharing the same space (Suárez de Vivero et al., 2009). Taking as example the English case, the UK North-East Offshore Marine Plan aims at achieving, in an integrated manner, a sustainable marine economy while living within environmental limits (Marine Management Organisation, 2020). This translates into balancing different goals such as the protection and enhancement of the marine environment and mitigating climate change through offshore energy generation. Similarly, the Dutch Draft North Sea Program 2022-2027 (Government of The Netherlands, 2021a) defined 21 national interests, such as ensuring national safety, limiting climate change, maintaining and developing the main infrastructure for mobility, improving/protecting biodiversity and developing sustainable fishing.
Central to managing offshore space is the use of a Marine Spatial Plan (MSP). Normatively, a MSP aims to employ an area-based, integrated, strategic, adaptive and participatory processes (Spijkerboer, 2021), following an ecosystem-based and precautionary approach (Government, 2011) and promoting multisector management strategies that take into consideration various sectoral values (White et al., 2012). Hence, the spatial claims exerted by different sectors are managed by trying to distribute sectors among their high-value locations with the low inter-sectoral conflicts (Ehler and Douvere, 2009; White et al., 2012; Lester et al., 2013), considering principles such as freedom and safety of navigation and aviation (Dutch Central Government, 2009; Marine Management Organisation, 2020). MSPs function in the context of a legal framework, which does not allow or limits activities in the national interest designated areas (e.g. such as for the Dutch EEZ the production of sustainable energy, shipping, oil and gas extraction, defense, sand extraction) (Dutch Central Government, 2009). However, when known risks (in particular safety) of interaction between multiple activities are low, or benefits are exceeding risks, the multi-use of space is encouraged. As a result, two main spatial allocation options for OWFs can be underlined: single-use, where only one of the sea user has priority in using the allocated site, and multi-use (Schupp et al., 2019), where OWFs and the existing sea users can jointly use an area under well-defined conditions. A single-use strategy is associated with lower risks of accidents during operation at sea, as well as lower local impacts on the marine environment due to multiple pressures (cumulative effects) (Gușatu et al., 2021). However, a single-use strategy is not always feasible within a limited offshore space.
Allocating areas offshore for the future OWF developments will require a negotiation between OWF and existing sea users, such as fisheries, nature protected areas, shipping, military, etc. Ideally, the selected locations will have a high potential for OWFs and limited to no conflict with alternative users. In reality, however, the installation of OWF turbines will come at the cost of minimizing or restricting the physical access for other activities, could result in adverse impacts on marine ecosystems (Lehmann et al., 2021) or may allow for a degree of multi-use where OWFs can be combined with other users. The exact costs and impacts will differ spatially, depending on the value an area has for each individual user. In addition, legislation under the MSP umbrella permits conflict resolution management strategies that might limit impacts: i.e. ranging from minimization/limitation of negative effects, mitigation of negative effects, to compensation or relocation, where possible (Dutch Central Government, 2009; Marine Management Organisation, 2020). Consequently, the level of conflict between the potential deployment of an OWF and alternative sea uses will depend on both its location and available resolution strategies.
In the most recent body of literature the site selection for OWFs is defined as a complex problem, which takes into account a variety of factors, from the access to wind resources and constructability of the infrastructure (in particular offshore), to environmental, social and economic factors (Gil-García et al., 2022). In order to better account for potential trade-offs between alternative OWF deployment options, a number of studies on optimal OWF site location have been focusing on combining a multi criteria decision making (MCDM) framework and GIS (geographic information systems) (Mahdy and Bahaj, 2018; Gil-García et al., 2022; Caceoğlu et al., 2022; Nagababu et al., 2022; Sánchez-Lozano et al., 2022). In particular, an entire body of literature has been focusing on the analytical hierarchy process (AHP), which implies a structured technique that compares alternatives based on weighted criteria of site selection that usually conflict with each other (Gil-García et al., 2022). Hence, most studies have so far focused on exclusion factors which would lead to a number optimal locations for locating OWFs (Loughney et al., 2021; Caceoğlu et al., 2022; Nagababu et al., 2022), or a range of options based on a suitability index (Mahdy and Bahaj, 2018). A related body of literature has been focusing on the analysis of potential pair-wise trade-offs between offshore uses and activities and the emerging offshore wind energy (White et al., 2012; Lester et al., 2013). However, most studies address the site location problem from a single-use space management option, employing a top-down approach, the multi-use of OWFs with other activities and the potential opportunities and risks attached to this management option have not yet been explored, in particular at a large spatial scale and when considering multiple overlapping offshore interests.
Opposed to these models, a more recent set of studies do consider alternative objectives by going beyond mere economic modelling and relying on a bottom-up approach to identify trade-offs by combining stakeholder engagement with GIS-based mapping tools (Gimpel et al., 2018). Nevertheless, their spatial resolution and scope remains limited (Kyvelou and Ierapetritis, 2019; Spijkerboer, 2021), while these studies also often narrow their focus on general techno-economic (fisheries (Schupp et al., 2021)) or institutional barriers (shipping (Mehdi et al., 2017; Mehdi et al., 2018)). In response to this first research gap, this study analyzes and maps the spatial distribution and intensity of conflicts between alternative sea users and OWFs, across large marine areas (country level Exclusive Economic Zone-EEZ) on a high spatial resolution (km2) and by consideration of economic and non-economic values of OWFs and four sea user groups (fisheries, nature protected areas, military activities, shipping).
Second, most studies do not differentiate between types of activities within a sea user group. Nevertheless, there are multiple types of fisheries (such as bottom trawlers and static gears), but also different military activities, modes of shipping or protected features within nature protected areas. Those different types can have a different spatial coverage, and the exact risks and impacts posed by the development of OWFs will differ per sea user type, leading to different conflict resolution strategies at different locations. While such differences are crucial to recognize, it is also crucial to identify locations where various types of sea users may simultaneously occur in a single piece of offshore space, such as pelagic trawls and military flying areas, or sea mammals, bird’s habitats and passenger routes. In response, this study does include these differences and their potential simultaneous occurrence.
Third, when looking at the North Sea basin, criteria for site selection and the balancing of spatial (sectoral) claims differs between countries, as different (mainly sectoral) policies and priorities apply. Aspects such as the size and importance of shipping lanes, the status of the protected features and protection measures for nature areas, or activities permitted within the training military zones all differ across different countries. Acknowledging these differences, which have implications on the authorization process, and therefore, the speed of deployment, this study will apply the developed method for two countries’ EEZ, namely the English (East Offshore and North East Marine plans areas) and Dutch EEZ. The two cases differ not only in the size of EEZ, but also in the offshore energy goals for 2030 (UK Department for Business Energy and Industrial Strategy [BEIS], 2020; Government of The Netherlands, 2021a). Moreover, there is a considerable contrast between the deployment pace of the two countries, which could reflect the difficulties in balancing the densely claimed space of the Dutch EEZ, as well as the degree of flexibility in dealing with conflicting spatial claims in the English EEZ.
There is a recurring need to trade national economic development for national non-economic objectives, such as ecosystem restoration, and vice versa (Confederation of European Shipmasters’ Associations, 2018). This trade-off, however, is difficult to convey in clear numbers or units of measurement, due to different value measurement in the case of non-monetary trade-offs (Confederation of European Shipmasters’ Associations, 2018), but also due to the absence of property rights at sea (Lester et al., 2013). As a consequence, the management of the offshore space has been, more than often, shaped by dominative power asymmetries between the offshore economic and non-economic sectors (Overlegorgaan Fysieke Leefomgeving, 2020). More recently, marine spatial plans have been developed as tools to promote a more inclusive, participatory and equitable management of the offshore space (Lombard et al., 2019). However, the MSP process has also been criticized to prioritize powerful interests, in particular OWFs, over other interests offshore, failing therefore to successfully integrate the multispectral interests offshore, from an institutional but also spatial perspective (Spijkerboer, 2021). The overarching objective of this study is to develop and apply a multi-criteria analysis framework for quantifying, qualifying and mapping the spatial distribution of conflicts between OWFs and four sea user groups (fisheries, nature protected areas, military activities, shipping). The method and its application in our study aims to provide a robust and transparent knowledge basis for strategic spatial policy development in finding space for OWFs, potentially underpinning future standardized practices at the basin level. This is particularly relevant due to the transboundary nature of most marine activities and uses, such as shipping, marine protected areas and fishing. Moreover, making trade-offs and conflict management measures (solve/minimize/mitigate) visible could also help tackling with criticism of spatial injustice in the governance and planning of the marine area ‘commons’ (Ntona and Schröder, 2020).
Methods
We followed three main methodological steps for the development and application of our multi-criteria analysis framework, as we detailed in Figure 1.
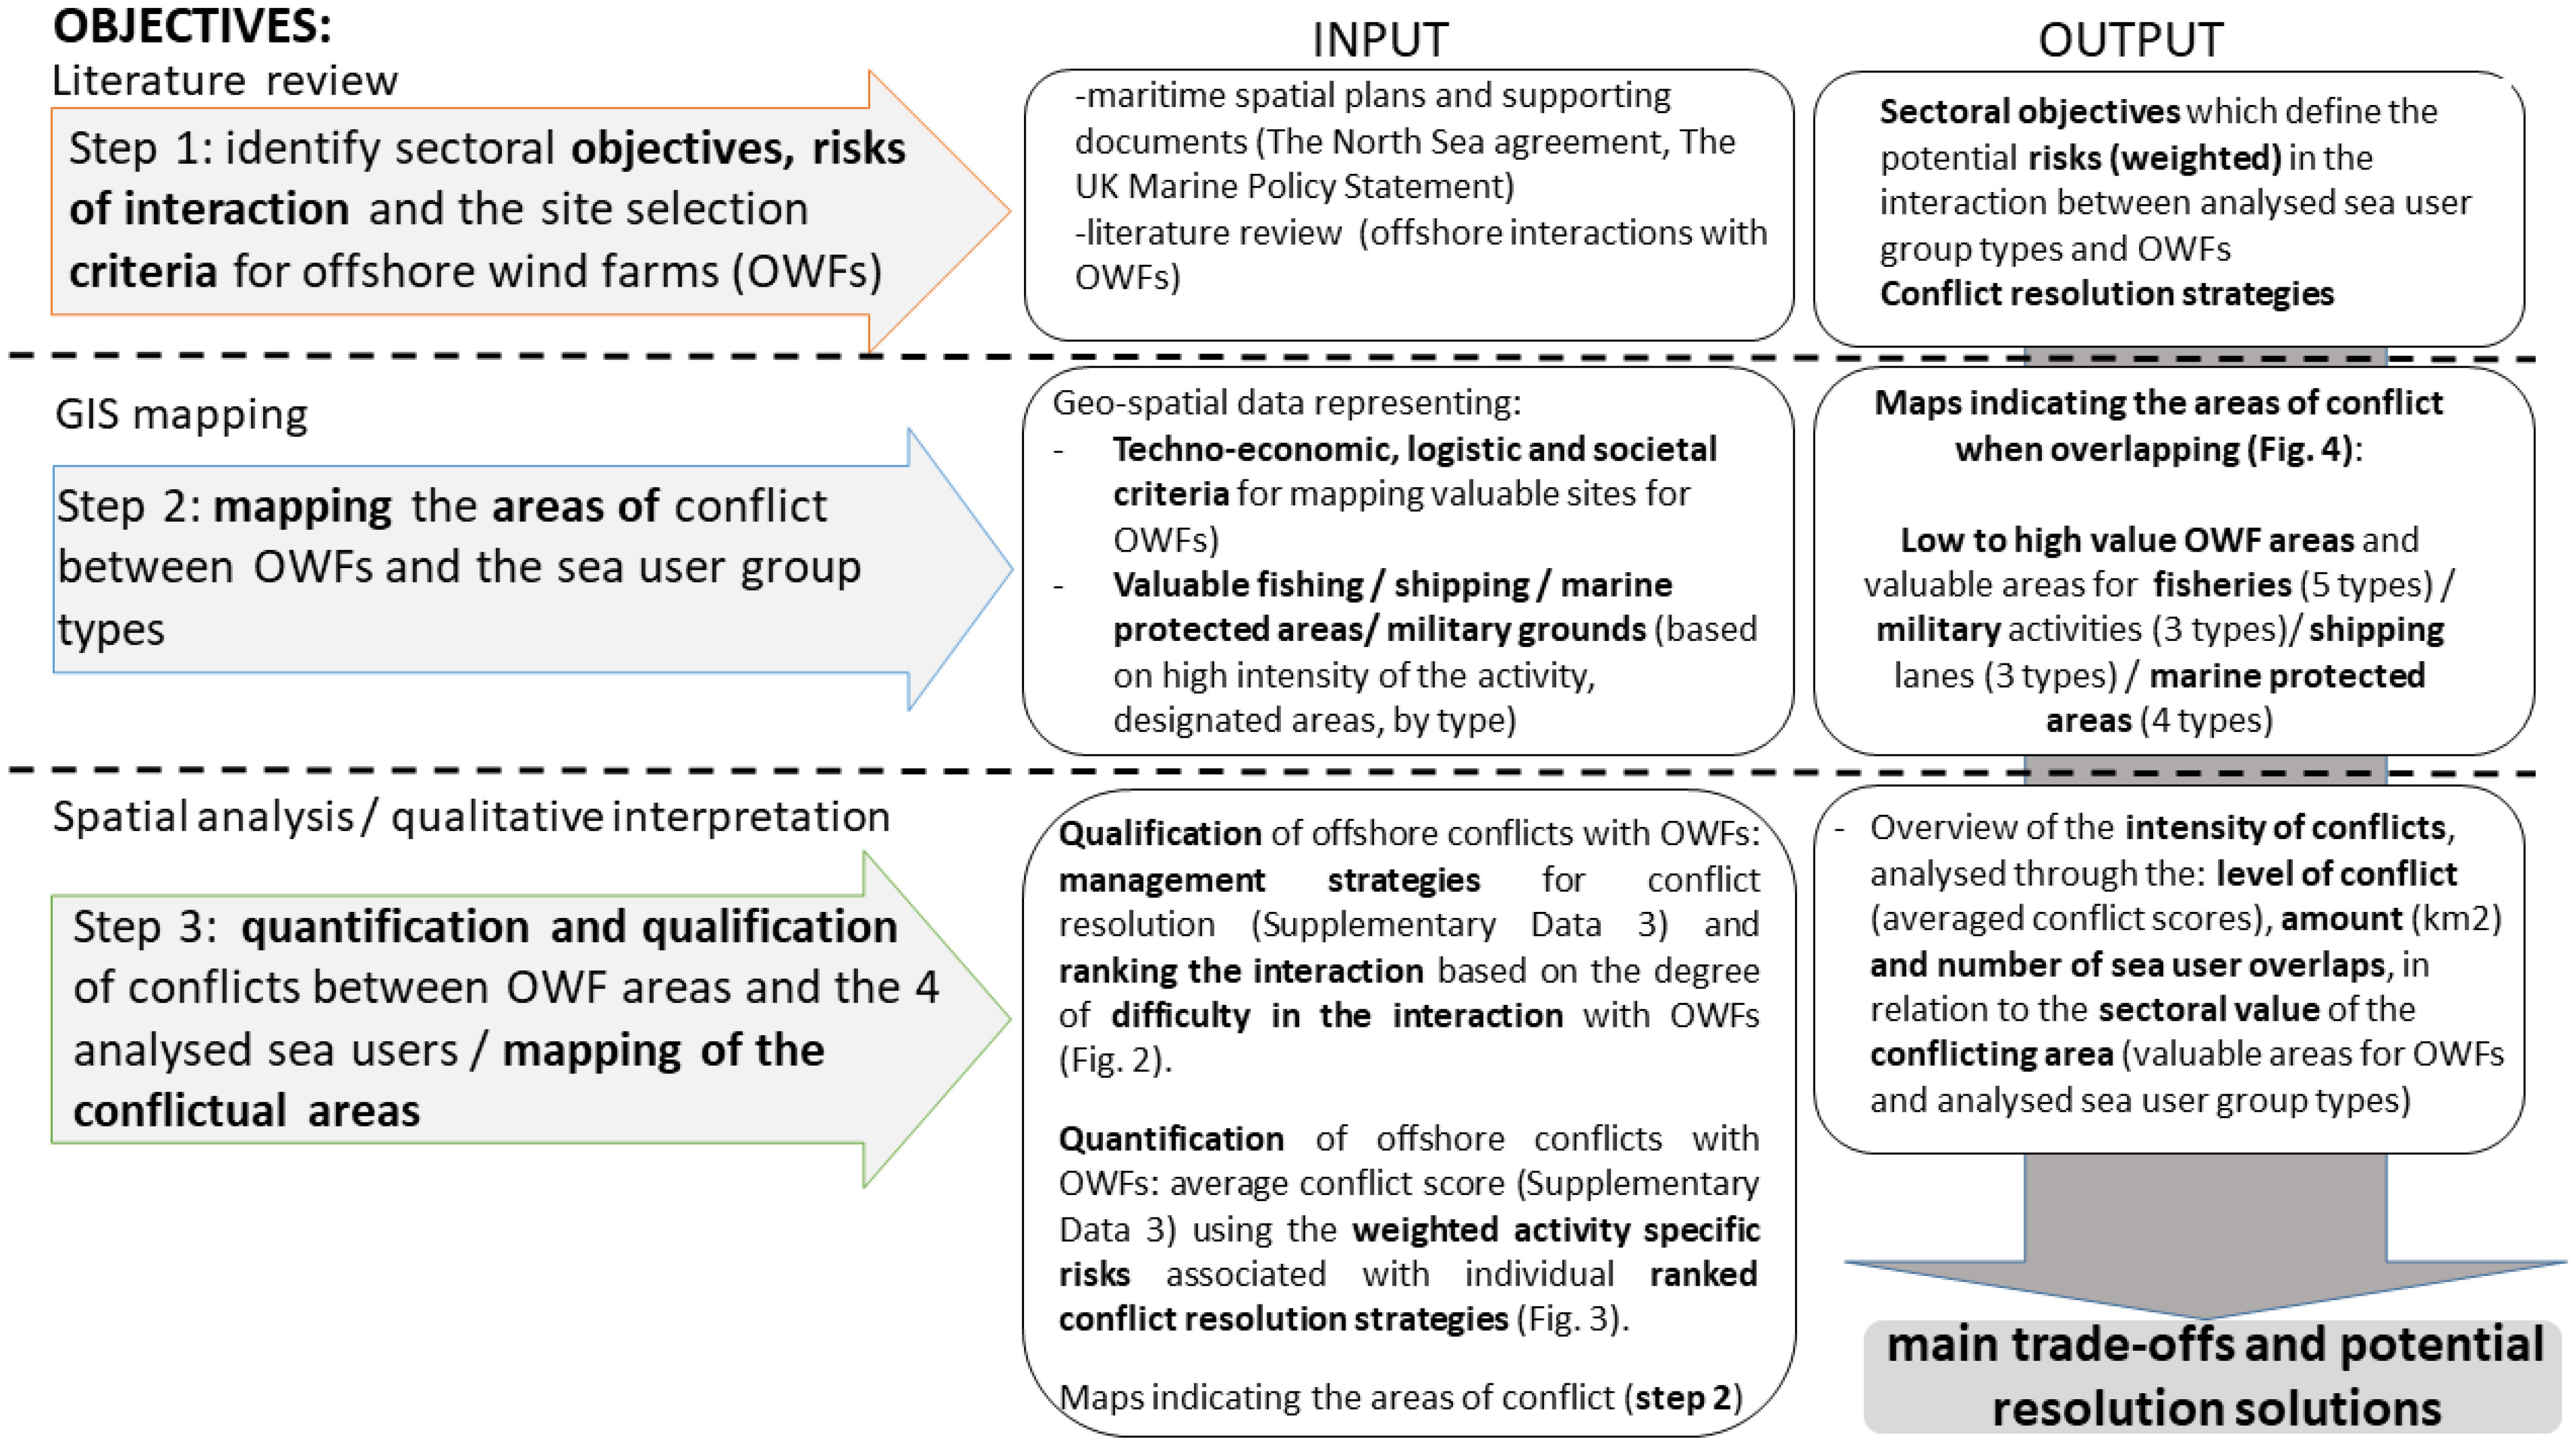
Figure 1 Sequence of steps for identifying trade-offs for the interactions of OWFs in the Dutch and English EEZ, with selected sea users: Fisheries (beam trawls, bottom otter trawl, bottom seine, pelagic trawls and seine, static gear), nature protected areas (seabed habitats, marine mammals habitats, birds habitats, fish habitats), shipping routes (cargo, passenger, tanker) and military activities (flying areas, shooting areas, airspace radar areas).
Step 1. Literature review and data collection
The first step is based on conducting a literature review and data collection. The literature review will: 1) identify the sectoral objectives/priorities related to all included sea user groups, 2) identify the main risks/benefits in the interaction between the different sea user types in the selected sea user groups and OWFs and 3) attach an importance weight factor to these risks to express their relative importance. Therefore, our first round of literature review was a document analysis on a country basis and international level (Supplementary Data 1) targeting the main legal setting for managing the interaction between OWFs and the other four sea users included in this study (military, shipping, fishing, nature protection areas). The method employed for this step is qualitative data analysis through two cycle coding of selected documents. For the 1st cycle coding, we used exploratory coding methods, namely provisional coding (codes: “offshore wind farms”, “fisheries”, “nature protected areas”, “protected marine environment”, “shipping”, “military”). For the 2nd cycle coding we used pattern coding methods (Wicks, 2017), which enabled us to organize and group similarly coded data into a number of themes with shared characteristics (patterns). Specifically, the outcomes of this first round, in alignment with the themes that we grouped the data, are (1): the main sectoral objectives (e.g.: “access to (resources) fishing grounds”, “conservation and regeneration of environmental features”, “sufficient exercise space for military activities”) (2), the risks involved from the interaction between OWFs sites and the selected sea user types, including the preliminary importance weights, and (3) potential benefits or synergies between different sectoral objectives (i.e., restoration of seabed habitats and protection of fish species can be achieved by forbidding fishing in OWF area, while temporary closing of OWF sites could increase fish stocks which represents a fishing sector objective). The patterns used for organizing the data are characterized by: 1) similarity (can be classified in the above mentioned categories: sectoral objectives, risks of interaction, synergies); 2) correspondence (are connected to the interaction with OWF development); 3) causation (applied in particular for risks and synergies, where codes are linked to data on effects of OWF deployment). The results reflect the international and national legal rights and obligations in the use of the sea space (e.g., safety of operation at sea) in relation to the analyzed activities.
Our second literature review round meant to help qualify and further quantify risks and benefits while also considering potential conflict resolution strategies (Figure 1). Literature targeted included: 1) scientific literature on co-location (Mehdi et al., 2017; Mehdi et al., 2018; Degraer et al., 2020; Stelzenmüller et al., 2021), risk assessments (for shipping: collision risk with vessels (Moulas et al., 2017), effects of OWFs on the shipping activity (Rawson and Rogers, 2015)), effects of OWFs on the marine environment (OWF as a protected area (Ashley et al., 2014)), fishing activity (Andrew Gill et al., 2020); 2) governmental/industry reports and guidelines on the interaction between OWFs and the analyzed activities: military (Office of the Director of Defense Research and Engineering, 2006), shipping (Maritime & Coastguard Agency, 2006), nature protected areas (Copping and Hemery, 2020) (Netherlands (Hermans et al., 2020), England (Harley et al., 2009)); 3) OWF project reports and environmental impact assessments: military (Ørsted, 2018), nature protected areas (environmental impact assessments for OWFs in the study area: Horns Rev (NL), Borselle (NL), Walney(UK), etc.). This allowed us to summarize conflict resolution and management strategies and practices for solving, minimizing or mitigating negative effects, in the interaction with OWFs. The method employed here is qualitative data analysis through two cycle coding of selected documents. For the 1st cycle coding, we used exploratory coding methods, namely provisional coding (codes: “interaction”, “risk”, “benefit”, “effects”, “gains”, “losses”, “impact”, “recommendation”, “solve”, “minimize”, “mitigate”). This allowed to identify recommended conflict resolution strategies for each activity specific risk identified in the first round of literature review (e.g. the negative impacts of the risk of “reduced efficiency of the air traffic control services” can be minimized through “gap-fill options using turbines as substations for air traffic control radars”- Supplementary Data 3). The second cycle coding is realized using pattern coding methods (Wicks, 2017), categorizing the data from the first cycle into two main groups representing: 1) risks of interaction with OWF infrastructure, and 2) conflict resolution options (solve, minimize, mitigate) (examples in Supplementary Data 3). The importance weight of the identified risks is reflecting the sectoral priorities and objectives underlined in policy documents (MSP document, Marine Policy statements), sectoral policy documents (Prellezo et al., 2020), technical industry reports (Ørsted, 2018) and literature review (perceived or analyzed risks). We operationalize the ranking of importance weight using: 1) the relevance towards achieving sectoral objectives, and 2) frequency of occurrence within the selected body of literature. This is detailed in Supplementary Data 3.
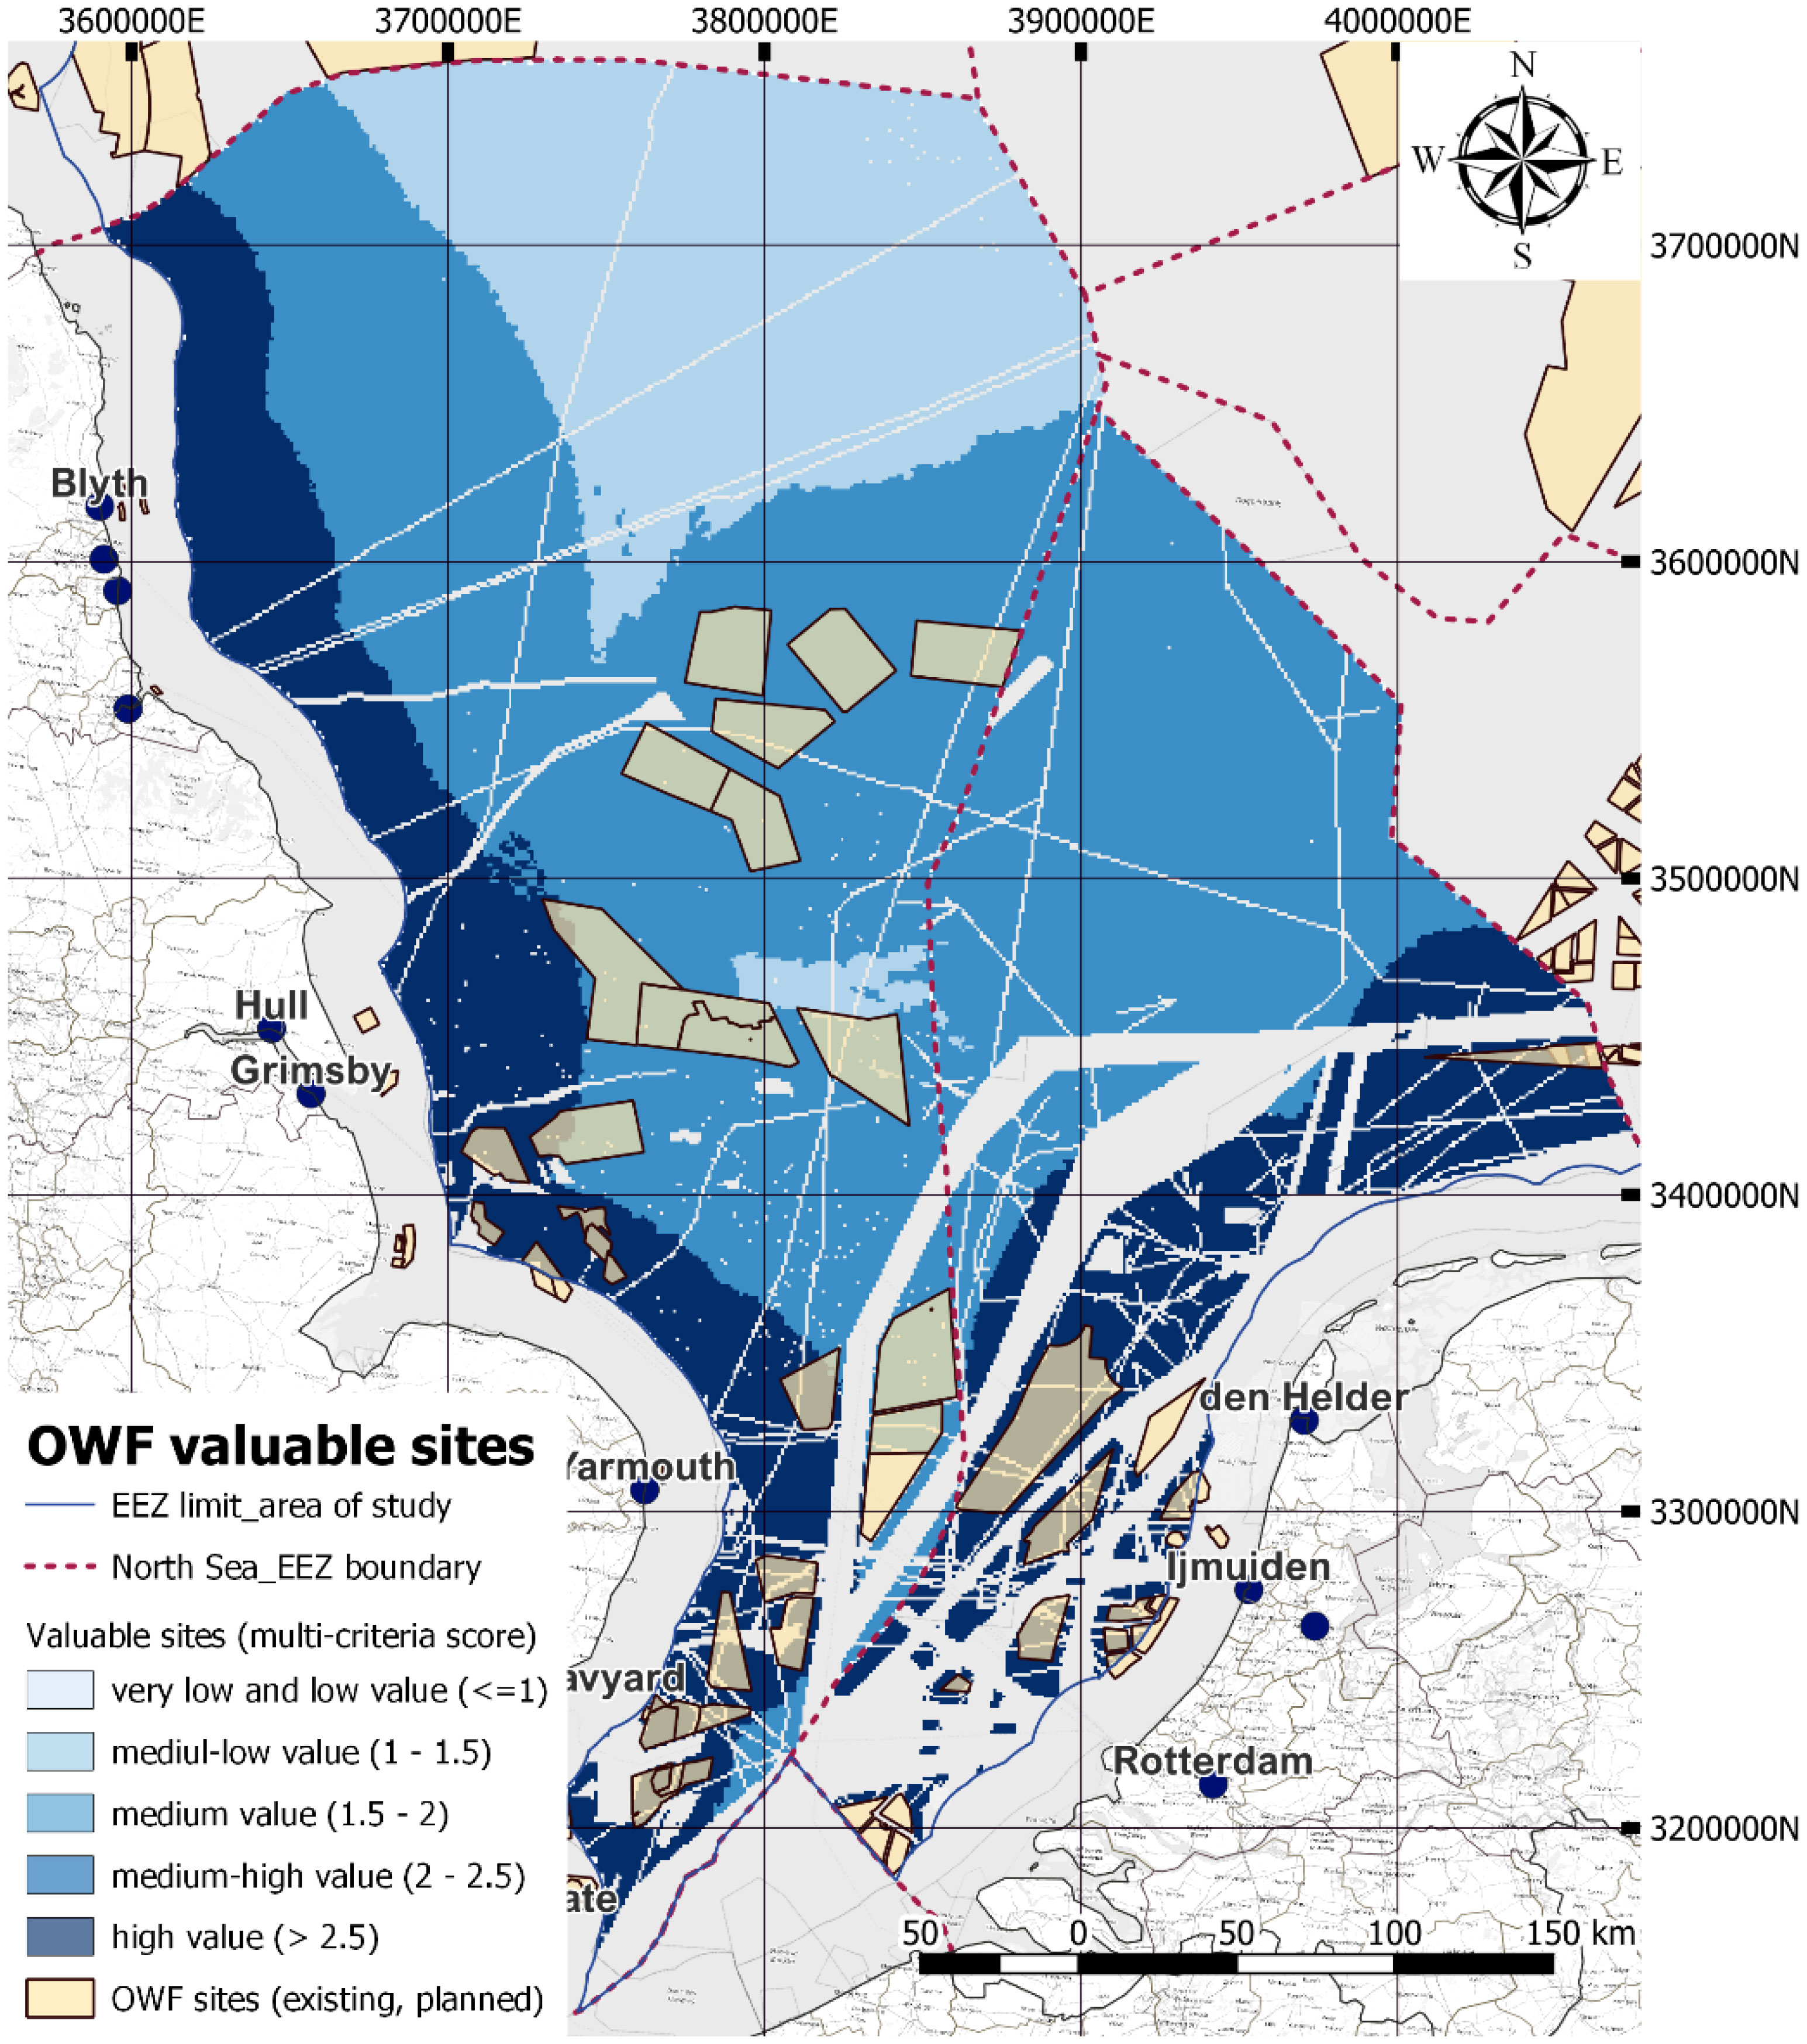
Figure 2 Valuable OWF sites in the Dutch and English EEZ.
We further discuss the mapping of valuable sites for OWFs and the selected sea users, followed by how we used the information from this second literature review round in our third methodological step 3. It is also there where we explain how we combined the weigh factor of risk on the interaction between user groups and OWF and potential use of conflict resolution strategies in addressing these risks for identifying the intensity of offshore conflicts with OWFs.
Step 2. Spatial visualization and mapping of valuable sites and the interaction with analyzed sea users
The first part of step 2 is the mapping of the valuable OWF sites areas. We identified the initial investment costs, operation and maintenance costs, transport of electricity cost, community acceptance as essential sectoral objectives for OWF deployment and translated them into six spatial criteria with different interval values and criteria rankings (Table 1). The sectoral objectives, spatial criteria and criteria rankings we use have been selected from the study of Deveci et al. (2020) (Deveci et al., 2020), a novel and comprehensive study involving a mixed method approach. Based on the ranking provided by Deveci et al., we selected the critical and moderate importance spatially relevant criteria for the North Sea context. For practical reasons and towards the focus of our study on the interaction with fisheries, nature protection areas, shipping and military, we excluded the following OWF criteria: proximity to landscape protection or conservation area, proximity to passage route of birds, proximity to shipping lanes, proximity to military operation area, proximity to radar and radio corridors, fishing ground proximity.
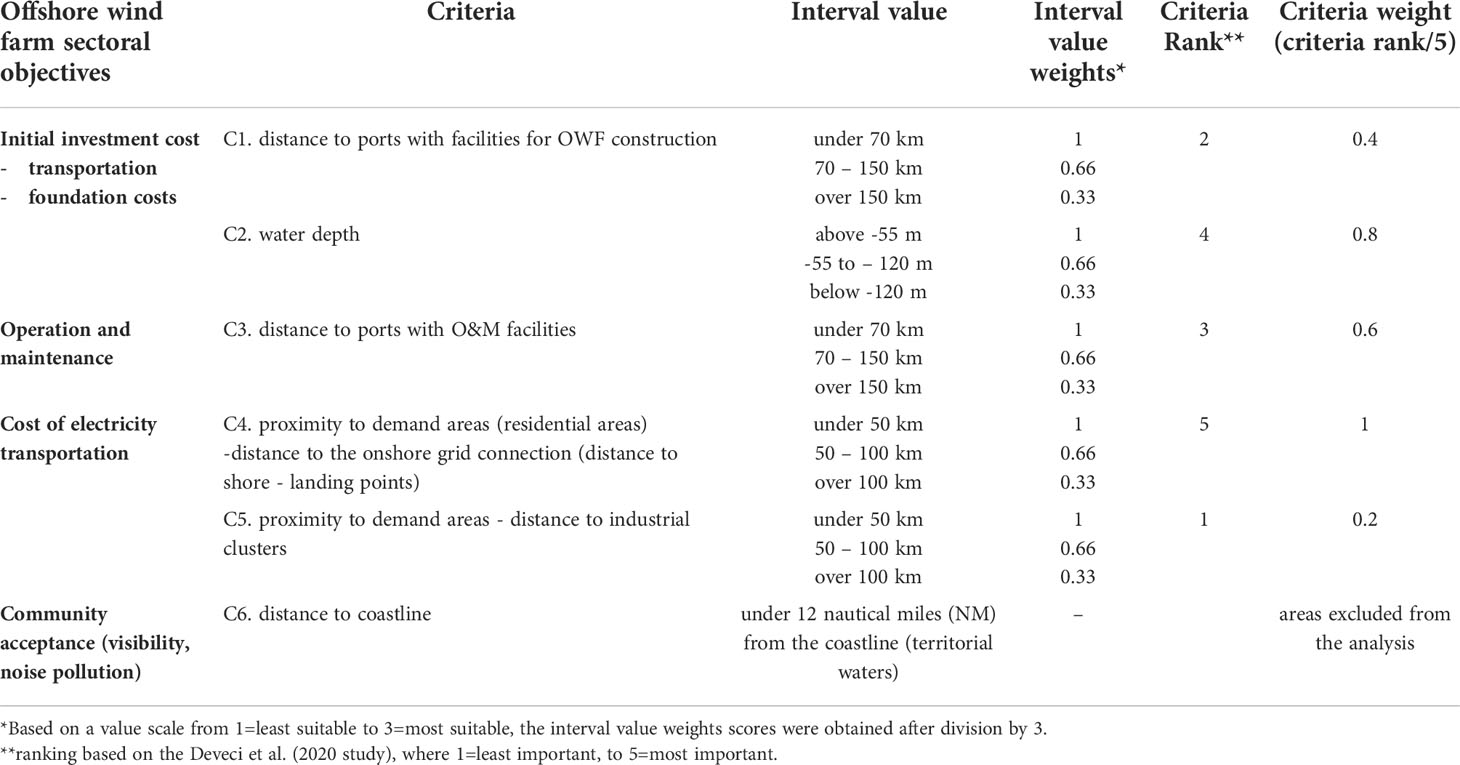
Table 1 Explicit OWF site allocation criteria, for the calculation of valuable OWF area.
The criteria C1-C5, the criteria rankings, the interval values and their respective weights (Table 1) are used in compiling the OWF valuable sites map. This is realized using the QGIS open-source software, through a number of steps: 1) create the GIS vector layers for each criterion (e.g., the areas with water depths above -55 m, between -55 and -120 m, below – 120m), and add a separate field for the respective interval value weights; 2) convert all shapefiles in raster files for each criteria, with a spatial resolution of 1 kmx1km (Hengl, 2006); 3) apply the raster calculator using the created raster files, the interval value weight and the criteria weights, where:
cell value = , and Ci = criteria from C1 to C5.
The areas with the highest cell value are the most valuable OWF sites. We subsequently translated these values into six categories: very low value (<=0.5), low value (0.5-1), medium-low value (1-1.5), medium value (1.5-2), medium-high value (2-2.5) and high value (>=2.5). In the display of the final ACS scores (Supplementary Figures 2-5), the spatial distribution of conflictual areas (see Results Section) and space of overlap between activities per activity type (Supplementary Figure 1), we merge the first two OWF valuable sites categories, very low and low value OWFs. This is due to the fact that in the low valuable sites category there is a reduced amount of overlap with the other activities (e.g.: Supplementary Figure 1; in the English case there are 55 km2 of overlap with fisheries, 0 km2 of overlap with nature protected areas and nature protected areas and 4 km2 of overlap with shipping routes).
Secondly, we exclude all other activities not considered in this study (e.g. not part of the four user groups) where OWF deployment is not possible, including their protection zones, namely cables, pipelines, oil and gas infrastructure, aggregate extraction (source: EMODnet geoportal). We also excluded the operational, authorized and under construction OWF areas (sources: Rijkswaterstaat Geoservices, The Crown Estate), and the Traffic Separation Schemes (TSS), clearways and anchorage areas (sources: Rijkswaterstaat Geoservices, Admiralty Data solutions), as permanent structures are not allowed within or in a 500 m zone surrounding these shipping routes (Dutch Central Government, 2009). A detailed explanation of the selected OWF criteria and respective interval values can be found in Supplementary Data 2. The resulting map for valuable OWF sites is illustrated in Figure 2.
Thirdly, we overlapped the OWF raster value maps (categories from very-low/low to high value) with layers (maps) illustrating the spatial distribution (presence or intensity) of the analyzed sea user groups (military areas, shipping, fisheries, marine protected areas), separated in different types for each group (Table 2). For shipping and fisheries, we only include areas with a high intensity use. Separating the sea user groups in the different types is relevant considering that different user types interact differently with OWFs (meaning they are exposed to different risks and require different conflict resolution strategies).
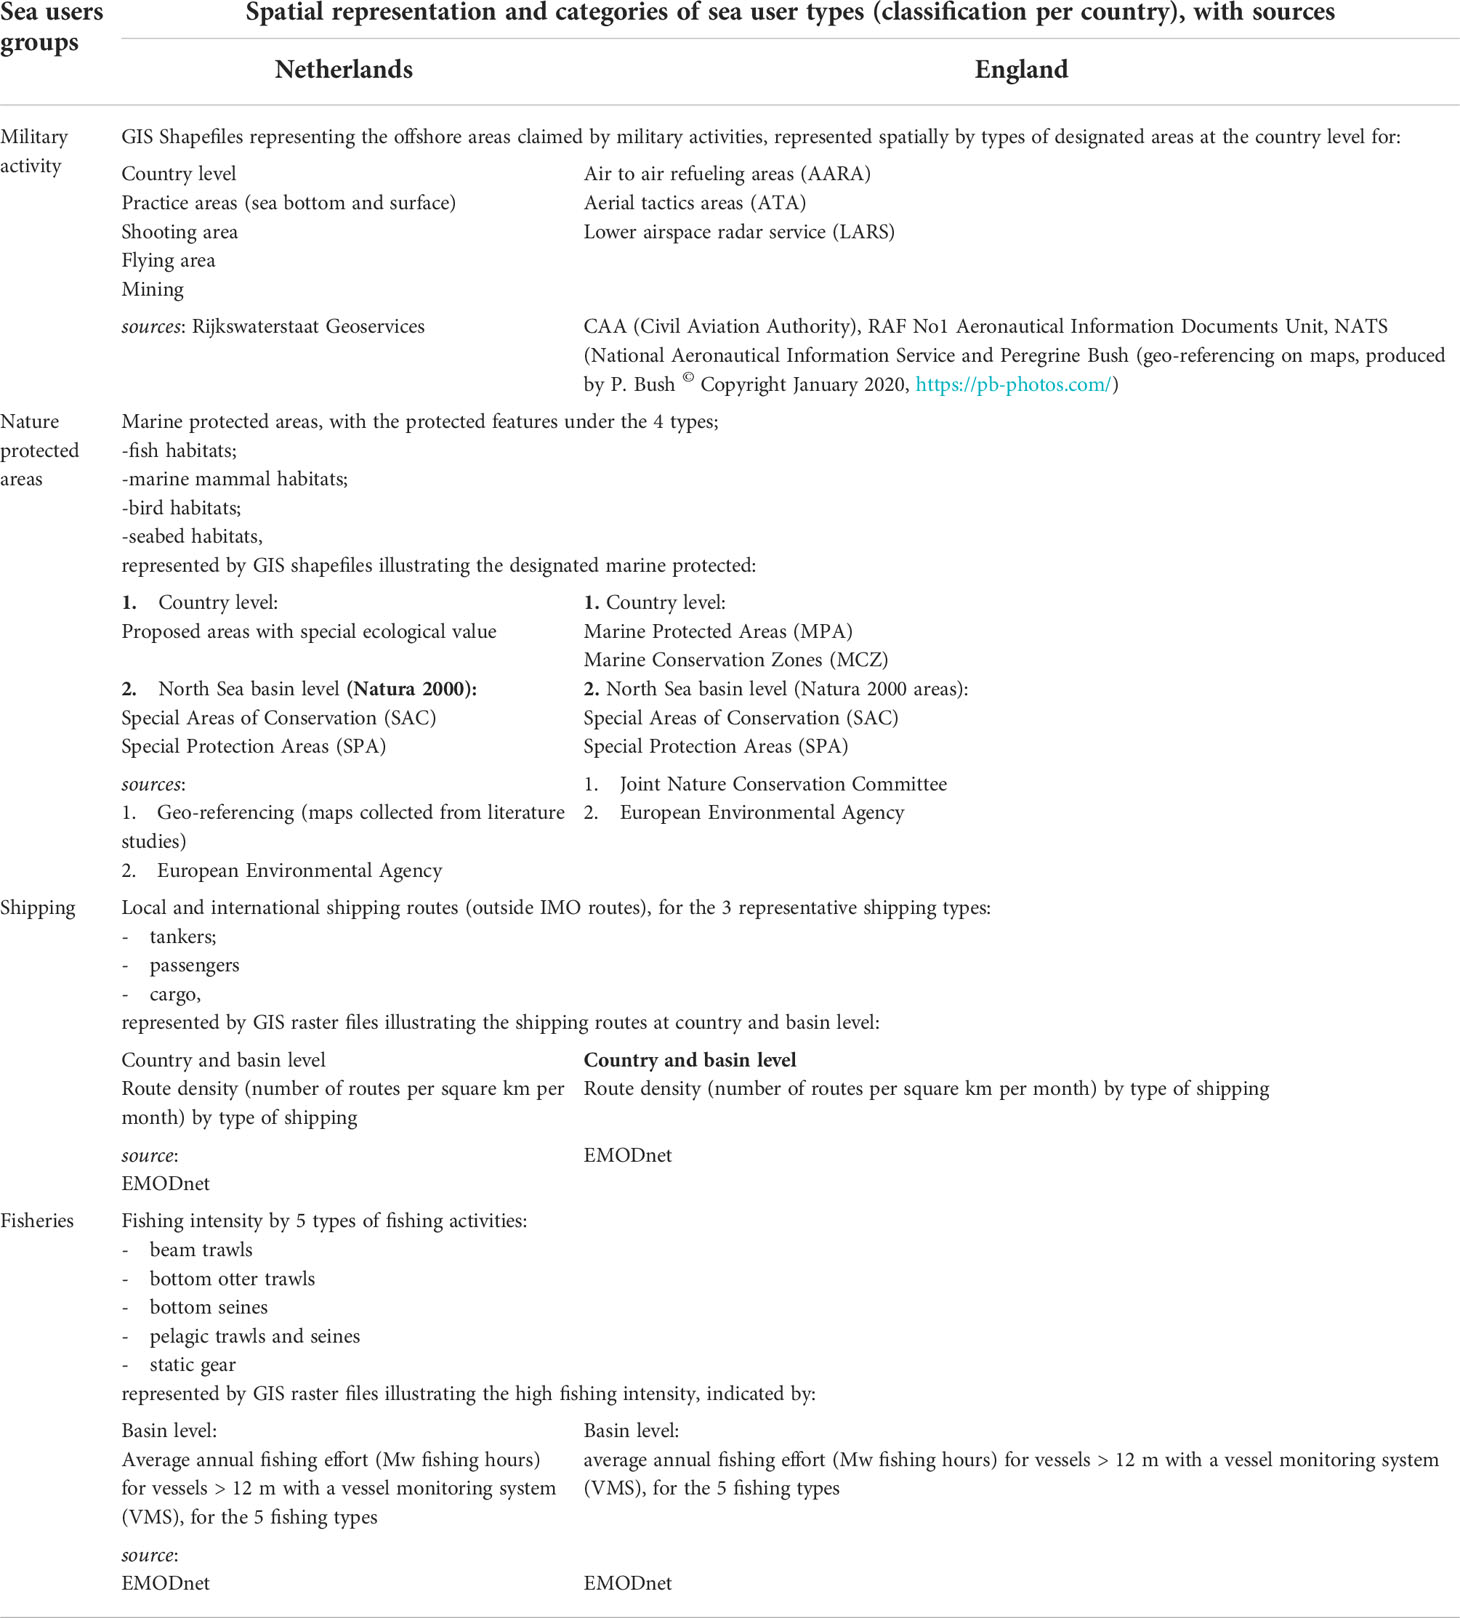
Table 2 Geo-spatial data base for the analyzed activities with used indicators.
In compiling the raster maps to display the areas of overlap, we used the QGIS raster calculator. We assigned the raster layers representing the presence of the analyzed sea user types the value 100 and calculated the difference with the scores representing the values of the OWF areas. This allowed us to show the spatial presence of different types of sea users within each activity group (fisheries types, protected features within nature protected areas, military activities, shipping types), in all areas of very-low/low to high value/importance for OWF deployment. The results are presented as separate maps by sea user group type (Supplementary Figure 2; i.e., for shipping activity group, we display the values for cargo, passenger and tanker).
Step 3. Qualification and quantification of conflicting claims offshore (average conflict score)
The degree to which offshore activities are (in)compatible is firstly influenced by the ability of involved activities to pursue their individual objectives (e.g., accessing resources, protection of valuable features, free navigational or aviation access), when sharing the same physical offshore space (spatially and/or temporally). Secondly, based on conflict resolution theories, compatibility is influenced by the degree in which conflict management strategies are available and feasible to settle (in some cases top-down imposed) or resolve conflicts (Alexander et al., 2013). On the other hand, negative effects of the interaction can be minimized or mitigated, an approach most commonly taken in the current offshore space management strategies (Dutch Central Government, 2009; Marine Management Organisation, 2020; Government of The Netherlands, 2021a). Thirdly, next to (in) compatibility, the difficulty of addressing potential negative impacts increases with the number of overlapping activities claiming the same physical space.
To express levels of (in)compatibility we qualify a site through a so called the average conflict score (ACS) and the number of overlapping activities. For developing an ACS, we first assign importance weights (as detailed in Methods Section 2.1.) to all risks identified in the interaction between an individual activity type and OWFs. The identified risks (Figure 3, R1-Rn, Supplementary Data 3) relate how reliant the activity is on important resources located in the area, the well-being and safety of operation, financial consequences of the interaction or, in the case of nature protected areas, impacts on the protected features (details in Supplementary Data 3). Per identified risk we subsequently assign a ‘Conflict rank’, which expresses the difficulty/ease of coping with the risk. We rely on three main conflict management strategies, commonly used in dealing with conflict resolution between offshore activities (Dutch Central Government, 2009; Government, 2011; Department for Environment Food and Rural Affairs, 2014a), namely 1) solving/avoiding the conflict, 2) minimizing the negative effects or 3) mitigating/compensating for the negative effects (Figure 3). For the assessment and assigning of ranks, we synthesize the techno-economic and management options for solving/minimizing/mitigating conflicts from best practices reports documenting implemented or tested options, guidelines from the policy side, management options proposed in the MSP documents, industry reports on impact assessment of OWF projects as well as scientific literature (Supplementary Data 3). If management options for solving or avoiding a risk are reliable (already implemented or successfully demonstrated), cost effective and based on readily available technologies in the short term (up to 2030), we assign the lowest Conflict Rank 1. If solving or avoiding is feasible but we have to rely on technology that is only likely to exist at a later point, or has higher costs, but demonstrates utility and necessity (create synergies between sea users that address sectoral or MSP goals), we assign Conflict Rank 2. If conflicts cannot reasonably be expected to be solved, we shift to the minimizing negative effects, implying a higher Rank. Depending on the reliability/feasibility of the management option, the implied estimated costs and the availability of involved technologies or procedures, we assign either Conflict Ranks 3 and 4. Last, if neither solving or minimizing are viable options, the requirements are that negative impacts are mitigated/compensated for, leading to Conflict Ranks 5 if this is possible and sensible and 6 if not (fully incompatible).
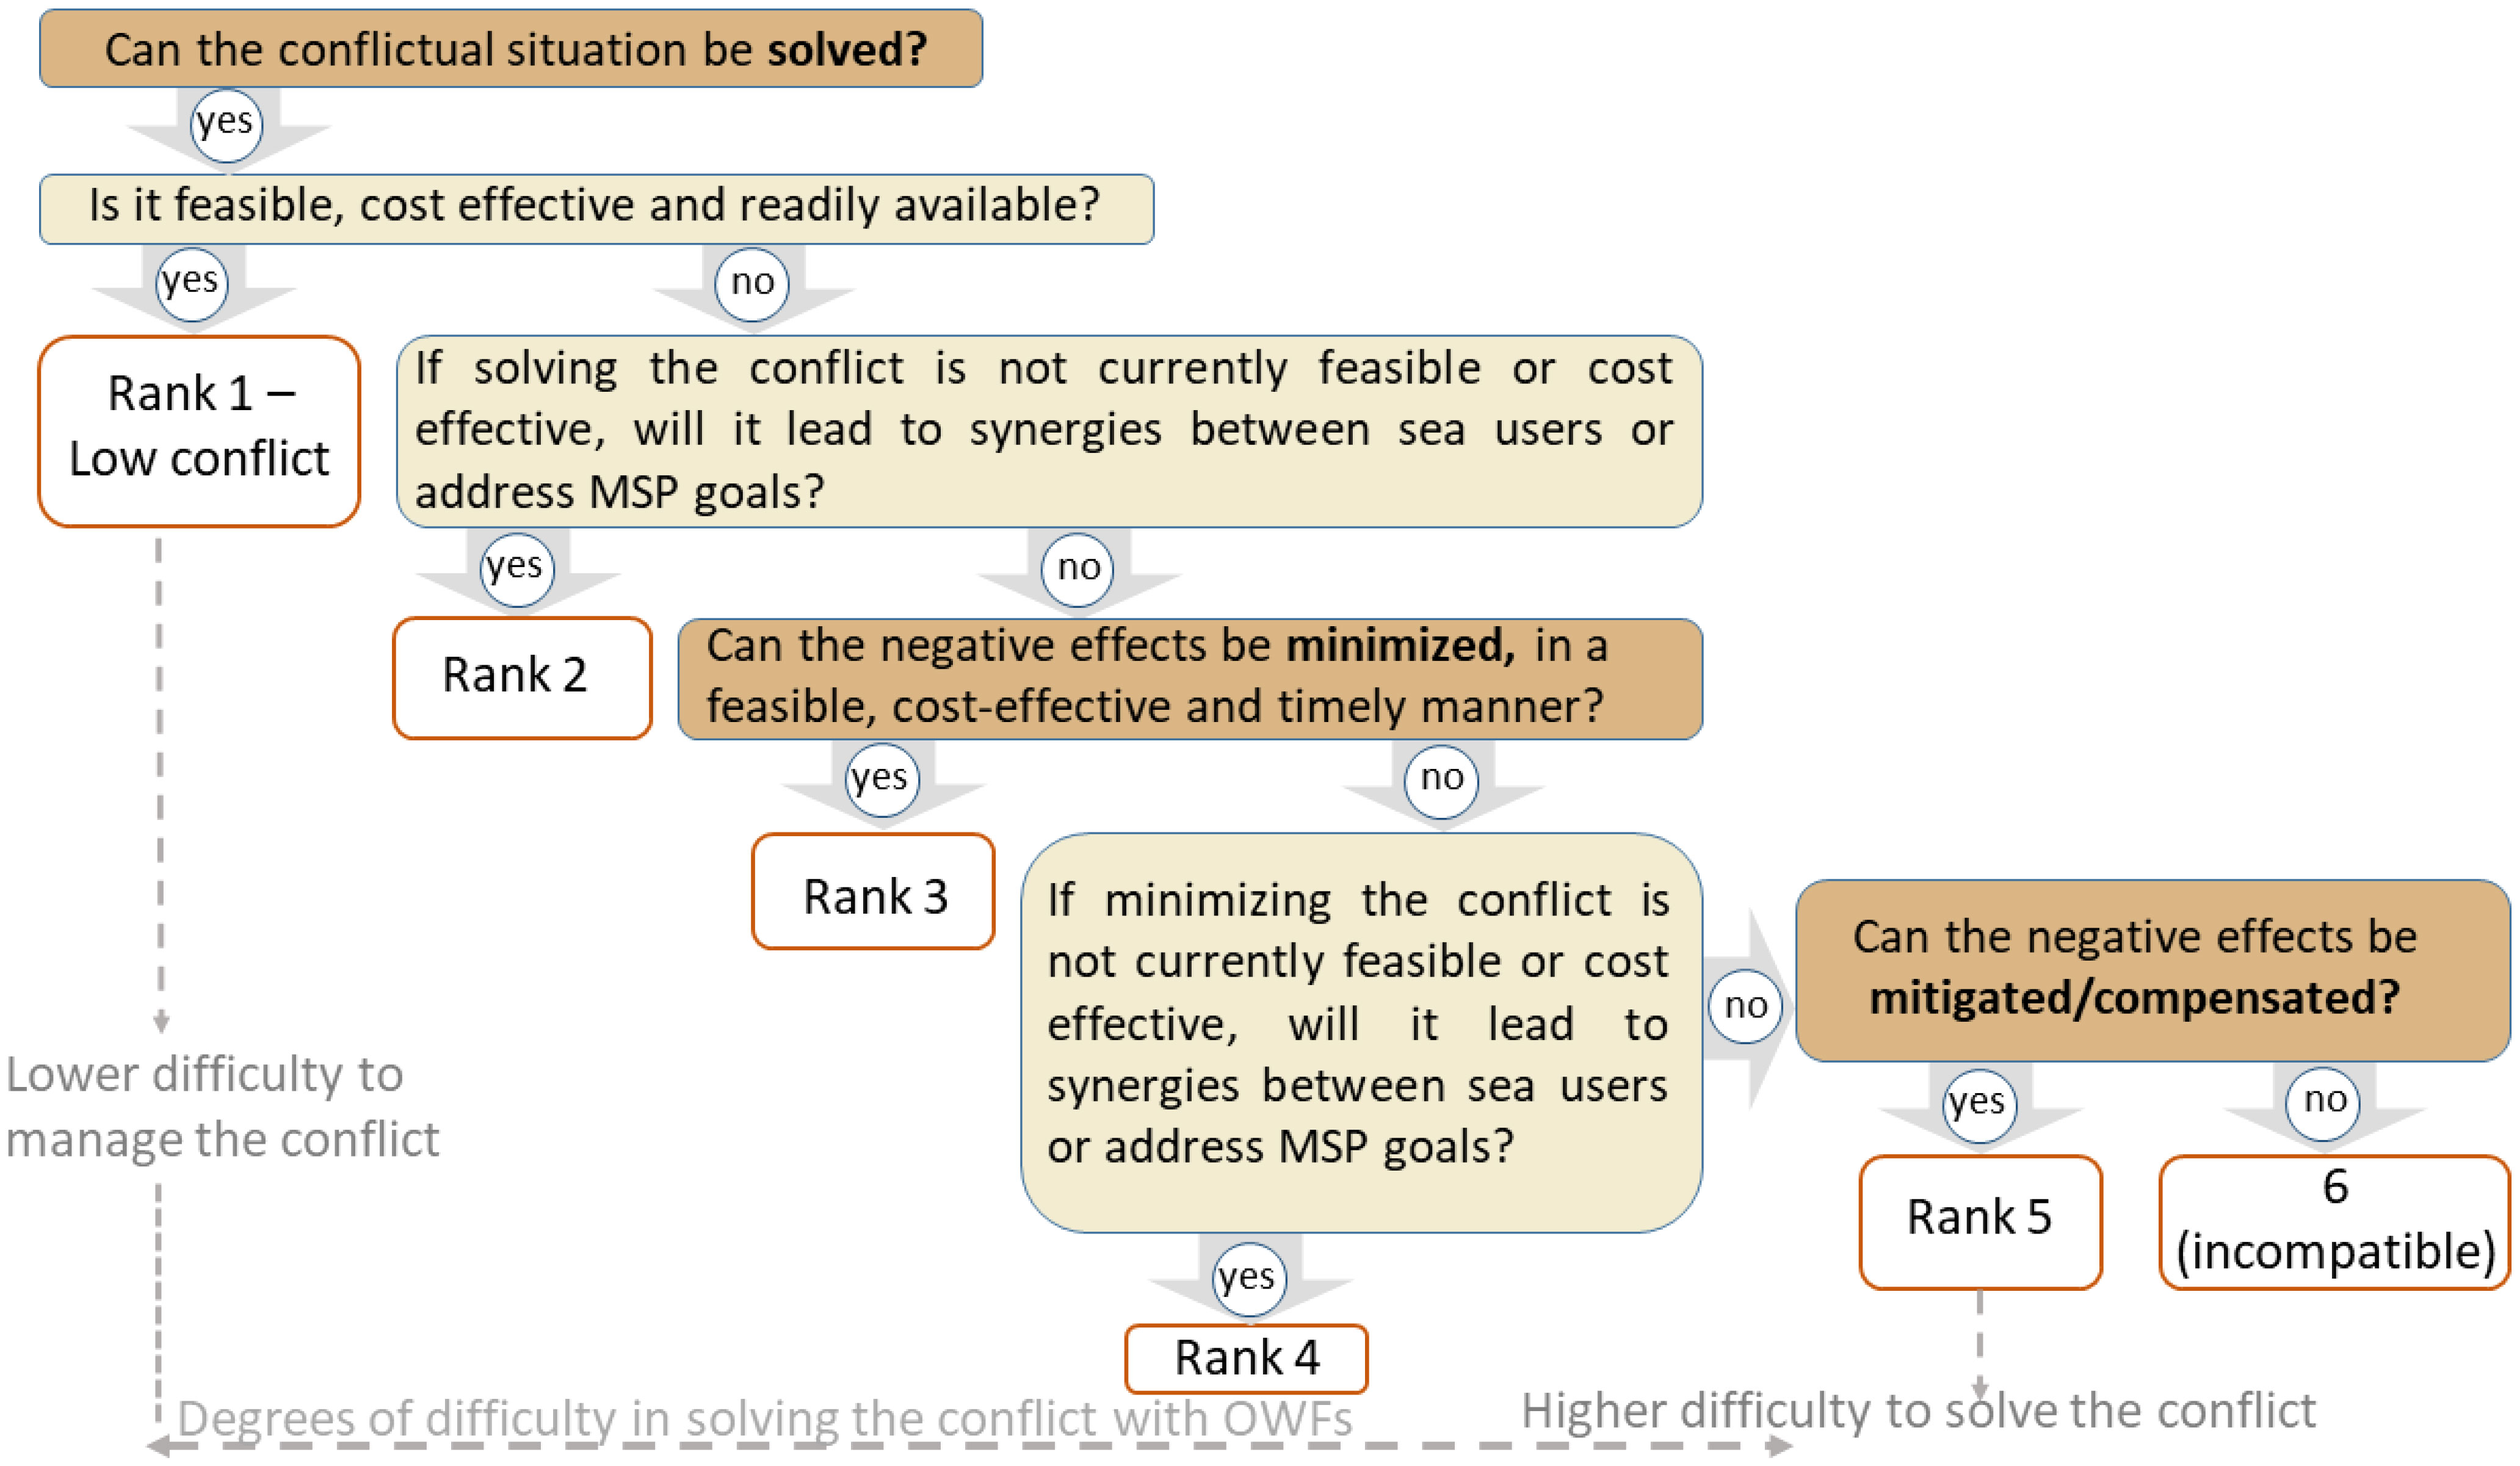
Figure 3 Spatial distribution (cumulated area of conflict) of conflicts (ACS) within the OWF valuable sites, for military activities sea user group types – England.
Calculating the ACS score on the interaction between OWF development and each individual activity type is based on multiplying the importance weight per each identified risk (R1 to Rn) regarding this interaction with the Conflict Rank related to this risk (Figure 3) and summing these together (Figure 4). This results in a final ACS for each of the distinct activity type. These final scores will be normalized for each activity type, by dividing the final activity type ACS by the highest ACS per activity type. The normalized ACS are used to spatially illustrate the areas with the different degrees of difficulty for conflict resolution. The formula used to calculate the normalized ACS score, following the sequence of steps presented in Figure 5, is therefore:
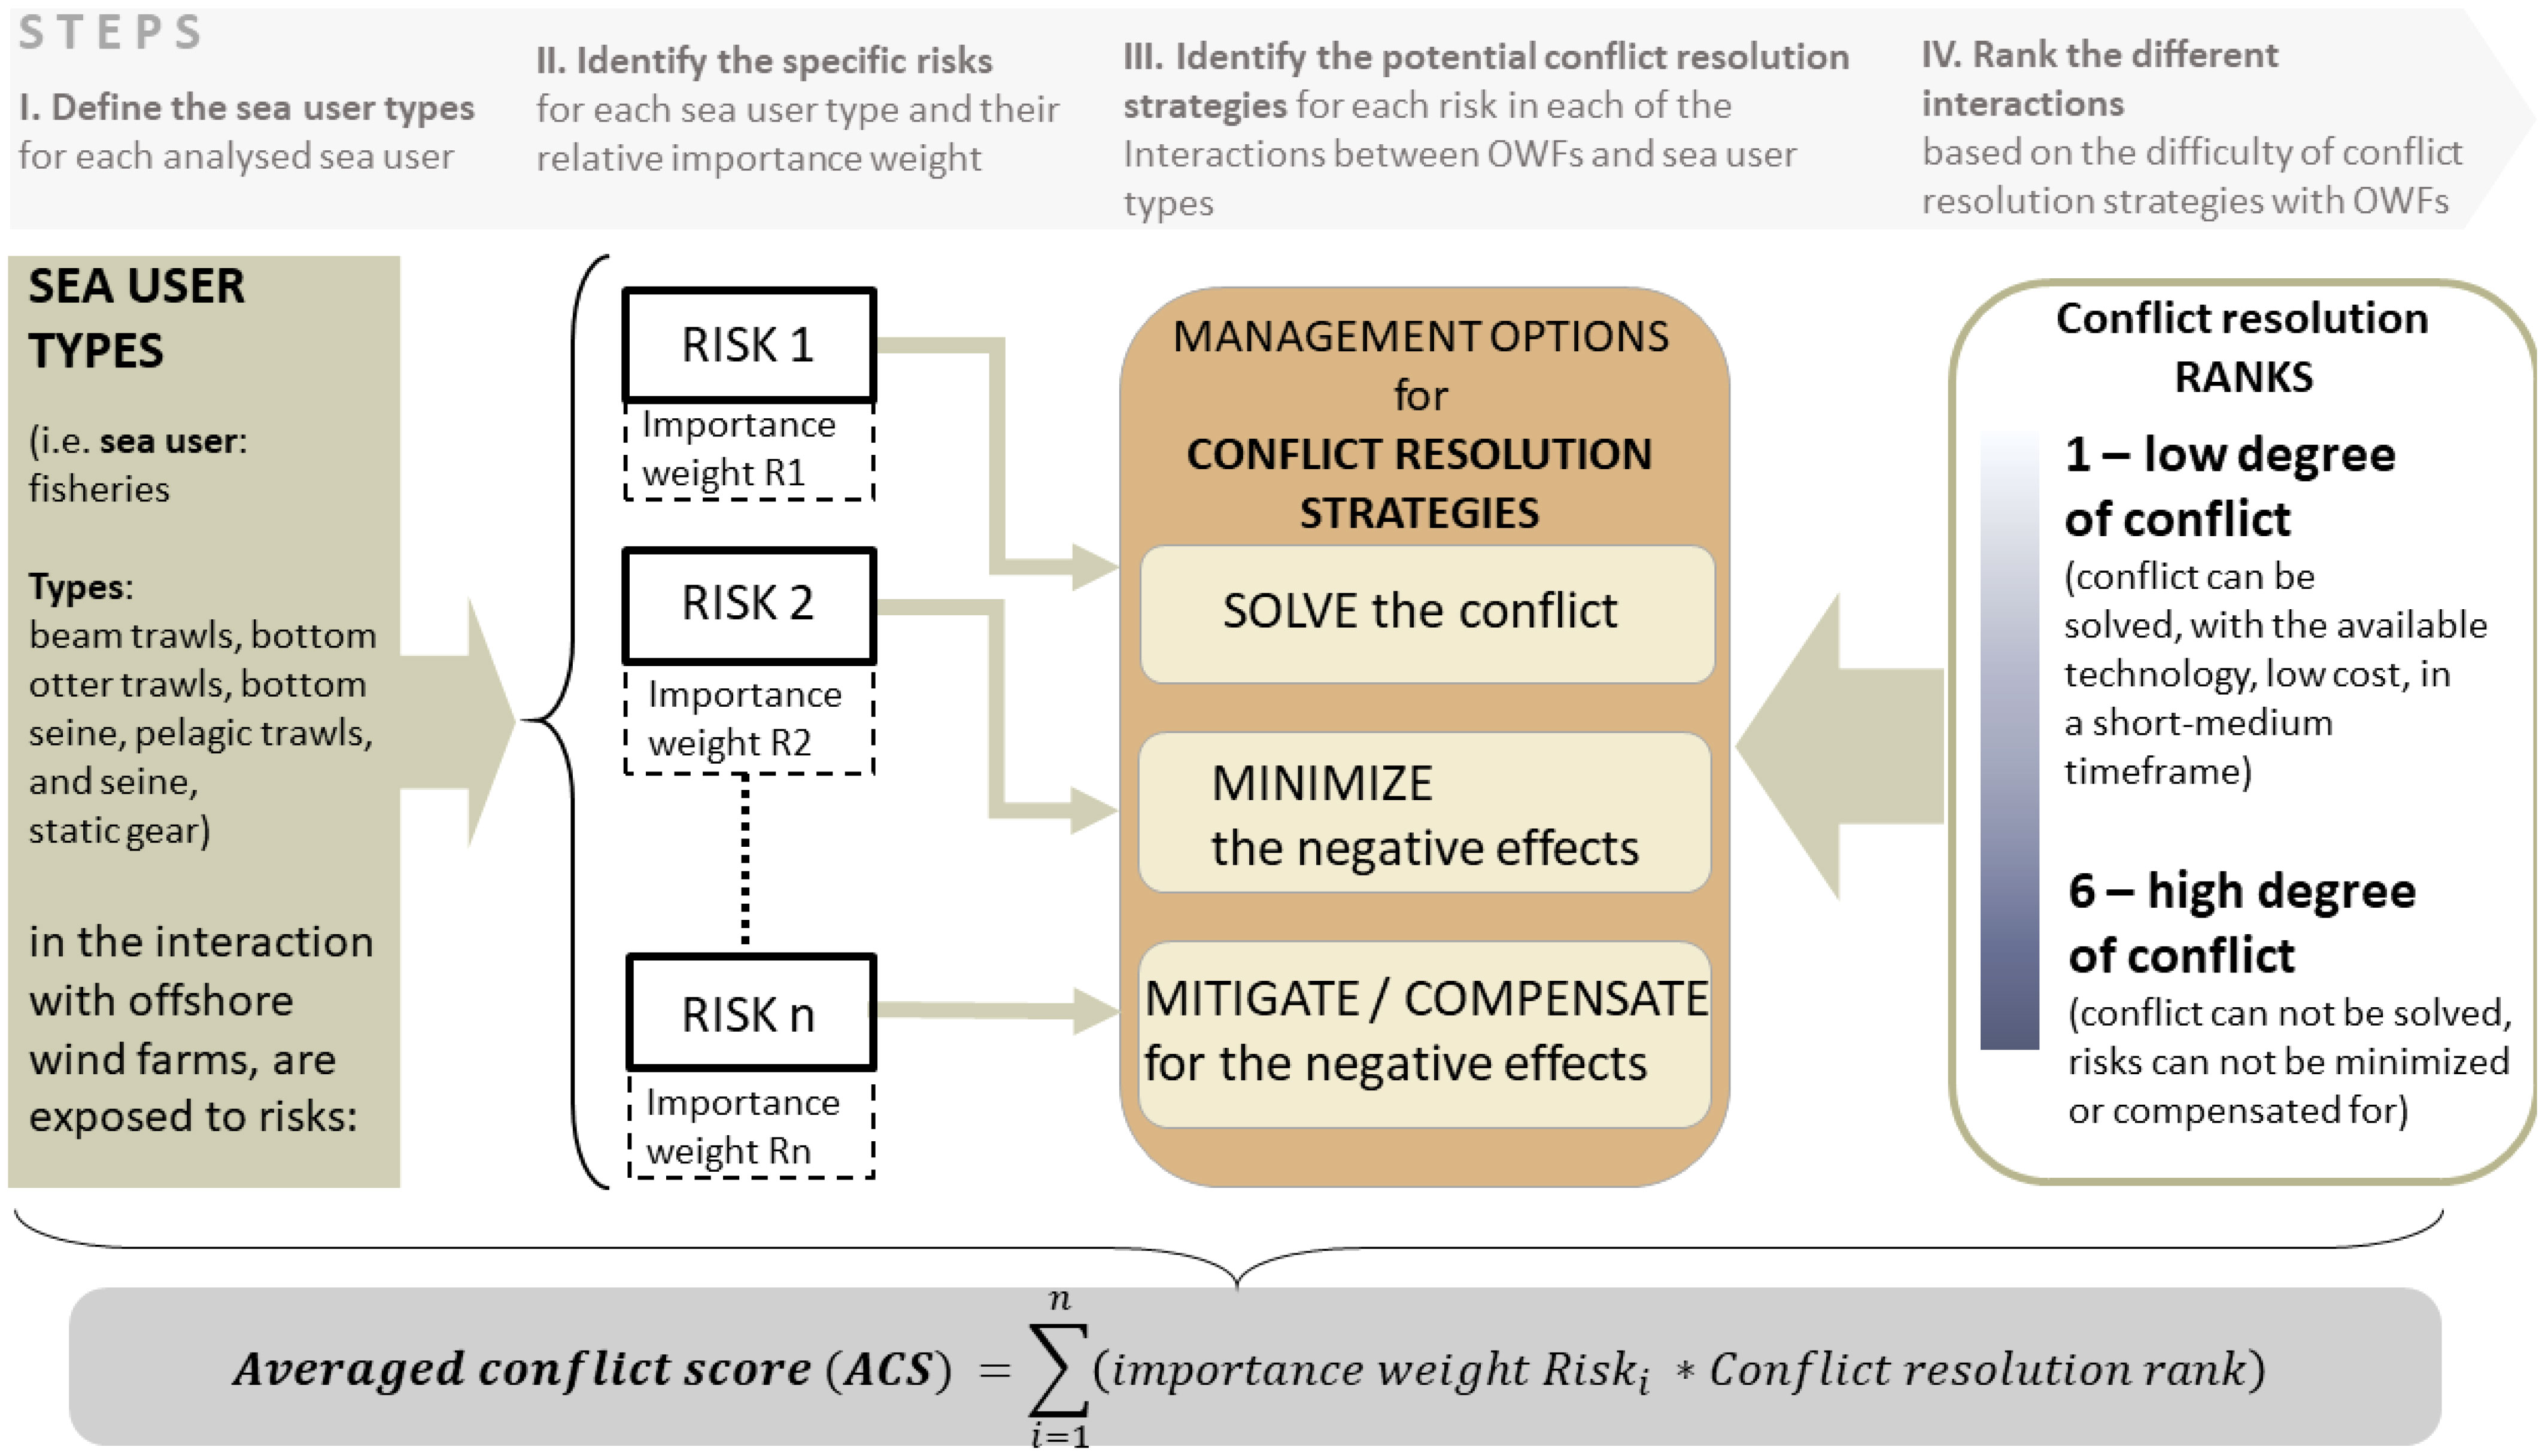
Figure 4 Framework of analysis to determine the conflict resolution rank (degree of conflict) for each specific identified risk of the interaction between sea user types and OWFs.
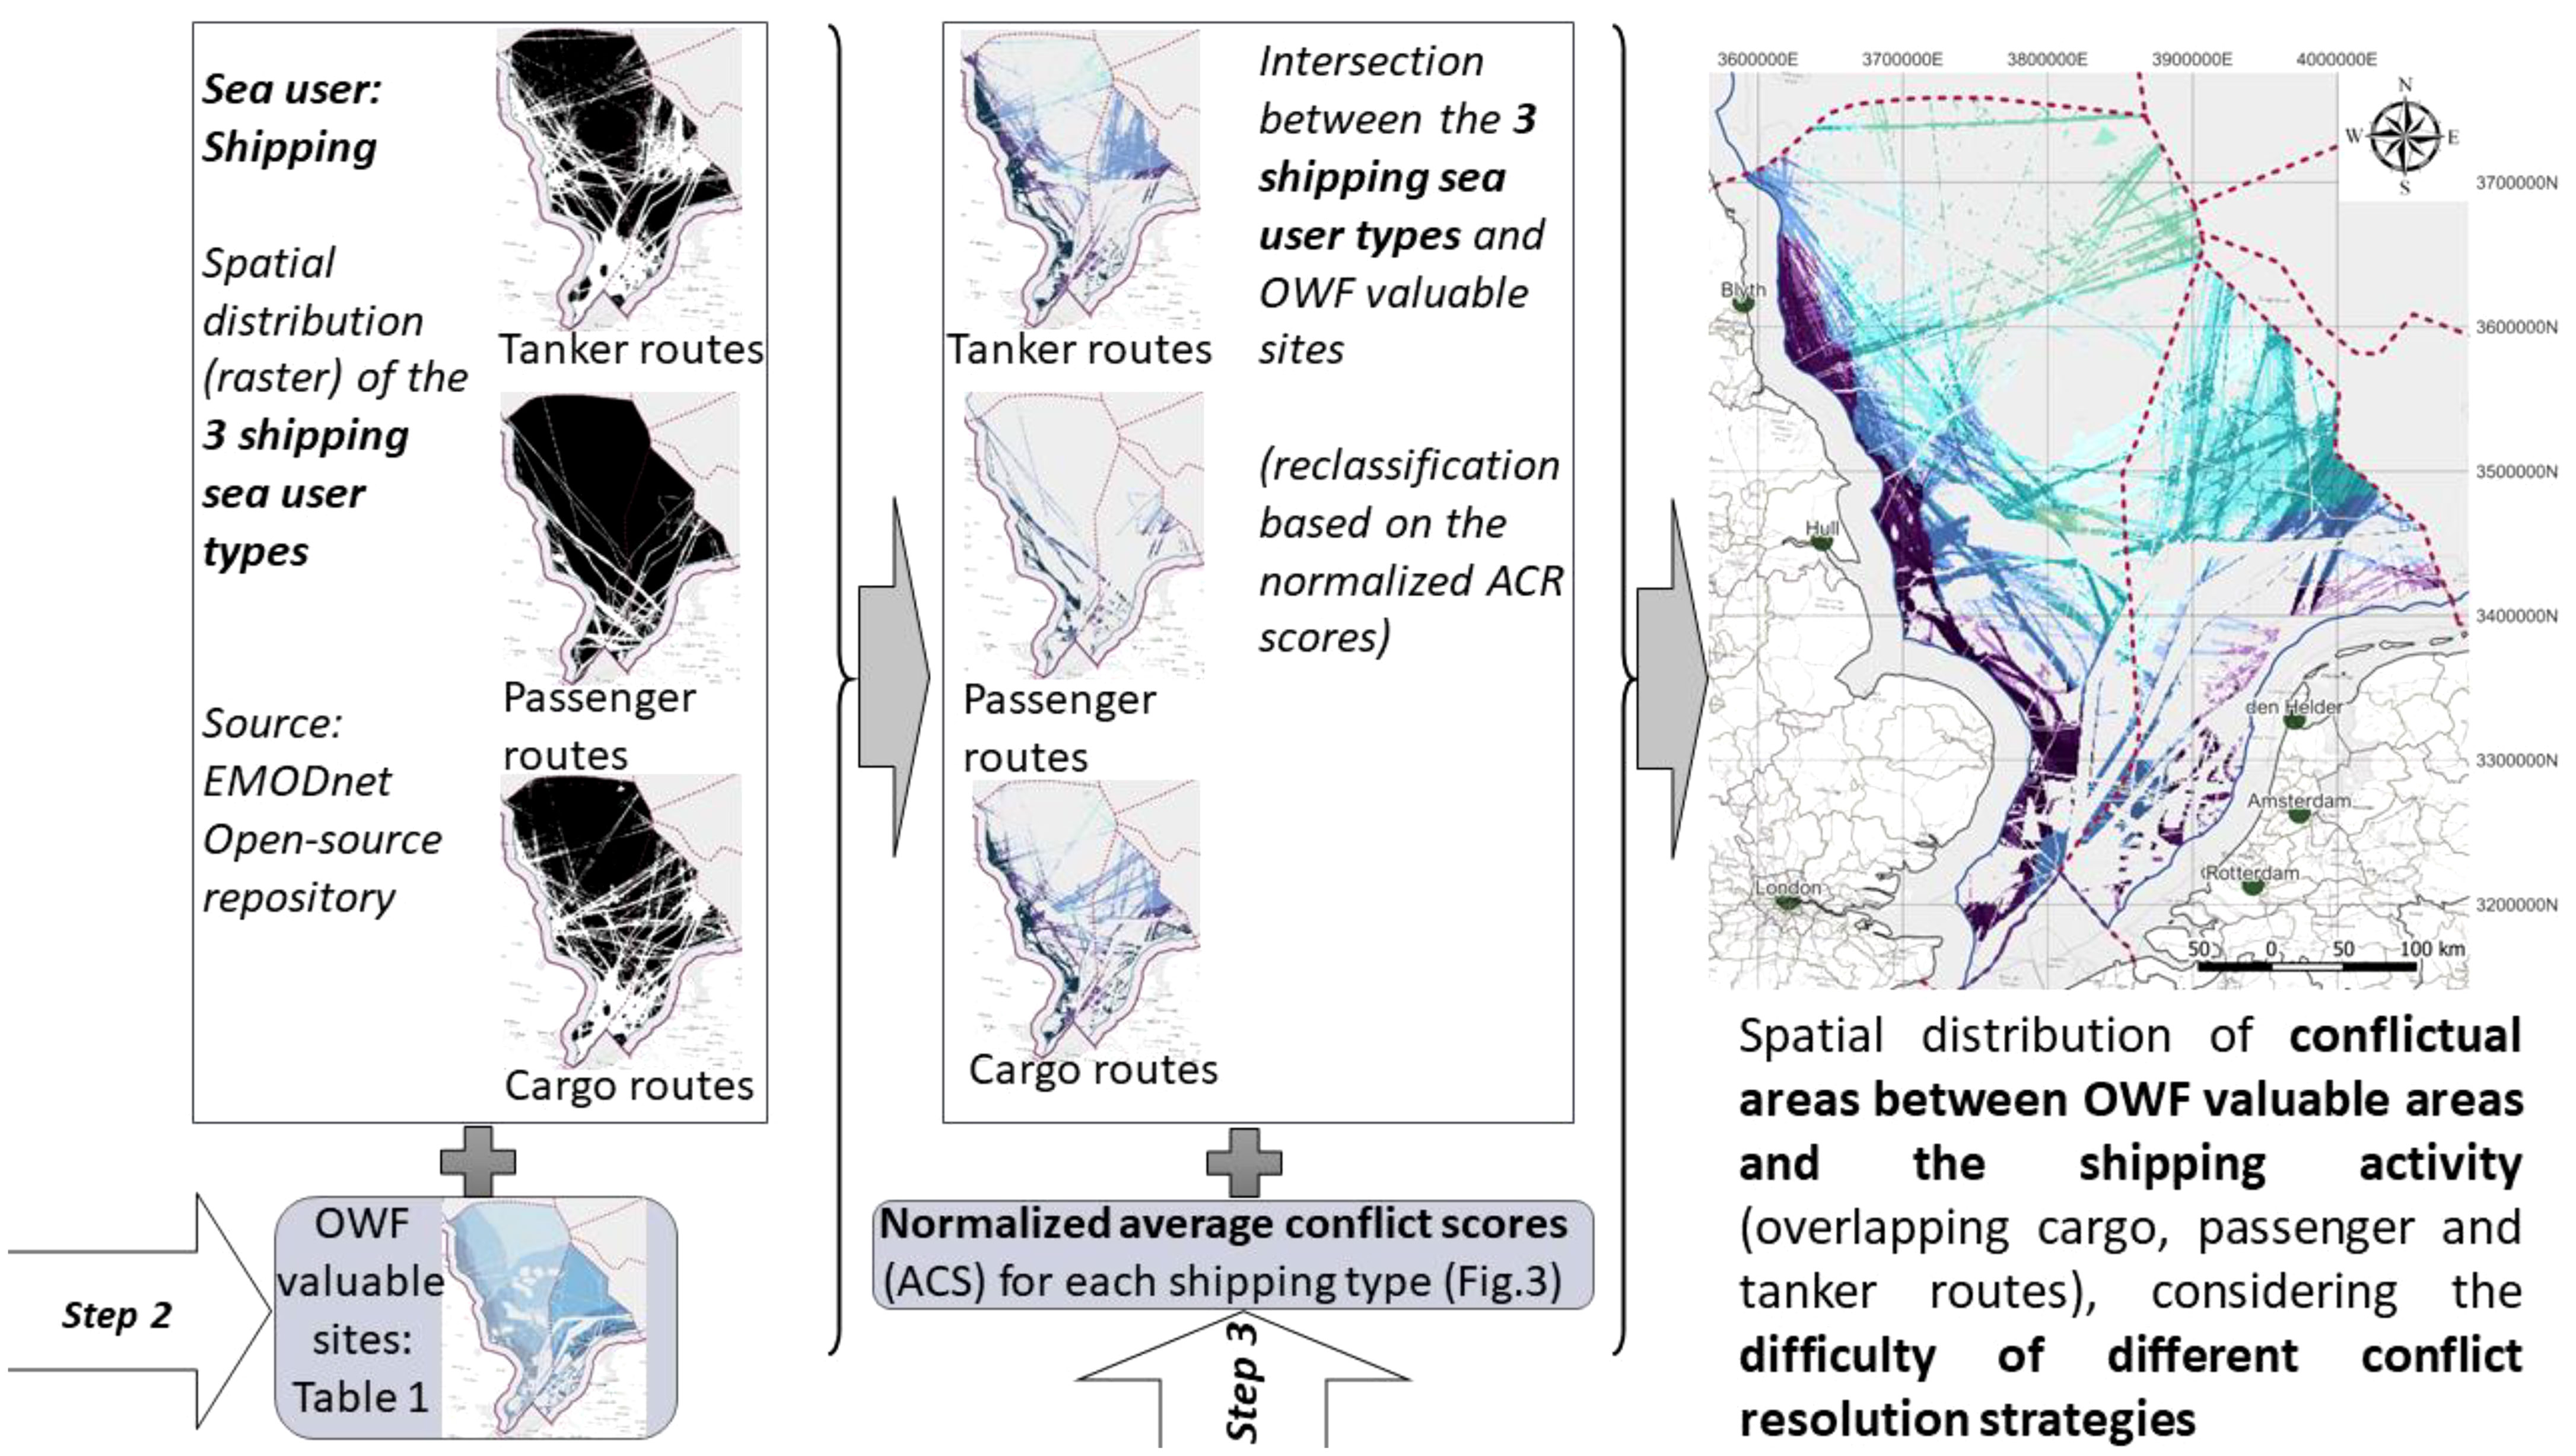
Figure 5 Sequence of steps to determine the average conflict resolution scores for each sea user type, based on the identified risks, conflict resolution strategies Supplementary Data 3) and respective conflict resolution ranks (Figure 4).
where max (ACS) is the maximum value of the respective sea user type.
The normalized ACS scores per activity type are input for mapping the intensity of offshore conflict across the EEZs per sea user group. To better indicate the differences between the different ACS scores, they are classified on a low/medium/high scale, with low accounting for low level of conflict and high for a high level of conflict with OWFs (matrix present in Supplementary Data 4). We then assign the classified ACS scores to the raster files representing the presence of the related activity type to the six categories of OWF valuable areas (Figure 5).
Per sea user group we use QGIS to identify for each cell (1 km2): (1) the category of OWF valuable area, (2) the number of overlaps with each activity type (1 or more) and (3) the ACS score per overlap (low, medium, high). The result is a range of different intensities of conflict per cell (km2), ranging from no conflict, limited conflict (i.e., low OWF value, overlap with 1 fisheries type and a low ACR score) to high conflict (i.e., high OWF value, overlap with 4 fisheries types and high ACR score). We subsequently quantify the spatial magnitude of different intensities of offshore conflict by calculating the size of their impacted areas (km2); i.e. resulting in tables that show per category of OWF valuable area the number of overlaps (1 or more), their related ACS scores (low, medium, high) and spatial magnitude in km2 (Supplementary Figure 1). Apart from presenting these tables, we will also show in our results section maps that visualize the locations of each possible degree of intensity of conflict listed in these tables, for the two EEZs (Figure 5).
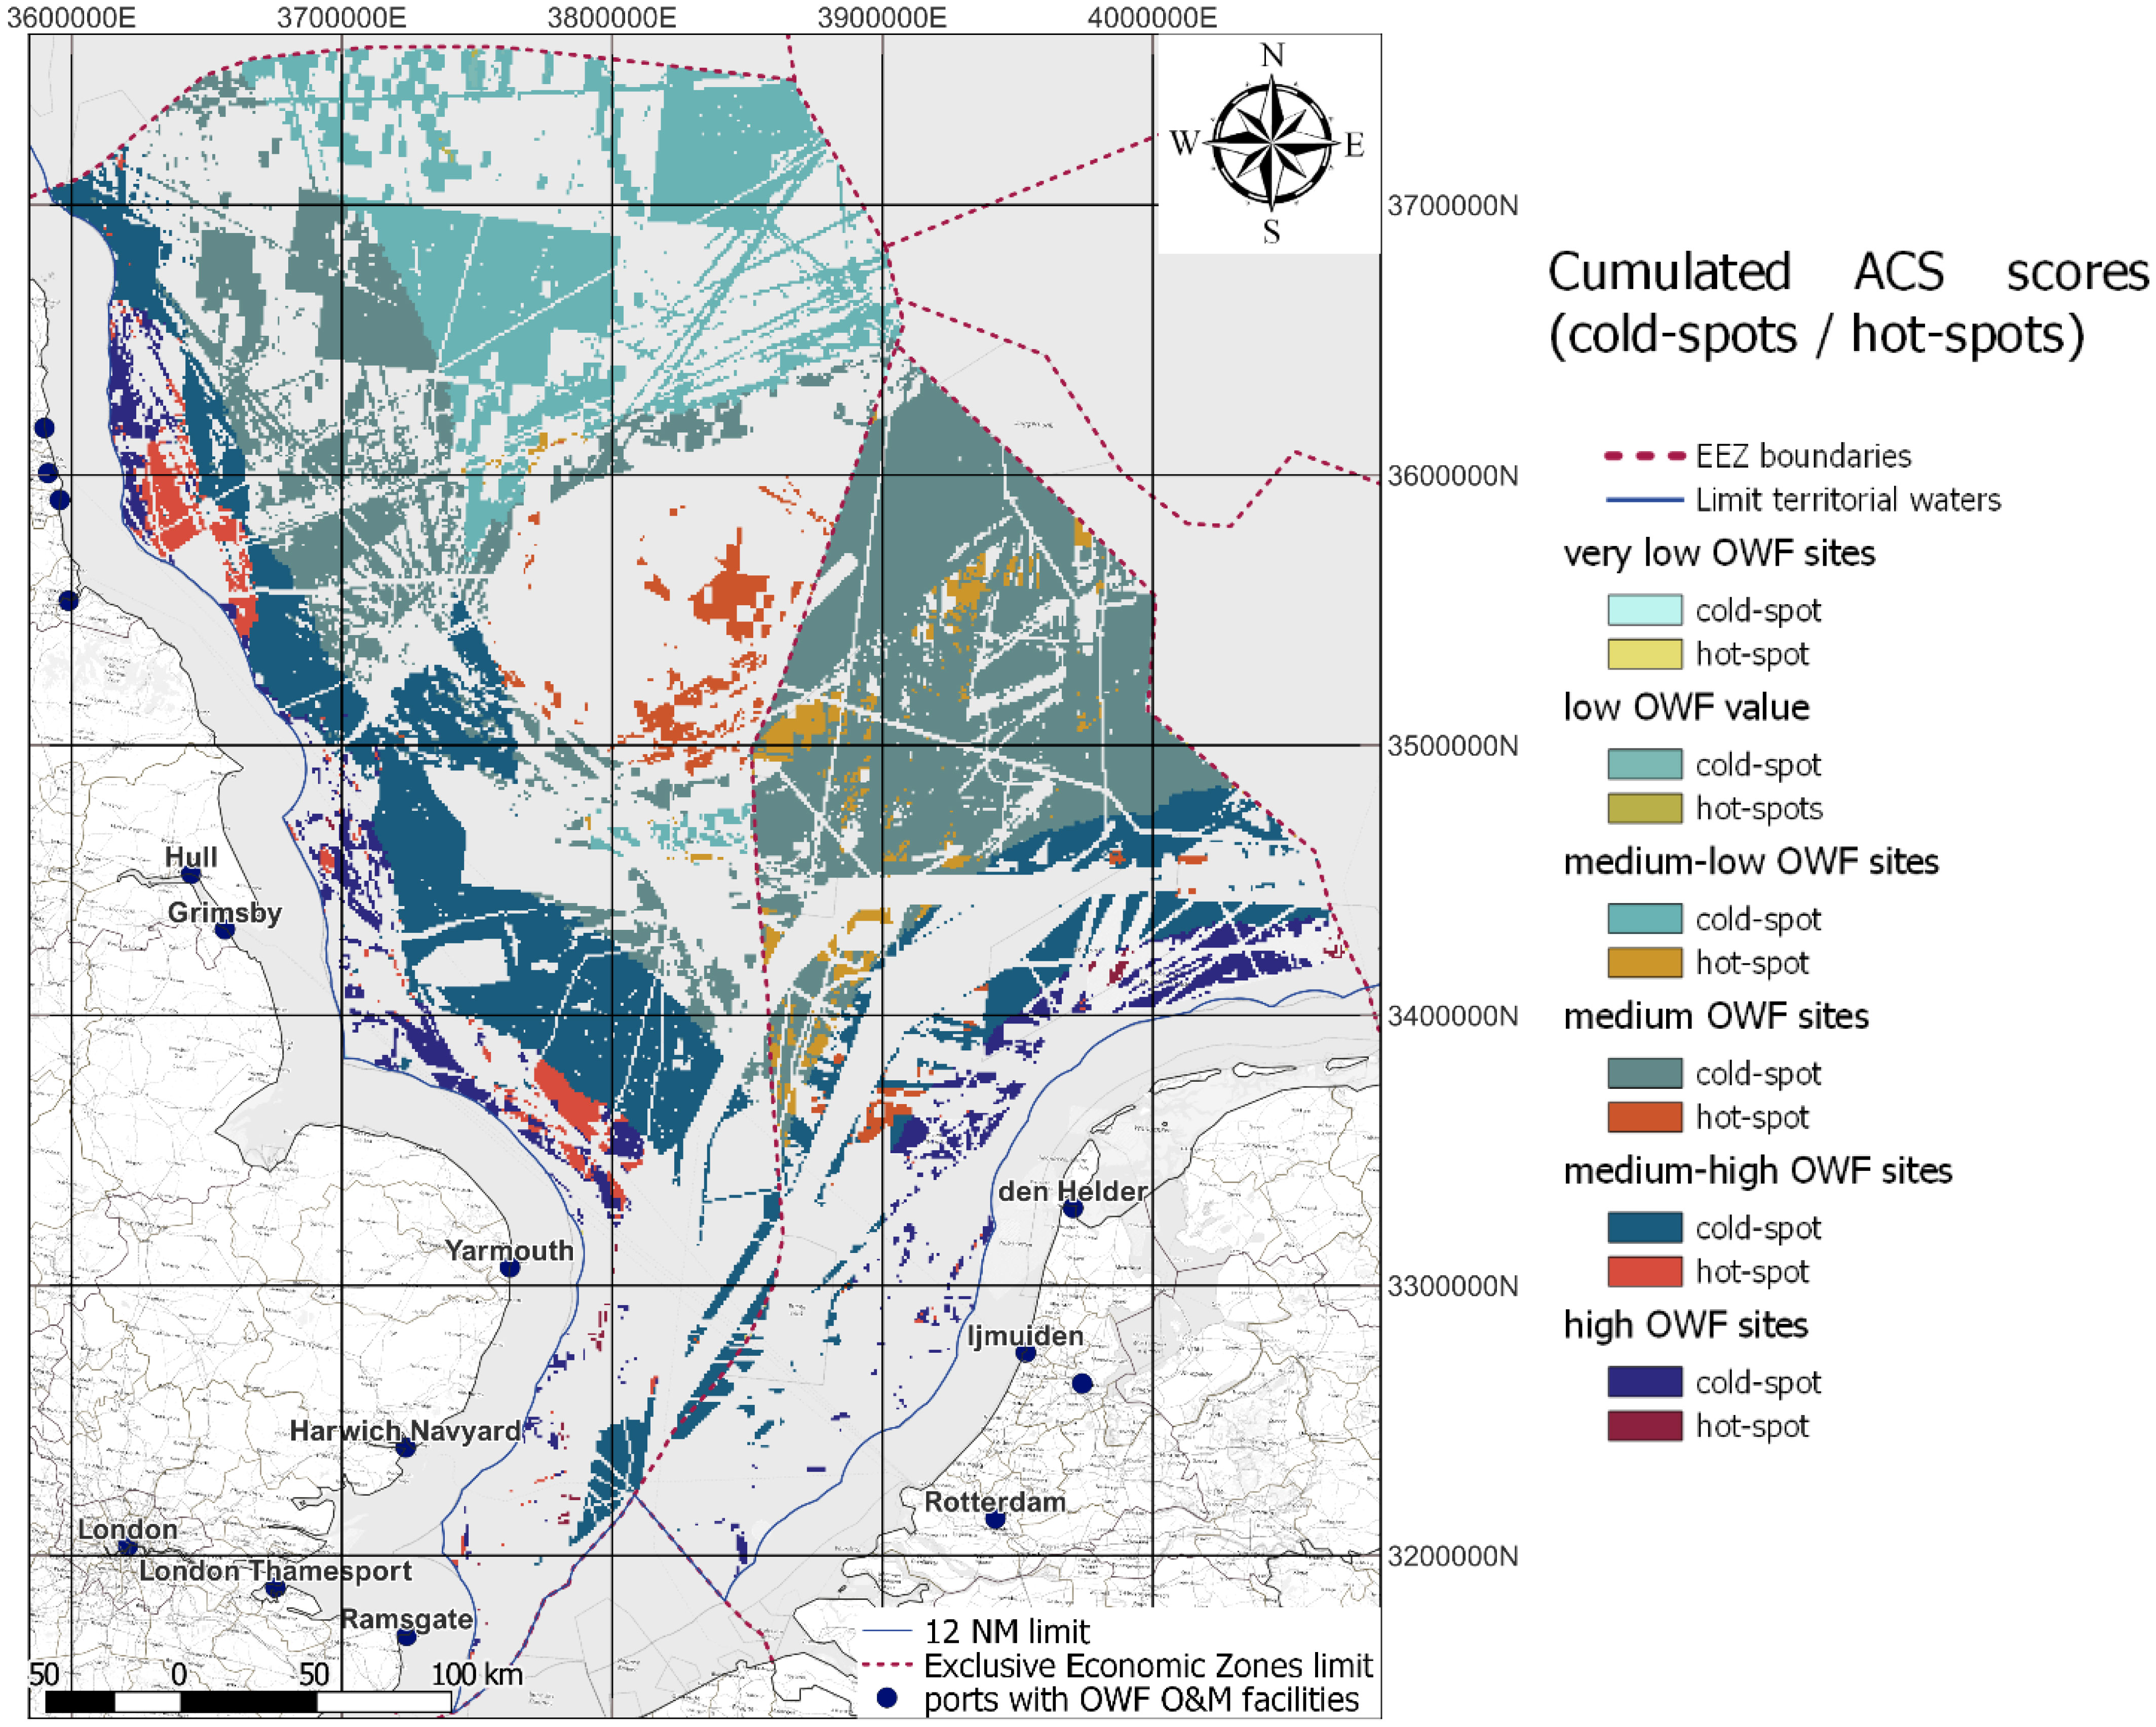
Figure 6 Sequence of steps to map the spatial distribution of conflictual areas by sea user, using the ACS score.
The pairwise assessment of interactions and conflicts offshore with OWF infrastructure offers a clear but simplified understanding of the complexity and diversity of interactions which could occur when overlapping all layers of sea users. We deliberately do not calculate intensities of conflict by combining all sea user types as we do not consider it sensible to assign weights per sea user group or simply consider these of equal importance. In addition, there is no sound academic basis to substantiate such weight factors. Nevertheless, we do spatially map possible hotspots and cold-spots of conflict when different sea user types overlap with valuable OWF sites (Figure 6).
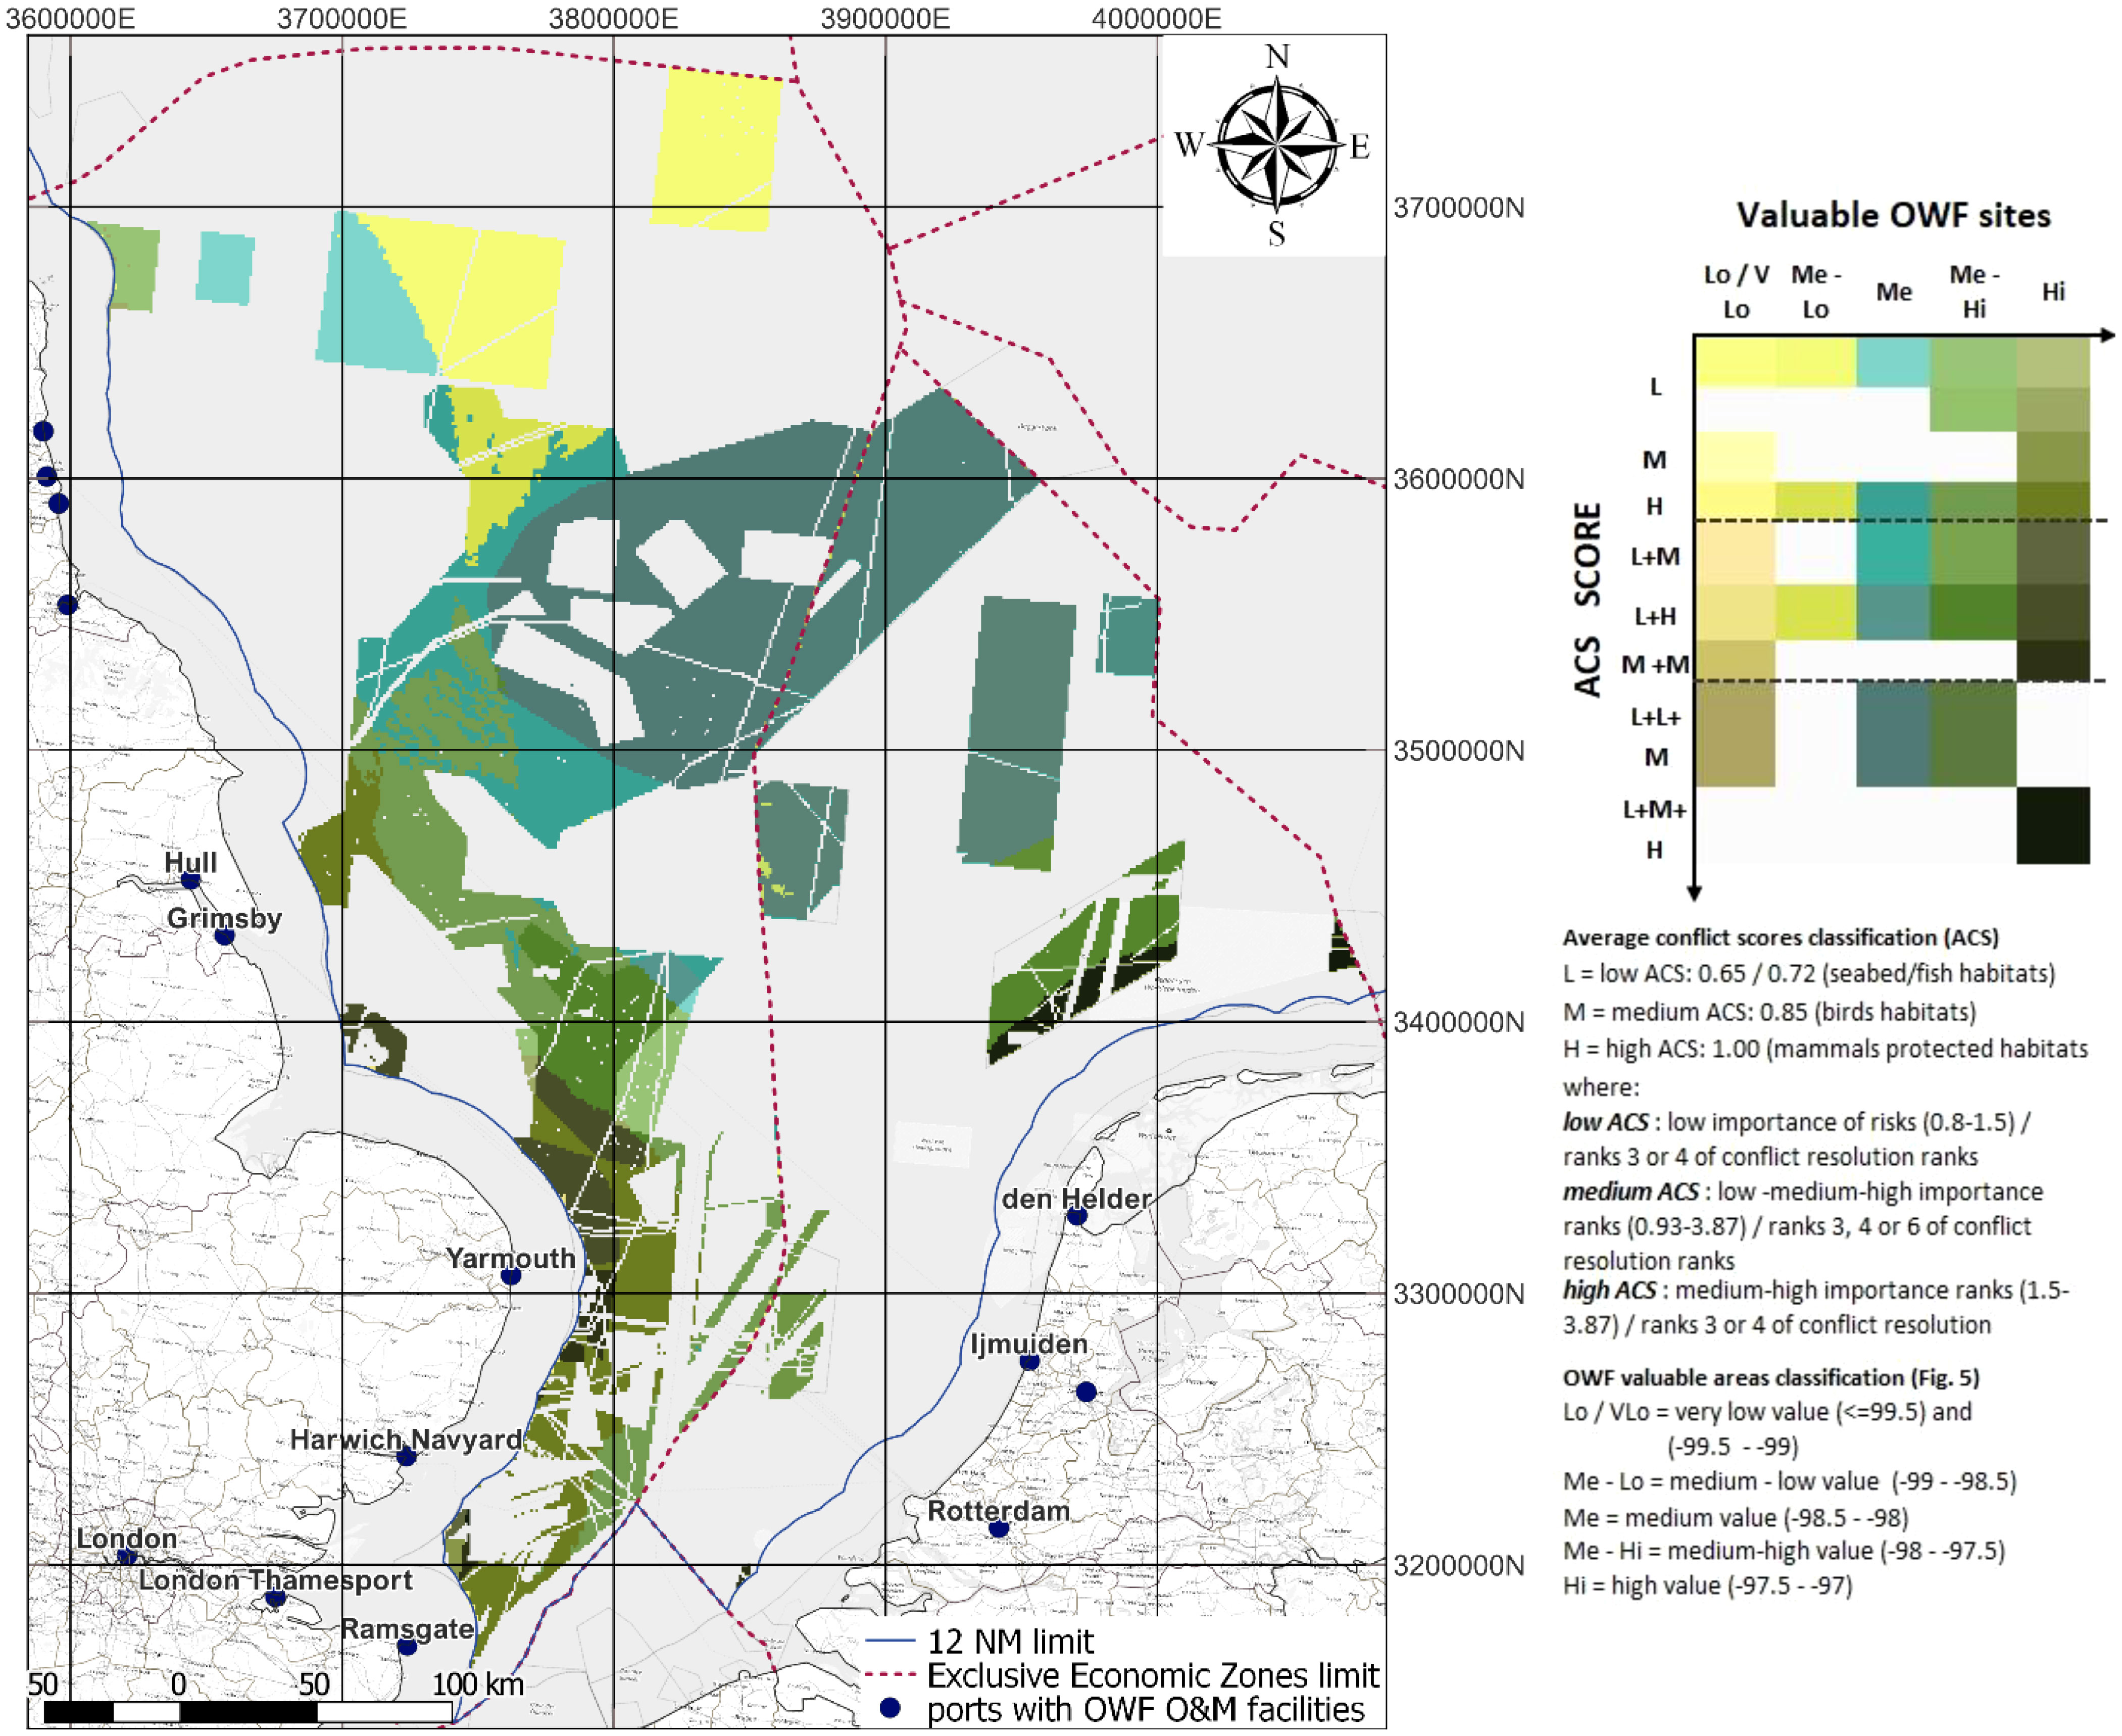
Figure 7 Spatial distribution (cumulated area of conflict) of conflicts (ACS) within the OWF valuable sites, for fisheries sea user group types.
The overlap between the different selected activity types in the four analyzed sea use groups with the five categories of OWF valuable sites resulted in 554 combinations for the English EEZ and 311 combinations for the Dutch EEZ. Using histograms (Supplementary Data 7) of the resulted ACS values of the cumulated overlaps (all sea user activity types and categories of OWF value sites), we map the cold-spots (lower 1/3 of histogram bins) and hot-spots (higher 1/3 of histogram bins) in Figure 6, to aggregate areas to be avoided (hot-spots) and areas with lower levels of conflict (cold-spots).
Results
Case studies
The case studies are the Dutch EEZ and the offshore areas corresponding to the East Offshore Marine Plan and North East Offshore Marine Plan areas within the English EEZ. The studied areas differ in size (approx. 49 997.6 km2 vs. 99 071.8 km2), show different degrees of intensities of use and have different offshore renewable energy targets (11.5 GWs(4) vs. approx. 29 GWs-when excluding Scottish targets (UK Department for Business Energy and Industrial Strategy [BEIS], 2020; Scottish Government, 2020) for 2030). Moreover, the two countries also differ in the speed of offshore wind farm deployment. The high number of cancelled projects (84 projects by 2018) and the substantial time delay in obtaining the approval to install and develop an OWF project of approx. 2 years (under previous regulations) (Salvador et al., 2018) in the Dutch EEZ is partly reflecting the conflicts with other sea users, in particular fishing activities and protected marine environment features (such as migratory routes). As a result, The Netherlands is still lagging behind the other North Sea countries in reaching its offshore renewable energy targets, underlining the need for managing the offshore conflicts. As also underlined by the recent Climate Agreement (Government of the Netherlands, 2019), The Netherlands is one of the North Sea countries with high incentives to seek sustainable solutions for managing the scarce offshore space, and it has been aiming to achieve this through a cross-sectoral participation process. Recently, more innovative solutions include the “area passports”, which are describing current users and potential forms of future multi-use in the area (de Koning et al., 2021).
On the other side of the spectrum, the UK (and in particular England) has the highest installed capacity in the North Sea basin of 8.1 GWs of which 7.2 GWs (fully commissioned) in the English EEZ. This has been facilitated not only by the improved clarity of the consent procedure for OWFs, by reducing the agencies involved and consents required, but also by the reduced timeline of the authorization process, with a processing time of 18 months, third fastest after Scotland and Denmark (Salvador et al., 2018). Another particular aspect which could play an important role in the high share of UK installed capacity among other North Sea countries is the high acceptance of locating OWFs in protected areas, especially in the shallow waters of the EEZ.
Furthermore, while the two countries have similar objectives and visions for the management of the offshore space, there are notable differences in the preferred spatial allocation options for the interaction between OWFs and other activities. While in the English case the multi-use option with fisheries, nature protection areas and military activities is encouraged (Andrew Gill et al., 2020; Marine Management Organisation, 2021; Ørsted, 2021), up until the current Dutch MSP2, the preferred space allocation option was single-use. The single-use strategy, however, is not always a feasible option in the highly claimed EEZs of the Netherlands and overlooks potential benefits of combining uses, where possible, such as enhancing the fish stock or contributing to the regeneration of the marine environment. Accessing the high value sites for OWFs in the Dutch and English EEZ areas (Figure 2), will require a clear understanding of the main trade-offs (risks/losses, opportunities/gains) in the offshore interactions.
OWFs- nature protected areas
Under the Marine Strategy Framework Directive (MSFD) (European Parliament and Council, 2008), the main marine environmental goals are to achieve the GES (Good Environmental Status), which implies safeguarding the marine biodiversity, the biological boundaries of commercially exploited fish species, the normal abundance and distribution of the food web, and that the seabed integrity is under acceptable limits and the human pressures are under control (Department for Environment Food and Rural Affairs, 2014b). For the North Sea countries, the sustainable economic development needs to align with measures for maintaining or restoring the GES of the marine environment, hence, limiting, protecting, conserving and recovering the losses produced by human activities (Dutch Central Government, 2009; Government, 2011; Department for Environment Food and Rural Affairs, 2014a). In achieving this, a number of Natura 2000 areas across the North Sea basin (Marine Protected Areas-MPA, Special Areas of Conservation-SAC, Special Protection Areas-SPA) have been designated with the aim to create a coherent network of protected areas at sea. In defining the risks of interaction with the OWF related activities, we use the MSFD defined qualitative descriptors for determining GES, grouped in an indicative list of characteristics, pressures and impacts (such as physical loss, interference with hydrological processes, biological disturbance) (European Parliament and Council, 2008).
As a base rule, following the precautionary principle, no activities with a risk of significant ecological effects, including the installation of OWFs, are allowed in the Natura 2000 areas of the Dutch part of the North Sea, unless no other realistic alternatives are available and there is a pressing reason of overriding public interest (Dutch Central Government, 2009) (Supplementary Data 5-Marine protected areas).The English take a more flexible approach, with planning authorities assessing both positive and negative environmental impacts of the new developments, on an area-based approach (Government, 2011). Therefore, there is flexibility of criteria used in the selection or de-selection of the protected marine areas, while cumulative impacts are assessed for the entire timeline of the proposed projects. The flexibility of the policy is aiming at increasing the resilience of the marine environment and at enabling the adaptive management to help mitigate the negative impacts on the environmental features, due to human pressure and climate change (Department for Environment Food and Rural Affairs, 2014a). Therefore, while both countries seriously constrain OWFs within nature protection areas, the English approach is increasingly aiming towards adaptive planning and area-based approach, allowing the installation of OWFs in the MPAs, SACs or SPAs.
The more flexible English approach considers synergies between different climate change actions, namely the production of renewable energy offshore and the objective of recovering the degraded maritime areas (Department for Environment Food and Rural Affairs, 2014a). There is also growing scientific evidence that the installation of structures within the marine areas may enhance the local habitat (creation of new substrate, enhancing the fish diversity and biomass) over a longer period of time (Government, 2011). In the English EEZ, the multi-use with nature protected areas has led to the allocation of space of a large number of OWFs in already designated protected areas, where projects initiators are required to demonstrate that negative effects on the conservation objectives of marine protected areas, if occurring, were either minimized or mitigated. While more prudent, in the Dutch EEZ the “building with nature” concept has also been more recently promoted even inside ecologically valuable or vulnerable areas. Currently the Dutch see this only as an option if no other realistic alternatives are available and when negative effects will be minimized, mitigated or compensating measures will be taken (Dutch Central Government, 2009; Government of The Netherlands, 2021a).
Marine protected areas (MPAs, MCZ, SPA, SAC), have been designated for different protected features, namely seabed habitats, marine mammals, seabirds, fish species, each with specific conservation objectives (Supplementary Data 6). The interaction with the valuable OWF areas, the degree of conflict (given by the average conflict score and area of overlap) and the cumulative claims (number of overlaps) are presented in the table and maps below. The interpretation of results is facilitated through the ordinal classification of OWFs sites into 5 ranks, from very low/low (least valuable) to high (most valuable), as well as the ordinal classification of ACS scores of interaction by ranking from low (conflict with low risks that can be solved or effects minimized) to high (conflict with high risks that can be mitigated/compensated), for each interaction OWF-sea user group. The potential conflict resolution strategies are presented in Supplementary Data 3. The geo-spatial overlap between OWF valuable areas in the 5 categories and the different types of protected areas is presented in Supplementary Figure 2, and the cumulated ACS scores per grid cell are mapped in Figure 7.
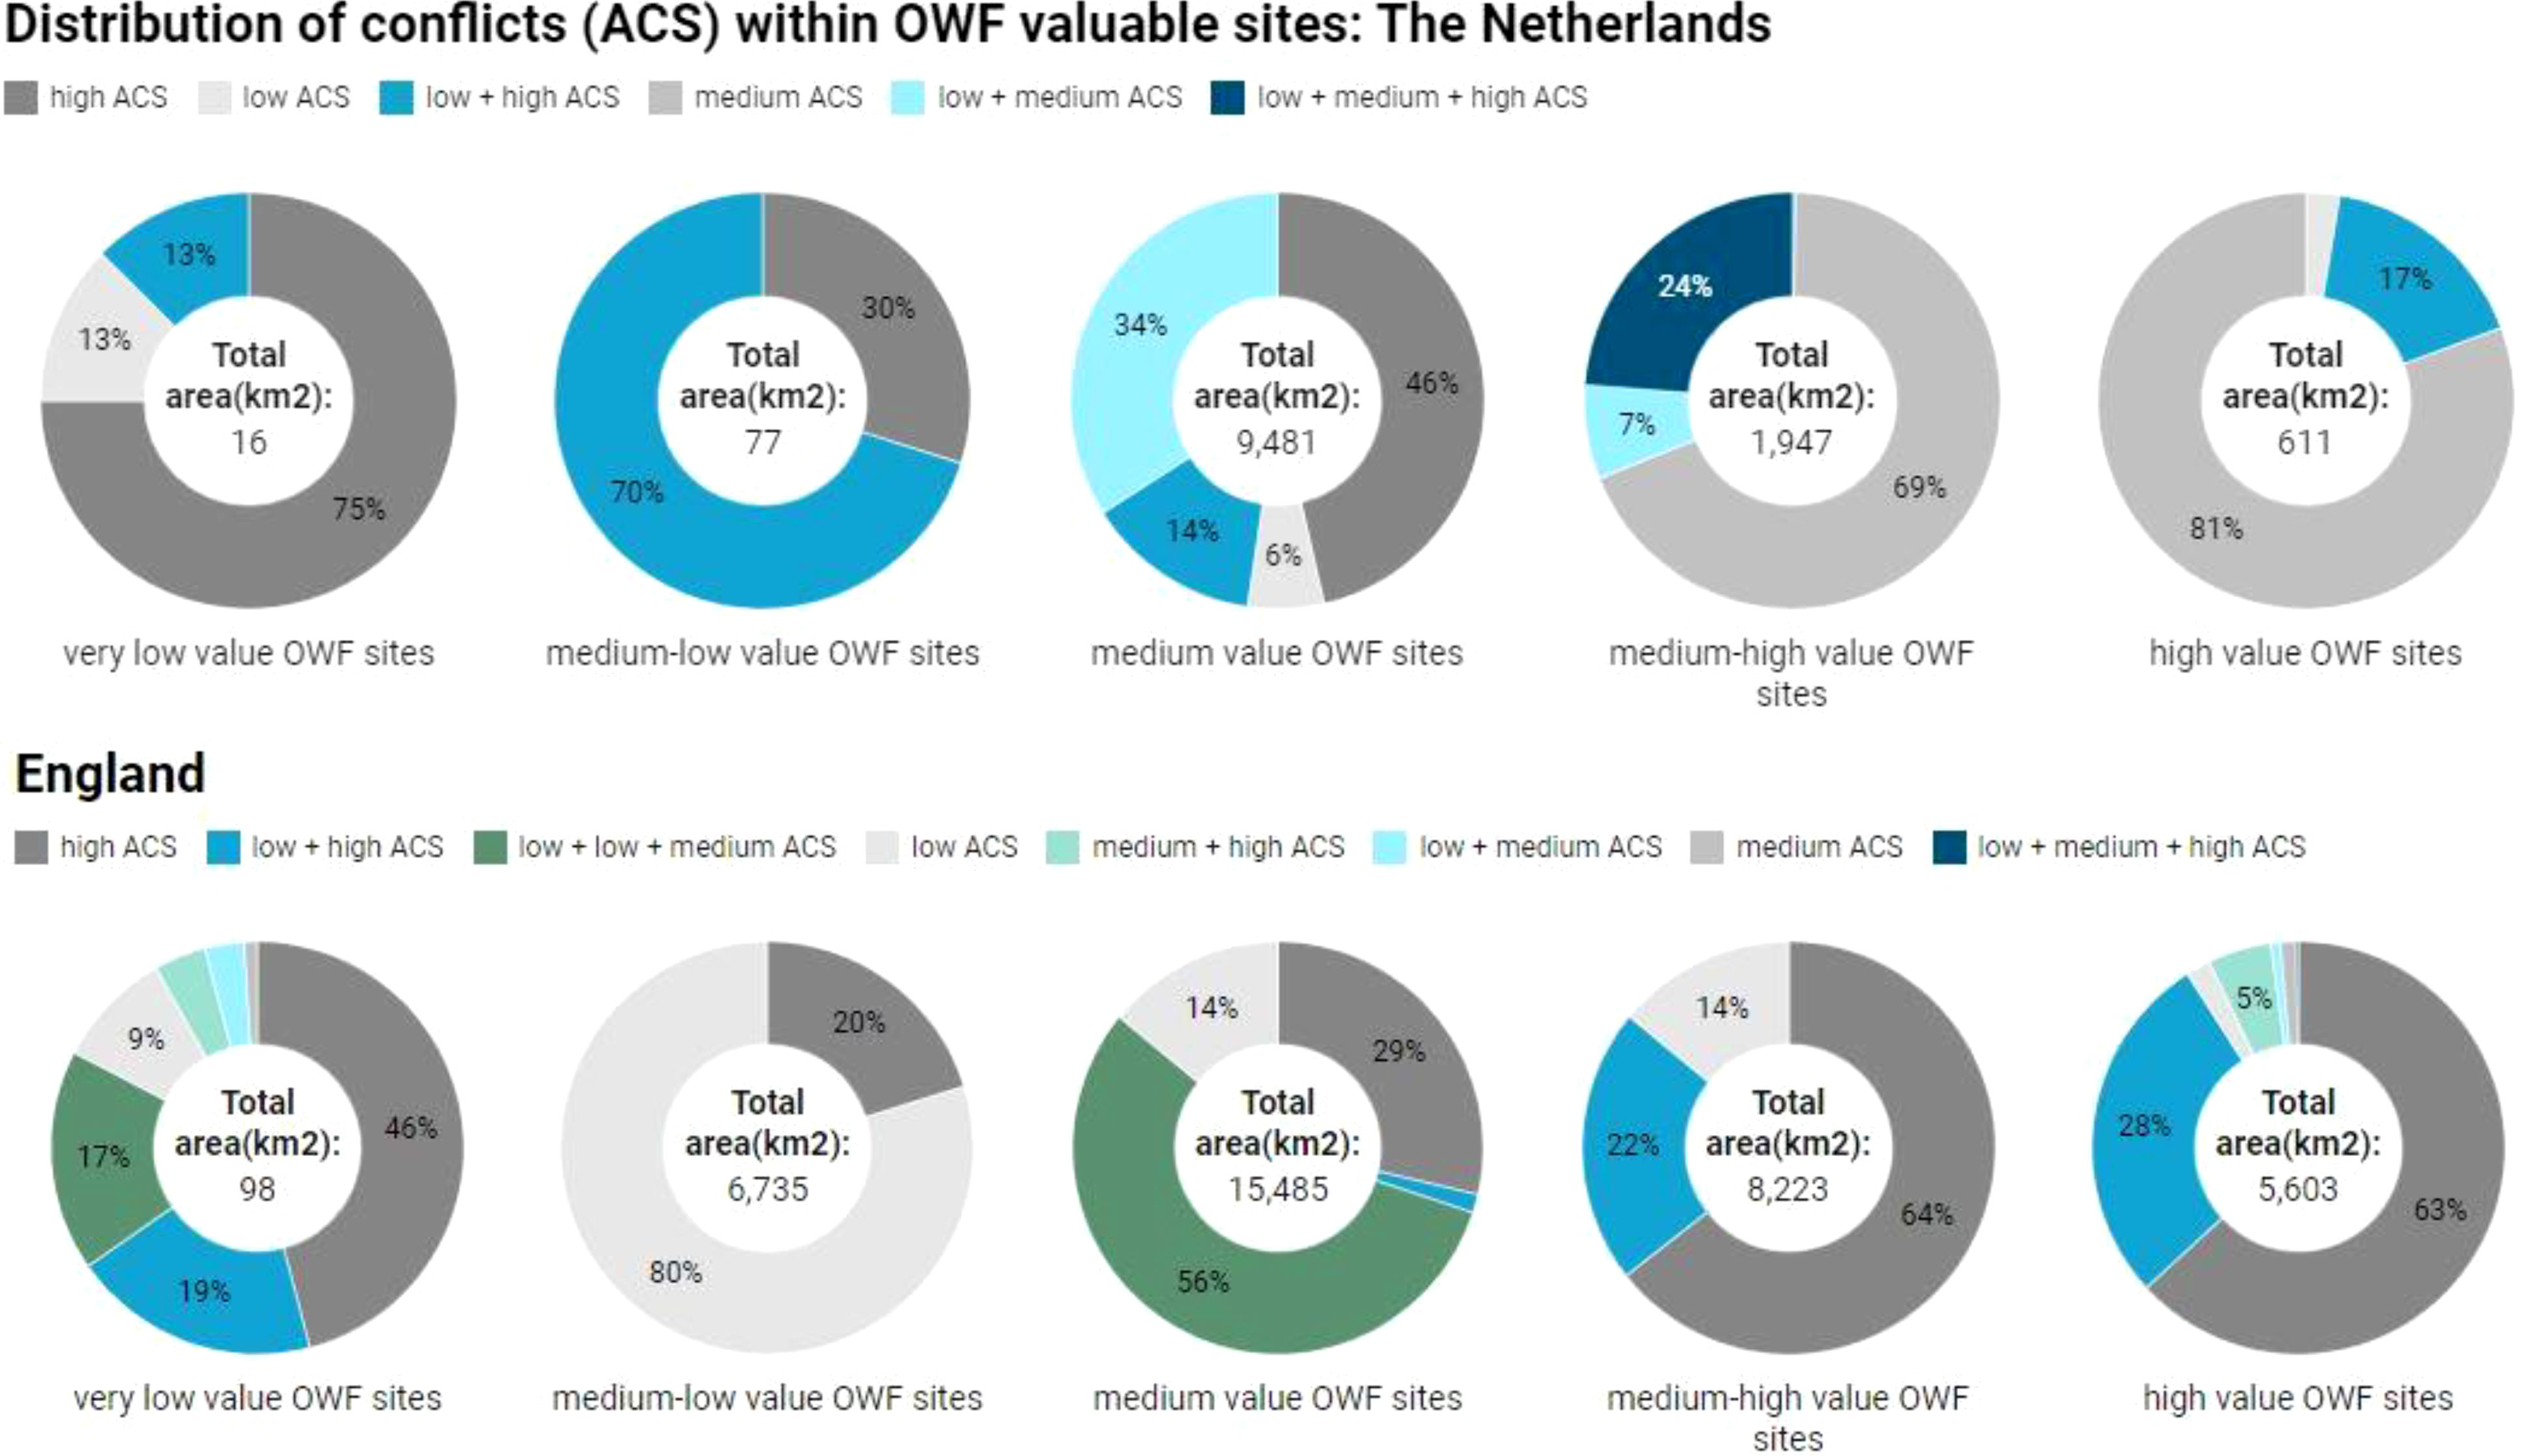
Figure 8 Average conflict resolution scores for the interaction between OWFs and nature protected areas.
Considering the results, a number of key messages should be underlined for the two EEZs, when qualifying and quantifying the pairwise interactions between the analyzed sea users and OWFs valuable sites (Supplementary Figure 2). We estimate the potential GWs to be deployed based on two densities, namely 3,6 MWs/km2 (for a multi-use management alternative) and 6,4 MWs/km2 (for a single-use planning management alternative). While the Dutch EEZ is nearly half the size of the English EEZ, the total area of conflict between protected areas and OWFs is 3 times smaller than in the English case. For the Dutch case, 78% of the conflict is located in medium value OWF sites, of which 46% of the interaction is taking place in habitats for marine mammal’s protection, in approx. 4.361 km2 (equivalent of 15.7-27.9 GWs). In medium-high and high value OWF sites, the main conflict occurs with bird’s habitats (medium ACS), cumulating 1838 km2 (6.6-11.8 GWs). Also relevant is the overlap with birds and seabed/fish habitats, in medium value OWF sites, accounting for 3,223.5 km2 (11,6-20.6 GWs).
In the English EEZ (Figure 8), the majority of the conflict is taking place in medium and medium-high value areas for OWFs, predominantly from 8,671.6 km2 (31.2-55.5 GWs) of overlap with seabed, fish and bird habitats, and a cumulated 9,753.37 km2 (35-62.4 GWs) in mammals’ habitats. One relevant finding is the potential presented by managing the conflictual overlap with seabed/fish habitats (low ACS) in medium-low OWF value sites, which could unlock 5,388 km2 (19.4-34.5 GWs). The alternative potential to be unlocked in areas with higher costs for the OWF sector (such as the medium value sites) at a lower environmental cost (lower ACS scores) is one of the main trade-offs which should be addressed when balancing risks and opportunities of OWF deployment.
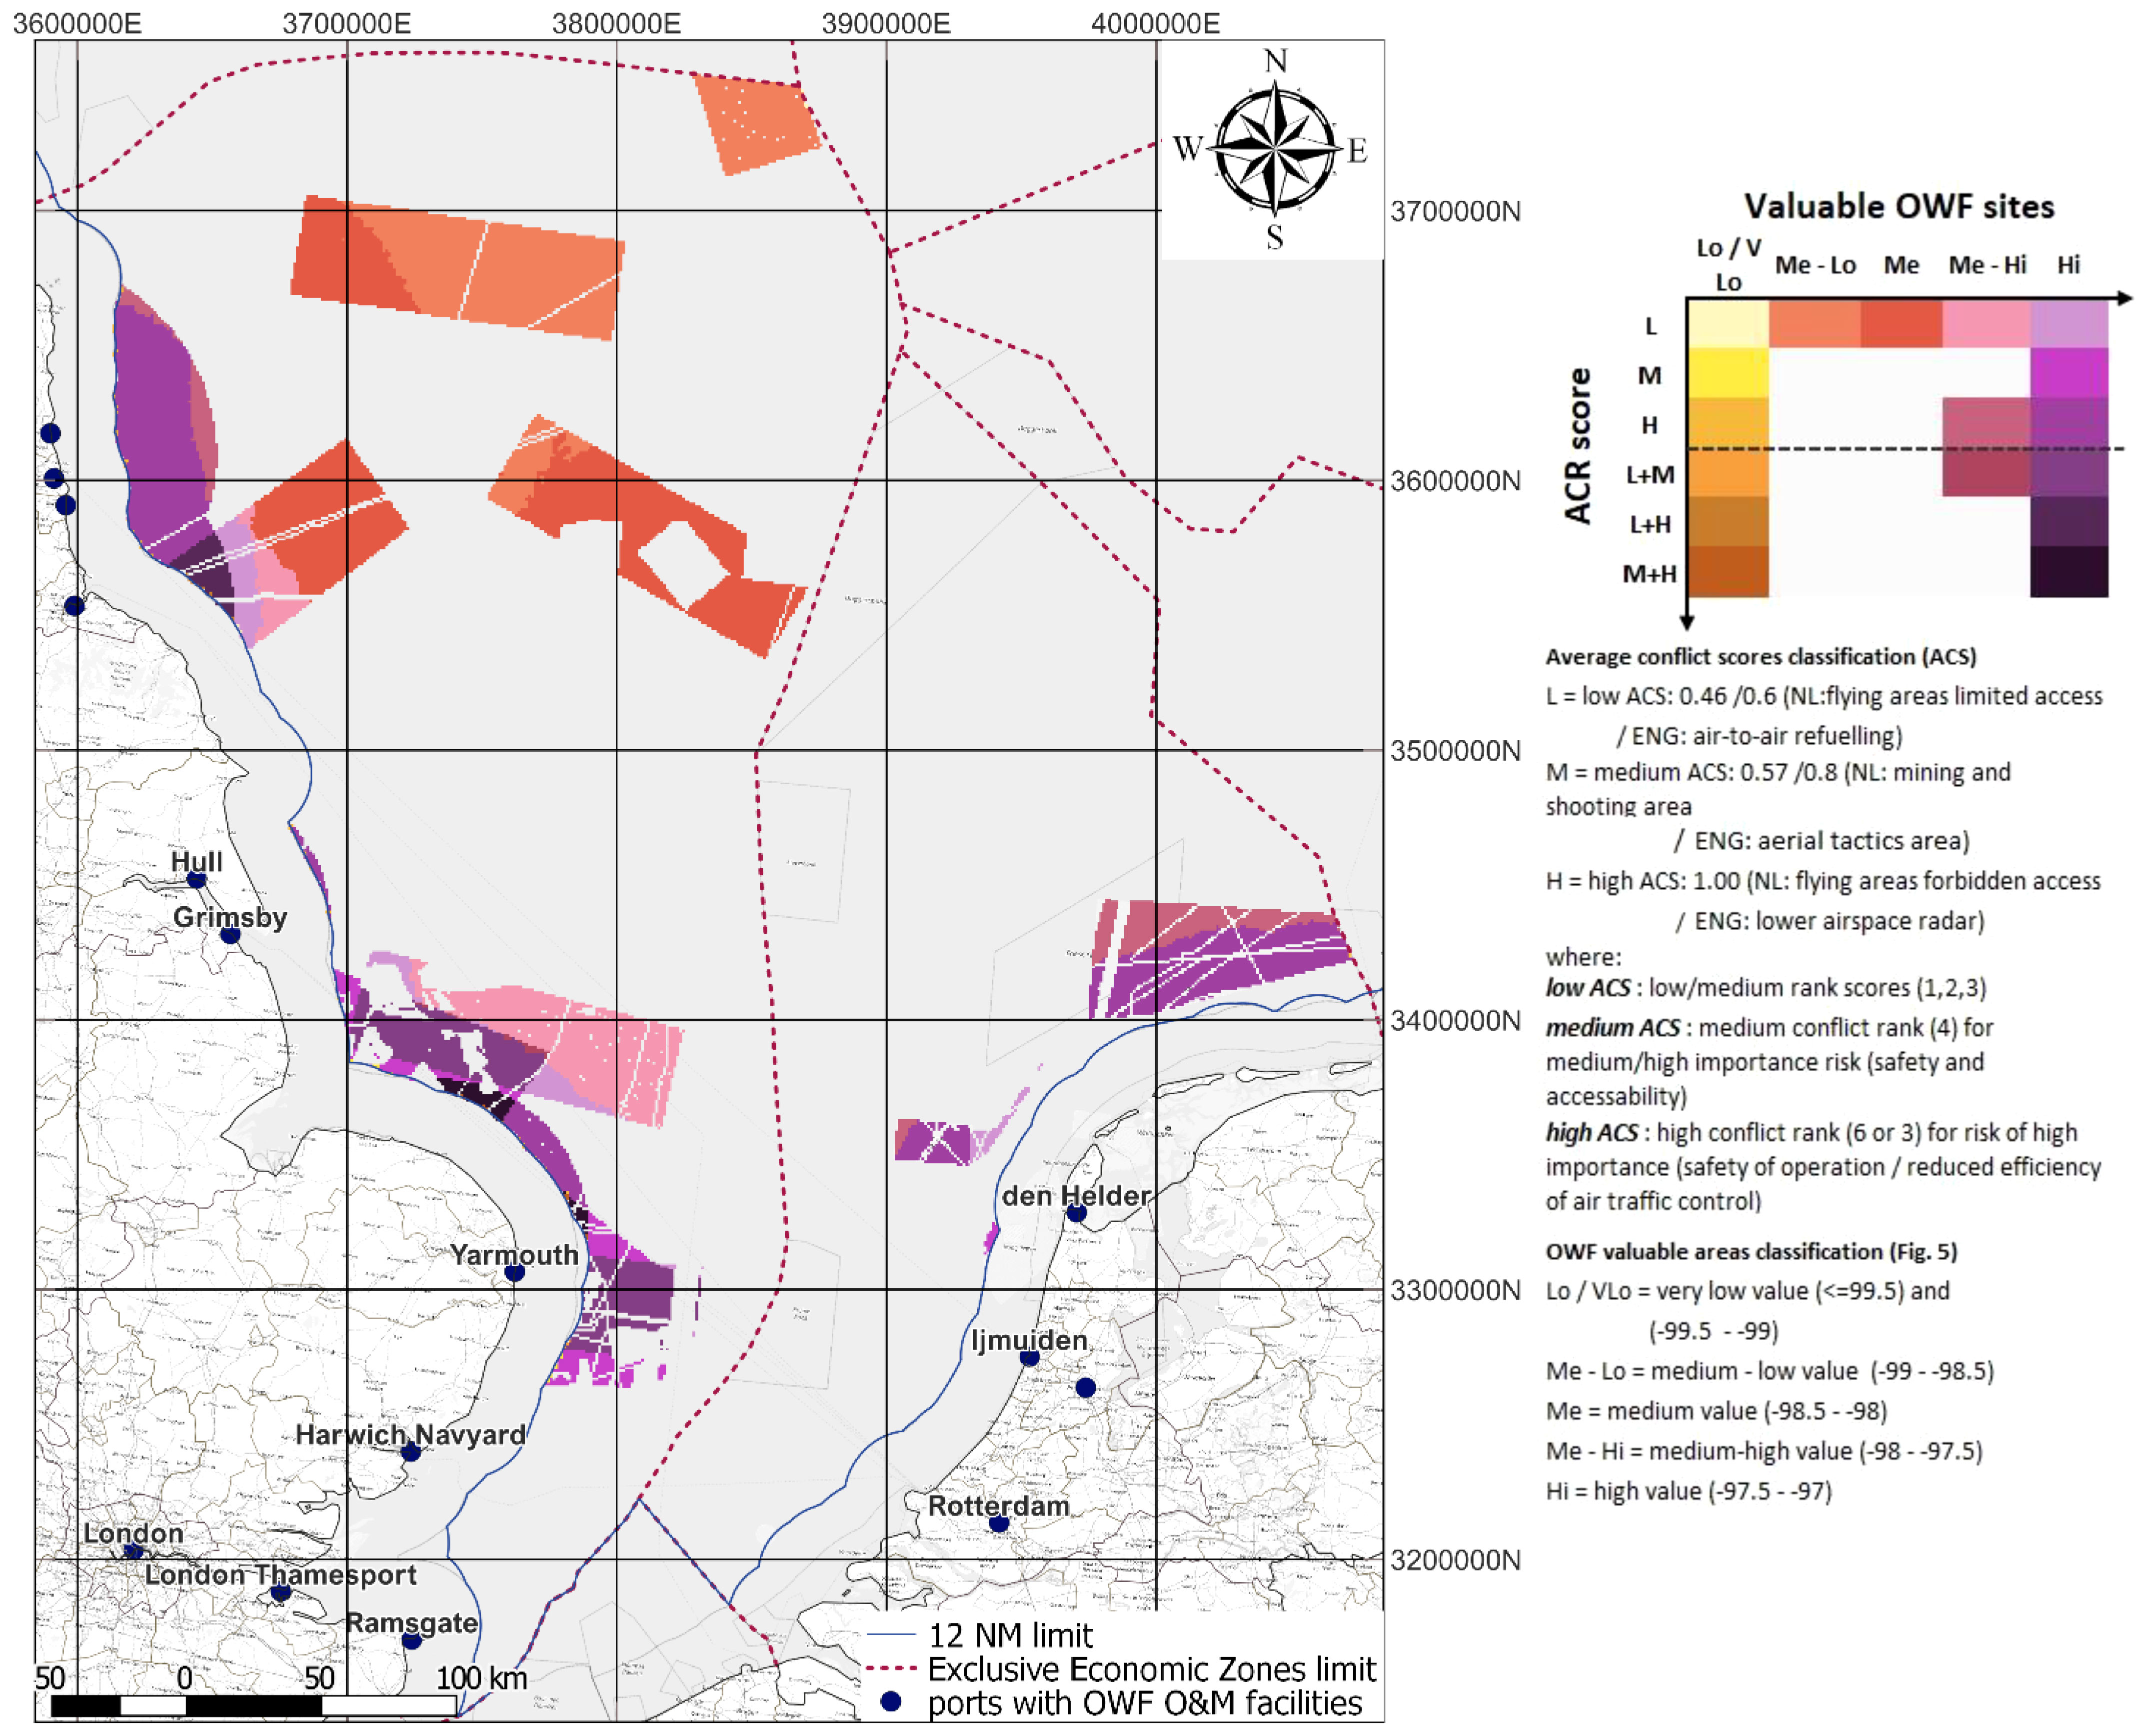
Figure 9 Spatial distribution (cumulated area of conflict) of conflicts (ACS) within the OWF valuable sites, for nature protection areas sea user group types.
OWFs - military activities
In both Dutch and English EEZs, the military related activities are priority activities of national interest (Dutch Central Government, 2009; Department for Environment Food and Rural Affairs, 2014a), have a role in security, and have a significant socio-economic contribution as a major employer in coastal areas (Department for Environment Food and Rural Affairs, 2014a). The main objectives of the sector are the safety of operations at sea and the sufficient areas for armed forces. As a principle, when multiple activities of national interest will be stacked in the same area, the planning approach is towards combined, efficient and safe use of space (Dutch Central Government, 2009). However, due to safety concerns of potential damage or restrictions posed by fixed installations (OWF turbines) to most military activities, the siting of OWFs is not permitted in military areas. The main concerns related to the interaction with military areas are posed by the Primary Surveillance Radars the obstacle posed by the wind turbines to low flight activities or to helicopters engaged in offshore operations (Mcpherson et al., 2019). The relocation of military activities can be considered, provided sufficient safe and feasible alternatives are available (EHD-41 defense exercise area in the Dutch EEZ2).
While the multi-use of space with permanent installations (OWFs) is not encouraged (Dutch Central Government, 2009; Department for Environment Food and Rural Affairs, 2014a), efforts are being made to limit the negative impacts of locating OWF in the range of military and aviation radars, by locating military radars on OWF turbines to fill the air gap caused by the location of OWFs (gap-fill options) (Supplementary Data 5 – Military activities). We map the interaction with the valuable OWF areas (Figure 9), the intensity of conflict per sea user group (Supplementary Figure 3) and we present the potential conflict resolution strategies to consider in each type of interaction between OWFs and military activities (Supplementary Data 3).
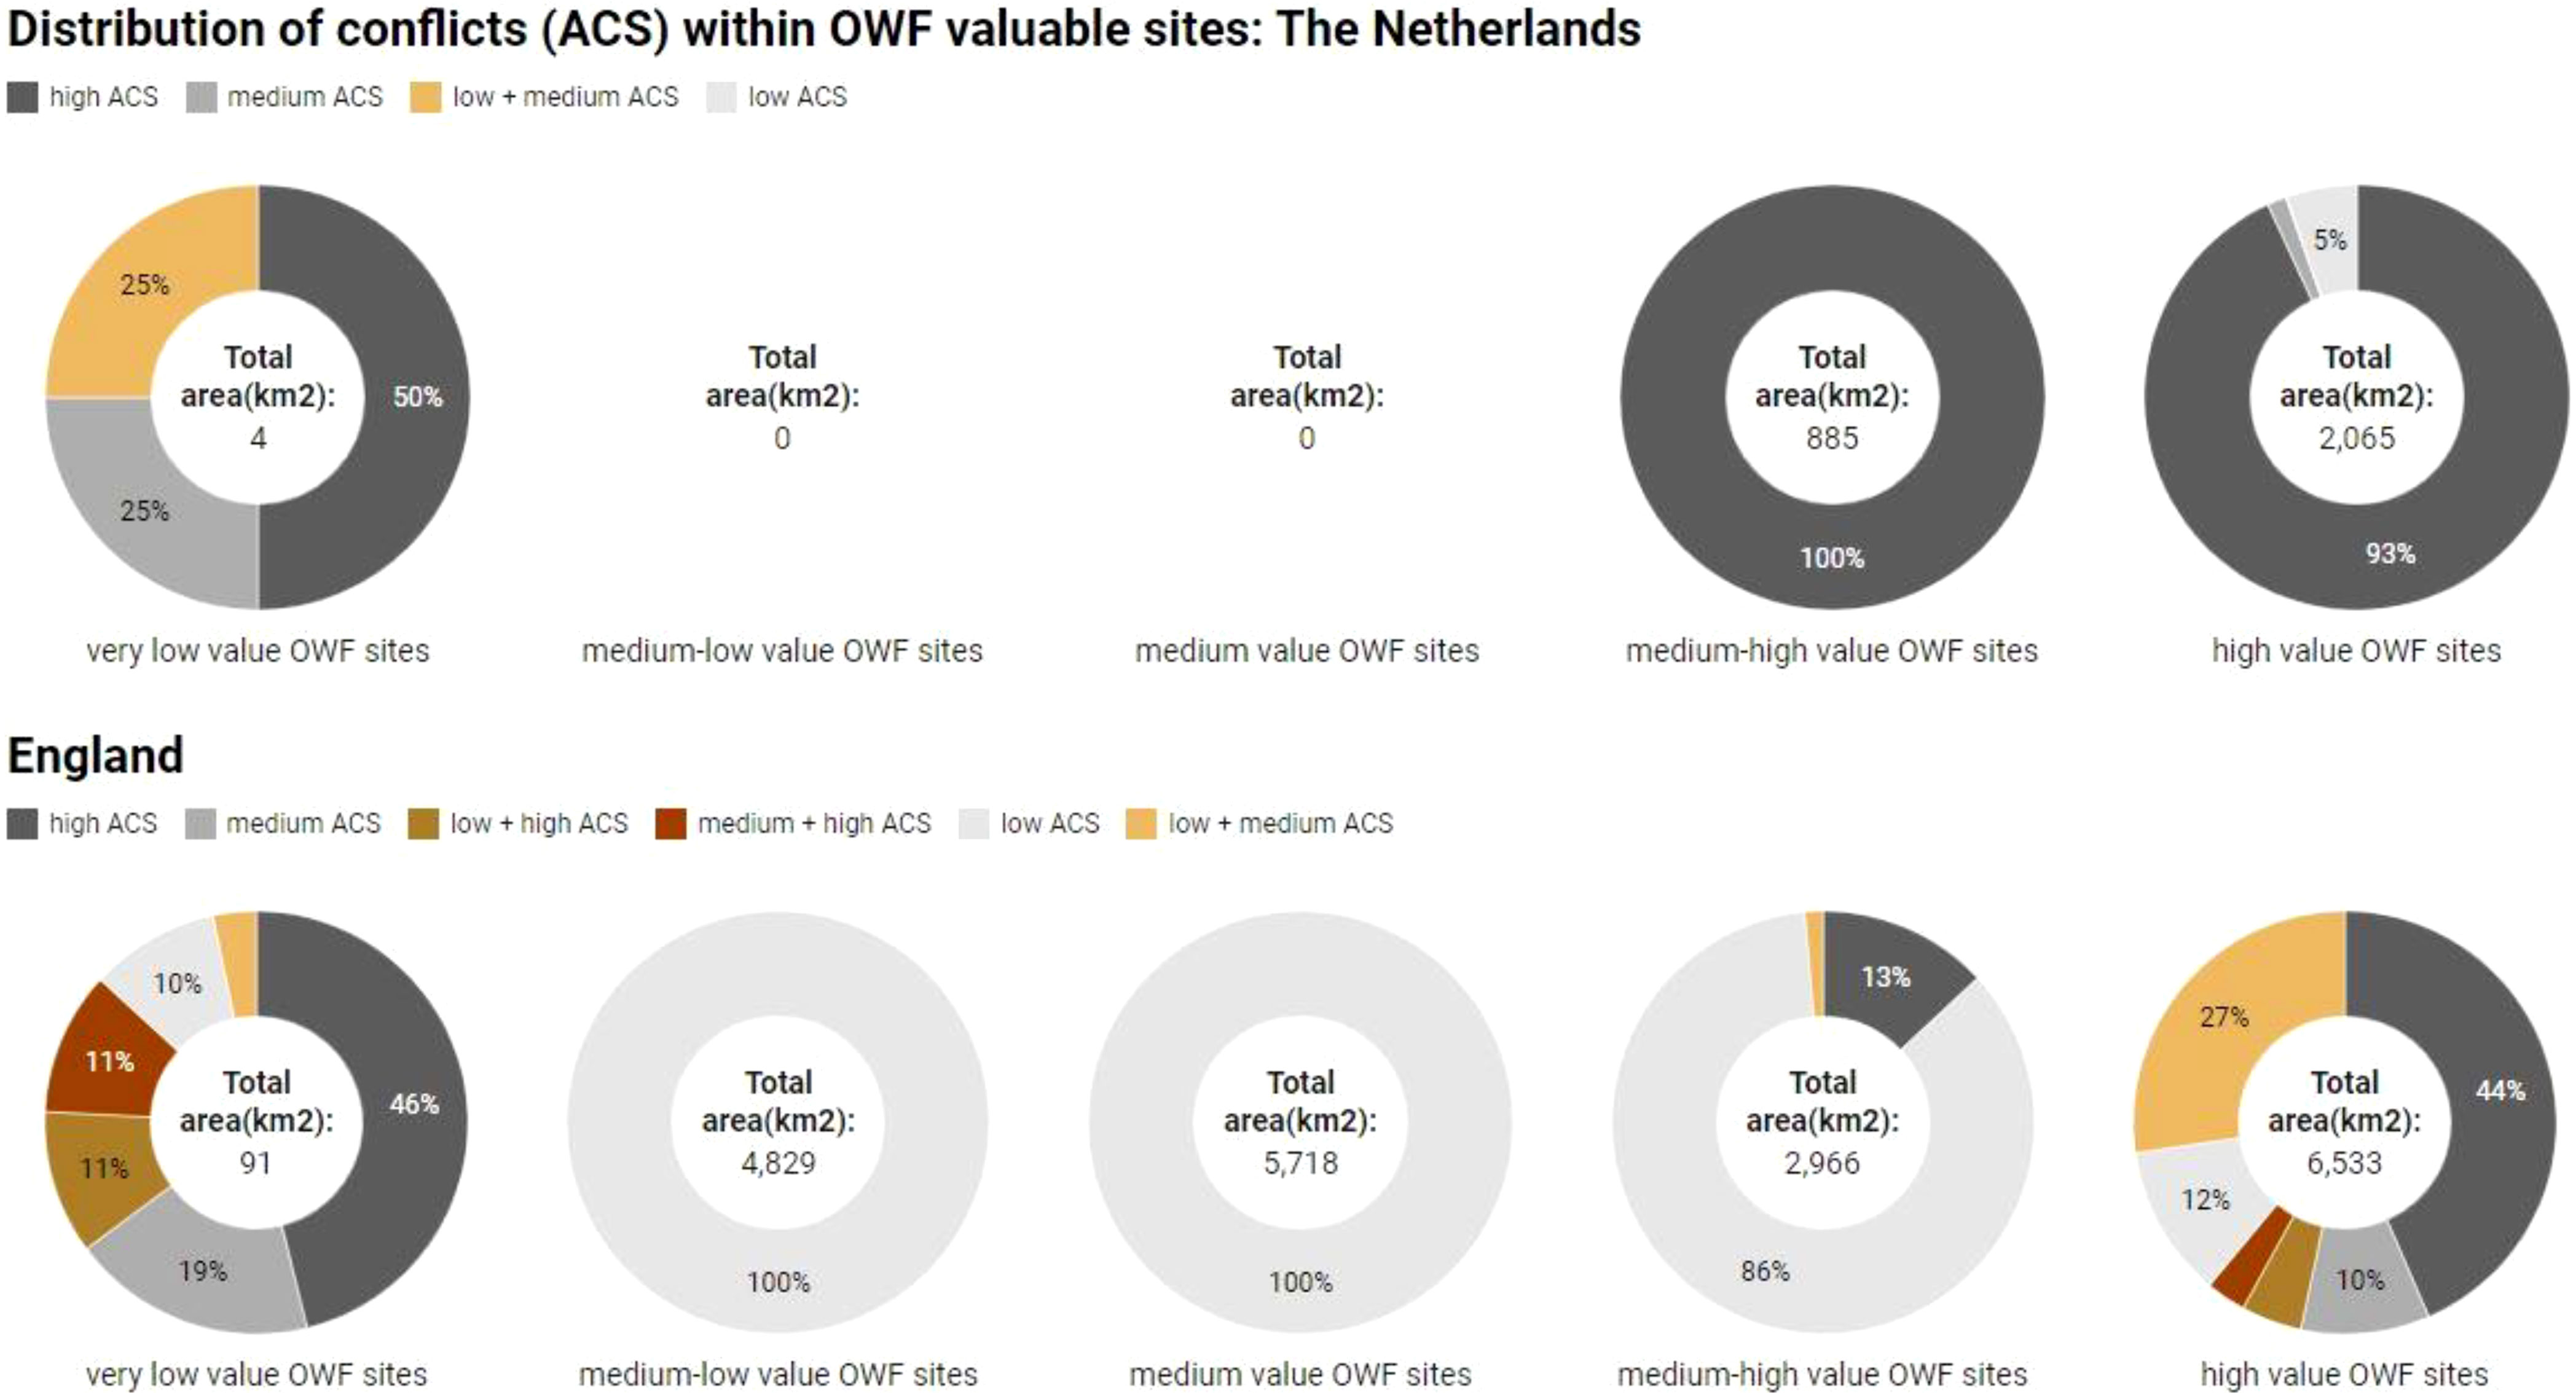
Figure 10 Average conflict resolution scores for the interaction between OWFs and military/aviation areas.
The military activities in the Dutch EEZ are mainly concentrated in the medium-high and high value OWF sites, at the intersection with areas reserved for flying military activities (forbidden access), over a cumulated area of 2,805.45 Km2 (10-18 GWs)(Figure 10). While present in high value OWF areas, the military flying areas are highly incompatible with OWF related activities, the only option remaining the single use (either OWFs or military activities).
In the English EEZ, the lowest conflict is represented by the interaction with air-to-air refueling areas, in medium-low, medium and medium-high value OWF sites. At the two extremes, in very low/low and in high value OWF sites, the degree of conflict is diversified, with the highest proportion of the conflict assigned to lower radar space, covering an area of 2,874 Km2 (10.4-18.4 GWs). While for the Dutch case, the interaction with military flying areas is considered incompatible, in the English EEZ sustained efforts exist to tackle the negative impacts on lower radar areas with the aim to eventually balance the risks and benefits of the two activities.
OWFs- shipping routes
Shipping is another activity of national interest, with high economic value for UK and in particular for The Netherlands. Safety, accessibility and swift navigation in the designated areas and safe navigational access to ports, in particular with national strategic importance, are primary goals for the shipping sector of UK and The Netherlands (Dutch Central Government, 2009; Department for Environment Food and Rural Affairs, 2014a; Marine Management Organisation, 2020). Individual permanent structures are not allowed within the designated shipping lanes or at a distance of 500 m surrounding them, preventing OWFs in or near the recognized sea lanes of regional and international importance. UK planning documents do acknowledge the potential changes in the (mainly local) shipping activity as a result of Round 2 and 3 OWF deployment, if the safe navigation and access to ports with national strategic importance is maintained, and no adverse economic impacts on shipping occur (Department for Environment Food and Rural Affairs, 2014a; Marine Management Organisation, 2020). In contrast, new shipping lanes of economic importance for the Dutch ports are given priority over already designated OWF areas (e.g. the OWF designated area IJmuiden Ver) (Government of The Netherlands, 2021a). Therefore, both countries give a high priority to safety of navigation at sea, as well as to the economic importance of shipping activity and ports. This is highlighted by the designation of new shipping lanes in the Dutch EEZ, with an already high footprint of IMO routes (no-go for OWFs) in a highly spatially scarce EEZ.
Despite efforts for combining activities offshore, OWFs and shipping will remain separate, due to current international regulations and guidelines for designing the shipping lanes. In consideration of local conditions (available depth of water, risk of natural hazards), the traffic density of the specific routes and vessel types may allow deviations (Confederation of European Shipmasters’ Associations, 2018). In the Dutch EEZ the new policy framework allows for passage through corridors within the OWF areas, for ships under 46 meters, on a case by case approach(2). Moreover, the current standards for the safety distances from the shipping lanes to other permanently installed objects can be subject to negotiation with the shipping sector (Dutch Central Government, 2009). This approach has not been adopted by the English legislation so far.
We map the interaction with valuable OWF areas (Figure 11), the degree of conflict and the cumulative claims (number of overlaps) (Supplementary Figure 4), and present the potential conflict resolution strategies to consider in each type of interaction between OWFs and shipping types (Supplementary Data 3).
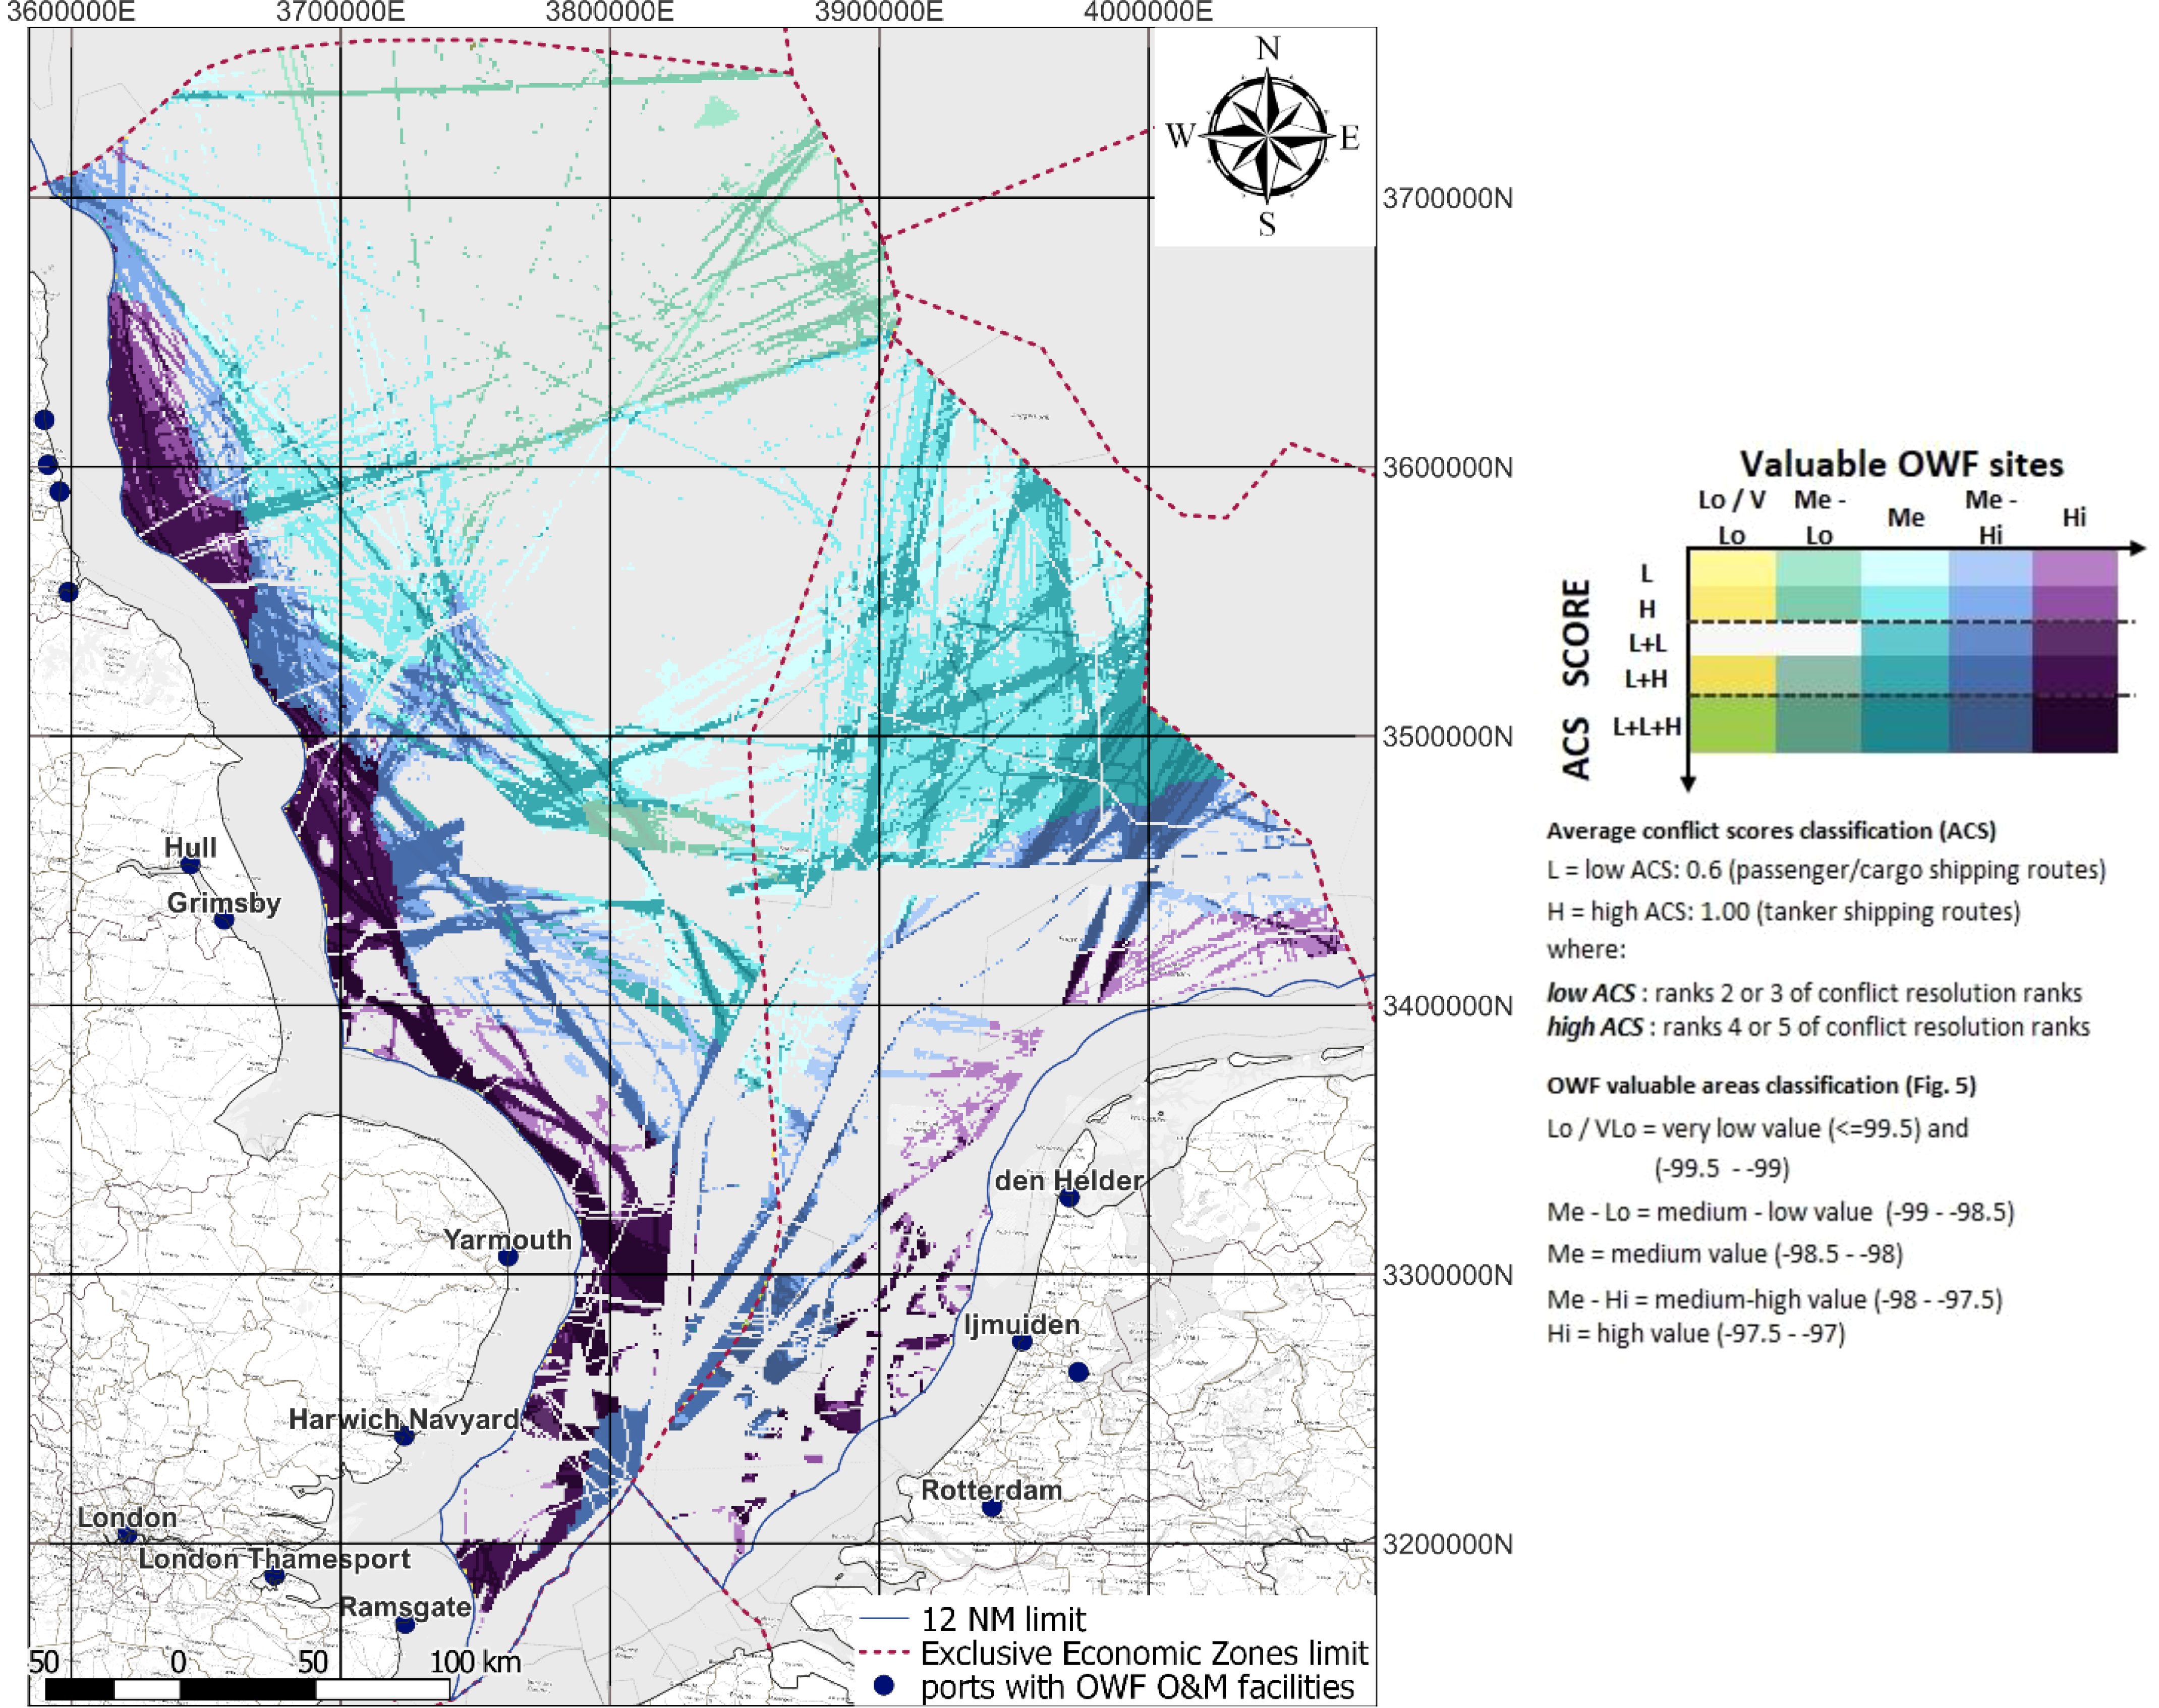
Figure 11 Average conflict resolution scores for the interaction between OWFs and shipping activities.
In the Dutch case, the shipping activity is highly concentrated in the medium value OWF sites, with 46% of the conflict associated with tanker shipping routes, in 6083.7 km2 (21.9-38.9 GWs). Though having a smaller spatial impact, managing the low conflict with passenger/cargo routes could unlock 1370.3 km2 (4.9-8.7 GWs) in high value OWF sites.
In the English case, the conflict with shipping activities is concentrated in medium value OWFs sites, in particular with tanker routes claiming 4138 km2 (14.9-26.5 GWs, Figure 12), and in high value OWF sites, where both tanker and cargo/passenger routes cover 4674 km2 (16.8-30 GWs). Interestingly, the management of only low conflicts (1 overlap, low ACS) with passenger/cargo routes could still unlock 10.9-19.4GWs, 3.8-6.8GWs and 2.4-4.2GWs in medium, medium-high and high OWF value sites.
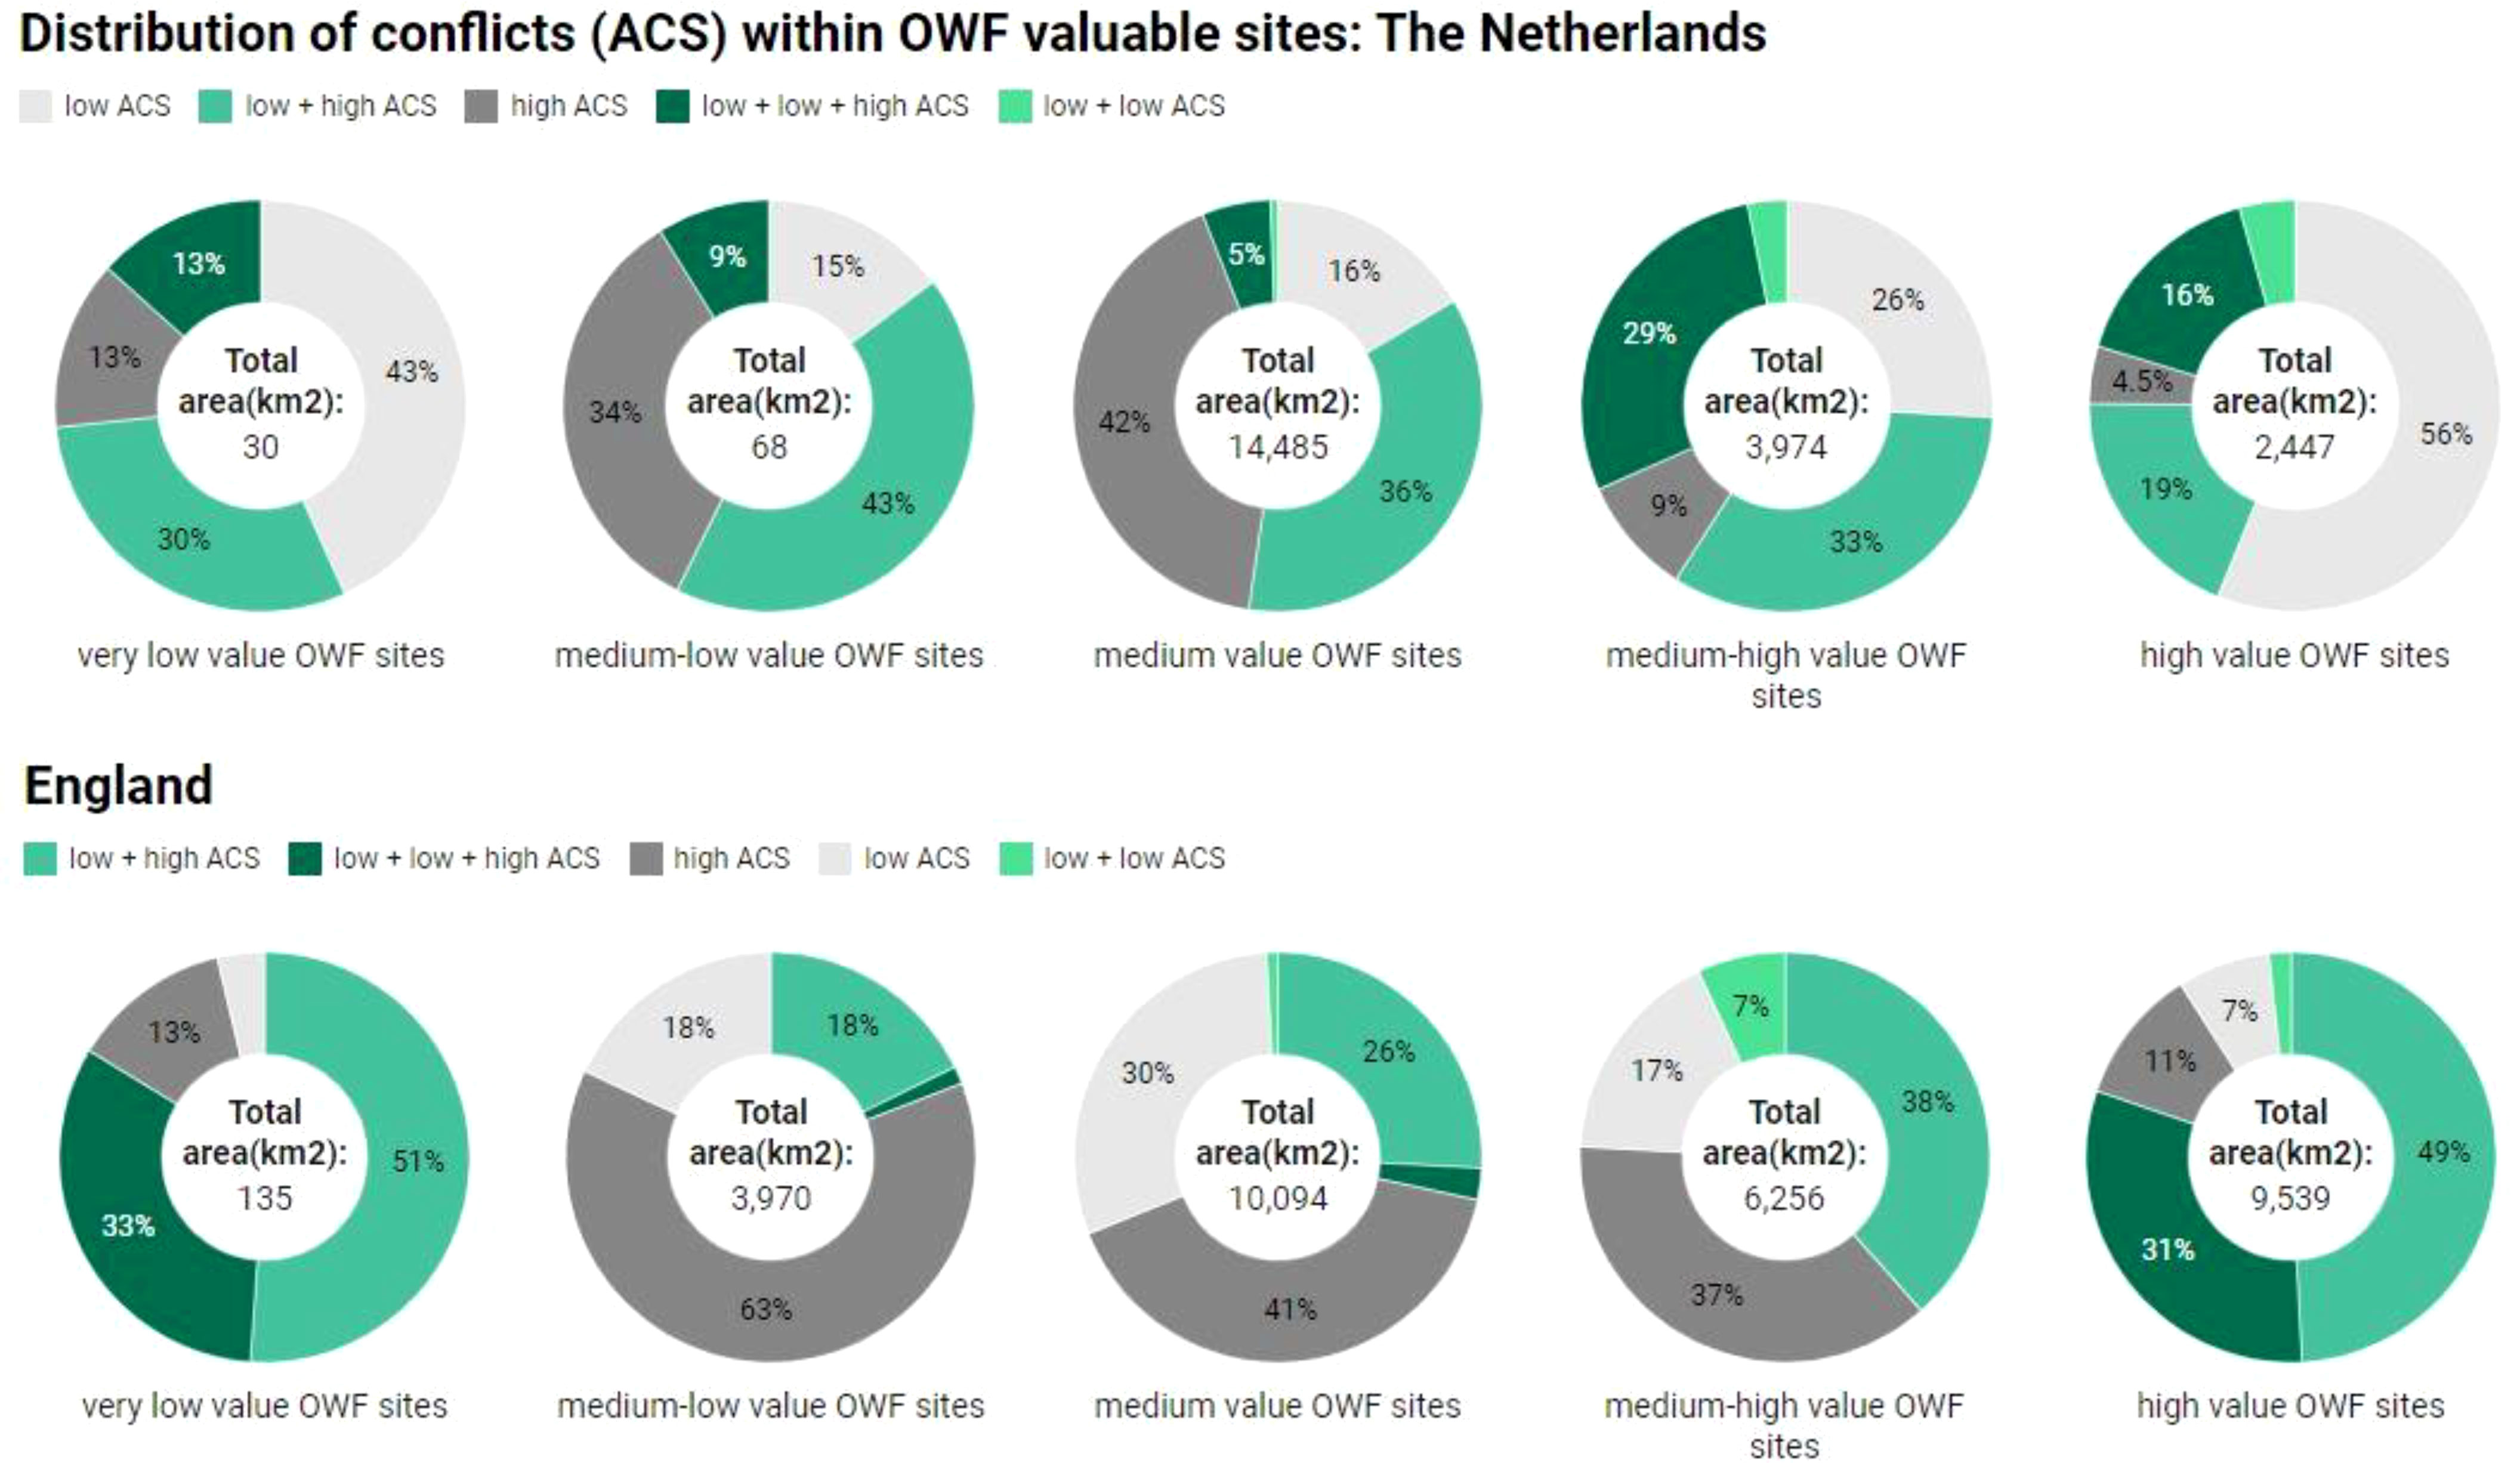
Figure 12 Spatial distribution (cumulated area of conflict) of conflicts (ACS) within the OWF valuable sites, for shipping activities sea user group types.
OWFs- fisheries
Fishing is one of the traditional activities taking place in the North Sea basin, with an economic and socio-cultural value, linked to the identity of coastal communities (Dutch Central Government, 2009; Government, 2011). The sectoral objectives include safe access to fishing grounds (fishing resources), sustainable fishing management (keeping the stock within safe biological limits or improving the fish stock where possible) and creation of jobs at all skills levels (Government, 2011; Government of The Netherlands, 2021a). Recently, the Dutch fishing sector has been facing increasing constraints in practicing its activity due to limitation of access in Natura 2000 areas, and limited access to fishing grounds in the English waters, following Brexit. Moreover, the increased presence of OWFs has raised awareness of potential displacement of fisheries, since fisheries do not have priority over activities of national interest (such as energy production) (Dutch Central Government, 2009). Under new guidelines and agreements, both in the English and Dutch EEZ there is no strict interdiction for fishing inside the OWF. In practice, however, safety concerns of both fishing activity and damages to the wind farm (collision risks, grabbing the cables) imply that fishing activities are displaced when an area is designated for OWFs. In response, the Dutch government, through the North Sea Agreement (Overlegorgaan Fysieke Leefomgeving, 2020), urges for the financial compensation of the fishing sector through the Transition Fund (Overlegorgaan Fysieke Leefomgeving, 2020), used primarily for the restructuring of the sector towards more sustainable fisheries (fishing gears and methods). Alternatively, the English approach is to account for impacts on the fishing activity early in the process, such as the search for viable alternatives for fishing activity, with reliable fish stock and feasible travelling possibilities to the new fishing grounds. Where negative effects on the local communities and businesses would arise, they need to be minimized or mitigated (Department for Environment Food and Rural Affairs, 2014a; Marine Management Organisation, 2020).
Multi-use of space between fisheries and OWFs is encouraged, where possible, in both the English EEZ (Government, 2011) and Dutch EEZ (except the southern part), mainly for fisheries which do not disturb the sea bottom (fixed gear – baskets) (Government of The Netherlands, 2021a). While in both cases the legal framework provides flexibility for multi-use options, no concrete guidelines and financial instruments for supporting the safe, efficient and equitable combination of the two activities exist. The co-location of the two activities, however, requires sustained efforts also from the OWF sector to ensure safety for fisherman inside the OWFs, as detailed through management strategies in Supplementary Data 3. Techno-economic solutions require better communication, knowledge exchange and working relationships between the fishermen and the OWF service vessel operators. A large body of literature is pointing at synergies between sectoral objectives, including shared facilities for operation and maintenance (e.g., commercial fishing vessels used as safety and research vessels), or developing funds to support the affected fishing communities (Orsted, 2021). Moreover, recent studies in the English and German EEZ show improvements in the local lobster (English EEZ) (Roach et al., 2018), brown crab and cod (German EEZ) (Gimpel et al., 2020) population size and characteristics within the OWFs (without fishing). This increase in local biomass may allow for the recovery of fisheries economic losses caused by the closing of the OWF, underlining the potential benefits on fish stock recovery (Roach et al., 2018; Gimpel et al., 2020).
We map the interactions with the valuable OWF areas (Figure 13), the degree of conflict (given by the area of overlap) and the cumulative claims (number of overlaps, Supplementary Figure 5) and the management options for conflict resolution (Supplementary Data 3).
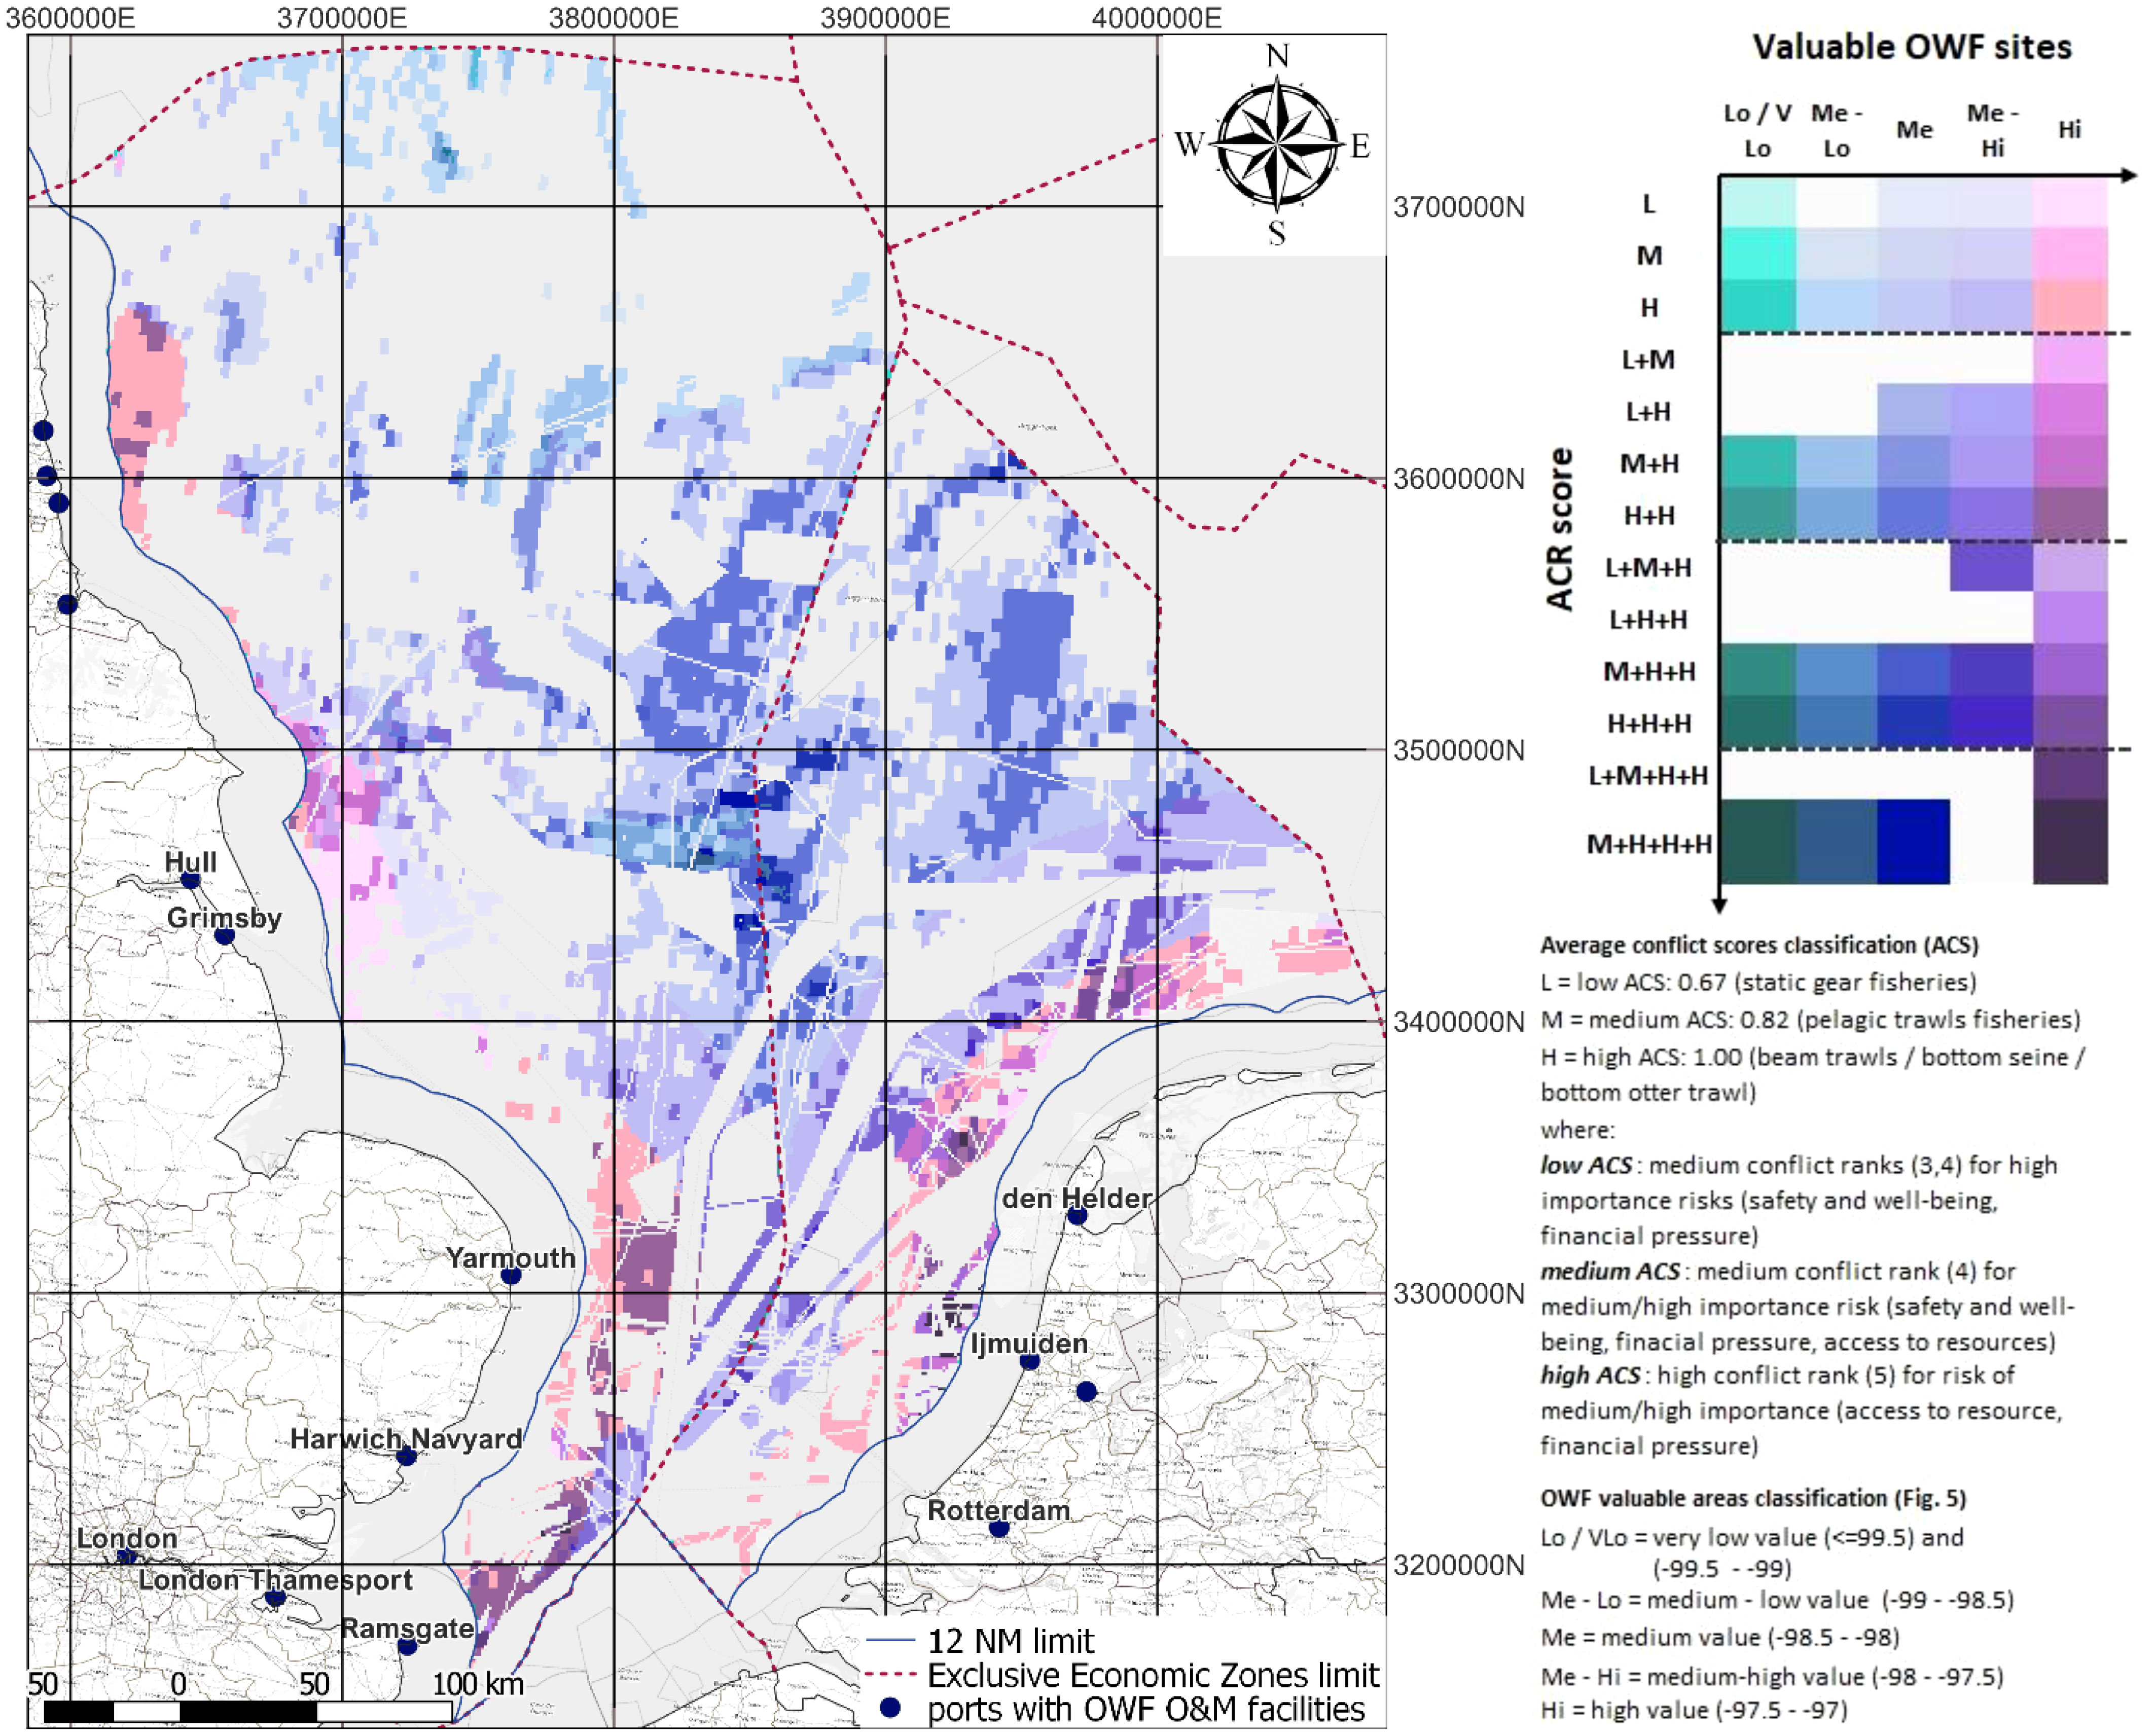
Figure 13 Average conflict resolution scores for the interaction between OWFs and high intensity fishing activities.
In the Dutch case, the majority of the claims occur in medium value OWF sites over 4197.6 km2 (15-26.8 GWs), in areas of one overlap with either pelagic trawls (medium ACS) and beam trawls/bottom seine/bottom otter trawls (high ACS), and to a lesser extent in areas of two overlaps between two medium ACS and high ACS fisheries types (31806 km2, 11.4-20.3 GWs) (Figure 14). It is important to notice the magnitude of overlap between high conflict fisheries in medium value OWF sites (33%), medium-high value OWF sites (67%) and high value OWF sites (49%), cumulating a total area of 9993,96 km2 , 35.9-63.9 GWs.
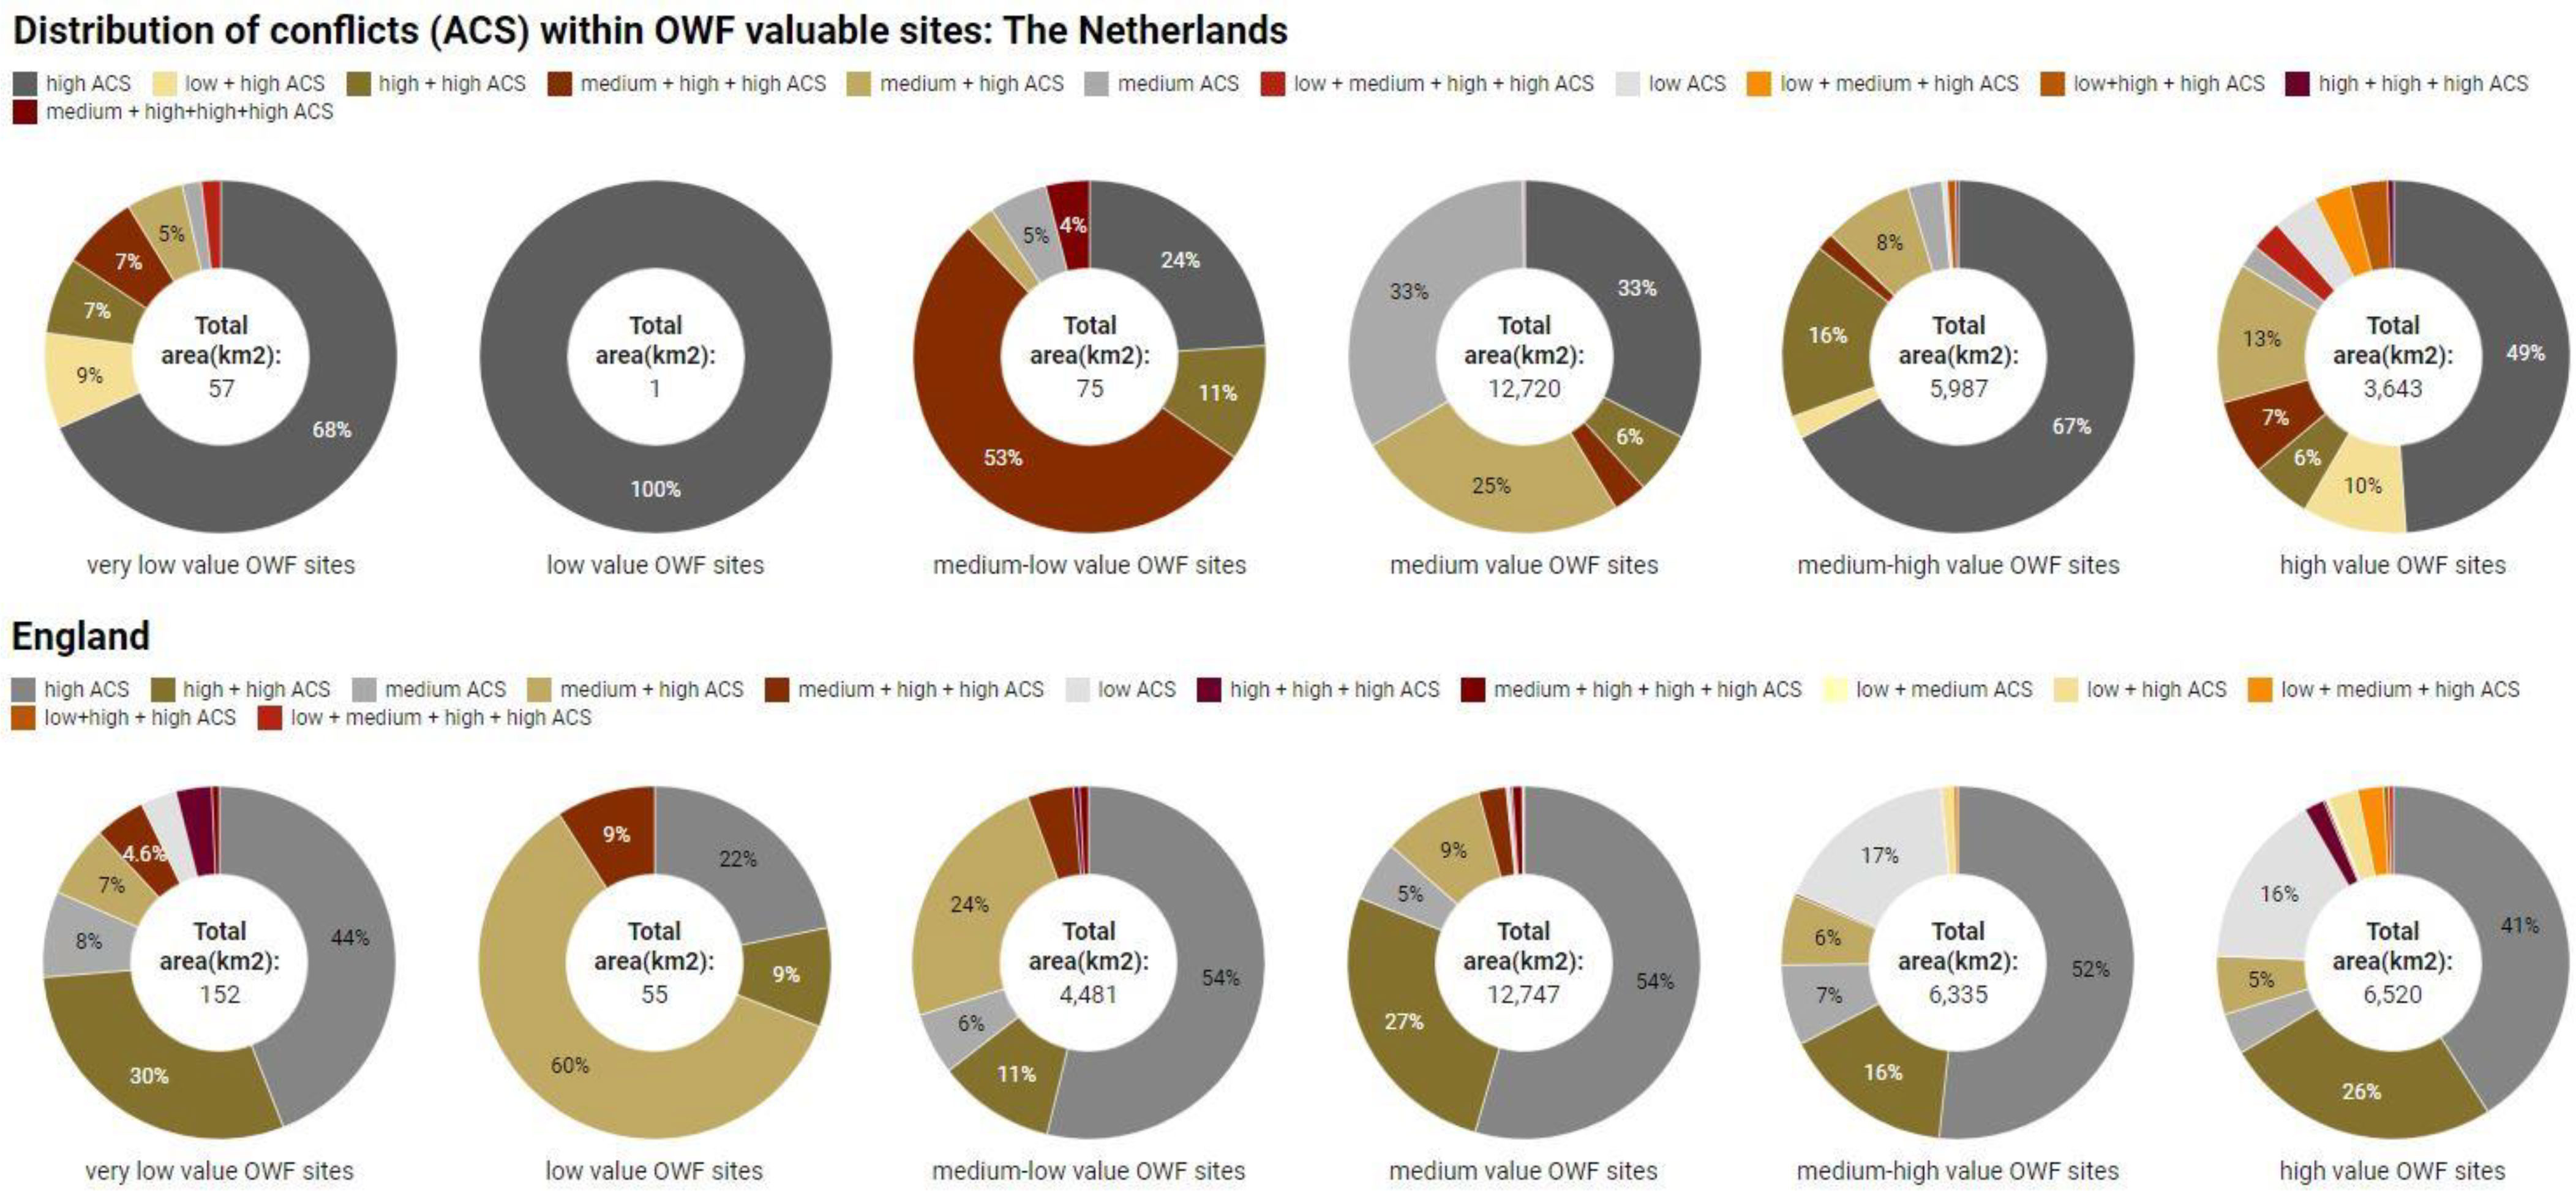
Figure 14 Spatial distribution (cumulated area of conflict) of conflicts (ACS) within the OWF valuable sites, for fisheries sea user group types.
Similarly, for the English case, the largest overlap is associated to high conflict fisheries (beam trawls/bottom seine/bottom otter trawls), accounting for 6883.3 km2 , 24.8-44 GWs (medium OWF), 3292.2 km2, 11.8-21GWs (medium-high OWF), 2673.2 km2 , 9.6-17 GWs (high value OWF). Detailed tables of the resulted ACR scores, number of overlaps and area of conflict, per each OWF value site category and per country, are presented in Supplementary Figure 5.
Offshore conflicts in the planned search areas for future OWF deployments
While identifying the cold and hot spots of conflict is highly relevant for the EEZ level of strategic planning of OWFs, a discussion on the specific strategies to solve, minimize or mitigate risks can more effectively be realized at a local level. As such, we further explore the level of conflict and management strategies for the already designated areas or search areas within the English and Dutch EEZ.
Currently, the Search Areas proposed by the national governmental bodies responsible for the management of offshore activities in their respective EEZ areas, are mainly located in medium and medium-high value areas for OWFs (Figure 15). In the English EEZ case, this refers to the Offshore Wind Leasing Round 4 Characterization Areas, within biding areas 1 and 2 (The Crown Estate, 2019), while for the Dutch EEZ we consider the Search areas 1-8 proposed through the Draft North Sea Program 2022-2027(2).
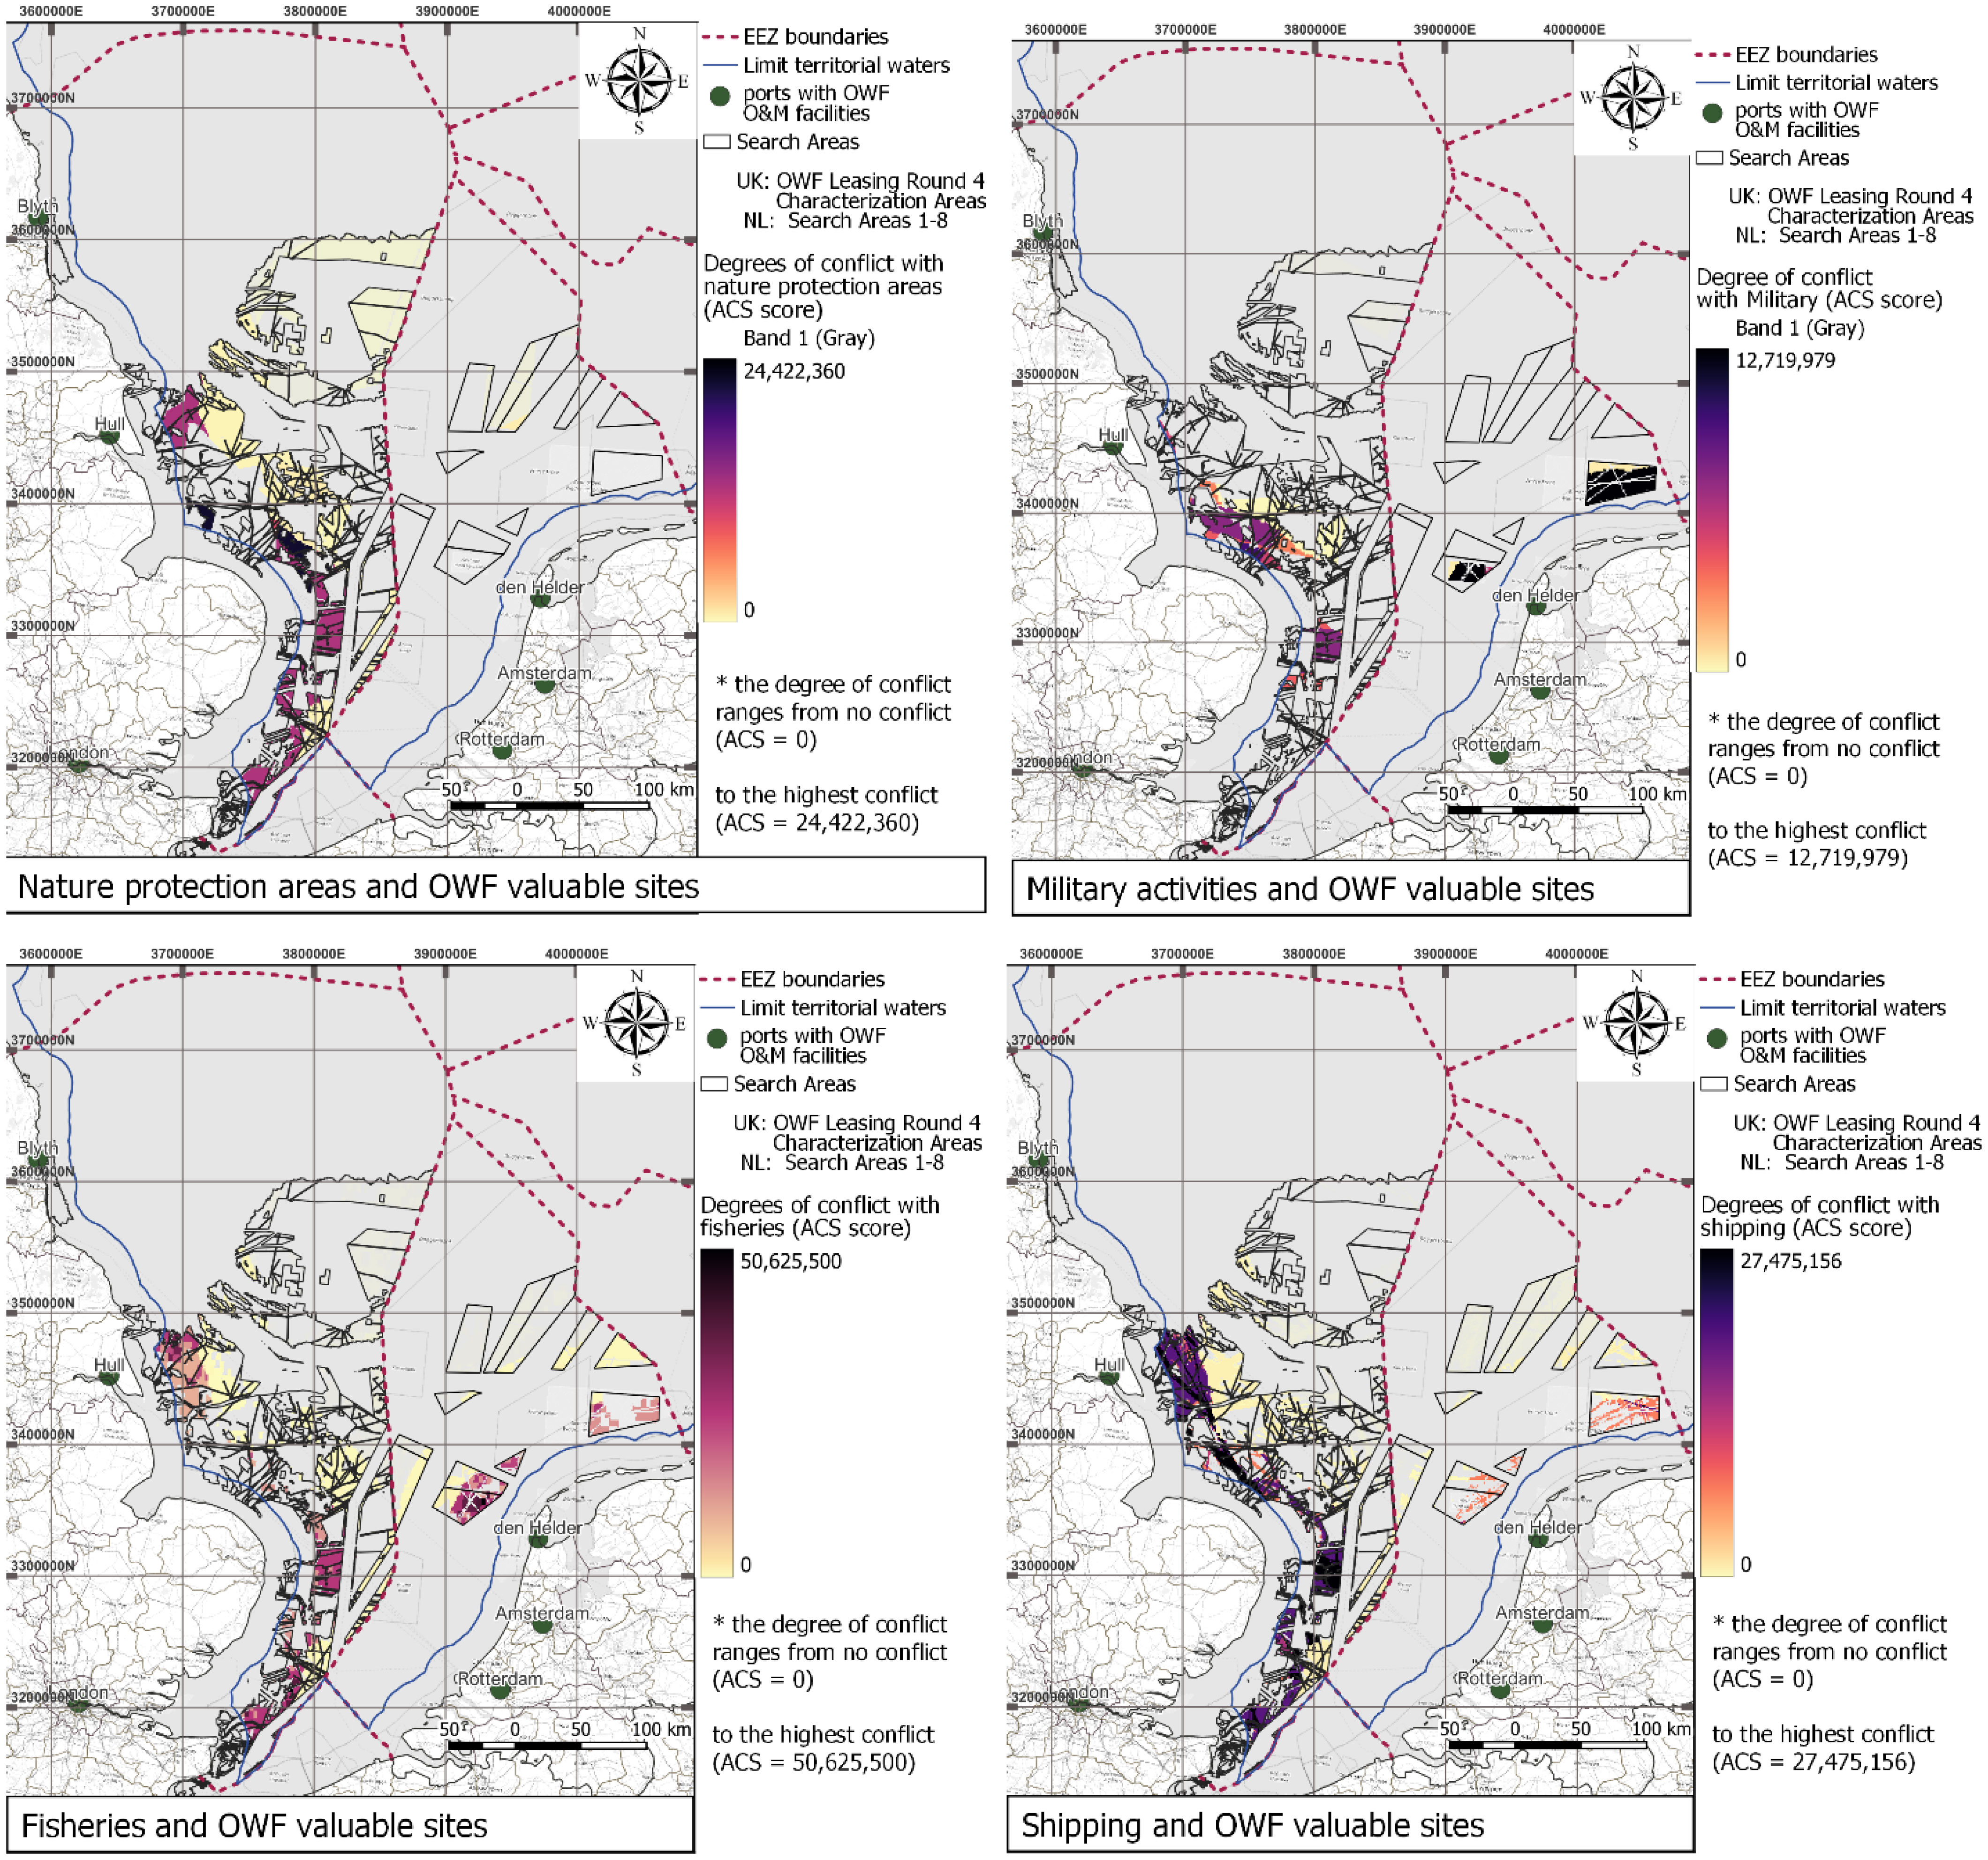
Figure 15 Distribution of conflict areas within the Search areas for future OWF developments, beyond 2030, by sea user.
The new 2030-2050 search areas for the Dutch EEZ, mapped out through the Draft North Sea Program 2022 – 2027(2), are sufficient to cover the requirements for a low energy demand of 38 GWs in 2050, resulting in an excess space equivalent to approx. 10.5 GWs. In the case of a high demand of 72 GWs in 2050, however, these proposed areas of search are still lacking approx. 23.45 GWs. Therefore, the question remains how to more efficiently use the designated areas to best balance the risks and opportunities of interaction with multiple other sea users in the low demand scenario and to identify the most suitable locations for additional areas in the high demand scenario. Using the proposed framework, we show the high level of conflict with military activities and fisheries in Search areas 2,8,4 and with nature protected areas and shipping for Search areas 6 and 7, in the Dutch EEZ (Figure 15).
For the analyzed area of the English EEZ, namely the East Offshore and North East Offshore Marine Plan areas, reaching the low 2050 targets of 75 GWs (UK Department for Business Energy and Industrial Strategy [BEIS], 2020) or the high targets of 108 GWs (Aunedi et al., 2021) requires additional search areas for OWF deployment to accommodate an approx. capacity of 19 GWs to 37 GWs (when excluding the energy targets for Scotland, and assuming a similar trend of deployment for Wales and Northern Ireland towards 2050). This is next to the current approved and planned areas for OWFs. Accommodating the additional GWs translates into around 2.7 to 5 times more space than the currently approx. 7GWs installed.
Alternatives for the future space allocation of OWF sites
Using the proposed framework, we can distinguish between alternatives in space allocation and conflict management options, towards a more transparent and efficient balancing process between the different sectoral goals. This can contribute to the strategic planning of future OWFs in a timely manner, synchronizing the timeline of deployment with techno-economically available options to solve, minimize or mitigate potential risks of interaction. Through the proposed weighted multi-criteria framework, we distinguish between different areas in terms of: 1) difficulty to solve conflicts (higher ACS and number of spatial overlaps) and 2) the potential for OWF deployment (value of the sites for OWF development and spatial footprint in km2 f each type of interaction).
The strategic and adaptive planning of future OWF deployment (beyond 2030) in the Dutch EEZ could be assisted by concrete maps and their related risk management options illustrating and quantifying alternatives between valuable areas of lower difficulty to access (Figure 16A)., equivalent to 8.67-15.4 GWs) and higher difficulty to access (Figure 16B., 33-59 GWs). The differences stand not only in the difficulty to access, but also in the relevance for the OWF deployment timeline, with the former located in areas closer to shore and, therefore, of immediate priority (lower investment costs in infrastructure). However, a decision in prioritizing one option over the other can also be related to the feasibility, costs and availability of the different management strategies selected for solving, minimizing or mitigating conflicts with the protected features in the two alternatives.
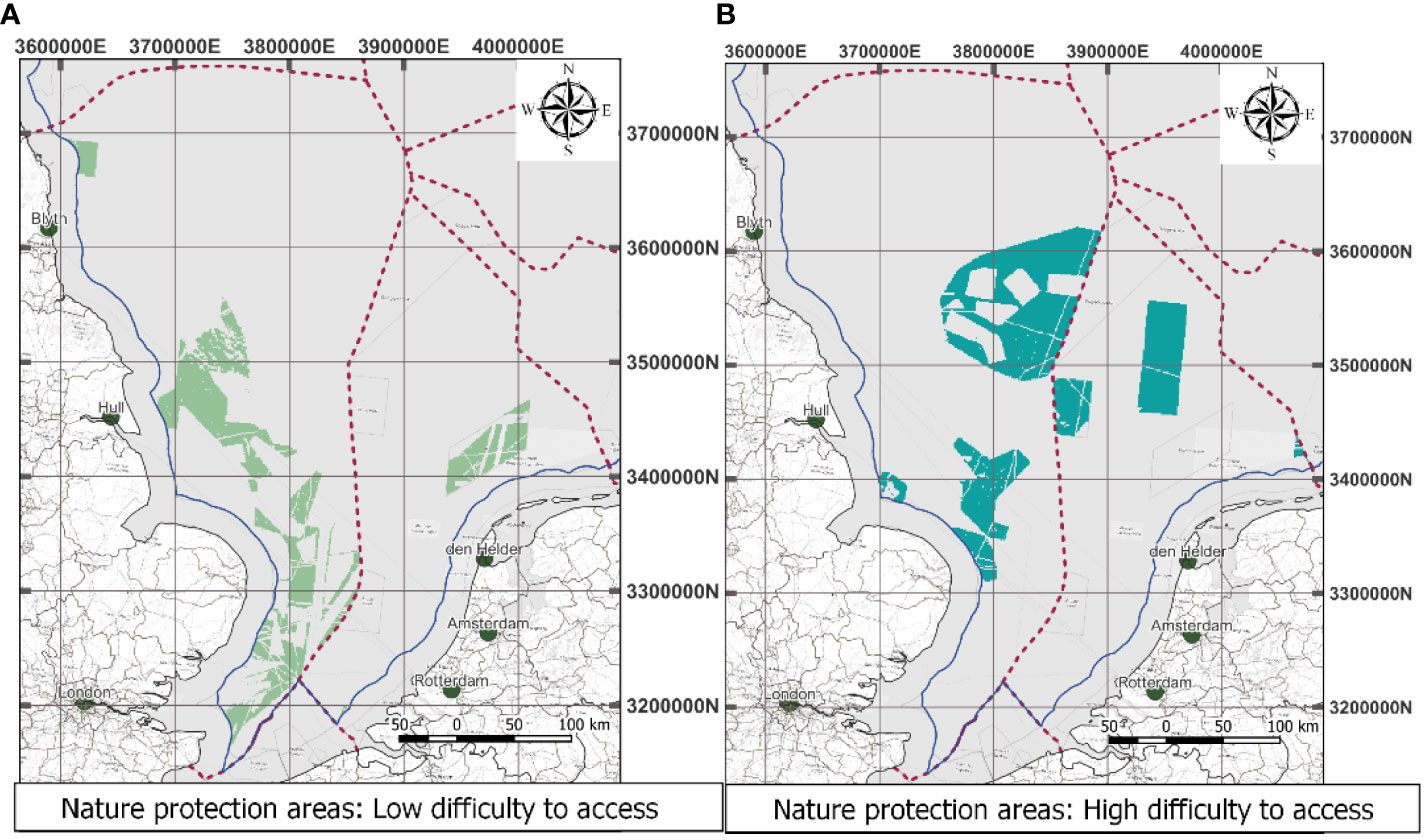
Figure 16 Areas of distinct focus for management strategies with nature protected sites: (A) low difficulty to access (low ACS/1 or 2 overlaps); and (B) high difficulty to access (high ACS/2 or 3 overlaps).
Similarly, for the English EEZ, using the above mentioned criteria, we distinguish between areas with lower difficulty to access (Figure 16A., equivalent of 84-149.7 GWs) and areas of higher difficulty to access (Figure 16B., 45-80 GWs). Unlocking the potential in the first category would imply mainly solving or minimizing the negative effects on mammal’s habitats (in medium and medium-high valuable sites for OWFs), but also on seabed habitats and to a lesser extend fish habitats (in medium-low and medium OWF value sites). For the second case, unlocking the highest potential (12.8-22.8 GWs in medium-high and high value OWF sites) would require management options addressing effects on seabed/fish and mammal habitats.
The maps quantifying the different areas of low difficulty to access with the shipping activity (Figure 17A) reveal a dispersed pattern of interaction, concentrated in particular in the English EEZ. In those areas, solving the conflict with the passenger and cargo routes could unlock 22.4-39.8 GWs (of which 24% in medium-high and 13.7% in high value OWF areas). On the other hand, Figure 17B indicates clear concentrations of areas with a high difficulty to access (high ACS from the interaction with tanker and passenger/cargo routes), predominantly located in medium and high value OWFs, with a minimum potential for 57 GWs (Netherlands) and 85 GWs (England), under a 3.6 MWs km2 /nsity. Nevertheless, this cumulates with requirements to manage the spatial and claims from other offshore users, such as marine protected areas, as presented in Figure 16.
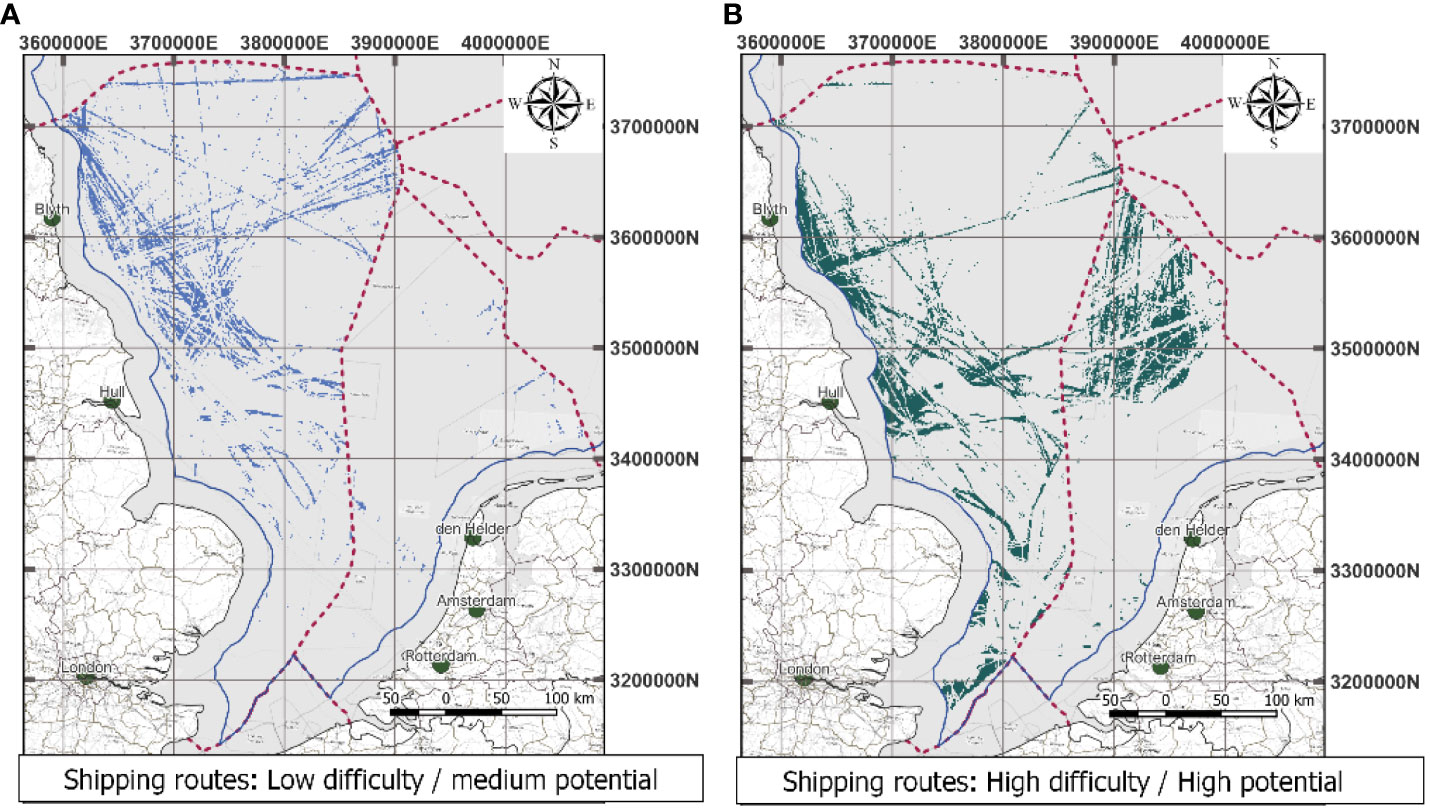
Figure 17 Areas of distinct focus for management strategies with shipping routes: a. low difficulty to access (low ACS from 1 or 2 overlaps)/medium potential of deployment (from 1.1 to 35GWs);b. high difficulty to access (high ACS from 2 or 3 overlaps) and high potential of deployment (from 8.4 to 67GWs).
For the interaction with the fishing activity, a number of key locations of low difficulty of conflict resolution (low ACS resulted from the interaction with maximum 3 fishing types) can be distinguished both in the English and Dutch EEZ (Figures 18A, B). We identified an area of 8.718 km2 th a high level of difficulty in managing the interaction with multiple types of fishing activities within the high value OWF sites in the English EEZ. This is significantly higher compared to 1.909 km2 f similar type of interaction within the Dutch EEZ (Figure 18C).
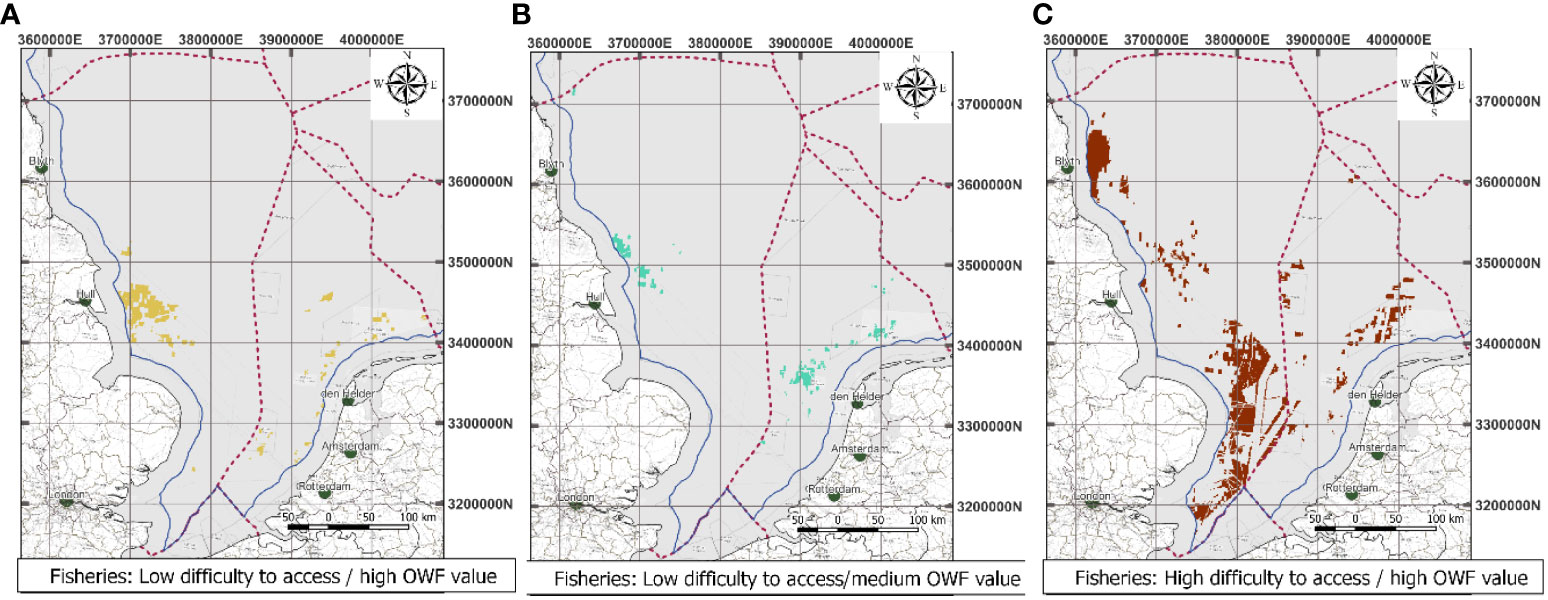
Figure 18 Areas of distinct focus for management strategies with fisheries: (A) low difficulty to access (low ACS from 1 or 2 overlaps) and high value for OWF deployment (from (B) low difficulty to access and medium value for OWF deployment (C) high difficulty to access and high value for OWF deployment.
Main conflict resolution strategies for different types of offshore conflicts
We also identify a number of management strategies for conflict resolution between OWFs and the other existing offshore users (Supplementary Data 3). Examples of measures can rank from adapting the type of foundation to the specific conditions of protected habitats and using sound protection curtains in the installation phase, to strategic management of the OWF area with the purpose of creating a “fish sanctuary” or seabed recovery sites.
Using the ACS raster files for different sea user types, we illustrate in Figure 19 priority areas where specific conflict resolution strategies are relevant for unlocking high value OWF sites (under 50 km from shore, with a water depth over -55m), taking into account the intensity of the conflicts. Hence, Figure 19A displays areas where the priority conflict resolution measures to be considered are related to compensation of the impacted activities (beam trawls, bottom seine, bottom otter trawls) and minimization of effect by layout adaptation (to accommodate and reduce impacts on protected habitats) while also indicating synergy with the local habitats (fish sanctuary/seabed restoration). Areas mapped in Figure 19B are indicating priority sites where measures such as layout adaptation, cable routing and turbine distancing could potentially address the conflict with pelagic trawls fisheries and static gear, over a total area of 10.522 km2 in the Dutch EEZ and 8.160 km2 in the English EEZ. Additionally, Figure 19C underline sites where the “passage through corridors” should be part of the management strategies in order to address the safe and smooth navigational requirements.
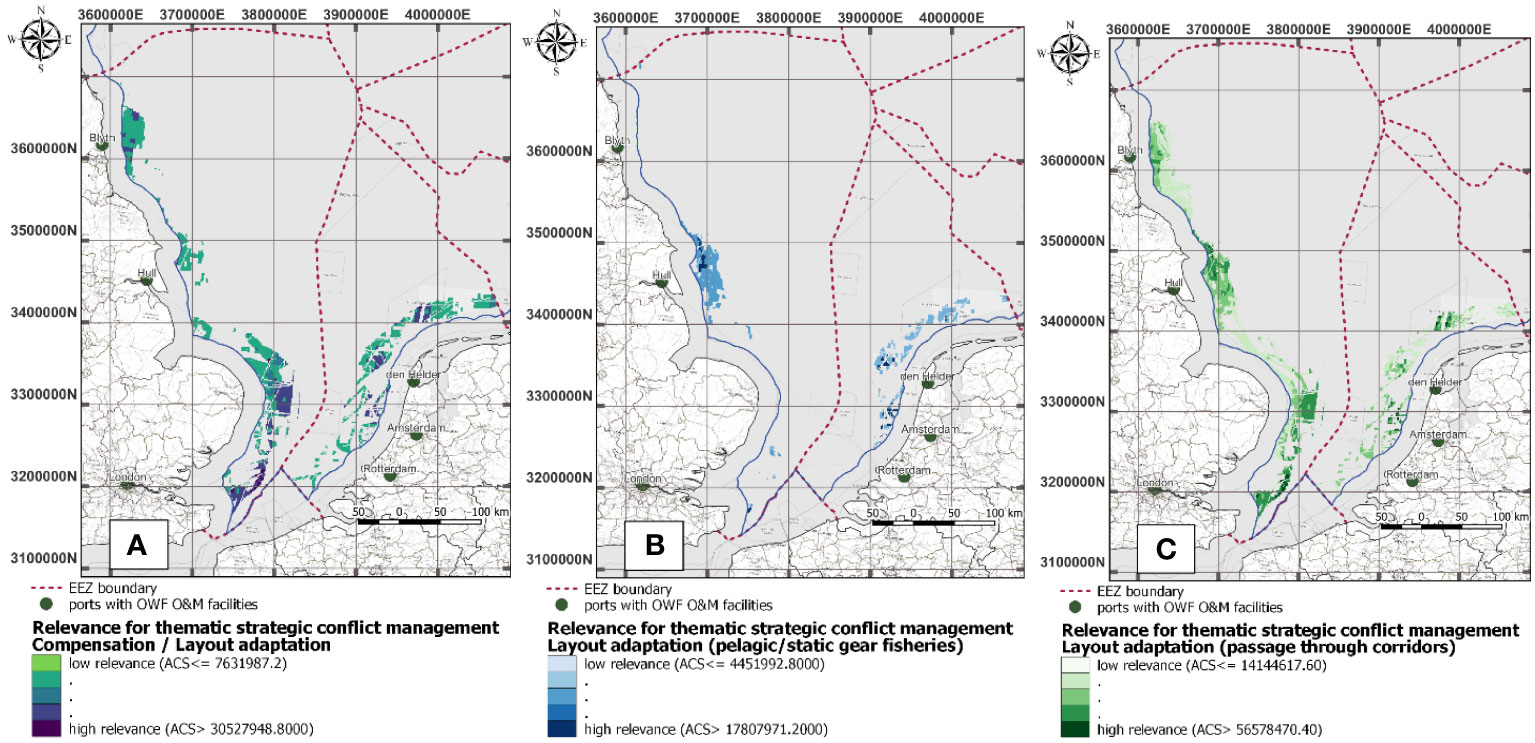
Figure 19 Spatial localization of priority areas (within high value OWF sites) where specific conflict resolution strategies can be relevant (based on level of conflict-ACS values and management strategies for the overlapping sea user types): (A) compensation (fisheries: beam trawls, bottom otter trawls, bottom seine)/layout adaptation/synergies (seabed/fish habitats); (B) layout adaptation/cable routing/turbine distancing (fisheries: pelagic trawls, static gears); (C) areas for passage through corridors (fisheries and shipping).
While for the English EEZ, the interaction with the high intensity shipping activities is distributed relatively equally in the medium and medium-high value areas for OWFs, in the Dutch EEZ those interactions take place to the highest degree in the high value OWF areas (Figure 20). This could result in two different strategies for the strategic location of future OWF large-scale deployments. For the Dutch EEZ this could entail the urge to integrate designated “passing-through” shipping corridors in the OWF layout, while for the English EEZ this could lead to a focus of the search areas further away for the busy areas close to the shore. As a consequence, for a more efficient and integrated grid, developing the energy hub in the eastern and north-eastern part of the English EEZ could prove to be a long-term preferred solution. Therefore, the proposed framework can be seen as a transparent, rigorous, knowledge-based offshore conflict management tool which can support the just and rapid deployment of the planned 212 GWs of installed OWFs (nearly 8 times 25.9 GWs installed capacity in 2021 (Wind Europe, 2021)), towards reaching the 2050 energy targets in the North Sea basin.
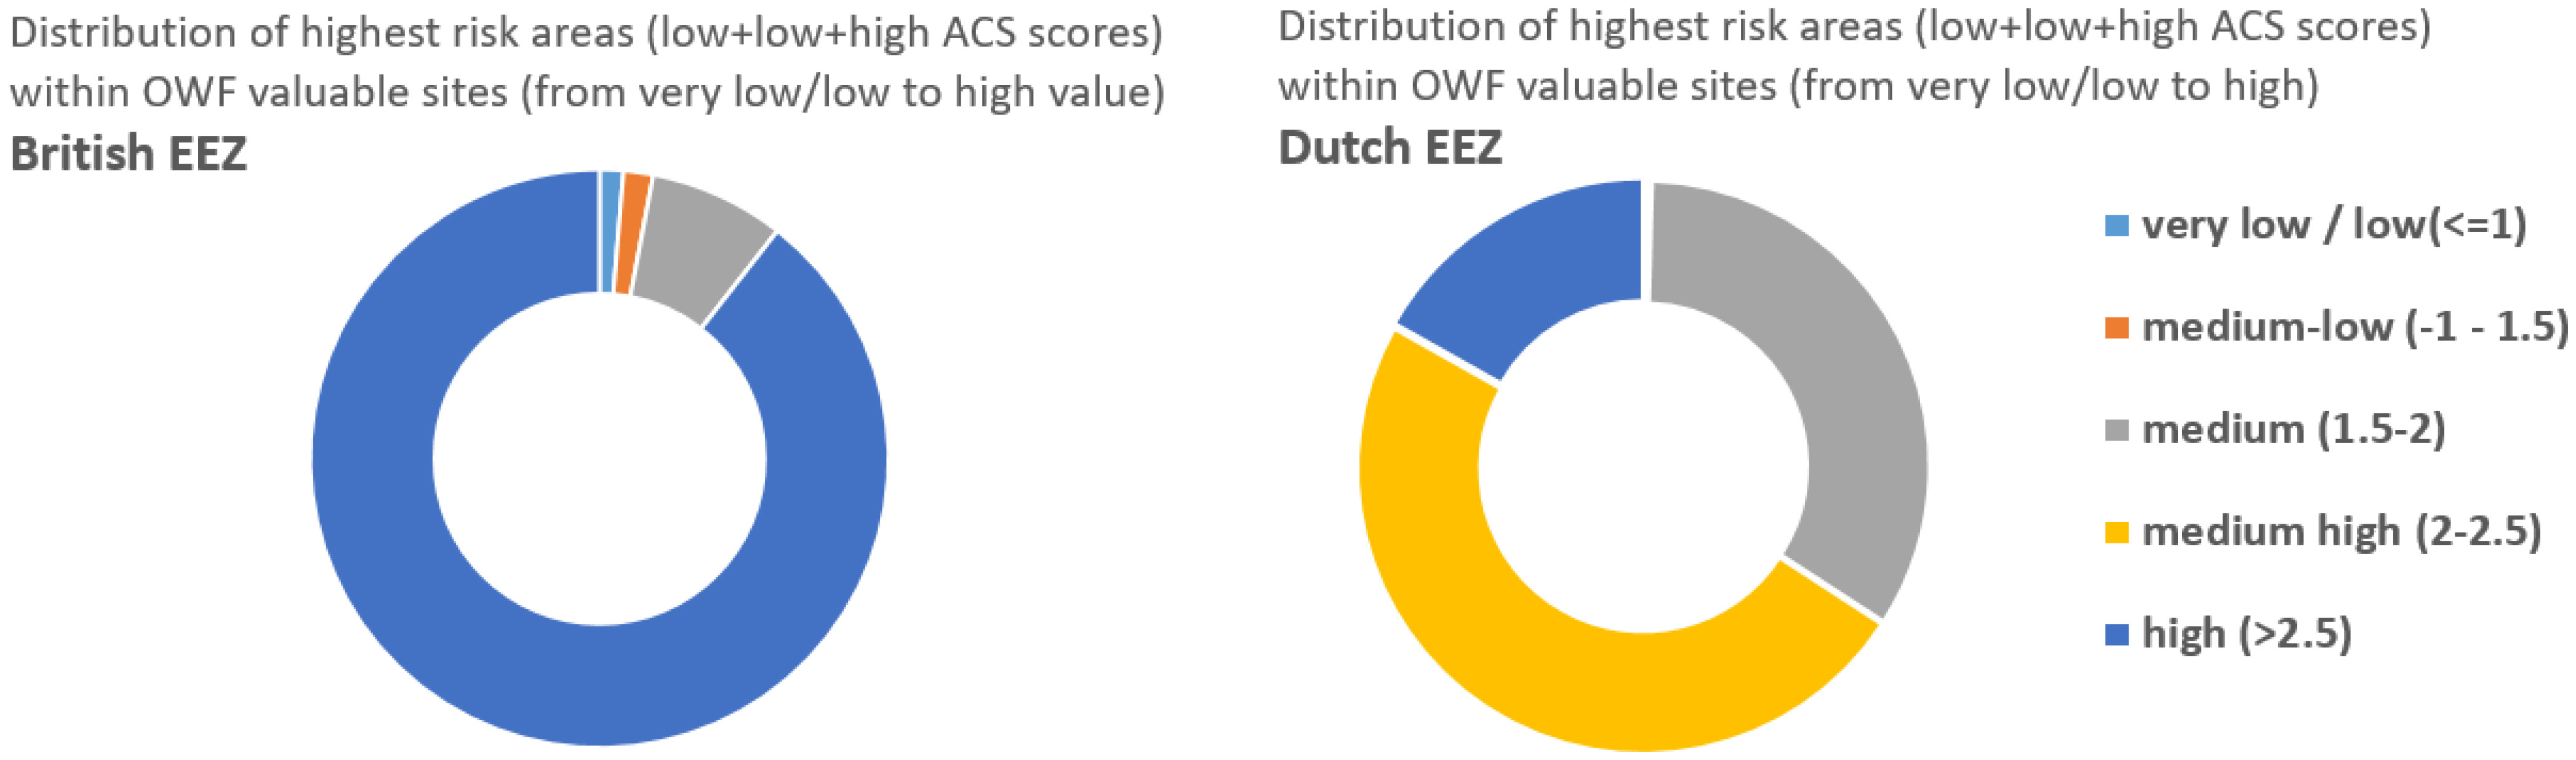
Figure 20 Distribution of highest risk areas for shipping activities within the OWF sites for the Dutch and English EEZ.
Discussion
The multi-criteria framework we propose in this paper may assist in MSP processes to include a more transparent and spatially detailed analysis for offshore interactions with OWF activities. Notably, by combining a spatial perspective and taking into account different sectoral objectives, the proposed framework may support MSP to promote a just and inclusive sea space management process, and to prevent delays in the authorization process towards a more rapid roll-out of RES offshore.
Unlocking valuable areas and risk management options
Using the proposed framework, we can connect risk to conflict resolution management options (addressing the precautionary principle and adaptive planning) and reduce uncertainties by creating a tool that brings together knowledge of the cause-effect chain, to be used in decision-making. Using the ACS scores to evaluate the level of conflict with different sea user types and the spatial distribution of those conflicts within the OWF valuable sites, we can indicate which conflicts and interactions should be first addressed in order to unlock valuable sites for OWF deployment (Tables 3 and 4).
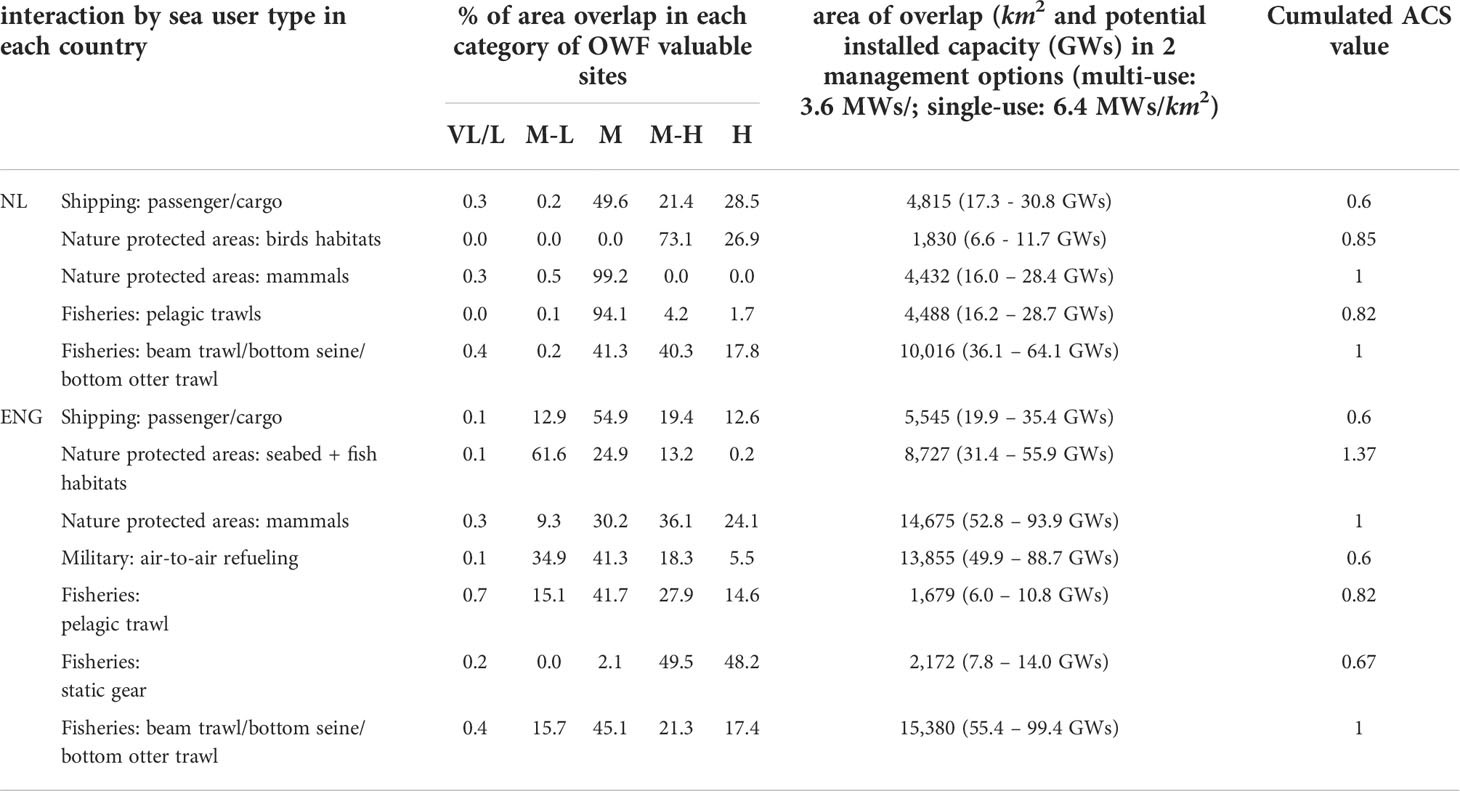
Table 3 Distribution of areas with low difficulty to unlock (low ACS and 1 or 2 overlapping interactions), with a medium or high OWF development potential (minimum 6 GWs installed capacity), within OWF valuable sites (VL-very low/L-low; ML-medium-low; M-medium; MH-medium high; H-high).
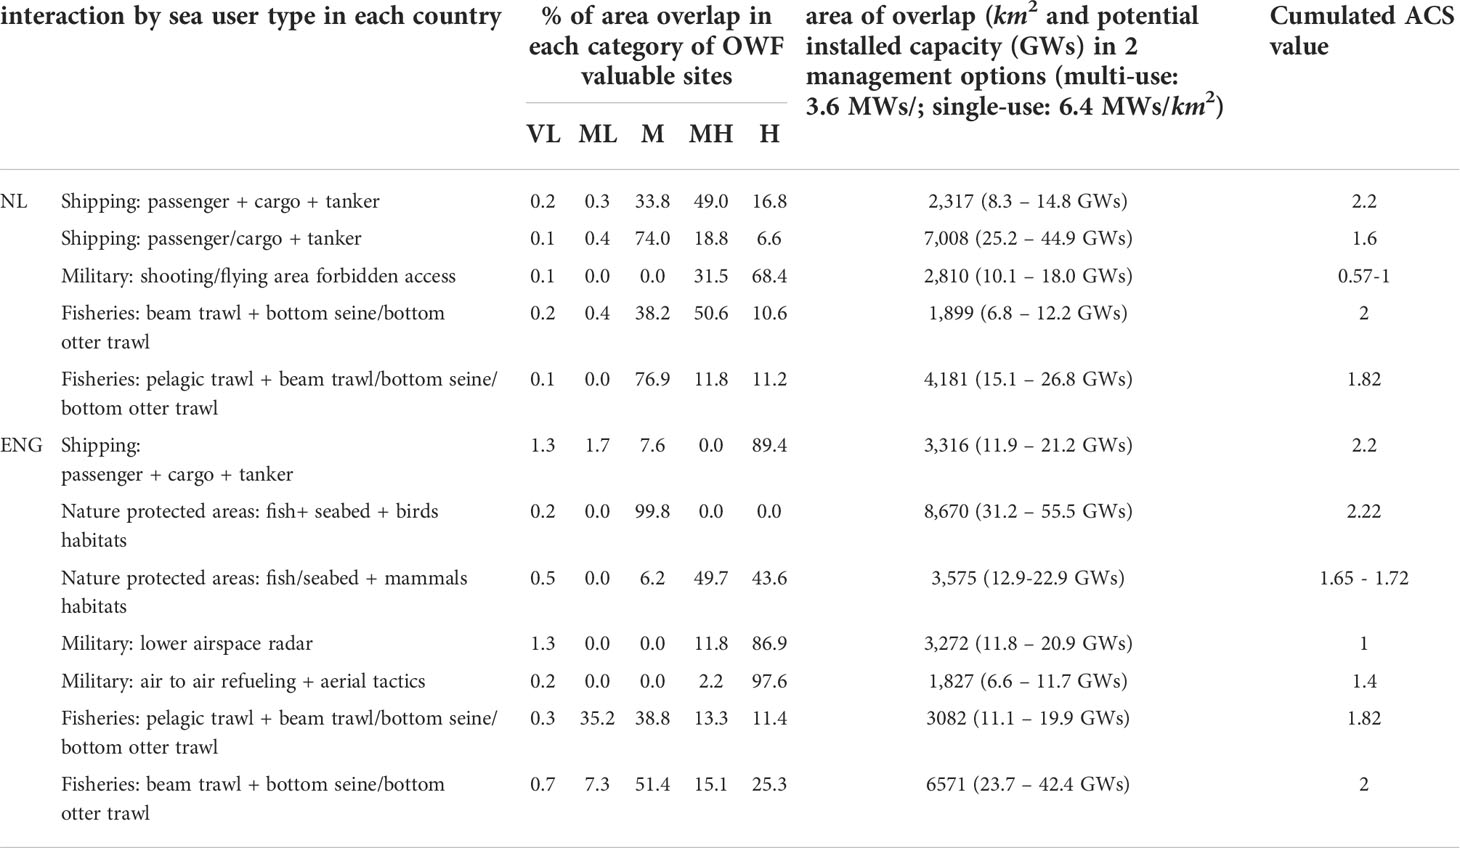
Table 4 Distribution of areas with high difficulty to unlock (high ACS/2 or more overlapping interactions), with a medium or high OWF development potential (minimum 6 GWs installed capacity).
Most viable options include areas with limited conflict scores (Table 3), such as the beam trawl, bottom seine or bottom otter trawl fisheries, which would unlock 36.1-64.1 GWs in the Dutch EEZ and 55.4-99.4 GWs in the English EEZ. The management options could include not only financial compensation for reduced revenues, shared insurances for potential gear or turbine damages, but also technical solutions such as monitoring and layout adaptation. Within the nature protection area user group, the most noticeable interaction is with mammal’s habitats, which covers areas equivalent to 16-28.4 GWs in the Dutch case and 52.8-93.9 GWs. However, in the Dutch case the interaction is located mainly in medium value sites for OWF deployment (99.2%) as compared to the more evenly distributed interaction for the English case (30.2%, 36%, 24% in medium, medium-high, high OWF value sites). This can lead to accelerated implementation of technical solutions (sound protection, use of gravitational foundations), particularly in the English case, in order to access the high OWF sites.
Areas much more difficult to unlock with either high ACS and multiple overlaps (or both) are presented in Table 4. Most of these types of conflicts are concentrated in areas with medium and high value for OWFs. Those are areas between 70-150 km from ports with facilities for OWF construction, O&M facilities, but also at 50-100 km from energy demand areas (urban and industrial areas), and with a water depth between -55- -120 m. Here, considering “passing through corridors” for tankers, passenger and/or cargo would unlock approx. 23.6 GWs in a multi-use scenario. On the other hand, in a single-use scenario, where shipping routes will be deviated for the location of OWFs, collaborating with the shipping industry on logistics of alternative shipping routes or compensation for longer shipping distances could unlock approx.135.6 GWs in the Dutch EEZ. This would require technical and logistic solutions such as layout adaptation for “passing through corridors”, or negotiation of safety distances with the shipping industry.
The highest levels of conflict with the military activities are located for both case studies in high value OWF sites. The management of the interaction with lower radar space (fill-the-gap options, layout design to incorporate radar equipment), could unlock 11.8-20.9 GWs in the English high value sites (86.9%) for OWFs, while accessing the military areas for shooting/flying (currently forbidden access, subject to relocation) could unlock 10.1-18 GWs in medium-high (31.5%) and high (68.4%) OWF sites, in the Dutch EEZ.
The concentration of high conflicts in medium value sites for OWF deployment indicates not only the depletion of options in high value OWF sites (closer to the shore, in shallow waters), but also the unlocked potential for areas further from the shore, with a lower degree of conflict, in particular with shipping and military activities. Focusing on less valuable OWF sites (deeper waters, further from shore), as a result of the roll-out of technologies such as floating OWFs or the development of energy hubs, could benefit from lower levels of conflict with a lower number of sea users.
Methodological reflections
The main advantage of the method proposed is a transparent, rigorously knowledge-based and consistent framework to quantify and quality for the diverse and interlinked claims in the offshore space, taking into account sectoral objectives, reflected in both spatial and non-spatial risks and opportunities for the interaction with OWF infrastructure. We rely as inputs on an extensive literature review (scientific papers, industrial and governmental reports, environmental impact assessments, expert judgement from previous studies (Gușatu et al., 2021)), in order to identify and quantify the specific risks and management strategies for offshore interactions.
Nevertheless, our approach also has its limitations. For one, our input is derived from existing research, policies, regulations and geospatial knowledge of the presence of activities/species. Secondly, while our approach to ranking and weighing is based explicitly on existing sectoral objectives and preferences, exact ranking and weighing may well be subject to altering choices between both stakeholders and through time. Our approach, however, also allows for such changes. Both data input, assumptions and thus, assigned ranks and weights may be altered. In doing so, there is clear scope for alterations and possible improvements, for example in response to a changing legal and policy environment, differing stakeholder perspectives, but also information on the dynamic character of the analyzed activities. This may, for example, allow for input from different stakeholders, changes due to legal processes (such as the designation of new marine protected areas, changing of the status or re-drawing the boundaries of protected sites), or seasonality of activities, since the intensity or routing of fishing or shipping activity has a changing pattern in the four seasons. By involving a multitude of stakeholders and representatives of the analyzed sectors in the primary steps of the data inputs, the proposed framework could benefit from site-specific and sector-specific knowledge. More specifically, input from sector representatives could contribute in better defining the spatial location of valuable sites or routes for the four analyzed activities, but also in better defining and weighting the risks and opportunities related to the interaction with the OWF sector. Examples of potential improvements in representing the valuable sites for the analyzed activities are: fish markets for fishing activities or preferred routes to access the valuable grounds (Holmes et al., 2020), migration routes for fish species, mammals, birds and bats, routes linking the on-land military basis and the designated military sites, etc. Finally, also limitations related to input data, such as the uneven knowledge regarding the interaction between the different sectors and OWFs (there is more research on OWF- fisheries and protected areas, than it is on OWF-shipping and military) may prompts improvements. Currently, there is a clear preference in recent scientific literature for analyzing the potential multi-use with fisheries and protected areas as compared to shipping and military activities, potentially linked to the willingness and urgency of the different sectors to mediate and collaborate towards joint solutions. Despite the noted limitations, our proposed framework offers a comprehensive approach to human activities and users of the marine space, linking ecological, socio-economic and technological consequences with spatial claims. The proposed framework of analysis can be used with different input parameters, assumptions and weights, depending on the impacts/effects of technological advancements and lessons from best practices in the interaction between offshore activities. As such, it can easily be fine-tuned to include improvements and variations following alternative perspectives and future research.
Conclusions
A first key contribution of the framework we propose is to identify valuable areas for OWFs that may be unlocked, and which risk management options may be applied in doing so. When focusing on large-scale deployments in the Netherlands, the largest potential (cumulated area of interaction and value of OWFs areas) concentrates in medium value OWF sites, where the biggest trade-offs involve OWFs and mammal habitats, tanker routes and pelagic or trawls/bottom seine/bottom otter trawls fisheries. In the English case, the spatial location of conflict is more evenly distributed across OWF value sites, with most trade-offs assigned to seabed/fish and birds’ habitats in medium value OWFs, to tanker routes in medium and medium high OWF value sites, and to beam trawls/bottom seine/bottom otter trawls in medium-low through high value OWF sites.
With a lower presence in medium value OWFs, military activities are mainly claiming high value OWF sites, predominantly areas for flying in the Dutch EEZ and lower radar space zones in the English EEZ. However, with the availability of new technologies such as floating OWFs, the focus for OWF deployment might switch to currently less valuable OWFs sites (deeper waters). Also, areas further from shore might present a viable alternative for locating OWFs (north of the Dutch EEZ), as those display lower levels of conflict with other sea users.
Taking a comprehensive approach is, we argue, crucial as multiple users claiming the same space will imply a multitude of conflicting situations, each relying on different safety and operation rules, national or international laws and each prioritizing their own sectoral goals. During the authorization process, this complex interaction leads to project uncertainty and increased risk of delay or failure in implementing offshore wind projects. The proposed multi-criteria analysis framework relies on a robust knowledge basis for informing strategic spatial policy development in the allocation of space for OWFs. The robustness of the framework lies part in the input of policy considerations and stakeholder interests, also in part in the detailed spatial data and finally, in its capacity to be adapted to new knowledge or altered perspectives on interactions between sea uses and related conflict management strategies. We used our framework to quantify and qualify a number of key potential trade-offs between OWFs and four sea user groups. Moreover, through the identified solving/minimization/mitigation options, the strategic policies are provided with inputs not only on where the conflicts occur, but also how those can be dealt with. Applying this framework at a local or regional level can underpin future standardized practices, part of a timely, transparent and participatory decision-making process, in identifying and qualifying alternatives for the future OWF developments. This is of key relevance as it can provide the basis for further negotiations and discussions with various stakeholder groups that are less focused on prioritizing their own sectoral interests, but rather are interested in shared policy agreements that capture synergies and work with shared goals towards the sustainable, integrated, ecosystem-based and adaptive use of the marine resources.
The high ambitions of deploying over 212 GWs of OWFs in the North Sea basin by 2050, approx. 8 times more the 25.9 GWs installed capacity in 2021 (Wind Europe, 2021), will undoubtedly result in conflicts over the limited offshore space. The currently operational and the planned (by 2028) OWF areas are cumulating approx. 42.3 GWs and will occupy an area of approx. 9,722 km2 The additional space to be claimed will involve multiple spatial conflicts, in particular with tanker routes, mammal habitats, military areas with forbidden access and trawler fisheries (beam, bottom seine, bottom otter) in the Dutch high, medium-high and medium value sites. Similarly, the spatial conflicts with passenger/cargo routes, mammal habitats, lower airspace radar areas, trawler fisheries (beam, bottom seine or bottom otter) will most compete with OWFs for space in the English OWF high, medium-high and medium value OWF areas. It is such knowledge that may prove crucial considering the future ahead of us. Thus, from a policy perspective, future OWF space allocation can clearly benefit from applying the proposed framework, while such an application may even challenge the suitability of the existing planned sites.
Data availability statement
The original contributions presented in the study are included in the article/Supplementary Material. Further inquiries can be directed to the corresponding author.
Author contributions
LG, CZ, and AF conceived the ideas and designed the methodology. LG collected and performed the formal analysis of the data, realized the maps and graphs. LG wrote the first draft. LG, CZ, and AF participated in the review and formulation of the final draft. CZ and AF provided supervision. All authors contributed to project administration, edited the manuscript and gave final approval for publication.
Funding
This research is part of the ENSYSTRA project that has received funding from the European Union’s Horizon 2020 research and innovation program under the Marie Skłodowska-Curie grant agreement No 765515.
Conflict of interest
The authors declare that the research was conducted in the absence of any commercial or financial relationships that could be construed as a potential conflict of interest.
Publisher’s note
All claims expressed in this article are solely those of the authors and do not necessarily represent those of their affiliated organizations, or those of the publisher, the editors and the reviewers. Any product that may be evaluated in this article, or claim that may be made by its manufacturer, is not guaranteed or endorsed by the publisher.
Supplementary material
The Supplementary Material for this article can be found online at: https://www.frontiersin.org/articles/10.3389/fmars.2022.959375/full#supplementary-material
Supplementary Figure 1 | Qualification and quantification of conflicts using the average conflict resolution scores (ACS), areas of overlap and number of interaction, for the interaction between OWF valuable sites and nature protected areas.
Supplementary Figure 2 | Localization of analyzed sea user types within the OWF valuable sites and ACS scores of interaction with OWFs – Nature protected areas.
Supplementary Figure 3 | Localization of analyzed sea user types within the OWF valuable sites and ACS scores of interaction with OWFs – Military activity areas.
Supplementary Figure 4 | Localization of analyzed sea user types within the OWF valuable sites and ACS scores of interaction with OWFs – Shipping routes.
Supplementary Figure 5 | Localization of analyzed sea user types within the OWF valuable sites – Fisheries.
References
Ørsted Collaborating with fisheries. Available at: https://orsted.com/en/sustainability/answering-key-questions/collaborating-with-fisheries (Accessed November 1, 2021).
Ørsted (2018). “Hornsea Project Three Offshore Wind Farm,” in Communication Environmental Statement: Volume 2, Chapter 8 – Aviation, Military and Communication, vol. 5. .
Alexander K. A., Potts T., Wilding T. A. (2013). Marine renewable energy and Scottish west coast fishers: Exploring impacts, Opportunities and potential mitigation. Ocean Coast. Manage. 75, 1–10. doi: 10.1016/j.ocecoaman.2013.01.005
Andrew Gill B. B., Degraer S., Lipsky A., Mavraki N., Methratta E., Brabant R. (2020). Setting the Context for Offshore Wind Development Effects on Fish and Fisheries. Oceanography. 33 (4), 126. doi: 10.5670/oceanog.2020.411
Ashley M. C., Mangi S. C., Rodwell L. D. (2014). The potential of offshore windfarms to act as marine protected areas - A systematic review of current evidence. Mar. Policy. 45, 301–309. doi: 10.1016/j.marpol.2013.09.002
Aunedi M., Wills K., Green T., Strbac G. (2021). Net-Zero GB Electricity: Cost-Optimal Generation and Storage Mix (London: Imperial College London). doi: 10.25561/88966
Caceoğlu E., Yildiz H. K., Oğuz E., Huvaj N., Guerrero J. M. (2022). Offshore wind power plant site selection using Analytical Hierarchy Process for Northwest Turkey. Ocean Eng. 252, 111178. doi: 10.1016/j.oceaneng.2022.111178
Cleijne H., De R. M., Duvoort M., De K. W., Raadschelders J. (2020). North Sea Energy Outlook (The Netherlands: DNV-GL, Arnhem).
Confederation of European Shipmasters’ Associations (2018) International Regulations and Guidelines for Maritime Spatial Planning Related to Safe Distances to Multiple Offshore Structures. Available at: http://www.cesma-eu.org/MSP.pdf.
Copping A. E., Hemery L. G. (2020). OES-Environmental 2020 State of the Science Report: Environmental Effects of Marine Renewable Energy Development Around the World (US: OES-Environmental, Washington). doi: 10.2172/1632878
Degraer S., Carey D. A., Coolen J. W. P., Brabant R., Rumes B. (2020). Offshore wind farm artificial reefs affect ecosystem structure and functioning: A synthesis. Oceanography. 33 (4), 48–57. doi: 10.5670/oceanog.2020.405
Department for Business E& IS (2019) The UK’S Draft Integrated National Energy and Climate Plan (NECP). Available at: https://assets.publishing.service.gov.uk/government/uploads/system/uploads/attachment_data/file/774235/national_energy_and_climate_plan.pdf.
Department for Environment Food and Rural Affairs (2014a). East Inshore and East Offshore Marine Plans (London: HM Government). Available at: http://www.nationalarchives.gov.uk/doc/open-%0Ahttps://www.gov.uk/government/publications/east-inshore-and-east-offshore-marine-plans.
Department for Environment Food and Rural Affairs (2014b). East Inshore and East Offshore Marine Plans (London: HM Government).
Deveci M., Özcan E., John R., Covrig C. F. (2020). Pamucar D. A study on offshore wind farm siting criteria using a novel interval-valued fuzzy-rough based Delphi method. J. Environ. Manage. 270, 110916. doi: 10.1016/j.jenvman.2020.110916
Directorate-General Maritime Affairs and Fisheries (2020). The EU Blue Economy Report 2020 (European Parliament and Council, Brussels).
Ehler C., Douvere F. (2009). Marine spatial planning: a step-by-step approach, IOC Manuals and Guides 53 (Paris: United Nations Educational, Scientific and Cultural Organization), 99.
European Parliament and Council. (2008). DIRECTIVE 2008/56/EC OF THE EUROPEAN PARLIAMENT AND OF THE COUNCIL of 17 June 2008 Establishing a Framework for Community Action in the Field of Marine Environmental Policy (Marine Strategy Framework Directive) Vol. 164 (Brussels: European Parliament and Council, Brussels) 19–40.
Gil-García I. C., Ramos-Escudero A., García-Cascales M. S., Dagher H., Molina-García A. (2022). Fuzzy GIS-based MCDM solution for the optimal offshore wind site selection: The Gulf of Maine case. Renew Energy. 183, 130–147. doi: 10.1016/j.renene.2021.10.058
Gimpel A., Stelzenmüller V., Haslob H., Berkenhagen J., Schupp M. F., Krause G. (2020). Offshore-Windparks: Chance für Fischerei und Naturschutz. Thünen à la Cart 7. 627, 1644–1655. doi: 10.1016/j.scitotenv.2018.01.133
Gimpel A., Stelzenmüller V., Töpsch S., Galparsoro I., Gubbins M., Miller D. (2018). A GIS-based tool for an integrated assessment of spatial planning trade-offs with aquaculture. Sci. Total Environ. 627, 1644–1655. doi: 10.1016/j.scitotenv.2018.01.133
Government of the Netherlands (2019). Climate Agreement (The Hague: Government of the Netherlands). doi: 10.1016/J.ENG.2016.04.009
Government of The Netherlands (2021a). Draft North Sea Programme 2022 – 2027 (The Hague: Ministry of Infrastructure and Water Management).
Government of The Netherlands (2021b) Renewable energy - Offshore wind farms. Available at: https://www.government.nl/topics/renewable-energy/offshore-wind-energy (Accessed February 19, 2022).
Gușatu L. F., Menegon S., Depellegrin D., Zuidema C., Faaij A., Yamu C. (2021). Spatial and temporal analysis of cumulative environmental effects of offshore wind farms in the North Sea basin. Sci. Rep. 11 (1), 1–18. doi: 10.1038/s41598-021-89537-1
Harley M., Drewitt A., Gilliand P., Cleary B., Langston R., Southgate M., et al. (2009) Wind Farm Development and Nature Conservation. Available at: www.iberdrolarenewables.us/.
Hengl T. (2006). Finding the right pixel size. Comput. Geosci. 32 (9), 1283–1298. doi: 10.1016/j.cageo.2005.11.008
Hermans A., Prusina I., Bos O., Kilinge M. (2020). Nature-Inclusive Design: A Catalogue for Offshore Wind Infrastructure (Wageningen: Witteveen+Bos, Wageningen Marine Research). doi: 10.13140/RG.2.2.10942.02882
Holmes S., Natale F., Gibin M., Guillen J., Alessandrini A., Vespe M. (2020). Where did the vessels go? An analysis of the EU fishing fleet gravitation between home ports, fishing grounds, landing ports and markets. PloS One 15 (5), 1–13. doi: 10.1371/journal.pone.0230494
de Koning S., Steins N., van H. L. (2021). Balancing sustainability transitions through state-led participatory processes: The case of the dutch north sea agreement. Sustain. 13 (4), 1–16. doi: 10.3390/su13042297
Kyvelou S. S., Ierapetritis D. (2019). Discussing and analyzing “maritime cohesion” in MSP, to achieve sustainability in the marine realm. Sustain. 11 (12), 1–29. doi: 10.3390/su11123444
Lehmann P., Ammermann K., Gawel E., Geiger C., Hauck J., Heilmann J. (2021). Managing spatial sustainability trade-offs: The case of wind power. Ecol. Econ. 185, 107029. doi: 10.1016/j.ecolecon.2021.107029
Lester S. E., Costello C., Halpern B. S., Gaines S. D., White C., Barth J. A. (2013a). Evaluating tradeoffs among ecosystem services to inform marine spatial planning. Mar. Policy. 38, 80–89. doi: 10.1016/j.marpol.2012.05.022
Lester S. E., Costello C., Halpern B. S., Gaines S. D., White C., Barth J. A. (2013b). Evaluating tradeoffs among ecosystem services to inform marine spatial planning. Mar. Policy. 38, 80–89. doi: 10.1016/j.marpol.2012.05.022
Lombard A. T., Ban N. C., Smith J. L., Lester S. E., Sink J. K., Wood S. A. (2019). Practical approaches and advances in spatial tools to achieve multi-objective marine spatial planning. Front. Mar. Sci. doi: 10.3389/fmars.2019.00166
Loughney S., Wang J., Bashir M., Armin M., Yang Y. (2021). Development and application of a multiple-attribute decision-analysis methodology for site selection of floating offshore wind farms on the UK Continental Shelf. Sustain Energy Technol. Assessments. 47, 101440. doi: 10.1016/j.seta.2021.101440
Mahdy M., Bahaj A. B. S. (2018). Multi criteria decision analysis for offshore wind energy potential in Egypt. Renew Energy. 118, 278–289. doi: 10.1016/j.renene.2017.11.021
Marine Management Organisation Marine licensing: nationally significant infrastructure projects. Available at: https://www.gov.uk/government/collections/marine-licensing-nationally-significant-infrastructure-projects (Accessed March 22, 2021).
Marine Management Organisation (2020) North East Inshore and North East Offshore Marine Plan. Available at: https://assets.publishing.service.gov.uk/government/uploads/system/uploads/attachment_data/file/857247/DRAFT_NE_Marine_Plan.pdf.
Maritime & Coastguard Agency (2006) MARINE GUIDANCE NOTE MGN 543 (M+F) Safety of Navigation: Offshore Renewable Energy Installations (OREIs)-Guidance on UK Navigational Practice, Safety and Emergency Response. Available at: https://assets.publishing.service.gov.uk/government/uploads/system/uploads/attachment_data/file/502021/MGN_543.pdf.
Martínez-Gordón R., Sánchez-Diéguez M., Fattahi A., Morales-España G., Sijm J., Faaij A. (2022). Modelling a highly decarbonised North Sea energy system in 2050: A multinational approach. Adv. Appl. Energy. 5, 100080. doi: 10.1016/j.adapen.2021.100080
Mcpherson S., Bolton J., Walker H. (2019) East Anglia TWO Offshore Windfarm Chapter 15 Civil and Military Aviation and Radar. Available at: www.scottishpowerrenewables.com.
Mehdi R. A., Pålsson J., Nilsson H., van Overloop J. (2017). Improving the Co-Existence of Offshore Energy Installations & Shipping - Report on Work-Package 4.4 of the NorthSee Project.
Mehdi R. A., Schröder-Hinrichs J. U., van Overloop J., Nilsson H., Pålsson J. (2018). Improving the coexistence of offshore wind farms and shipping: an international comparison of navigational risk assessment processes. WMU J. Marit Aff. 17 (3), 397–434. doi: 10.1007/s13437-018-0149-0
Moulas D., Shafiee M., Mehmanparast A. (2017). Damage analysis of ship collisions with offshore wind turbine foundations. Ocean Eng. 143, 149–162. doi: 10.1016/j.oceaneng.2017.04.050
Nagababu G., Puppala H., Pritam K., Kantipudi M. P. (2022). Two-stage GIS-MCDM based algorithm to identify plausible regions at micro level to install wind farms: A case study of India. Energy. 248, 123594. doi: 10.1016/j.energy.2022.123594
Netherlands Enterprise Agency. (2022). New Offshore Wind Energy Roadmap. Available at: https://english.rvo.nl/information/offshore-wind-energy/new-offshore-wind-energy-roadmap (Accessed February 19, 2022).
Ntona M., Schröder M. (2020). Regulating oceanic imaginaries: the legal construction of space, identities, relations and epistemological hierarchies within marine spatial planning. Marit Stud. 19 (3), 241–254. doi: 10.1007/s40152-020-00163-5
Office of the Director of Defense Research and Engineering (2006). Report to the Congressional Defense Committees. The Effect of Windmill Farms On Military Readiness (Washington, US: Department of Defense).
Orsted. Collaborating with fisheries. (2021). Available at: https://orsted.com/en/sustainability/answering-key-questions/collaborating-with-fisheries (Accessed October 9, 2021).
Overlegorgaan Fysieke Leefomgeving. (2020). The North Sea Agreement (The Hague: Government of the Netherlands).
Prellezo R., Carvalho N., Guillen J. (2020). Scientific, Technical and Economic Committee for Fisheries (STECF) – The 2013 Annual Economic Report on the EU Fishing Fleet (STECF-13-15) (Luxembourg: Publications Office of the European Union). doi: 10.2760/500525
Rawson A., Rogers E. (2015). Assessing the impacts to vessel traffic from offshore wind farms in the Thames Estuary. Sci. Journals Marit Univ Szczecin. 43 (115), 99–107. Available at: https://eprints.soton.ac.uk/426239/1/16_zn_am_43_115_rawson_rogers_org044_2_.pdf.
Roach M., Cohen M., Forster R., Revill A. S., Johnson M. (2018). The effects of temporary exclusion of activity due to wind farm construction on a lobster (Homarus gammarus) fishery suggests a potential management approach. ICES J. Mar. Sci. 75 (4), 1416–1426. doi: 10.1093/icesjms/fsy006
Salvador S., Gimeno L., Sanz Larruga F. J. (2018). Streamlining the consent process for the implementation of offshore wind farms in Spain, considering existing regulations in leading European countries. Ocean Coast. Manage. 157, 68–85. doi: 10.1016/j.ocecoaman.2018.02.014
Sánchez-Lozano J. M., Ramos-Escudero A., Gil-García I. C., García-Cascales M. S., Molina-García A. A. (2022). GIS-based offshore wind site selection model using fuzzy multi-criteria decision-making with application to the case of the Gulf of Maine. Expert Syst. Appl. 210, 118371. doi: 10.1016/j.eswa.2022.118371
Schupp M. F., Bocci M., Depellegrin D., Kafas A., Kyriazi Z., Lukic I. (2019). Toward a Common Understanding of Ocean Multi-Use. Front. Mar. Sci. 6. doi: 10.3389/fmars.2019.00165
Schupp M. F., Kafas A., Buck B. H., Krause G., Onyango V., Stelzenmuller V. (2021). Fishing within offshore wind farms in the North Sea: Stakeholder perspectives for multi-use from Scotland and Germany. J. Environ. Manage. 279, 111762. doi: 10.1016/j.jenvman.2020.111762
Spijkerboer R. C. (2021). The Institutional Dimension of Integration in Marine Spatial Planning: The Case of the Dutch North Sea Dialogues and Agreement. Front. Mar. Sci. 8. doi: 10.3389/fmars.2021.712982
Stelzenmüller V., Gimpel A., Haslob H., Letschert J., Berkenhagen J., Brüning S. (2021). Sustainable co-location solutions for offshore wind farms and fisheries need to account for socio-ecological trade-offs. Sci. Total Environ. 776, 145918. doi: 10.1016/j.scitotenv.2021.145918
Suárez de Vivero J. L., Rodríguez Mateos J. C., Florido del Corral D. (2009). Geopolitical factors of maritime policies and marine spatial planning: State, regions, and geographical planning scope. Mar. Policy. 33 (4), 624–634. doi: 10.1016/j.marpol.2008.12.010
The Crown Estate (2019) Leasing Round 4 Seabed Bidding Areas. Available at: https://www.thecrownestate.co.uk/media/3338/tce-r4-seabed-bidding-areas.pdf.
UK Department for Business Energy and Industrial Strategy [BEIS] (2020) Energy White Paper: Powering Our Net Zero Future. Available at: https://www.gov.uk/government/publications/energy-white-paper-powering-our-net-zero-future.
White C., Halpern B. S., Kappel C. V. (2012). Ecosystem service tradeoff analysis reveals the value of marine spatial planning for multiple ocean uses. Proc. Natl. Acad. Sci. U S A. 109 (12), 4696–4701. doi: 10.1073/pnas.1114215109
Wicks D. (2020). The Coding Manual for Qualitative Researchers (3rd Edition). Vol 12 (London: Sage Publications). doi: 10.1108/qrom-08-2016-1408
Keywords: offshore wind farms, trade-offs, multi-criteria analysis, fisheries, shipping, military, nature protected areas
Citation: Guşatu LF, Zuidema C and Faaij A (2022) A multi-criteria analysis framework for conflict resolution in the case of offshore wind farm sitting: A study of England and the Netherlands offshore space. Front. Mar. Sci. 9:959375. doi: 10.3389/fmars.2022.959375
Received: 01 June 2022; Accepted: 02 September 2022;
Published: 28 September 2022.
Edited by:
Andrei Polejack, World Maritime University, SwedenReviewed by:
Yan Jiao, Virginia Tech, United StatesJose Santos Lopez Gutierrez, Polytechnic University of Madrid, Spain
Emre Tercan, General Directorate of Highways, Turkey
Copyright © 2022 Guşatu, Zuidema and Faaij. This is an open-access article distributed under the terms of the Creative Commons Attribution License (CC BY). The use, distribution or reproduction in other forums is permitted, provided the original author(s) and the copyright owner(s) are credited and that the original publication in this journal is cited, in accordance with accepted academic practice. No use, distribution or reproduction is permitted which does not comply with these terms.
*Correspondence: Laura Florentina Guşatu, bC5mLmd1c2F0dUBydWcubmw=