 Takao Yoshida
 Masaru Kawato
 Yoshihiro Fujiwara
 Yuriko Nagano
 Shinji Tsuchida
 Akinori Yabuki
- Deep-Sea Biodiversity Research Group, Marine Biodiversity and Environmental Assessment Research Center, Research Institute for Global Change, Japan Agency for Marine-Earth Science and Technology (JAMSTEC), Yokosuka, Kanagawa, Japan
Deep-sea ecosystems present difficulties in surveying and continuous monitoring of the biodiversity of deep-sea ecosystems because of the logistical constraints, high cost, and limited opportunities for sampling. Environmental DNA (eDNA) metabarcoding analysis provides a useful method for estimating the biodiversity in aquatic ecosystems but has rarely been applied to the study of deep-sea fish communities. In this study, we utilized pumped deep-sea water for the continuous monitoring of deep-sea fish communities by eDNA metabarcoding. In order to develop an optimum method for continuous monitoring of deep-sea fish biodiversity by eDNA metabarcoding, we determined the appropriate amount of pumped deep-sea water to be filtered and the practical number of filtered sample replicates required for biodiversity monitoring of deep-sea fish communities. Pumped deep-sea water samples were filtered in various volumes (5–53 L) at two sites (Akazawa: pumping depth 800 m, and Yaizu: pumping depth 400 m, Shizuoka, Japan) of deep-sea water pumping facilities. Based on the result of evaluations of filtration time, efficiency of PCR amplification, and number of detected fish reads, the filtration of 20 L of pumped deep-sea water from Akazawa and filtration of 10 L from Yaizu were demonstrated to be suitable filtration volumes for the present study. Fish biodiversity obtained by the eDNA metabarcoding analyses showed a clear difference between the Akazawa and Yaizu samples. We also evaluated the effect of the number of filter replicates on the species richness detected by eDNA metabarcoding from the pumped deep-sea water. At both sites, more than 10 sample replicates were required for the detection of commonly occurring fish species. Our optimized method using pumped deep-sea water and eDNA metabarcoding can be applied to eDNA-based continuous biodiversity monitoring of deep-sea fish to better understand the effects of climate change on deep-sea ecosystems.
1. Introduction
The deep sea, which comprises water depths below 200 m, is the largest ecosystem on Earth and has unique characteristics which support one of the highest levels of biodiversity in aquatic environments while harboring an ecosystem distinct from other marine and land-based ecosystems (Ramirez-Llodra et al., 2010; Costello and Chaudhary, 2017). With its large volume, the deep sea remains poorly understood, as there are several difficulties in tackling it: the access to and investigation of deeper oceanic waters are still limited (e.g., high cost, logistic difficulties, and limited opportunities for sampling). Thus, biodiversity in the deep sea has still not been fully elucidated (Ramirez-Llodra et al., 2010; Webb et al., 2010; Mora et al., 2011; Costello and Chaudhary, 2017; Fujiwara et al., 2021). Therefore, there is an urgent need to assess the biodiversity of deep sea ecosystems including biodiversity loss by climate change and anthropogenic activities through continuous monitoring.
Environmental DNA (eDNA) analysis for metabarcoding of macroorganisms using next-generation sequencing has been utilized for monitoring of biodiversity within aquatic ecosystems (Taberlet et al., 2012; Miya et al., 2015; Valentini et al., 2016; Vences et al., 2016). eDNA metabarcoding for simultaneous and highly sensitive detection of multiple species aimed at understanding species presence/absence, distribution of species, biomass estimates, and detection of introduced species, have been examined in various aquatic environments including oceans (Thomsen et al., 2012; Yamamoto et al., 2016; Weltz et al., 2017; Kelly et al., 2018; Ushio et al., 2018; Knudsen et al., 2019). As fish are the most diverse vertebrates, and include large predators with higher trophic levels, they are one of the key components of aquatic ecosystem functioning through the food web (Albouy et al., 2019). They are also sensitive to climate change and human activities (e.g., commercial fishing) (Gallo et al., 2020; Huang et al., 2021; Baag and Mandal, 2022).
Unfortunately, investigation of the deep sea is not easy to conduct and expensive to carry out, thus the opportunities for continuous biodiversity monitoring are limited. As a means of solving this issue, we focused on pumped deep-sea water as an eDNA source. More than ten deep-sea water pumping facilities for commercial and research purposes are located in Japan. Pumped deep-sea water is more easily accessible than the deep-sea water collected using water sampling devices (e.g., CTD with Niskin bottles) operated from a research vessel and is available at all times throughout the year on land. The most important advantage of pumped deep-sea water is that the continuous collection of a large amount of deep-sea water as required is possible. Thus, we utilized it as a source of eDNA for elucidating and continuous monitoring of the biodiversity in deep-sea fish in this study.
In the deep sea, eDNA analysis has focused on the sediments to survey the benthic communities (e.g., Guardiola et al., 2016; Sinniger et al., 2016; Laroche et al., 2021). On the other hand, a few surveys of aquatic communities in the deep sea have been conducted (Fraija-Fernández et al., 2020; McClenaghan et al., 2020; Merten et al., 2021). Recently, a combination of eDNA with other methodologies (e.g., imaging data) is shown to be a more comprehensive method of monitoring deep-sea biodiversity (Fujiwara et al., 2022; Stefanni et al., 2022). However, it is estimated that in the deep sea, where biomass is low, the amount of eDNA sources is lower than in coastal and surface seawater (McClenaghan et al., 2020). Moreover, several biological factors of deep-sea fish (e.g., slower metabolism) (Drazen and Seibel, 2007) may also affect the amount of eDNA sources released into seawater. Due to lower eDNA concentrations in deep-sea water, large filtration volumes of seawater are needed for biodiversity monitoring to detect a large number of taxa using the eDNA metabarcoding analysis (Bessey et al., 2020; Stauffer et al., 2021). Indeed, a larger number of species could be detected with increasing filtration volume (Miya et al., 2016; Bessey et al., 2020). Filtration volume for fish metabarcoding studies at river, stream, and reef varied from 0.15 – 6 L (Wilcox et al., 2016; Hinlo et al., 2017; Schumer et al., 2019), although 1 – 2 L of water is frequently filtered (reviewed in Bessey et al., 2020). Recent studies indicated that filtration of over 20 L of water from each site is required for detecting species until accumulation curves approach an asymptote (Cantera et al., 2019; Koziol et al., 2019). However, the greater the volume of water that is filtered, the greater the presence of PCR inhibitory substances and non-targeted eDNA, which may result in PCR inhibition as described previously (Deiner et al., 2015; Lear et al., 2017; Harper et al., 2019). Thus, we should also pay attention to the occurrence of such undesirable materials. Another important point of monitoring fish biodiversity using pumped deep-sea water is the number of sample replicates for metabarcoding analysis. Fish eDNA in seawater can be sporadically distributed, thus detection of fish using eDNA metabarcoding is strongly affected by its distribution, as previously reported (Bessey et al., 2020). An adequate number of sample replicates is effective for estimating biodiversity (Bessey et al., 2020).
For continuous monitoring of the biodiversity of deep-sea fish using pumped deep-sea water, seasonal sampling, and the sampling of water after natural disasters (such as earthquakes, extreme floods, and extreme storms), are planned using the deep-sea water from two pumping facilities on the Pacific coast of central Japan. One is in Akazawa (Shizuoka Prefecture, pumping depth: 800 m) facing Sagami Bay, and the other is in Yaizu (Shizuoka Prefecture, pumping depth: 400 m) facing Suruga Bay. In this study, we developed an eDNA metabarcoding analysis using pumped deep-sea water for understanding the biodiversity of deep-sea fish. To evaluate the effect of filtration volume of water on extracted eDNA yields, PCR amplification efficiency, and detected fish diversity in the metabarcoding analysis, various volumes of pumped deep-sea water were filtered. Moreover, we examined the effect of the number of sample replicates on the detection of deep-sea fish. For these purposes, we collected the deep-sea water at Akazawa on September 14–15, 2020, and at Yaizu on September 16–17, 2020.
2. Materials and methods
2.1. Deep-sea water sampling and filtration
Deep-sea water samples were collected from two deep-sea water pumping facilities belonging to DHC corporation, located in Akazawa, Shizuoka, Japan (34°50.331’N, 139°08.192’E, pumping depth: 800 m) on September 14–15, 2020, and Shizuoka prefecture at Yaizu, Shizuoka, Japan (34°51.196’N, 138°21.439’E, pumping depth: 400 m) on September 16–17, 2020. These facilities are located on the Pacific coast of central Japan, facing Sagami Bay and Suruga Bay, respectively. These facilities are located near our laboratory and can be rapidly accessed after natural disasters. Moreover, extensive surveys on marine organisms have been carried out in these areas and also have been continuously investigated. Environmental data including temperature (°C), salinity (‰), electrical conductivity (mS/cm), σT, chlorophyll a (Chl-a in µg/L), turbidity (FTU), and dissolved oxygen (DO; mg/L) of collected deep-sea water was measured using Rinko profiler sensors (JFE Advantech Co., Ltd., Nishinomiya, Japan). Collected pumped deep-sea water was immediately filtered on-site using a Sterivex filter cartridge (0.45 µm pore size, PVDF membrane, gamma-irradiated, sterile, SVHVL10RC, Merck KGaA, Darmstadt, Germany). The deep-sea water at Yaizu was filtered using peristaltic pumps (Masterflex L/S peristaltic pump with Masterflex L/S multichannel cartridge pump head and L/S 17G tubing, Masterflex, Radnor, PA, USA), and that at Akazawa was directly filtered by a filtration device driven by pressure due to the height differential (Supplementary Figure 1). At each site, 18 Sterivex filters at Akazawa and 8 at Yaizu were simultaneously used for filtration as one cycle, and at least 2.5 or at least 3 cycles were carried out per day. All filtration equipment used in this study was sterilized by immersion in a 1% or 6% chlorine-based commercial bleach solution before use. After filtration, the outlet of the Sterivex cartridge was capped by a sterilized protective plug (B. Braun, Melsungen, Germany), and approximately 2.0 mL of RNAlater (Thermo Fisher Scientific, Waltham, MA, USA) was immediately filled into the cartridge through the inlet to prevent the degradation of eDNA, and the inlet was capped similarly. Sterivex cartridges were refrigerated at 4°C for transport back to the laboratory and were stored at -30°C in the lab until eDNA extraction. To evaluate the effect of filtration volume of water on extracted eDNA yields, PCR amplification efficiency, and detected fish diversity in metabarcoding analysis, three or four replicates of pumped deep-sea water for each volume (10, 20, 30, 40, 48, 50, and 53 L at Akazawa; and 5, 10, 15, 20, 25, and 30 L at Yaizu) was filtered except for 48 L and 53 L at Akazawa, and 25 L and 30 L at Yaizu. Based on filtration time, filtration volumes were determined. In addition, to evaluate the relationship between the number of sample replicates and the detected fish diversity, we prepared 33 replicates of 20-L filtration from Akazawa, and 27 replicates of 10-L filtration from Yaizu, sharing a portion of filters with the water-volume experiments shown above. Based on the filtration time, the quantity of PCR products, and the ratio of total fish reads, filtration volumes (20-L filtration from Akazawa and 10-L filtration from Yaizu) were determined. Details of deep-sea water samples and environmental data were summarized in Tables 1 and Supplementary Table S1. Additionally, 20 L or 10 L of ultra-purified water (Milli-Q), filled in a single-use sterilized plastic bag (Sekisui Seikei Co., Ltd., Osaka, Japan) or a plastic tank sterilized with 6% chlorine-based commercial bleach solution, and filtered using the Sterivex filter cartridge by the peristaltic pump at each collection site and RNAlater was also filled into the cartridge as the same manner to serve as negative controls (Filtration blank; FB) during the filtration and subsequent experiments. An infiltrated Sterivex filled with RNAlater was also used as a negative control (eDNA elution blank; EB) at each collection site.
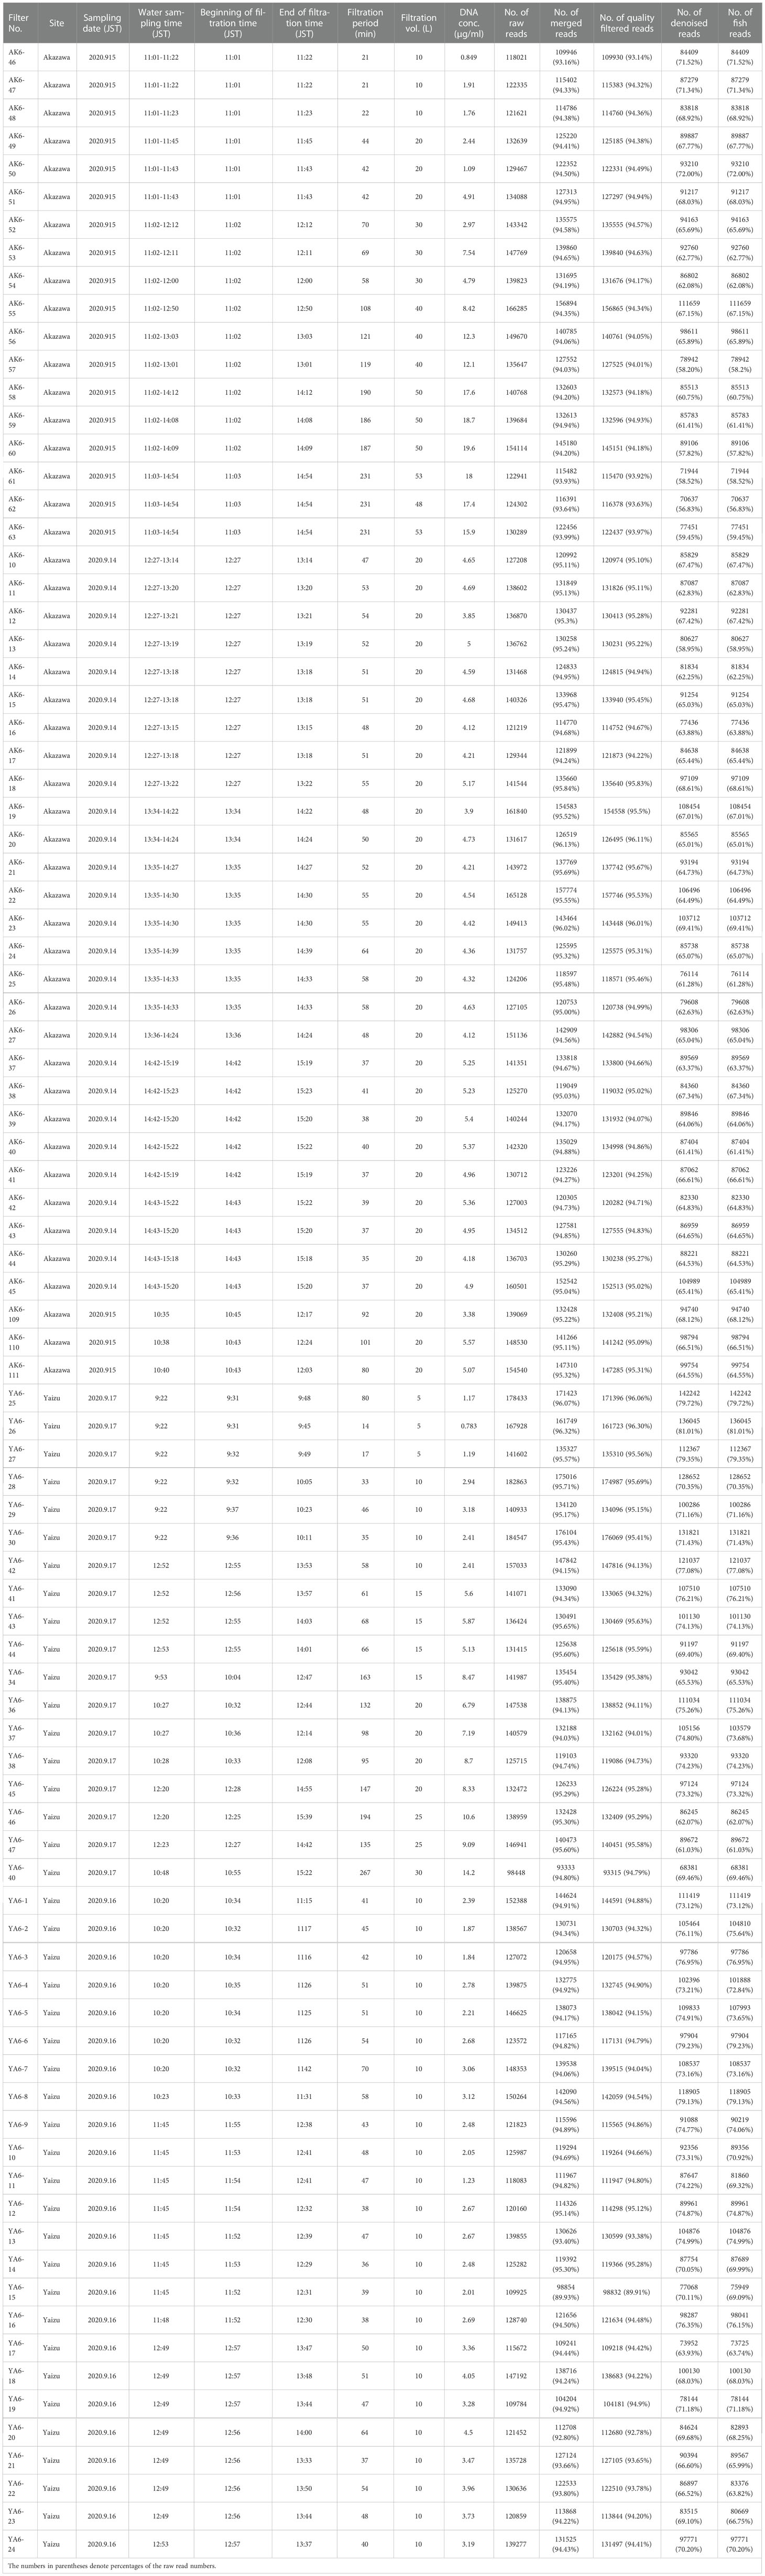
Table 1 Summary of filtered samples with filtration volume, recovered eDNA, read number of data processing, and taxon assignment.
2.2. DNA extraction, library preparation, and next-generation sequencing
eDNA collected on a filtration membrane in a Sterivex filter cartridge was extracted using a DNeasy Blood and Tissue Kit (QIAGEN, Valencia, CA, USA) as described previously (Kawato et al., 2021). In this method, the filter was removed from the Sterivex filter cartridge after opening the cartridge and was cut into small pieces for efficient lysis of eDNA sources (Kawato et al., 2021). eDNA was eluted into 200 µl of the elution buffer. Extracted eDNA concentrations were quantified by a Qubit dsDNA HS Assay Kit with a Qubit fluorometer (Life Technologies, Carlsbad, CA, USA). To evaluate the purity of extracted eDNA, the absorbance at 230 nm (A230), 260 nm (A260), and 280 nm (A280) and the ratio of A260/A230 were measured by a JASCO V-560 ultraviolet-visible spectrophotometer (JASCO, Tokyo, Japan).
Library preparation including two-step PCR for metabarcoding of fish in eDNA from pumped deep-sea water was performed according to a recently updated method (Kawato et al., 2021) which was based on a previously reported method by Miya et al., 2015. In the first round of PCR, multiplex PCR targeting the mitochondrial 12S rRNA gene sequence using two universal primer sets (MiFish-U-Forward, MiFish-E-Forward, MiFish-U-Reverse, and MiFish-E-Reverse; Supplementary Table S3) was performed. These primer sets amplify approximately 170-bp fragments in a hypervariable region of the mitochondrial 12S rRNA gene and append second-round primer binding adapters for the next-generation sequencing at both ends of amplicons (total length: ca. 300bp) (Miya et al., 2015). PCR amplification was carried out as previously described (Kawato et al., 2021) using Platinum SuperFi II DNA polymerase (Thermo Fisher Scientific, Waltham, MA, USA) and 1 X SuperFi II buffer containing 200 µM of each dNTP, 0.6 µM of each primer, and a minimum of 40ng eDNA template. Eight technical replicates for each eDNA template, as described in the previous studies (Miya et al., 2015), were prepared. PCR thermal cycling conditions were as follows; 98°C for 30 s for initial denaturation, followed by 38 cycles of denaturation at 98°C for 10 s, annealing at 60°C for 10 s, and extension at 72°C for 30 s; with a final extension at 72°C for 5 min. After PCR amplification, amplicons were analyzed by an E-gel Precast Agarose Electrophoresis System using an E-gel SizeSelect II Agarose Gels 2% (Thermo Fisher Scientific, Waltham, MA, USA) and an Agilent 2100 Bioanalyzer using an Agilent High Sensitivity DNA Kit (Agilent Technologies, Santa Clara, CA, USA). To evaluate the PCR amplification efficiency, the amount of PCR products represented by fluorescence intensity (i.e., peak area) of corresponding products obtained using the Agilent 2100 Bioanalyzer was calculated.
After the first round of PCR, the second round of PCR and next-generation sequencing was performed by Bioengineering Lab. Co., Ltd (Sagamihara, Japan) as described previously (Kawato et al., 2021). First-round PCR products were purified with AMPure XP (Beckman Courter, Brea, CA, USA). Second-round PCR was performed to add unique index sequences and Illumina sequencing adapters (2ndF, and 2ndR; Supplementary Table S3) using Ex Taq polymerase (Takara Bio, Shiga, Japan). Adapter-attached PCR fragments were purified using AMPure XP, and then these paired-end sequence libraries were sequenced using Illumina MiSeq (Illumina, San Diego, CA, USA) under 2 × 300 bp conditions.
To assess potential contamination of exogenous DNA during the experimental procedure including water filtration, eDNA extraction, and PCR amplification, first-round PCR amplifications using eDNA extraction solutions from FB and EB were conducted. All apparatuses and benches used in this procedure were cleaned with a 1% chlorine-based commercial bleach before use. Tubes and pipetting tips were also new and sterilized using a UV sterilizer light bulb. Detailed operating procedures employed to avoid any contamination risks were performed according to the previously described methods (Miya et al., 2015; Minamoto et al., 2021) and were performed by staff who were familiar with these procedures.
2.3. Bioinformatics
Amplicon raw sequence data were processed by a previously described method (Oka et al., 2021) using USEARCH ver11.0.667 (Edgar, 2010). Raw paired-end reads were merged, and low-quality (Q score < 2) and short reads (< 100 bp) were filtered out. Merged reads with differences over 5 bp in aligned regions were discarded. After trimming primer sequences, low-quality reads with an expected error rate of over 1% and short reads (<120 bp) were removed. Duplicated sequences from resulting sequences were found and unique sequences without singletons, doubletons, and tripletons which were removed to avoid false positives (Edgar, 2016), were obtained. Obtained sequences were processed to generate amplicon sequence variants (ASVs) and chimeric sequences were removed.
Assignment of operational taxonomic units (OTUs) from ASVs which was based on a previously described report (Oka et al., 2021), was performed by using MiFish database ver. 41. Instead of a faunal survey based on traditional methods, we conducted the literature surveys (e.g., habitat, habitat depth range, and distribution at Akazawa and Yaizu) of the resulting taxonomic hit species using FishBase www.fishbase.org) (Froese and Pauly, 2022) and an atlas of Japanese fishes (Nakabo, 2013) which comprehensively catalogs the fish species recorded in Japanese waters. To assess the taxonomic assignment of ASVs, a family-level neighbor-joining (NJ) phylogenetic tree including ASVs was built using MEGAX ver. 10210527 (Kumar et al., 2018) after alignment with MUSCLE (Edgar, 2004) which is a built-in program in MEGAX. ASVs with sequence identity of more than 98.5% (two nucleotide difference allowed) and a clade consisting of the same species were assigned to the species name of the reference sequence, while those with sequence identities of 80–98.5% and a clade consisting same species were named “U98.5” plus corresponding species names with highest identities. ASVs with sequence identities of lower than 80% were removed from taxonomic assignment. Each OTU in a monophyletic clade of species belonging to a particular genus was assigned the genus name followed by “sp.” with a sequential number (e.g., Lepidotrigla sp. 1, sp. 2). Each OTU in a clade of a particular family but not in a particular genus was named that family followed by “sp.” with a sequential number (e.g., Synaphobranchidae sp. 1, sp. 2 or U98.5_Myctophidae sp. 1, U98.5_Myctophidae sp. 2). Hereafter, the terms, “OTU” and “species” are used interchangeably.
Alpha diversity (ChaoI) for OTUs was analyzed using vegan v2.5.7 (Dixon, 2003) packaged in R 4.1.2 (R Core Team, 2021) set in RStudio Version 2021.09.1 + 372 (RStudio Team, 2020). The nonmetric multidimensional scaling (NMDS) based on the presence/absence data of the fish species in individual samples from Akazawa and Yaizu was performed using the Jaccard distance with the metaMDS function in the vegan package in R. Species accumulation curves based on the presence/absence data of the fish species detected by eDNA were analyzed using iNEXT ver. 2.0.20 packaged-in R 4.1.2 set in RStudio Version 2021.09.1 + 372. Graphics were constructed using the R package ggplot2 ver. 3.3.5 (Wickham, 2016).
2.4. Statistical analysis
The correlation between fish reads and filtration volumes was investigated by calculating Pearson’s product-moment correlation coefficient in R 4.1.2 set in RStudio Version 2021.09.1 + 372. The difference in the number of OTUs between Akazawa and Yaizu which obtained various filtration volumes was performed by using Dunnett’s test in multcomp ver. 1.4-17 packaged in R 4.1.2 set in RStudio Version 2021.09.1 + 372. We also compared the difference in the number of OTU from 33 replicates of 20-L filtration from Akazawa, and 27 replicates of 10-L filtration from Yaizu by using Mann–Whitney’s U test in exactRankTests ver 0.8-34 in R 4.1. set in RStudio Version 2021.09.1 + 372. A difference at p < 0.05 was considered significant in all tests.
3. Results
3.1. Comparison of filtration volume and extracted eDNA yields from pumped deep-sea water
The relationships between filtration water volume, filtration time, yields of recovered eDNA, and efficiency of PCR amplification were evaluated using filtered samples of pumped deep-sea water in varying quantities. At the Akazawa sampling site, we developed a filtration device that utilized the pressure due to the height difference (Supplementary Figure 1). This filtration device has 18 filters that can filter the larger volume of the pumped deep-sea water without an electric power supply. The filtration time across all the filtration volumes ranged from approximately 20 to 230 min for water samples collected at Akazawa and from approximately 15 to 260 min at Yaizu (Figure 1). Concentration and purity (ratio of A230/A260) of extracted eDNA were shown in Supplementary Figures 2, 3. eDNA was recovered from all the filtered samples at both sampling sites, regardless of the volume of filtered deep-sea water. Filtration water volumes had a positive effect on the amount of recovered total DNA, with higher eDNA concentrations recovered from larger filtration volume samples compared to those from smaller ones. DNA concentrations estimated by measuring the A260 absorbance indicated a higher value than that measured using fluorescent reagents, and the difference between them at Yaizu increased with increasing filtration volume (Supplementary Figure 3). For the Yaizu samples, PCR products by adding more template DNA were not detected in the larger samples of filtered water (Supplementary Figure 4). It was noted that the amount of PCR products obtained from 10-L filtered samples were the highest among the Yaizu samples only when the minimum amount of the template DNA solution was added (Supplementary Figures 4, 6). For the Akazawa samples, PCR products decreased only when the maximum amount of the template DNA solution was added (Supplementary Figure 5). In the negative controls which are filtration blanks including ultra-purified water filtered blanks and eDNA elution ones, no detectable DNA concentration was obtained and any PCR amplifications were not recognized.
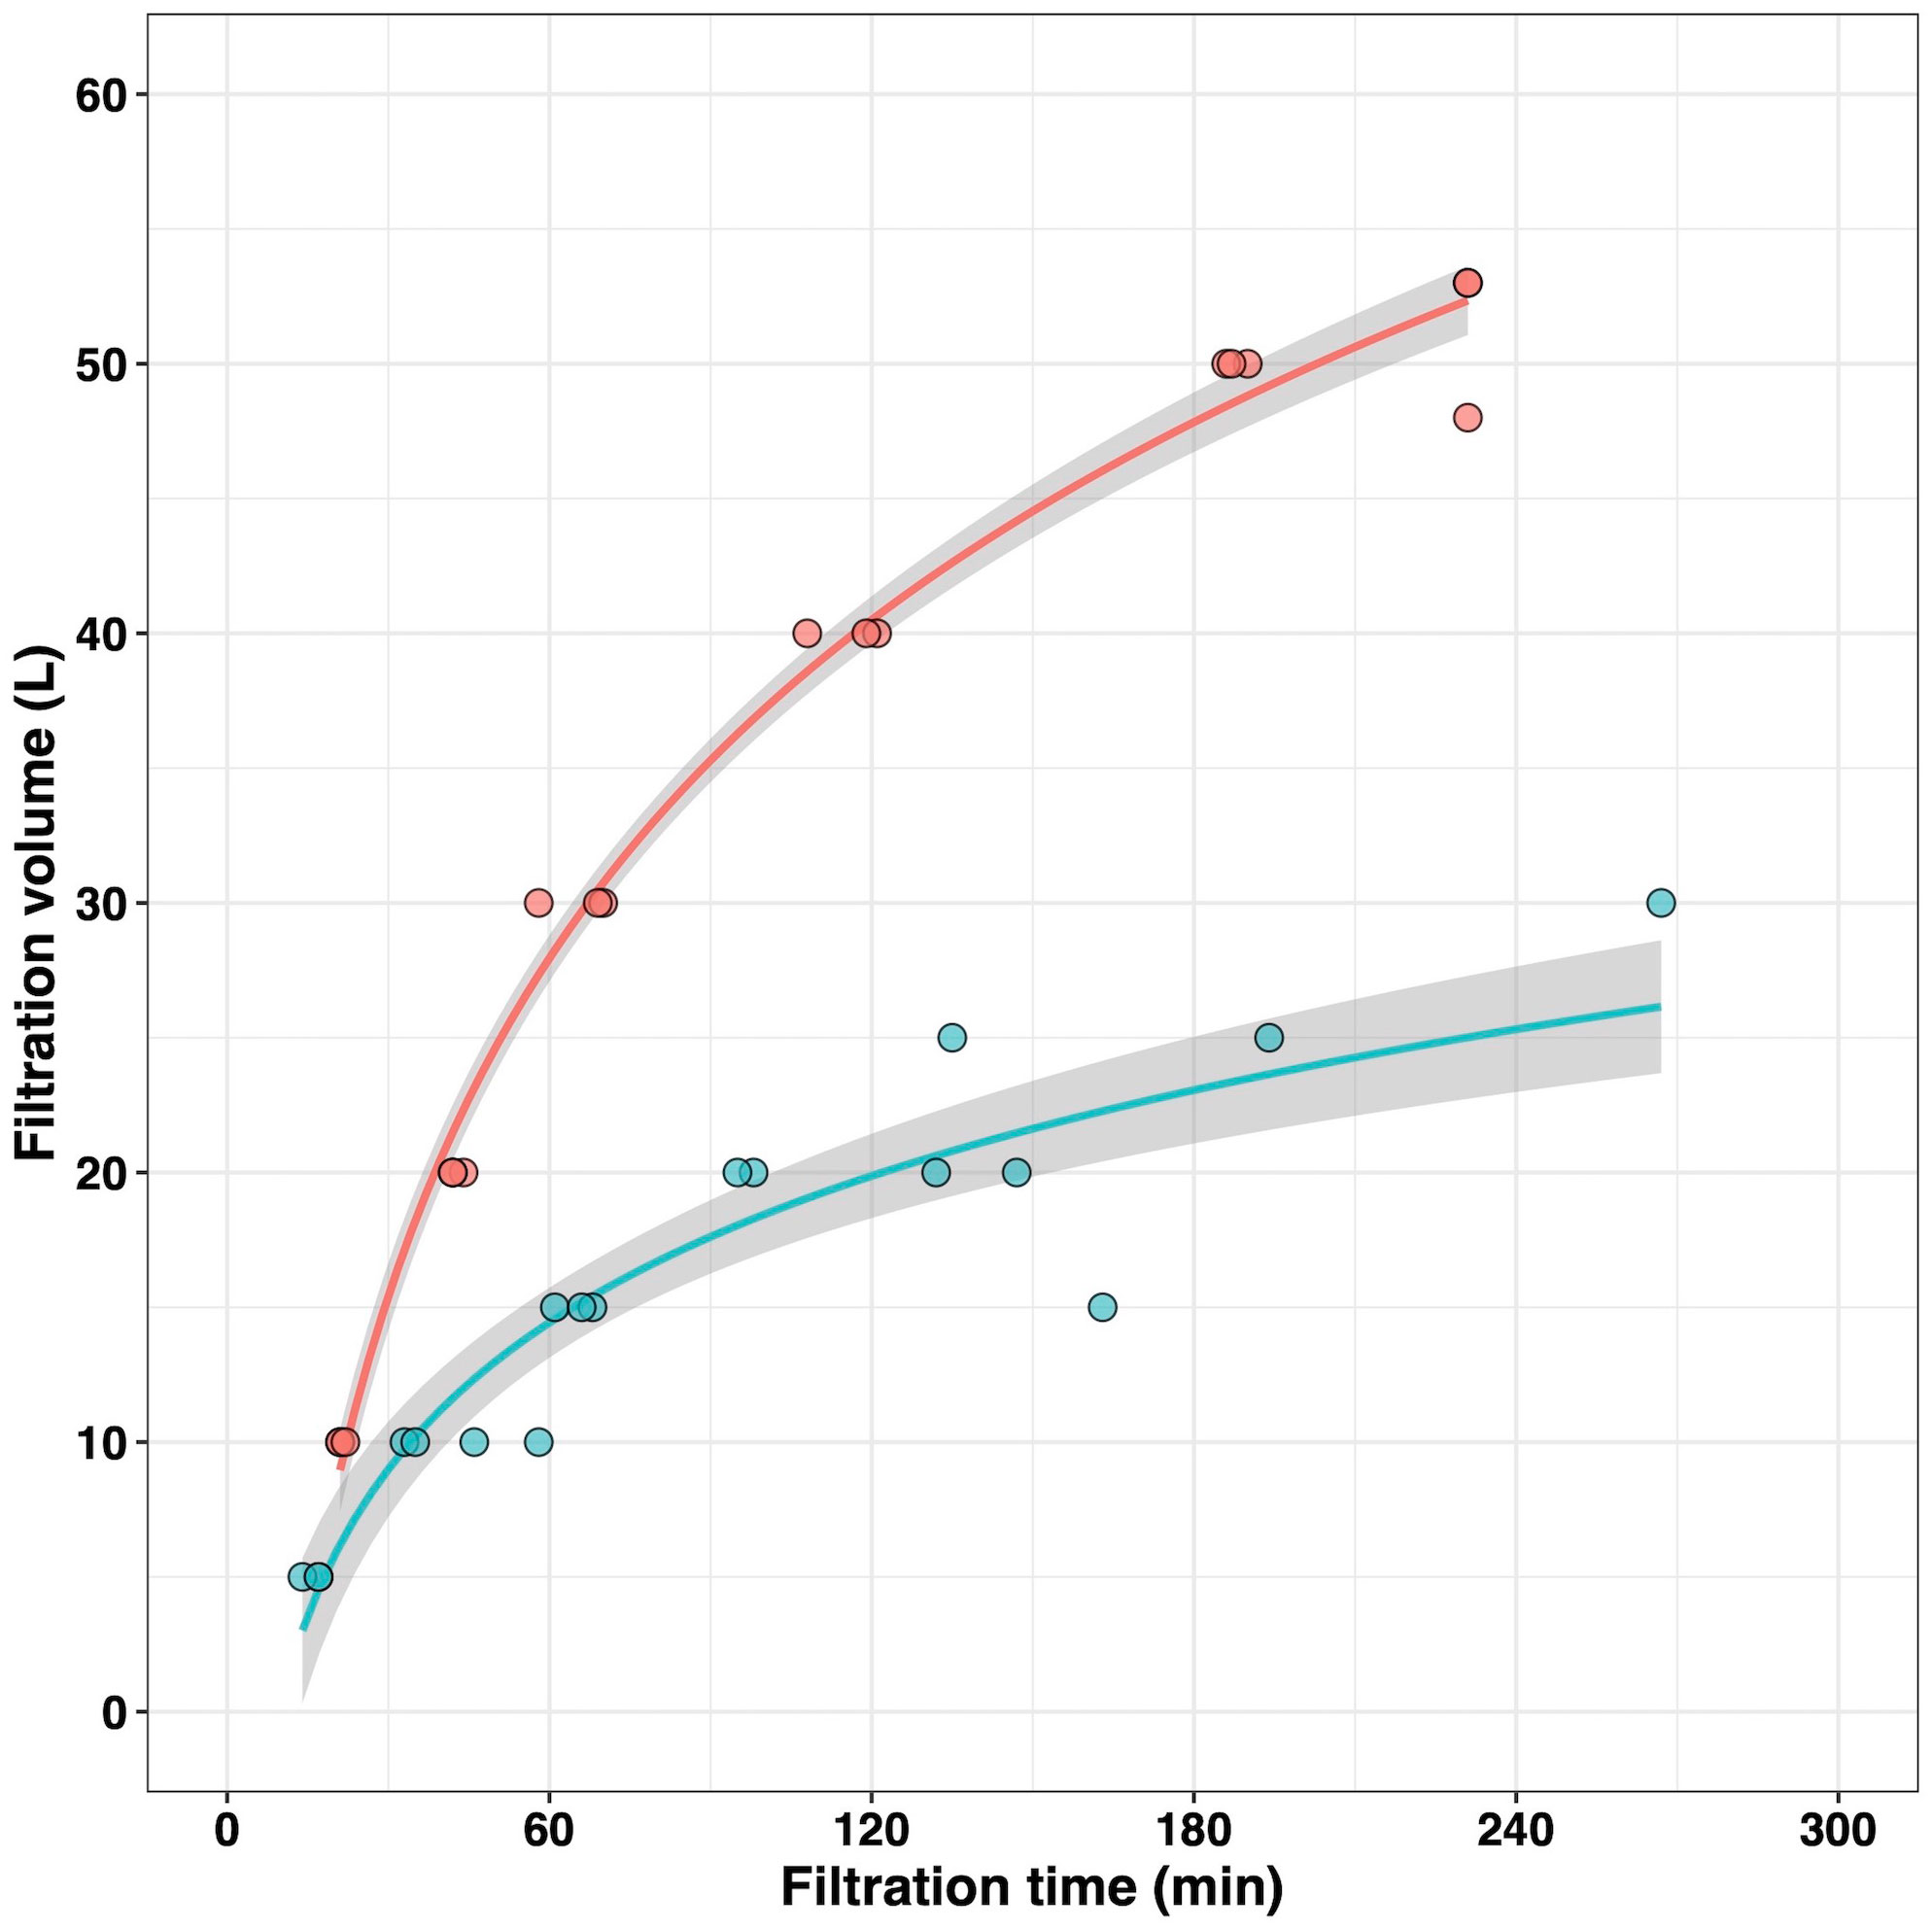
Figure 1 Time profile of the filtration volume collected at Akazawa and Yaizu. Circles represent experimental values. Lines and shadowed bands indicate the approximate curves and 95% confidence interval, respectively. Red and cyan represent information from Akazawa and Yaizu, respectively.
3.2. Sequencing summary of eDNA metabarcoding derived from pumped deep-sea water
A total of 90 fish metabarcoding libraries of filtered samples from various filtration-volume series (18 libraries at both Akazawa and Yaizu) and filtered sample replicates from fixed filtration-volume series (30 libraries at Akazawa and 24 libraries at Yaizu) were sequenced by MiSeq (detailed data were shown in Table 1). The number of raw reads (a total of 12,395,136 reads) for each library ranged from 98,448 to 184,547 with an average of 137,724 (Table 1). After sequence processing, a total of 8,450,653 reads were assigned as fish sequences which ranged from 68,381 to 142,242 per sample with an average of 93,896 (Table 1). Negative correlations between filtration volumes and the percentage of assembled fish reads were found at both sampling sites (Akazawa: Pearson’s r = -0.87, df = 16, P = 2.868e-06; Yaizu: Pearson’s r = -0.65, df = 16, P = 0.035; Table 1; Supplementary Figure 7). A total of 146 OTUs representing fish including 92 identified at the species level, 13 identified at the genus level, and 24 identified at the family level and 17 sequences with identities of 80-98.5% were detected at both sampling sites (Supplementary Table S2). These OTUs consisted of a total of 68 fish families and 88 genera (Supplementary Figure 8A) and most detected OTUs at both sampling sites were benthopelagic, bathydemersal, and bathypelagic species (Supplementary Table S2, Supplementary Figure 9). A total of 43 and 123 OTUs were detected at Akazawa and Yaizu, respectively (Supplementary Figure 8A). Of these OTUs, 29 OTUs (67.4% of detected total OTUs) at Akazawa and 89 OTUs (72.4% of detected total OTUs) at Yaizu were in good agreement with the known distribution records, i.e., distribution to Sagami Bay and Suruga Bay, respectively (Supplementary Table S2) (Nakabo, 2013). Moreover, the habitat depth range of 27 OTUs (62.8% of detected total OTUs) at Akazawa and 63 OTUs (51.2% of detected total OTUs) at Yaizu corresponded to the depth of each intake of the pumped deep-sea water (Akazawa: 800 m, Yaizu; 400 m, Supplementary Table S2; Figure 2). The species representing incongruent habitat depth range with the depth of each water intake were 9 OTUs (20.9% of detected total OTUs) at Akazawa and 25 OTUs (20.3% of detected total OTUs) at Yaizu (Supplementary Table S2; Figure 2), and 7 OTUs (16.3% of detected total OTUs) at Akazawa and 35 OTUs (28.5% of detected total OTUs) at Yaizu exhibited no records of habitat depth range from FishBase
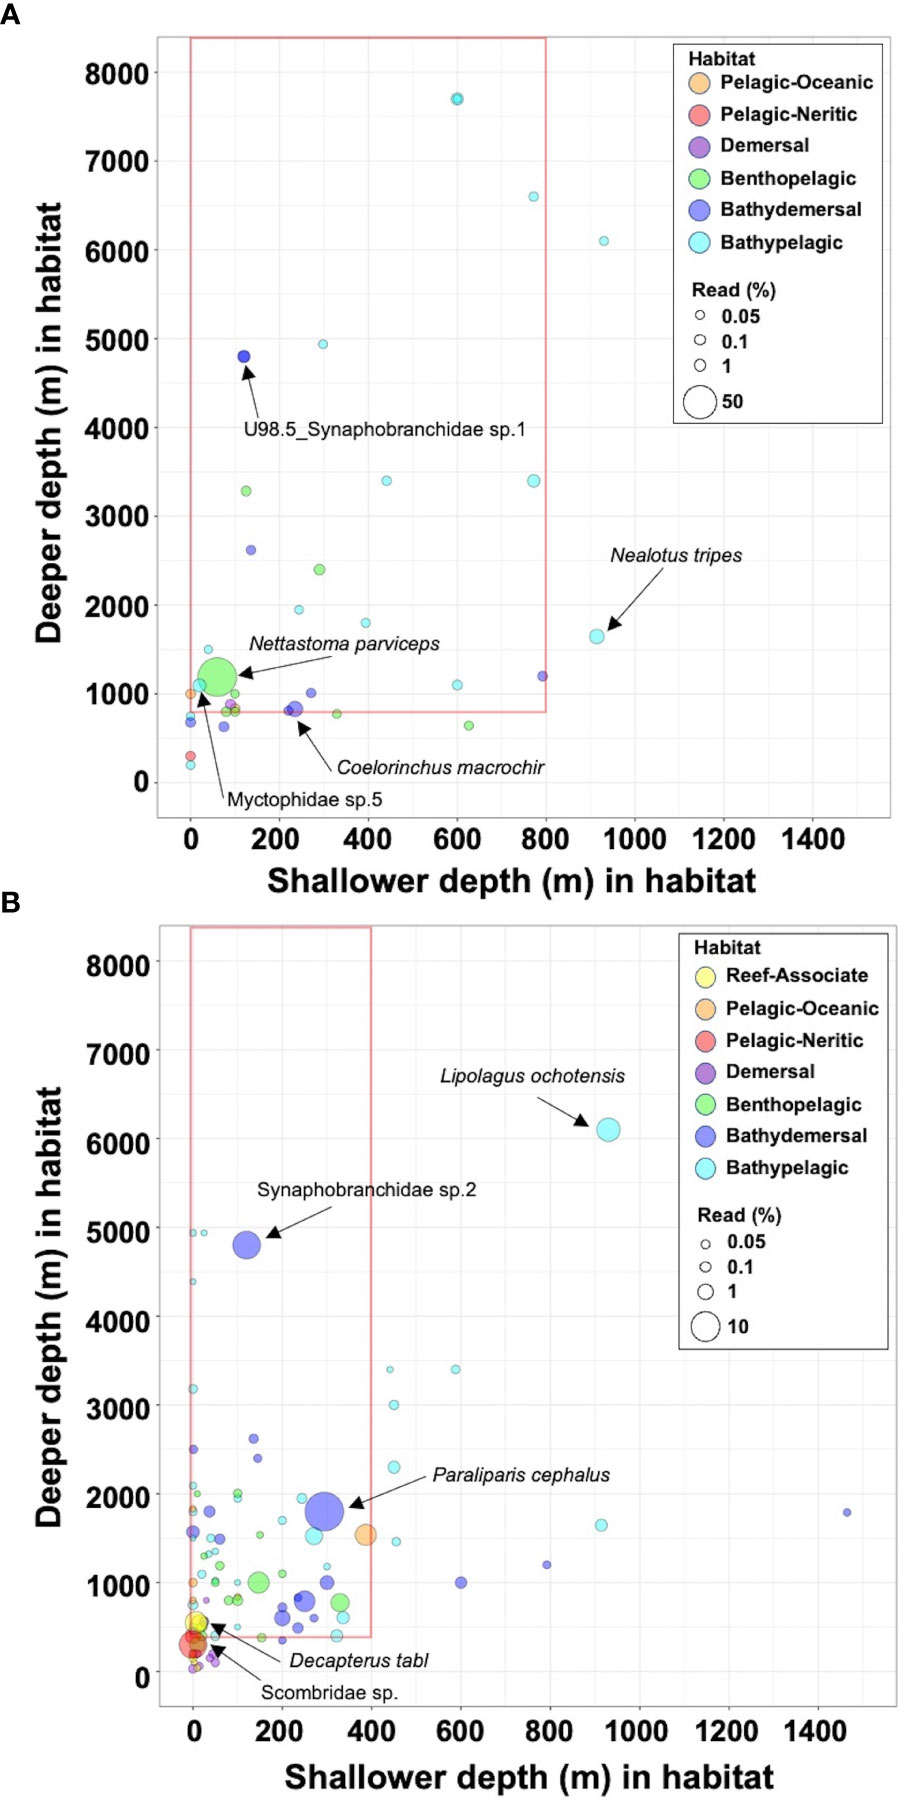
Figure 2 Range of habitat depth records for fish species detected from eDNA. The shallowest and deepest recorded depths of habitats of detected fish species obtained from FishBase (https://www.fishbase.se/home.html) are denoted by circles on the X and Y axes, respectively. Circles placed inside the red frames represent the species that can be distributed at the depth of each water intake (Akazawa: 800 m, Yaizu: 400 m). (A) Akazawa, (B) Yaizu. Circles of different colors indicate different habitat types classified by FishBase. Size of circles indicates the ratio of each OTU to the total reads. The names of the top five species in most abundant reads and species below inlet depth, are shown as black and blue characters, respectively.
3.3. Detection of fish OTUs from each filtration volume of pumped deep-sea water
The number of OTUs detected at each filtration volume sample was lower than that of the estimated species richness (ChaoI index) and total detected OTUs (Figure 3). Based on statistical analysis, the number of OTUs detected from the larger samples of filtered water was not significantly higher than in the smaller samples of filtered water at the Akazawa site (Figure 3A). However, a significant increase in the number of detected OTUs was observed in 15-, 20-, and 25-L filtered samples at the Yaizu site (Figure 3B). The total number of OTUs from the samples of various amounts of filtered water was significantly increased at Yaizu (Figure 3). A similar trend was seen in the numbers of shared OTUs between replicates from samples of various amounts of filtered water at Yaizu.
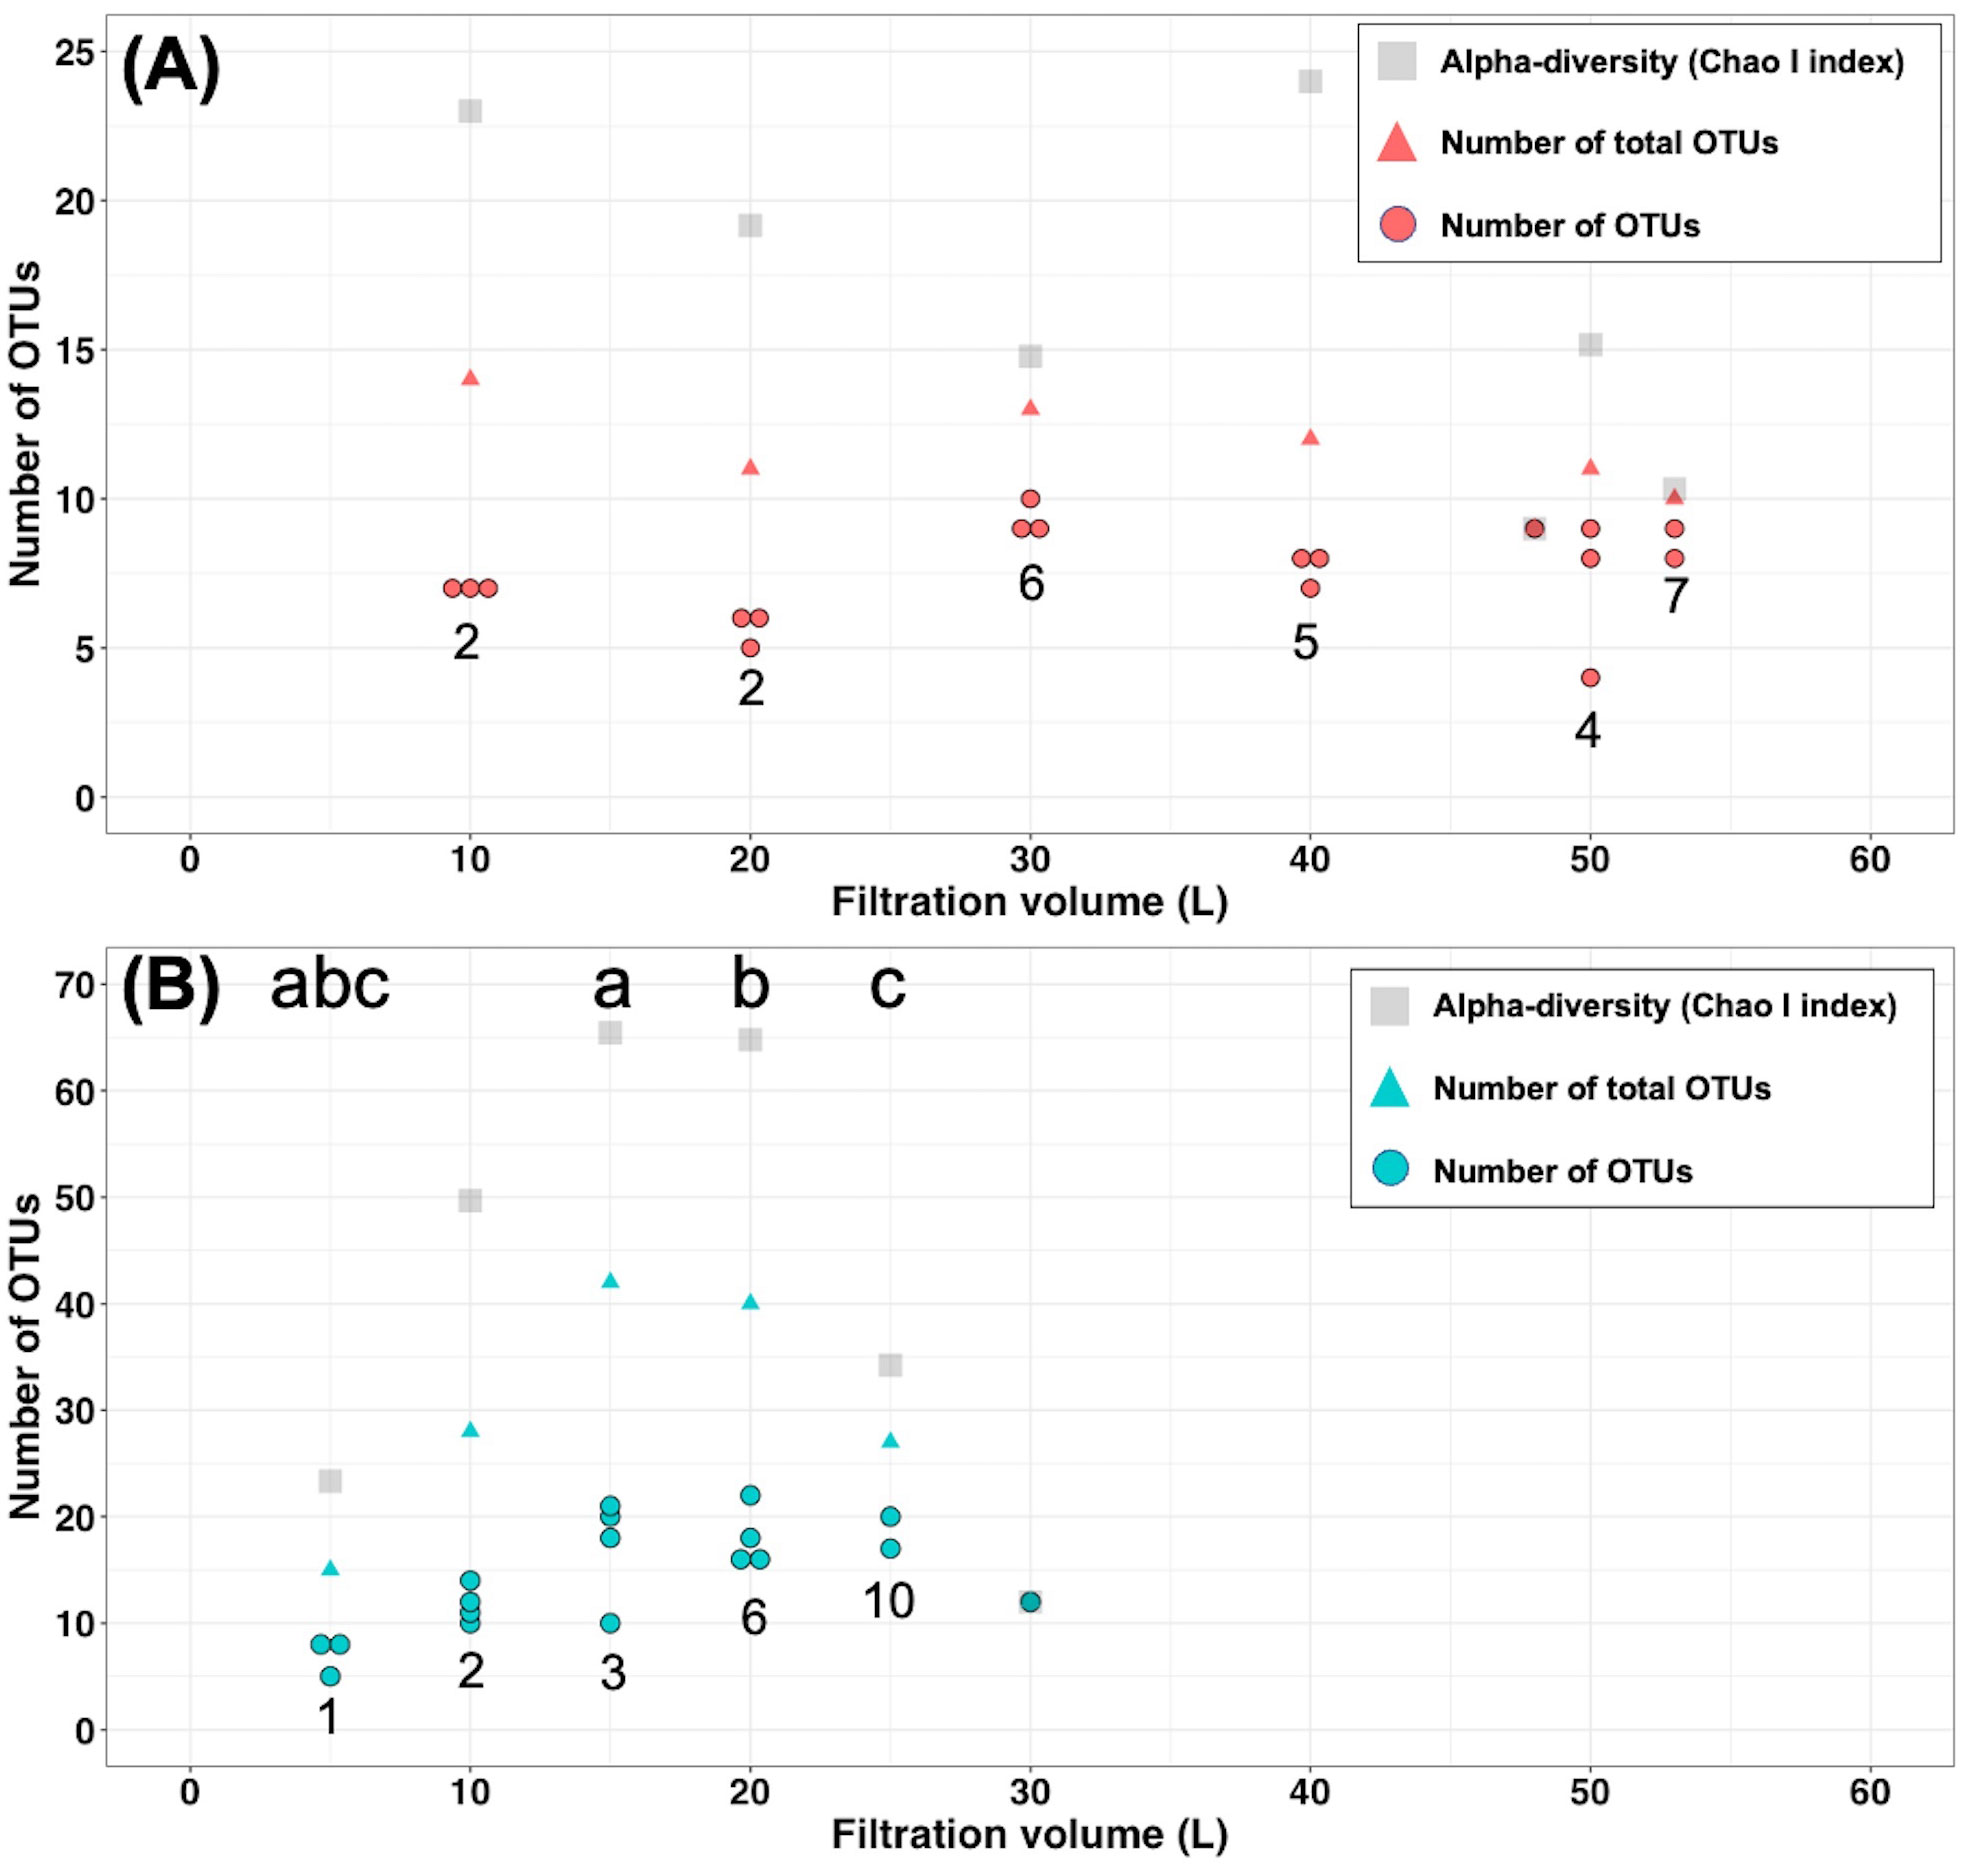
Figure 3 Number of fish OTUs identified from different filtration-volume samples in (A) Akazawa, and (B) Yaizu. Circles, triangles, and squares indicate the number of OTUs, number of total OTUs, and alpha-diversity (ChaoI index), respectively. The numbers below circles indicate the number of shared OTUs between all replicates. There is a significant difference in the number of OTUs between samples given the same alphabet based on Dunnett’s test (p < 0.05).
3.4. Relationship between the number of sample replicates and detected fish biodiversity at two sites
In this experiment, each filtration volume was fixed among replicates (20 L at Akazawa, 10 L at Yaizu) based on the result of the evaluation of the filtration time, efficiency of PCR amplification, and number of detected fish reads. The numbers of OTUs detected from replicates were different between the sampling sites (Figure 4). The numbers of detected OTUs ranged from 2 to 10 (means = 6.36) at Akazawa and from 10 to 22 (means = 15.36) at Yaizu, significantly higher at Yaizu than at Akazawa (Mann–Whitney’s U test; p < 0.05). The variation of detected OTUs among replicates was higher at Yaizu than at Akazawa. The numbers of total OTUs and chaoI index of samples collected from Yaizu (total OTUs: 98; chaoI index: 217.5) were also higher than those from Akazawa (total OTUs, 35; chaoI index, 43.8). A total of 118 OTUs representing fish species including 76 identified genera and 61 identified families were detected (Supplementary Figure 8B). Of these 118 OTUs, the number of shared OTUs between Akazawa and Yaizu was 15. There was distinct dissimilarity in the composition of fish taxa between the two sampling sites (Figure 5; NMDS stress = 0.844778). The frequency of occurrence among sample replicates (the occurrence ratio of fish OTU among filtered sample replicates) showed that approximately half the number of OTUs from Yaizu and one-third of the OTUs from Akazawa showed a less than 5% in occurrence ratio (Supplementary Figure 10). The cumulative number of OTUs from Akazawa almost converged to 40 in 50 replicates (Figure 6A). In addition, accumulation curves of OTUs representing a frequency of more than 5% were saturated within 15 replicates at Akazawa. In contrast to Akazawa, the accumulation curve of OTUs at Yaizu using all OTU data indicated species richness was not fully saturated even in 50-replicate sampling (Figure 6B). Similarly to Akazawa, the OTUs representing a frequency of more than 5%, accumulation curves were also saturated within 15 replicates at Yaizu. Accumulation curves of OTUs using OTU data with more than 5% frequency among replicates indicated that more than 10 sample replicates at both sites were needed for the detection of frequently occurring fish species (Figure 6).
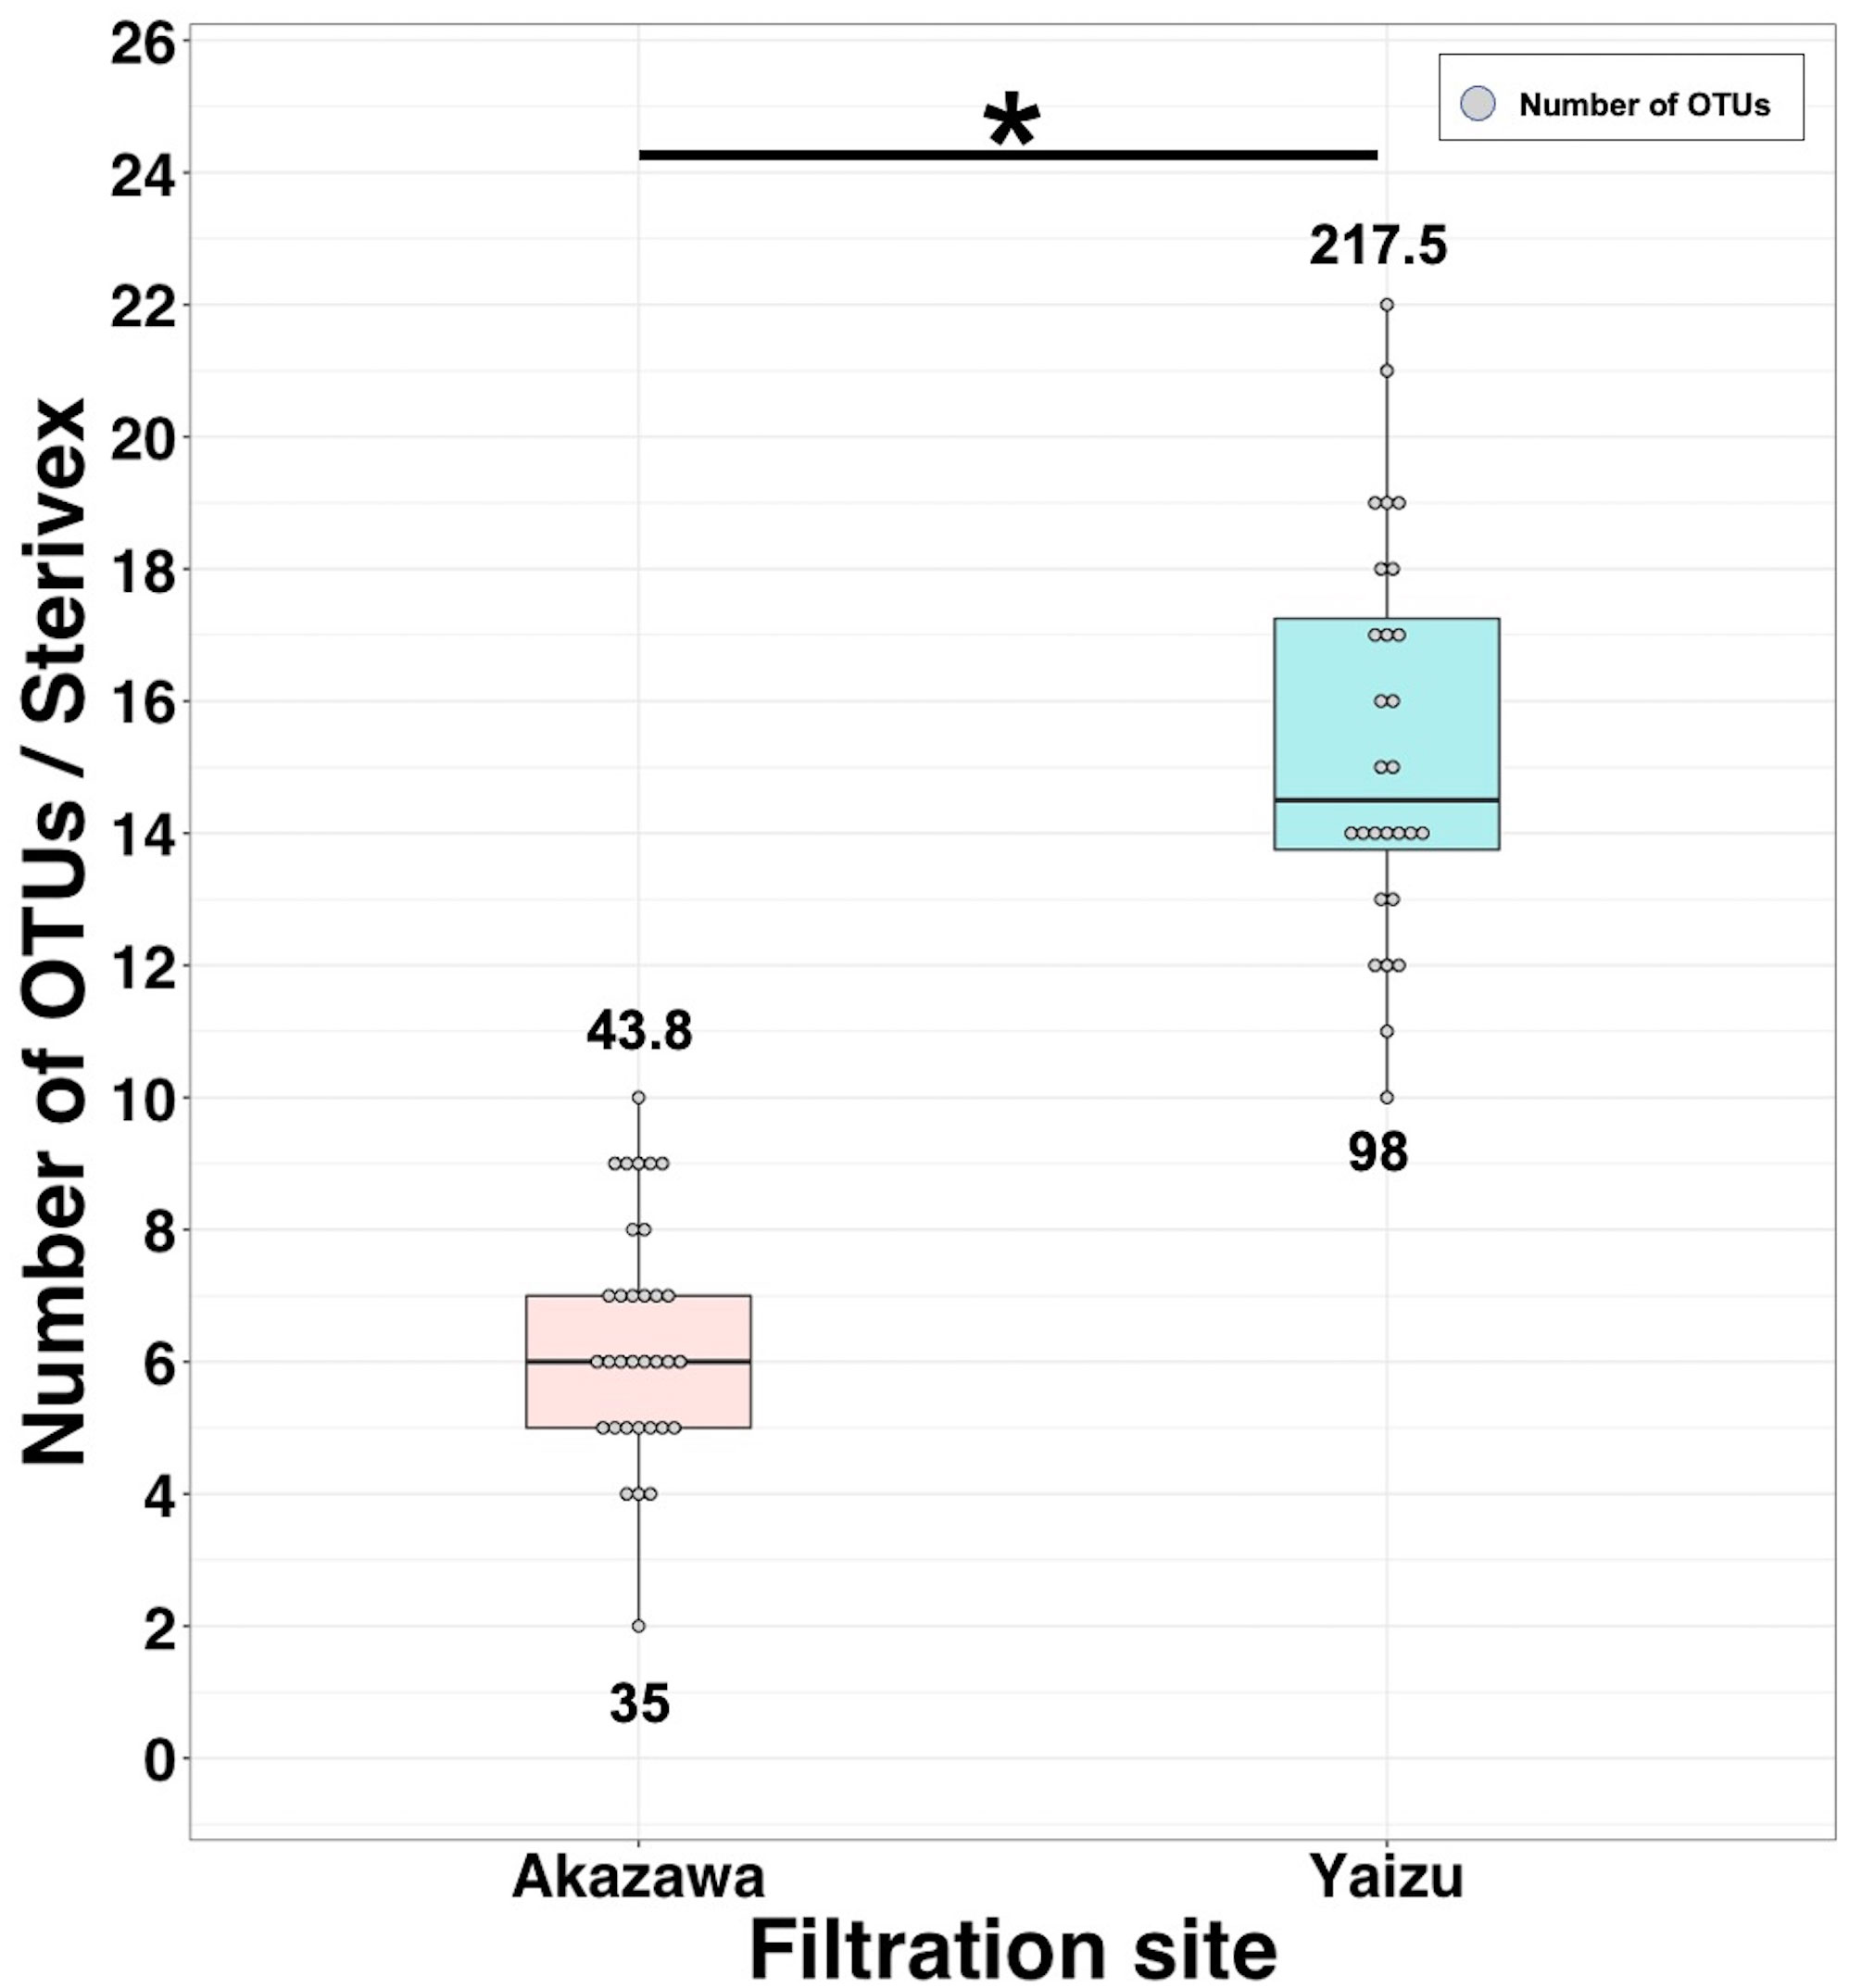
Figure 4 Number of fish OTUs obtained from pumped deep-sea water sampled in Akazawa and Yaizu. Filtration volume of samples from Akazawa and Yaizu was 20 L and 10 L, respectively. Boxplots with circles indicate the number of OTUs. Upper and lower values indicate the alpha diversity (ChaoI index) and total number of OTUs, respectively. Asterisk indicates significant difference in number of OTUs between Akazawa and Yaizu samples based on Mann–Whitney’s test (p < 0.05).
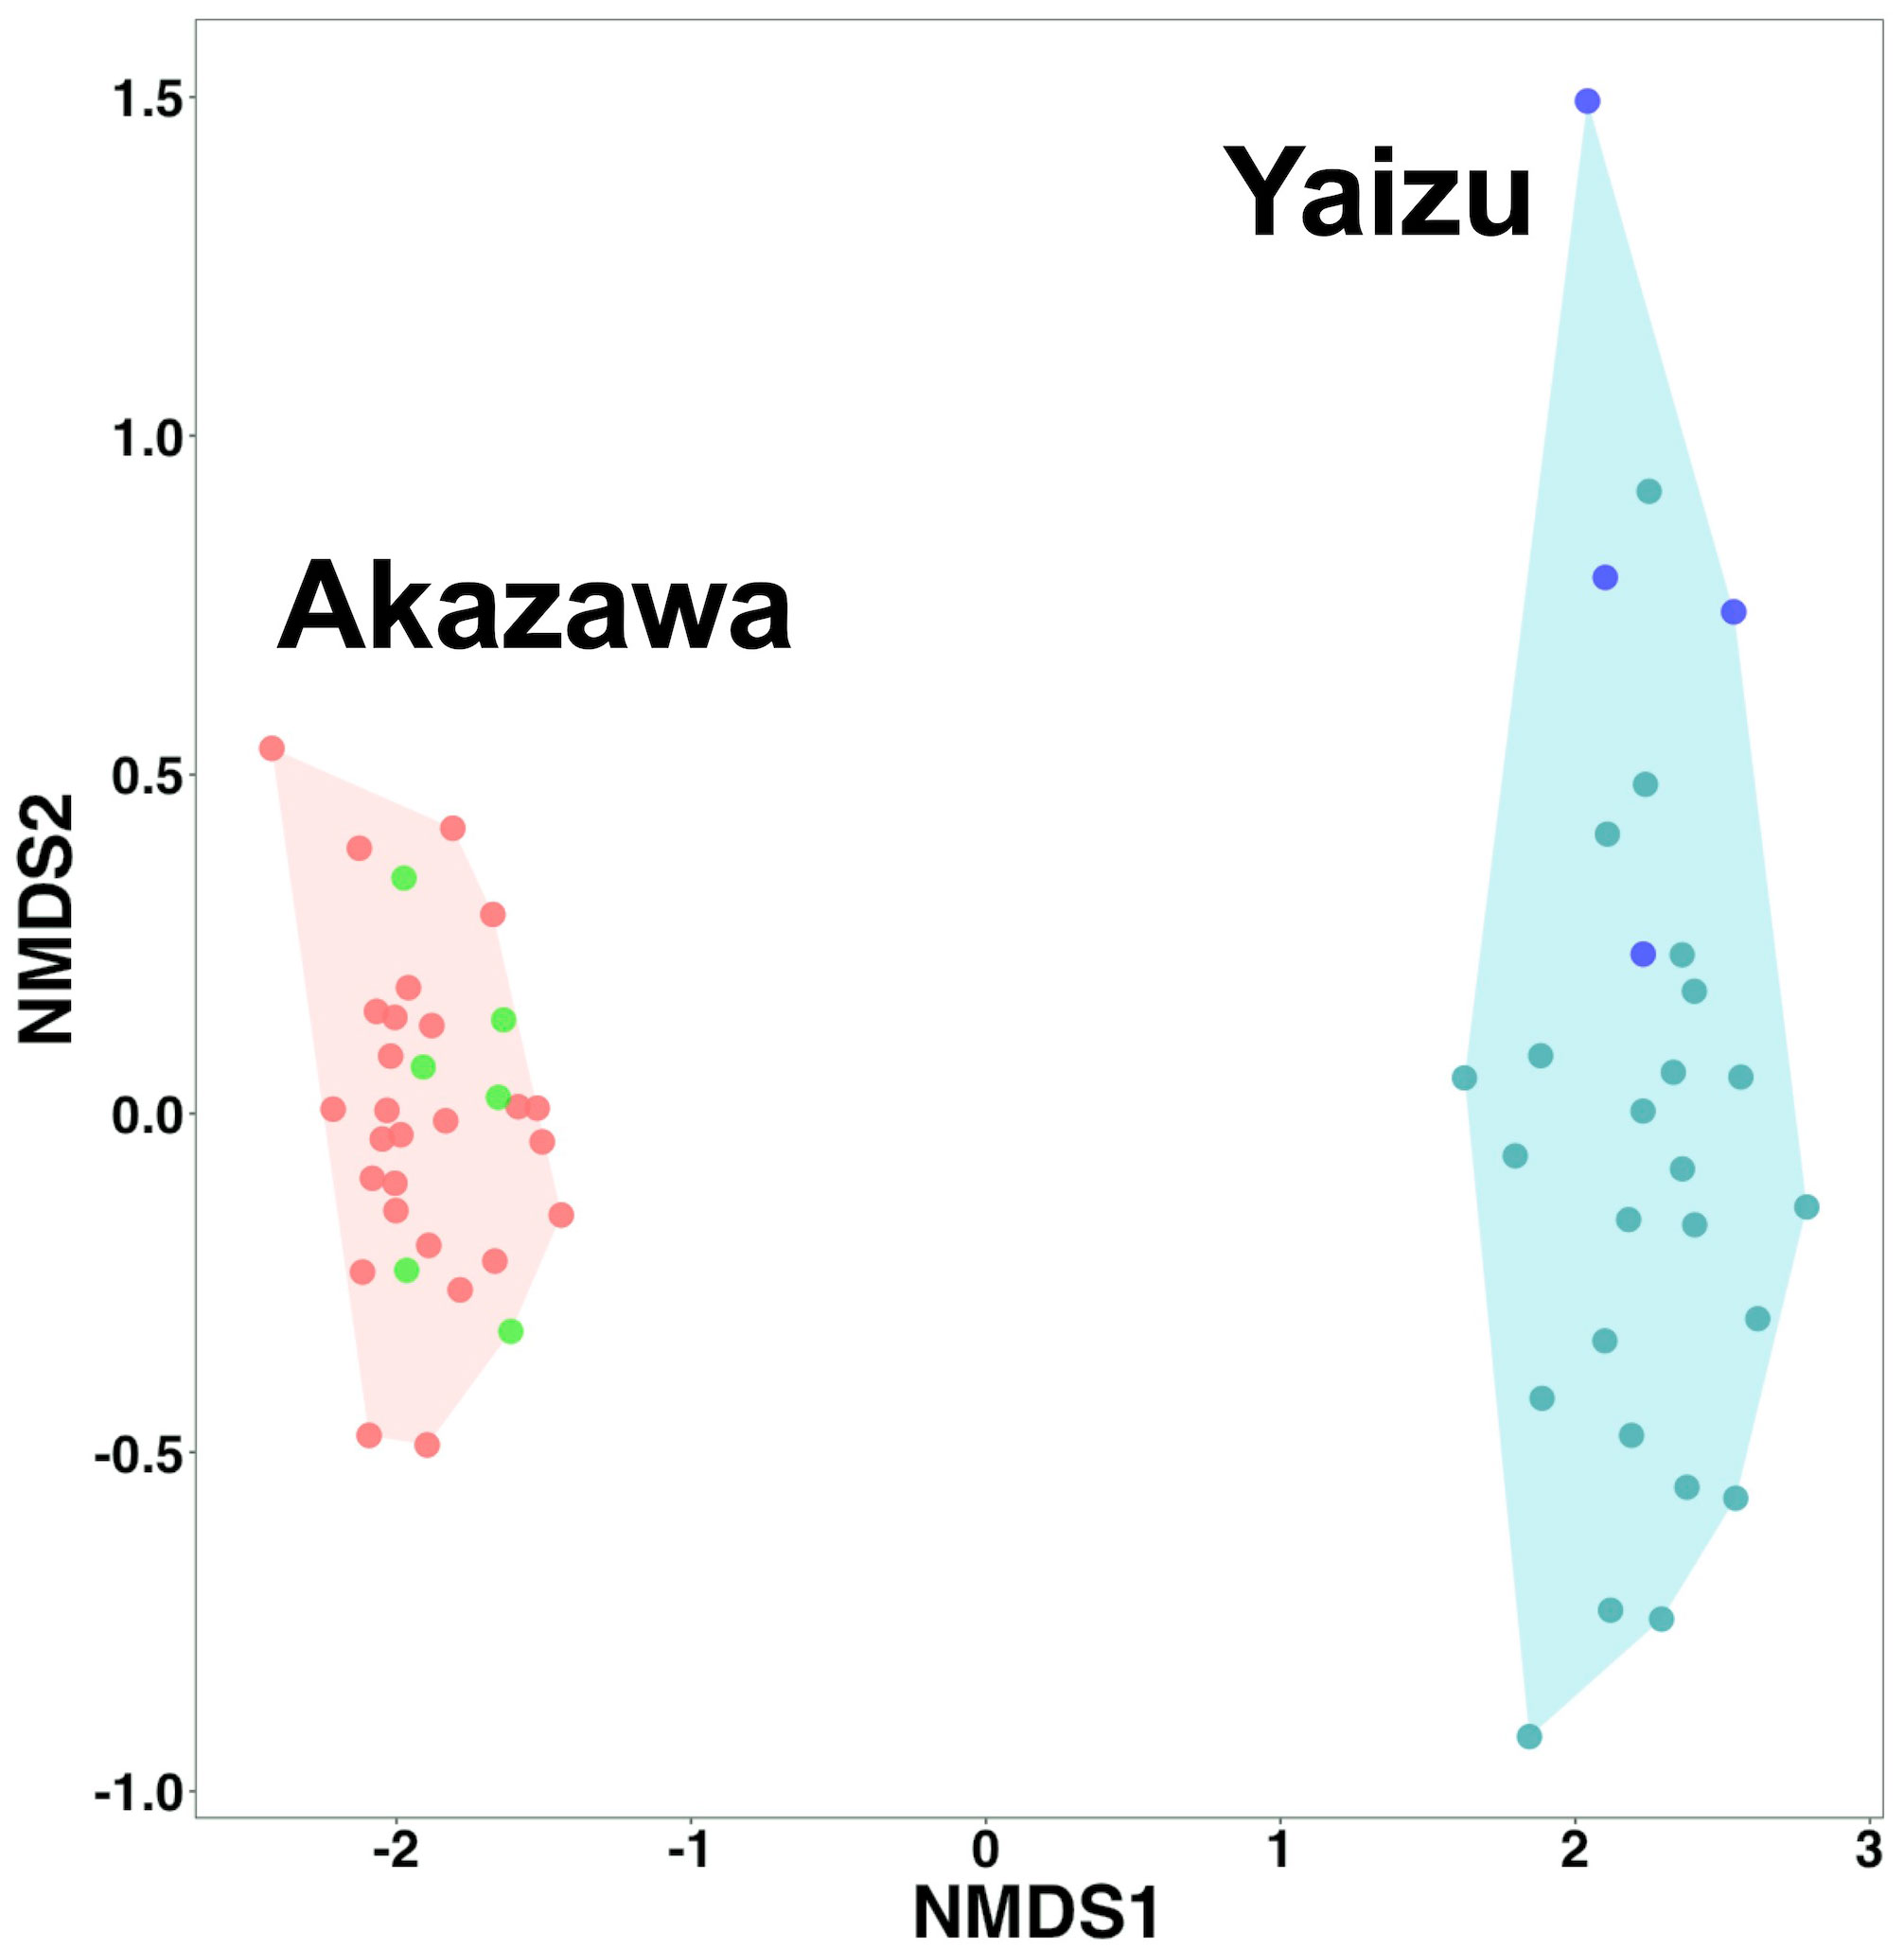
Figure 5 Nonmetric multidimensional scaling (NMDS) of fish OTU occurrence obtained from Akazawa and Yaizu. Analysis was performed using OTU read presence and Jaccard distance. Red and green circles indicate the filtered samples collected at Akazawa on September 14 and 15, 2020, respectively. Dark green and blue circles indicate the filtered samples collected at Yaizu on September 16 and 17, 2020, respectively. Convex hulls cluster samples according to collected sampling sites. NMDS stress value was 0.091377.
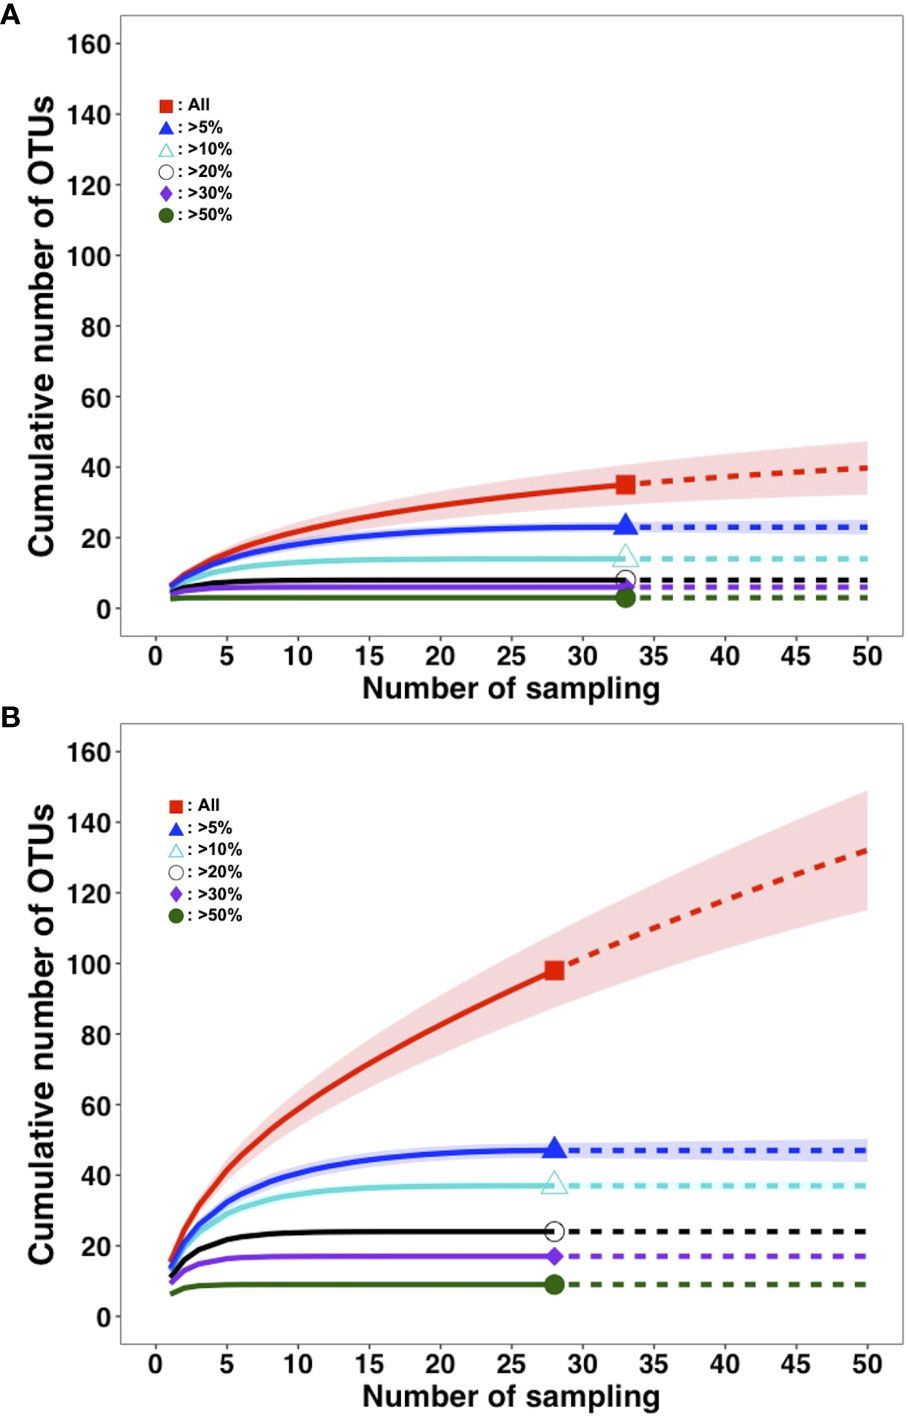
Figure 6 Accumulation curves of fish OTUs detected from eDNA at Akazawa and Yaizu by sampling effort. Accumulation curves based on occurrence rate among replicates at (A) Akazawa and (B) Yaizu. Lines and dotted lines indicate sample-size-based rarefaction and extrapolated sampling plots, respectively. Observed numbers of OTUs were denoted by symbols. Shadings indicate 95% confidential interval. Red squares: all OTUs applied; blue triangles: OTUs with more than 5% occurrence; light blue triangles: OTUs with more than 10% occurrence; white circles: OTUs with more than 20% occurrence; purple diamonds: OTUs with more than 30% occurrence; green circles: OTUs with more than 50% occurrence.
4. Discussion
In this study, we demonstrated the successful application of monitoring of fish diversity using eDNA from pumped deep-sea water and developed a novel filtration device using the siphon effect which simultaneously filtrates 18 replicates without the need for expensive equipment or power. Our results indicated that large filtration volumes (> 20-L) of pumped deep-sea water presented several technical difficulties and risks. Furthermore, the filtration of 20 L of pumped deep-sea water from Akazawa and filtration of 10 L of pumped deep-sea water from Yaizu were demonstrated to be suitable filtration volumes for monitoring deep-sea fish biodiversity in the present study. Also, our data suggested that sufficient replicate samples are needed to detect comprehensive eDNA of rarely occurring fish in pumped deep-sea water (approximately 10 or more replicates for covering major communities, and much more if it includes minor communities, depending on the sites). Moreover, this study suggested that optimum filtration water volume and appropriate sample replicates vary depending on the filtration system and biodiversity of the survey points, thus, it is important to consider the optimum method for each study site and purpose.
Our results indicated no significant differences in the number of detected OTUs among different filtration volumes of samples at Akazawa. The amount of PCR products was less amplified even though the eDNA extracted from a larger volume of the pumped deep-sea water was utilized. Moreover, a negative correlation between the filtration volume and the total number of assembled fish reads was found. A possible reason for these negative effects with the increase of filtration volume was that the accumulation of PCR inhibitory materials and sources of non-target DNA such as bacterial particles on the filter exceeded the accumulation of fish eDNA sources when the filter began clogging as the amount of filtration increased. It took about 30–45 min for the 10-L filtration at Yaizu and the 20-L filtration at Akazawa, while much larger filtration needed excessive time, and it took more than one hour for 10-L and 20-L filtrations or larger. Large filtration volume (more than 20-L) of pumped deep-sea water presents several technical difficulties and risks, such as the increase of the contamination risk, the degradation of eDNA, and the accumulation of PCR inhibitory materials during longer filtration time. Hence, the appropriate pumped deep-sea water volume of filtration samples should be determined considering those difficulties and risks: the 20-L filtration of pumped deep-sea water from Akazawa and 10-L filtration from Yaizu have been demonstrated to be suitable in the present study, for the following reasons: the quantity of PCR products in more than 10-L filtrations was lower at Yaizu (Supplementary Figures 4, 6) and the ratio of total fish reads in more than 20-L filtration was decreased at Akazawa (Supplementary Figure 7).
Along with filtration volume, the number of replicates of filtered samples is also an important factor for estimating biodiversity using eDNA metabarcoding analysis. The source of eDNA in seawater exhibits sporadic distribution, and the estimation of biodiversity using eDNA is strongly influenced by the sampling effort (Bessey et al., 2020; Stauffer et al., 2021; Ahn et al., 2022). The number of detected species was relatively congruent among replicates, with a variation of up to 8 species between replicates for the Akazawa samples and up to 12 species between replicates for the Yaizu samples. These variations were slightly higher than that of a previous study conducted in tropical streams and rivers (Cantera et al., 2019), but were significantly lower than that of a previous deep-sea study (McClenaghan et al., 2020). The number of detected species at Yaizu among replicates was higher than that of Akazawa, and the total number at Akazawa and Yaizu was 35 and 98, respectively. Of these OTUs, 25 OTUs (71.4% of the total detected OTUs) at Akazawa and 70 OTUs (71.4% of the total detected OTUs) at Yaizu were in good agreement with previously known distribution records. A previous study indicated that eDNA derived from low-abundant taxa is very localized (Di Muri et al., 2020), and our results indicated that approximately half of the OTUs at Yaizu and one-third of the OTUs at Akazawa were only detected from one replicate (approximately less than 5% occurrence ratio among replicates; Supplementary Figure 10). Except for OTUs with less than a 5% occurrence ratio, accumulation curves of detected OTUs reached the plateau in approximately 10 replicates or more, while that of all detected OTUs at Yaizu was not saturated even in 50 replicates. These data suggested that eDNA from fish in low density shows a sporadic distribution and is rarely pumped. Our results were consistent with previous suggestions that sufficient replicate samples are needed to improve the detection probabilities and to obtain reliable estimates of fish biodiversity (Bessey et al., 2020; Stauffer et al., 2021).
The fish eDNA in the open ocean is thought to be detected at the depth where it was released or deeper, but rarely shallower (Canals et al., 2021). Our results showed that the habitat depth range of detected species corresponded to the depth of each intake of pumped deep-sea water (Akazawa: 800 m, Yaizu: 400 m, respectively). Moreover, approximately 70% of the total detected OTUs at both sampling sites were in agreement with the previous distribution records. Of the remaining OTUs, approximately 14% OTUs at both sampling sites did not find in distribution records from previous reports and other OTUs showed no record data. Thus, deep-sea water pumped at both sampling sites is useful and available for estimating the biodiversity of deep-sea fish. Further imaging studies are needed to directly observe live fish using remotely operated vehicles and/or automated baited cameras to increase the reliability of eDNA metabarcoding data.
A recent study suggests that the predicted changes in temperature and oxygen by climate change are expected to reduce biodiversity in deep-sea demersal fish communities in the Gulf of California (Gallo et al., 2020). Fishes are key organisms in ocean ecosystem functioning through the food web (Albouy et al., 2019). eDNA analysis is a powerful tool for monitoring fish biodiversity comparable to conventional survey methods, such as capture-based sampling (e.g., Yamamoto et al., 2017; Ahn et al., 2020; Bessey et al., 2020; Sigsgaard et al., 2020; Oka et al., 2021) and its utilization to various studies are becoming more popular recently. However, deep-sea field surveys using research vessels equipped with water-collecting devices (e.g., CTD with Niskin bottles) are difficult to conduct, time-consuming, and costly. Recently, new sampling approaches using a novel device attached to trawl nets or the utilization of drip water from trawl nets for simpler and cheaper detection of eDNA have been conducted on bottom trawl fishing vessels (Russo et al., 2021; Maiello et al., 2022). These methods, which are potentially applied to commercial fishing vessels, are useful for the continuous monitoring of biodiversity. Similarly, pumped deep-sea water as an eDNA source supplied by a pumping facility is also cost-effective, foregoing the need for vessels and acts as a window into the near-shore deep-sea environments, which are more affected by human activities and climate change, making it highly effective as a method for the monitoring of deep-sea fish biodiversity. Understanding the impacts of climate change on the biodiversity of fish is an important issue for predicting the future of marine ecosystems. Our optimized method may provide accurate qualitative information on fish biodiversity in deep-sea water and eDNA metabarcoding analysis using pumped deep-sea water is a cost-effective and useful approach for continuous biodiversity monitoring.
Data availability statement
Raw DNA sequence data from MiSeq are deposited in the DNA Data Bank of JAPAN (DDBJ) Sequenced Read Archive (DRA; https://www.ddbj.nig.ac.jp/dra/index-e.html) under accession number DRA013780. The datasets presented in this study can be found in the article/Supplementary Material.
Ethics statement
The animal study was reviewed and approved by All animal experiments were conducted in accordance with the Guidelines for Proper Conduct of Animal Experiments (Science Council of Japan).
Author contributions
TY and MK designed the research. TY, MK, YF, YN, ST, and AY collected and filtrated the deep-sea water. MK performed the experiments. TY and MK annotated the OTUs. TY analyzed all data and wrote the manuscript. All authors approved the final version of the manuscript and agreed to be accountable for all aspects of the work in ensuring that questions related to the accuracy or integrity of any part of the work are appropriately investigated and resolved. All authors contributed to the article and approved the submitted version.
Funding
This study was funded by the Japan Agency for Marine-Earth Science and Technology.
Acknowledgments
We thank Messrs. Michiyasu Nomura (DHC Corporation), Yusuke Sano, and Hideo Kawai (Shizuoka prefectural deep-sea water pumping facility) for their technical assistance with sample collection; Ms. Seiko Sano (JAMSTEC) for assistance with laboratory experiments; Dr. Rachel Atanacio (FishBase) for providing a FishBase data set. We also thank Dr. Katsuhisa Yamada (DHC Corporation), Mr. Takahiro Amano (Shizuoka Prefectural Government Office), and Ms. Keiko Maeda (Shizuoka prefectural deep-sea water pumping facility) for their logistic support when utilizing pumped deep-sea water.
Conflict of interest
The authors declare that the research was conducted in the absence of any commercial or financial relationships that could be construed as a potential conflict of interest.
Publisher’s note
All claims expressed in this article are solely those of the authors and do not necessarily represent those of their affiliated organizations, or those of the publisher, the editors and the reviewers. Any product that may be evaluated in this article, or claim that may be made by its manufacturer, is not guaranteed or endorsed by the publisher.
Supplementary material
The Supplementary Material for this article can be found online at: https://www.frontiersin.org/articles/10.3389/fmars.2022.965800/full#supplementary-material
References
Ahn H., Asano Y., Suzuki S., Ooki A. (2022). Positive effect of filtration additives for increasing environmental DNA detections in summer and winter oceanic waters. Environ. DNA 4, 661–673. doi: 10.1002/edn3.282
Ahn H., Kume M., Terashima Y., Ye F., Kameyama S., Miya M., et al. (2020). Evaluation of fish biodiversity in estuaries using environmental DNA metabarcoding. PloS One 15, e0231127. doi: 10.1371/journal.pone.0231127
Albouy C., Archambault P., Appeltans W., Araújo M. B., Beauchesne D., Cazelles K., et al. (2019). The marine fish food web is globally connected. Nat. Ecol. Evol. 3, 1153–1161. doi: 10.1038/s41559-019-0950-y
Baag S., Mandal S. (2022). Combined effects of ocean warming and acidification on marine fish and shellfish: A molecule to ecosystem perspective. Sci. Total Environ. 802, 149807. doi: 10.1016/j.scitotenv.2021.149807
Bessey C., Jarman S. N., Berry O., Olsen Y. S., Bunce M., Simpson T., et al. (2020). Maximizing fish detection with eDNA metabarcoding. Environ. DNA 2, 493–504. doi: 10.1002/edn3.74
Canals O., Mendibil I., Santos M., Irigoien X., Rodríguez-Ezpeleta N. (2021). Vertical stratification of environmental DNA in the open ocean captures ecological patterns and behavior of deep-sea fishes. Limnol. Oceanogr. Lett. 6, 339–347. doi: 10.1002/lol2.10213
Cantera I., Cilleros K., Valentini A., Cerdan A., Dejean T., Iribar A., et al. (2019). Optimizing environmental DNA sampling effort for fish inventories in tropical streams and rivers. Sci. Rep. 9, 3085. doi: 10.1038/s41598-019-39399-5
Costello M. J., Chaudhary C. (2017). Marine biodiversity, biogeography, deep-Sea gradients, and conservation. Curr. Biol. 27, R511–R527. doi: 10.1016/j.cub.2017.04.060
Deiner K., Walser J.-C., Mächler E., Altermatt F. (2015). Choice of capture and extraction methods affect detection of freshwater biodiversity from environmental DNA. Biol. Conserv. 183, 53–63. doi: 10.1016/j.biocon.2014.11.018
Di Muri C., Lawson Handley L., Bean C. W., Li J., Peirson G., Sellers G. S., et al. (2020). Read counts from environmental DNA (eDNA) metabarcoding reflect fish abundance and biomass in drained ponds. Metabarcoding Metagenom. 4, 97–112. doi: 10.3897/mbmg.4.56959
Dixon P. (2003). VEGAN, a package of r functions for community ecology. J. Veg. Sci. 14, 927–930. doi: 10.1111/j.1654-1103.2003.tb02228.x
Drazen J. C., Seibel B. A. (2007). Depth-related trends in metabolism of benthic and benthopelagic deep-sea fishes. Limnol. Oceanogr. 52, 2306–2316. doi: 10.4319/lo.2007.52.5.2306
Edgar R. C. (2004). MUSCLE: a multiple sequence alignment method with reduced time and space complexity. BMC Bioinf. 5, 113. doi: 10.1186/1471-2105-5-113
Edgar R. C. (2010). Search and clustering orders of magnitude faster than BLAST. Bioinformatics 26, 2460–2461. doi: 10.1093/bioinformatics/btq461
Edgar R. C. (2016)UNOISE2: improved error-correction for illumina 16S and ITS amplicon sequencing. In: bioRxiv. Available at: http://biorxiv.org/content/early/2016/10/15/081257.abstract (Accessed 19 May, 2022).
Fraija-Fernández N., Bouquieaux M.-C., Rey A., Mendibil I., Cotano U., Irigoien X., et al. (2020). Marine water environmental DNA metabarcoding provides a comprehensive fish diversity assessment and reveals spatial patterns in a large oceanic area. Eco. Evol. 10, 7560–7584. doi: 10.1002/ece3.6482
Froese R., Pauly D. (2022) FishBase, version (2/2022). Available at: https://www.fishbase.org (Accessed 10 April 2022).
Fujiwara Y., Kawato M., Poulsen J. Y., Ida H., Chikaraishi Y., Ohkouchi N., et al. (2021). Discovery of a colossal slickhead (Alepocephaliformes: Alepocephalidae): an active-swimming top predator in the deep waters of suruga bay, Japan. Sci. Rep. 11, 2490. doi: 10.1038/s41598-020-80203-6
Fujiwara Y., Tsuchida S., Kawato M., Masuda K., Sakaguchi S. O., Sado T., et al. (2022). Detection of the largest deep-Sea-Endemic teleost fish at depths of over 2,000 m through a combination of eDNA metabarcoding and baited camera observations. Front. Mar. Sci. 9. doi: 10.3389/fmars.2022.945758
Gallo N. D., Beckwith M., Wei C. L., Levin L. A., Kuhnz L., Barry J. P. (2020). Dissolved oxygen and temperature best predict deep-sea fish community structure in the gulf of California with climate change implications. Mar. Ecol. Prog. Ser. 637, 159–180. doi: 10.3354/meps13240
Guardiola M., Wangensteen O. S., Taberlet P., Coissac E., Uriz M. J., Turon X. (2016). Spatio-temporal monitoring of deep-sea communities using metabarcoding of sediment DNA and RNA. PeerJ 4, e2807. doi: 10.7717/peerj.2807
Harper L. R., Buxton A. S., Rees H. C., Bruce K., Brys R., Halfmaerten D., et al. (2019). Prospects and challenges of environmental DNA (eDNA) monitoring in freshwater ponds. Hydrobiologia 826, 25–41. doi: 10.1007/s10750-018-3750-5
Hinlo R., Gleeson D., Lintermans M., Furlan E. (2017). Methods to maximise recovery of environmental DNA from water samples. PloS One 12, e0179251. doi: 10.1371/journal.pone.0179251
Huang M., Ding L., Wang J., Ding C., Tao J. (2021). The impacts of climate change on fish growth: A summary of conducted studies and current knowledge. Ecol. Indic. 121, 106976. doi: 10.1016/j.ecolind.2020.106976
Kawato M., Yoshida T., Miya M., Tsuchida S., Nagano Y., Nomura M., et al. (2021). Optimization of environmental DNA extraction and amplification methods for metabarcoding of deep-sea fish. MethodsX 8, 101238. doi: 10.1016/j.mex.2021.101238
Kelly R. P., Gallego R., Jacobs-Palmer E. (2018). The effect of tides on nearshore environmental DNA. PeerJ 6, e4521. doi: 10.7717/peerj.4521
Knudsen S. W., Ebert R. B., Hesselsøe M., Kuntke F., Hassingboe J., Mortensen P. B., et al. (2019). Species-specific detection and quantification of environmental DNA from marine fishes in the Baltic Sea. J. Exp. Mar. Biol. Ecol. 510, 31–45. doi: 10.1016/j.jembe.2018.09.004
Koziol A., Stat M., Simpson T., Jarman S., DiBattista J. D., Harvey E. S., et al. (2019). Environmental DNA metabarcoding studies are critically affected by substrate selection. Mol. Ecol. Resour. 19, 366–376. doi: 10.1111/1755-0998.12971
Kumar S., Stecher G., Li M., Knyaz C., Tamura K. (2018). MEGA X: Molecular evolutionary genetics analysis across computing platforms. Mol. Biol. Evol. 35, 1547–1549. doi: 10.1093/molbev/msy096
Laroche O., Pochon X., Wood S. A., Keeley N. (2021). Beyond taxonomy: Validating functional inference approaches in the context of fish-farm impact assessments. Mol. Ecol. Resour. 21, 2264–2277. doi: 10.1111/1755-0998.13426
Lear G., Dickie I., Banks J., Boyer S., Buckley H., Buckley T., et al. (2017). Methods for the extraction, storage, amplification and sequencing of DNA from environmental samples. N. Z. J. Ecol. 42, 10. doi: 10.20417/nzjecol.42.9
Maiello G., Talarico L., Carpentieri P., De Angelis F., Franceschini S., Harper L. R., et al. (2022). Little samplers, big fleet: eDNA metabarcoding from commercial trawlers enhances ocean monitoring. Fisheries Res. 249, 106259. doi: 10.1016/j.fishres.2022.106259
McClenaghan B., Fahner N., Cote D., Chawarski J., McCarthy A., Rajabi H., et al. (2020). Harnessing the power of eDNA metabarcoding for the detection of deep-sea fishes. PloS One 15, e0236540. doi: 10.1371/journal.pone.0236540
Merten V., Bayer T., Reusch T. B. H., Puebla O., Fuss J., Stefanschitz J., et al. (2021). An integrative assessment combining deep-Sea net sampling, in situ observations and environmental DNA analysis identifies cabo Verde as a cephalopod biodiversity hotspot in the Atlantic ocean. Front. Mar. Sci. 8. doi: 10.3389/fmars.2021.760108
Minamoto T., Miya M., Sado T., Seino S., Doi H., Kondoh M., et al. (2021). An illustrated manual for environmental DNA research: Water sampling guidelines and experimental protocols. Environ. DNA 3, 8–13. doi: 10.1002/edn3.121
Miya M., Minamoto T., Yamanaka H., Oka S., Sato K., Yamamoto S., et al. (2016). Use of a filter cartridge for filtration of water samples and extraction of environmental DNA. J. Vis. Exp. 117, e54741. doi: 10.3791/54741
Miya M., Sato Y., Fukunaga T., Sado T., Poulsen J. Y., Sato K., et al. (2015). MiFish, a set of universal PCR primers for metabarcoding environmental DNA from fishes: detection of more than 230 subtropical marine species. R. Soc Open Sci. 2, 150088. doi: 10.1098/rsos.150088
Mora C., Tittensor D. P., Adl S., Simpson A. G. B., Worm B. (2011). How many species are there on earth and in the ocean? PloS Biol. 9, e1001127. doi: 10.1371/journal.pbio.1001127
Nakabo T. (2013). Fishes of Japan with pictorial keys to the species. 3rd ed (Tokyo: Tokai University Press).
Oka S.-i., Doi H., Miyamoto K., Hanahara N., Sado T., Miya M. (2021). Environmental DNA metabarcoding for biodiversity monitoring of a highly diverse tropical fish community in a coral reef lagoon: Estimation of species richness and detection of habitat segregation. Environ. DNA 3, 55–69. doi: 10.1002/edn3.132
Ramirez-Llodra E., Brandt A., Danovaro R., De Mol B., Escobar E., German C. R., et al. (2010). Deep, diverse and definitely different: unique attributes of the world's largest ecosystem. Biogeosciences 7, 2851–2899. doi: 10.5194/bg-7-2851-2010
R Core Team (2021). R: A language and environment for statistical computing (Vienna, Austria: R Foundation for Statistical Computing). Available at: https://www.R-project.org/.
RStudio Team (2020). RStudio: Integrated development for r (Boston, MA: RStudio, PBC). Available at: http://www.rstudio.com/.
Russo T., Maiello G., Talarico L., Baillie C., Colosimo G., D'Andrea L., et al. (2021). All is fish that comes to the net: metabarcoding for rapid fisheries catch assessment. Ecol. Appl. 31, e02273. doi: 10.1002/eap.2273
Schumer G., Crowley K., Maltz E., Johnston M., Anders P., Blankenship S. (2019). Utilizing environmental DNA for fish eradication effectiveness monitoring in streams. Biol. Invasions 21, 3415–3426. doi: 10.1007/s10530-019-02056-z
Sigsgaard E. E., Torquato F., Frøslev T. G., Moore A. B. M., Sørensen J. M., Range P., et al. (2020). Using vertebrate environmental DNA from seawater in biomonitoring of marine habitats. Conserv. Biol. 34, 697–710. doi: 10.1111/cobi.13437
Sinniger F., Pawlowski J., Harii S., Gooday A. J., Yamamoto H., Chevaldonné P., et al. (2016). Worldwide analysis of sedimentary DNA reveals major gaps in taxonomic knowledge of deep-Sea benthos. Front. Mar. Sci. 3. doi: 10.3389/fmars.2016.00092
Stauffer S., Jucker M., Keggin T., Marques V., Andrello M., Bessudo S., et al. (2021). How many replicates to accurately estimate fish biodiversity using environmental DNA on coral reefs? Eco. Evol. 11, 14630–14643. doi: 10.1002/ece3.8150
Stefanni S., Mirimin L., Stanković D., Chatzievangelou D., Bongiorni L., Marini S., et al. (2022). Framing cutting-edge integrative deep-Sea biodiversity monitoring via environmental DNA and optoacoustic augmented infrastructures. Front. Mar. Sci. 8. doi: 10.3389/fmars.2021.797140
Taberlet P., Coissac E., Hajibabaei M., Rieseberg L. H. (2012). Environmental DNA. Mol. Ecol. 21, 1789–1793. doi: 10.1111/j.1365-294X.2012.05542.x
Thomsen P. F., Kielgast J., Iversen L. L., Møller P. R., Rasmussen M., Willerslev E. (2012). Detection of a diverse marine fish fauna using environmental DNA from seawater samples. PloS One 7, e41732. doi: 10.1371/journal.pone.0041732
Ushio M., Murakami H., Masuda R., Sado T., Miya M., Sakurai S., et al. (2018). Quantitative monitoring of multispecies fish environmental DNA using high-throughput sequencing. Metabarcoding Metagenom. 2, e23297. doi: 10.3897/mbmg.2.23297
Valentini A., Taberlet P., Miaud C., Civade R., Herder J., Thomsen P. F., et al. (2016). Next-generation monitoring of aquatic biodiversity using environmental DNA metabarcoding. Mol. Ecol. 25, 929–942. doi: 10.1111/mec.13428
Vences M., Lyra M. L., Perl R. G. B., Bletz M. C., Stanković D., Lopes C. M., et al. (2016). Freshwater vertebrate metabarcoding on illumina platforms using double-indexed primers of the mitochondrial 16S rRNA gene. Conserv. Genet. Resour. 8, 323–327. doi: 10.1007/s12686-016-0550-y
Webb T. J., Vanden Berghe E., O'Dor R. (2010). Biodiversity's big wet secret: The global distribution of marine biological records reveals chronic under-exploration of the deep pelagic ocean. PloS One 5, e10223. doi: 10.1371/journal.pone.0010223
Weltz K., Lyle J. M., Ovenden J., Morgan J. A. T., Moreno D. A., Semmens J. M. (2017). Application of environmental DNA to detect an endangered marine skate species in the wild. PloS One 12, e0178124. doi: 10.1371/journal.pone.0178124
Wilcox T. M., McKelvey K. S., Young M. K., Sepulveda A. J., Shepard B. B., Jane S. F., et al. (2016). Understanding environmental DNA detection probabilities: A case study using a stream-dwelling char salvelinus fontinalis. Biol. Conserv. 194, 209–216. doi: 10.1016/j.biocon.2015.12.023
Yamamoto S., Masuda R., Sato Y., Sado T., Araki H., Kondoh M., et al. (2017). Environmental DNA metabarcoding reveals local fish communities in a species-rich coastal sea. Sci. Rep. 7, 40368. doi: 10.1038/srep40368
Keywords: eDNA, biodiversity, deep-sea water, fish monitoring methods, metabarcoding
Citation: Yoshida T, Kawato M, Fujiwara Y, Nagano Y, Tsuchida S and Yabuki A (2023) Optimization of environmental DNA analysis using pumped deep-sea water for the monitoring of fish biodiversity. Front. Mar. Sci. 9:965800. doi: 10.3389/fmars.2022.965800
Received: 10 June 2022; Accepted: 29 December 2022;
Published: 17 January 2023.
Edited by:
Clara F. Rodrigues, University of Aveiro, PortugalReviewed by:
Tommaso Russo, University of Rome Tor Vergata, ItalyGiorgi Dal Pont, Federal University of Paraná, Brazil
Copyright © 2023 Yoshida, Kawato, Fujiwara, Nagano, Tsuchida and Yabuki. This is an open-access article distributed under the terms of the Creative Commons Attribution License (CC BY). The use, distribution or reproduction in other forums is permitted, provided the original author(s) and the copyright owner(s) are credited and that the original publication in this journal is cited, in accordance with accepted academic practice. No use, distribution or reproduction is permitted which does not comply with these terms.
*Correspondence: Takao Yoshida, dHlvc2hpZGFAamFtc3RlYy5nby5qcA==