 Shao-Min Chen
 Peta Mudie2
 Owen A. Sherwood
- 1Department of Earth and Environmental Sciences, Dalhousie University, Halifax, NS, Canada
- 2Marine Environmental Geoscience, Geological Survey of Canada Atlantic, Dartmouth, NS, Canada
The on-going decline in Arctic sea ice represents a significant loss of habitat for sea ice algae, which are a major contributor to primary production in the Arctic. Data on sea ice algal production is limited due to difficulties in both accessing sea-ice and sampling under-ice algae. Compound-specific isotope analysis (CSIA) of amino acids (AAs) is emerging as a powerful tool to trace element origins and biogeochemical processes in marine food webs and may address the knowledge gaps in sea ice algal productivity dynamics. Here we measured δ13C-AA and δ15N-AA in natural communities of sea ice and pelagic algae collected from regions offshore Labrador and Nunavut, Canada. Significant difference in δ13C-AA patterns between sea ice and pelagic algae was observed in different size classes. This difference was further supported by multivariate analyses based on normalized δ13C of essential amino acids (EAAs), which demonstrated a clear separation between sea ice and pelagic algae. Beta (β) values and trophic position (TP) calculated from δ15N of Glutamic Acid and Phenylalanine (Phe) and ∑V parameter for microbial resynthesis indicated a slightly higher heterotrophic biomass in pelagic and sea ice samples as compared to cultured samples. This finding is consistent with the Phe-normalized δ15N of Alanine and Threonine, which provided better separations between sea ice/pelagic algae and other end-member groups. Overall, our study provides first insights into the potential differences in δ13C-AA and δ15N-AA patterns between sea ice and pelagic algae and suggests carbon of sea ice origins may be distinguished from pelagic sources using CSIA-AA approach. These observations highlight the potential of CSIA-AA to estimate proportional contributions of sea ice and pelagic algae to export production and efficiency of benthic-pelagic coupling in polar marine environments.
Introduction
The Arctic Ocean has been experiencing unprecedented reductions in sea ice extent as a result of climate change. The average monthly sea ice extent in September has been declining on average at a rate of 12.8 ± 2.3% per decade from 1979 to 2018 (Meredith et al., 2019). This reduction is accompanied by younger and thinner ice, freshening surface water, and less ice-covered area in the Arctic, which may alter ecosystem dynamics by affecting light penetration, nutrient availability, and density stratification in the water column (Post et al., 2013). The decline in sea ice has caused an increase in pelagic primary production, a reduced surface nutrient availability, and a shift in plankton community structure toward picoplankton (Li et al., 2009; Finkel et al., 2010; Arrigo and van Dijken, 2015; Gérikas Ribeiro et al., 2020; Dhifallah et al., 2022). Further, the loss of sea ice represents a loss of habitat for highly productive sea ice algae, which can be a major contributor to primary production in the Arctic (3-25% and up to 60% in the central Arctic; Legendre et al., 1992; Gosselin et al., 1997; Arrigo, 2014). Therefore, changes in sea ice extent and sea ice algal production are likely to have cascading effects on energy transfer, carbon (C) cycling, and food web functioning in Arctic ecosystems. Since 1997, data on sea ice algal activity and biomass have become more available, but the number of field studies with a sufficient spatial and temporal resolution are still limited (Gosselin et al., 1997; Leu et al., 2015). Despite an increase in primary production being reported, current estimates on Arctic/subarctic productivity have been mainly based on satellite observations, which cannot account for under-ice algal growth and phytoplankton blooms (Mundy et al., 2009; Arrigo et al., 2012; Arrigo and van Dijken, 2015; Ardyna et al., 2020), and thus Arctic productivity may be drastically underestimated. Recent studies also pointed out that changes in timing, duration, and magnitude of the different types of algal blooms due to the loss of sea ice may induce potential mismatches for the timing of zooplankton production and hence alter the biomass and energy transfer to higher trophic levels (Post et al., 2013; Leu et al., 2015). Enhanced understanding of sea ice algae production and clear distinction of their dynamics from pelagic algae is essential to evaluate future productivity and community responses in the changing Arctic.
A key to improved understanding of sea ice algae is the use of highly specific biomarkers. Existing proxies include bulk stable carbon isotopes (δ13C), fatty acids, and highly branched isoprenoids (HBI; e.g., IP25). Sea ice algae have been reported to be more enriched in δ13C compared to phytoplankton, due to the C-limiting environment in the semi-closed sea ice system (Kohlbach et al., 2016; De La Vega et al., 2019). This difference in bulk δ13C has been widely used to trace C from sea ice algae and pelagic phytoplankton, yet interpretation of bulk δ13C can be complicated by the variations in source signatures, effects of metabolic processes and other environmental factors (Pineault et al., 2013; Søreide et al., 2013; Kohlbach et al., 2016). To account for the uncertainties in bulk δ13C, fatty acid proxies were often used along with stable isotope analyses to provide a more accurate estimate of ice algal production (Budge et al., 2008; Søreide et al., 2013; Kohlbach et al., 2016). As a common biomarker for marine primary producers, fatty acids alone are not able to distinguish sea ice algae from phytoplankton, because both communities consist of mainly diatoms which produce the same fatty acids (Søreide et al., 2013; Kohlbach et al., 2016). The small biomass (5-14% of the C biomass) in marine phytoplankton and rapid degradation in detrital materials, however, pose challenges to preservation of fatty acid proxies in marine sediments or bioarchive organisms (e.g., mussels and deep-sea corals; De Troch et al., 2012; Jónasdóttir, 2019). A HBI proxy, IP25 (“Ice Proxy with 25 carbons”), was discovered to be exclusively produced by a few Arctic sea-ice diatoms and has been used as a presence/absence indicator of sea ice taxa in marine sediments (Belt et al., 2007; Brown et al., 2014). However, being highly species specific, this biomarker may not provide community-level information on sea ice algal production (Belt and Müller, 2013). Hence, additional ice-algal specific and well-preserved biomarkers are needed for advancing knowledge of sea ice algal dynamics in the Arctic.
Compound-specific isotope analysis (CSIA) of amino acids (AAs) has emerged as a powerful tool for tracing organic C and nitrogen (N) in marine food webs and sediments (Larsen et al., 2009; Larsen et al., 2013; McMahon et al., 2013; Batista et al., 2014; Ohkouchi et al., 2017). The traditional approach to interpret stable isotope values of bulk organic materials has been widely used to study organic matter sources and cycling in different ecosystems (Fry, 1998). However, the bulk isotopes can be difficult to interpret due to modification by a wide range of environmental factors, including variations in C or N sources, trophic transfer, and microbial alteration (Boecklen et al., 2011). With the emerging CSIA-AA approach, these confounding factors can be addressed by measuring stable isotope values of carbon (δ13C) or nitrogen (δ15N) atoms in individual compounds, e.g. amino acids, that provide specific information about their sources and the physiology of the organisms (Close, 2019). Isotopic fractionation of C in AAs is largely determined by their assimilation and biosynthesis. Amino acids are conventionally classified into essential and non-essential AAs based on their dietary requirements by animals (Karasov and del Rio, 2007; McMahon et al., 2013). Essential amino acids (EAAs) can only be synthesized by autotrophs or resynthesized by bacteria de novo and utilized directly by consumers with minor alteration to their C skeletons (Larsen et al., 2013; McMahon et al., 2013). Diverse biosynthetic pathways and associated isotopic effects lead to distinct and consistent δ13C of EAAs in different functional groups of primary producers (Hayes, 1993; Larsen et al., 2009), which are transferred to higher trophic levels with little or no trophic discrimination (McMahon et al., 2013). Therefore, δ13C-EAA patterns of consumers reflect the isotopic signatures of primary producers at the base of the food web (McMahon et al., 2013). In the ocean, the δ13C-EAA signatures of primary producers are passed, unaltered, to higher trophic levels and eventually preserved in paleo-archives such as proteinaceous deep-sea corals and marine sediments (Schiff et al., 2014; Larsen et al., 2015; McMahon et al., 2015). Such stable isotope “fingerprints” have been developed for primary producers from terrestrial and aquatic ecosystems (Larsen et al., 2009; Larsen et al., 2013; McMahon et al., 2015) and used in Bayesian mixing models to reconstruct plankton community structure from archived materials (McMahon et al., 2015). The changes in δ15N in AAs during trophic transfers lead to different groupings of AAs that are independent of those based on δ13C. The δ15N values of source AAs (SrcAAs) remain basically unchanged while those of trophic AAs (TrAAs) become enriched with increasing trophic position (McClelland and Montoya, 2002). The scattering of δ15N-AA values has been used to investigate the relative contribution of heterotrophic biomass (the ∑V parameter; McCarthy et al., 2007). Hence, the ability of δ15N-AA to provide specific information about trophic transfers, N sources and microbial biomass disentangles the confounding effects for bulk isotope values and allow for more accurate interpretation of stable isotope data (McMahon et al., 2013; McMahon and McCarthy, 2016).
Sea ice algae are subject to extreme variations in light, temperature, and salinity during ice formation and melting, and are therefore adapted to a wide range of environmental conditions (Kirst and Wiencke, 1995). These adaptations include changing chlorophyll characteristics in response to low-light conditions (Kirst and Wiencke, 1995) and production of anti-freeze proteins (Janech et al., 2006; Bayer-Giraldi et al., 2011), which may impact the biosynthetic pathways of AAs and generate unique δ13C-AA and δ15N-AA patterns that can be distinguished from algae of pelagic origins. We therefore hypothesize that the δ13C-AA and δ15N-AA patterns of sea ice algae can be distinguished from those of pelagic algae. Here we present the first preliminary test of this hypothesis by determining δ13C-AA and δ15N-AA values of sea ice and pelagic algae collected offshore Labrador and Nunavut, Canada. By measuring δ13C-AA and δ15N-AA values and comparing with existing data of other end-member autotrophs (Larsen et al., 2013; McCarthy et al., 2013; Sauthoff, 2016; Doherty et al., 2021), we assess the potential to develop a new quantitative biomarker for sea ice algae. With this proxy, it may be possible to reconstruct the relative contribution of sea ice algae to export production recorded in deep-sea corals and marine sediments, which will enhance our understanding of sea ice algae dynamics and contributions to export productivity.
Materials and methods
Sample collection and processing
Brash ice and pelagic algae were collected opportunistically during expeditions of the Canadian Coast Guard Ship Amundsen to the northern Labrador Sea and Baffin Bay during late June to early July in 2019 and during mid-July to mid-August in 2021 (Figure 1 and Table S1). Brash ice algae were collected in Frobisher Bay (Station: FB) in 2019 and Baffin Bay in 2021 (Station: SF and CF) while pelagic algae were collected on the Labrador Shelf (Station: NS and IC) in 2019 and Baffin Bay in 2021 (Station: SF and CF). Both regions are subject to seasonal sea ice cover (Yashayaev et al., 2021).
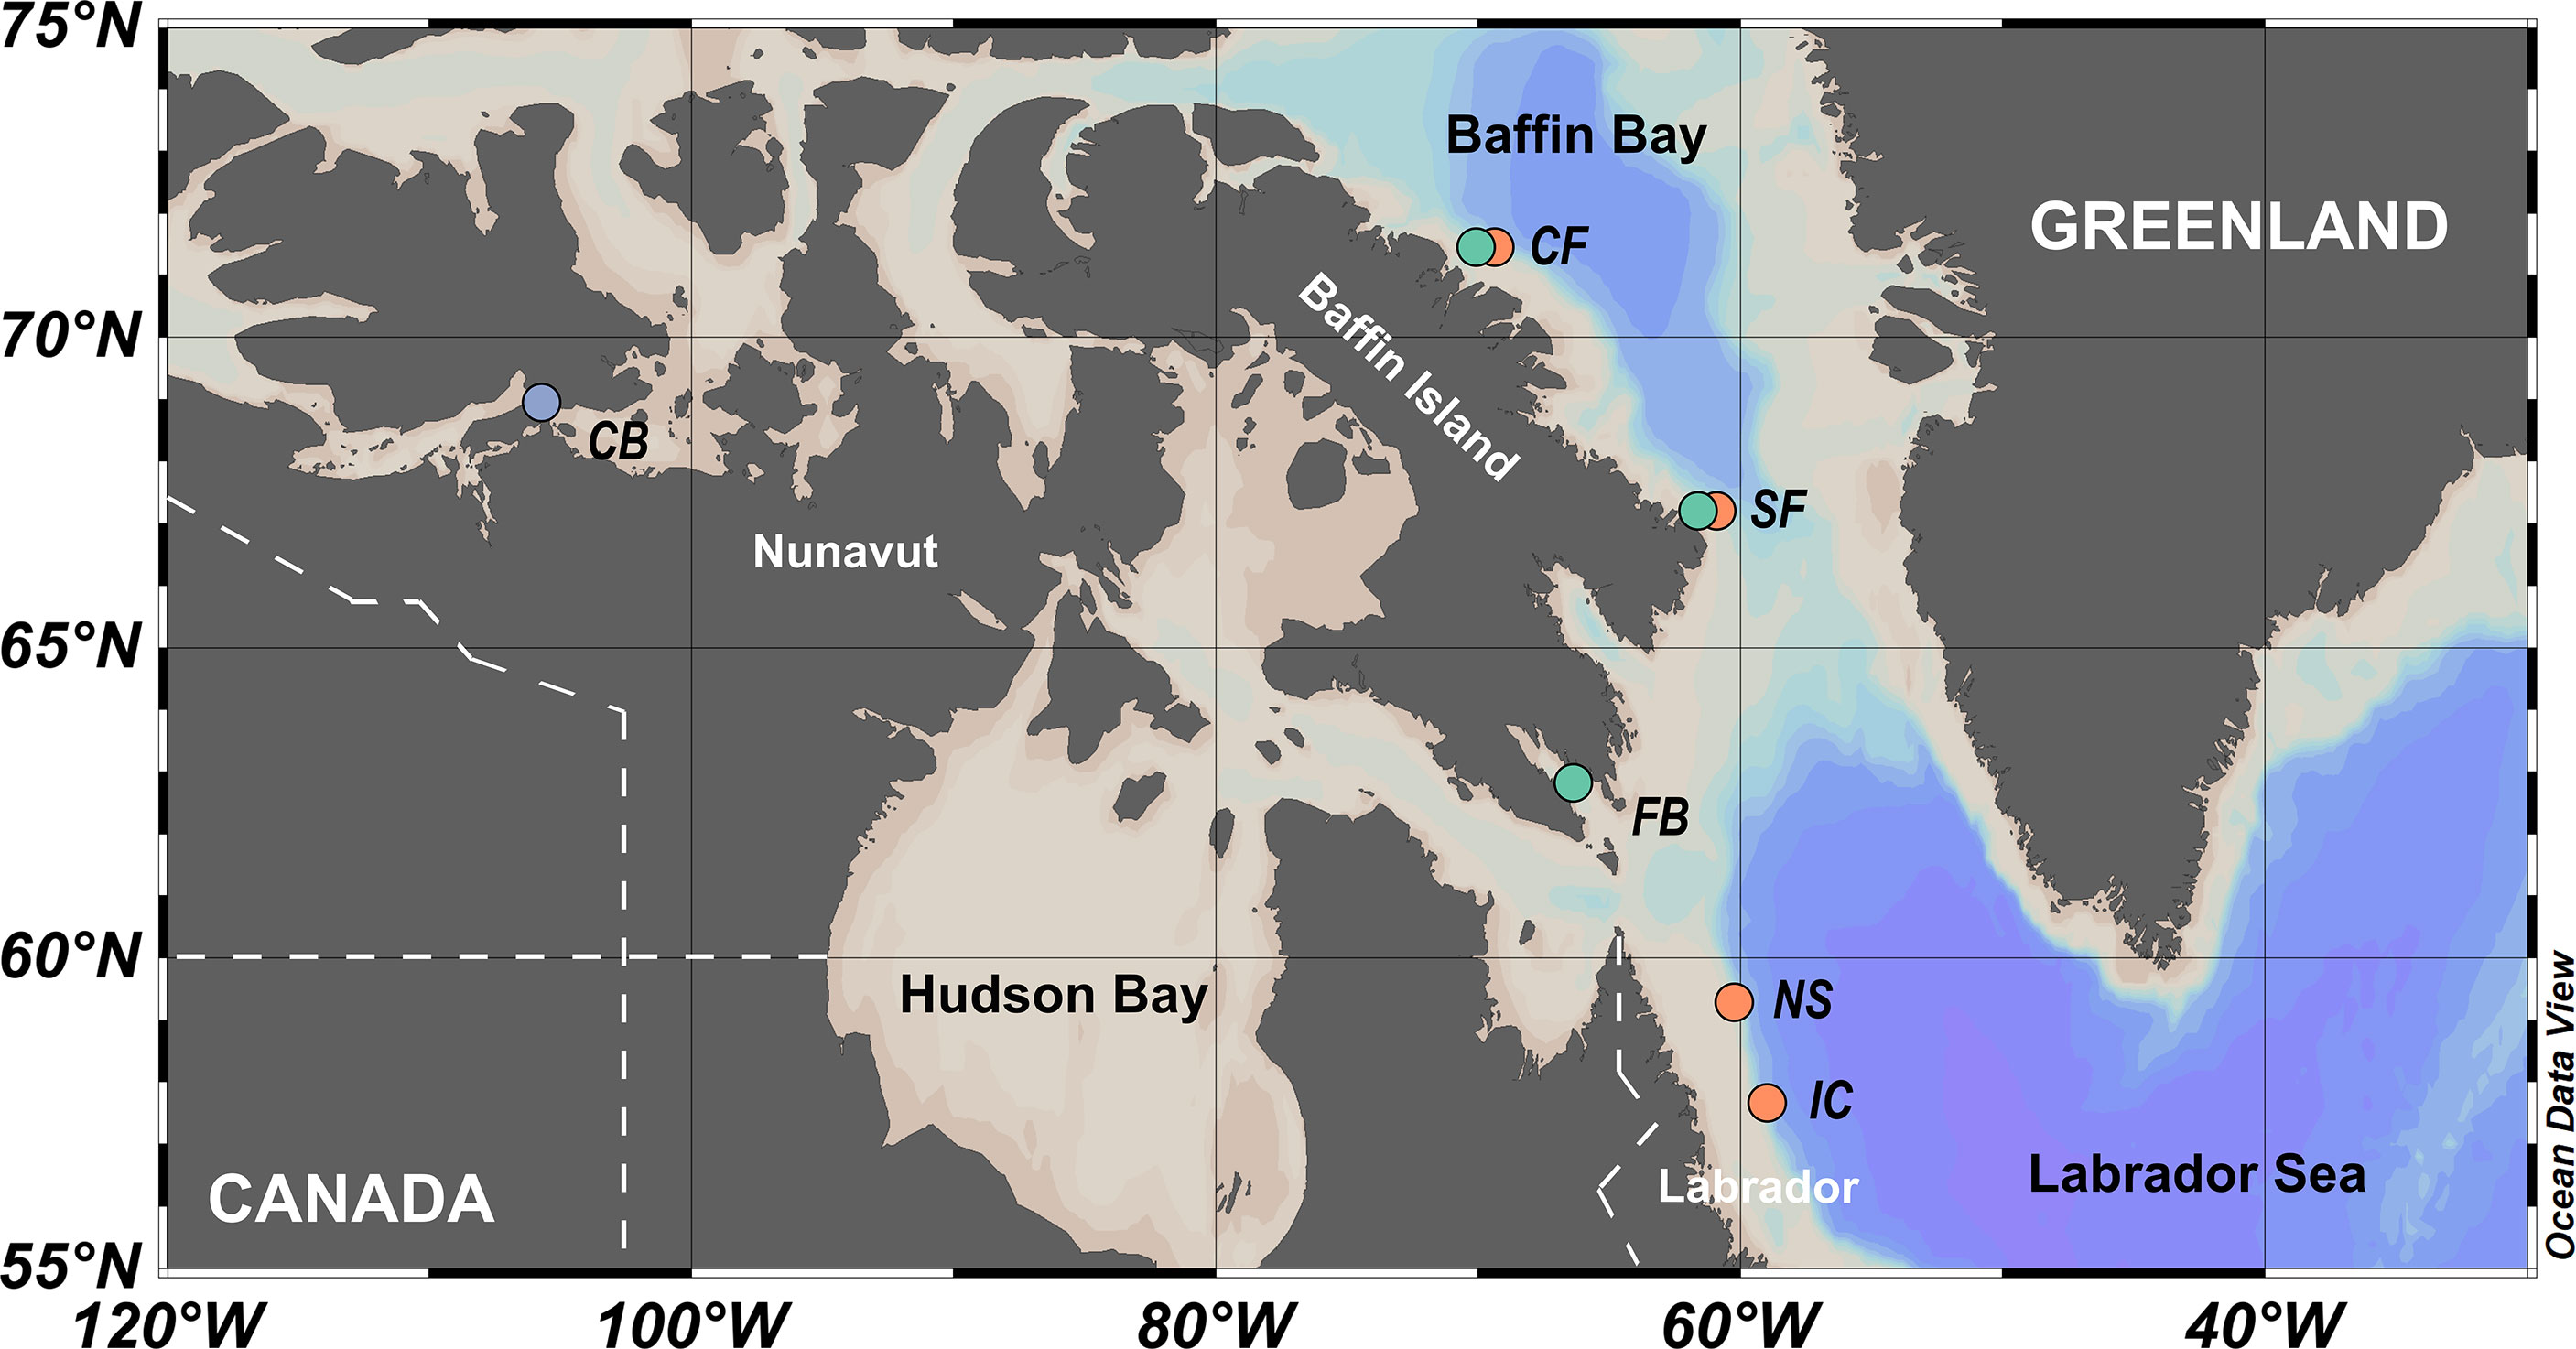
Figure 1 Map of sampling locations off Labrador and Nunavut, Canada. Light blue circles: sea ice algae collected by coring of spring fast ice; Green circles: sea ice algae collected by melting of late spring and early summer brash ice; Orange circles: pelagic algae collected by a CTD-Rosette. Location/station abbreviations: CB, Cambridge Bay; CF, Clark Fjord; SF, Southwind Fjord; FB, Frobisher Bay; NS, Non-sponge Site; IC, ISECOLD1-1500. Figure made with Ocean Data View, (Schlitzer, 2021).
Pelagic algae were collected using a CTD-Rosette (Seabird SBE-911 plus) equipped with a fluorometer and 24 12-L Niskin bottles (Figure 1). Fluorometer readings during the descent of the CTD were used to identify the depth of the deep chlorophyll maximum (DCM). Samples were then taken at depths at or above the DCM (Table S1). Seawater from each depth was then drawn directly from the Niskin bottles into a pre-rinsed 20-L plastic containers and kept in darkness before and during subsequent filtration. Algae were isolated by size-fractionated filtration through nylon filters of 180-μm and 20-μm pore size and polycarbonate filters of 3-μm and 0.2-μm pore size, respectively, using a peristaltic pump. Depending on the concentration of particulate organic matter (POM) in each sample, the volume of seawater filtered was between 10 and 20 L. Immediately following filtration, each filter was then packed into a piece of aluminum foil, placed in a plastic bag, and stored at -20°C until further analysis.
Sea ice algae were collected by scooping pieces of brash ice using a cage lowered by a crane from the bow of the ship. The ice was immediately placed in 0.2-μm filtered seawater at an approximately 1:1 volume ratio and melted at room temperature in the dark upon collection. Melt water was filtered with the same size-fractionated system described above in 2021 (through 180-μm, 20-μm, 3-μm and 0.2-μm pore size filters). In 2019, due to time and equipment constrains, melt water was only filtered through 3-μm and 0.2-μm pore size filters. Every 0.5-1 L melted ice water was filtered through the size-fractionated system in a descending order for each sample.
Additional samples of sea ice algae were provided by Centre for Earth Observation Science, Manitoba. The samples were collected during the 2017 ICE-CAMPS field campaign (26 April to 12 May 2017) within a tidal strait area between the Finlayson Islands near Cambridge Bay, Nunavut (~69°00.033’N, 105°48.967’W; Figure 1 and Table S1), by filtration of landfast ice-core melt (30-100 ml) onto pre-combusted GF/F filters (Pogorzelec et al., 2022 in review).
Upon return to the laboratory, all the filters were freeze-dried and weighed to estimate the biomass collected on each filter by subtracting the average weight of blank filters (n = 10 for each type with a standard deviation up to 1.0 mg). Sea ice algae filters had approximate biomass ranging from < 0.1 to 12.2 mg while pelagic algae filters ranging from 0.7-11.9 mg. All the freeze-dried filters were stored at -20°C in dark again until further analysis.
Amino acid δ13C and δ15N analyses
Approximately 2-5 mg of biomass was required for δ13C-AA and δ15N-AA analyses per sample. For algae filters with a biomass < 1 mg, 2 or 3 filters of the same pore size from the same piece of ice or the same water depth were combined as one sample. Individual or combined filters of algae were transferred to Pyrex culture tubes in preparation for AA acid hydrolysis. Since some sea ice algae filters were collected through different pore sizes (only 3 and 0.2 μm), to make them comparable with pelagic algae, sea ice and pelagic algae filters with pore size of 180 μm, 20 μm and 3 μm collected from the same piece of ice or the same depth were combined to one sample. We found that nylon filters of 180-μm and 20-μm pore size reacted during AA derivatization and introduced contamination peaks during isotopic analyses. Therefore, biomass was extracted from the nylon filters before hydrolysis. To carry out the extraction, 180-μm and 20-μm filters collected from the same depth were placed in 5 ml Milli-Q water in a Pyrex culture tube and ultrasonicated at 40 kHz for 45 min. Thereafter, the Pyrex tubes were centrifuged at 3000 rpm for 10 min, and the supernatant and the filters were removed from each tube. The 3-μm filter from the corresponding depth or the same piece of ice was then added to each Pyrex tube, so that each tube contained biomass from the 180-μm, 20-μm and 3-μm filters. The 0.2-μm filters from different depths or ice were treated as individual samples and transferred to Pyrex tubes for further hydrolysis. It is important to note that ultrasonic extraction may induce cell disruption which releases a portion of water-soluble proteins and free AAs (Rahman and Lamsal, 2021). The impact of ultrasonication on AA composition and CSIA values is discussed in the supplementary.
Individual or combined filters/biomass of sea ice algae and pelagic algae in Pyrex culture tubes were hydrolyzed in 2-ml 6-N HCl (Sigma-Aldrich) at 110 °C for 20 hours (Larsen et al., 2013; Batista et al., 2014; McMahon et al., 2015). Following hydrolysis, the liquid phase in each sample was transferred into a 4- or 7-ml dram vial (Sigma-Aldrich). Preparation was done in batches of 6-7 samples, two calibration standards of AA mixtures with known δ13C and δ15N values and a lab standard (homogenized Chlorella powder; Organika) processed in the same way as samples. Samples and standards were spiked with a norleucine (Nle) internal standard (Sigma-Aldrich) and purified using Dowex 50WX8 200-400 (H) cation exchange resin following Fábián et al. (1991) and Takano et al. (2010). To reduce polarity and increase volatility of AAs for GC-IRMS analysis, AAs were converted into volatile derivatives by esterification of carboxyl groups and subsequent acylation of amine groups using isopropanol and trifluoroacetic acid anhydride respectively (Silfer et al., 1991; McMahon et al., 2015). Derivatized samples were purified and extracted with a phosphate buffer (P-buffer) solution (Mixture of 1 M KH2PO4 and 1 M Na2HPO4 solution) prepared in deionized water (Millipore, Milli-Q; adjusted to pH = 7) and chloroform (Sigma-Aldrich) following the procedures described by Ueda et al. (1989); Carstens et al. (2013) and Broughton et al. (2015). Samples were well mixed with 2-ml P-buffer and 2-ml chloroform by shaking the vials for 30 sec and then centrifuged at 3000 rpm for 5 min. The P-buffer layer was removed followed by an addition of another 2-ml P-buffer solution to repeat the mixing and centrifugation twice or three times. After the last centrifugation, the chloroform layer containing derivatized AAs was transferred to a new dram vial. The remaining P-buffer layer was washed by shaking and centrifugation with another 2-ml chloroform, which was pooled together with the previously obtained chloroform in the new dram vial. Purified samples in chloroform were acylated again, dried and dissolved in ethyl acetate (Sigma-Aldrich) for further analysis.
Samples were injected in triplicate or quadruplicate, bracketed by triplicate or quadruplicate injections of calibration standards, and analyzed for δ13C or δ15N using a Trace 1310 Gas Chromatograph (GC) coupled with a Delta V IRMS (Thermo Scientific). The following AAs were typically measured under our analytical conditions: alanine (Ala), glycine (Gly), proline (Pro), valine (Val), leucine (Leu), isoleucine (Ile), asparagine + aspartic acid (Asx), threonine (Thr), serine (Ser), glutamine + glutamic acid (Glx), phenylalanine (Phe), lysine (Lys) and tyrosine (Tyr). Measured δ13C values were corrected for isotopic fractionation and introduction of C atoms during derivatization according to Silfer et al. (1991). Linear regression was used to normalize samples against instrument drift between successive triplicate injections of the amino acid standard (Yarnes and Herszage, 2017; denoted as calibrated δ13C). Measured δ15N values were calibrated based on the offset between known and measured values of calibrated standards and normalized against instrument drift with linear regression (denoted as calibrated δ15N). The average reproducibility of δ13C was ± 0.3‰ for the internal standard Nle, and from ± 0.2‰ (Asp) to ± 0.6‰ (Leu and Lys) for AA standards, respectively (n = 27 for each AA). The average reproducibility of δ15N was ± 0.5‰ for the internal standard Nle, and from ± 0.3‰ (Pro) to ± 0.8‰ (Thr) for AA standards, respectively (n = 26 for each AA). The relative abundance (mol%) of amino acids was quantified by calibration of mass 44 peak areas measured during δ13C analysis using relative response factors between each AA and the Nle internal standard, following Kaiser and Benner (2005).
Calculations and statistical analyses
To account for region-specific differences in baseline δ13C, calibrated δ13C values were internally normalized by subtracting the mean of 5 EAAs (Phe, Leu, Ile, Thr and Val) for each sample (denoted as normalized δ13C). Normalization accounts for variations in inorganic C sources and other environmental parameters, whereas the internal variations between AAs are driven by the underlying biochemical mechanisms (Larsen et al., 2015; McMahon et al., 2015). Larsen et al. (2015) examined the δ13C-AA fingerprints of a cultured marine diatom (Thalassiosira weissflogii) under a wide range of environmental parameters (light, salinity, temperature, and pH). They found that despite natural variability in bulk δ13C and absolute δ13C-AA values, the normalized δ13C-EAA values remained unaltered under different growing conditions, suggesting that internally-normalized δ13C-EAA signatures are diagnostic of the biosynthetic origins of AAs across environmental gradients (Larsen et al., 2015). This spatiotemporal consistency in δ13C-EAA signatures of marine primary producers was further validated by controlled experiments by Stahl (2021) and analyses of 135 field samples by Elliott Smith et al. (2022).
The trophic position (TP) of samples was estimated based on the calibrated δ15N values of Glx and Phe, following the equation proposed by Chikaraishi et al. (2009) and modified by Nielsen et al. (2015):
where 2.9‰ is the beta (β) value representing the difference between the trophic AA δ15N-Glx and the source AA δ15N-Phe in marine primary producers and 6.6‰ is the trophic enrichment factor representing the δ15N enrichment in Glx relative to Phe with each trophic transfer (Chikaraishi et al., 2009; Nielsen et al., 2015). To compare with published β values, βGlx/Phe and βGlx/Lys values were calculated for sea ice and pelagic algae from the calibrated δ15N values of Glx and Phe, and Glx and Lys, respectively.
To examine the degree of heterotrophic resynthesis, ∑V was calculated based on the deviation in calibrated δ15N values of trophic AAs, following the formula McCarthy et al. (2007):
where n is the number of trophic AAs used in this calculation, δ15Ni are the calibrated δ15N values of each trophic AA (Ile, Leu, Asx, Glx, Pro and Ala) and δ15Nmean is the average δ15N value of these AAs. Higher ∑V values indicate a higher degree of heterotrophic resynthesis (McCarthy et al., 2007).
Prior to testing the differences between sea ice and pelagic algae using Two Sample T-test and one-way ANOVA with Tukey HSD test, normalized δ13C and calibrated δ15N values were tested for univariate normality with Shapiro-Wilks test (R package: stats). Principal Component Analysis (PCA, R package: FactoMineR) and Linear Discriminant Analysis (LDA, R package: MASS) were performed in R version 4.1.1 with RStudio interface version 1.4.1717. To examine the differences between sea ice and pelagic algae, PCA was performed on normalized δ13C-AA values and calibrated δ15N-AA values, respectively. To assess to what extent sea ice algae can be distinguished from pelagic algae, an LDA classification model was built based on their normalized δ13C-EAA values and a leave-one-out cross validation approach was used to calculate the probability of group membership of the classifier samples. Standard ellipse areas (SEA) were plotted for the groups’ bivariate means in the PCA and LDA plots, each enclosing ~40% of the data.
Results
Amino acid δ13C and δ15N patterns
The overall δ13C-AA patterns for all measured algae were similar to eukaryotic microalgae reported elsewhere (Larsen et al., 2013), with relatively more positive values for NEAAs (Figure 2). For EAAs, all the algae groups had normalized δ13C values of -6 to -3‰ for Phe, Leu and Val, and ~2‰ for Ile. The δ13C of Thr was more variable, ranging from 7.8‰ to 14.9‰. Sea ice algae collected from brash ice (B) had higher Thr values than those of pelagic algae (P) for both size groups (Two Sample T-test, p < 0.01) while their Val values were significantly lower than pelagic algae for the 0.2-3 μm group (p < 0.05).
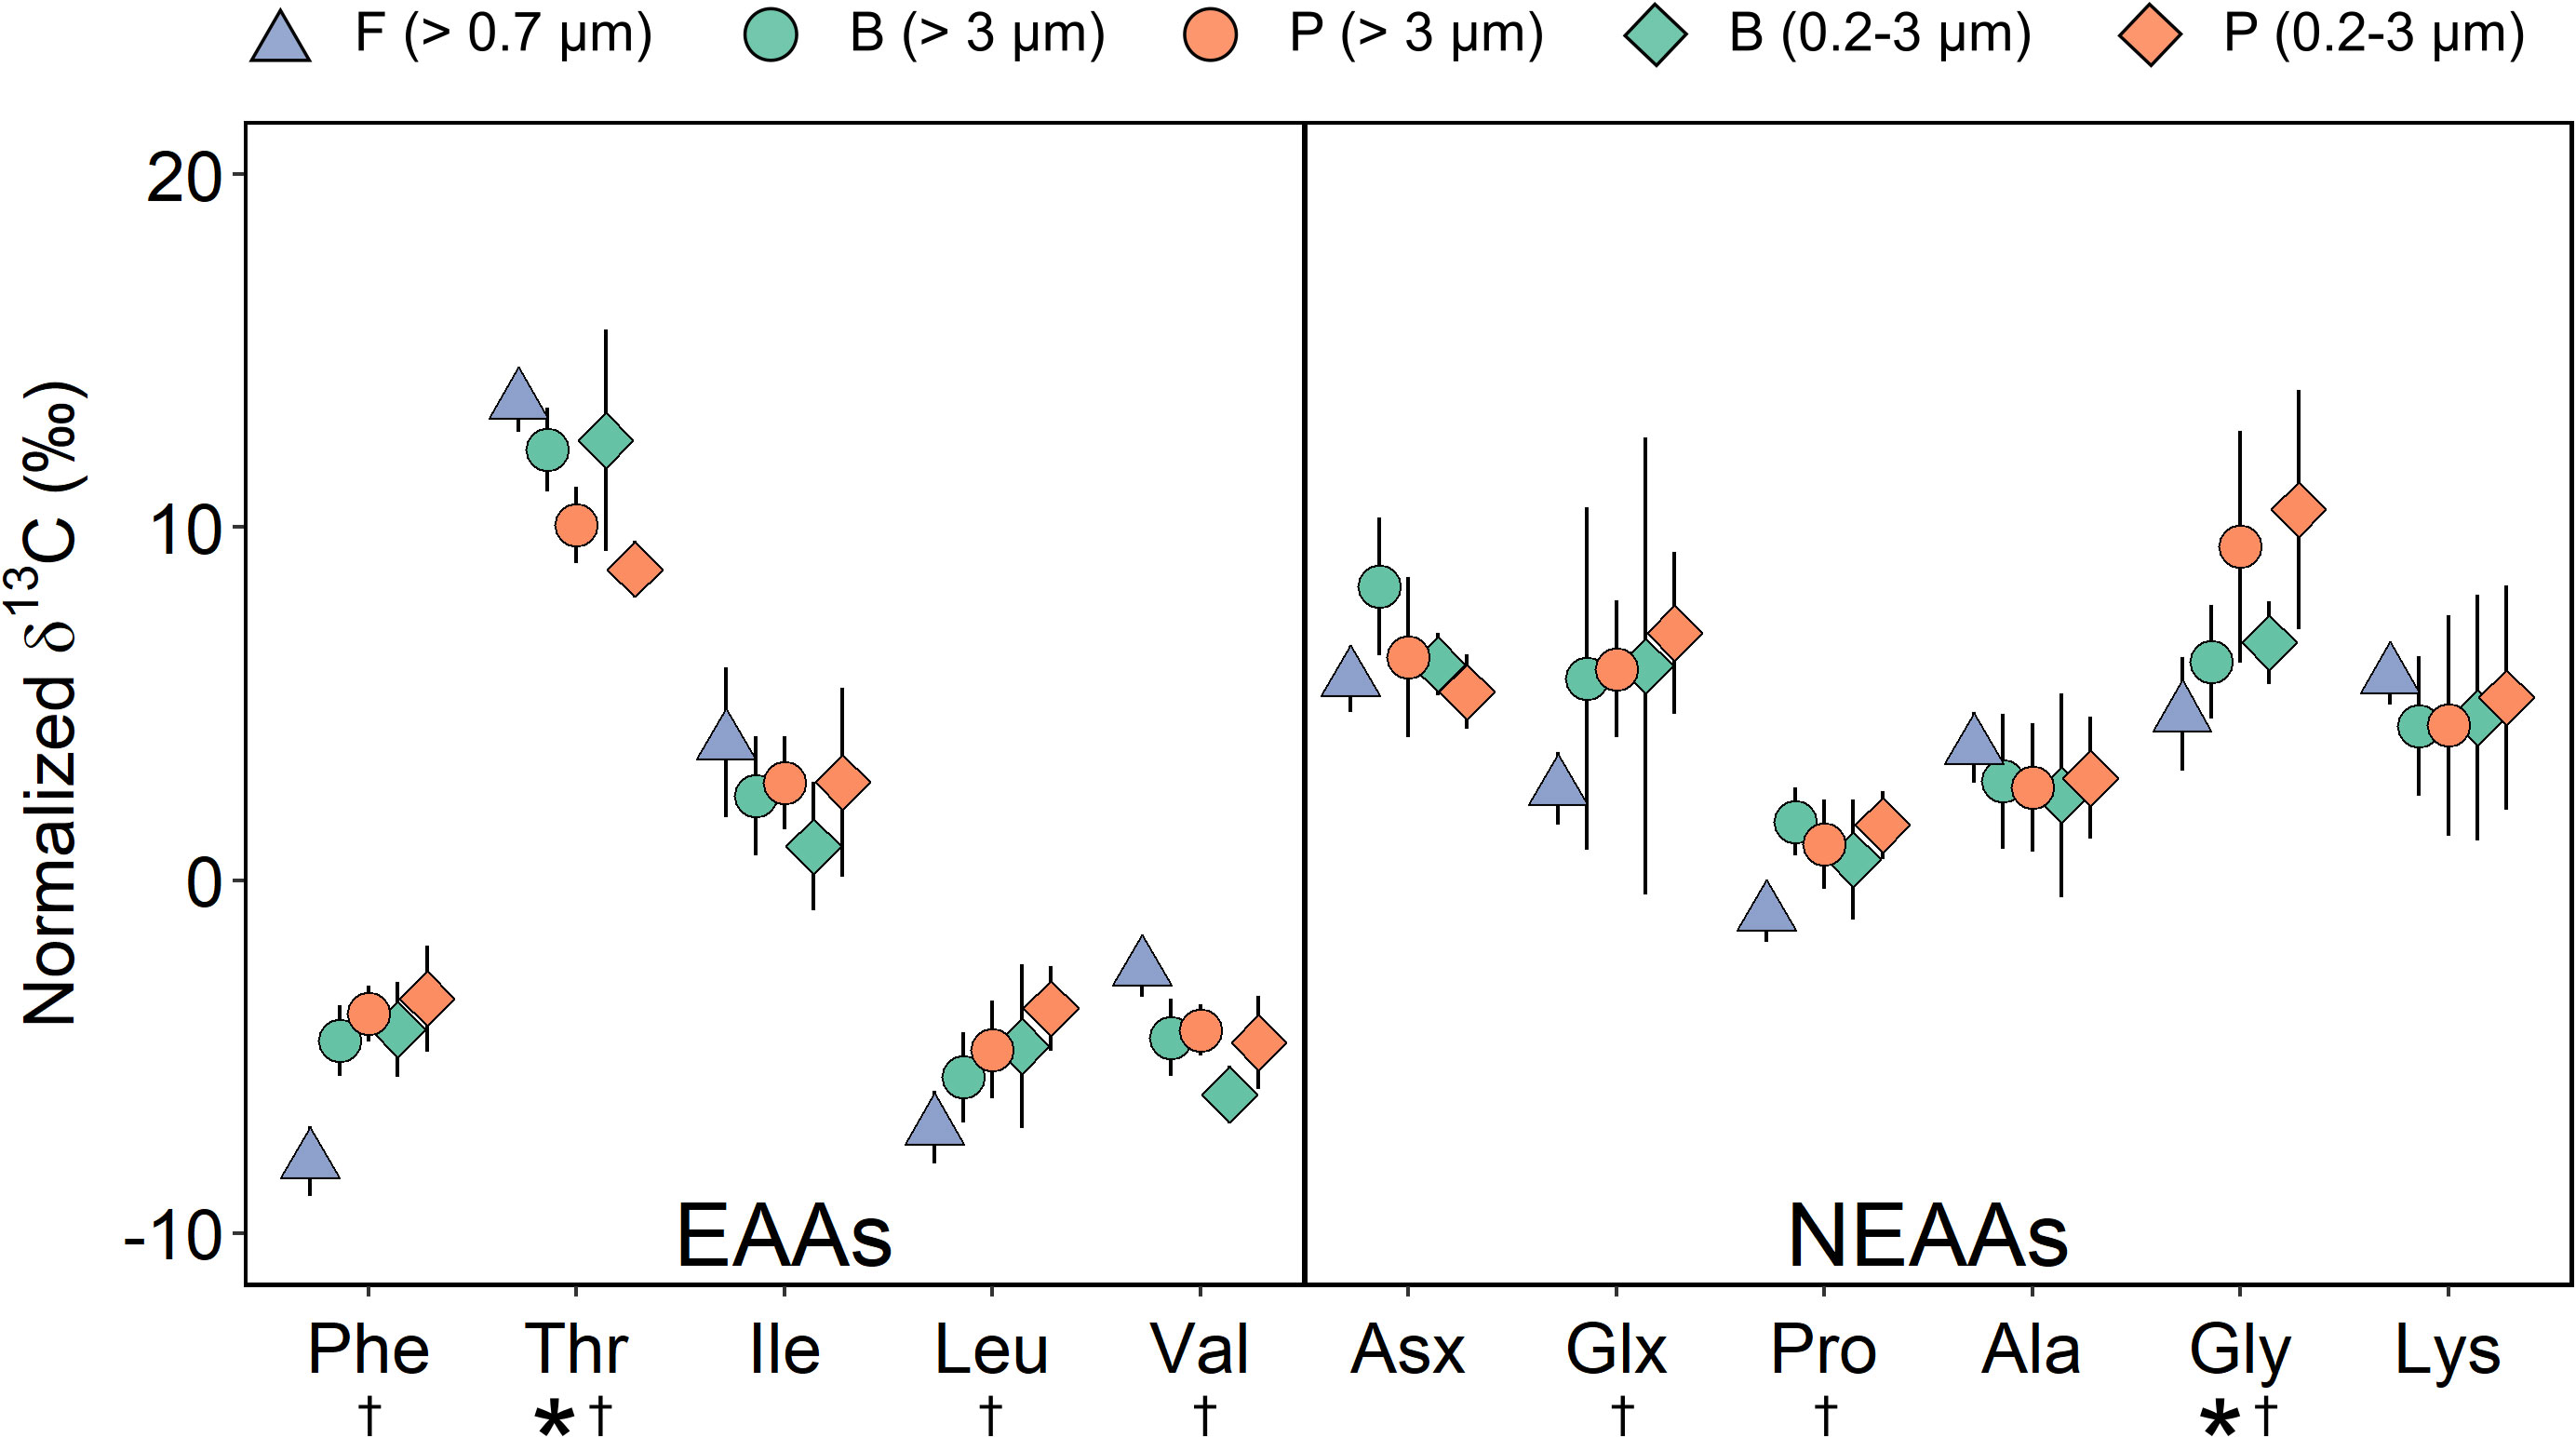
Figure 2 Normalized δ13C-AA values of pelagic algae (P) and sea ice algae from the fast ice (F) and brash ice (B). Error bars show ±1 standard deviation for each group (n = 5-9). Asterisks indicate significant differences between brash ice algae and pelagic algae for both sizes (Two Sample T-test, p < 0.05). Daggers indicate significant differences between fast ice algae and pelagic algae for both sizes (Two Sample T-test, p < 0.05). EAAs, essential amino acid; NEAAs, non-essential amino acid.
To validate if the difference between sea ice and pelagic algae was consistent across different ice types, we compare the results from the brash ice with sea ice algae from fast ice (F) from Cambridge Bay. Similarly, sea ice algae from the fast ice (> 0.7 μm; n = 6) exhibited a higher Thr value than those of pelagic algae for both sizes (n = 9 for each size; Two Sample T-test, p < 0.01; Figure 2). Phe, Leu and Val values from the fast ice algae were significantly different from those of pelagic algae for both sizes (p < 0.01). The NEAA patterns were relatively similar between all groups, except for Gly which was significantly higher in both size groups of pelagic algae (p < 0.05; Figure 2). Variations in normalized δ13C-EAA values were significantly different between different groups (one-way ANOVA, p < 0.001), with a higher variation in sea ice algae, ranging 21.7 ± 1.0‰ for > 0.7 μm fast ice algae, 18.3 ± 1.6‰ and 18.5 ± 3.4‰ for > 3 μm and 0.2-3 μm brash ice algae, and 15.2 ± 2.0‰ and 13.7 ± 1.5‰ for > 3 μm and 0.2-3 μm pelagic algae, respectively. The Tukey HSD test revealed that the differences between > 3 μm and 0.2-3 μm brash ice algae, > 0.7 μm fast ice algae and 0.2-3 μm brash ice algae, and > 3 μm and 0.2-3 μm pelagic algae were not significant (p > 0.05).
Patterns of δ15N-AA for pelagic and sea ice algae were also broadly similar to marine algae and particulate organic matter reported globally (McCarthy et al., 2007; McCarthy et al., 2013) with relatively lower values for source AAs and higher values for trophic AAs (Figure 3). Note that δ15N-AA in the fast ice samples from the Cambridge Bay was not analyzed due to low biomasses from small filtration volumes (see Sect. 2.1). Different algal and size groups shared similar calibrated δ15N-AA values in Phe (mean: 5.3 ± 1.3‰) and Lys (mean: 5.5 ± 1.4‰; one-way ANOVA, p > 0.05; Figure 3). There were significant offsets in trophic AAs between brash ice algae and pelagic algae (Two Sample T-test; Asx, Ala, and Gly for > 3 μm, p < 0.05; Gly and Val for 0.2-3 μm, p < 0.05; Figure 3). Compared to Phe, which is an indicator of δ15N of baseline N sources, most trophic AAs had similar or higher δ15N values while Gly and Thr were lower (Figure 3).
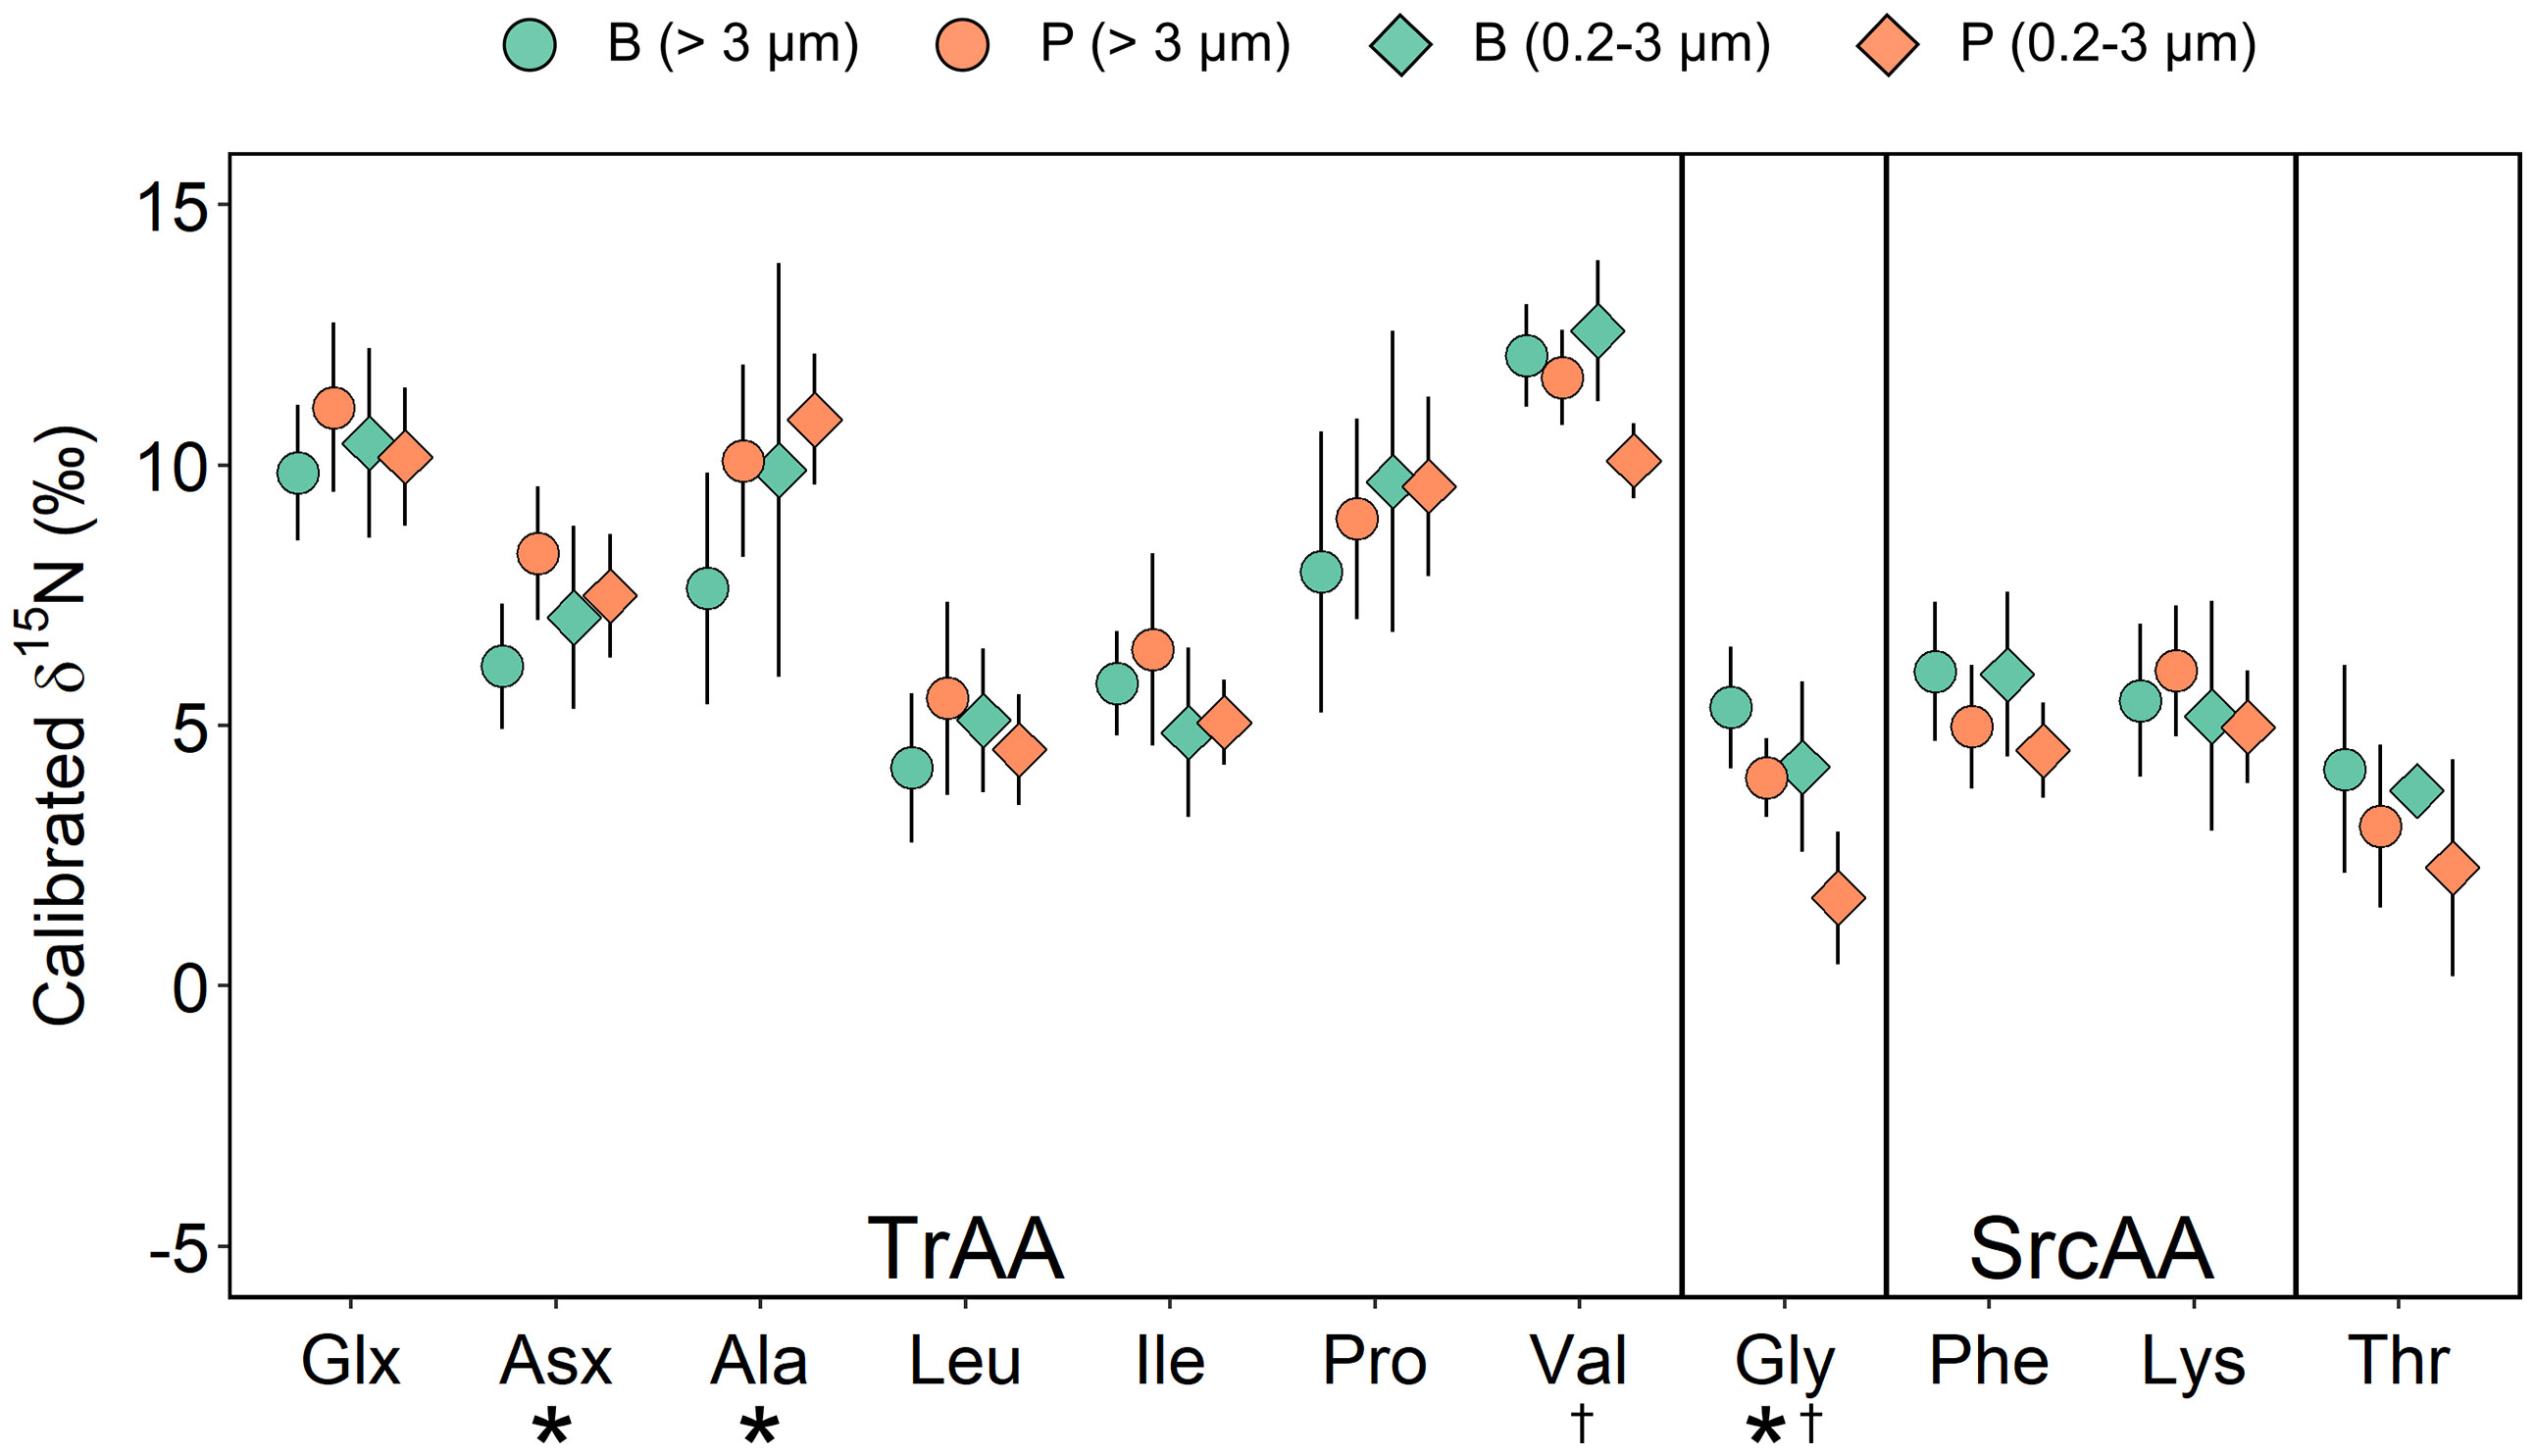
Figure 3 Normalized δ15N-AA values of pelagic algae (P) and sea ice algae from the brash ice (B). Error bars show ±1 standard deviation for each group (n = 4-8). Asterisks indicate significant differences between > 3 μm sea ice and pelagic algae (Two Sample T-test, p < 0.05). Daggers indicate significant differences between 0.2-3 μm sea ice and pelagic algae (Two Sample T-test, p < 0.05). SrcAA, source amino acid; TrAA, Trophic AA.
Multivariate analysis
To explore the differences in normalized δ13C-AA patterns between sea ice and pelagic algae, principal component analysis (PCA) was performed on pelagic algae (P) and sea ice algae from the fast ice (F) and brash ice (B). PCA using normalized δ13C values of 11 AAs explained 60.6% of the total variation between individual samples. The first principal component (PC1) accounted for 37.1% of the total variation and separated the pelagic algae from the fast ice algae (Figure 4A). The standard ellipses of brash ice algae and pelagic algae showed a more constrained and separated distribution when performing PCA using only the normalized δ13C values of EAAs, with variation explained by PC1 increased by 11.6% (Figure 4B). Phe, Leu, and Thr contributed the most to the variation of PC1 (30.1%, 29.3%, and 23.1%, respectively). PC2 explained 24.6% of the total variation, mostly contributed by Ile (58.7%) and Thr (32.1%).
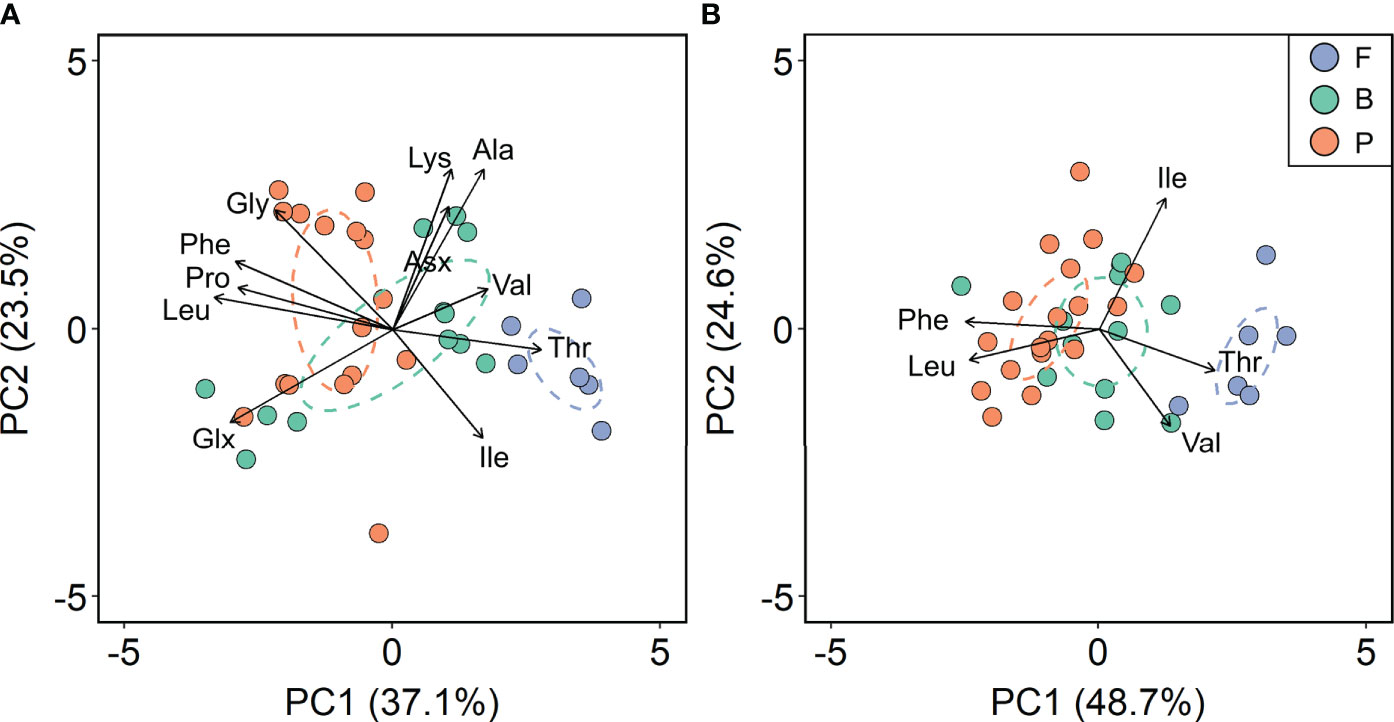
Figure 4 Principal component analysis based on normalized δ13C values of (A) 11 amino acids and (B) five essential amino acids of pelagic algae (P) and sea ice algae from the fast ice (F) and brash ice (B). Values in parentheses of the axis titles are the percentage variation explained by each axis. The colored ellipses represent standard ellipse area (SEA) for each corresponding group, containing ~40% of the data.
PCA was performed on brash ice and pelagic algae using δ15N-SrcAAs and δ15N-TrAAs respectively, and no clear separations were observed between algal groups (data not shown).
The separation between brash/fast ice algae and pelagic algae became more pronounced in the LDA classification model (Figure 5). The first linear discriminant (LD1) explained 80.2% of group variation (Figure 5). The re-classification using the leave-one-out cross validation approach showed that 8 out of 12 brash ice samples were classified as brash ice algae (87.0 ± 12.6%), 15 out of 18 pelagic samples were classified as pelagic algae (86.9 ± 16.1%), and all 6 fast ice algae were classified as fast ice algae (93.8 ± 15.1%; Table S5).
TP and ∑V, Phe-normalized δ15N of Ala and Thr
Beta (β) values calculated from the calibrated δ15N of Phe and Glx averaged 3.8 ± 0.5‰ and 4.4 ± 0.9‰ for > 3 μm and 0.2-3 μm brash ice algae, and 6.1 ± 1.3‰ and 5.6 ± 0.9‰ for > 3 μm and 0.2-3 μm pelagic algae, respectively. The βGlx/Lys values were similar across different size and algal groups (one-way ANOVA, p > 0.05), with means of 4.4 ± 0.7‰ and 5.2 ± 0.9‰ for > 3 μm and 0.2-3 μm brash ice algae, and 5.1 ± 1.1‰ and 4.8 ± 1.0‰ for > 3 μm and 0.2-3 μm pelagic algae, respectively.
Trophic position (TP) values estimated based on the calibrated δ15N of Phe and Glx averaged 1.2 ± 0.1 (n = 12) and 1.5 ± 0.2 (n = 21) for sea ice algae from the brash ice and pelagic algae, respectively (Figure 6A). Values of the ∑V parameter for microbial resynthesis were similar between the two algal groups, with means of 1.8 ± 0.5‰ and 1.9 ± 0.5‰, respectively (Two Sample T-test, p > 0.05; Figure 6A). Both sea ice and pelagic algae showed significant differences in TP from cultured algae (0.7 ± 0.5, n = 12), and zooplankton (2.5 ± 0.4, n = 7). The ∑V values of sea ice algae were significantly different from sediment values reported in the literature (2.3 ± 0.7‰, n = 28; p < 0.05) while those of pelagic algae showed no difference from sediment (p > 0.05; Figure 6A).
Another way to distinguish different end-members is to examine their Phe-normalized δ15N of Ala and Thr, which have been found useful in previous studies (Doherty et al., 2021). Sea ice algae from the brash ice and pelagic algae were examined and compared with previously published end-members (McCarthy et al., 2013; Yamaguchi and McCarthy, 2018; Doherty et al., 2021). Sea ice algae had similar Phe-normalized Ala values with cultured algae (p > 0.05), which were significantly different from pelagic algae, and all the other end-members (p < 0.05; Figure 6B). Pelagic algae had higher Ala δ15N than sea ice algae and cluster closer to microbial degraded POM and sediment (Figure 6B).
Discussion
Distinct essential amino acidδ13C fingerprints
Our study characterized for the first time, distinct δ13C-EAA patterns between sea ice and pelagic algae (Figure 2). Despite a different size range (> 0.7 μm), this distinction from pelagic algae was found consistent in another set of sea ice algae from the fast ice from Cambridge Bay. The distinction between sea ice and pelagic algae is further evidenced by the increase in variation explained by PC1 and PC2 and a clear separation between groups with loadings of only EAAs in the PCA (Figure 4B). This finding was consistent with previous observations that EAAs were among the most informative AAs for separating different primary producers (Larsen et al., 2013). The separation between sea ice and pelagic algae became more pronounced in the LDA classification model that correctly predicted the classes of most samples (Figure 5; Table S5), which is not surprising because, unlike PCA, LDA is a supervised technique that maximizes the separability between the classes. The strong classification probability in LDA demonstrated the potential to use δ13C-EAA fingerprints to trace C sources from sea ice and pelagic origins. Typical sea ice and pelagic communities in Arctic/subarctic regions consist of a mixture of diatoms, dinoflagellates, and flagellates (Lizotte, 2003; Poulin et al., 2011; Harrison et al., 2013; Hop et al., 2020), which was evidenced by the similar δ13C-AA patterns for all measured algae to eukaryotic microalgae reported by Larsen et al. (2013). Although the community composition of sea ice and pelagic algae from the northern Labrador Sea and Baffin Bay was not characterized due to the lack of taxonomic identification, previous studies can provide some taxonomic information of sea ice and pelagic communities in Frobisher Bay (Hsiao, 1979; Hsiao and Pinkewycz, 1985; Hsiao, 1992). Ice cores, seawater and sediment trap samples revealed a dominance of diatoms in both sea ice algae in spring and phytoplankton in summer in Frobisher Bay (Hsiao, 1979; Hsiao and Pinkewycz, 1985; Hsiao, 1992). Moreover, the community composition of sea ice algae from the fast ice in Cambridge Bay was surveyed and over 80% of the total population was dominated by pennate and centric diatoms (Pogorzelec et al., 2022 in review). Hence, we speculate that the unique δ13C-EAA signatures between the sea ice and pelagic communities are less likely to be driven by their similar community composition, and instead, they may be linked to the underlying biochemical and physiological differences between these two groups.
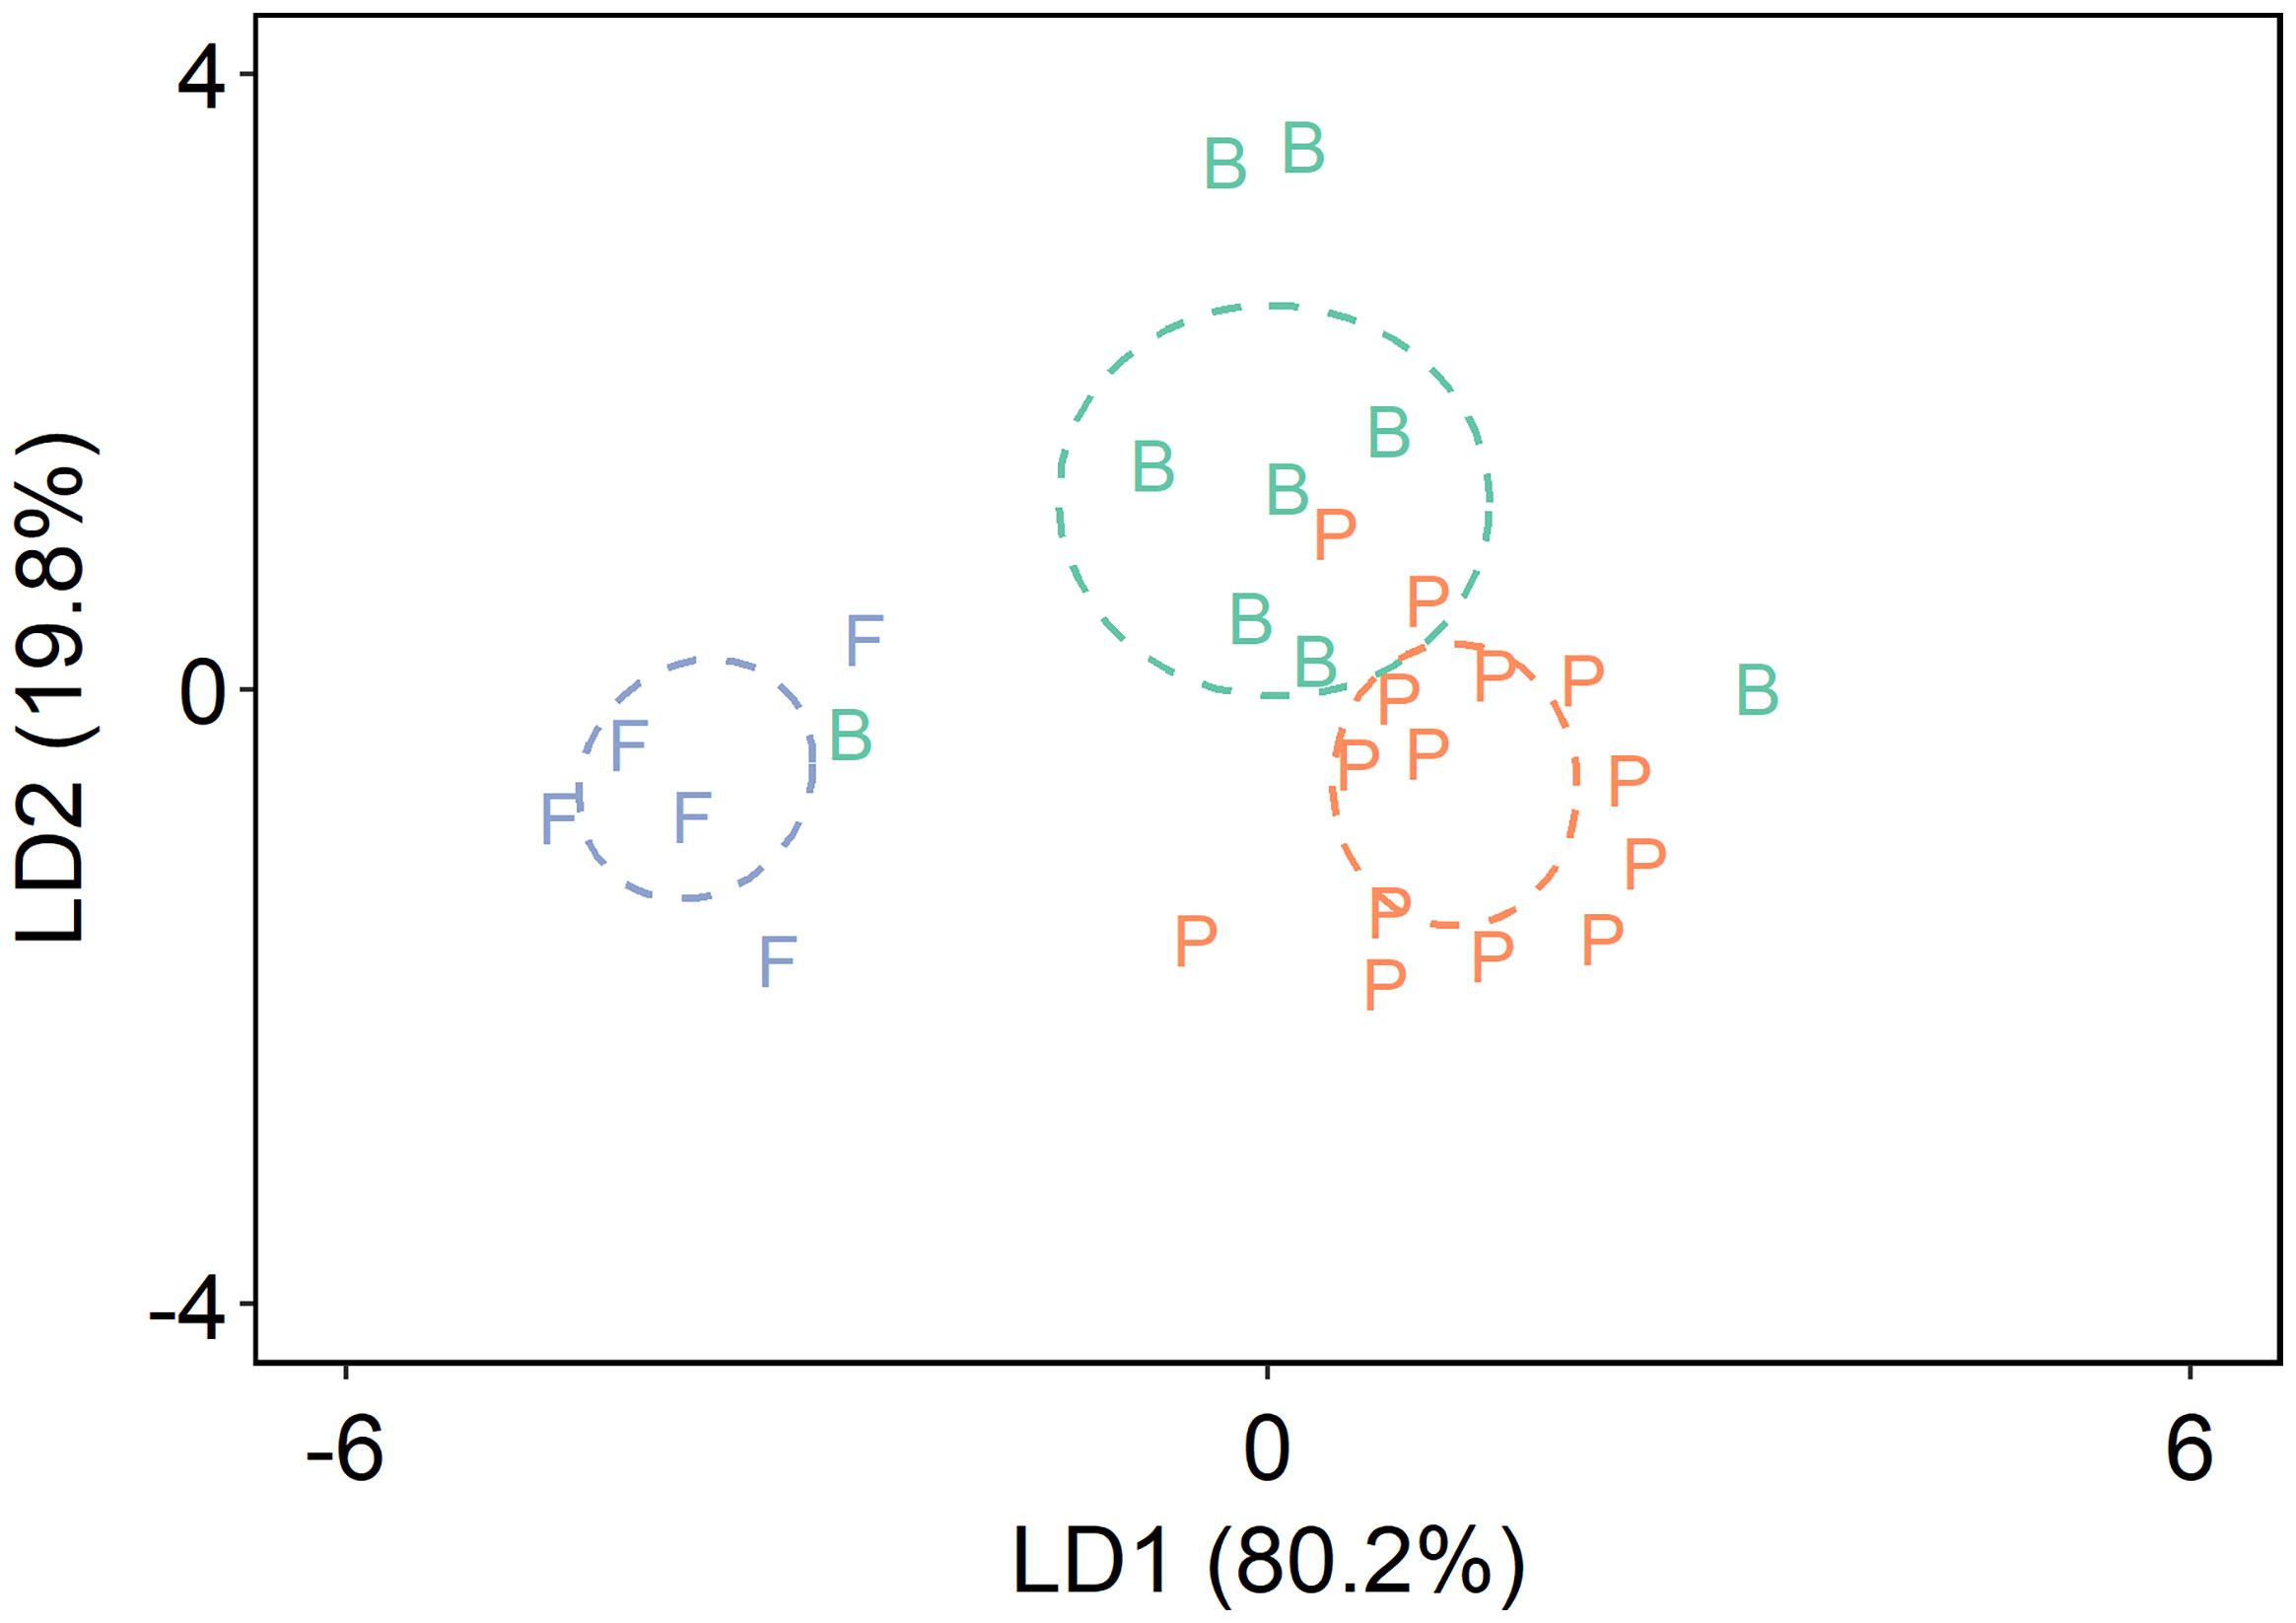
Figure 5 Linear discriminant analysis based on normalized δ13C values of five essential amino acids of pelagic algae (P) and sea ice algae from the fast ice (F) and brash ice (B). Values in parentheses of the axis titles are the percentage variation explained by each axis. The colored ellipses represent standard ellipse area (SEA) for each corresponding group, containing ~40% of the data.
To date, unique δ13C-EAA patterns have been identified in algae, seagrass, plants, fungi and bacteria (Larsen et al., 2009; Lehman, 2009; Larsen et al., 2013; Vokhshoori et al., 2014). Distinct and consistent δ13C-EAA patterns in different phylogenic groups result from their associated biosynthetic pathways and isotopic effects (Macko et al., 1987; Abraham and Hesse, 2003; Scott et al., 2006), which can be used as “fingerprints” to trace organic C sources in consumers and detrital materials (Larsen et al., 2013; Larsen et al., 2015; McMahon et al., 2015). Larsen et al. (2013) analyzed a wide range of field and culture samples and suggested that microalgae, such as chlorophytes and diatoms, shared similar δ13C-EAA patterns and therefore should be categorized into a single group. Based on their work, one would expect similar δ13C-EAA patterns between sea ice and pelagic algae, which are typically dominated by diatoms in summer (Kirst and Wiencke, 1995; Lovejoy et al., 2002; Lizotte, 2003; Hop et al., 2020). Whereas, we proposed that sea ice and pelagic algae may generate distinct δ13C-EAA fingerprints based on the unique adaptations of sea ice algae to their extreme habitats. Our findings in general supported this hypothesis (Figure 2), but the specific mechanisms remain unclear. There are several hypothetical explanations for their unique δ13C-EAA patterns. Sea ice algae are typically selectively developed from algal cells that incorporate into sea ice during ice formation or colonize the sea ice following ice formation (Kirst and Wiencke, 1995; Lizotte, 2003; Mundy and Meiners, 2021). The sea ice assemblages are subject to large gradients of temperature, irradiance, and salinity during their life cycles. Adaptations to these special growing conditions require specific physiological and metabolic properties, e.g., changes in enzyme activities (Kirst and Wiencke, 1995; Lizotte, 2003). First, sea ice algae are adapted to low-light conditions within or beneath sea ice with higher chlorophyll to C ratios and hence require fewer photons to complete their life cycles compared to phytoplankton (Kirst and Wiencke, 1995). Sea ice algae are also found to have optimal photosynthetic rates at lower salinity during ice melting or at higher salinity during colder seasons, depending on specific species (Lizotte, 2003). Studies on sea ice prokaryotic diversity demonstrated a higher number of cultivatable species compared to planktonic communities, indicating that sea ice communities may be better adapted to large substrate gradients (Junge et al., 2002; Lizotte, 2003). In addition, anti-freeze proteins have been reported to be produced by some polar sea ice assemblages, which are characterized by their ability to influence ice formation and protect sea ice diatoms from freezing (Ewart et al., 1999; Janech et al., 2006; Bayer-Giraldi et al., 2011). Amino acid composition analysis showed a high abundance in Ala, Gly and Thr in anti-freeze proteins (Bayer-Giraldi et al., 2011), while our study found significant differences in δ13C values of Gly and Thr between sea ice and pelagic algae for both sizes (Figure 2). AA mol% of sea ice and pelagic algae were well-balanced and consistent with previously reported values in marine phytoplankton (Cowie and Hedges, 1992), but significantly increased abundance of Thr was not observed in both fast-ice and brash-ice algal groups (Figure S1). To our knowledge, it is not yet known whether expression and biosynthesis of anti-freeze proteins are associated to the C fractionation of those abundant or δ13C-enriched amino acids in sea ice algae. Nevertheless, the generation of unique δ13C signatures in other source-specific molecules are produced by Arctic sea ice diatoms (Belt et al., 2008). Belt et al. reported that Arctic sea ice diatoms can produce a sea-ice-specific isoprenoid biomarker with distinctive δ13C signatures from that originated from planktonic or terrigenous organic matter (2008). As amino acids are the building blocks of life and contribute to the majority of organic C in plankton and sinking particulate organic matter (Hedges et al., 2001), their δ13C signatures controlled by biosynthetic and metabolic pathways are likely to be impacted and modified by specific adaptations to extreme living conditions in sea ice organisms. Future investigation is necessary for enhanced understanding of specific processes that control stable isotope fractionation of individual amino acids in sea ice algae.
N sources, trophic level, and microbial reworking
Amino acid δ15N analysis is a powerful tool to trace N cycling, reconstruct trophic relationships in marine food webs and estimate the degree of microbial resynthesis in marine organic matter (Ohkouchi et al., 2017; Close, 2019). In this study, both sea ice and pelagic algae shared similar δ15N values of SrcAAs (Phe: 5.3 ± 1.3‰; Lys: 5.5 ± 1.4‰), consistent with the near-surface δ15N values of nitrate (δ15N-NO3) in the study region (5-6‰; Sherwood et al., 2021). This similarity with near-surface δ15N-NO3 has two implications. First, from a nutrient uptake perspective, the δ15N-SrcAAs in pelagic and sea ice algae could be interpreted to represent the accumulated product in Rayleigh isotope fractionation dynamics during algal growth on nitrate (e.g., Waser et al., 2000). Water column nutrient concentrations were not measured alongside the algae collection in 2019 and 2021, but euphotic zone nitrate (and ammonium) along the western Labrador and Baffin margins is generally exhausted to < 1 μM by July each year (Harrison et al., 2013). In this regard, the algal δ15N-SrcAA values appear to converge on that of δ15N-NO3 under conditions of complete nutrient utilization. Second, from a trophic processing perspective, the δ15N-SrcAA values in sea ice and pelagic algae were the same, despite the indication of higher trophic position and microbial resynthesis in the pelagic algae (Figure 6). This adds to the growing body of evidence that δ15N-SrcAA signatures are minimally altered during trophic processing of both living and detrital biomass (e.g., Chikaraishi et al., 2009; Shen et al., 2021). Together, these interpretations lend support to the use of δ15N-SrcAA values recorded in benthic organisms and sediments for tracking changes in baseline δ15N variability spatially and temporally (Sherwood et al., 2014; Vokhshoori and McCarthy, 2014).
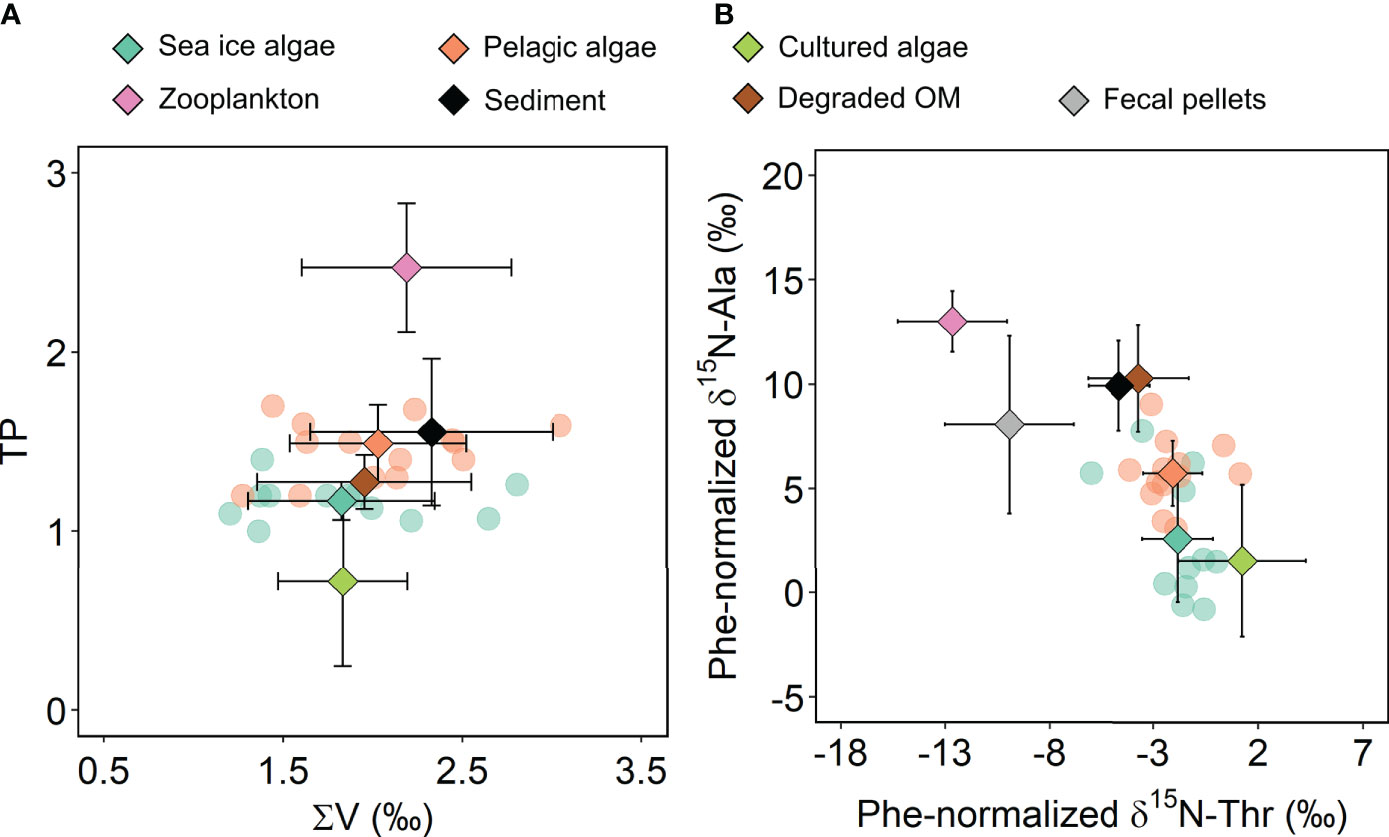
Figure 6 Estimation of trophic transfers and microbial reworking from δ15N-AA. (A) End-member trophic position (TP) and the ∑V parameter of sea ice (brash-ice) and pelagic algae were calculated based on calibrated δ15N-AA values (semi-transparent circles) with end-member means and ±1 standard deviations (diamonds with error bars). (B) End-member data based on Phe-normalized δ15N of Ala and Thr (semi-transparent circles) are shown with end-member means and ±1 standard deviations (diamonds with error bars). Other end-member means and standard deviations are shown in diamonds with error bars from previously published studies: cultured algae, McCarthy et al., 2013; sediment, Sauthoff, 2016; degraded OM, Yamaguchi and McCarthy, 2018; fecal pellet and zooplankton, Doherty et al., 2021). OM, organic matter.
The higher TP in pelagic versus sea ice algae may be attributed to the different degrees of heterotrophic processing in these field samples (Figure 6). The βGlx/Phe (2.9‰) used in the TP calculation was derived mostly from cultured marine phytoplankton (Nielsen et al., 2015). Compared to cultured samples, field-collected algae samples include varying amounts of heterotrophic bacteria, protozoa and microzooplankton. The influence of heterotrophic biomass is evident from the higher calculated βGlx/Phe values for sea ice and pelagic algae (Table 1). Hence, application of a smaller βGlx/Phe value from cultured samples led to slightly higher TP values in both the pelagic and sea ice algae samples as compared to cultured algae (Table 1; Figure 6A). Recent studies revealed that βGlx/Phe values are more variable and more influential on TP estimation than typically considered while βGlx/Lys showed less variation across primary producer taxonomic groups (Ramirez et al., 2021). The smaller variability in βGlx/Lys was also reflected by the lack of significant differences between different size and algal groups in our samples (Table 1). To account for variability in β values and to obtain realistic TP estimation, future research should sample in-situ primary producers concurrent to sampling of consumers, establish/apply β values from in-situ primary producers, and when feasible, include estimation based on δ15N-Lys for cross validation.
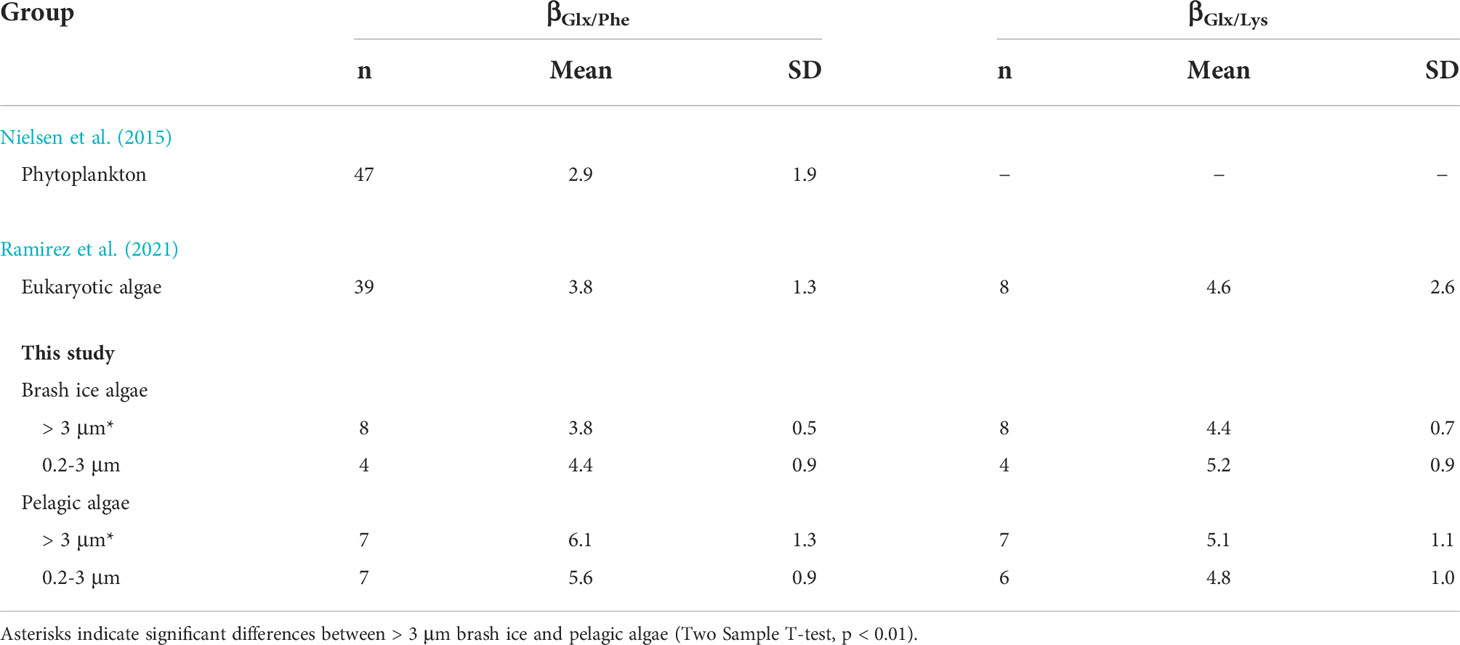
Table 1 Calculated βGlx/Phe and βGlx/Lys values (sample size, mean, and standard deviation) of different algal groups from published literature and this study.
Although Glx is often used to compute TP for its chemical stability, high abundance, and the pronounced trophic enrichment of δ15N (Chikaraishi et al., 2009), questions have been raised on whether Glx reflects reliable trophic enrichment in plankton food webs (Gutiérrez-Rodríguez et al., 2014; Décima et al., 2017). Through a series of chemostat experiments, Décima et al. suggested that under-estimation of Glx-based TP for protistan consumers can be outstanding, and Ala instead may provide a more robust trophic signal for protistan and metazoan consumers (2017). Our results showed that Ala and Thr provide an improved separation between the primary end-members (algae, fecal pellet, zooplankton, degraded OM and sediment) from the microbial and plankton food webs compared to the TP-∑V model (Figure 6). The resemblance of sea ice algae with cultured algae and the clustering of pelagic algae towards degraded OM and sediment demonstrated again the slightly higher contribution of heterotrophic reworking in pelagic algae. Previous studies have revealed that Ala has a higher trophic sensitivity to consumers involved in microbial food webs than Glx, while Thr can distinguish animal metabolism (zooplankton and fecal pellet) from microbial metabolism (microalgae and sediment; Gutiérrez-Rodríguez et al., 2014; Décima et al., 2017; Doherty et al., 2021). Combined, Phe-normalized δ15N values of Ala and Thr indicated slightly higher microbial metabolism in pelagic algae and minimal impacts of animal metabolism on both sea ice and pelagic algae. Our observations provide support to the use of δ15N-Ala-Thr models for improved characterization of the end-member distribution and contribution in microbial food webs.
Uncertainties in the CSIA-AA proxies
Our results showed clear separation of pelagic and sea ice algae based on δ13C-EAA patterns. However, it should be emphasized that the measured δ13C-EAA patterns represent the integrated isotopic effects of a natural community. Previous studies characterized δ13C-EAA values mostly at a family/species level and explored their unique patterns for each phylogenic group (Larsen et al., 2009; Larsen et al., 2013). Even though Canadian Arctic sea ice and pelagic assemblages are known to be often dominated by centric and pennate diatom species, among which Atteya spp., Fragilariopsis cylindrus, and Nitzschia frigida are the most frequently reported (Poulin et al., 2011; Szymanski and Gradinger, 2016; Hop et al., 2020; Pogorzelec et al., 2022 in review), our samples may be influenced by other C imprints including other eukaryotic and prokaryotic algae and bacteria. Contribution from heterotrophic bacteria can be estimated from TP-∑V and δ15N-Ala-Thr models (Figure 6). Our results suggest the modification by heterotrophic biomass was in general insignificant.
As stated above, we hypothesized that the distinct δ13C-EAA pattern in sea ice algae from pelagic algae is governed by their unique physiological adaptations to extreme conditions. Nevertheless, the distinctions in δ13C-EAA patterns between sea ice and pelagic algae could be impacted by the differences in algal community composition. To assess the role community composition played in separating the algal groups, we measured different size classes of sea ice and pelagic algae. Size classes are an important functional trait for marine microalgae, and it has been previously reported that picoplankton has distinct taxonomic composition from micro- and nanophytoplankton (Lizotte, 2003; Finkel et al., 2010; Balzano et al., 2012). Hence, differences in the δ13C-EAA patterns between size classes can serve as a rough proxy for δ13C-EAA variations due to community composition. In our study, the differences between sizes were less pronounced compared to the differences between sea ice and pelagic origins (Figures 2, 4), indicating community composition played a minor role in separating the algae groups. It is yet difficult to draw a conclusion based on the moderate sample size of our algae samples, especially for sea ice algae which were collected opportunistically. Hence, extensive sampling of sea ice and pelagic algae of different sizes across a wide range of geographical locations in different seasons is fundamental to test the consistency in δ13C-EAA patterns of sea ice and pelagic algae across size, space, and time (Close, 2019; Whiteman et al., 2019).
It is extremely hard to build an end-member library for each phylogeny due to the difficulties in isolating substantial biomass for different species from field samples. Lab cultures require specific facilities to maintain suitable growing conditions which could be expensive and time consuming, and therefore constrain the number of species that can be grown at a time, especially for sea ice algae. To our knowledge, few facilities can simulate sea ice growth and mimic the natural sea ice environment for growing sea ice algae (Geilfus et al., 2016). Moreover, not all the species are cultivatable. Although easier to cultivate, planktonic communities are known to have a lower number of cultivatable species compared to sea-ice communities, which may result in biases when characterizing species-specific end-members (Junge et al., 2002; Lizotte, 2003). On the other hand, field assemblages are easier to be processed and less time-consuming with less or no taxonomic identification and cultivation effort. Characterization of their δ13C-EAA patterns from different types of habitats helps us obtain a general idea of contributions from different C sources to marine organic matter.
In our study, the consistency in δ13C-EAA patterns and the degree of heterotrophic processing in sea ice and pelagic algae were validated by application of different multivariate analyses, linear models and comparison with published data. A tremendous advantage of using CSIA-AA proxies is the ability of amino acid δ13C and δ15N to provide independent evidence and information about the source contributions and heterotrophic processing in marine organic matter. However, the underlying biochemical or metabolic mechanisms remained largely unclear. For example, the ∑V parameter was defined as the average deviation of trophic AAs that reflects the degree of microbial resynthesis (McCarthy et al., 2007). This application has been broadly reported and yielded consistent observations across different types of samples (McCarthy et al., 2013; Batista et al., 2014; Yamaguchi and McCarthy, 2018). Yet the fundamental relationships between microbial resynthesis and the deviation of δ15N values of each trophic AA are uncertain. Similar constraints can be found in the distinct δ13C-EAA patterns between certain phylogenic classifications and the use of Ala and Thr to trace heterotrophic processing in microbial food webs (Larsen et al., 2013; Décima et al., 2017; Doherty et al., 2021). A thorough understanding of the amino acid δ13C and δ15N dynamics at molecular, cellular, and physiological levels is crucial for accurate data interpretation of CSIA-AA data in marine biogeochemistry and ecology (Whiteman et al., 2019). Lastly, amino acid δ13C and δ15N data have been rapidly and widely generated in the last decade. However, inter-laboratory variations across different amino acids are variable and yet, inter-laboratory comparisons of CSIA-AA data are scarce, especially for δ15N-AA (Yarnes and Herszage, 2017). Future work should also consider the effects of ultrasonication and removal of supernatant on selective loss of AAs (see Sect. 2.2). Without accounting for such variation in CSIA-AA data due to inconsistent derivatization and calibration techniques, data generated from different laboratories may not be directly comparable. Hence, sample preparation protocols and quality assurance procedures need to be standardized across laboratories.
Conclusion
Taken together, our study presented for the first time, distinct δ13C-EAA patterns between sea ice and pelagic algae and explored the N sources, trophic transfers, and microbial resynthesis from the δ15N-AA data of these samples in remote polar settings. Our observations support the hypothesis that the δ13C-AA and δ15N-AA patterns of sea ice algae can be distinguished from those of pelagic algae. Multivariate analyses further demonstrated the diagnostic potential of δ13C-EAA to differentiate eukaryotic microalgae from sea ice and pelagic origins. These findings may enhance our understanding of C sources and transfers in ecologically important areas that are subject to sea-ice dynamics in the changing Arctic Ocean. Our study also examined the degree of trophic transfers and microbial resynthesis in the field-collected algae samples from δ15N-AA. The use of Ala and Thr illustrated better relationships and separations between sea ice/pelagic algae and other end-member groups, reflecting a slightly higher degree of heterotrophic reworking in pelagic algae. These δ15N-AA based proxies can provide valuable information about the general composition and purity of field samples. With the on-going sea ice decline in the coming century, it is key to understand sea ice algae production to predict future productivity and plankton community responses in the changing Arctic. Our dataset provides new insights into the differentiation in δ13C-AA and δ15N-AA between sea ice and pelagic algae and highlights the potential to address crucial knowledge gaps in sea ice algae dynamics using CSIA-AA.
Despite the powerful potential in CSIA-AA, limitations and challenges remain to be addressed in future research. Establishment of a larger repository of end-member data from laboratory cultures under various growing conditions and extensive sampling of marine primary producer end-members across size, space, and time are fundamental to assess the consistency in δ13C-EAA patterns of different functional groups and the robustness in δ15N-AA proxies to reflect N cycling processes. To improve data interpretation of the multi-dimensional CSIA-AA proxies, specific processes that control stable isotope fractionation of individual amino acids are worth investigating. Standardization of sample processing and data calibration techniques is essential to ensure direct comparisons of cross-study datasets.
Data availability statement
The original contributions presented in the study are included in the Supplementary Material, further inquiries can be directed to the corresponding author.
Author contributions
S-MC and OAS contributed to conception and design of the study. S-MC contributed to sampling. S-MC and OAS contributed to sample processing, measurements and data analysis. PM provided up-to-date references and taxonomic data from sea ice and phytoplankton studies in Frobisher Bay for comparison with our data. S-MC wrote the manuscript with input from all the co-authors. All authors contributed to the article and approved the submitted version
Funding
This research was funded by NSERC Discovery Grant (RGPIN-2018-05590) and NSERC Ship Time Grant (RGPST-544990-2020) to OAS.
Acknowledgments
We would like to express our gratitude for all the officers and crew members of the Canadian Coast Guard Ship Amundsen for their professional support with sea ice and seawater sampling. We are grateful to C. J. Mundy from University of Manitoba for providing fast-ice algae samples and valuable insights on sea ice algae and statistics. We thank Chelsea Fougère for assistance with CSIA-AA measurements and data analysis. We thank Evan Edinger, David Cote, Blake Tibert, Nina Golombek, Amy McAllister, and Simone Booker for help at sea or in the laboratory. We thank John Gosse, Markus Kienast, Zoe Finkel, Thomas Larsen, Matthew McCarthy, and Kelton McMahon for valuable discussions about the analyses and data.
Conflict of interest
The authors declare that the research was conducted in the absence of any commercial or financial relationships that could be construed as a potential conflict of interest.
Publisher’s note
All claims expressed in this article are solely those of the authors and do not necessarily represent those of their affiliated organizations, or those of the publisher, the editors and the reviewers. Any product that may be evaluated in this article, or claim that may be made by its manufacturer, is not guaranteed or endorsed by the publisher.
Supplementary material
The Supplementary Material for this article can be found online at: https://www.frontiersin.org/articles/10.3389/fmars.2022.976908/full#supplementary-material
References
Abraham W. R., Hesse C. (2003). Isotope fractionations in the biosynthesis of cell components by different fungi: A basis for environmental carbon flux studies. FEMS Microbiol. Ecol. 46 (1), 121–128. doi: 10.1016/S0168-6496(03)00203-4
Ardyna M., Mundy C. J., Mills M. M., Oziel L., Grondin P. L., Lacour L., et al. (2020). Environmental drivers of under-ice phytoplankton bloom dynamics in the Arctic ocean. Elementa: Sci. Anthropocene 8, 30. doi: 10.1525/elementa.430
Arrigo K. R. (2014). Sea Ice ecosystems. Annu. Rev. Mar. Sci. 6, 439–467. doi: 10.1146/annurev-marine-010213-135103
Arrigo K. R., Perovich D. K., Pickart R. S., Brown Z. W., Van Dijken G. L., Lowry K. E., et al. (2012). Massive phytoplankton blooms under Arctic sea ice. Science 336 (6087), 1408–1408. doi: 10.1126/science.1215065
Arrigo K. R., van Dijken G. L. (2015). Continued increases in Arctic ocean primary production. Prog. Oceanogr. 136, 60–70. doi: 10.1016/j.pocean.2015.05.002
Balzano S., Marie D., Gourvil P., Vaulot D. (2012). Composition of the summer photosynthetic pico and nanoplankton communities in the Beaufort Sea assessed by T-RFLP and sequences of the 18S rRNA gene from flow cytometry sorted samples. ISME J. 6 (8), 1480–1498. doi: 10.1038/ismej.2011.213
Batista F. C., Ravelo A. C., Crusius J., Casso M. A., McCarthy M. D. (2014). Compound specific amino acid δ15N in marine sediments: A new approach for studies of the marine nitrogen cycle. Geochimica Cosmochimica Acta 142, 553–569. doi: 10.1016/j.gca.2014.08.002
Bayer-Giraldi M., Weikusat I., Besir H., Dieckmann G. (2011). Characterization of an antifreeze protein from the polar diatom fragilariopsis cylindrus and its relevance in sea ice. Cryobiology 63 (3), 210–219. doi: 10.1016/j.cryobiol.2011.08.006
Belt S. T., Massé G., Rowland S. J., Poulin M., Michel C., LeBlanc B. (2007). A novel chemical fossil of palaeo sea ice: IP25. Organic Geochem. 38 (1), 16–27. doi: 10.1016/j.orggeochem.2006.09.013
Belt S. T., Massé G., Vare L. L., Rowland S. J., Poulin M., Sicre M. A., et al. (2008). Distinctive 13C isotopic signature distinguishes a novel sea ice biomarker in Arctic sediments and sediment traps. Mar. Chem. 112 (3-4), 158–167. doi: 10.1016/j.marchem.2008.09.002
Belt S. T., Müller J. (2013). The Arctic sea ice biomarker IP25: A review of current understanding, recommendations for future research and applications in palaeo sea ice reconstructions. Quaternary Sci. Rev. 79, 9–25. doi: 10.1016/j.quascirev.2012.12.001
Boecklen W. J., Yarnes C. T., Cook B. A., James A. C. (2011). On the use of stable isotopes in trophic ecology. Annu. Rev. Ecol. Evol. Systematics 42, 411–440. doi: 10.1146/annurev-ecolsys-102209-144726
Broughton R. C. I., Newsham K. K., Hill P. W., Stott A., Jones D. L. (2015). Differential acquisition of amino acid and peptide enantiomers within the soil microbial community and its implications for carbon and nitrogen cycling in soil. Soil Biol. Biochem. 88, 83–89. doi: 10.1016/j.soilbio.2015.05.003
Brown T. A., Belt S. T., Tatarek A., Mundy C. J. (2014). Source identification of the Arctic sea ice proxy IP25. Nat. Commun. 5 (1), 1–7. doi: 10.1038/ncomms5197
Budge S. M., Wooller M. J., Springer A. M., Iverson S. J., McRoy C. P., Divoky G. J. (2008). Tracing carbon flow in an arctic marine food web using fatty acid-stable isotope analysis. Oecologia 157 (1), 117–129. doi: 10.1007/s00442-008-1053-7
Carstens D., Lehmann M. F., Hofstetter T. B., Schubert C. J. (2013). Amino acid nitrogen isotopic composition patterns in lacustrine sedimenting matter. Geochimica Cosmochimica Acta 121, 328–338. doi: 10.1016/j.gca.2013.07.020
Chikaraishi Y., Ogawa N. O., Kashiyama Y., Takano Y., Suga H., Tomitani A., et al. (2009). Determination of aquatic food-web structure based on compound-specific nitrogen isotopic composition of amino acids. Limnol. Oceanogr.: Methods 7 (11), 740–750. doi: 10.4319/lom.2009.7.740
Close H. G. (2019). Compound-specific isotope geochemistry in the ocean. Annu. Rev. Mar. Sci. 11, 27–56. doi: 10.1146/annurev-marine-121916-063634
Cowie G. L., Hedges J. I. (1992). Sources and reactivities of amino acids in a coastal marine environment. Limnol. Oceanogr. 37 (4), 703–724. doi: 10.4319/lo.1992.37.4.0703
Décima M., Landry M. R., Bradley C. J., Fogel M. L. (2017). Alanine δ15N trophic fractionation in heterotrophic protists. Limnol. Oceanogr. 62 (5), 2308–2322. doi: 10.1002/lno.10567
De La Vega C., Jeffreys R. M., Tuerena R., Ganeshram R., Mahaffey C. (2019). Temporal and spatial trends in marine carbon isotopes in the Arctic ocean and implications for food web studies. Global Change Biol. 25 (12), 4116–4130. doi: 10.1111/gcb.14832
De Troch M., Boeckx P., Cnudde C., Van Gansbeke D., Vanreusel A., Vincx M., et al. (2012). Bioconversion of fatty acids at the basis of marine food webs: insights from a compound-specific stable isotope analysis. Mar. Ecol. Prog. Ser. 465, 53–67. doi: 10.3354/meps09920
Dhifallah F., Schiffrine N., Rochon A., Gosselin M. (2022) 12th International Conference on Modern and Fossil Dinoflagellates (DINO12), Las Palmas de, Grand Canarias, Spain, July 2-8, 2022 (Gran Canaria, Spain: DINO12 Organizing Committee). Available at: https://dino12conference.com/, Temporal changes of dinoflagellate communities in inner Frobisher Bay, Nunavut, CanadaExtended Abstract 5.04.
Doherty S. C., Maas A. E., Steinberg D. K., Popp B. N., Close H. G. (2021). Distinguishing zooplankton fecal pellets as a component of the biological pump using compound‐specific isotope analysis of amino acids. Limnology and oceanography 66 (7), 2827–41. doi: 10.1002/lno.11793
Elliott Smith E. A., Fox M. D., Fogel M. L., Newsome ,. S. D. (2022). Amino acid δ13C fingerprints of nearshore marine autotrophs are consistent across broad spatiotemporal scales: An intercontinental isotopic dataset and likely biochemical drivers. Funct. Ecol. 36 (5), 1191–1203. doi: 10.1111/1365-2435.14017
Ewart K. V., Lin Q., Hew C. L. (1999). Structure, function and evolution of antifreeze proteins. Cell. Mol. Life Sci. CMLS 55 (2), 271–283. doi: 10.1007/s000180050289
Fábián V., Morvai M., Pintér-Szakács M., Molnár-Perl I. (1991). Standardization of cation-exchange clean-up prior to gas chromatography of amino acids. J. 553, 87–92. doi: 10.1016/S0021-9673(01)88476-4
Finkel Z. V., Beardall J., Flynn K. J., Quigg A., Rees T. A. V., Raven J. A. (2010). Phytoplankton in a changing world: Cell size and elemental stoichiometry. J. Plankton Res. 32 (1), 119–137. doi: 10.1093/plankt/fbp098
Fry B. (1988). Food web structure on georges bank from stable c, n, and s isotopic compositions. Limnol. Oceanogr. 33 (5), 1182–1190. doi: 10.4319/lo.1988.33.5.1182
Geilfus N. X., Galley R. J., Else B. G., Campbell K., Papakyriakou T., Crabeck O., et al. (2016). Estimates of ikaite export from sea ice to the underlying seawater in a sea ice–seawater mesocosm. Cryosphere 10 (5), 2173–2189. doi: 10.5194/tc-10-2173-2016
Gérikas Ribeiro C., dos Santos A. L., Gourvil P., Le Gall F., Marie D., Tragin M., et al. (2020). Culturable diversity of Arctic phytoplankton during pack ice melting. Elementa: Sci. Anthropocene 8, 6. doi: 10.1525/elementa.401
Gosselin M., Levasseur M., Wheeler P. A., Horner R. A., Booth B. C. (1997). New measurements of phytoplankton and ice algal production in the Arctic ocean. Deep Sea Res. Part II: Topical Stud. Oceanogr. 44 (8), 1623–1644. doi: 10.1016/S0967-0645(97)00054-4
Gutiérrez-Rodríguez A., Décima M., Popp B. N., Landry M. R. (2014). Isotopic invisibility of protozoan trophic steps in marine food webs. Limnol. Oceanogr. 59 (5), 1590–1598. doi: 10.4319/lo.2014.59.5.1590
Harrison W. G., Børsheim K. Y., Li W. K., Maillet G. L., Pepin P., Sakshaug E., et al. (2013). Phytoplankton production and growth regulation in the subarctic north Atlantic: A comparative study of the Labrador Sea-Labrador/Newfoundland shelves and Barents/Norwegian/Greenland seas and shelves. Prog. Oceanogr. 114, 26–45. doi: 10.1016/j.pocean.2013.05.003
Hayes J. M. (1993). Factors controlling 13C contents of sedimentary organic compounds: Principles and evidence. Mar. Geol. 113 (1-2), 111–125. doi: 10.1016/0025-3227(93)90153-M
Hedges J. I., Baldock J. A., Gélinas Y., Lee C., Peterson M., Wakeham S. G. (2001). Evidence for non-selective preservation of organic matter in sinking marine particles. Nature 409 (6822), 801–804. doi: 10.1038/35057247
Hop H., Vihtakari M., Bluhm B. A., Assmy P., Poulin M., Gradinger R., et al. (2020). Changes in sea-ice protist diversity with declining sea ice in the Arctic ocean from the 1980s to 2010s. Front. Mar. Sci. 7, 243. doi: 10.3389/fmars.2020.00243
Hsiao S. I. C.. (1979). Phytoplankton and sea ice microalgal data from Frobisher Bay, 1971 to 1978. Fisheries and Marine Service Data Report, Fisheries and Environment Canada 155, 82.
Hsiao S. I., Pinkewycz N.. (1985). Arctic marine phytoplankton contributed to the sediments in Frobisher Bay. Canadian Data Report on Fisheries and Aquatic Sciences 539, 106.
Hsiao S. I.. (1992). Dynamics of ice algae and phytoplankton in Frobisher Bay. Polar Biology 12 (6), 654–51. doi: 10.1007/BF00236987
Janech M. G., Krell A., Mock T., Kang J. S., Raymond J. A. (2006). Ice-binding proteins from sea ice diatoms (bacillariophyceae) 1. J. Phycol. 42 (2), 410–416. doi: 10.1111/j.1529-8817.2006.00208.x
Jónasdóttir S. H. (2019). Fatty acid profiles and production in marine phytoplankton. Mar. Drugs 17 (3), 151. doi: 10.3390/md17030151
Junge K., Imhoff F., Staley T., Deming W. (2002). Phylogenetic diversity of numerically important Arctic sea-ice bacteria cultured at subzero temperature. Microbial. Ecol. 43 (3), 315–328. doi: 10.1007/s00248-001-1026-4
Kaiser K., Benner R. (2005). Hydrolysis-induced racemization of amino acids. Limnol. Oceanogr.: Methods 3 (8), 318–325. doi: 10.4319/lom.2005.3.318
Karasov W. H., del Rio C. M. (2007). Physiological ecology: how animals process energy, nutrients, and toxins (Princeton, New Jersey, US: Princeton University Press).
Kirst G. O., Wiencke C. (1995). Ecophysiology of polar algae. Oceanographic Literature Rev. 12 (42), 1094. doi: 10.1111/j.0022-3646.1995.00181.x
Kohlbach D., Graeve M., A. Lange B., David C., Peeken I., Flores H. (2016). The importance of ice algae-produced carbon in the central Arctic ocean ecosystem: Food web relationships revealed by lipid and stable isotope analyses. Limnol. Oceanogr. 61 (6), 2027–2044. doi: 10.1002/lno.10351
Larsen T., Bach L. T., Salvatteci R., Wang Y. V., Andersen N., Ventura M., et al. (2015). Assessing the potential of amino acid 13 c patterns as a carbon source tracer in marine sediments: effects of algal growth conditions and sedimentary diagenesis. Biogeosciences 12 (16), 4979–4992. doi: 10.5194/bg-12-4979-2015
Larsen T., Taylor D. L., Leigh M. B., O’Brien D. M. (2009). Stable isotope fingerprinting: a novel method for identifying plant, fungal, or bacterial origins of amino acids. Ecology 90 (12), 3526–3535. doi: 10.1890/08-1695.1
Larsen T., Ventura M., Andersen N., O’Brien D. M., Piatkowski U., McCarthy M. D. (2013). Tracing carbon sources through aquatic and terrestrial food webs using amino acid stable isotope fingerprinting. PLoS One 8 (9), e73441. doi: 10.1371/journal.pone.0073441
Legendre L., Ackley S. F., Dieckmann G. S., Gulliksen B., Horner R., Hoshiai T., et al. (1992). Ecology of sea ice biota. Polar Biol. 12 (3), 429–444. doi: 10.1007/BF00243114
Lehman J. (2009). Compound-specific amino acid isotopes as tracers of algal central metabolism: developing new tools for tracing prokaryotic vs. eukaryotic primary production and organic nitrogen in the ocean (Santa Cruz, CA: University of California, Santa Cruz, CA).
Leu E., Mundy C. J., Assmy P., Campbell K., Gabrielsen T. M., Gosselin M., et al. (2015). Arctic Spring awakening–steering principles behind the phenology of vernal ice algal blooms. Prog. Oceanogr. 139, 151–170. doi: 10.1016/j.pocean.2015.07.012
Li W. K., McLaughlin F. A., Lovejoy C., Carmack E. C. (2009). Smallest algae thrive as the Arctic ocean freshens. Science 326 (5952), 539–539. doi: 10.1126/science.1179798
Lizotte M. P. (2003). “The microbiology of sea ice,” in Sea Ice: an introduction to its physics, chemistry, biology and geology (Cornwall, UK: Blackwell Science Ltd), 184–210.
Lovejoy C., Legendre L., Martineau M. J., Bâcle J., Von Quillfeldt C. H. (2002). Distribution of phytoplankton and other protists in the north water. Deep Sea Res. Part II: Topical Stud. Oceanogr. 49 (22-23), 5027–5047. doi: 10.1016/S0967-0645(02)00176-5
Macko S. A., Fogel M. L., Hare P. E., Hoering T. C. (1987). Isotopic fractionation of nitrogen and carbon in the synthesis of amino acids by microorganisms. Chem. Geol 65 (1), 79–92. doi: 10.1016/0168-9622(87)90064-9
McCarthy M. D., Benner R., Lee C., Fogel M. L. (2007). Amino acid nitrogen isotopic fractionation patterns as indicators of heterotrophy in plankton, particulate, and dissolved organic matter. Geochimica Cosmochimica Acta 71 (19), 4727–4744. doi: 10.1016/j.gca.2007.06.061
McCarthy M. D., Lehman J., Kudela R. (2013). Compound-specific amino acid δ15N patterns in marine algae: tracer potential for cyanobacterial vs. eukaryotic organic nitrogen sources in the ocean. Geochimica Cosmochimica Acta 103, 104–120. doi: 10.1016/j.gca.2012.10.037
McClelland J. W., Montoya J. P. (2002). Trophic relationships and the nitrogen isotopic composition of amino acids in plankton. Ecology 83 (8), 2173–2180. doi: 10.1890/0012-9658(2002)083[2173:TRATNI]2.0.CO;2
McMahon K. W., Hamady L. L., Thorrold S. R. (2013). Ocean ecogeochemistry: a review. Oceanogr. Mar. Biol.: Annu. Rev. 51, 327–374. doi: 10.1201/b15406
McMahon K. W., McCarthy M. D. (2016). Embracing variability in amino acid δ15N fractionation: mechanisms, implications, and applications for trophic ecology. Ecosphere 7 (12), e01511. doi: 10.1002/ecs2.1511
McMahon K. W., McCarthy M. D., Sherwood O. A., Larsen T., Guilderson T. P. (2015). Millennial-scale plankton regime shifts in the subtropical north pacific ocean. Science 350 (6267), 1530–1533. doi: 10.1126/science.aaa9942
Meredith M., Sommerkorn M., Cassotta S., Derksen C., Ekaykin A., Hollowed A., et al. (2019). “Polar regions,” in IPCC special report on the ocean and cryosphere in a changing climate. Chapter 3. (Cambridge, UK and New York, NY, USA: Cambridge University Press), 203–320.
Mundy C. J., Gosselin M., Ehn J., Gratton Y., Rossnagel A., Barber D. G., et al. (2009). Contribution of under-ice primary production to an ice-edge upwelling phytoplankton bloom in the Canadian Beaufort Sea. Geophysical Res. Lett. 36 (17), L17601. doi: 10.1029/2009GL038837
Mundy C. J., Meiners K. M. (2021). Ecology of Arctic Sea ice. Arctic Ecol. (West Sussex, UK: John Wiley & Sons Ltd), 261–288. doi: 10.1002/9781118846582.ch10
Nielsen J. M., Popp B. N., Winder M. (2015). Meta-analysis of amino acid stable nitrogen isotope ratios for estimating trophic position in marine organisms. Oecologia 178 (3), 631–642. doi: 10.1007/s00442-015-3305-7
Ohkouchi N., Chikaraishi Y., Close H. G., Fry B., Larsen T., Madigan D. J., et al. (2017). Advances in the application of amino acid nitrogen isotopic analysis in ecological and biogeochemical studies. Organic Geochem. 113, 150–174. doi: 10.1016/j.orggeochem.2017.07.009
Pineault S., Tremblay JÉ., Gosselin M., Thomas H., Shadwick E. (2013). The isotopic signature of particulate organic c and n in bottom ice: Key influencing factors and applications for tracing the fate of ice-algae in the Arctic ocean. J. Geophysical Res.: Oceans 118 (1), 287–300. doi: 10.1029/2012JC008331
Pogorzelec N. M., Gough K. M., Ha S.-Y., Campbell K., Else B., Kim K., et al. (2022). FTIR autecological analysis of bottom-ice diatom taxa across nutrient gradients in a tidal strait, Canadian Arctic. In Rev.
Post E., Bhatt U. S., Bitz C. M., Brodie J. F., Fulton T. L., Hebblewhite M., et al. (2013). Ecological consequences of sea-ice decline. Science 341 (6145), 519–524. doi: 10.1126/science.1235225
Poulin M., Daugbjerg N., Gradinger R., Ilyash L., Ratkova T., von Quillfeldt C. (2011). The pan-Arctic biodiversity of marine pelagic and sea-ice unicellular eukaryotes: a first-attempt assessment. Mar. Biodiversity 41 (1), 13–28. doi: 10.1007/s12526-010-0058-8
Rahman M. M., Lamsal B. P. (2021). Ultrasound-assisted extraction and modification of plant-based proteins: Impact on physicochemical, functional, and nutritional properties. Compr. Rev. Food Sci. Food Saf. 20 (2), 1457–1480. doi: 10.1111/1541-4337.12709
Ramirez M. D., Besser A. C., Newsome S. D., McMahon K. W. (2021). Meta-analysis of primary producer amino acid δ15N values and their influence on trophic position estimation. Methods Ecol. Evol. 12 (10), 1750–1767. doi: 10.1111/2041-210X.13678
Søreide J. E., Carroll M. L., Hop H., Ambrose W. G. Jr., Hegseth E. N., Falk-Petersen S. (2013). Sympagic-pelagic-benthic coupling in Arctic and Atlantic waters around Svalbard revealed by stable isotopic and fatty acid tracers. Mar. Biol. Res. 9 (9), 831–850. doi: 10.1080/17451000.2013.775457
Sauthoff W. (2016). Nitrogen isotopes of amino acids in marine sediment: a burgeoning tool to assess organic matter quality and changes in supplied nitrate δ 15 n (Santa Cruz: University of California).
Schiff J. T., Batista F. C., Sherwood O. A., Guilderson T. P., Hill T. M., Ravelo A. C., et al. (2014). Compound specific amino acid δ13C patterns in a deep-sea proteinaceous coral: Implications for reconstructing detailed δ13C records of exported primary production. Mar. Chem. 166, 82–91. doi: 10.1016/j.marchem.2014.09.008
Scott J. H., O’Brien D. M., Emerson D., Sun H., McDonald G. D., Salgado A., et al. (2006). An examination of the carbon isotope effects associated with amino acid biosynthesis. Astrobiology 6 (6), 867–880. doi: 10.1089/ast.2006.6.867
Shen Y., Guilderson T. P., Sherwood O. A., Castro C. G., Chavez F. P., McCarthy M. D. (2021). Amino acid δ13C and δ15N patterns from sediment trap time series and deep-sea corals: Implications for biogeochemical and ecological reconstructions in paleoarchives. Geochimica Cosmochimica Acta 297, 288–307. doi: 10.1016/j.gca.2020.12.012
Sherwood O. A., Davin S. H., Lehmann N., Buchwald C., Edinger E. N., Lehmann M. F., et al. (2021). Stable isotope ratios in seawater nitrate reflect the influence of pacific water along the Northwest Atlantic margin. Biogeosci. 18 (5), 4491–510. doi: 10.5194/bg-18-4491-2021
Sherwood O. A., Guilderson T. P., Batista F. C., Schiff J. T., McCarthy M. D. (2014). Increasing subtropical north pacific ocean nitrogen fixation since the little ice age. Nature 505 (7481), 78–81.
Silfer J. A., Engel M. H., Macko S. A., Jumeau E. J. (1991). Stable carbon isotope analysis of amino acid enantiomers by conventional isotope ratio mass spectrometry and combined gas chromatography/isotope ratio mass spectrometry. Analytical Chem. 63 (4), 370–374. doi: 10.1021/ac00004a014
Stahl A. (2021). Identifying novel isotopic tracers of marine primary producers to study food web carbon cycles (Rhode Island, US: University of Rhode Island). Doctoral dissertation.
Szymanski A., Gradinger R. (2016). The diversity, abundance and fate of ice algae and phytoplankton in the Bering Sea. Polar Biol. 39 (2), 309–325. doi: 10.1007/s00300-015-1783-z
Takano Y., Kashiyama Y., Ogawa N. O., Chikaraishi Y., Ohkouchi N. (2010). Isolation and desalting with cation-exchange chromatography for compound-specific nitrogen isotope analysis of amino acids: Application to biogeochemical samples. Rapid Commun. Mass Spectrometry 24 (16), 2317–2323. doi: 10.1002/rcm.4651
Ueda K., Morgan S. L., Fox A., Gilbart J., Sonesson A., Larsson L., et al. (1989). D-alanine as a chemical marker for the determination of streptococcal cell wall levels in mammalian tissues by gas chromatography/negative ion chemical ionization mass spectrometry. Analytical Chem. 61 (3), 265–270. doi: 10.1021/ac00178a015
Vokhshoori N. L., Larsen T., McCarthy M. D. (2014). Reconstructing δ13C isoscapes of phytoplankton production in a coastal upwelling system with amino acid isotope values of littoral mussels. Mar. Ecol. Prog. Ser. 504, 59–72. doi: 10.3354/meps10746
Vokhshoori N. L., McCarthy M. D. (2014). Compound-specific δ15N amino acid measurements in littoral mussels in the California upwelling ecosystem: A new approach to generating baseline δ15N isoscapes for coastal ecosystems. PLoS One 9 (6), e98087. doi: 10.1371/journal.pone.0098087
Waser N. A., Harrison W. G., Head E. J., Nielsen B., Lutz V. A., Calvert S. E. (2000). Geographic variations in the nitrogen isotope composition of surface particulate nitrogen and new production across the north Atlantic ocean. Deep Sea Res. Part I: Oceanographic Res. Papers 47 (7), 1207–1226. doi: 10.1016/S0967-0637(99)00102-8
Whiteman J. P., Elliott Smith E. A., Besser A. C., Newsome S. D. (2019). A guide to using compound-specific stable isotope analysis to study the fates of molecules in organisms and ecosystems. Diversity 11 (1), 8. doi: 10.3390/d11010008
Yarnes C. T., Herszage J. (2017). The relative influence of derivatization and normalization procedures on the compound-specific stable isotope analysis of nitrogen in amino acids. Rapid Commun. Mass Spectrometry 31 (8), 693–704. doi: 10.1002/rcm.7832
Yashayaev I., Peterson I., Wang Z. (2021). Meteorological, Sea ice and physical oceanographic conditions in the Labrador Sea during 2018 (Dartmouth, Nova Scotia, Canada: Canadian Science Advisory Secretariat= Secrétariat canadien de consultation scientifique).
Keywords: isotope ecology, compound specific, stable isotopes, amino acid, phytoplankton, biomarker, sea ice algae, Canadian Arctic
Citation: Chen S-M, Mudie P and Sherwood OA (2022) Amino acid δ13C and δ15N fingerprinting of sea ice and pelagic algae in Canadian Arctic and Subarctic Seas. Front. Mar. Sci. 9:976908. doi: 10.3389/fmars.2022.976908
Received: 23 June 2022; Accepted: 05 September 2022;
Published: 04 October 2022.
Edited by:
Marius Nils Müller, Federal University of Pernambuco, BrazilReviewed by:
Philip Riekenberg, Royal Netherlands Institute for Sea Research (NIOZ), NetherlandsAndrew Martin, Victoria University of Wellington, New Zealand
Copyright © 2022 Chen, Mudie and Sherwood. This is an open-access article distributed under the terms of the Creative Commons Attribution License (CC BY). The use, distribution or reproduction in other forums is permitted, provided the original author(s) and the copyright owner(s) are credited and that the original publication in this journal is cited, in accordance with accepted academic practice. No use, distribution or reproduction is permitted which does not comply with these terms.
*Correspondence: Shao-Min Chen, c2hhb21pbi5jaGVuQGRhbC5jYQ==