 Hongfei Li1
 Shuangrui Lin1
 Pengzhi Qi1
 Jingtian Wang2
 Meihua Fan1
 Hongwei Huang1
 Zhenyu Dong1Kaida Xu3
 Baoying Guo1*
- 1National Engineering Research Center for Marine Aquaculture, Zhejiang Ocean University, Zhoushan, China
- 2State Key Laboratory of Marine Environmental Science, Xiamen University, Xiamen, China
- 3Key Laboratory of Sustainable Utilization of Technology Research for Fisheries Resources of Zhejiang Province, Scientific Observing and Experimental Station of Fishery Resources for Key Fishing Grounds, Ministry of Agriculture, Marine Fishery Research Institute of Zhejiang Province, Zhoushan, China
To better understand the physiological events involving death after spawning in S. japonica (Japanese spineless cuttlefish), we have presently generated a proteomic data set to properly examine this phenomenon. As such, a proteomic-based approach was employed to identify differentially expressed proteins (DEPs) in the optic glands of S. japonica, at three distinct growth stages: pre-spawning after sexual maturity (group A); spawning (group B) and postspawning before death (group C). About 955, 1000, and 1024 DEPs were identified for each comparative group analysis (i.e., group B vs A, group B vs C, and group C vs A). We further discovered that the function of these newly identified DEPs was mostly related to molecular events such as gene translation and signal transduction. According to the enriched GO terms obtained by Gene Ontology analysis, the function of most DEPs was correlated with structural molecule activity, ribosome function and gene expression. The majority of DEPs were known to be involved in signal transduction and energy metabolism, interestingly, some aging-related DEPs were also identified. Putting together, our study provides new insights, at the protein level, in the phenomenon of death after spawning in S. japonica, by referring to anti-aging effects conserved in other cephalopoda species.
1 Introduction
Sepiella japonica (Mollusca, Cephalopoda, Decapoda, Sepiidae, Sepiella) is a common species of cuttlefish, largely distributed across the coastal waters of China, Japan and Indonesia as well as in many parts of the Pacific Ocean and the East China Sea (Liu et al., 2019). S. japonica is abundantly present in China, where it is considered a distinctive fishery resource and one of the four most famous sea products. This categorization is mainly due to the high economic, edible and medicinal value of S. japonica (Shen et al., 2007). As a result, the wild population has continuously dropped since the 1980s, and it has become nearly extinct mainly due to overfishing (Wu et al., 2010). Therefore, artificial breeding of S. japonica has been widely carried out. However, the amount of brooding is about 1500~3000, and only about 40% of the eggs could be produced, after spawning, the cuttlefish stops eating, stays underwater quietly but surfaces occasionally, and then dies after a short period time (Catalano et al., 2013). This phenomenon illustrates an immense loss of reproductive resources. Actually, most the other living cephalopods are generally short lived (usually ~1 year) (Boal et al., 2010). In cephalopods, there is an organ called the optic gland which is inextricably linked to reproductive regulation (Wells and Wells, 1959). Earlier studies have shown that a modest concentration of octopus secretion can accelerate its death process, but its life span can eventually be extended after the removal of the optic gland (Wodinsky, 1977). Nevertheless, the precise reason for this phenomenon to occur remains unknown, and the mechanism for the death of S. japonica after spawning has yet to be discussed. Indeed, limited information has been disclosed about the pathways and mechanisms involved in accelerated death after spawning.
Aging is a complex process whose mechanisms are under continuous exploration (Berdasco and Esteller, 2012). Based on the establishment of the concept of signalling pathways, researchers have evaluated a series of molecular routes and identified classical aging-related signalling cascades, such as Wnt, Insulin/IGF-1 and Notch (Brack et al., 2007; Salminen and Kaarniranta, 2010; Zhang et al., 2013; Balistreri et al., 2016). However, the correlation between these pathways and mechanisms involving death after spawning in S. japonica is poorly understood. Indeed, it is not well clear whether these signalling pathways play any pivotal roles in S. japonica. Therefore, the application of label-free proteomic analysis of S. japonica would certainly add more insights into the understanding of its physiological processes, including death after spawning (Scaros et al., 2020).
In this study, we have generated and further analyzed proteomic-based data from S. japonica at three different growth stages - pre-spawning after sexual maturity, spawning and post-spawning before death - to find out differential proteins and related pathways and, consequently, to predict the role and impact of these molecules into death after spawning in S. japonica. Hence, here we provide novel insights into the understanding of this phenomenon and then look for potential solutions to control this physiological process.
2 Materials and methods
2.1 Ethics statement
All animals and experiments are put into practice by the guidelines for the usage and care of animals according to set out in the “Management of Laboratory Animals in Zhejiang Province” by the Department of Science and Technology of Zhejiang Province. Every effort is made to minimize animal suffering. All experimental programs are authorized by the Animal Care and Use Ethics Committee of Zhejiang Ocean University, Zhoushan, China.
2.2 Study design and sample processing
S. japonica individuals used were collected in the East China Sea (23°00′-33°10′N; 117°11′- 131°00′E). Organisms were divided into three groups according to their respective growth stages: group A (pre-spawning after sexual maturity), group B (spawning), and group C (post-spawning before death). Optic gland tissues were obtained from respective groups of cuttlefish, and three samples were retrieved from each group. A high-throughput label-free proteomic approach was utilized to determine the protein content of each sample. The differentially abundant proteins, identified after comparison between the three groups, were selected when fold-change (FC) ≥1.5 and P < 0.05 (up-regulated) or FC ≤ 0.667 and P < 0.05 (down-regulated). Bioinformatics analyses of all differentially identified proteins were further carried out.
2.3 Protein extraction
After tissue collection, optic glands were washed twice with pre-chilled PBS. Liquid on the surface was sucked up with filter paper. An appropriate volume of AP solution (1mL of AP solution per 50mg tissue), supplemented with protease inhibitors, was used to homogenize the tissues. Next, tissue homogenates were centrifuged for 10 mins at 13,000rpm at room temperature, and respective supernatants (protein samples) were then transferred to new tubes/vials. A total volume of 21μL per protein sample was resolved by SDS-PAGE to determine (i) the molecular weight range of the total protein and (ii) the differences between the optic gland tissue samples. Protein concentration was determined at 595nm with a Bradford kit, using a Microplate Reader (BioTek, Winooski, Vermont, U.S.A). Supernatants were stored at -80°C for further analysis.
2.4 Analysis of optic gland proteome
A total of 60μL per quantified protein sample was treated with 5μL 1M dithiothreitol (DTT) for 1 hr at 37°C and then mixed with 20μL 1M iodoacetamide (IAA) for an additional 1 hr in the dark. Samples were then centrifuged, and the resulting supernatants were separated. A volume of 100μL UA (8M urea, 100mM Tris-HCl, pH8.0) was added to each supernatant, followed by a new round of centrifugation. After repeating twice this last procedure, a total of 100μL 50mM NH4HCO3 was added to each respective supernatant, followed by another round of centrifugation. This last procedure was repeated three times before trypsinization. Sequencing-grade modified trypsin (Promega, Madison, Wisconsin, U.S.A) was then added to each protein sample (50:1 ratio of protein to an enzyme). Sample digestion was performed for 12-16 hrs at 37°C. Chromatographic separation of digested peptides was carried out on Easy-nLC 1200 and Ultimate 3000 systems (Thermo Scientific, Waltham, MA, U.S.A), equipped with trap (C18, 100μm×20mm, 3μm) and capillary column (C18, 150μm×120μm, 1.9μm) configurations, separately. Peptide mixtures were loaded on the trap column in solution A (0.1% formic acid), then separated with the capillary column with a gradient solution B (0.08% formic acid and 80% acetonitrile), at a flow rate of 310 nL/min. A gradient was established according to the following steps: 3-8% solution B for 8 mins, 8-20% for 60 mins, 20-30% for 15 mins, 90% solution B for 2 mins and holding it for an additional 5mins (Guo et al., 2017). Separated peptides were analyzed by Q-Exactive HF Orbitrap mass spectrometer (Thermo Scientific, Waltham, MA, U.S.A).
MS data were evaluated by SEQUEST software (Eng et al., 1994) embedded into Proteome Discover 2.0 (Thermo Scientific, Waltham, MA, U.S.A), using a peptide database (gby_All-Unigene.pep) constructed from the transcriptome data of S. japonica. Parameters were set as the following: (i) fully tryptic peptides with ≤ 2 missed cleavages were permitted, (ii) fixed modifications were related to carbamidomethyl (C), (iii) variable modifications were related to oxidization (M) and acetylation (Protein N-term), (iv) peptide mass tolerance was 15 ppm, (v) fragment mass tolerance was 20 mmu, (vi) peptide confidence was high and (vii) peptide length>4. The filtering parameter set was that the peptide false discovery (FDR) should be less than or equal to 0.01 (Sandberg et al., 2012; Park et al., 2016; Zhou et al., 2016).
2.5 Bioinformatic analysis
Three sample groups were cross-compared in this study. The student’s t-test was used to identify proteins with significant differential expression among the different samples/groups. P < 0.05 was considered as a statistically significant difference. For volcano plot design, the log10 (FC) was used as abscissa and the -log10 (P-value) was used as ordinate. Gene ontology (GO) analysis was performed for the functional annotation of differential proteins. Particularly, three ontology categories (cellular component, molecular function, and biological process) were analyzed via the GO database (www.geneontology.org/). The main biological functions of differential proteins were determined by GO enrichment analysis. Access to the Kyoto Encyclopedia of Genes and Genomes (KEGG) pathway database (http://www.kegg.jp/kegg/pathway.html) was used to annotate and further perform enrichment pathway analysis of the differential proteins. Concomitantly, COG analysis of differential proteins was also carried out. Enrichment pathway analysis of the differential expression protein groups was carried out by comparing differential proteins with the KOG database. Thereafter, putative protein functions were predicted and classified.
2.6 Statistical analysis
To evaluate the statistical significance of the differences observed between different groups, an analysis of variance was performed using the IBM SPSS statistics package (version: 23) and Prism 8 statistics software package (version: 8.3.1). All data presented in this study are means with standard deviation calculated from the triplicated cultures in each group.
2.7 Quantitative real-time PCR analysis
Total RNA was isolated using TRIzol Reagent (CWBIO, Beijing, China), according to the manufacturer’s instructions. Single strand cDNA synthesis was performed with a PrimeScript RT Reagent kit (Takara Bio Inc., Beijing, China). The qRT-PCR was conducted with SYBR® Premix Ex Taq™ II (Takara Bio Inc., Dalian, China), using a CFX Connect™ Real-Time PCR Detection System (BIO-RAD Bio Inc., Shanghai, China). The following qRT-PCR program was used: 95°C for 1 min, followed by 40 cycles of 95°C for 15 secs, and 60°C for 45 secs. Relative expression levels of the target genes were calculated using the 2−ΔΔCt method. Each experiment included three biological replicates and three technical replicates. The data were presented as mean ± standard deviation (S.D.) ANOVA was performed to analyze the significant differences of the data. P < 0.05 was considered as a statistically significant difference, while P < 0.01 was considered as extremely significant. All primer sequences are listed in Supplementary Table 1.
2.8 Accession number
The Label-free proteomics data have been deposited in the ProteomeXchange consortium via PRIDE with the data set identifier PXD033041.
3 Results
3.1 Overview of proteomics and active metabolic pathways in the three stages
The Protein content of each group sample was separated by SDS-PAGE, in the range of 20 to 220 kDa, and some differences could be noticed between groups (Figure 1). A total of 10,963 peptides and 2,147 proteins were identified across all samples (Supplementary Figure 1). A percentage of 91.24% of all identified proteins had a molecular weight within the range of 10 to110 kDa (Supplementary Figure 2A), and 86.21% of these proteins presented a pI value in the range of 4-9 (Supplementary Figure 2B). The sequence coverage of most proteins (1,926 of 2,147; 89.71%) is distributed within 35% (Supplementary Figure 2C), and 72.85% (1,564 of 2,147) of the identified proteins were represented by two or more peptides (Supplementary Figure 2D). Principal component analysis (PCA) for the proteomics data indicated that the within-group biological replicates were close to each other whereas different groups were well separated from each other, validating the experimental setup and reliability of the proteomics data for differentially expressed proteins (DEPs) analysis (Supplementary Figure 3).
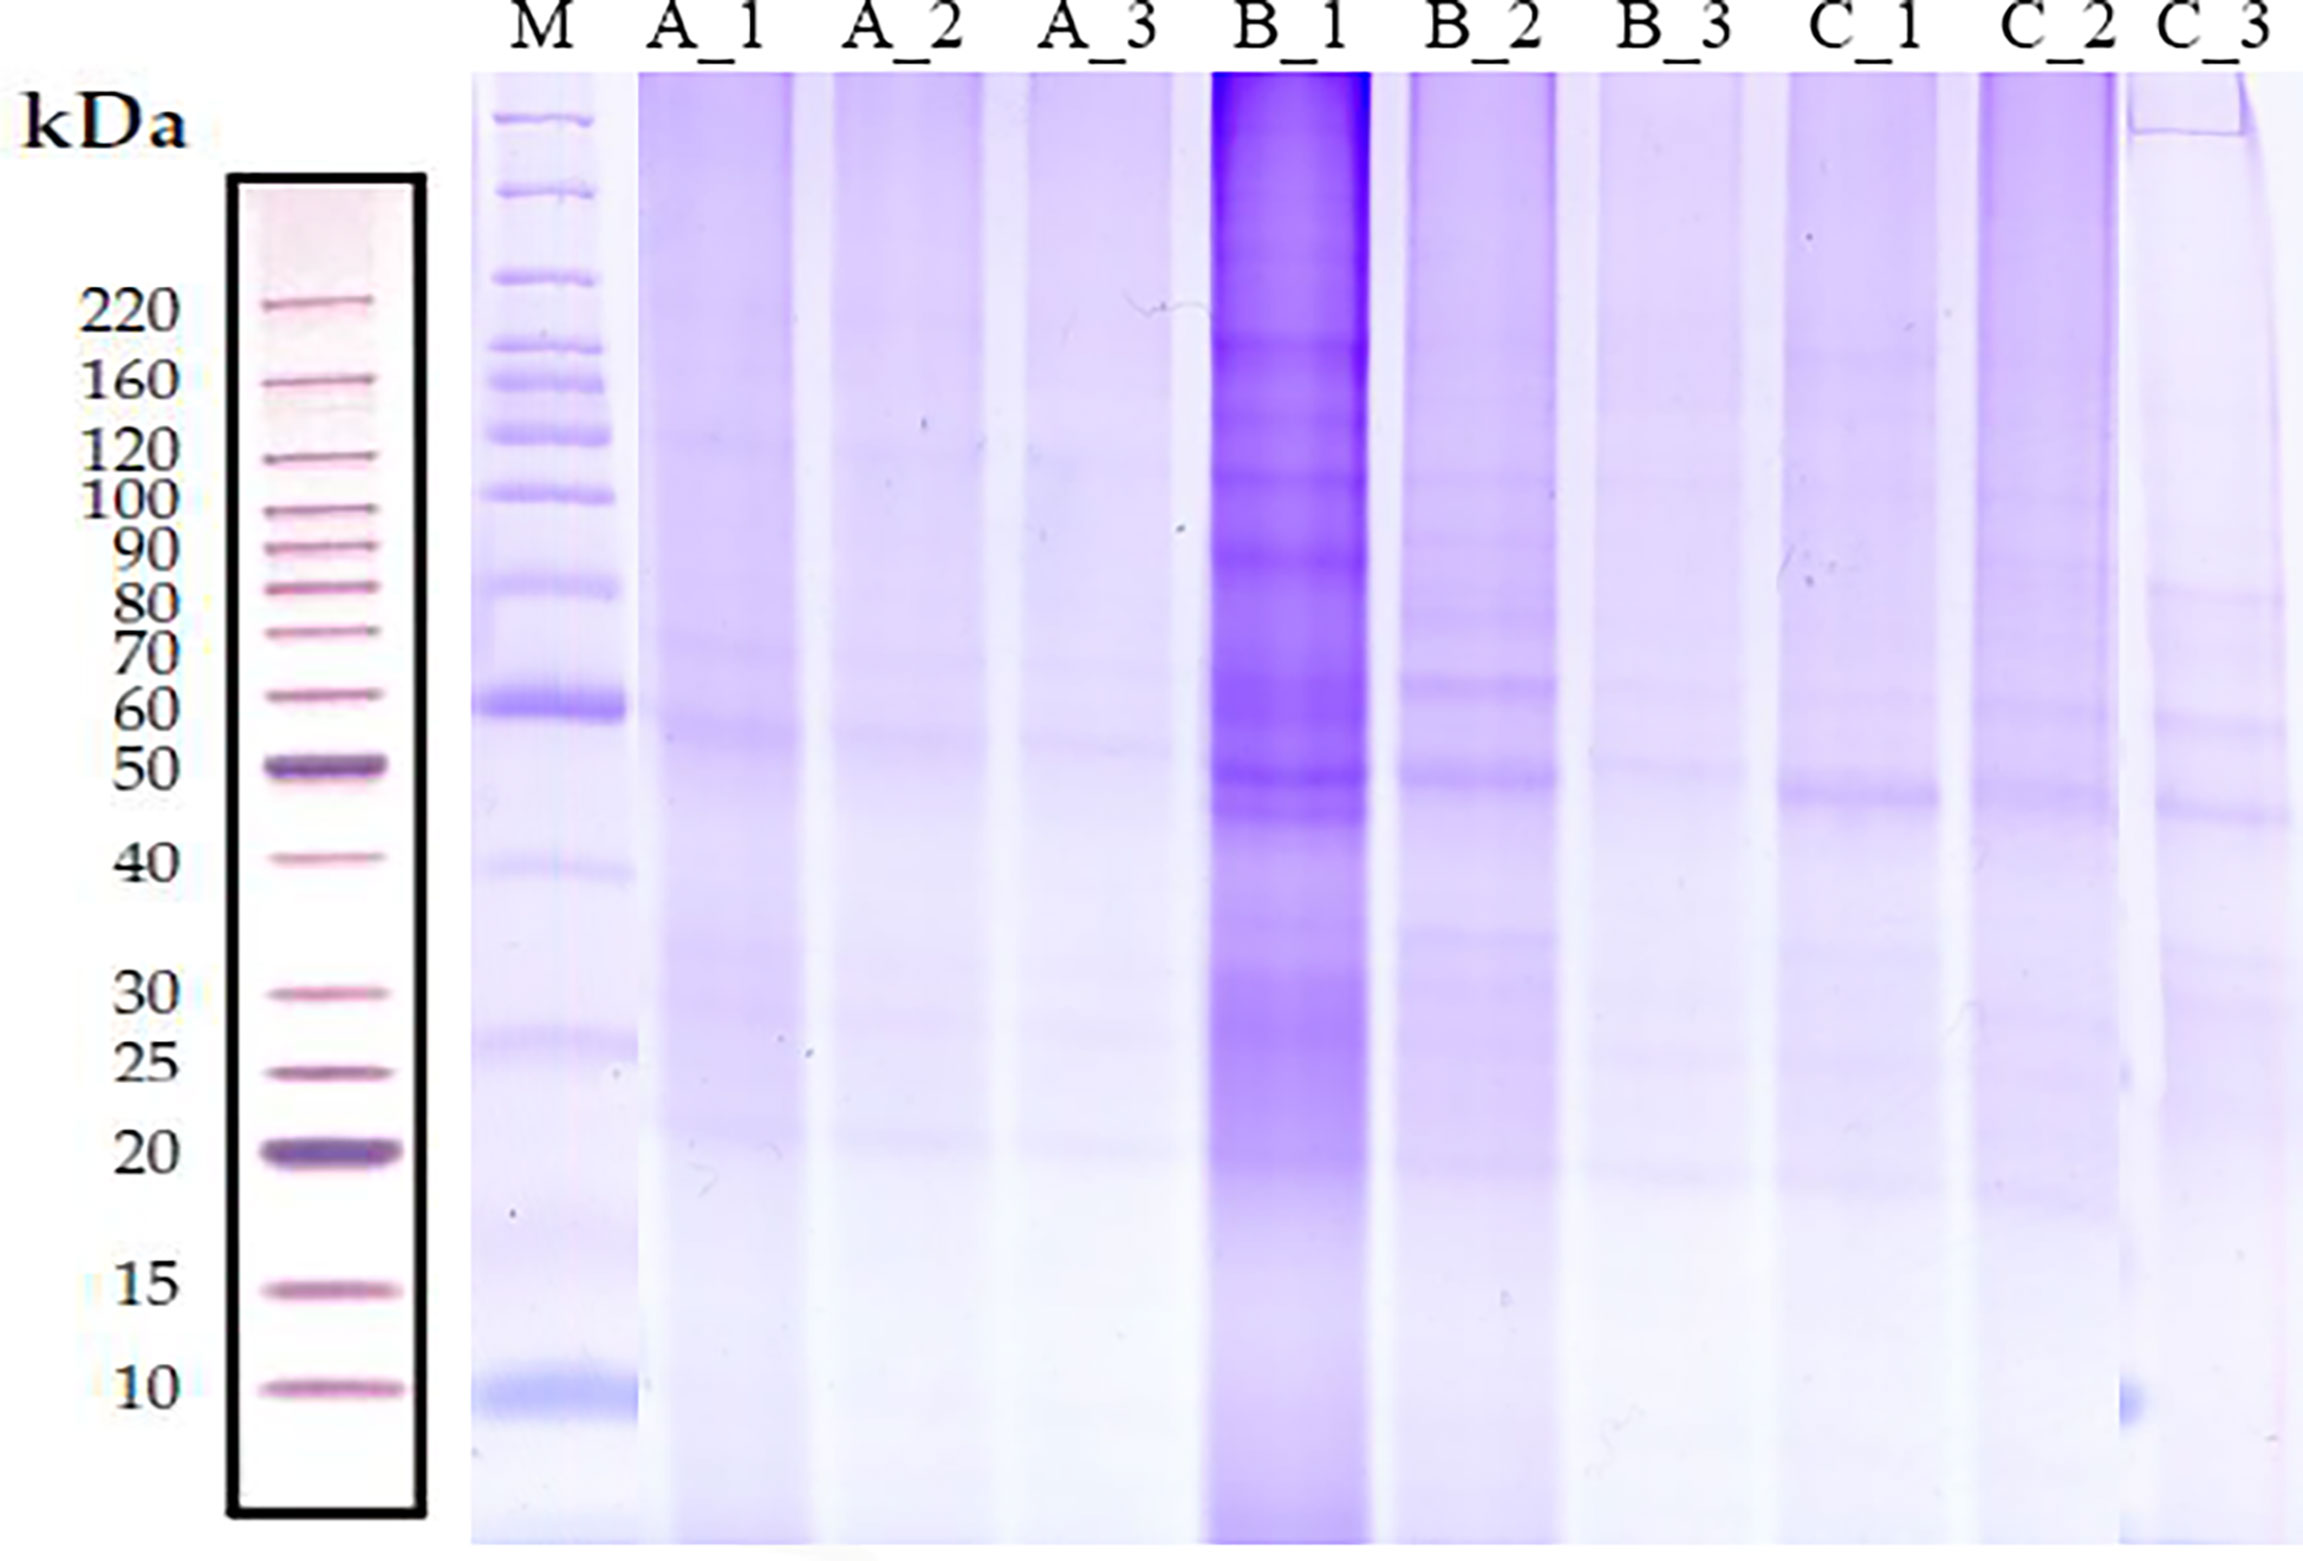
Figure 1 Analysis of protein quality of S. japonica at different stage levels. The total content of proteins isolated from S. japonica optic gland (groups A, C and D) were analyzed by SDS-PAGE.
Venn diagram showed that there were 1229 co-expressed proteins in the three groups (Figure 2A), which were mainly enriched in Carbon metabolism, Ribosome, Oxidative phosphorylation, and other pathways (Table S2). We focused on the top 10% of most highly average expression proteins (HEPs) in each group and found 109 HEPs that were common among all the groups (Figure 2B; Supplementary Table 3). The expression values of these HEPs ranged from 12,734,240.06 -1,452,948,390.98. The five proteins with the highest average expression were collagen type I alpha, superoxide dismutase (Cu-Zn family), histone H2B, ubiquitin-small subunit ribosomal protein S27Ae, and tyrosinase. The 109 HEPs are mainly enriched in the five KEGG pathways of Carbon metabolism, Biosynthesis of amino acids, Oxidative phosphorylation, Citrate cycle (TCA cycle), and Glycolysis/Gluconeogenesis (Figure 2C).
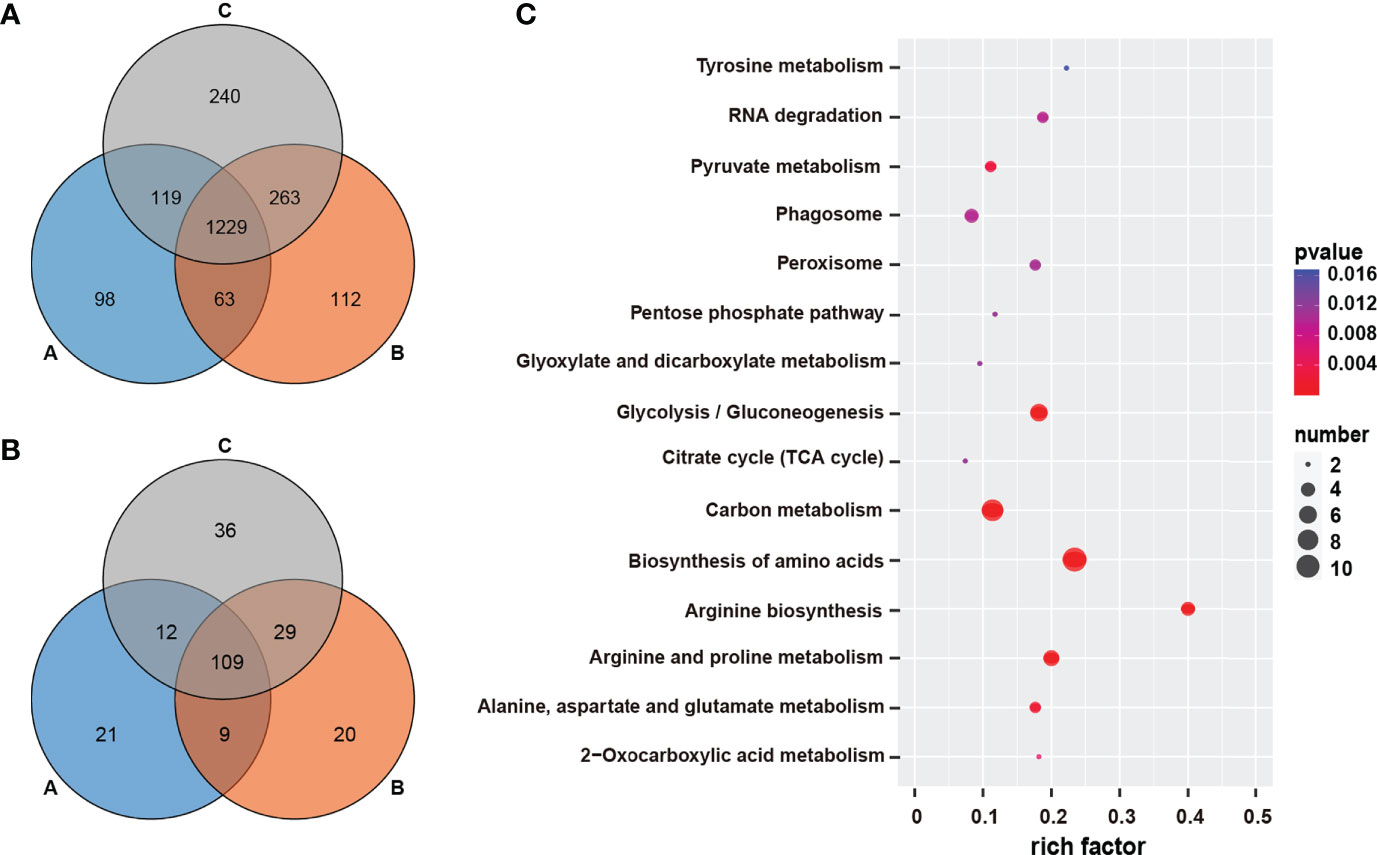
Figure 2 Wenn analysis of co-expressed genes in different groups and pathway enrichment of co-highly expressed genes. (A) Wenn analysis of co-expressed genes in three groups; (B) Wenn analysis of co-highly expressed genes in three groups; (C) Pathway enrichment of co-highly expressed genes in three groups.
3.2 Identification of differentially expressed proteins
According to the parameters used for DEP selection (FC≥1.5 and P<0.05), a total of 955 proteins were identified and quantified after comparing group A versus group B. Respective results indicated that 76 DEPs were up-regulated and 287 DEPs were down-regulated in group B, while 217 and 375 proteins were respectively accumulated in groups A and B. The comparative results among the three different groups are shown in Table 1. The distributions of DEPs among the groups are represented in volcano plots (Figures 3A, C, E). The hierarchical clustering of all DEPs showed an elevation of protein levels during distinct growth stages of S. japonica (Figures 3B, D, F).

Table 1 DEPs identified in group B vs group A, group B vs group C, and group C vs group A.
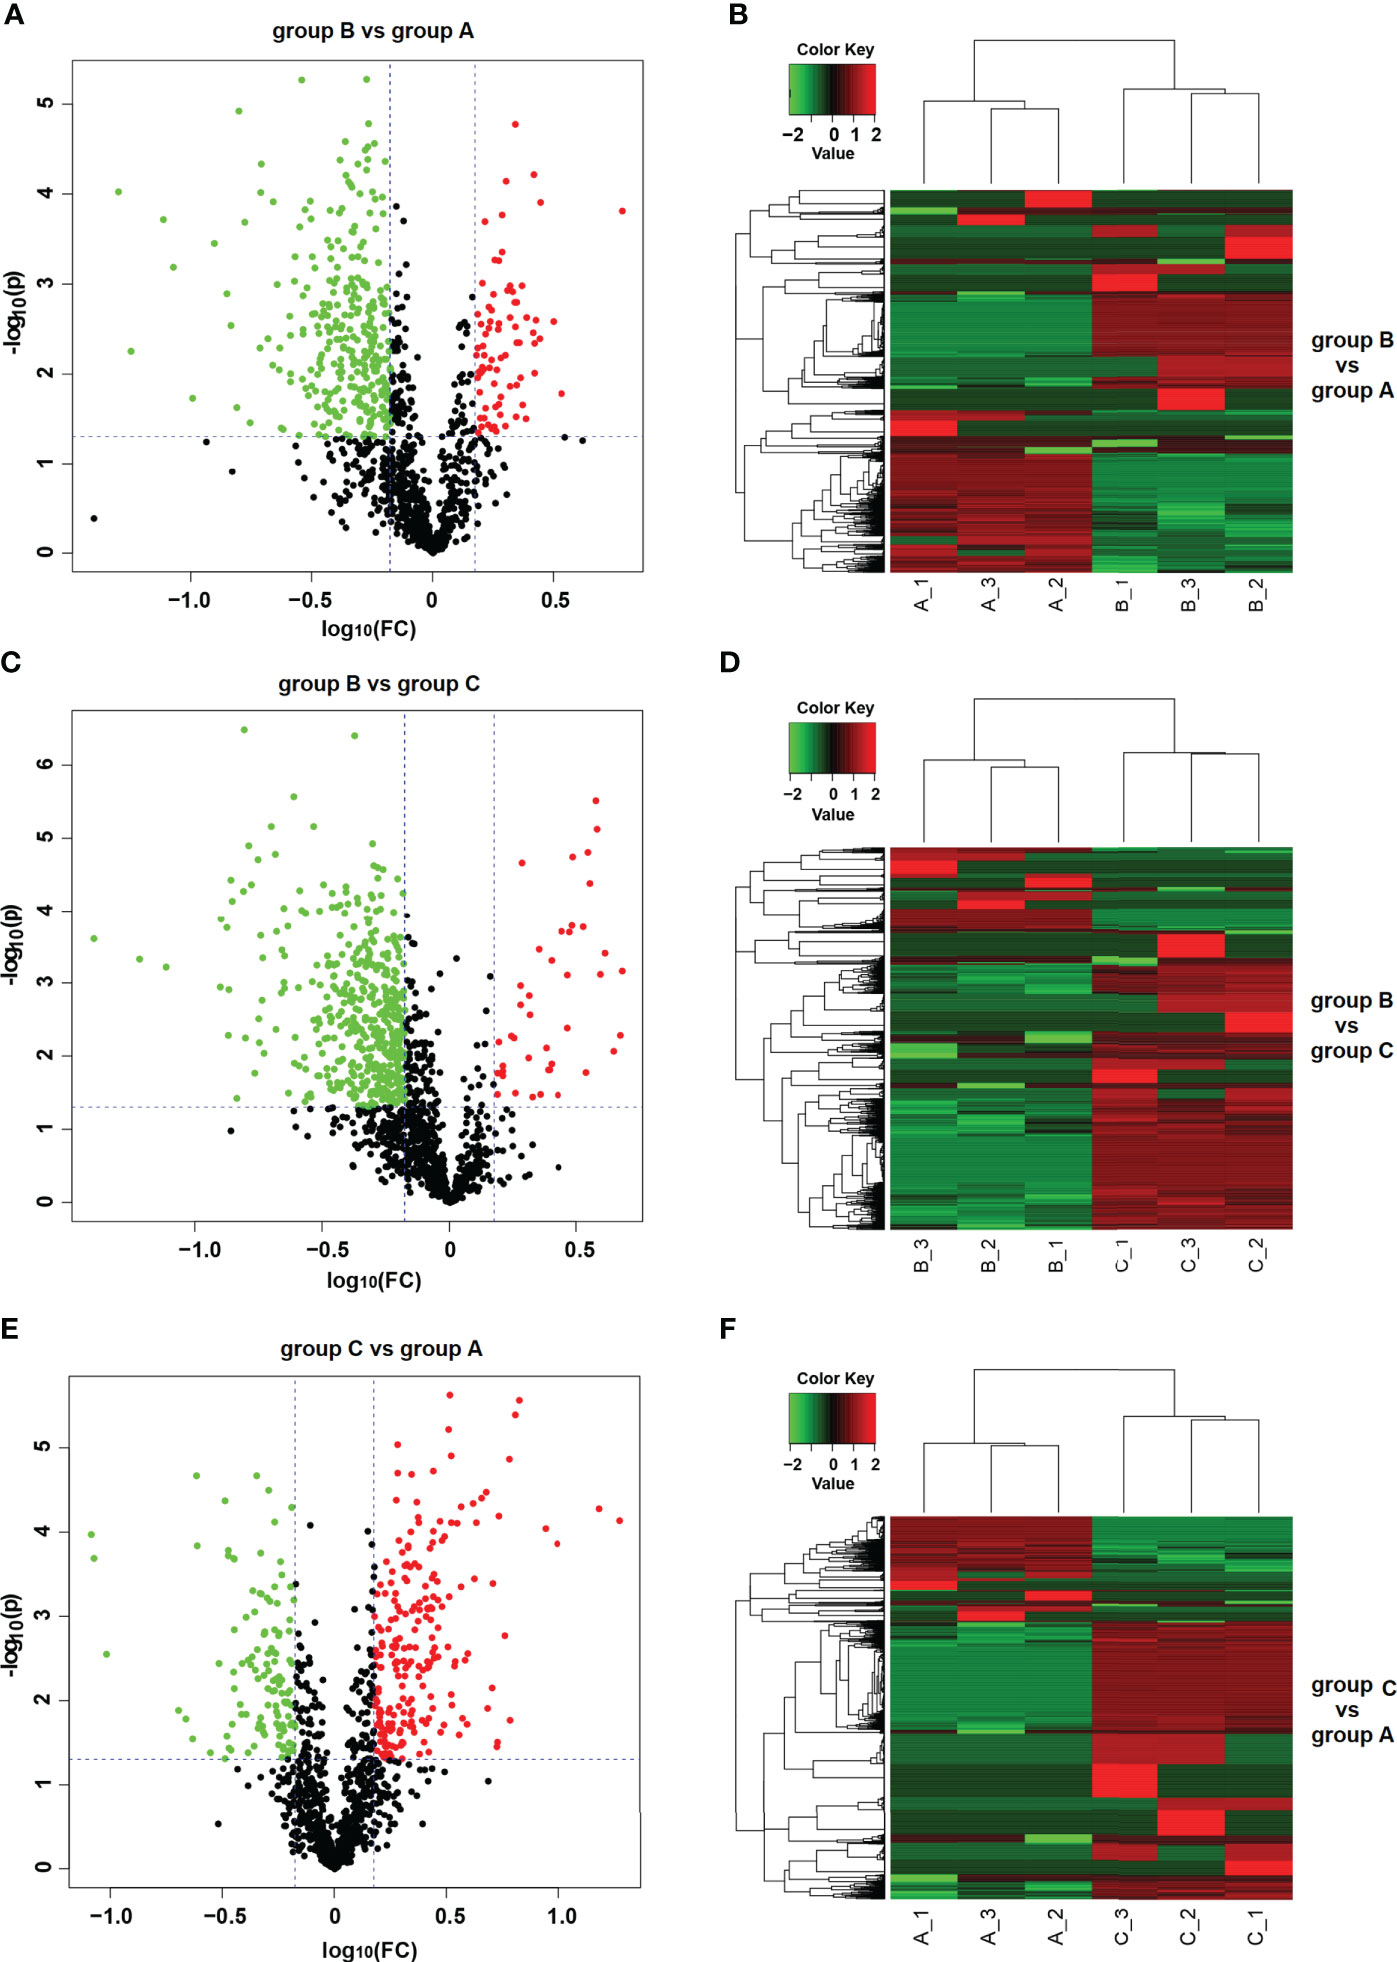
Figure 3 Differentially expressed proteins (DEPs) detected between different groups of S. japonica. Volcano plot of group B vs group A (A), group B vs group C (C) and group C vs group A (E). The up- and down-regulated proteins are marked in red and green, respectively. Heatmap of group B vs group A (B), group B vs group C (D) and group C vs group A (F). Red and green colors represent high and low protein abundance, respectively.
3.3 Functional annotation and pathway enrichment of DEPs
3.3.1 Gene Ontology analysis of DEPs
A total of 82.09% (784/955, B vs A), 84.28% (863/1024, B vs C) and 83.70% (837/1000, C vs A) of respective DEPs were annotated with, at least, one GO term. The GO annotation of DEPs mainly focused on (i) biological processes, (ii) molecular function, and (iii) cellular components (Figures 4A, 4C, 4E). Some proteins involved in important biological processes, for instance those identified after comparing group C versus group B, were enriched and further correlated with gene expression (GO:0010467), macromolecule biosynthetic process (GO:0009059), cellular macromolecule biosynthetic process (GO:0034645), cellular amide metabolic process (GO:0043603), and peptide metabolic process (GO:0006518) (P<0.01). Regarding the connection with cellular components, ribosome (GO:0005840), and intracellular ribonucleoprotein complex (GO:0030529), ribonucleoprotein complex (GO:1990904) were significantly enriched (P<0.01). In the context of molecular function, structural molecule activity (GO:0005198) and structural constituent of ribosome (GO:0003735) were also significantly enriched (P<0.01) (Figure 4B and Table 2). The enrichment results of other groups are shown (Figures 4D, F and Table 2).
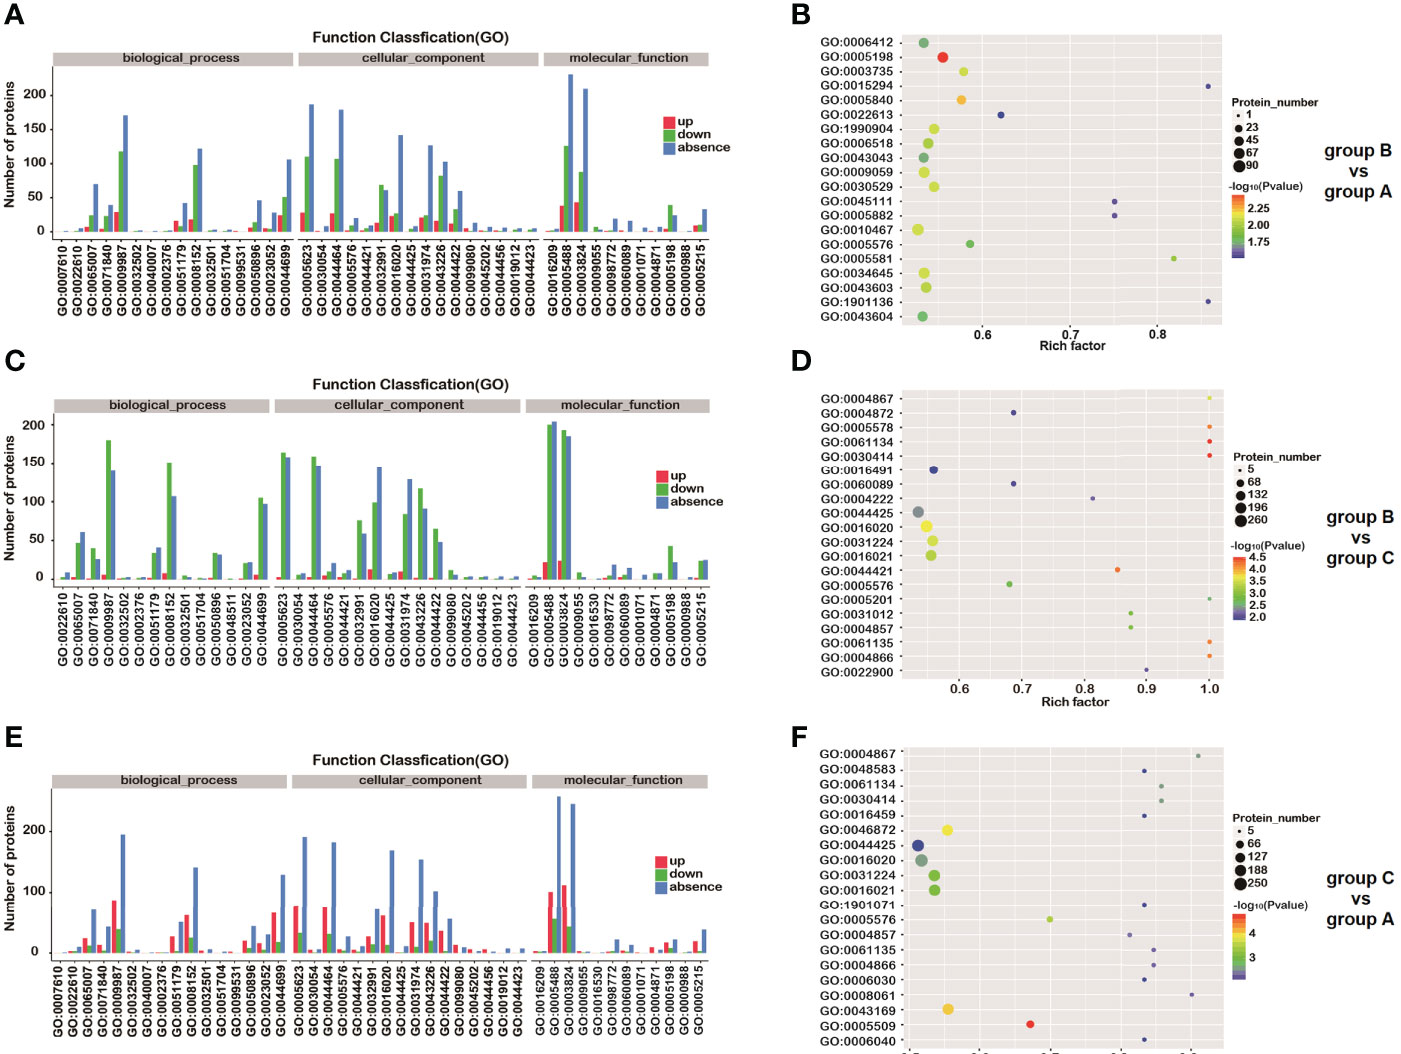
Figure 4 GO analysis of differentially expressed proteins (DEPs). Distribution of GO annotation of the DEPs identified in group B vs group A (A), group B vs group C (C) and group C vs group A (E). Red and green bars represent up- and down-regulated proteins, respectively. Blue bar represents unique proteins detected in a single group. GO enrichment of differentially expressed proteins in group B vs group A (B), group B vs group C (D) and group C vs group A (F). The size of spots represents the number of proteins in each GO term. Different colors represent distinct P-values. GO numbers represent GO terms, which can be found in Gene Ontology.
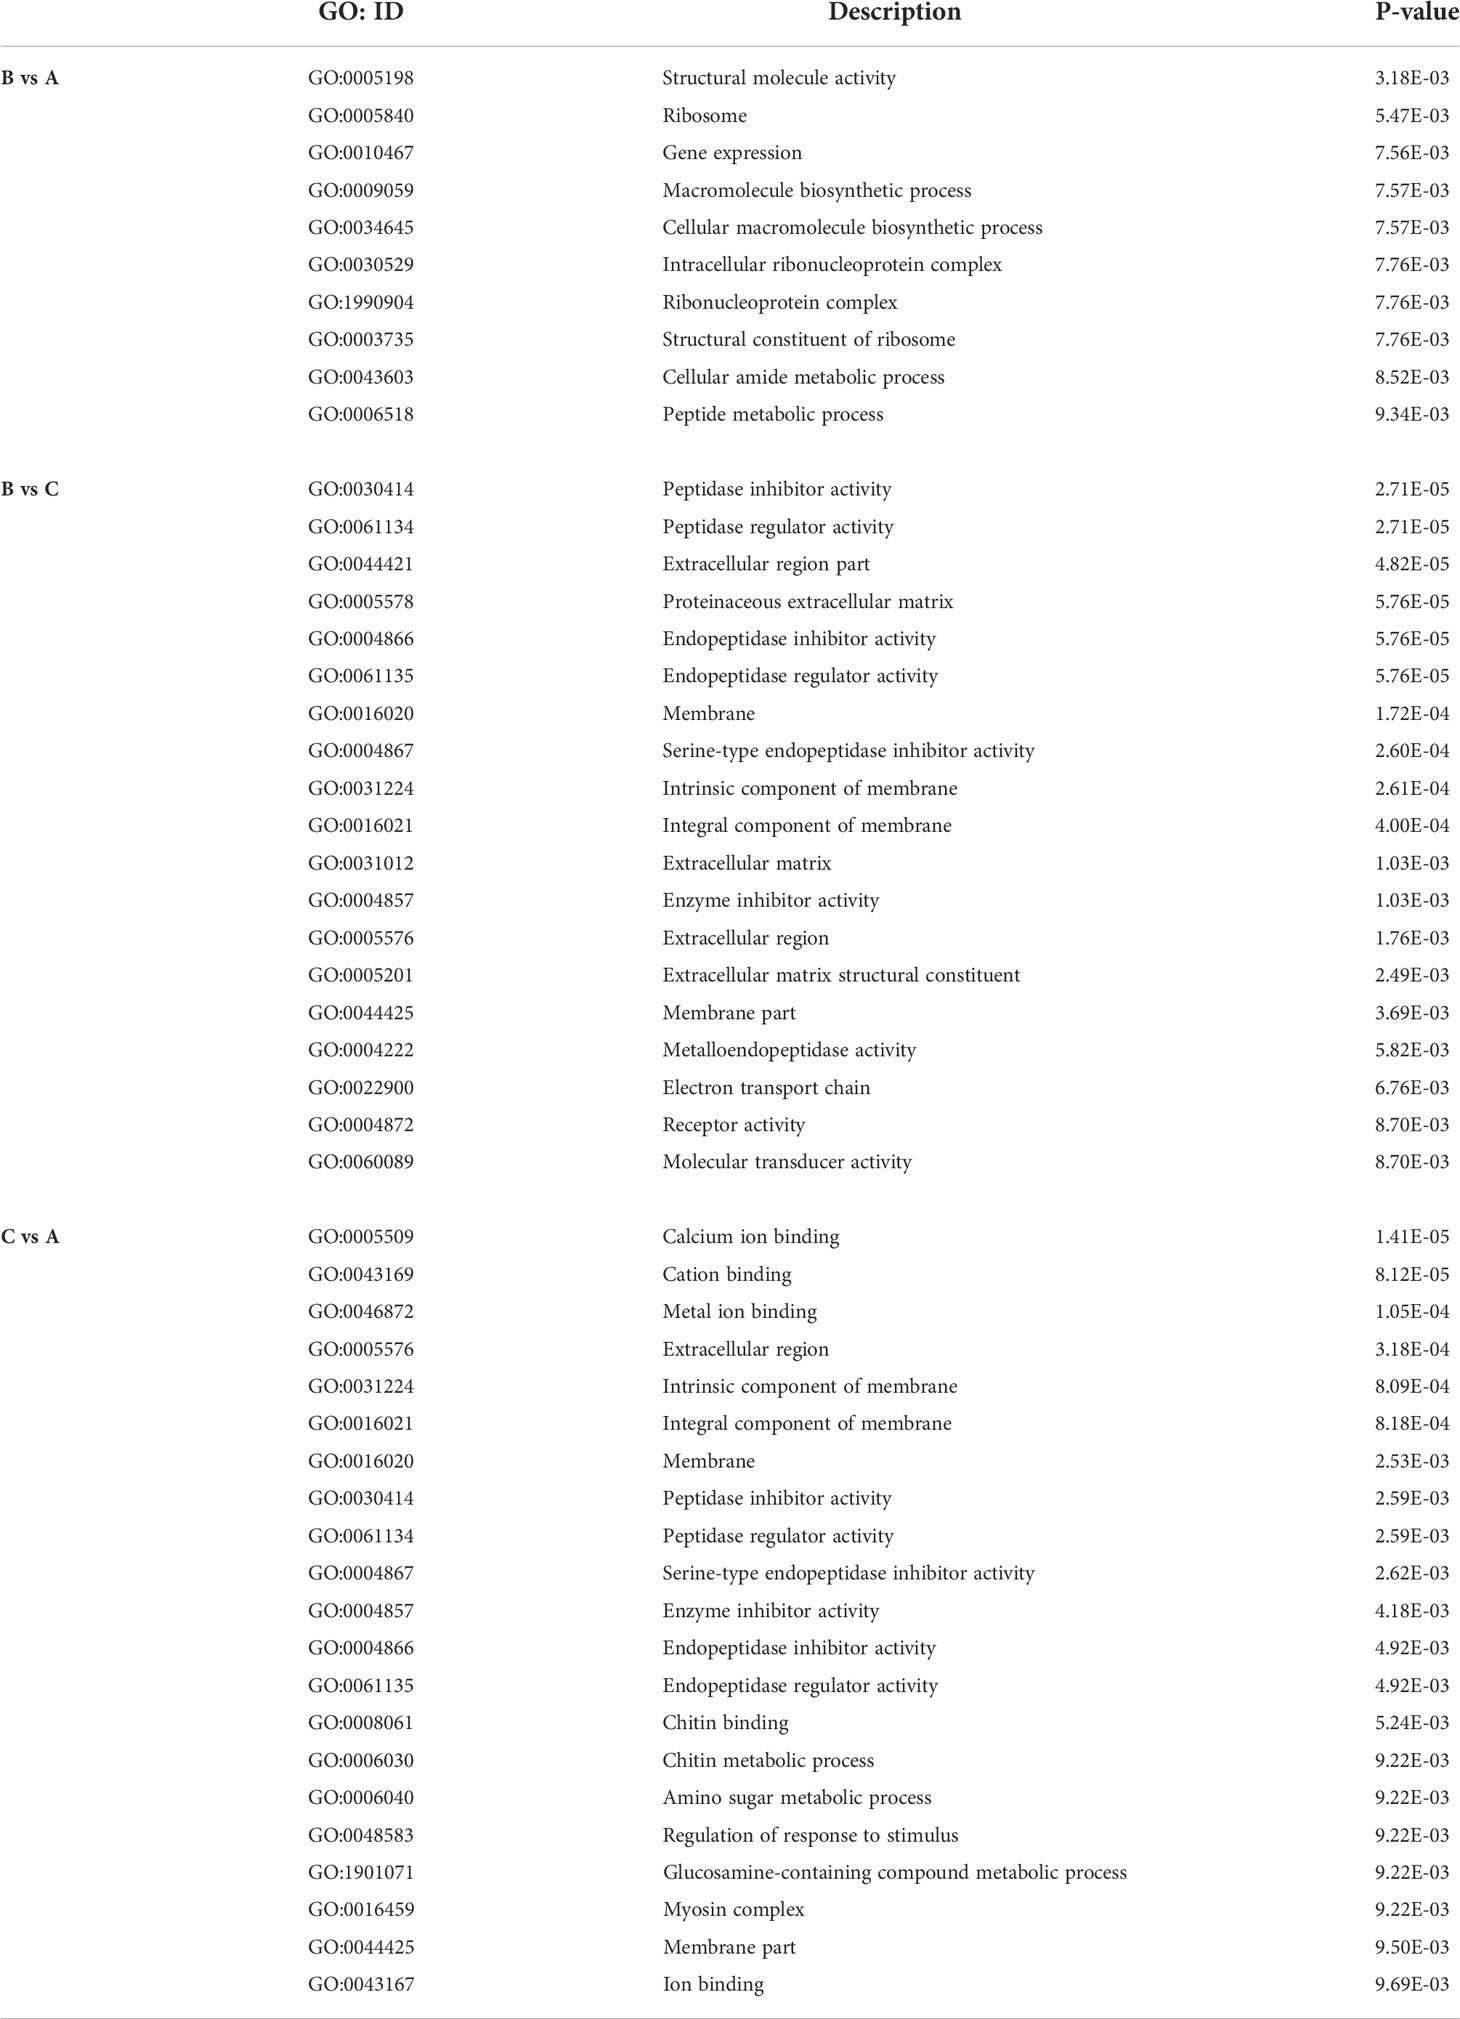
Table 2 GO enrichment for DEPs (P < 0.01).
3.3.2 KEGG analysis of DEPs
KEGG pathway analysis was pursued to identify the significant difference of DEP-related pathways for each group comparison. After comparing group B versus group A, 43.87% (419/955) of the DEPs were mapped into 200 pathways according to the KEGG database. For group B vs group C as well as group C vs group A, 43.95% (450/1024) and 42.50% (425/1000) DEPs were mapped into 189 and 214 pathways, respectively. The results of the KEGG annotation of all selected DEPs are presented (Figures 5A, C, E). The DEPs originated from the comparison between groups B and A were significantly enriched in four particular pathways (P<0.05): ribosome (P = 0.0039), spliceosome (P = 0.0143), apoptosis – fly (P = 0.0307), as well as antigen processing and presentation (P = 0.0307). The significant pathways enriched in the comparison between groups B and C (P<0.05) were the following: selenocompound metabolism (P = 0.0016), propanoate metabolism (P = 0.0075), ECM-receptor interaction (P = 0.0099), alanine, aspartate and glutamate metabolism (P = 0.0293), as well as arginine and proline metabolism (P = 0.0424). Finally, the DEPs identified on the comparison between groups C and A were significantly enriched in six pathways (P<0.05): glyoxylate and dicarboxylate metabolism (P = 0.0066), ECM-receptor interaction (P = 0.0111), mitophagy – animal (P = 0.0125), synthesis and degradation of ketone bodies (P = 0.0137), pyruvate metabolism (P = 0.0245), as well as antigen processing and presentation (P = 0.0325) (Figures 5B, D, F and Table 3). Many pathways were simultaneously enriched by three DEPs data sets, including ECM-receptor interaction, Oxidative phosphorylation, Propanoate metabolism, Valine, leucine and isoleucine degradation, etc. (Figure 6).
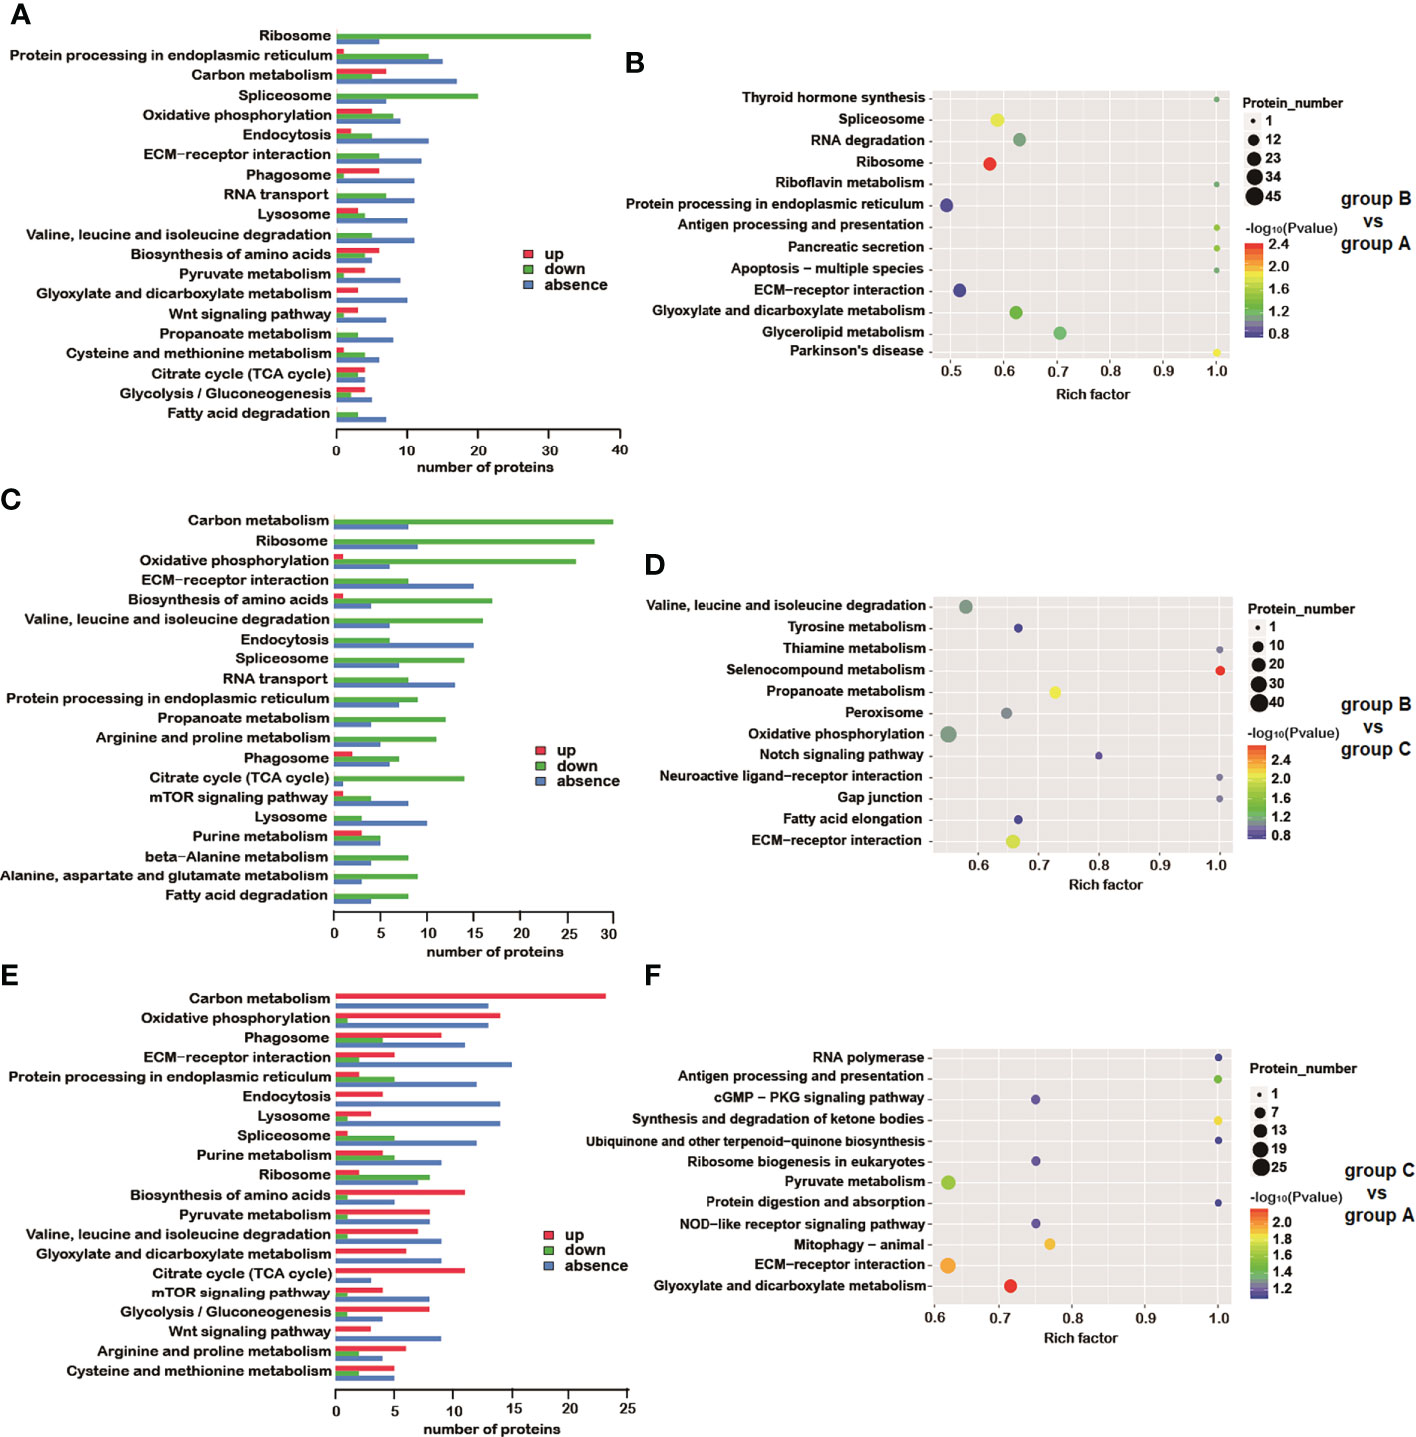
Figure 5 KEGG analysis of DEPs. Results of KEGG annotation in group B vs group A (A), group B vs group C (C) and group C vs group A (E). Up- and down-regulated proteins (red and green, respectively) as well as unique (blue) proteins are indicated in the pathways. KEGG enrichment of differentially expressed proteins is shown for comparisons between group B vs group A (B), group B vs group C (D) and group C vs group A (F). The color of spots indicates the significance level related to differences between each group. Gene names can be found in KEGG by searching gene symbols.
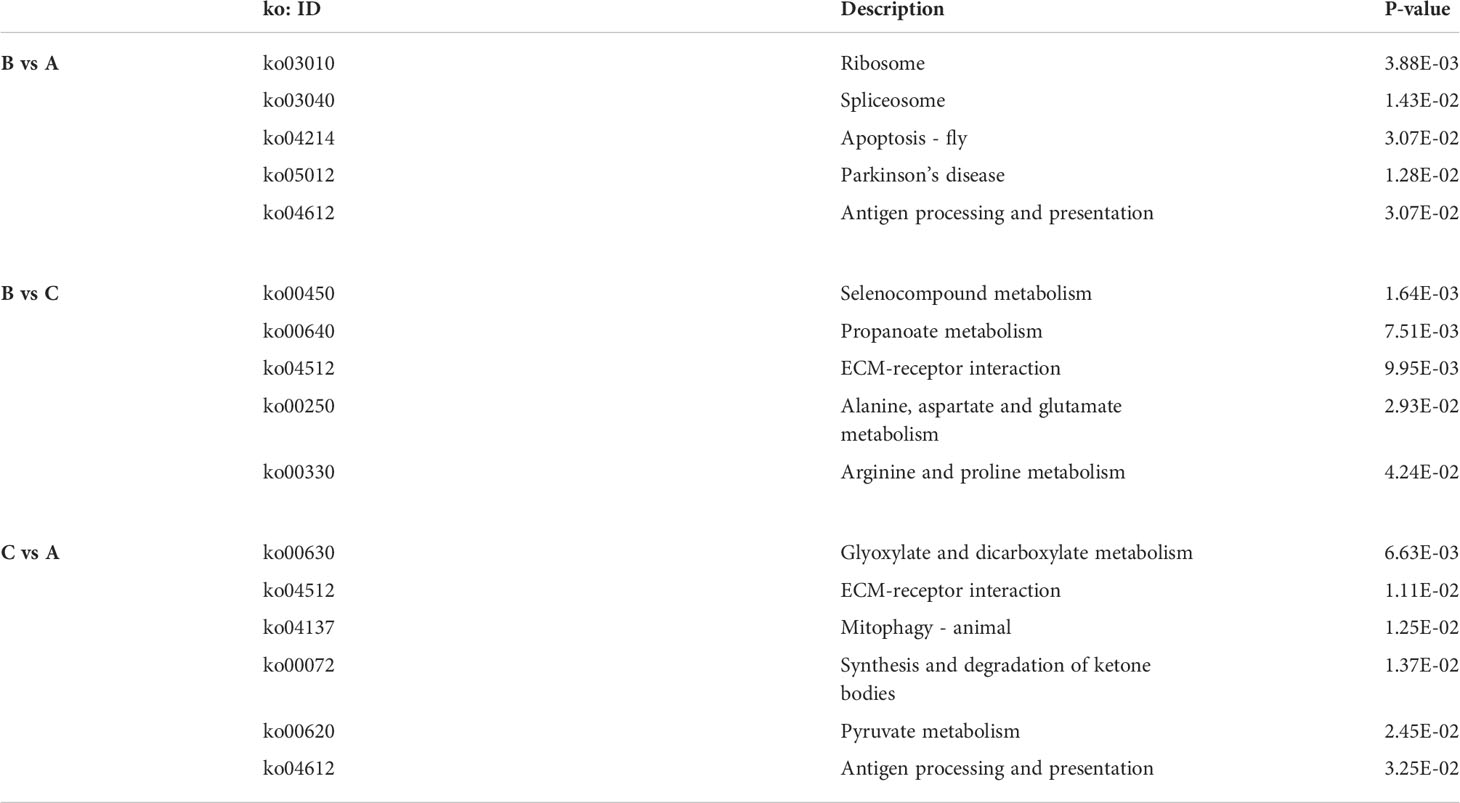
Table 3 KEGG enrichment for DEPs (P < 0.05).
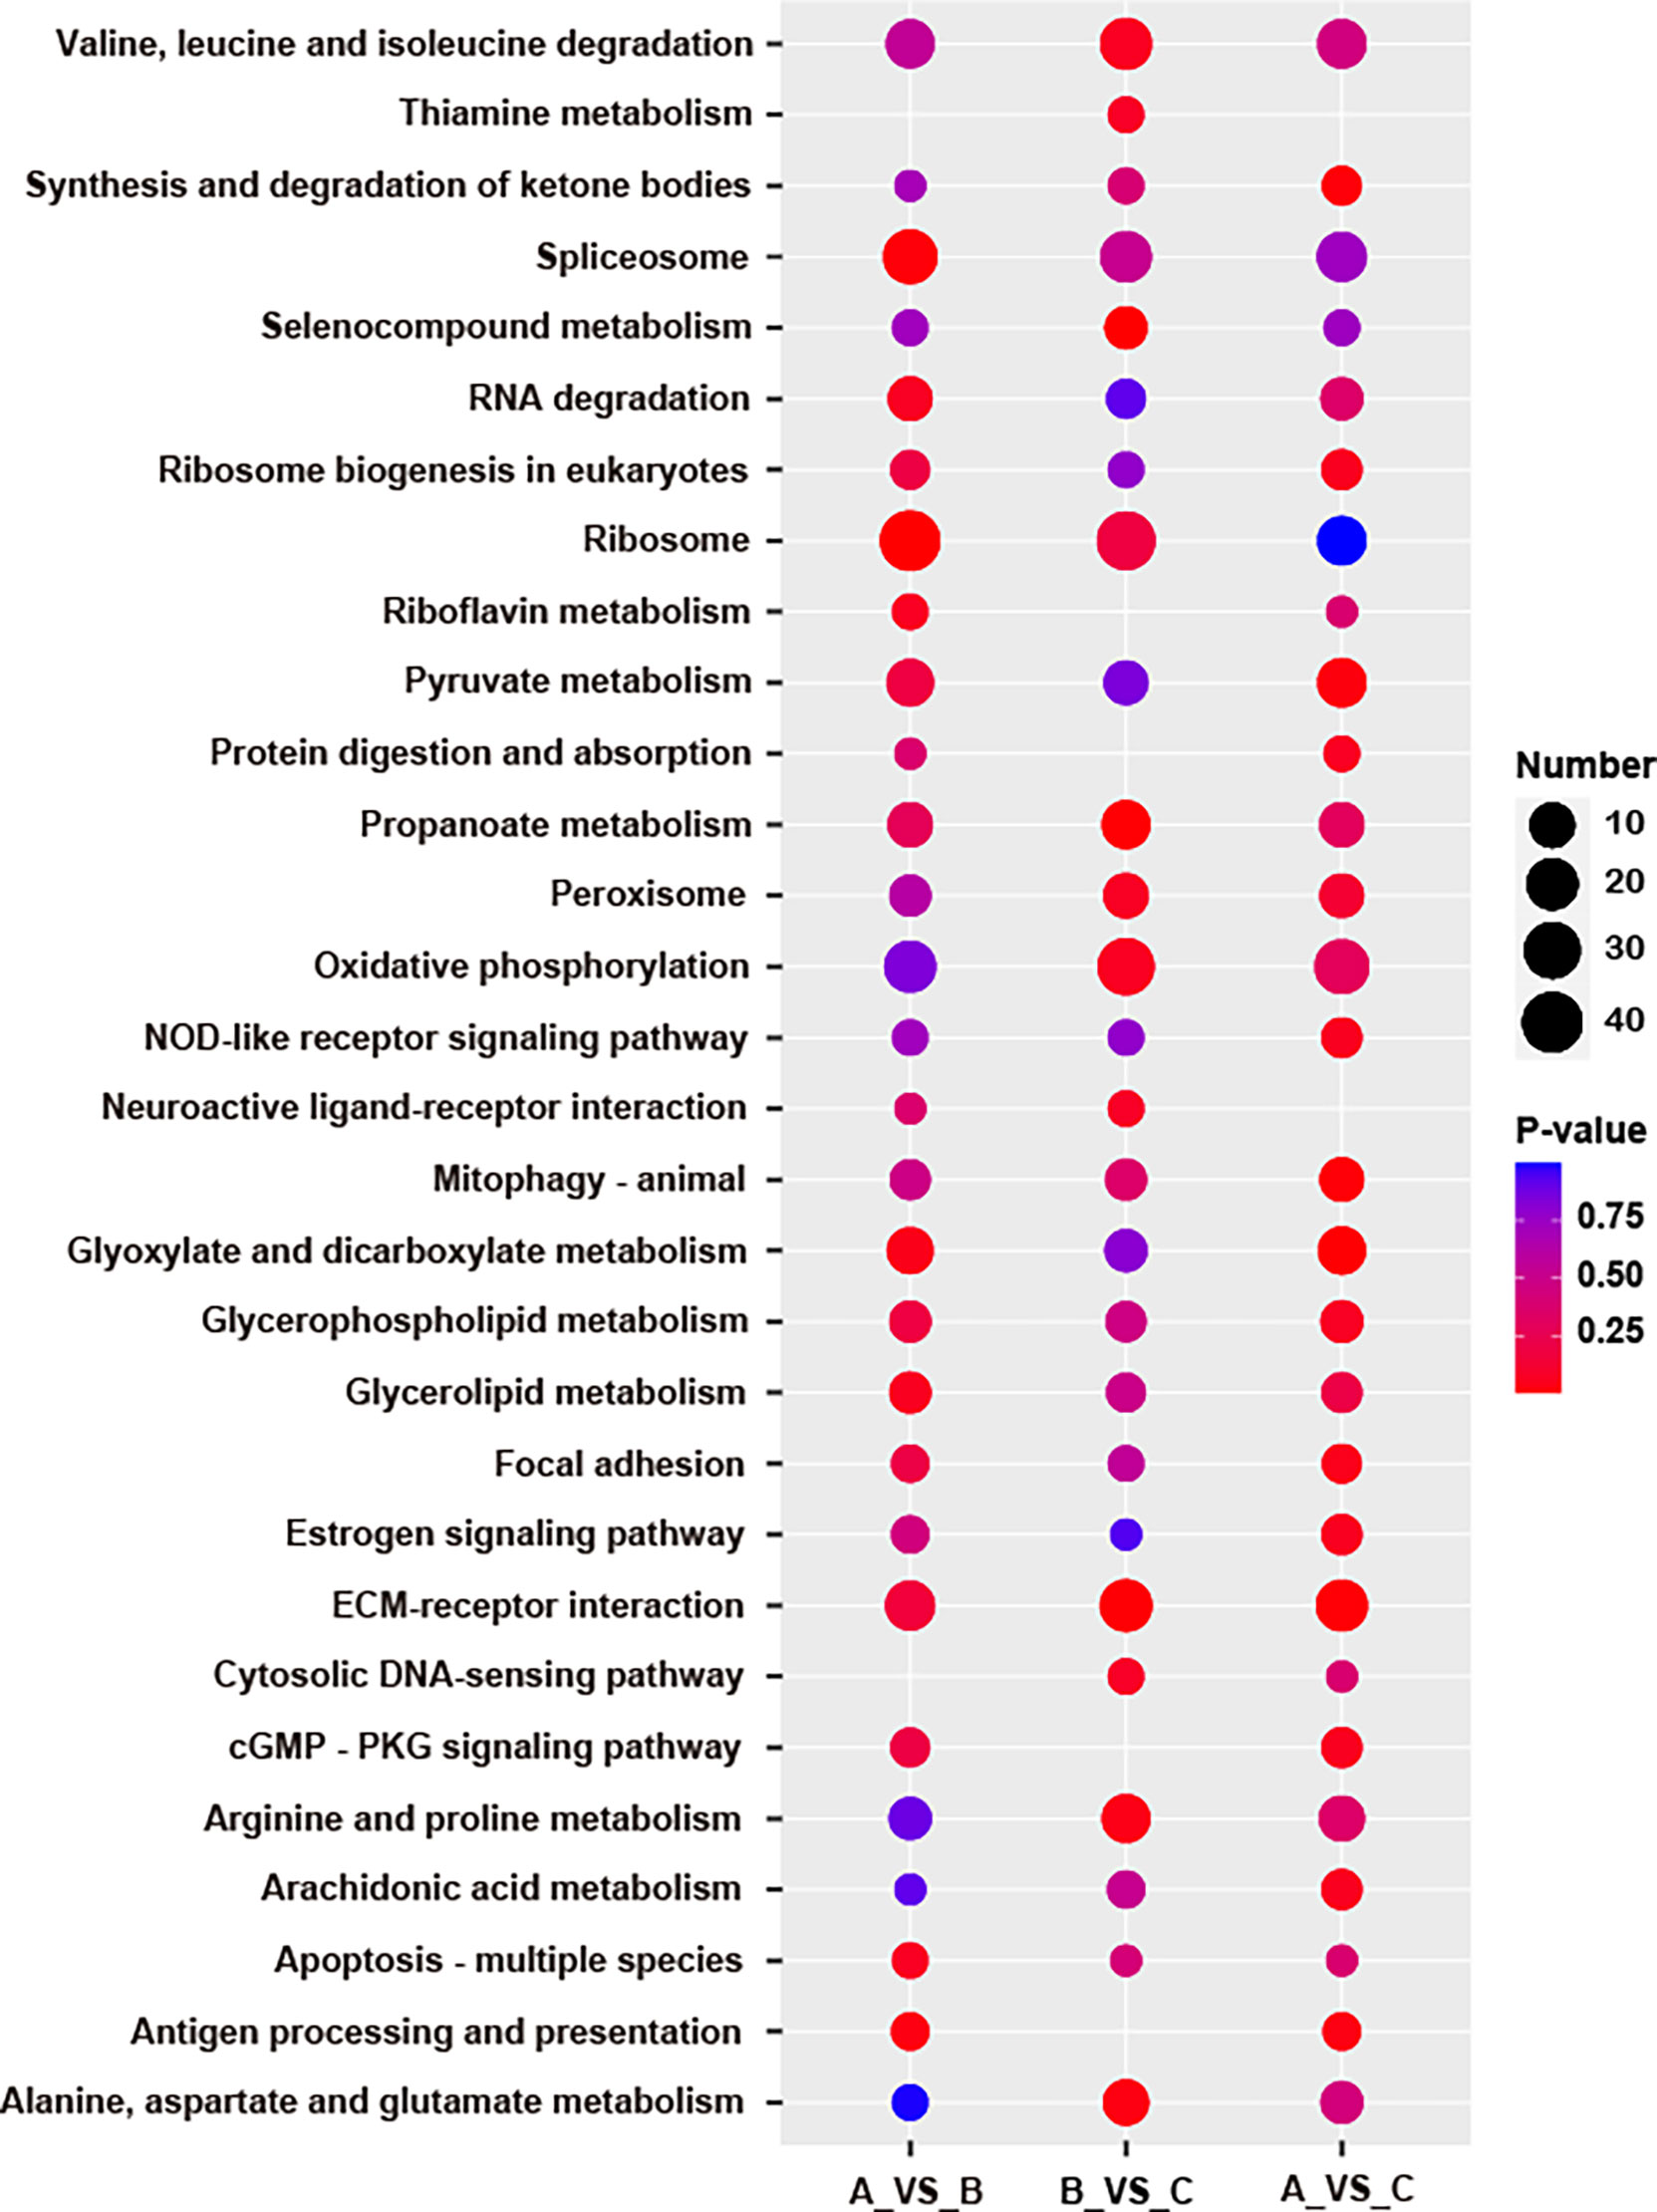
Figure 6 Pathways enriched by three DEPs datasets.
3.3.3 COG analysis of DEPs
The cluster of orthologous groups (COGs) of proteins was produced based on the database for homologous classification of proteins, which included two sections: (i) the COG database for prokaryotes and (ii) the KOG database for eukaryotes. The putative functions of the DEPs were predicted and classified according to the KOG database. A total of 797 DEPs, originated from the comparison between groups A and B, were assigned to the KOG classification. Among 25 KOG categories, three particular ones contained more than 100 DEPs: (i) posttranslational modification, protein turnover, chaperones; (ii) signal transduction mechanisms; and (iii) general function prediction only. Four other categories possessed more than 50 but less than 100 DEPs: (i) translation, ribosome structure and biogenesis; (ii) intracellular trafficking, secretion, and vesicular transport; (iii) energy production and conversion; and (iv) cytoskeleton (Figure 7A). The comparative result of group B vs group C and group C vs group A comparisons are presented in (Figure 7B) and (Figure 7C), respectively.
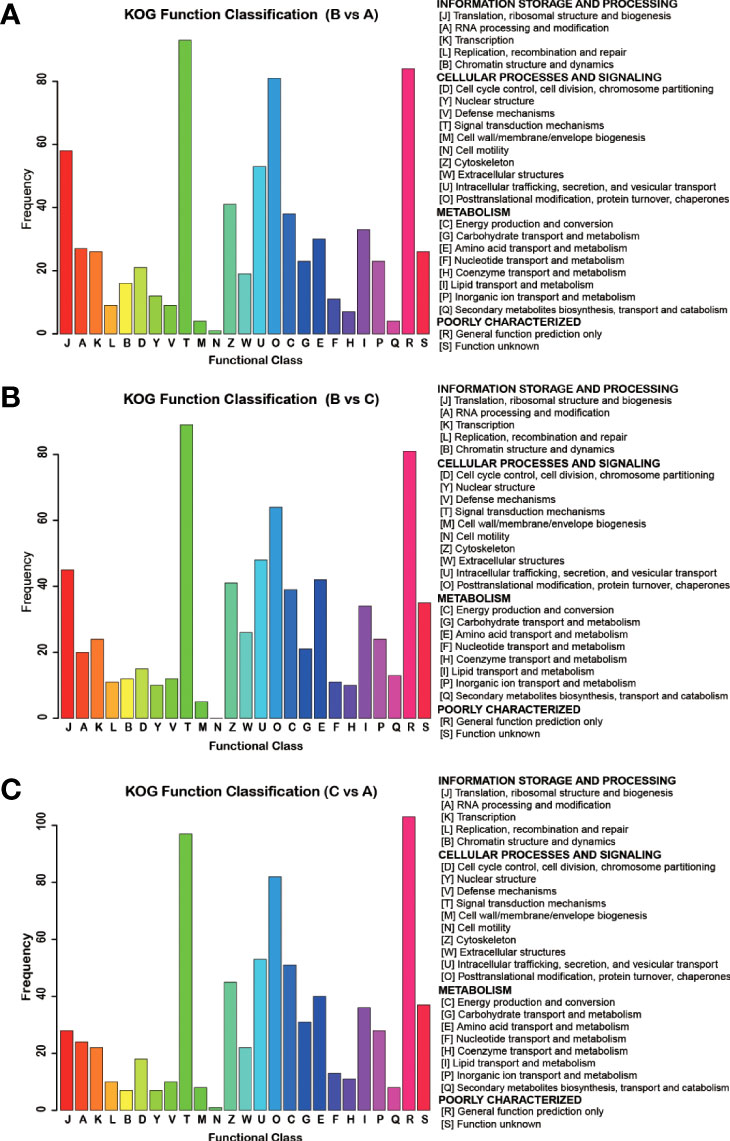
Figure 7 COG analysis of DEPs detected between different groups of S. japonica. DEPs detected in group B vs group A (A), group B vs group C (B) and group C vs group A (C), were categorized according to the information storage, cellular, signalling, and metabolism process.
3.4 Proteins in central carbon metabolism and oxidative phosphorylation
Central carbon metabolism (CCM) traditionally includes glycolysis, pentose phosphate pathway and tricarboxylic acid cycle (TCA). In this study, the expression levels of most enzymes related to Central carbon metabolism (CCM) were not significantly different between group A and group B but were up-regulated in group C (Figure 8). Among them, the core enzymes of glycolysis 6-phosphofructokinase 1 (PFK) and pyruvate kinase (PK) increased gradually from group A to group B and then to group C. Compared with group A and group B, PFK in group C was upregulated by 2.3- and 1.9-fold, and PK in group C was upregulated by 2.9- and 1.5- fold compared with group A and B, respectively. The rate-limiting enzyme of the pentose phosphate pathway, Glucose-6-Phosphate Dehydrogenase (G6PDH), was up-regulated by 2.0- and 1.4-fold in group C compared with group A and group B, respectively. The core enzymes of the TCA cycle, Citrate synthase (CS), isocitrate dehydrogenase (IDH), and α-ketoglutarate dehydrogenase complex (OGDH), have also shown a trend of up-regulation over time. Compared with group A and group B, these three enzymes were up-regulated by at least 2.1 fold and 1.8 fold in group C, respectively. Similar to CCM, our results showed that the expression of most proteins of the five major complexes involved in oxidative phosphorylation did not differ significantly between groups A and B but was significantly upregulated in group C (Figure 8). In addition, almost all proteins enriched in pyruvate metabolism and propanoate metabolism pathways were gradually up-regulated, with the highest abundance in group C (Figure 8).
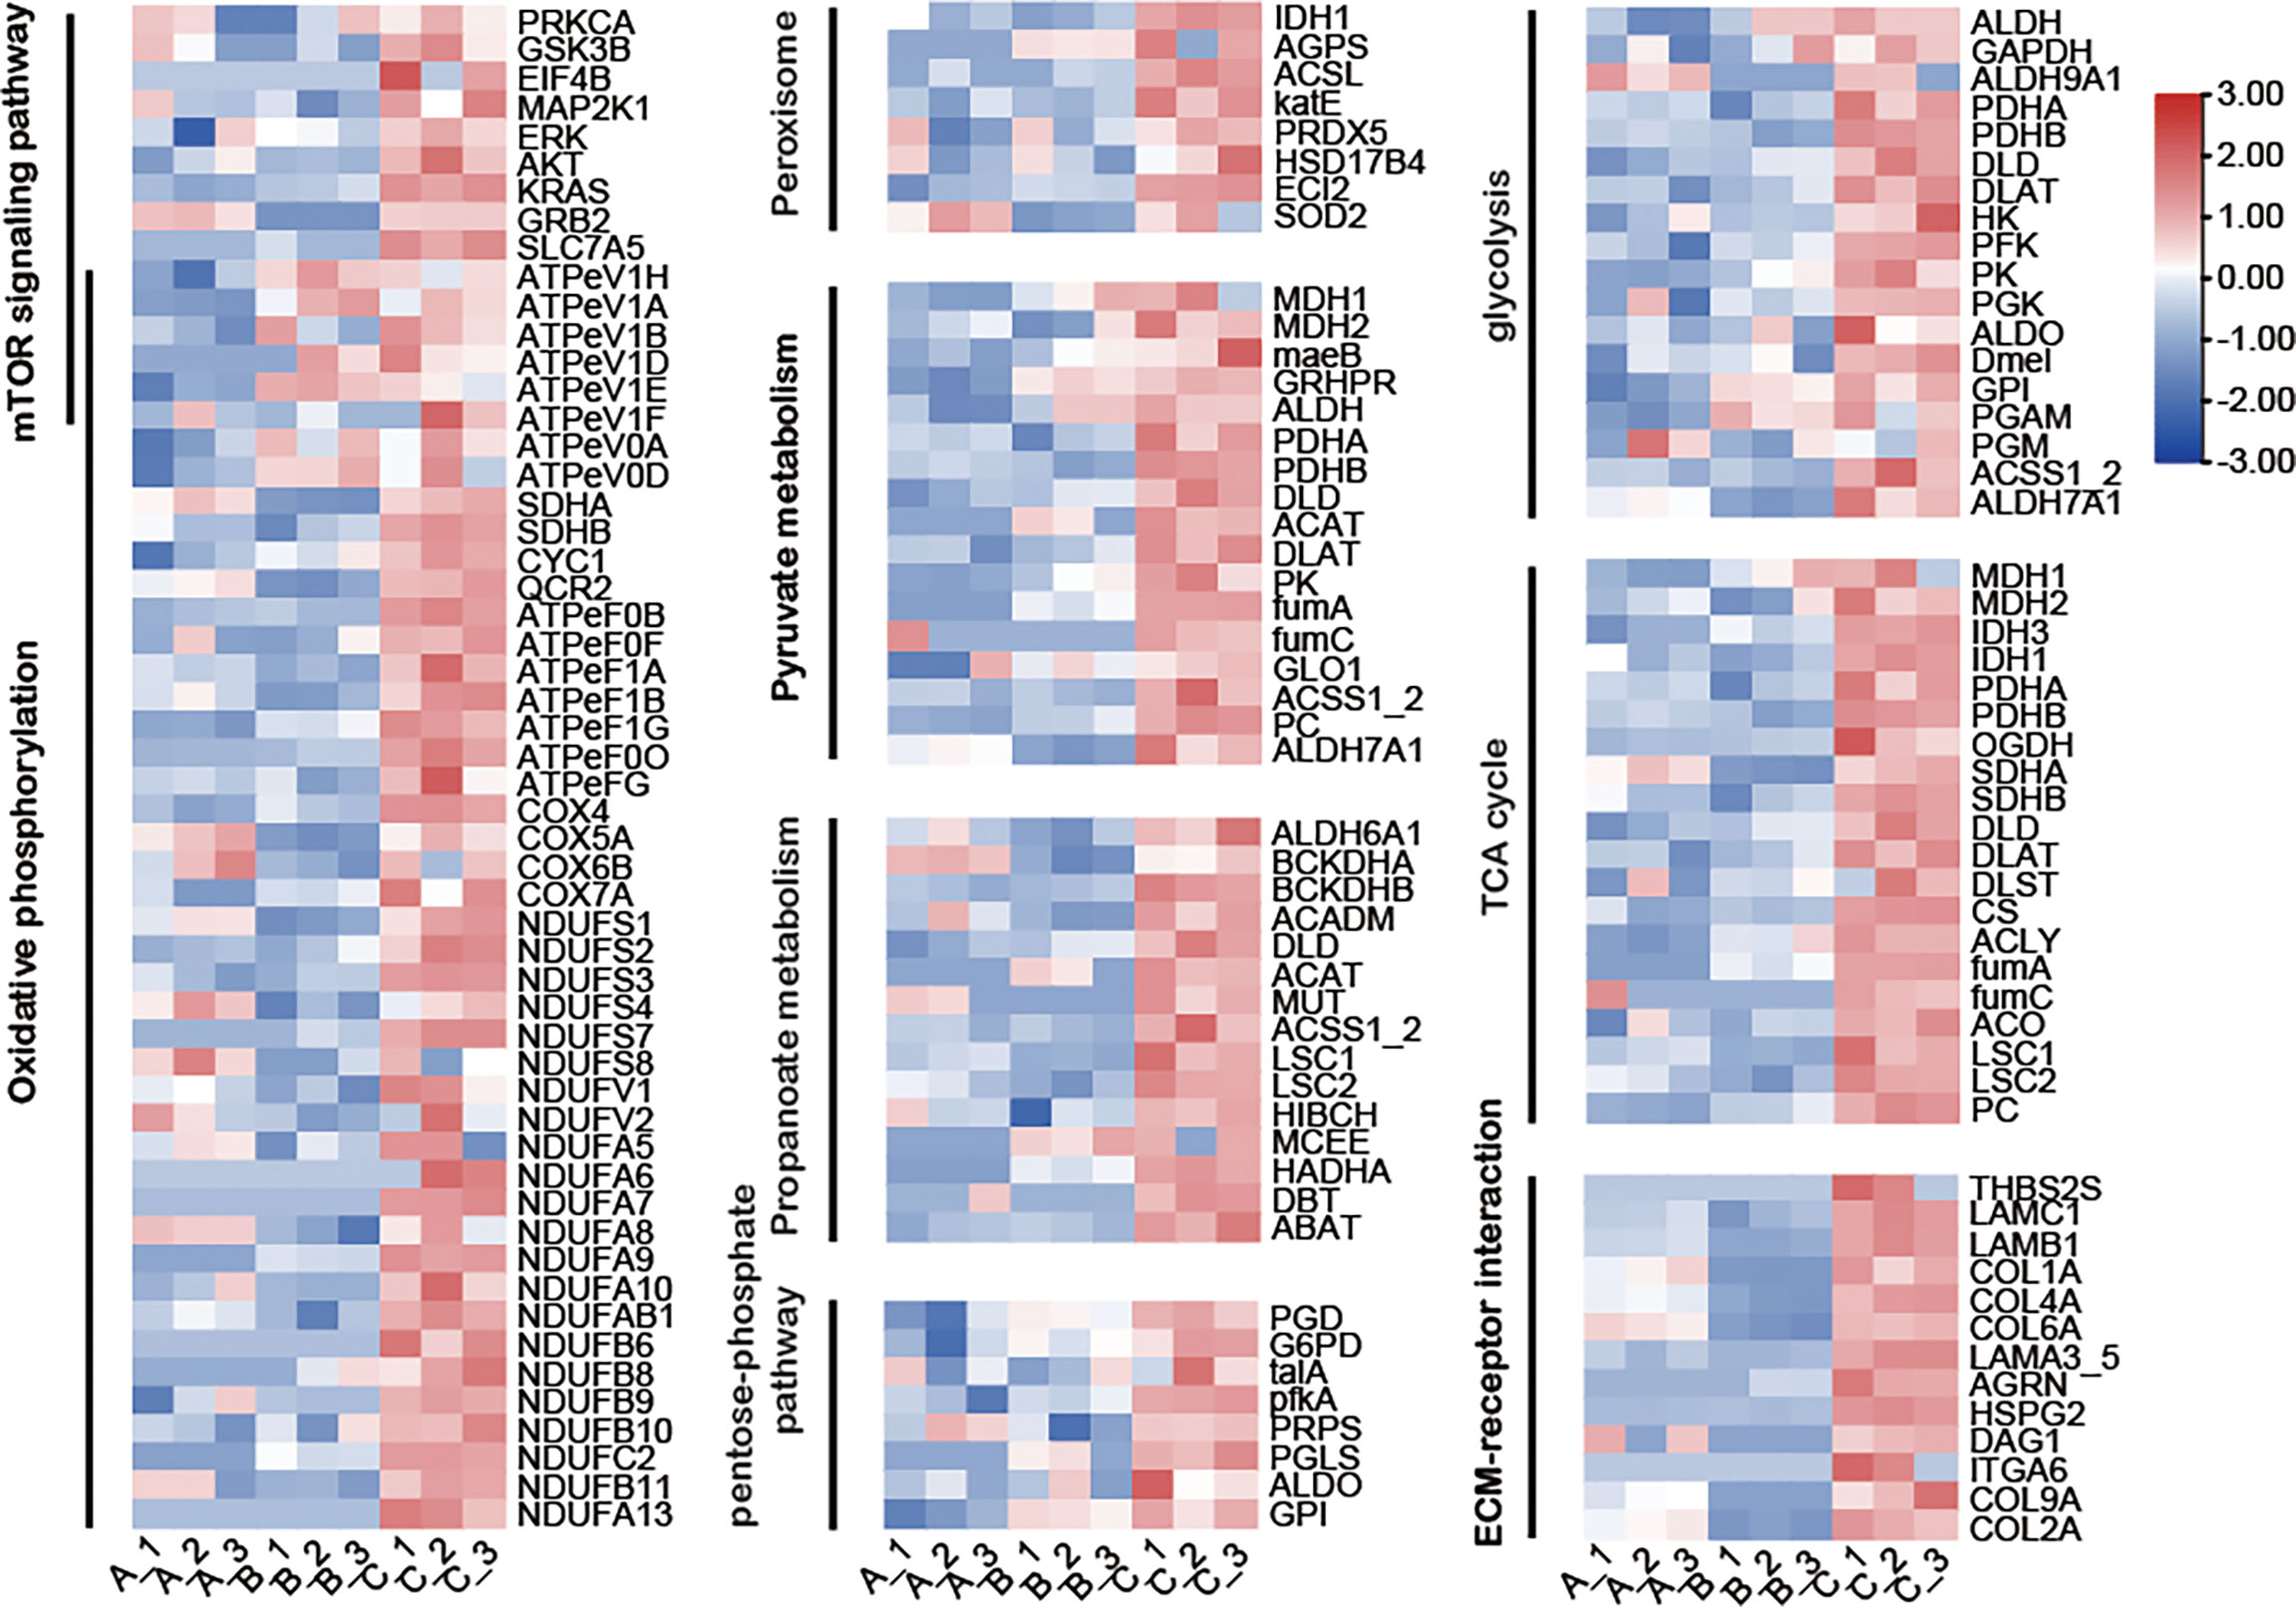
Figure 8 Heatmap showing changes in abundance of proteins in several major metabolic pathways. The color scale represents protein abundance normalized as Z-score, from blue the lowest to red the highest values. Red means up regulation, blue means down regulation.
3.5 Proteins in ECM-receptor interaction
From group A to group B, almost all the proteins enriched in the ECM-receptor interaction pathway were down-regulated, except for agrin (AGRN), thrombospondin 2/3/4/5 (THBS2S), and integrin alpha 6 (ITGA6). From group B to group C, all proteins were up-regulated. The expression levels of all proteins were the highest in group C. THBS2S and ITGA6 were only detected in group C (Figure 8).
3.6 Proteins in endocytosis and phagosome
Analyzing the DEPs involved in endocytosis between every two groups, it was found that the number of DEPs for A/B, B/C and A/C were 16, 10 and 12, respectively. Compared with group B, 13 DEPs were up-regulated and 3 DEPs were down-regulated in group A. Compared with group C, all 10 DEPs in group B were down-regulated. Compared with group C, 4 DEPs were up-regulated and 8 DEPs were down-regulated in group A (Figure 9).
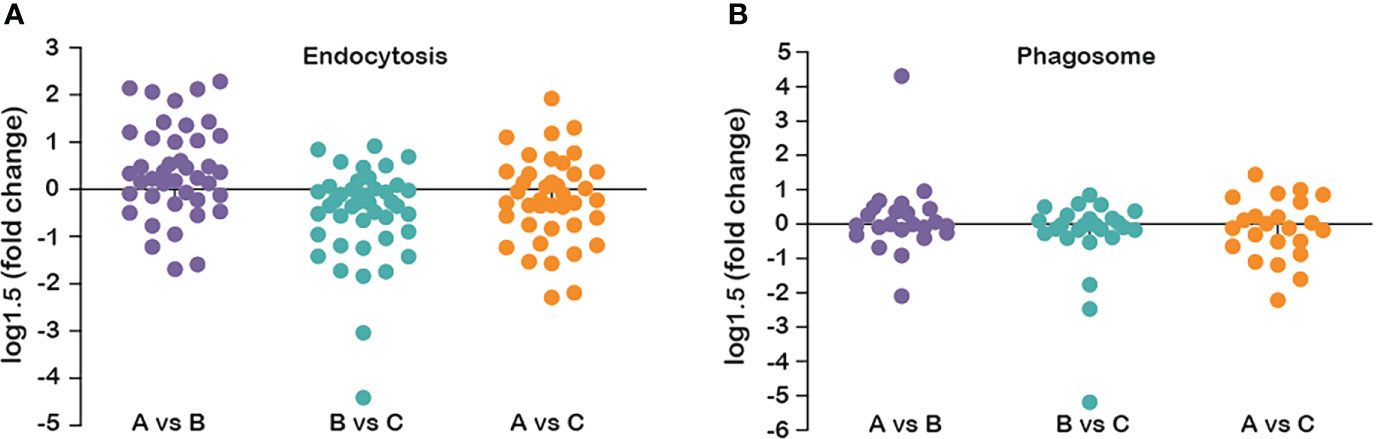
Figure 9 Fold changes in protein abundance in the phagosome and endocytosis pathways at three stages. (A) in the phagosome pathway; (B) in the endocytosis pathway.
3.7 Proteins in aging-related pathways
Kegg enrichment of DEPs revealed that several aging-related signalling pathways were enriched, including mTOR, cGMP/PKG, Wnt, MAPK, and PI3K/Akt signalling pathways (Figure 5). The analysis of DEPs in these signalling pathways showed that the expression of proteins in mTOR and Wnt signalling pathways in group C was higher than that in the other two groups (Figure 8). In contrast, the expression of proteins in cGMP - PKG and PI3K Akt signalling pathways decreased gradually (Suppelementary Table 4), among which Na+/K+ ATPase alpha subunit (ATP1A), mitochondrial ADP/ATP carrier proteins (SLC25A4S), heat shock protein 90 alpha family class A member 1 (HSP90AA1), heat shock protein 90 alpha family class B member 1 (HSP90AB1) and tyrosine3-monooxygenase/tryptophan 5-monooxygenase activation protein epsilon (YWHAE) were detected only in group A. In the MAPK signalling pathway, the expression levels of Ras-related GTPase (RAP1A) and fibroblast growth factor receptor 4 (FGFR4) proteins increased gradually, while heat shock 70kDa protein 1/2/6/8 (HSPA1s) was detected only in group A (Suppelementary Table 4).
3.8 Other major metabolism pathways
Based on KEGG annotation and protein abundance, we found that almost all proteins in the peroxisome, pyruvate metabolism and propanoate metabolism pathways were more abundant in group C than in the other two groups (Figure 8).
3.9 Quantitative validation by qRT-PCR
To further verify the results for protein expression, fifteen representative genes related to aging-related pathways, namely CALM2, RhoA, PPP3C, CAMK2, PLCB, Rap1A, GNB1, ATPeV1E, ATPeV1G, GRB2, KRAS, MAP2K1, AKT, GSK3B and CTSD were quantified using qRT-PCR. The results indicated that the mRNA expression levels of most genes showed a consistent alteration tendency with the corresponding proteins; however, RhoA and ATPeV1G showed a disparity between mRNA expression and protein abundance (Figure 10, and Supplementary Table 4).
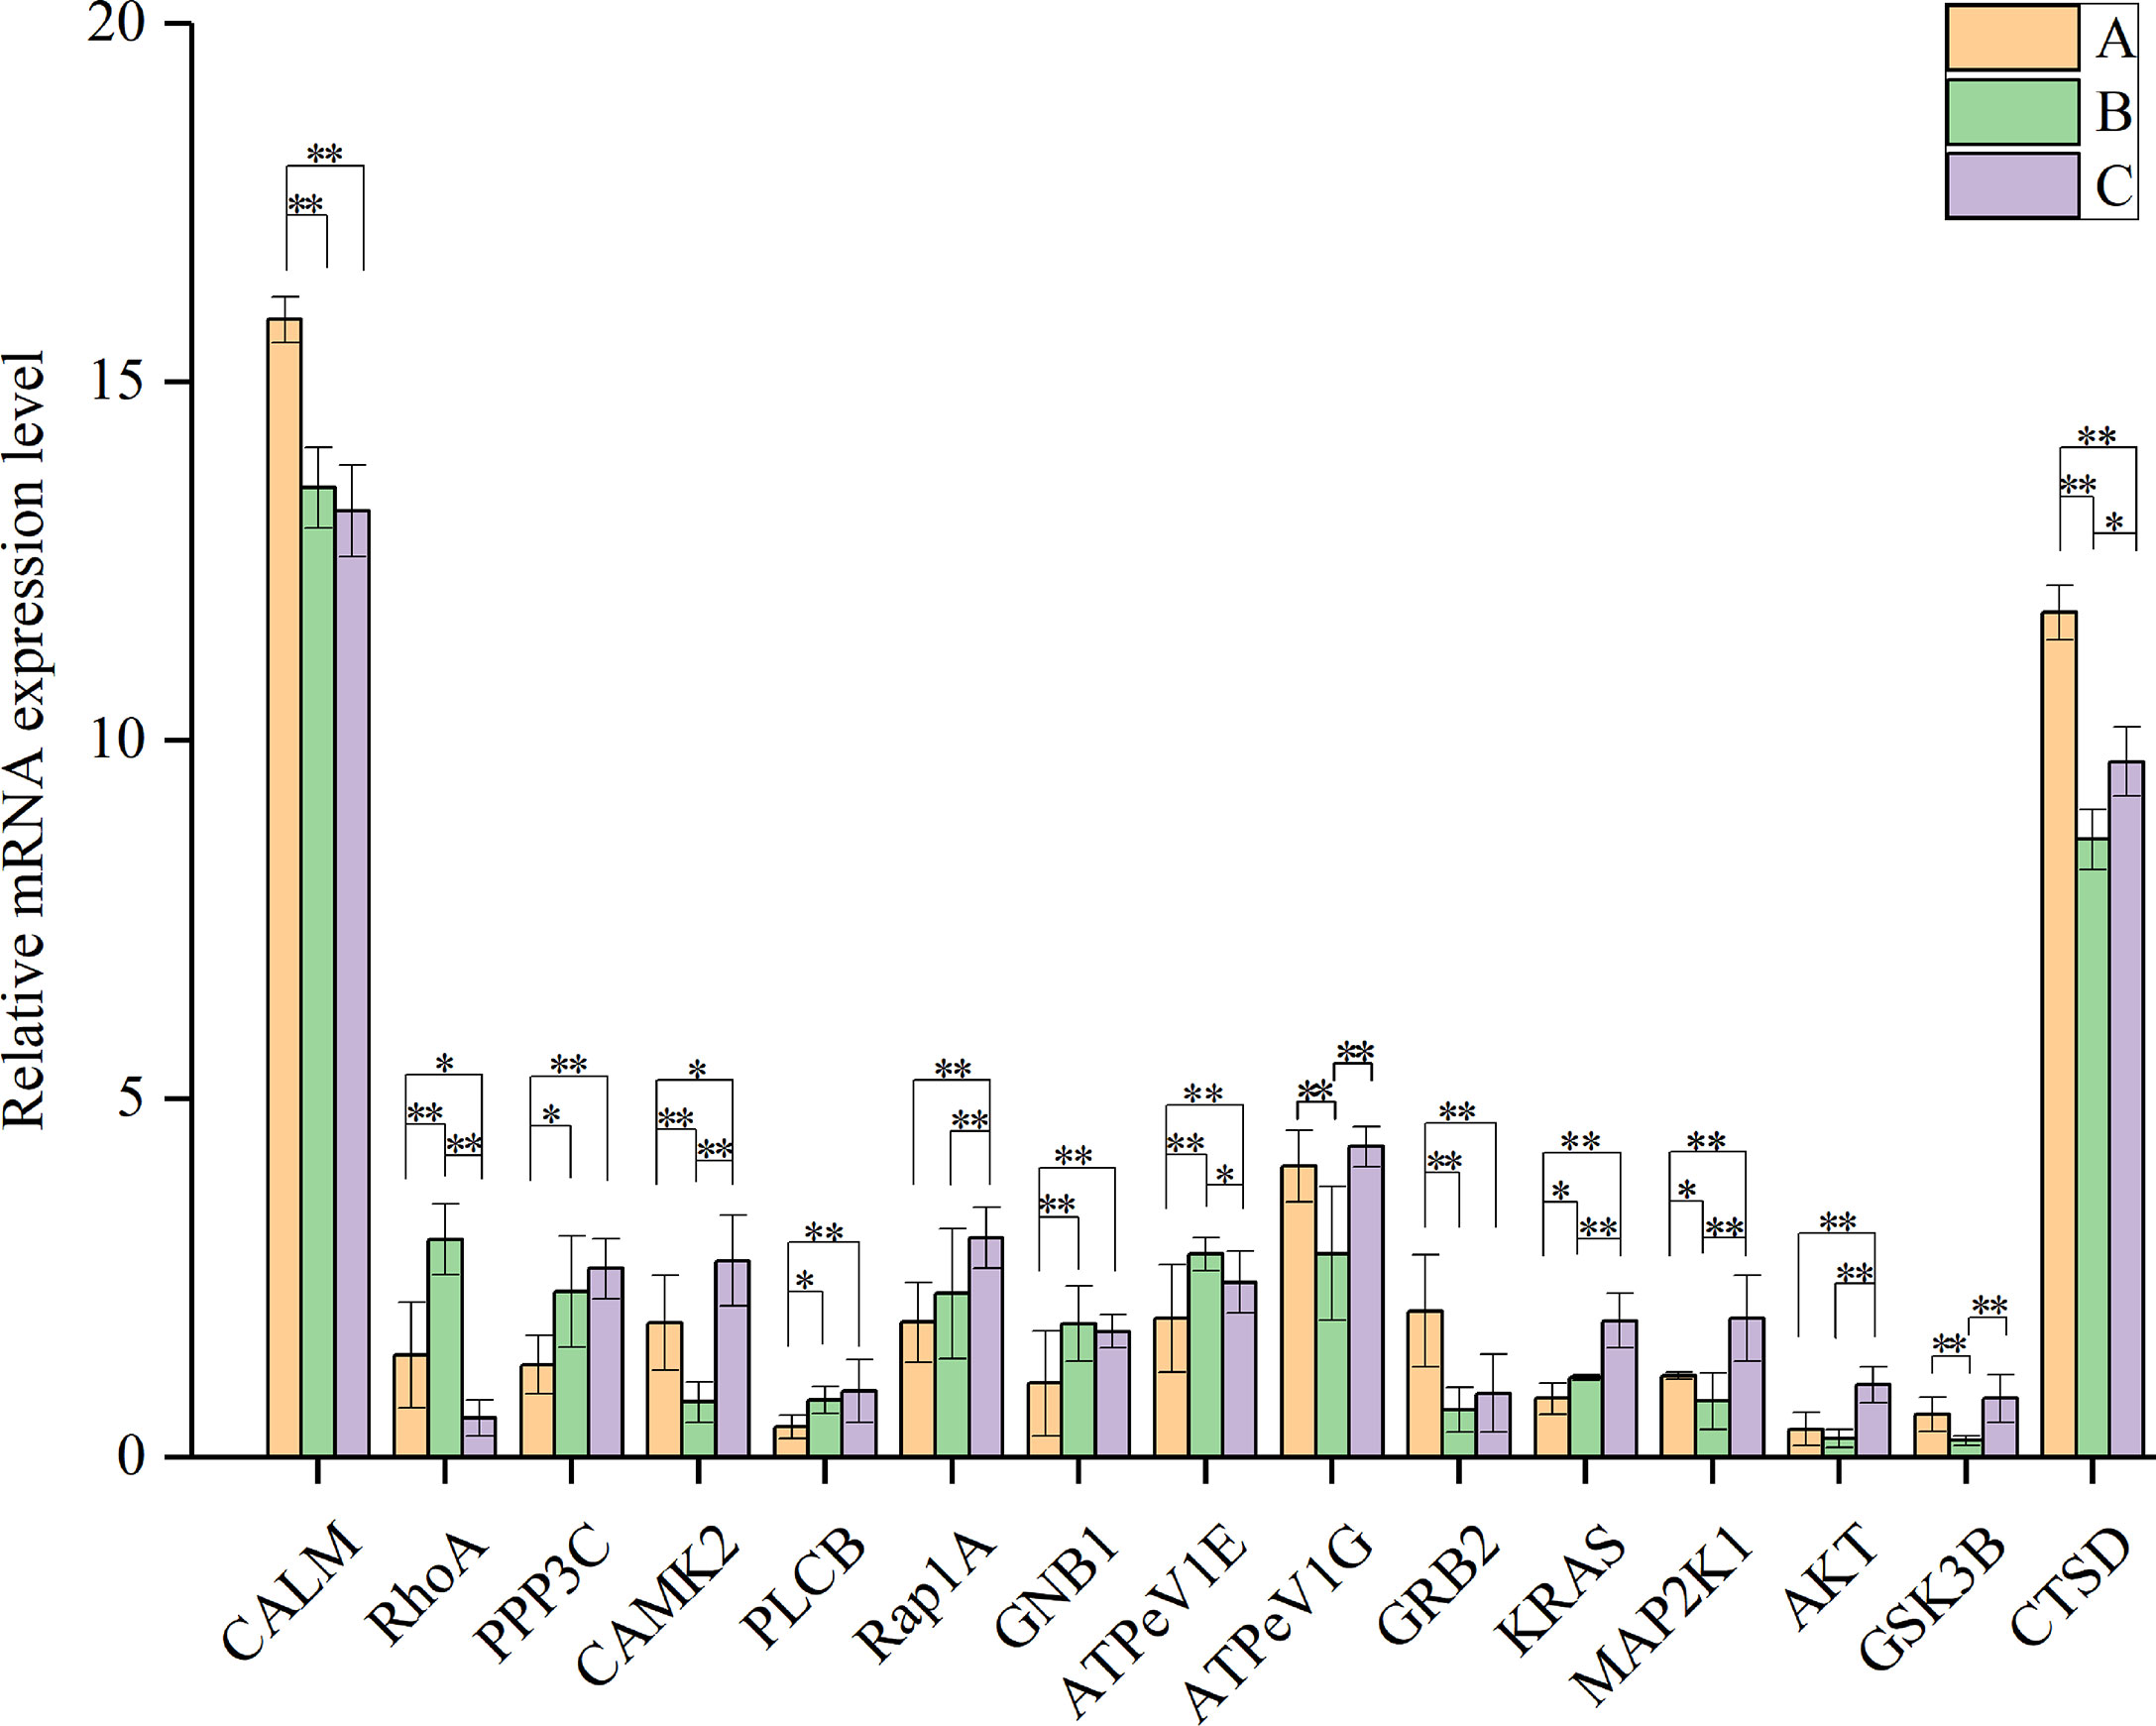
Figure 10 Relative mRNA level of genes encoding proteins involved in aging-related pathways. CALM: calmodulin; RhoA: Ras homolog gene family, member A; PPP3C: serine/threonine–protein phosphatase, catalytic subunit; CAMK2: calmodulin–dependent protein kinase II; PLCB: phospholipase C, beta; Rap1A: Ras–related protein 1A; GNB1: guanine nucleotide-binding protein, subunit beta–1; ATPeV1E: V–type H+–transporting ATPase subunit E; ATPeV1G: V–type H+–transporting ATPase subunit G; GRB2: growth factor receptor–binding protein 2; KRAS: GTPase KRas; MAP2K1: mitogen–activated protein kinase kinase 1; AKT: RAC serine/threonine–protein kinase; GSK3B: glycogen synthase kinase 3 beta; CTSD: cathepsin D. “*” and “**” indicate significant differences at P<0.05 and P<0.01, respectively. Data are presented as mean ± S.D. from three independent biological replicates.
4 Discussion
4.1 Correlation between GO terms and protein function
According to the GO annotation, we found that the GO terms were similar among the different groups. Regarding biological processes, the GO terms with the largest number of DEPs were related to “cellular”, “metabolic”, and “single-organism” processes. In the context of cellular components, enriched GO terms referred to “cell”, “cell part”, and “organelle” (group B vs group A)/”membrane” (group B vs group C, and group C vs group A). Lastly, regarding molecular functions, most of the DEPs were grouped as “binding”, “catalytic activity”, and “structural molecular activity” (group B vs group A, and group B vs group C)/”transporter activity” (group C vs group A) (Figures 4A, C, E).
To better explain the results of GO annotation, we further performed GO enrichment and COG analyses. In the comparison between groups A and B, the main enriched GO terms were “structural molecular activity”, “ribosome”, and “gene expression” (Figure 4B; Table 2). Among these, “structural molecular activity” also appeared in the GO annotation, while “ribosome” corresponded to “organelle” in the GO annotation. This data analysis indicated that the activity of some genes, ribosomes and proteins increased from the period of sexual maturity to spawning (manifested as the enrichment of “structural molecular activity”). Regarding the comparison between groups B and C, the main enriched GO terms were “peptidase inhibitor activity”, “peptidase regular activity”, and “extracellular region part” (Figure 4D and Table 2). In particular, two terms were related to peptidase, which were also involved with “catalytic activity” in the molecular function that appeared in GO annotation. Such results illustrate that the activity of peptidase has increased from the period of spawning to death, where some changes had also taken place in the part of the extracellular region.
The homeostasis of S. japonica gradually becomes unstable after spawning. According to the comparison between groups A and C, the main enriched GO terms were “calcium ion binding”, “cation binding”, and “metal ion binding” (Figure 4F; Table 2). Correspondingly, a representative number of DEPs were annotated in “transport activity” and “membrane”. Calcium ions act as second messengers in signal transduction pathways, so the large number of DEPs in these GO terms (i.e., group C vs group A) indicate that major changes in metabolic pathways potentially occur after the spawning of S. japonica.
Protein function analyses by COG have shown a large number of DEPs involved in “signal transduction mechanism”, as well as “posttranslational modification, protein turnover, chaperones”, indicating that calcium ion indeed plays an important role in the aging process of S. japonica. Secondly, many DEPs were related to “energy production and conversation”, and “intracellular trafficking, secretion, and vesicular transport”. These results correspond to the fact that many DEPs appeared in cellular and metabolic processes based on the GO annotation. Moreover, the number of DEPs in “translation, ribosome structure and biogenesis” (group C vs group A comparison) was much lower than that observed in other comparative analyses (i.e. group B vs group A, or group B vs group C). These results indicate that the activity of protein synthesis decreased significantly after spawning (Figures 7A, B, C).
4.2 Significantly enriched pathways detected upon the comparison between S. japonica groups
KEGG enrichment analysis was performed to screen key pathways during aging process. The results of this analysis indicated that the enriched pathways were distinct for each group (Figures 5B, D, F and Table 3). In the comparison of group B versus group C, the most significant enrichment pathway was “ribosome”, which contained the largest number of DEPs. This result was consistent with the KEGG pathway annotation. We presume that ribosome activity increases due to a large requirement for protein acquisition before spawning. In addition, “Spliceosome” and “Parkinson’s disease” pathways were also significantly enriched, but both contained a fewer number of DEPs. The spliceosome is a macromolecular complex, comprised of five small ribonucleoproteins (U1, U2, U4, U5, and U6) and numerous proteins (Will and Lührmann, 2011), which are responsible for the intron removal of pre-RNAs (splicing) and further maturation of the transcripts (Valadkhan, 2005; Wachtel and Manley, 2009). In the present study, most spliceosome-related proteins were down-regulated during spawning relative to the other two stages. We hypothesize that this down-regulation could be the main reason that the ribosome activity of S. japonica decreases during spawning. In humans, Parkinson’s disease is a long-term degenerative disorder of the central nervous system (CNS). In this case, the midbrain cells of affected patients are typically compromised, therefore affecting the locomotor system. We noticed that DEPs from the “Parkinson’s disease” pathway were concentrated in the mitochondria, and all of them were down-regulated. Among these DEPs, some were able to inhibit ATP production. The mitochondrial activity appears to increase to further reconstitute ATP levels that were reduced due to the inhibition of ATP synthesis. Ultimately, this process would also produce increased amounts of ROS, which could potentially lead to cell apoptosis.
In the comparison between group B versus group C, “selenocompound metabolism”, “propanoate metabolism” and “ECM-receptor interaction” were the most notably enriched pathways (Figure 5D). Selenocompounds (i.e., compounds containing selenium or seleno-substances) have activities similar to glutathione peroxidase (GSH-Px), therefore acting as a putative antioxidant and/or anti-aging molecules. Under certain conditions, selenium is also capable of preventing cancer progression (Domínguez-Álvarez et al., 2016; Bartolini et al., 2017; Gopalakrishna et al., 2018). In our study, all DEPs presented in the “selenocompound metabolism” pathway were up-regulated. Coincidently, all DEPs involved in “Propanoate metabolism” were also up-regulated (Figure 8). “Propanoate metabolism” is an alternate metabolic pathway which starts with the processing of propanoate to propanoyl coenzyme A (propanoyl-CoA). Propanoyl-CoA is further converted into succinyl-CoA, an intermediate of the citric acid (TCA) cycle. It has been demonstrated that the activity of the TCA cycle is enhanced and, consequently, energy supply is increased during the spawning of S. japonica.
Extracellular matrix (ECM) is a complex three-dimensional network of extracellular macromolecules, such as enzymes, glycoproteins, and collagen (Theocharis et al., 2019). ECM provides a suitable place for cell survival, and it can influence cell shape, function, metabolism, migration and differentiation through signal transduction cascades (Sever and Brugge, 2015). After comparison with group C, most of the DEPs in the “ECM-receptor interaction” pathway were significantly down-regulated in group B (Figure 8). Changes in protein content related to these pathways indicated that the increase of cell activity in S. japonica may have occurred between pre- to post-spawning. Therefore, the energy supply provided by the CCM was enhanced and more ROS were produced. To prevent the damage caused by ROS in cells, the expression of peroxisomes and selenocompounds concomitantly increased to counterbalance cell aging and pro-apoptotic events. In addition, the “ECM-receptor interaction” pathway was also significantly enriched after the comparison of group C versus group A, where most of the DEPs were significantly up-regulated in group C. Similar results were obtained in group B versus group C comparison, reiterating the increase of cell activity in cuttlefish after spawning. Furthermore, the “glyoxylate and dicarboxylate metabolism” and “mitophagy-animal” pathways were more significantly enriched than other pathways in the comparison between group C versus group A, similar to the “ECM-receptor interaction” pathway. The former pathway can affect the TCA cycle, pyruvate and purine metabolism, so many DEPs were up-regulated in group C. The latter pathway was also related to mitochondrial autophagy (mitophagy). Mitophagy plays an important role in maintaining cell health. Under normal conditions, mitophagy can selectively remove damaged mitochondria, adjust mitochondrial content, and change cellular metabolic needs (Youle and Narendra, 2011). In case mitophagy is altered, the number of damaged mitochondria may increase. Furthermore, damaged mitochondria lead to ATP depletion and release of cytochrome C, promoting caspase activation and the onset of apoptosis. Our results showed that most of the DEPs involved in this pathway solely appeared in group C, suggesting an increase in mitophagic activity. However, according to the KEGG mapping of this pathway, the function of many proteins in this pathway can be suppressed by hypoxia. Coincidently, S. japonica quietly lives underwater after spawning, which may lead to hypoxic effects. The function of this pathway may be inhibited because of hypoxia. So, we inferred that the up-regulated protein did not play its role well, and cell apoptosis continued.
4.3 Ca2+-related DEPs and their involvement with aging progress
Several aging-related pathways were identified via KEGG analysis (Figure 5), such as cGMP/PKG, Wnt, MAPK, PI3K/Akt and mTOR signalling pathways (Supplementary Table 4). DEPs from each group were eventually present in these pathways, and up-or down-regulation of the proteins could affect the function of related pathways.
Calcium (Ca2+) plays an important role as a second messenger by regulating some aspects of cellular signalling (McAinsh et al., 1997). Calmodulin is the major intracellular Ca2+ receptor in many cells. Calmodulin can activate a lot of enzymes in response to Ca2+ and regulate a series of biological processes, such as the assembly and disassembly of microtubules, by controlling the activity of protein kinases (Klee et al., 1980; Hanson and Schulman, 1992). At distinct growth stages, the abundance of calmodulin as well as of related proteins continued to decline significantly. The decrease of calmodulin levels indicates a decrease on Ca2+ which could lead to the imbalance of various biological processes. Orexin A is an appetite-stimulating neuropeptide that can increase Ca2+ in the orexigenic hormone neuropeptide Y (NPY)-producing hypothalamic neurons via Ca2+ channels (Wu et al., 2013), to further active calcium/calmodulin-dependent protein kinase mitophagy 2 (CAMKK2) (Marcelo et al., 2016). Previous studies have shown that the NPY expression was reduced in mice devoid of CAMKK2, which consequently consume less food (Anderson et al., 2008). Besides, calcium/calmodulin-dependent protein kinase (CAMK) is associated with protective functions against cerebrovascular damage. Defects of CAMKK2 and CAMK IV in mice lead to brain injuries and behavioral deficits (McCullough et al., 2013; Liu et al., 2014). In our present study, the abundance of calcium/calmodulin-dependent protein kinase II (CAMK2) decreased in group B and increased significantly in group C. The large number of CAMK2 expressed in group C is unsatisfactory due to the decrease of calmodulin abundance. Moreover, the function of CAMK2 is related to CAMKK2, which may reduce the appetite and activity ability of S. japonica after spawning.
4.4 DEPs involved in energy supply
CCM is the main source of energy required by organisms and provides precursors for other metabolism (Eylem et al., 2022). The occurrence of animal diseases and the emergence of plant adversity are usually accompanied by severe metabolic disorders, which are mostly attributed to CCM disorders. CCM also affects the function of immune cells and is associated with disease resistance and immune responses (Cheng et al., 2014). Most of the energy released by CCM is stored in reductive coenzymes, and only a small part is directly formed into ATP through substrate phosphorylation. The energy in reductive coenzyme needs to be synthesized by oxidative phosphorylation before it can be utilized (Moore et al., 2020). In this study, the rate-limiting enzymes of the three CCM pathways were all upregulated at spawning than pre-spawning, although most of the enzymes did not differ significantly during these two growth periods, suggesting that the optic glands of S. Japonica require more energy at spawning than pre-spawning. This may be because S. Japonica’s optic gland synthesizes and secretes hormones that regulate spawning. After spawning, the CCM pathway and oxidative phosphorylation pathway-related enzymes of the S. Japonica optic gland were almost all up-regulated, and the energy metabolism was highly active, indicating that the metabolic activity of the S. Japonica optic gland was further enhanced after spawning, which may involve hormone synthesis and secretion (7), ECM synthesis and secretion, cell growth and so on.
Glycolysis is one of the most ancient metabolic pathways for energy production in living cells (Yellen, 2018) and a primitive metabolic pathway that is easily exploited by cancer cells for energy to grow and spread (Fadaka et al., 2017). Many studies have shown that cancer cells switch from getting energy from normal cells through aerobic respiration to glycolysis or burning sugar (Garber, 2006; Devic, 2016). Glycokinase 2 (HK2), phosphofructase (PFK), M2-type acetone kinase (PKM2) and other key enzymes in glycolysis have become tumor markers, and their expression and activity can affect tumor glycolysis and thereby affect tumor proliferation (Kumar et al., 1996; Sattler et al., 2010; Shi et al., 2010). In this study, most proteins in the glycolysis process were up-regulated, especially the key enzyme phosphofructokinase (PFK) was significantly up-regulated, which indicated that the glycolysis process in the optic gland of S. japonica was significantly enhanced after spawning. This may indicate that the S. japonica’s immunity degenerates due to aging after spawning, resulting in tumors, which has been reported in some salmon studies (Morrison and Macdonald, 1995).
4.5 Effect of Ras-related proteins in the cell cycle of S. japonica
The Ras superfamily is composed of a series of small GTPases, divided in five main GTPase families (Ras, Rho, Ran, Rab, Arf), which are largely involved in the regulation of cell division (Wennerberg et al., 2005). The Ras family mainly impacts cell proliferation, while Rho is involved in cell morphology, Ran in nuclear transport, and both Rab and Arf have roles in vesicle transport (Munemitsu et al., 1990). RhoA is a small GTPase protein from the Rho family, whose main function is to regulate cell division and cytoskeleton as well as to control the activity of other signalling pathways through various cytokines. KRAS was the first Ras member identified as a p21 GTPase (Kranenburg, 2005). KRAS is usually tethered to cell membranes and is an early player in many signal transduction pathways, usually acting as a switch in cell signalling. KRAS controls cell proliferation under normal conditions and, when mutated, functions as an oncogene. In our current study, the expression of both RhoA and KRAS were also observed (Supplementary Table 4). The content of RhoA and KRAS in groups A and C did not show a significant change but still, it was significantly up-regulated in group C.
Furthermore, Rap-1A (another member of the Ras family) was detected in all groups, but significantly up-regulated in group C. Some studies have demonstrated that Rap-1A can interact with c-Raf (Han and Colicelli, 1995; Nassar et al., 1995; Okada et al., 1999). RAF kinases can be activated by the interaction with RAS-GTPases. RAF kinases consist of three serine/threonine protein kinases (related to retroviral oncogenes) which participate in the MAPK cascade (Roskoski, 2010). Excessive activation of the MAPK cascade may result in excessive cell proliferation and tumor formation. MAPK and AKT were also observed in all groups and showed a similar abundance trend. Both are serine/threonine protein kinases, involved in adjusting cellular response to a diverse array of stimuli. Therefore, MAPK and AKT regulate a series of cell functions including gene expression, mitosis, cell proliferation, cell migration and apoptosis. MAP2K is located upstream of MAPK and plays a role in activating MAPK enzymatic activity. MAP2K was detected in all groups here analyzed. The proteins discussed above are involved in Wnt, MAPK and mTOR signalling pathways. In addition to their role in aging, these pathways are also involved in tumor formation. The increased expression of these proteins in group C indicates that the cell cycle in S. japonica was affected, potentially leading to abnormal cell proliferation and tumor formation.
4.6 DEPs involved in phagosome and endocytosis
It is worth mentioning that the “phagosome” and “endocytosis” pathways included many DEPs originated from the comparison of group C vs group A, where the number of up-regulated proteins was more prominent than the amount of down-regulated proteins (Figure 9). Phagosomes are key organelles present in macrophages and participate in a series of physiological events such as tissue remodeling, clearance of apoptotic cells, and control of pathogen proliferation inside cells (Garin et al., 2001; Pauwels et al., 2017). Phagosome formation is essential for body homeostasis, particularly in the innate and adaptive host defense against pathogens (Levine and Deretic, 2007; Lee et al., 2020). The change of DEPs in the “phagosome” pathway in different growth stages suggests that the phagosome activity may increase continuously, which potentially reflects the imbalance of homeostasis in S. japonica after spawning. In fact, at this stage, the cuttlefish is more susceptible to various external factors, like viruses and other pathogenic microorganisms. Therefore, an increase in phagosome activity is possibly required to maintain certain body functions. Endocytosis is a general term describing a process by which cells absorb external material by engulfing it with the cell membrane (Flaherty, 2014). The endocytosis activity of optic gland cells reached the highest after spawning, which may be because the S. japonica stopped feeding after spawning, and the cells maintained their function by enhancing endocytosis and increasing nutrient uptake (Duffney et al., 2020).
4.7 Na+/K+ ATPase and cellular homeostasis
Na+/K+ ATPase is a type of enzyme that is embedded in the cell membrane. This ATPase has both carrier and enzymatic activities, so it plays an important role in many aspects of the cell homeostasis and energy supply, such as (i) catalyzing ATP hydrolysis, (ii) transporting Na+ and K+ to both sides of cell membrane to maintain membrane potential, (iii) regulating the cellular osmotic pressure, and (iv) promoting impulse conduction on nerve cells (Gorini et al., 2002). Na+/K+ ATPase consists of two subunits (α and β), the α subunit possesses the ATPase activity as well as Na+ and K+ binding sites. According to our results, the α subunit of Na+/K+ ATPase was present in group A (Supplementary Table 4), but it was not detectable in groups B and C. So, we can infer that S. japonica has failed to synthesize Na+/K+ ATPase during the stages of spawning and postspawning. Accordingly, the S. japonica cannot provide enough energy due to the lack of Na+/K+ ATPase, so a large amount of energy consumption by spawning may jeopardize the whole homeostasis. Hypoxia and starvation can also reduce the activity of Na+/K+ ATPase (Sandiford et al., 2004). The S. japonica stops feeding and remains underwater after spawning. Coincidentally, such behavior may lead to hypoxia and starvation, which further limits the function of Na+/K+ ATPase and may speed up the death of S. japonica.
4.8 Heat shock proteins and cellular protein homeostasis
Heat shock proteins (HSP) are among the most highly expressed cellular proteins across all species (Csermely et al., 1998). In group A, HSP70 and HSP90 expressions were detected (Supplementary Table 4). The molecular chaperone HSP70 can interact with ribosomes and control protein quality, together with the ribosome-associated complex (RAC) and the nascent polypeptide-associated complex (NAC) (Gautschi et al., 2001; Rakwalska and Rospert, 2004; Preissler and Deuerling, 2012). Importantly, HSP70 play a significant role in overall cellular homeostasis. For instance, HSP70 can help matrix proteins to cross over the mitochondrial inner membrane, in an ATP-dependent manner (Neupert and Herrmann, 2007; Bolender et al., 2008; Kutik et al., 2009), and later fold and assemble into protein complexes. Under resting conditions, HSP90 has similar functions that mainly include (i) protein folding, (ii) intracellular transport, (iii) cellular structure maintenance, (iv) control of protein degradations and (v) modulation of cell signalling (Paul and Mahanta, 2014). However, no HSP70 and HSP90 expression was detected in groups B and C. As a result, the protein homeostasis of S. japonica during spawning was certainly affected. After spawning, the continued lack of HSP can continuously damage protein homeostasis, which may lead to the absence of mitochondrial matrix proteins and, ultimately, to mitochondrial malfunction. Newly emerging and nascent polypeptide chains become defective/unfolded proteins in the absence of HSP70 and respective molecular chaperones. The turnover of certain defective/unfolded proteins can be eventually limited. Ubiquitin is a small protein that marks the proteins to degradation (Hershko and Ciechanover, 1998). Proteins can be ubiquitinated through the synergy of ubiquitin activating-enzymes (E1), ubiquitin conjugating-enzymes (E2) and ubiquitin ligases (E3) (Amm et al., 2014; Ji and Kwon, 2017). After ubiquitination, proteins are frequently degraded by proteasomes with the support of HSP70 and its molecular chaperones (Demand et al., 2001). Interestingly, the abundance of the skp1 component of ubiquitin ligase continuously increased in both groups B and C (Supplementary Table 4), but it was not detectable in group A. Upon comparison with group B, the abundance of ubiquitination-related components showed no significant up-regulation in the group C. These analyses indicate that the amount of non-functional proteins in S. japonica increased during the spawning process. In the meantime, “useless” proteins that were tagged by ubiquitin failed to be promptly degraded due to the absence of HSP70, which also resulted in the increased expression of ubiquitin ligases and the further abundance of non-functional proteins. As previously stated, we can infer that the imbalance on protein homeostasis occurs in the postspawning stage, which can accelerate the aging process in S. japonica.
4.9 CTSD and other DEPs involved in aging-related pathways
Additional proteins have also shown significant changes between different groups, such as PLCB, SEC13, CTSD and others (Supplementary Table 4). It is worth mentioning that an antibacterial effect may exist in CTSD synthesized in vitro. In the current work, the expression of CTSD was significantly down-regulated in group B only, with no significant differences between group A and group C. We inferred that this could be a strategy for cuttlefish to cope with issues related to distinct body aspects after spawning. Regarding the significant decrease of CTSD levels during spawning, more in-depth studies are warranted. Most of the proteins shown in Supplementary Table 4 are not exclusive to aging-related signalling cascades, since they may also impact other pathways. The significant up- or down-regulation between different groups, in addition to the close interaction between different pathways, indicate that the aging process of S. japonica after spawning is a complex process that deserves more detailed investigations.
5 Conclusion
In this study, many proteins typically involved in aging-related pathways were identified using a label-free proteomic approach. Bioinformatics analyses showed that energy metabolism, stress response and cell proliferation of S. japonica optic gland changed significantly at different stages of spawning. Compared with the stage of pre-spawning, the energy metabolism of the S. japonica optic gland increased after spawning, cells showed signs of over-proliferation. This effect was possibly due to cell cycle dysregulation, which is a classic feature of cancer. The cell cycle dysregulation is usually accompanied by homeostasis imbalance, which can lead to a weakening of the stress response against the environment. In a way, the cuttlefish at this stage would be more vulnerable to pathogen infection, but further experiments are needed to verify this assumption. In addition, our study also showed that S. japonica optic gland cells may supplement the required nutrients and maintain cell function by enhancing endocytosis and phagosome activity after spawning.
The rapid aging and death of S. japonica after spawning is a very complex process that involves many internal factors related to energy metabolism, cell cycle regulation, immunity, protein homeostasis, as environmental conditions such as temperature, stress and food. Our study provides some reasoning for the phenomenon of spawning, at the level of proteomics, and paves the way for further scientific studies.
Data availability statement
The datasets presented in this study can be found in online repositories. The names of the repository/repositories and accession number(s) can be found below: http://www.proteomexchange.org/, PXD033041.
Ethics statement
The animal study was reviewed and approved by Animal Care and Use Ethics Committee of Zhejiang Ocean University.
Author contributions
BG, KX designed the study; HL, SL, MF collected samples; HL, PQ, SL, JW analyzed data; HL, HH, ZD wrote the manuscript. All authors contributed to the article and approved the submitted version.
Funding
This work was funded by the National Key R&D Program of China (2019YFD0901204), the Hong Kong, Macao and Taiwan Science and Technology Cooperation Project (2014DFT30120), the Zhejiang Provincial Natural Science Foundation of China (Y14C190008), and the National Natural Science Foundation of China (No. 31101937, No. 31872547).
Conflict of interest
The authors declare that the research was conducted in the absence of any commercial or financial relationships that could be construed as a potential conflict of interest.
Publisher’s note
All claims expressed in this article are solely those of the authors and do not necessarily represent those of their affiliated organizations, or those of the publisher, the editors and the reviewers. Any product that may be evaluated in this article, or claim that may be made by its manufacturer, is not guaranteed or endorsed by the publisher.
Supplementary material
The Supplementary Material for this article can be found online at: https://www.frontiersin.org/articles/10.3389/fmars.2022.995691/full#supplementary-material
Supplementary Table 2 | Common proteins of the three groups.
Supplementary Table 3 | Common high abundance proteins of the three groups.
Supplementary Figure 1 | Protein identification. Peptides and proteins identified from all samples after proteome database search.
Supplementary Figure 2 | Profiling of proteins identified in the optic gland of S. japonica. Distribution of the molecular weight (A), pI (B), sequence coverage (C) and peptide counts (D).
Supplementary Figure 3 | PCA analysis of different sequencing samples.
References
Amm I., Sommer T., Wolf D. H. (2014). Protein quality control and elimination of protein waste: The role of the ubiquitin–proteasome system. Biochim. Biophys. Acta (BBA)-Molecular Cell Res. 1843 (1), 182–196. doi: 10.1016/j.bbamcr.2013.06.031
Anderson K. A., Ribar T. J., Lin F., Noeldner P. K., Green M. F., Muehlbauer M. J., et al. (2008). Hypothalamic CaMKK2 contributes to the regulation of energy balance. Cell Metab. 7 (5), 377–388. doi: 10.1016/j.cmet.2008.02.011
Balistreri C. R., Madonna R., Melino G., Caruso C. (2016). The emerging role of notch pathway in ageing: Focus on the related mechanisms in age-related diseases. Ageing Res. Rev. 29, 50–65. doi: 10.1016/j.arr.2016.06.004
Bartolini D., Sancineto L., de Bem A. F., Tew K. D., Santi C., Radi R., et al. (2017). Selenocompounds in cancer therapy: An overview. Adv. Cancer Res. 136, 259–302. doi: 10.1016/bs.acr.2017.07.007
Berdasco M., Esteller M. (2012). Hot topics in epigenetic mechanisms of aging: 2011. Aging Cell 11 (2), 181–186. doi: 10.1111/j.1474-9726.2012.00806.x
Boal J. G., Prosser K. N., Holm J. B., Simmons T. L., Haas R. E., Nagle G. T. (2010). Sexually mature cuttlefish are attracted to the eggs of conspecifics. J. Chem. Ecol. 36 (8), 834–836. doi: 10.1007/s10886-010-9816-0
Bolender N., Sickmann A., Wagner R., Meisinger C., Pfanner N. (2008). Multiple pathways for sorting mitochondrial precursor proteins. EMBO Rep. 9 (1), 42–49. doi: 10.1038/sj.embor.7401126
Brack A. S., Conboy M. J., Roy S., Lee M., Kuo C. J., Keller C., et al. (2007). Increased wnt signalling during aging alters muscle stem cell fate and increases fibrosis. Science 317 (5839), 807–810. doi: 10.1126/science.1144090
Catalano S. R., Whittington I. D., Donnellan S. C., Gillanders B. M. (2013). Using the giant Australian cuttlefish (Sepia apama) mass breeding aggregation to explore the life cycle of dicyemid parasites. Acta parasitol 58 (4), 599–602. doi: 10.2478/s11686-013-0186-y
Cheng S.-C., Joosten L. A., Netea M. G. (2014). The interplay between central metabolism and innate immune responses. Cytokine Growth factor Rev. 25 (6), 707–713. doi: 10.1016/j.cytogfr.2014.06.008
Csermely P., Schnaider T., So C., Prohászka Z., Nardai G. (1998). The 90-kDa molecular chaperone family: Structure, function, and clinical applications. a comprehensive review. Pharmacol. Ther. 79 (2), 129–168. doi: 10.1016/S0163-7258(98)00013-8
Demand J., Alberti S., Patterson C., Höhfeld J. (2001). Cooperation of a ubiquitin domain protein and an E3 ubiquitin ligase during chaperone/proteasome coupling. Curr. Biol. 11 (20), 1569–1577. doi: 10.1016/S0960-9822(01)00487-0
Devic S. (2016). Warburg effect-a consequence or the cause of carcinogenesis? J. Cancer 7 (7), 817. doi: 10.7150/jca.14274
Domínguez-Álvarez E., Gajdács M., Spengler G., Palop J. A., Marć M. A., Kieć-Kononowicz K., et al. (2016). Identification of selenocompounds with promising properties to reverse cancer multidrug resistance. Bioorg medic Chem. Lett. 26 (12), 2821–2824. doi: 10.1016/j.bmcl.2016.04.064
Duffney P. F., Embong A. K., McGuire C. C., Thatcher T. H., Phipps R. P., Sime P. J. (2020). Cigarette smoke increases susceptibility to infection in lung epithelial cells by upregulating caveolin-dependent endocytosis. PloS One 15 (5), e0232102. doi: 10.1371/journal.pone.0232102
Eng J. K., McCormack A. L., Yates J. R. (1994). An approach to correlate tandem mass spectral data of peptides with amino acid sequences in a protein database. J. Am. Soc. mass spectromet 5 (11), 976–989. doi: 10.1016/1044-0305(94)80016-2
Eylem C. C., Reçber T., Waris M., Kır S., Nemutlu E. (2022). State-of-the-art GC-MS approaches for probing central carbon metabolism. Microchem J. 172, 106892. doi: 10.1016/j.microc.2021.106892
Fadaka A., Ajiboye B., Ojo O., Adewale O., Olayide I., Emuowhochere R. (2017). Biology of glucose metabolization in cancer cells. J. Oncol Sci. 3 (2), 45–51. doi: 10.1016/j.jons.2017.06.002
Garber K. (2006). Energy deregulation: licensing tumors to grow. Am. Assoc. Advance Sci. 312, 1158–1159. doi: 10.1126/science.312.5777.1158
Garin J., Diez R., Kieffer S., Dermine J.-F., Duclos S., Gagnon E., et al. (2001). The phagosome proteome: Insight into phagosome functions. J. Cell Biol. 152 (1), 165–180. doi: 10.1083/jcb.152.1.165
Gautschi M., Lilie H., Fünfschilling U., Mun A., Ross S., Lithgow T., et al. (2001). RAC, A stable ribosome-associated complex in yeast formed by the DnaK-DnaJ homologs Ssz1p and zuotin. Proc. Natl. Acad. Sci. 98 (7), 3762–3767. doi: 10.1073/pnas.071057198
Gopalakrishna R., Gundimeda U., Zhou S., Bui H., Holmgren A. (2018). Redox regulation of protein kinase c by selenometabolites and selenoprotein thioredoxin reductase limits cancer prevention by selenium. Free Radical Biol. Med. 127, 55–61. doi: 10.1016/j.freeradbiomed.2018.05.062
Gorini A., Canosi U., Devecchi E., Geroldi D., Villa R. F. (2002). ATPases enzyme activities during ageing in different types of somatic and synaptic plasma membranes from rat frontal cerebral cortex. Prog. Neuropsychopharmacol. Biol. Psychiatry 26 (1), 81–90. doi: 10.1016/S0278-5846(01)00233-0
Guo J., Wang P., Cheng Q., Sun L., Wang H., Wang Y., et al. (2017). Proteomic analysis reveals strong mitochondrial involvement in cytoplasmic male sterility of pepper (Capsicum annuum l.). J. Proteomics 168, 15–27. doi: 10.1016/j.jprot.2017.08.013
Han L., Colicelli J. (1995). A human protein selected for interference with ras function interacts directly with ras and competes with Raf1. Mol. Cell. Biol. 15 (3), 1318–1323. doi: 10.1128/MCB.15.3.1318
Hanson P. I., Schulman H. (1992). Neuronal Ca2+/calmodulin-dependent protein kinases. Annu. Rev. Biochem. 61 (1), 559–601. doi: 10.1146/annurev.bi.61.070192.003015
Hershko A., Ciechanover A. (1998). The ubiquitin system. Annu. Rev. Biochem. 67 (1), 425–479. doi: 10.1146/annurev.biochem.67.1.425
Ji C. H., Kwon Y. T. (2017). Crosstalk and interplay between the ubiquitin-proteasome system and autophagy. Molecules Cells 40 (7), 441. doi: 10.14348/molcells.2017.0115
Klee C., Crouch T., Richman P. (1980). Calmodulin. Annu. Rev. Biochem. 49 (1), 489–515. doi: 10.1146/annurev.bi.49.070180.002421
Kranenburg O. (2005). The KRAS oncogene: Past, present, and future. Biochim. Biophys. Acta 1756 (2), 81–82. doi: 10.1016/j.bbcan.2005.10.001
Kumar A., Goel A. S., Hill T. M., Mikolajczyk S. D., Millar L. S., Kuus-Reichel K., et al. (1996). Expression of human glandular kallikrein, hK2, in mammalian cells. Cancer Res. 56 (23), 5397–5402.
Kutik S., Stroud D. A., Wiedemann N., Pfanner N. (2009). Evolution of mitochondrial protein biogenesis. Biochim. Biophys. Acta (BBA)-General Subj. 1790 (6), 409–415. doi: 10.1016/j.bbagen.2009.04.004
Lee H.-J., Woo Y., Hahn T.-W., Jung Y. M., Jung Y.-J. (2020). Formation and maturation of the phagosome: A key mechanism in innate immunity against intracellular bacterial infection. Microorganisms 8 (9), 1298. doi: 10.3390/microorganisms8091298
Levine B., Deretic V. (2007). Unveiling the roles of autophagy in innate and adaptive immunity. Nat. Rev. Immunol. 7 (10), 767–777. doi: 10.1038/nri2161
Liu L., McCullough L., Li J. (2014). Genetic deletion of calcium/calmodulin-dependent protein kinase kinase β (CaMKK β) or CaMK IV exacerbates stroke outcomes in ovariectomized (OVXed) female mice. BMC Neurosci. 15 (1), 1–10. doi: 10.1186/s12868-014-0118-2
Liu L., Zhang Y., Hu X., Lü Z., Liu B., Jiang L. H., et al. (2019). Multiple paternity assessed in the cuttlefish sepiella japonica (Mollusca, Cephalopoda) using microsatellite markers. ZooKeys 880, 33. doi: 10.3897/zookeys.880.33569
Marcelo K. L., Means A. R., York B. (2016). The Ca2+/calmodulin/CaMKK2 axis: nature's metabolic CaMshaft. Trends Endocrinol. Metab. 27 (10), 706–718. doi: 10.1016/j.tem.2016.06.001
McAinsh M. R., Brownlee C., Hetherington A. M. (1997). Calcium ions as second messengers in guard cell signal transduction. Physiol Plantarum 100 (1), 16–29. doi: 10.1111/j.1399-3054.1997.tb03451.x
McCullough L. D., Tarabishy S., Liu L., Benashski S., Xu Y., Ribar T., et al. (2013). Inhibition of calcium/calmodulin-dependent protein kinase kinase β and calcium/calmodulin-dependent protein kinase IV is detrimental in cerebral ischemia. Stroke 44 (9), 2559–2566. doi: 10.1161/STROKEAHA.113.001030
Moore D., Robson G. D., Trinci A. P. (2020). 21st century guidebook to fungi (Cambridge: Cambridge University Press).
Morrison C. M., Macdonald C. A. (1995). Epidermal tumors on rainbow smelt and Atlantic salmon from Nova Scotia. J. Aquat. Anim. Health 7 (3), 241–250. doi: 10.1577/1548-8667(1995)007<0241:ETORSA>2.3.CO;2
Munemitsu S., Innis M., Clark R., McCormick F., Ullrich A., Polakis P. (1990). Molecular cloning and expression of a G25K cDNA, the human homolog of the yeast cell cycle gene CDC42. Mol. Cell. Biol. 10 (11), 5977–5982. doi: 10.1128/mcb.10.11.5977-5982.1990
Nassar N., Horn G., Herrmann C. A., Scherer A., McCormick F., Wittinghofer A. (1995). The 2.2 Å crystal structure of the ras-binding domain of the serine/threonine kinase c-Raf1 in complex with RaplA and a GTP analogue. Nature 375 (6532), 554–560. doi: 10.1038/375554a0
Neupert W., Herrmann J. M. (2007). Translocation of proteins into mitochondria. Annu. Rev. Biochem. 76, 723–749. doi: 10.1146/annurev.biochem.76.052705.163409
Okada T., Hu C.-D., Jin T.-G., Kariya K.-I., Yamawaki-Kataoka Y., Kataoka T. (1999). The strength of interaction at the raf cysteine-rich domain is a critical determinant of response of raf to ras family small GTPases. Mol. Cell. Biol. 19 (9), 6057–6064. doi: 10.1128/MCB.19.9.6057
Park G. W., Hwang H., Kim K. H., Lee J. Y., Lee H. K., Park J. Y., et al. (2016). Integrated proteomic pipeline using multiple search engines for a proteogenomic study with a controlled protein false discovery rate. J. Proteome Res. 15 (11), 4082–4090. doi: 10.1021/acs.jproteome.6b00376
Paul S., Mahanta S. (2014). Association of heat-shock proteins in various neurodegenerative disorders: Is it a master key to open the therapeutic door? Mol. Cell. Biochem. 386 (1), 45–61. doi: 10.1007/s11010-013-1844-y
Pauwels A.-M., Trost M., Beyaert R., Hoffmann E. (2017). Patterns, receptors, and signals: Regulation of phagosome maturation. Trends Immunol. 38 (6), 407–422. doi: 10.1016/j.it.2017.03.006
Preissler S., Deuerling E. (2012). Ribosome-associated chaperones as key players in proteostasis. Trends Biochem. Sci. 37 (7), 274–283. doi: 10.1016/j.tibs.2012.03.002
Rakwalska M., Rospert S. (2004). The ribosome-bound chaperones RAC and Ssb1/2p are required for accurate translation in saccharomyces cerevisiae. Mol. Cell. Biol. 24 (20), 9186–9197. doi: 10.1128/MCB.24.20.9186-9197.2004
Roskoski R. Jr. (2010). RAF Protein-serine/threonine kinases: structure and regulation. Biochem. Biophys. Res. Commun. 399 (3), 313–317. doi: 10.1016/j.bbrc.2010.07.092
Salminen A., Kaarniranta K. (2010). Insulin/IGF-1 paradox of aging: Regulation. via AKT/IKK/NF-κB signalling. Cell. signalling 22 (4), 573–577. doi: 10.1016/j.cellsig.2009.10.006
Sandberg A., Lindell G., Källström B. N., Branca R. M., Danielsson K. G., Dahlberg M., et al. (2012). Tumor proteomics by multivariate analysis on individual pathway data for characterization of vulvar cancer phenotypes. Mol. Cell. Proteomics 11 (7), M112. 016998-1-M112. 016998-14. doi: 10.1074/mcp.M112.016998
Sandiford S. D., Green H. J., Duhamel T. A., Perco J. G., Schertzer J. D., Ouyang J. (2004). Inactivation of human muscle na+-K+-ATPase in vitro during prolonged exercise is increased with hypoxia. J. Appl. Physiol. 96 (5), 1767–1775. doi: 10.1152/japplphysiol.01273.2003
Sattler U., Hirschhaeuser F., Mueller-Klieser W. (2010). Manipulation of glycolysis in malignant tumors: Fantasy or therapy? Curr. medic Chem. 17 (2), 96–108. doi: 10.2174/092986710790112657
Scaros A. T., Andouche A., Baratte S., Croll R. P. (2020). Histamine and histidine decarboxylase in the olfactory system and brain of the common cuttlefish sepia officinalis (Linnaeus, 1758). J. Comp. Neurol. 528 (7), 1095–1112. doi: 10.1002/cne.24809
Sever R., Brugge J. S. (2015). Signal transduction in cancer. Cold Spring Harbor Perspect. Med. 5 (4), , a006098. doi: 10.1101/cshperspect.a006098
Shen C., Xie J., Xu X. (2007). The components of cuttlefish (Sepiella maindroni de rochebruns) oil. Food Chem. 102 (1), 210–214. doi: 10.1016/j.foodchem.2006.05.014
Shi H., Li D., Zhang J., Wang Y. S., Yang L., Zhang H. L., et al. (2010). Silencing of pkm2 increases the efficacy of docetaxel in human lung cancer xenografts in mice. Cancer Sci. 101 (6), 1447–1453. doi: 10.1111/j.1349-7006.2010.01562.x
Theocharis A. D., Manou D., Karamanos N. K. (2019). The extracellular matrix as a multitasking player in disease. FEBS J. 286 (15), 2830–2869. doi: 10.1111/febs.14818
Valadkhan S. (2005). snRNAs as the catalysts of pre-mRNA splicing. Curr. Opin. Chem. Biol. 9 (6), 603–608. doi: 10.1016/j.cbpa.2005.10.008
Wachtel C., Manley J. L. (2009). Splicing of mRNA precursors: The role of RNAs and proteins in catalysis. Mol. Biosyst. 5 (4), 311–316. doi: 10.1039/b820828j
Wells M., Wells J. (1959). Hormonal control of sexual maturity in octopus. J. Exp. Biol. 36 (1), 1–33. doi: 10.1242/jeb.36.1.1
Wennerberg K., Rossman K. L., Der C. J. (2005). The ras superfamily at a glance. J. Cell Sci. 118 (5), 843–846. doi: 10.1242/jcs.01660
Will C. L., Lührmann R. (2011). Spliceosome structure and function. Cold Spring Harbor Perspect. Biol. 3 (7), a003707. doi: 10.1101/cshperspect.a003707
Wodinsky J. (1977). Hormonal inhibition of feeding and death in octopus: Control by optic gland secretion. Science 198 (4320), 948–951. doi: 10.1126/science.198.4320.948
Wu C.-W., Dong Z.-Y., Chi C.-F., Ding F. (2010). Reproductive and spawning habits of sepiella maindroni off zhejiang, China. Oceanol Limnol Sin. 41 (1), 39–46. doi: 10.11693/hyhz201001005005
Wu W.-N., Wu P.-F., Zhou J., Guan X.-L., Zhang Z., Yang Y.-J., et al. (2013). Orexin-a activates hypothalamic AMP-activated protein kinase signalling through a Ca2+-dependent mechanism involving voltage-gated l-type calcium channel. Mol. Pharmacol. 84 (6), 876–887. doi: 10.1124/mol.113.086744
Yellen G. (2018). Fueling thought: Management of glycolysis and oxidative phosphorylation in neuronal metabolism. J. Cell Biol. 217 (7), 2235–2246. doi: 10.1083/jcb.201803152
Youle R. J., Narendra D. P. (2011). Mechanisms of mitophagy. Nat. Rev. Mol. Cell Biol. 12 (1), 9–14. doi: 10.1038/nrm3028
Zhang D.-Y., Pan Y., Zhang C., Yan B.-X., Yu S.-S., Wu D.-L., et al. (2013). Wnt/β-catenin signalling induces the aging of mesenchymal stem cells through promoting the ROS production. Mol. Cell. Biochem. 374 (1), 13–20. doi: 10.1007/s11010-012-1498-1
Keywords: sepiella japonica, spawning, aging, label-free quantitative proteomics, optic gland
Citation: Li H, Lin S, Qi P, Wang J, Fan M, Huang H, Dong Z, Xu K and Guo B (2022) Proteomic analysis of the spineless cuttlefish Sepiella japonica: Exploratory analyses on the phenomenon of death after spawning. Front. Mar. Sci. 9:995691. doi: 10.3389/fmars.2022.995691
Received: 16 July 2022; Accepted: 11 August 2022;
Published: 05 September 2022.
Edited by:
Bin Xia, Qingdao Agricultural University, ChinaReviewed by:
Changkao Mu, Ningbo University, ChinaYasmeen Gul, Government College for Women University, Pakistan
Copyright © 2022 Li, Lin, Qi, Wang, Fan, Huang, Dong, Xu and Guo. This is an open-access article distributed under the terms of the Creative Commons Attribution License (CC BY). The use, distribution or reproduction in other forums is permitted, provided the original author(s) and the copyright owner(s) are credited and that the original publication in this journal is cited, in accordance with accepted academic practice. No use, distribution or reproduction is permitted which does not comply with these terms.
*Correspondence: Baoying Guo, Z3VvYmFvYmFvMjAwMEAxMjYuY29t