 Tiantian Ge1†
 Chunle Luo1†Peng Ren2Hongmei Zhang1
 Di Fan2Hongtao Chen1
 Zhaohui Chen3
 Jing Zhang1,4
 Xuchen Wang1*
- 1Frontiers Science Center for Deep Ocean Multispheres and Earth System, and Key Laboratory of Marine Chemistry Theory and Technology, Ocean University of China, Qingdao, China
- 2Center for Isotope Geochemistry and Geochronology, Qingdao National Laboratory for Marine Science and Technology, Qingdao, China
- 3Frontiers Science Center for Deep Ocean Multispheres and Earth System, and Key Laboratory of Physical Oceanography, Ocean University of China, Qingdao, China
- 4Faculty of Science, University of Toyama, Toyama, Japan
The uptake of atmospheric CO2 and the cycle of dissolved inorganic carbon (DIC) in the ocean are the major mechanisms and pathways controlling global climate change and carbon cycling. The stable carbon isotope (δ13C) of DIC, therefore, provides an important tracer for processes such as air-sea exchange, photosynthesis, and water dynamics in the ocean. Here, we present new δ13C-DIC data on water samples collected from a north-south transect (13°N–40°N, 150°E) in the western North Pacific (NP) Ocean in November 2019 and compare the results with those previously reported for similar transects (149.3°E) during WOCE and CLIVAR projects over the past three decades. The values of δ13C-DIC, ranging from -0.83‰ to 0.86‰, were higher in the surface waters and decreased with depth. The high δ13C-DIC values in the surface waters were influenced primarily by isotopic fractionation during air-sea exchange and photosynthesis. With depth, the movement of different water masses and mixing, as well as bathypelagic respiration in the dark water of the ocean, all play important roles in influencing the distribution and isotopic signatures of δ13C-DIC in the western NP Ocean. The δ13C-DIC values of the 0–200 m water layer varied from -0.17‰ to 0.86‰, with lower values at high latitudes, affected by the low δ13C-DIC values carried by the Oyashio Current to the Kuroshio Extension (KE) region. A downward trend was present in the δ13C-DIC signature from north to south in the North Pacific Intermediate Water (NPIW) and Pacific Deep Water (PDW) in the western NP, which reflected the remineralization of organic matter with a horizontal transport of NPIW and PDW. We found a strong 13C Suess Effect in the upper 2,000 m in the western NP Ocean, and δ13C-DIC at the surface (<50 m) has decreased by 0.60‰-0.85‰ since 1993. The mean δ13C-DIC change in the surface ocean was estimated at 0.28‰ per decade between 1993 and 2019. The air-sea exchange and water mixing in the study area may have accelerated the absorption of anthropogenic CO2 in recent years, which likely caused a slightly faster rate of decrease in the δ13C-DIC from 2005–2019 than that observed from 1993–2005.
Introduction
The distribution of dissolved inorganic carbon (DIC), as the largest reservoir of carbon (38,000 Gt C) in the oceans (Key et al., 2004; Schuur et al., 2016), has a vast potential impact on the global carbon cycle and climate change (Broecker et al., 1985; Key et al., 2004; Tagliabue and Bopp, 2008). The stable carbon isotopic composition of oceanic DIC is influenced by physical, biological, and anthropogenic processes and has been used as an important tracer for studies of processes such as air-sea exchange, carbon remineralization, water mixing, and ocean circulations (Broecker et al., 1985; Gruber et al., 1999; Quay et al., 2003; Key et al., 2004; Druffel et al., 2008; Tagliabue and Bopp, 2008). The notation δ13C is typically used, representing deviations in the 13C/12C ratio relative to a standard, Vienna Pee Dee Belemnite (VPDB, Craig, 1957). Studies have shown that the δ13C values of DIC distributions are largely dominated by air-sea exchange in the surface ocean and that water mixing and ocean circulation play important roles in affecting the DIC δ13C values in the deep ocean (Key et al., 2004; Druffel et al., 2008; Ding et al., 2018; 2020 Ge et al., 2022a). Typically, δ13C values of DIC are relatively high in the upper waters and low in the deeper ocean (McNichol and Druffel, 1992). In surface water, the pool of residual DIC is slightly enriched in 13C due to isotope fractionation in biological processes. During photosynthesis, phytoplankton preferentially incorporate lighter carbon into organic matter, also leading to an increase in surface water δ13C-DIC (Schmittner et al., 2013). The gradient of high δ13C at the surface water and a lower δ13C in the deep ocean water is the result of the remineralization of sinking particulate organic matter releasing low δ13C carbon (Druffel et al., 2008). This gradient has been weakened with the intrusion of δ13C-depleted anthropogenic CO2 into the upper ocean since the Industrial Revolution from the atmosphere, i.e., the 13C Suess effect (Olsen and Ninnemann, 2010). Anthropogenic CO2 from the burning of fossil fuels and deforestation is very low in 13C, reflecting the preferential utilization of 12C during photosynthesis. The combustion of fossil fuels has added low δ13C carbon into atmospheric CO2 and decreased the value δ13C by nearly 2% since 1850 (Keeling et al., 2010). A strong 13C Suess effect in the upper 1,000 m of all ocean basins was found based on the observations of 2011–2013, and δ13C-DIC in the upper water has been depleted by more than 0.8‰ since the industrial revolution, with the strongest decrease in the subtropical gyres of the Northern Hemisphere (Eide et al., 2017). Understanding and quantifying the distribution of δ13C and the magnitude of the 13C Suess effect for DIC in the oceans is important both for understanding the efficiency of current sinks for anthropogenic CO2 and for unraveling ocean circulation.
It has been well recognized that the western North Pacific (NP) Ocean is of interest in terms of the oceanic carbon cycle. One aspect is a highly dynamic region that is largely influenced by western boundary currents (Hu et al., 2015; Ma et al., 2016), the Kuroshio and Oyashio Currents, and the Kuroshio Extension (KE) formed by the mixture of these two currents. Furthermore, the western NP Ocean acts as a major sink for anthropogenic CO2, accounting for ~25% of the annual oceanic uptake of CO2 from the atmosphere (Takahashi et al., 2009). The North Pacific Intermediate Water (NPIW) in the western NP is important with respect to anthropogenic CO2 because the subarctic water (Oyashio) mass is abundant in anthropogenic CO2 and is transported southward to the subtropical gyre and then widely distributed in the intermediate layer of the NP (Tsunogai et al., 1993; Yasuda et al., 1996; Qiu and Chen, 2011). The global survey of oceanic 13C in DIC in the western NP Ocean was conducted accompanied by radiocarbon measurement in DIC during the World Ocean Circulation Experiment (WOCE) in the 1990s and continued during the Climate Variation and Predictability Program (CLIVAR) in the 2000s (Key, 1996; McNichol et al., 2000; Kumamoto et al., 2013). The variations in oceanic δ13C collected in the same region during these surveys at different times have been estimated by comparing two individual data sets (Quay et al., 2003; Sonnerup and Quay, 2012; Eide et al., 2017). The decadal changes and regional variations in the δ13C of DIC since the WOCE project have indicated anthropogenic CO2 accumulation and natural variations in the ocean (Quay et al., 2007; Eide et al., 2017). However, the δ13C data of DIC in the western NP are still limited.
With the continuous climate change and the concomitant changes in hydrography as well as in biological productivity and communities, assessing and further examining the modern distribution of DIC δ13C in the NP is important to understanding these changes. In this study, we present new δ13C-DIC results for water samples collected in 2019 from P1 (13–40°N, 150°E), a meridional transect, in the northwestern NP Ocean (Figure 1). Our transect is close to those that were investigated during the WOCE cruise (P10 transect, ~149.3°E) in 1993 (Key et al., 2004) and during the CLIVAR cruise (P10N transect, ~149.3°E) in 2005 (Kumamoto et al., 2013). This paper outlines the use of stable isotopic carbon tracers to distinguish the sources and influences of waters around the western North Pacific to provide further constraints on physical, biological, and anthropogenic processes. Furthermore, comparison of the data obtained during our cruise with the CLIVAR and WOCE cruises along these close transects in the western NP in the last 26-year time period (2019–1993) enables us to improve the estimate of changes in δ13C in the western NP and to promote understanding of the carbon cycles that are linked to oceanic circulation and anthropogenic influence in the western NP. The δ13C data presented in this paper are the addition to the concentration and radiocarbon results of DIC collected from the same cruise we recently published (Ge et al., 2022a).
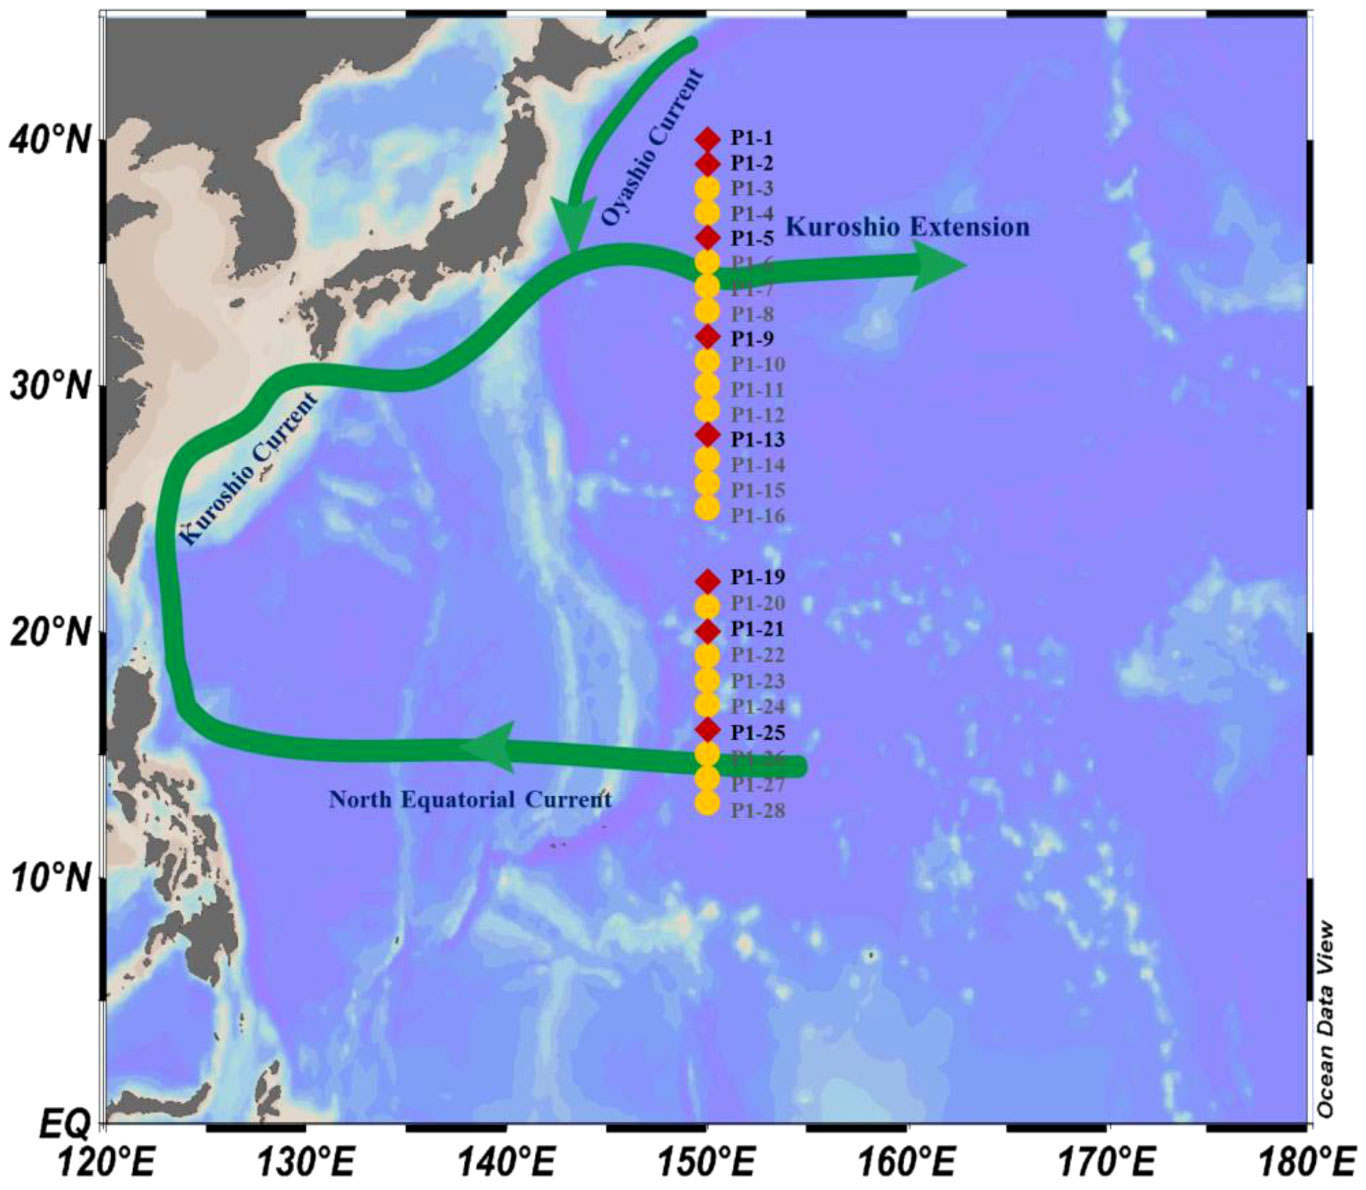
Figure 1 Map of the study region plotted using Ocean Data View (ODV, Schlitzer, 2015) and the sampling transect stations of line P1 in the northwestern North Pacific in November 2019. Red diamonds are the stations for measuring δ13C throughout the sampling water depth.
Materials and methods
Study areas
In the western NP ocean, the Kuroshio and Oyashio Currents are the two important western boundary currents of the subtropical and subarctic gyre (Yatsu et al., 2013; Hu et al., 2015). Separating from the Japanese east coast near 35°N, 140°E, the warm, saline Kuroshio Current flows eastward toward the open Pacific Ocean, which is recognized as the Kuroshio Extension (Qiu and Chen, 2005; Qiu et al., 2014). The cold and fresh Oyashio Current flows southward to the subtropical gyre. At approximately 34–37°N, the Oyashio front meets the KE Current and forms the mixed waters at the Kuroshio-Oyashio interfrontal zone, and then flows eastward (Rogachev et al., 2000; Qiu and Chen, 2011; Hu et al., 2015). An important feature of the Kuroshio-Oyashio interfrontal zone is that it is the most dynamic region in the NP, undergoing well-defined decadal fluctuations of sea surface height, eddy activity, and sea surface temperature (SST) (Qiu and Chen, 2005; 2010 Taguchi et al., 2007; Qiu et al., 2014). The newly formed NPIW originates as a vertical salinity minimum in the Kuroshio-Oyashio Mixed Water region, just east of Japan. In the western NP, the NPIW is characterized as water with a salinity minimum and a potential density of 26.6–27.4σ0 (Talley et al., 1995).
Sample collection, processing, and isotope measurement
Water samples were collected along a south-north transect P1 onboard R/V Dongfanghong 3 during the cruise in the western NP in November 2019 (Figure 1). Seawater samples were collected from the entire water depth at 7 stations (P1-1, P1-5, P1-9, P1-13, P1-19, P1-21, and P1-25) and from only the upper 2,000-m layer at 19 stations. The sampling schedule and methods used have been described in detail in our recently published paper, so readers can refer to Ge et al. (2022a; 2022b).
In the laboratory, water samples were measured for the concentrations and radiocarbon (Δ14C) compositions of DIC for all 26 stations (Ge et al., 2022a). For stable carbon isotopes, the δ13C values of DIC were measured for water samples from the seven stations with full water depths and P1-2, as well as for selected water samples at water depths of 1,000–2,000 m at other selected stations only (Supplementary Table 1). The results of concentrations and Δ14C values of DIC have been published recently (Ge et al., 2022a), and the data will be used for comparison here and help for interpretation of the δ13C results.
The δ13C values were measured using a MAT 253 plus isotope ratio mass spectrometer (IRMS) with a dual-inlet system at the Center for Isotope Geochemistry and Geochronology (CIGG) of Qingdao National Laboratory for Marine Science and Technology (QNLM) in Qingdao, China. The δ13C-DIC values were measured for purified CO2 gas extracted during sample processing for Δ14C measurement, and a small fraction was pre-saved (Ge et al., 2022a). The details of the method used for seawater DIC extraction and CO2 gas purification are described in Ge et al. (2022a). The δ13C values are reported in ‰ relative to the VPDB standard and expressed as δ13C (‰) = (Rsample – Rreference)/Rreference×1000, where R = 13C/12C. The δ13C analytic precision was ≤ 0.2‰.
Results
Hydrography
The salinity, temperature, and concentrations of DIC and δ13C-DIC of all the water samples collected in P1 transect are presented in Supplementary Table 1 of the Supplementary Material. The water temperature, salinity, and DO and DIC concentration data from the samples (Ge et al., 2022a, b) are used for δ13C-DIC results comparison and interpretation. As shown in the plots of the water potential temperature versus salinity (T-S), the water in the sampled region can be divided into different water masses with different potential densities (Figure 2). The largest variations in water temperature and salinity are at above a depth of 1,000 m, showing that the water temperatures and salinities in the upper water at the high-latitude stations (P1-1, P1-2, P1-3, P1-4, and P1-5; 36-40°N) were obviously lower than those at the other stations (Figure 2). Water temperature generally decreased unevenly with depth at above 500–1,000 m at all the stations (Ge et al., 2022a), and was relatively stable in deep water. Salinity had a different vertical gradient. The salinity increased slightly with depth in the upper water (>155 m), then decreased to the minimum level by 500–750 m (~26–27σ0), and then began to increase at greater depths before levelling off (>34.5, σ0 ≥ 27.5) below 1,500 m (Figure 2).
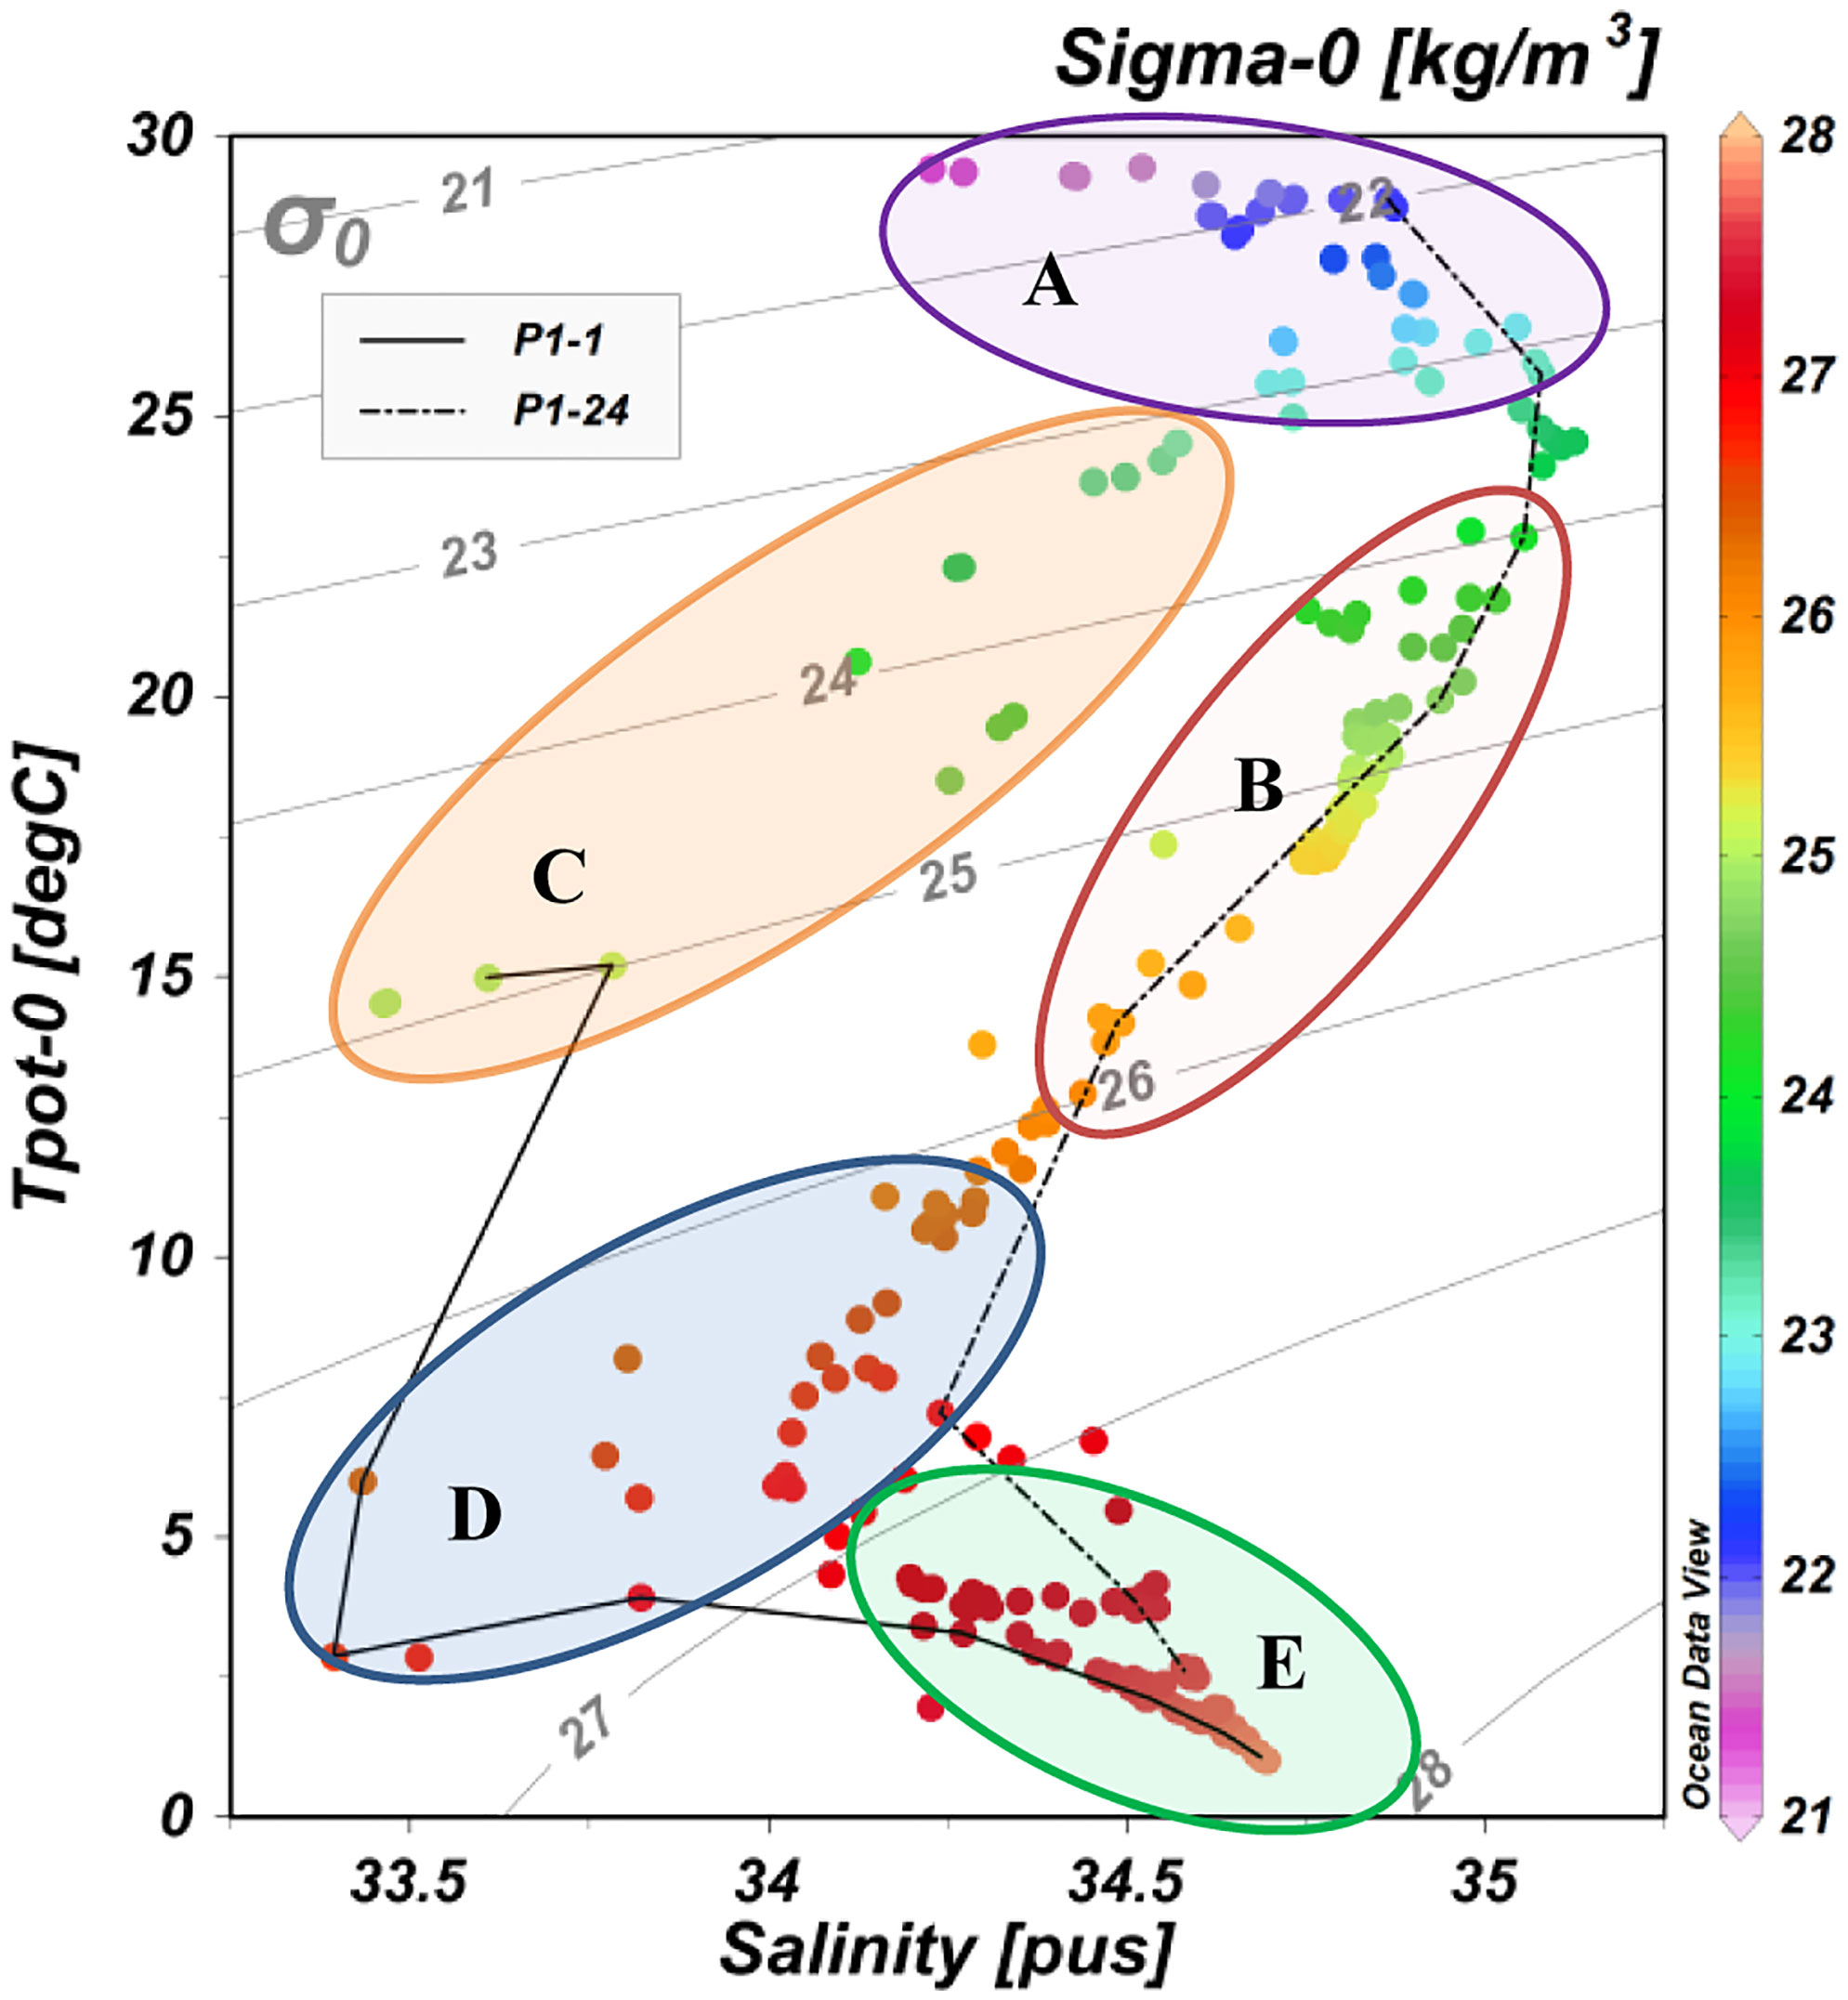
Figure 2 Plots of water temperature versus salinity with density (Sigma-0) associated with different water masses (represented by different colored points) along the P1 transect in the western NP in November 2019 using ODV. The color bar on the right side indicates the potential density. The solid line represents Station P1-1 in the KE region. The dotted line represents Station P1-24. The A-E regions represent low-density and high-temperature water in the upper 200 m depth (A) and the mixed water in the upper 200–300 m depth (B) at low latitudes (13°N–30°N), the denser and colder water in the upper water of the KE region [(36°N–40°N, (C)], the NPIW water mass (D), and deep water below a 1,000 m depth (E) along the P1 transect in the western NP.
The cold and fresh water observed at the northern stations (35°N-40°N) reflected the properties of the Oyashio Current. As the subsurface salinity minimum structure and relatively cold water documented at the density of 26.6–27.4σ0 indicated, the relatively new NPIW salinity was lower than 34.0 (Figure 2) (Itou et al., 2003). The T-S structure at 13°N–34°N was typical of subtropical gyre water (Itou et al., 2003; Ge et al., 2022a), which showed high temperatures and limited salinity fluctuations for the surface water in the subtropical gyre water region (13°N–34°N, Figure 2).
Concentrations and distributions of DO and DIC
The concentrations of DO were high in the upper water and low in the deep water, ranging from 35 μM to 239 μM. The largest changes in DO were seen in the upper 1,000 m depth along the P1 transect. The high values (164 μM to 239 μM) in the upper water layer (< 200 m) decreased rapidly with depth to the lowest concentrations at ~ 1,000 m at all the stations (Figures 3A, B; Ge et al., 2022b).
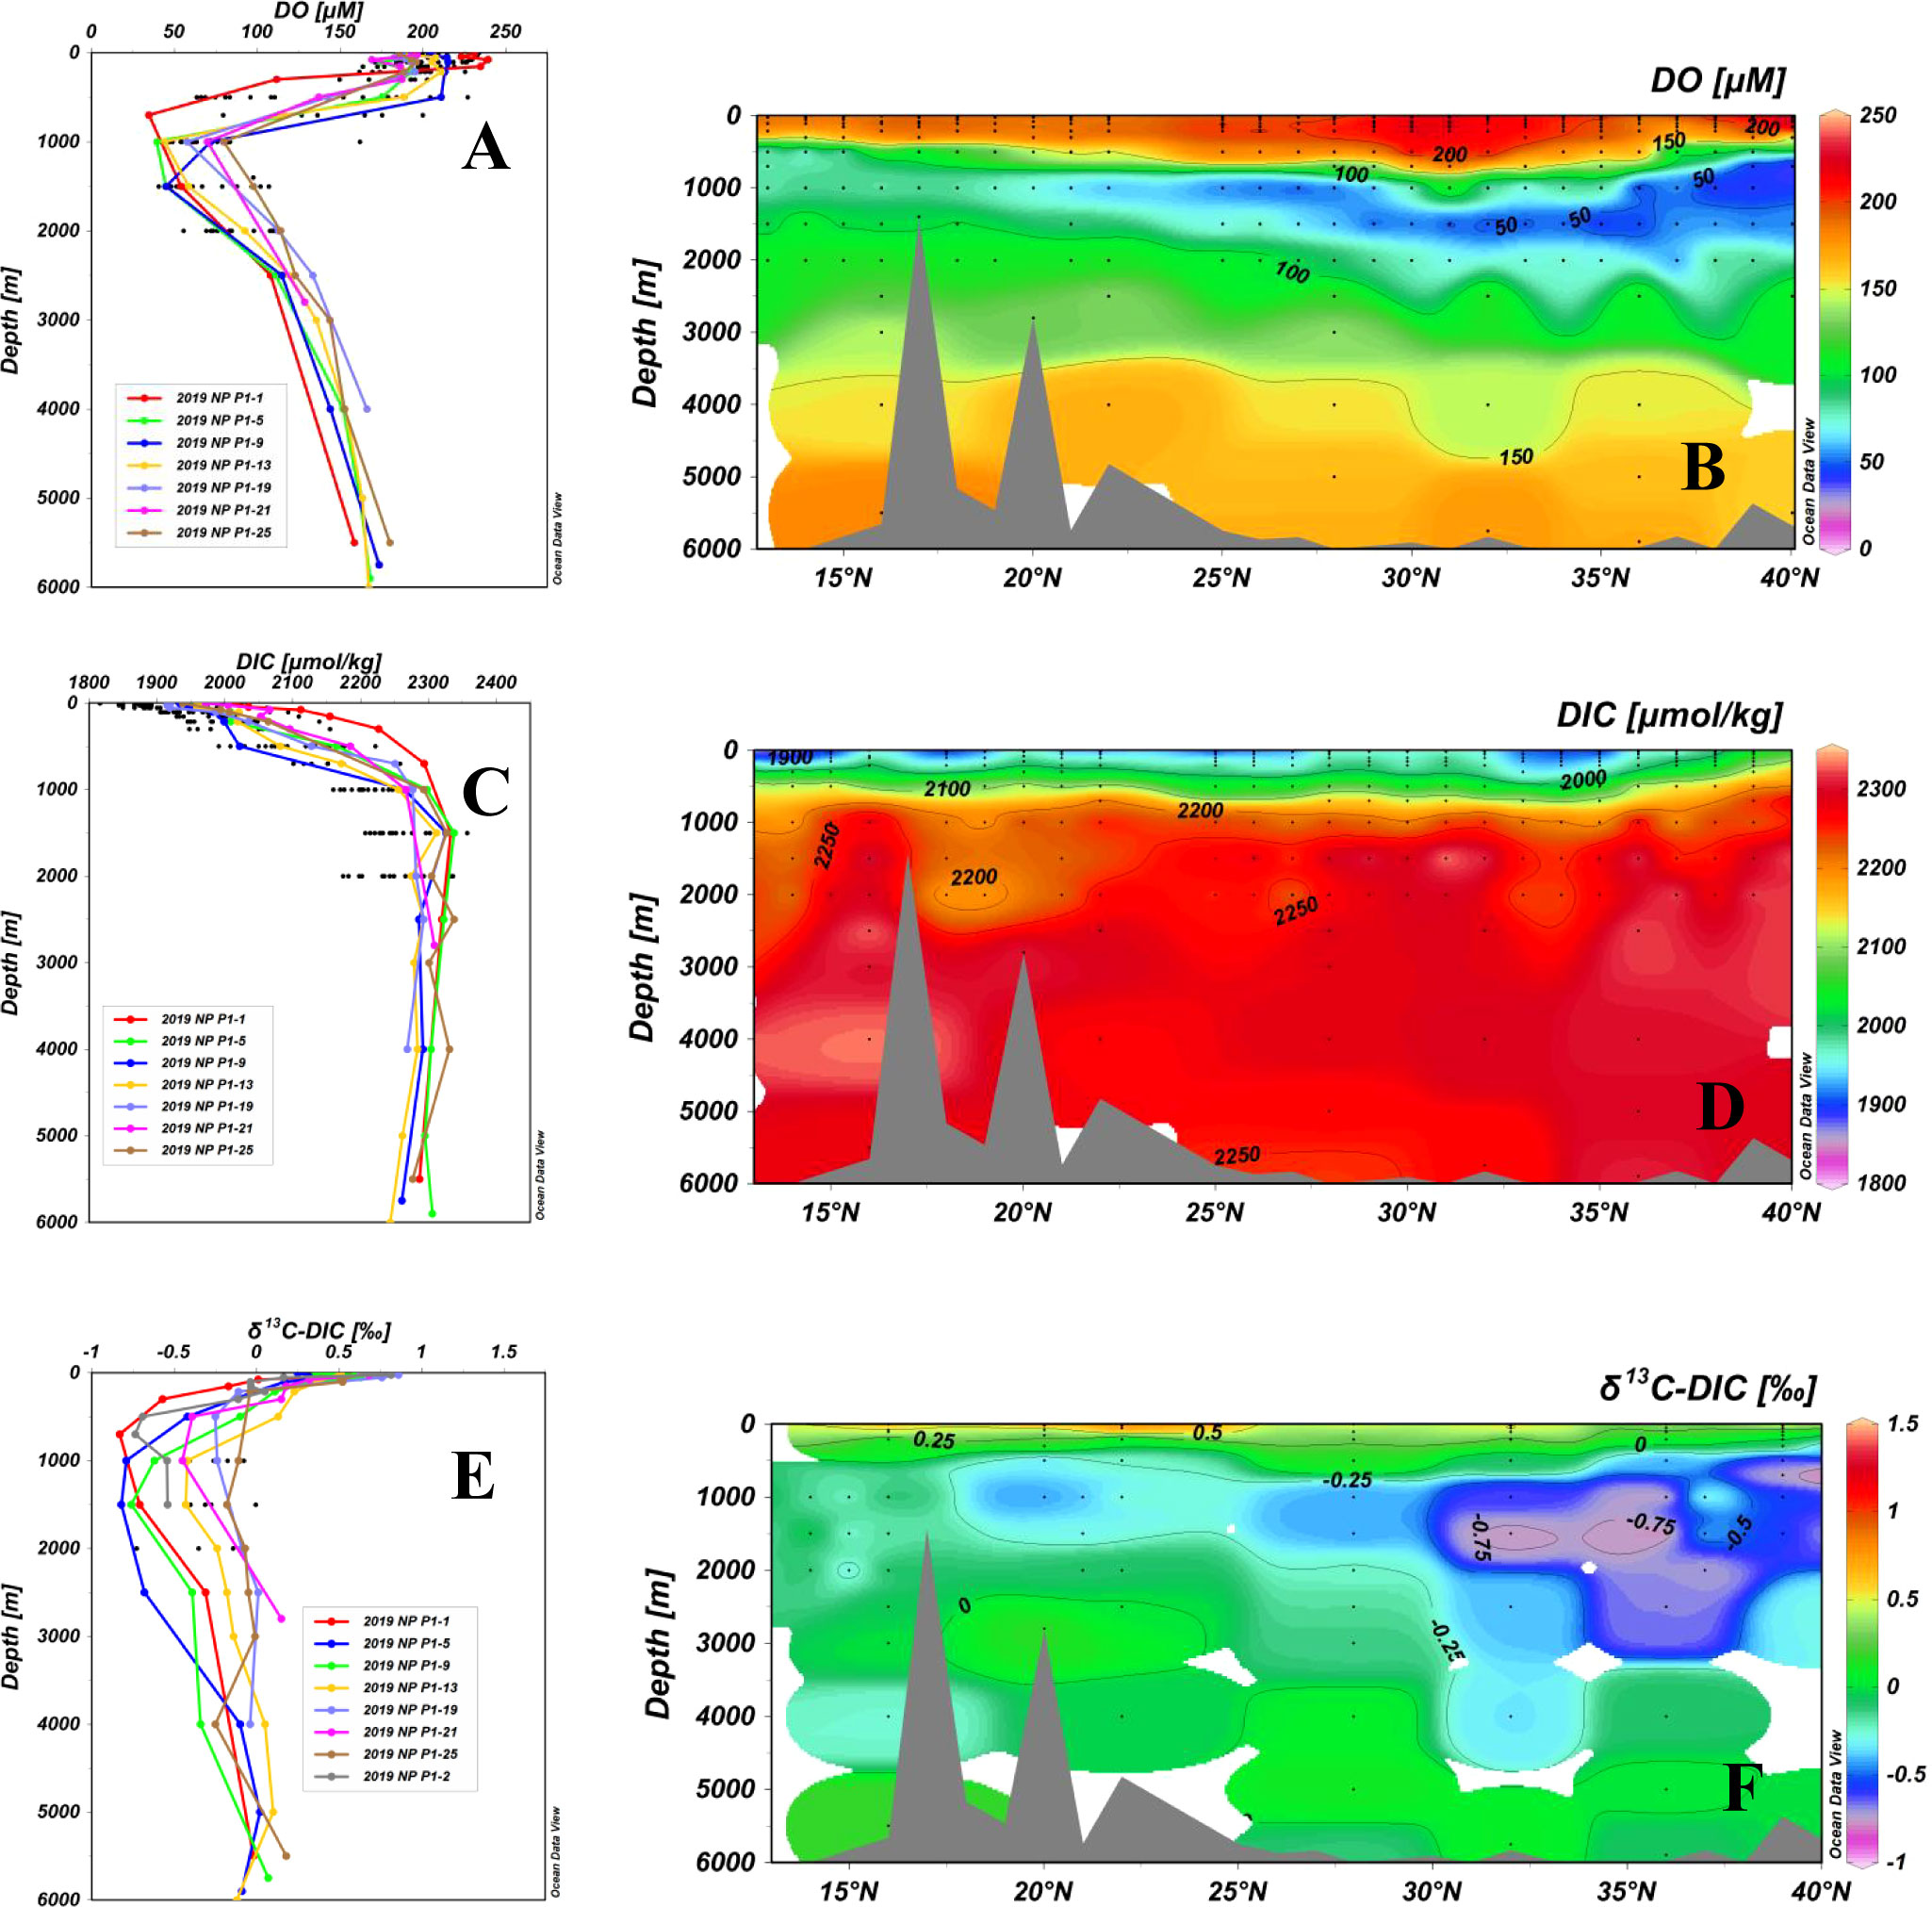
Figure 3 Depth profiles and latitudinal distributions of DO (A, B), DIC (C, D) and δ13C (E, F) in water samples collected from stations along the P1 transect in the northwestern NP in November 2019. Distribution of DO along the P1 transect is cited and replotted from Ge et al. (2022b). Data from the upper 2,000 m depth of the sampling stations are shown as black dots in the depth profiles.
The depth profiles and latitudinal distributions of the DIC concentrations for all stations along the P1 transect showed that the DIC concentrations ranged from 1,816 µmol kg-1 to 2,354 µmol kg-1 (Figures 3C, D). Although the DIC profiles exhibited some variation among the stations, in general, the concentrations of DIC showed minimum values in the upper 50 m (1.816–2,014 µmol kg-1), increased rapidly from the surface down to ~1,000-1,500 m, and then remained relatively constant or decreased slightly (Figure 3C). Laterally, large concentration variations across the north-south transect were seen in the upper 1,000 m depth (Figure 3D). In comparison with the other stations, stations in the KE region (36°N–40°N) had the highest DIC concentrations in the surface water, which were influenced by Subarctic water (Oyashio Current) characterized by high DIC concentrations originating in the northwestern subarctic gyre (Ge et al., 2022a).
Isotopic distributions of DIC
Depth profiles and latitudinal distributions of the δ13C-DIC values along the P1 transect are shown in Figure 3E and 3F. The δ13C values measured for DIC samples ranged from -0.83‰ to 0.86‰ (Supplementary Table 1 and Figure 3C). The δ13C-DIC values appeared to vary more in the upper 1,000 m than in deep waters. The δ13C-DIC profiles were relatively high in the surface water and decreased slightly with depth (Figures 3E, F). At 1,000–2,000 m depths, the δ13C-DIC values reached a minimum, then increased slightly with depth and remained relatively constant below a 3,000 m depth. The minima of δ13C at 1,000–3,000 depths were located around 30°N–40°N, and had upward trends from north to south (Figure 3F).
Discussion
Processes influencing the distribution of δ13C-DIC
The vertical distributions of δ13C-DIC (-0.83‰–0.86‰) that we measured in the water column along the P1 transect generally agree well with the values reported in previous studies in the NP (Quay et al., 2003; Druffel et al., 2008; Liu et al., 2010). Large variations in δ13C-DIC occur mainly in the upper 1,000 m water depth (Figures 3C, D), with the highest values in the surface water layer (< 200 m, -0.17‰ to 0.86‰), decreasing to the minimum values at 1,000–2,000 m, and increasing slightly again with depth to deeper water. The average global 13C value of atmospheric CO2 is approximately -8.0‰, which has decreased from -6.5‰ of the Holocene preindustrial atmospheric CO2 13C value as influenced by the increased concentration of 13C-depleted CO2 produced from fossil fuel combustion (Keeling et al., 1989; Siegenthaler and Sarmiento, 1993). Compared with the average atmospheric CO2 13C value, the high values of 13C in DIC in the surface water are clearly affected by isotope fractionation. Low DIC concentrations and high δ13C-DIC values at the water surface are attributable to photosynthesis. During photosynthesis, phytoplankton preferentially fix light 12C into organic carbon and thus leave 13C-enriched DIC in the surface waters, which increases the δ13C values of DIC (Schmittner et al., 2013). On the other hand, sinking and remineralization of organic carbon in and below the euphotic zone release light CO2 and may have caused the low δ13C-DIC values below 200–500 m at most stations. The values decrease to the minimum as the oxygen minimum zone (OMZ, ~1,000 m) is approached because of the addition of isotopically light CO2 from the oxidation of organic matter (McNichol and Druffel, 1992). Below this level, deep circulation patterns replenish the bottom waters and may cause the value of δ13C-DIC to increase (Kroopnick, 1985).
The δ13C-DIC values in the 0–200 m water layer also varied largely along the P1 transect from the lower value (-0.17‰) at high latitudes to the higher value (0.86‰) at lower latitudes (Figure 3D). The high latitudes of the western NP are considered to be one of the strongest anthropogenic CO2 sinks as a consequence of deep convection as well as strong biological activity (Takahashi et al., 2009; Qiu and Chen, 2011). Without taking other factors into account, the high productivity of upper seawater could correspond to the high δ13C-DIC value and vice versa, as organisms preferentially take up lighter isotopes of 12C during photosynthesis. Net primary production (NPP) was much higher in the KE region along the P1 transect (Ge et al., 2022b), which should have caused the high values of δ13C-DIC in the KE region. But the low values of δ13C-DIC in this region might not have been controlled by primary production but may be principally influenced by the contributions of the Oyashio Current, which carries low δ13C-DIC values in waters from the sub-Arctic. Distributions of DIC and radiocarbon (Δ14C) measurements in samples from the same cruise help explain these isotopic 13C data (Ge et al., 2022a). Compared to other stations, stations between 35°N and 40°N that are influenced by the Oyashio Current mass have denser water with high DIC concentrations and low Δ14C values in the upper 500 m (Ge et al., 2022a). The contribution of the Oyashio water to the KE water was calculated to be more than 50% in the western NP (Ding et al., 2018), which could greatly affect the distribution of δ13C-DIC. The clearly lowest δ13C-DIC values at depths of 500–3,000 m (Figure 3D) had an upward trend from north to south. The horizontal variation in δ13C was consistent with the change in DO (Figures 3B, F). Southward advection-diffusion of material at intermediate water depths and Pacific Deep Water was demonstrated by a horizontal variation in Δ14C-DIC and dissolved organic carbon (DOC) in our recent studies (Ge et al., 2022a; Ge et al., 2022b). Remineralization of organic matter with the horizontal transport of water masses may lead to this north-south horizontal variation in δ13C.
We use the temperature, salinity, oxygen, DIC and Δ14C of DIC data to help explain these isotopic δ13C data. As shown in Figure 4A, the δ13C-DIC values had negative correlations with DIC concentrations (R2 = 0.61, p<0.001), i.e., lower 13C-DIC values were associated with higher DIC concentrations. Positive correlations for δ13C-DIC and water temperature in the upper 1,000 m depth (R2 = 0.59, p<0.001), as shown in Figure 4B, indicated that the values of δ13C-DIC decreased with depth. The DIC concentration and temperature showed the opposite trend, i.e., the deeper the water, the higher the DIC concentration. In the upper water, the influence of water temperature on δ13C-DIC could be primarily controlled by air-sea exchange as well as ocean circulation and mixing, but the photosynthesis and respiration of organic matter also affected the distribution of δ13C-DIC. Below 1,000 m, as plotted in Figure 4B, the values of δ13C-DIC may not be influenced by water temperature, as the water is cold and uniform below this depth. In deeper water, microbial degradation of organic matter with water circulation and mixing may play a key role in affecting δ13C-DIC. We used the AOU to infer the biological effects. As shown in Figures 4A, D, δ13C-DIC decreased rapidly with increasing AOU and increasing DIC. These correlations were due to photosynthesis in the surface water and the oxidation of organic matter depleted in 13C in the deep water. In the upper 500 m (R2 = 0.68, p<0.001; Figure 4D) and below 500 m (R2 = 0.67, p<0.001; Figure 4D), there were highly linear correlations existing between δ13C-DIC and AOU along the P1 transect. The slope of these two regression lines in the upper 500 m and below 500 m was similar, but the intercepts were different (Figure 4D). The variation in the intercepts may represent various sources and influences of water masses. By estimating the net annual air–sea CO2 flux using the sea–air pCO2 difference and the air–sea gas transfer rate, the Western NP Ocean was determined to be a sink of atmospheric CO2 (Takahashi et al., 2009), which could explain the negative shift in the intercept of the linear curve in the upper water comparing with that in deep water. In the upper 500 m, the penetration of CO2 through the air-sea interface and photosynthesis are the primary factors affecting the values of δ13C-DIC (Takahashi et al., 2000). In deeper water, the movement of different water masses and mixing as well as bathypelagic respiration of POC in the dark part of the ocean influence the distribution of isotopic DIC signatures in the western NP Ocean.
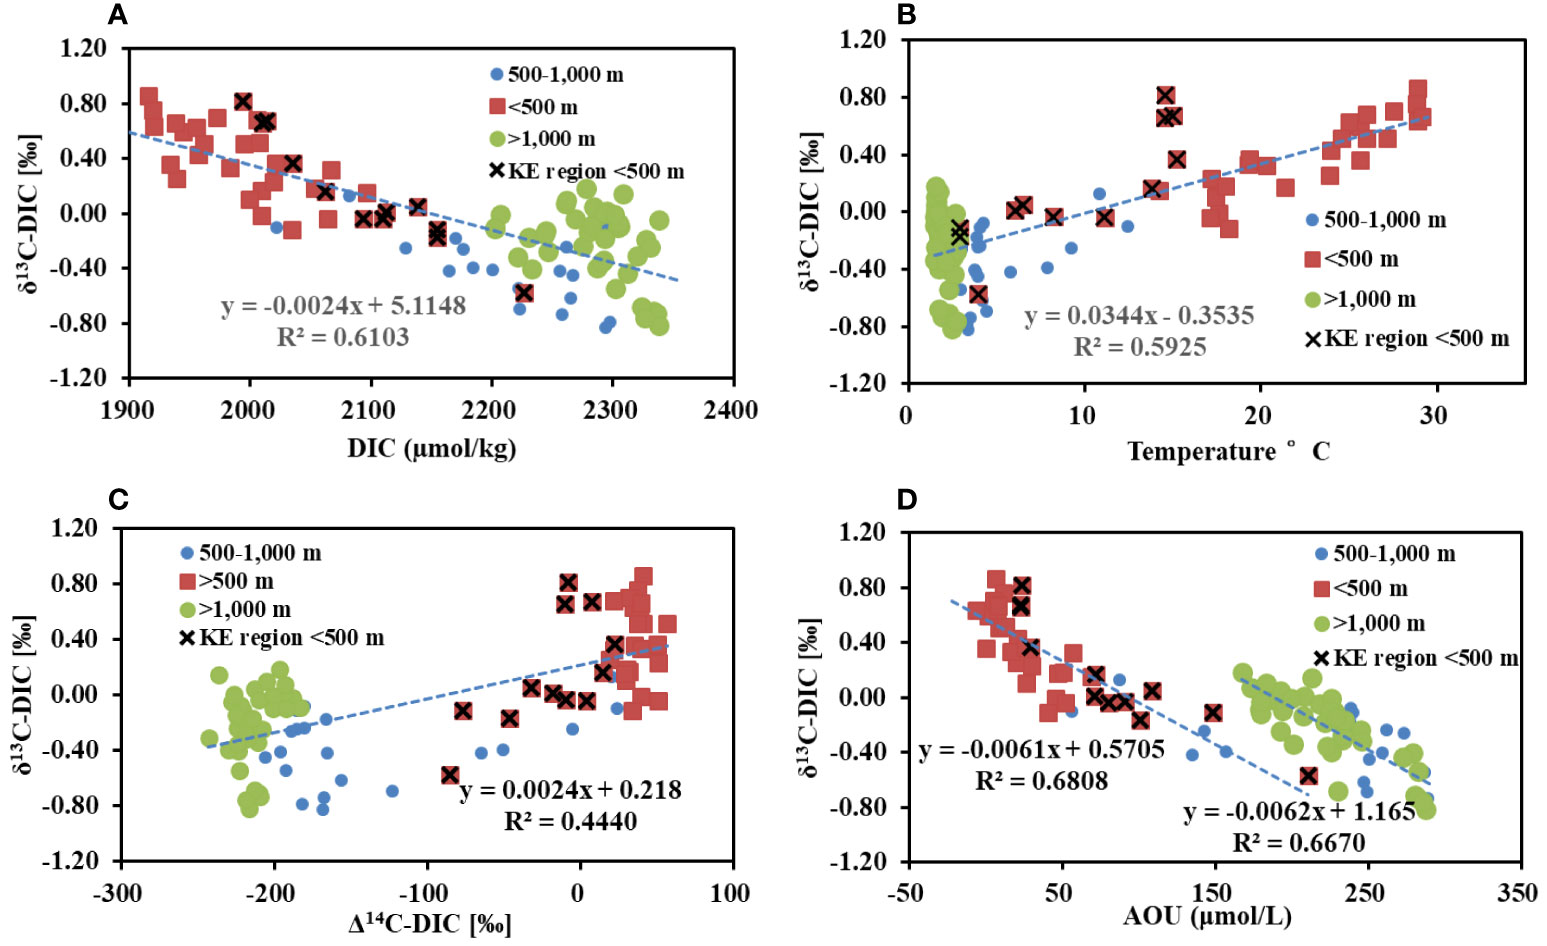
Figure 4 Plots of concentrations of δ13C-DIC versus (A) DIC, (B) water temperature, (C) Δ14C and (D) apparent oxygen utilization (AOU) for water samples along transect P1 in the western NP. The AOU data is cited and replotted from Ge et al. (2022b) for comparison discussion. The lines are linear regressions that fit the data.
The air-sea exchange signature of δ13C (δ13Cas) could provide crucial information on different water masses (Itou et al., 2003). If there was no air-sea exchange, the relationship between δ13C and PO4 concentrations in the ocean would be established (δ13C = (1.1PO4 + 2.8); Broecker and Maier-Reimer, 1992). By subtracting the equation of PO4 concentration as a biological factor from δ13C-DIC (Itou et al., 2003), we calculated the values of δ13Cas for upper 200 m water (δ13Cas = δ13C - (1.1PO4 + 2.8), PO4 unpublished data in our study) (Broecker and Maier-Reimer, 1992; Lynch-Stieglitz et al., 1995). As shown in Figure 5, the upper waters in the Kuroshio-Oyashio Mixed Water and in its southern region have different thermodynamic imprints on δ13Cas, indicating different physical properties of water masses in the two regions. If surface waters circulate for an adequate amount of time, giving the oceanic carbon sufficient time to establish isotopic equilibrium with the atmosphere, it is most likely that δ13Cas can have a linear relationship with water temperature, defined as an apparent equilibrium fractionation line (E-F Line, δ13C = -0.104T + 0.269, Figure 5; Zhang et al., 1995; Mook et al., 1974; Itou et al., 2003). The surface water (<200 m) south of the KE region should have approached relative air-sea isotopic equilibrium at relatively high temperatures, as shown in Figure 5. However, the temperature-δ13Cas relationship in the surface water (<200 m) in the Kuroshio-Oyashio Mixed Water along the P1 transect largely deviated from the E-F line (Figure 5), which may reflect the effect of anthropogenic CO2 penetration. The depleted deviation in the Kuroshio-Oyashio Mixed Water implies an apparent air-sea carbon isotopic disequilibrium resulting from the rapid penetration of surface water into the ocean interior occurring as water cooling (Itou et al., 2003). The invasion of anthropogenic atmospheric CO2 tends to decrease δ13Cas in surface water, and the depleted δ13Cas relative to the E-F line indicated that the Kuroshio-Oyashio Mixed region is an important oceanic anthropogenic CO2 sink area.
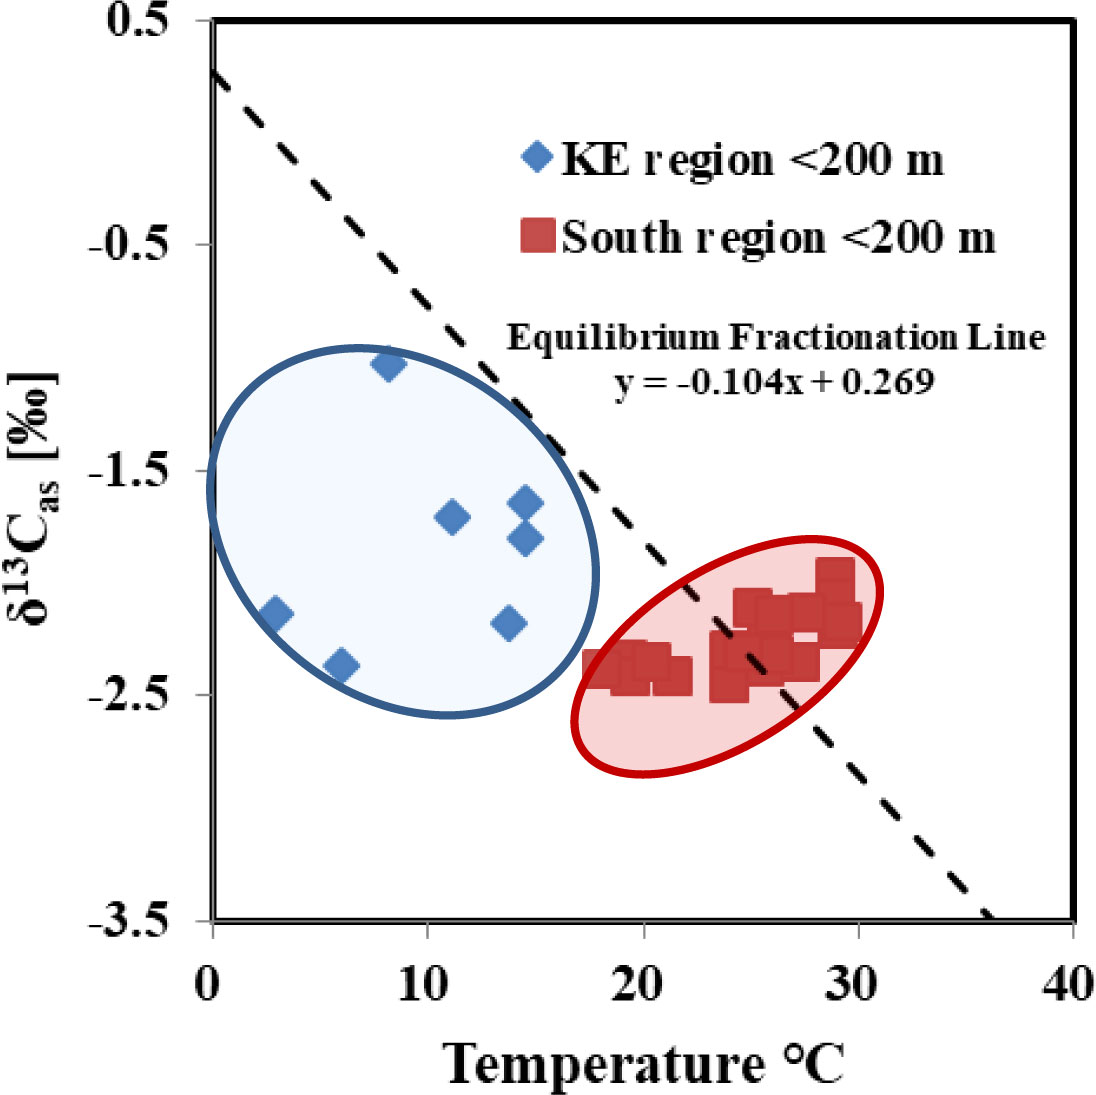
Figure 5 The δ13Cas versus temperature diagrams for water upper 200 m at subtropical gyre water Sea Water and Kuroshio-Oyashio Mixed Water Region. The dashed line is the equilibrium fractionation line when ocean DIC is in complete isotopic equilibrium with the atmosphere (Itou et al., 2003).
Decadal variations in δ13C along the P1 transect
The δ13C values for seawater DIC provide important information for understanding the movements and mixing of water masses and the penetration of anthropogenic CO2 into the ocean. An inventory of anthropogenic CO2 in the global ocean indicated that it was 92 ± 46 Gt C with the continuous addition of lower 13C values of atmospheric CO2 produced from fossil fuel combustion (Keeling et al., 1989; Siegenthaler and Sarmiento, 1993; Eide et al., 2017). To examine the decadal changes in δ13C-DIC in the western NP over the last three decades, we compared our results with the WOCE data measured in November 1993 (P10 line, ~149.3°E) and the CLIVAR data from June 2005 (P10N line, ~149.3°E). The δ13C data in 1993 and 2005 that we used for comparison were extracted from the GLOPAD data set (https://www.glodap.info/; Key et al., 2004). The values of δ13C-DIC ranged from -0.61 to 1.56‰ and -0.66 to 1.47‰ in the 1993 and 2005 cruises, respectively. The distributions of the δ13C-DIC values for the P1 transect in the western NP and the previous values along nearby transects (WOCE line P10 149.331°E, 1993 and CLIVAR line P10N 149.331°E, 2005) showed a similar distribution pattern with noticeably different values (Figure 6). The δ13C-DIC signal in the upper water (<2000 m) has negatively deviated since 1993 (Figure 6), as the emission of anthropogenic CO2 from fossil fuel resulted in a reduction in the 13C/12C ratio of the atmosphere (Druffel et al., 2008). Reflecting its organic source, the δ13C value of fossil fuel CO2 (-28‰) was much lower than the atmospheric δ13C value of -7‰ to -8‰ (Andres et al., 1996, Keeling et al., 1989; Keeling et al., 2005). As indicated in previous studies, the decrease rate of δ13C was approximately 0.25‰ per decade in the upper 1,000 m of the NP Ocean (Gruber et al., 1999; Körtzinger et al., 2003; Olsen et al., 2016). Changes in the atmospheric bomb 14C due to the Suess effect, as well as transport into deeper waters and/or advection away from the region, have decreased the Δ14C signature of the upper ocean along the P1 transect (Ge et al., 2022a), which is consistent with the decrease in δ13C-DIC along the P1 transect.
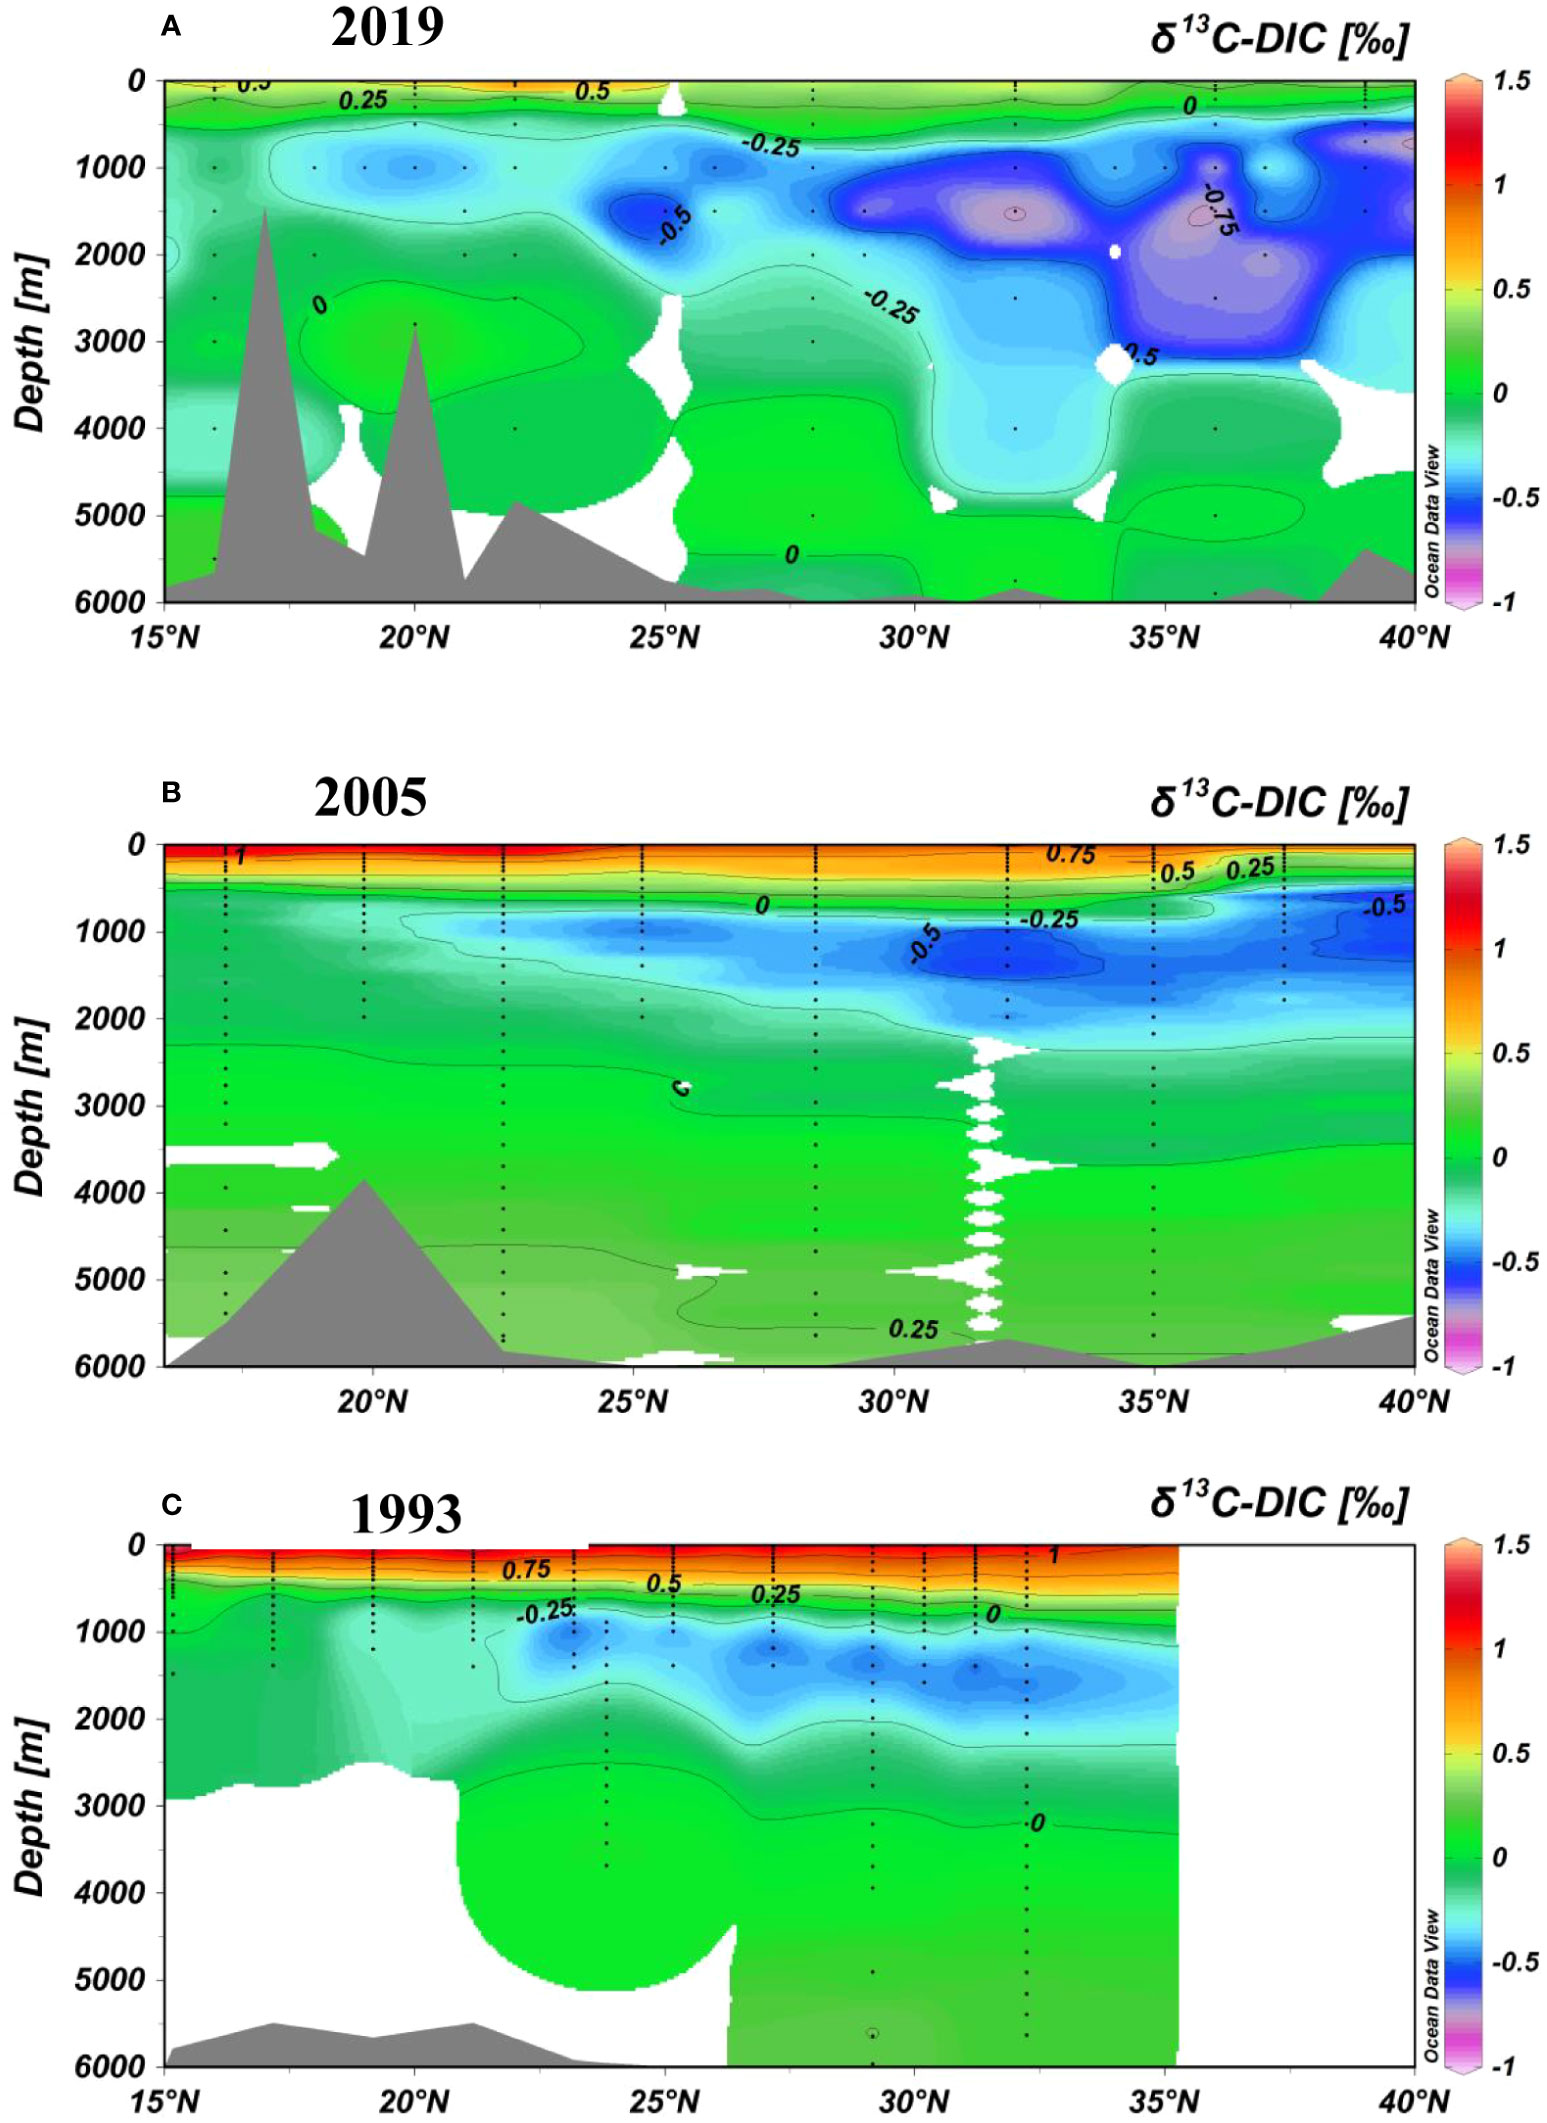
Figure 6 Latitudinal distributions of the δ13C-DIC values measured for (A) transect P1 in 2019 in our study; (B) CLIVAR line P10N in 2005; and (C) WOCE line P10 in 1993 in the northwestern NP using ODV. The data for lines P10N and P10 were obtained from the GLODAP database (https://www.glodap.info/).
To quantitatively calculate decadal variations in δ13C-DIC in the western NP, the depth profiles of δ13C-DIC for the stations sampled along the P1 transect during 2019 were also compared with those of similar stations sampled along the WOCE project’s P10 transect in 1993 and the CLIVAR project’s P10N transect in 2005, as shown in Figure 7. The surface δ13C-DIC values for samples in the P1 transect declined by approximately 0.60‰–0.85‰ compared to those obtained at adjacent stations along the P10 section in 1993 and by approximately 0.31‰–0.51‰ compared to those obtained along the P10N section in 2005 (Figure 7, Supplementary Table 1). This was consistent with previous results (Gruber et al., 1999; Körtzinger et al., 2003; Olsen et al., 2016). The increases in anthropogenic CO2 (ΔanCO2) in the upper thermocline along the P10 section were mostly 10–13 μmol kg-1, which were estimated using high-quality data for dissolved inorganic carbon and the related water properties obtained by two cruises separated by 12 years (1993–2005), and significant changes in ΔanCO2 were found down to a maximum depth of approximately 800 m (Murata et al., 2009). As calculated, an increase in DIC by 10 μmol kg-1 of pure fossil carbon would lower the δ13C-DIC values by ~0.2‰ from 1993 to 2005 (fossil fuel CO2 has a δ13C value of -28‰, and the average δ13C-DIC was 1.37‰ in the upper water in 1993). This is basically the same as the determination of δ13C-DIC between 1993 and 2005. The average rate of decrease in δ13C-DIC (<50 m) from 1993 to 2019 was 0.28‰ per decade. The temporal changes in δ13C show that the δ13C content of surface seawater (<50 m) decreased steadily at a rate of 0.11–0.32‰ per decade from 1993 to 2005 and that it accelerated at a rate of 0.22–0.37‰ per decade from 2005 to 2019. Considering the different seasons of these three observations (our transect was in November 2019, the transects in the WOCE and CLIVAR projects were in November 1993 and in May-June 2005, respectively), photosynthetic activity in summer may be characterized by higher 13C-DIC values (Racapé et al., 2014). This seasonal effect would increase the declining rate from June 2005 to Nov. 2019 compared to that from Nov. 1993 to June 2005. However, the increase in pCO2 due to warming might to some extent offset the increase in δ13C through biological effects in summer (Takahashi et al., 2009). The monthly mean values for sea–air pCO2 differences in the global ocean show that there was not a great difference between June and November (Takahashi et al., 2009). A study of the decadal variations in anthropogenic CO2 inventoried along the 147°E transect in the western NP showed that the rate of increase in the water column in recent decades (2005-2018) was 75% greater than between the 1990s and 2000s (Li et al., 2022), which may have caused the recent acceleration of the decreasing δ13C rate in recent years. Active air-sea exchange in the study area may be the main factor accelerating the absorption of anthropogenic CO2.
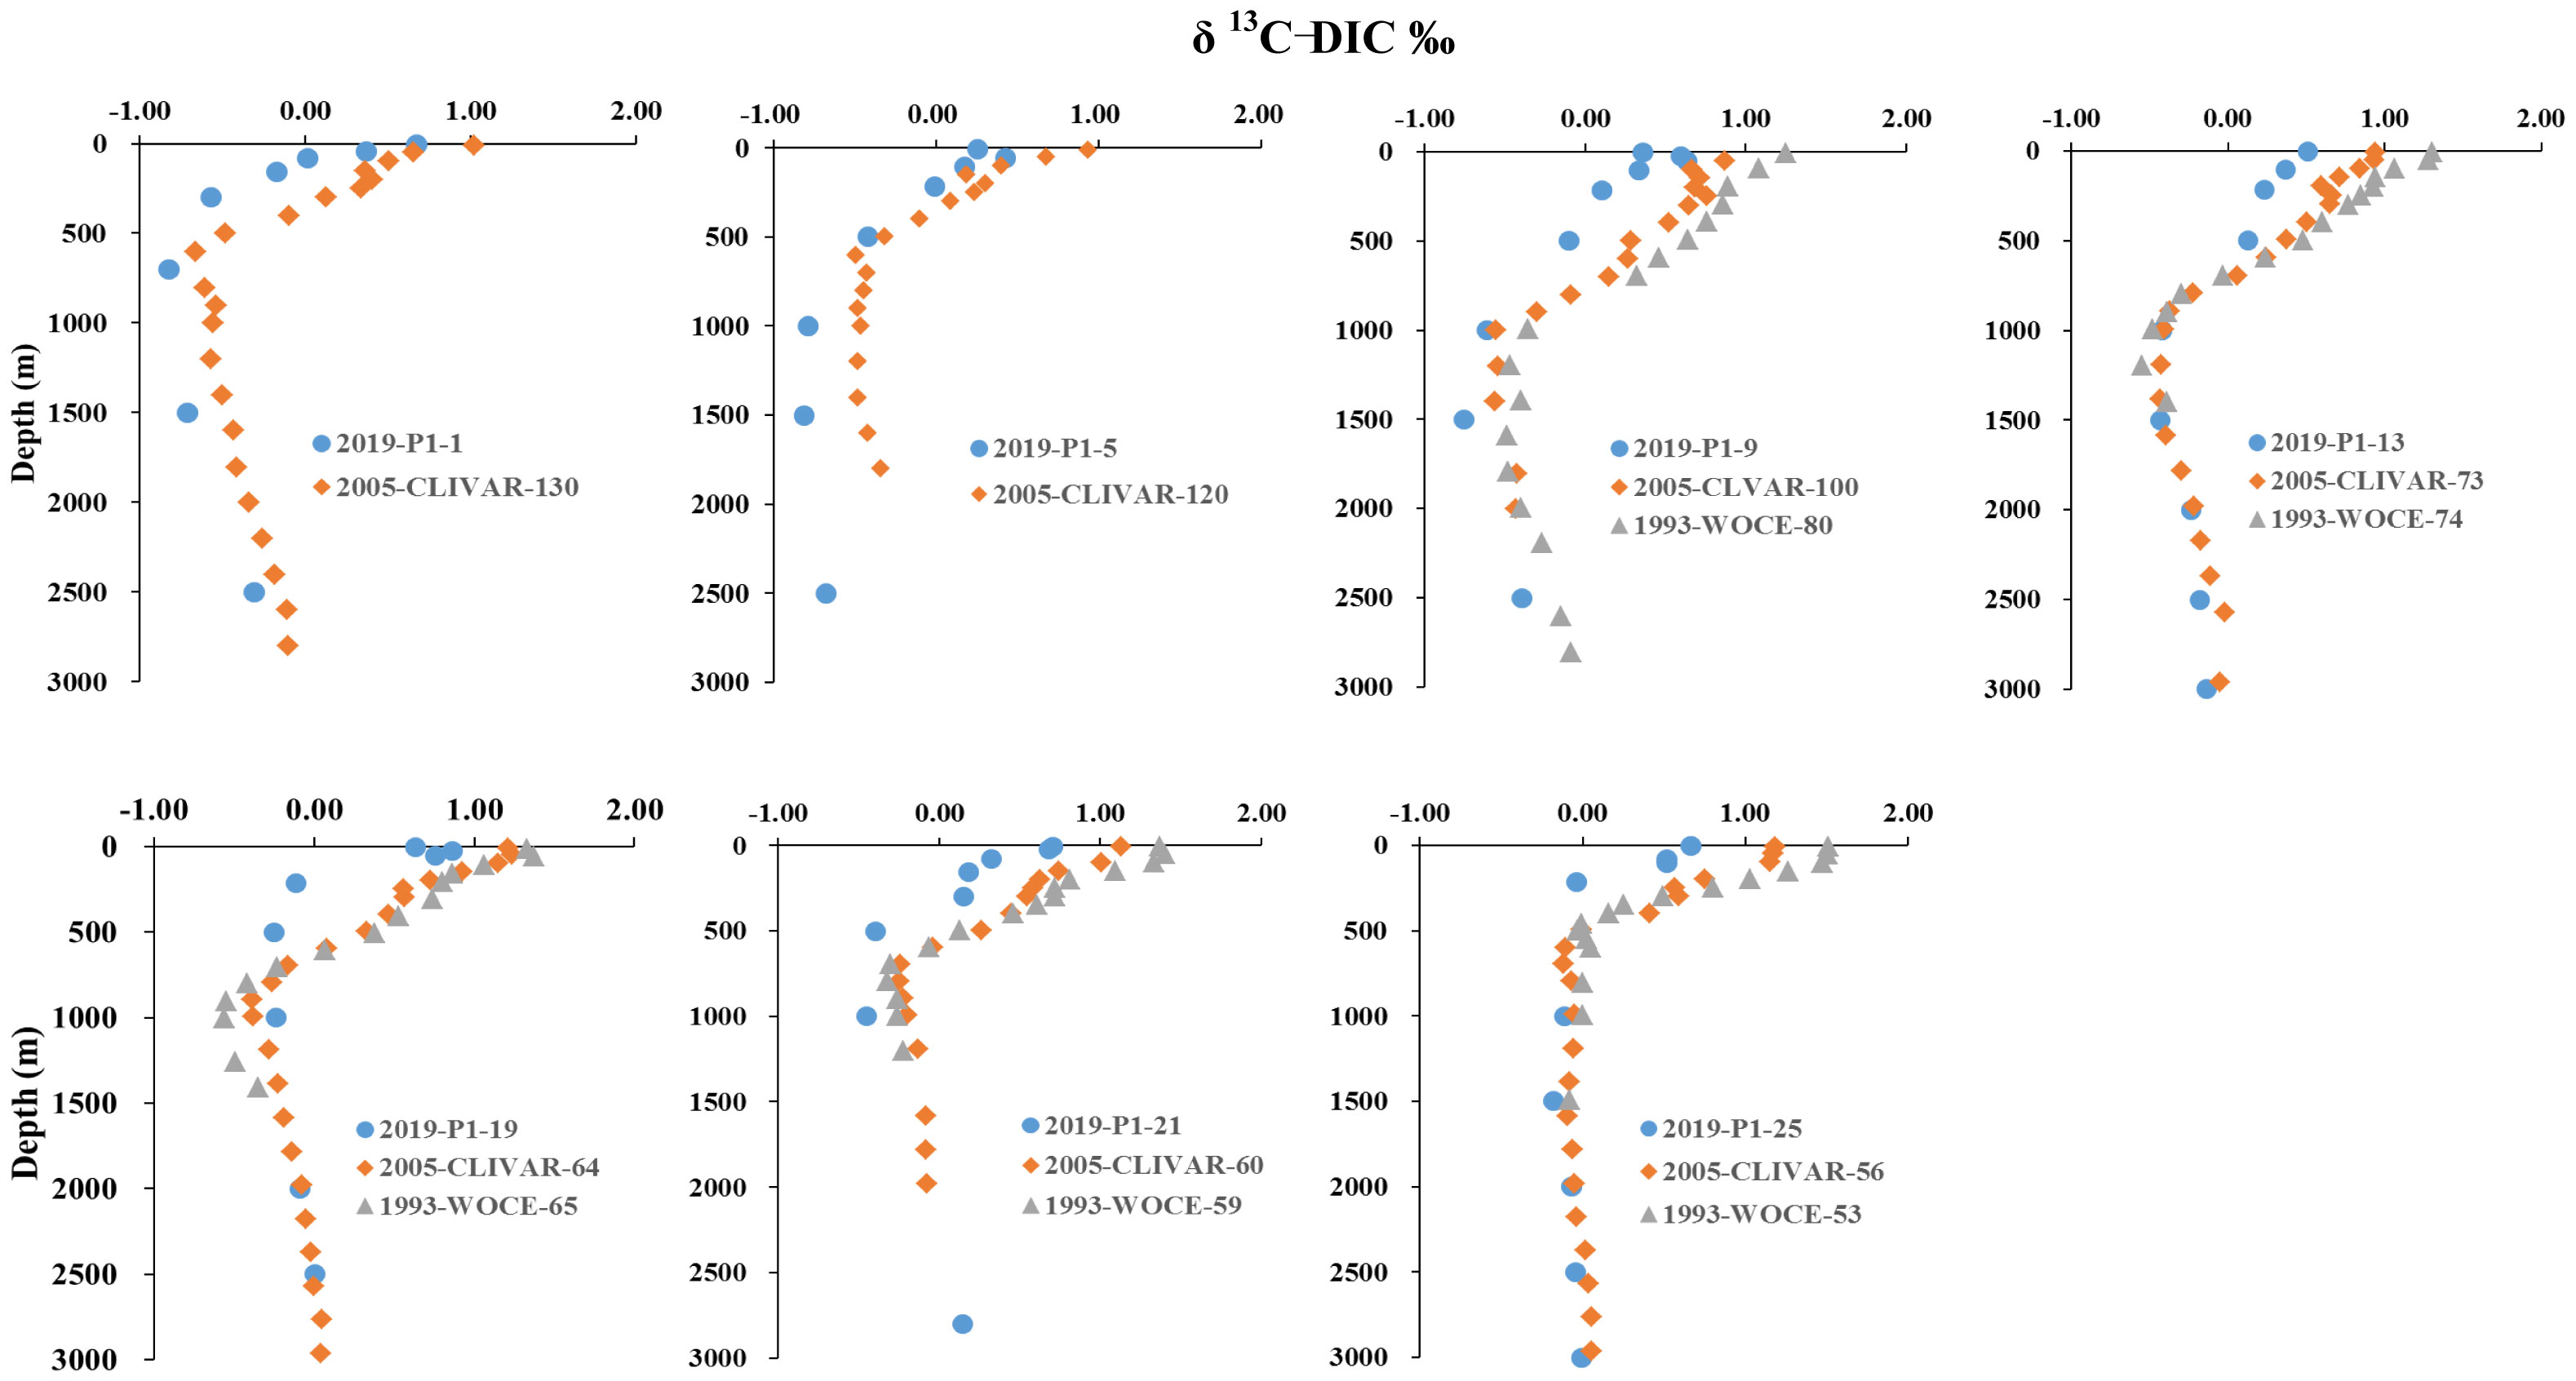
Figure 7 Comparison of the depth profiles of the δ13C-DIC values measured for stations along transect P1 in 2019 in our study with those obtained at nearby stations along CLIVAR line P10N in 2005 and WOCE line P10 in 1993 in the upper 3,000 m of water in the northwestern NP. The data for lines P10N and P10 are from the GLODAP database (https://www.glodap.info/).
At depths of ~500–3,000 m, especially between 30°N and 40°N, the minimum value of δ13C-DIC along the vertical profile has also significant declined since 1993 (Figures 6 and 7), which indicated that the signal of 13C-depleted atmospheric CO2 from anthropogenic sources should have reach at least 3,000 m. The δ13C-DIC values for samples from depths between 1,000 and 3,000 m as a function of latitude (10°N–40°N) from 1993, 2005 and 2019 showed that the δ13C values of the three transects increased slightly with latitude in a southward direction (Figure 8). Well-ventilated water masses in this area may be most affected by perturbations that reduce δ13C-DIC. The KE region is a high-productivity area with rapid hydrodynamic mixing (Isada et al., 2009; Shiozaki et al., 2014). However, the low temperature and weak vertical stratification of the upper water column do not favor the degradation of POC in the surface. The particles from plankton degradation are quickly carried to the deep water by sink water (Ge et al., 2022b). The lowest DO values at depths of ~500–3,000 m at 30°N–40°N showed that biological oxygen consumption in this area is relatively high. Remineralization of POC (δ13C ranging from -21‰ to -18‰ in the Pacific Ocean) (Druffel et al., 1992; Shan et al., 2020) from the surface could provide sufficient source transport of anthropogenic carbon to the NPIW and Pacific Deep Water.
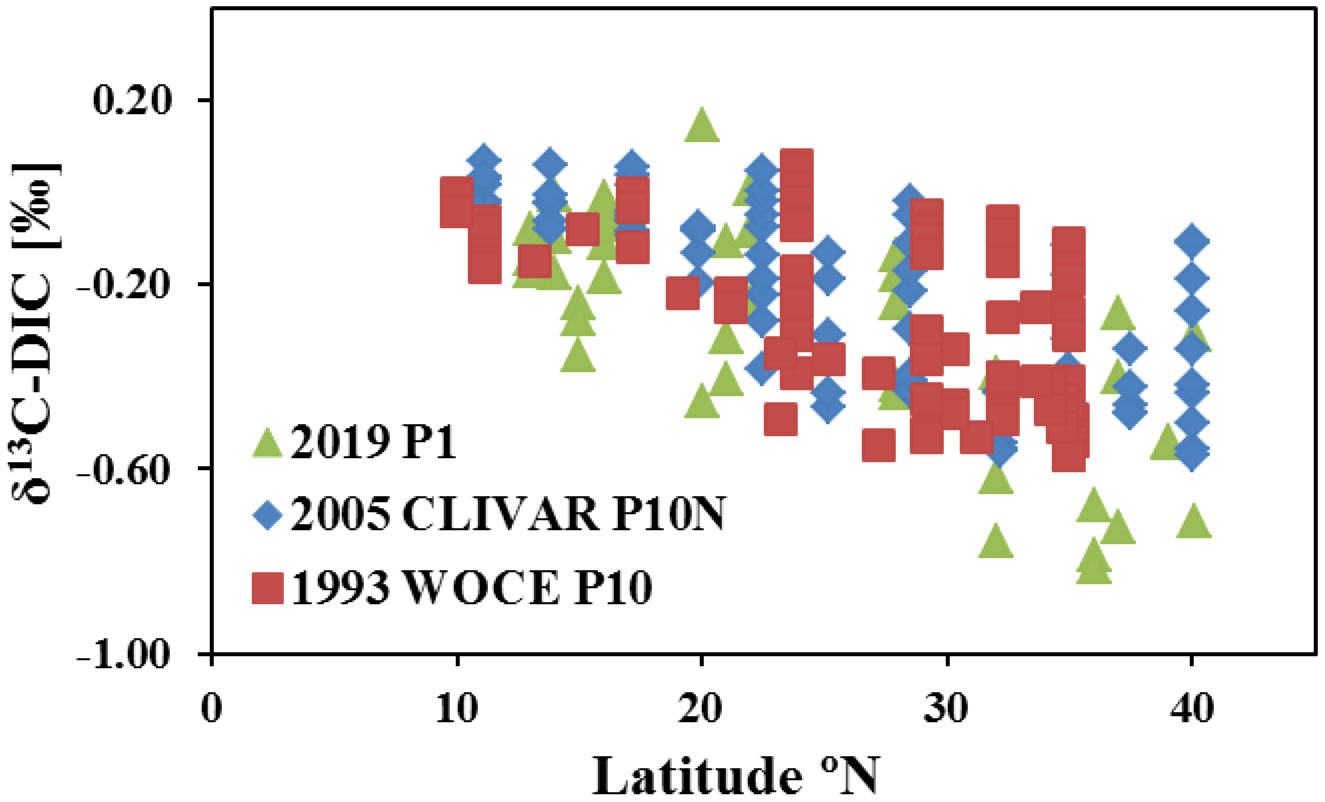
Figure 8 The δ13C-DIC values for samples between 1,000 and 3,000 m depths as a function of latitude (10°N–40°N) from 1993, 2005 and 2019.
Conclusions
Our study revealed that δ13C-DIC values ranged from -0.83‰ to 0.86‰ for water samples along the P1 transect in the western NP, and the values decreased with increasing water depth. The relatively high δ13C-DIC values (-0.17‰ to 0.86‰) in the surface water are influenced by mixed processes of air-sea exchange of atmospheric CO2 and isotope fractionation during phytoplankton photosynthesis. In the upper 200 m, δ13C-DIC values were lower at high latitudes than at lower latitudes, likely controlled by contributions of the Oyashio Current with low δ13C-DIC values in the KE region. A downward trend from north to south occurred in the δ13C-DIC signature in the western NP in the NPIW and deep water, which reflects the remineralization of organic matter with the horizontal transport of NPIW and Pacific Deep Water. At depth, the movement of different water masses and mixing as well as bathypelagic respiration in the dark water of the ocean all play important roles in influencing the distribution of isotopic signatures of DIC in the western NP Ocean.
The values of δ13C-DIC in the upper water layers along the P1 transect decreased in the NP compared with observations of the nearby transect of P10 in 1993 and P10N transect in 2005 due to increased anthropogenic carbon penetration into the ocean. The values decreased at an average rate of 0.28‰ per decade from 1993 to 2019. This decrease was generally consistent with that calculated from the increase in anthropogenic CO2 input in the NP. The rate of decrease in δ13C-DIC from 2005 to 2019 was slightly faster than that between 1993 and 2005, which could suggest that air-sea exchange in the study area may have accelerated the absorption of anthropogenic CO2 in recent years.
Data availability statement
The original contributions presented in the study are included in the article/Supplementary Material. Further inquiries can be directed to the corresponding author.
Author contributions
XW conceptualized and led the studies. ZC and JZ helped with the research project and cruises. TG participated in the study, data analysis and wrote the manuscript. CL and PR collected samples. CL, HZ, TG, HC, and DF carried out the chemical and isotope analyses of the samples. All authors provided intellectual inputs and contributed to the final version of the paper.
Funding
Financial support for this work was provided by the Ocean Program of the National Natural Science Foundation of China (Grant numbers 91858210 and 41476057) and the Western Pacific P1 Section Observation Voyage of the Shandong Major Science and Technology Innovation Project (2018SDKJ0105-1).
Acknowledgments
We thank the captain and crew of the R/V Dongfanghong-3 for their assistance during the cruise. We thank Editor Dr. Sun Jun and the two reviewers for the valuable and constructive comments. The raw data from this study are provided in Supplementary Table 1 of the Supplementary Material.
Conflict of interest
The authors declare that the research was conducted in the absence of any commercial or financial relationships that could be construed as a potential conflict of interest.
Publisher’s note
All claims expressed in this article are solely those of the authors and do not necessarily represent those of their affiliated organizations, or those of the publisher, the editors and the reviewers. Any product that may be evaluated in this article, or claim that may be made by its manufacturer, is not guaranteed or endorsed by the publisher.
Supplementary material
The Supplementary Material for this article can be found online at: https://www.frontiersin.org/articles/10.3389/fmars.2022.998437/full#supplementary-material
References
Andres R. J., Marland G., Boden T., Bischof S. (1996). “Carbon dioxide emissions from fossil fuel consumption and cement manufacture,1751 to 1991, and an estimate of their isotopic composition and latitudinal distribution,” in The carbon cycle. Ed. Wigely T. M. L. (Cambridge Univ. Press: New York), 1–18.
Broecker W. S., Maier-Reimer E. (1992). The influence of air and sea exchange on the carbon isotope distribution in the sea. Global Biogeochem. Cycles. 6 (3), 315–320. doi: 10.1029/92GB01672
Broecker W. S., Peteet D. M., Rind D. (1985). Does the ocean–atmosphere system have more than one stable mode of operation? Nature 315 (6014), 21–26. doi: 10.1038/315021a0
Craig H. (1957). Isotopic standards for carbon and oxygen and correction factors for mass-spectrometric analysis of carbon dioxide. Geochim. Cosmochim. Acta 12 (1-2), 133–149. doi: 10.1016/0016-7037(57)90024-8
Ding L., Ge T., Gao H., Luo C., Xue Y., Druffel E. R. M., et al. (2018). Large Variability of dissolved inorganic radiocarbon in the Kuroshio Extension of the northwest North Pacific. Radiocarbon 60 (2), 691–704. doi: 10.1017/RDC.2017.143
Ding L., Qi Y., Shan S., Ge T., Luo C., Wang X. (2020). Radiocarbon in dissolved organic and inorganic carbon of the south China sea. J. Geophys. Res. Oceans 125 (4), 1–14. doi: 10.1029/2020JC016073
Druffel E. R., Williams P. M., Bauer J. E., Ertel J. R. (1992). Cycling of dissolved and particulate organic matter in the open ocean. J. Geophys. Res. Ocean 97 (C10), 15639–15659. doi: 10.1029/92JC01511"10.1029/92JC01511
Druffel E. R., Bauer J. E., Griffin S., Beaupré S. R., Hwang J. (2008). Dissolved inorganic radiocarbon in the North Pacific Ocean and Sargasso Sea. Deep Sea Res. I Oceanogr. Res. Pap. 55 (4), 451–459. doi: 10.1016/j.dsr.2007.12.007
Eide M., Olsen A., Ninnemann U. S., Eldevik T. (2017). A global estimate of the full oceanic 13C suess effect since the preindustrial. Global Biogeochem. Cycles 31 (3), 492–514. doi: 10.1002/2016GB005473
Ge T., Luo C., Peng R., Zhang H., Chen H., Chen Z., et al. (2022b). Ed organic carbon along a meridional transect in the western North Pacific Ocean: Distribution, variation and controlling processes. Front. Mar. Sci. 9. doi: 10.3389/fmars.2022.909148
Ge T., Luo C., Ren P., Zhang H., Chen Z., Sun S., et al. (2022a). Decadal variations in radiocarbon in dissolved inorganic carbon (DIC) along a transect in the western. J. Geophys. Res. Oceans 127, e2021JC017845. doi: 10.1029/2021JC017845
Gruber N., Keeling C. D., Bacastow R. B., Guenther P. R., Lueker T. J., Wahlen M., et al. (1999). Spatiotemporal patterns of carbon-13 in the global surface oceans and the oceanic suess effect. Global Biogeochem. Cycles 13 (2), 307–335. doi: 10.1029/1999GB900019
Hu D., Wu L., Cai W., Gupta A. S., Ganachaud A., Qiu B., et al. (2015). Pacific western boundary currents and their roles in climate. Nature 522 (7556), 299–308. doi: 10.1038/nature14504
Isada T., Kuwata A., Saito H., Ono T., Ishii M., Yoshikawa-Inoue H., et al. (2009). Photosynthetic features and primary productivity of phytoplankton in the oyashio and Kuroshio–Oyashio transition regions of the Northwest Pacific. J. Plankton. Res. 31 (9), 1009–1025. doi: 10.1093/plankt/fbp050
Itou M., Ono T., Noriki S. (2003). Provenance of intermediate waters in the western North Pacific deduced from thermodynamic imprint on δ13C of DIC. J. Geophys. Res. Oceans 108 (C11), 3347. doi: 10.1029/2002JC001746
Keeling C. D., Piper S. C., Bacastow R. B., Wahlen M., Whorf T. P., Heimann M., et al. (2005). “Atmospheric CO2 and 13CO2 exchange with the terrestrial biosphere and oceans from 1978 to 2000: Observations and carbon cycle implications,” in A history of atmospheric CO2 and its effects on plants, animals, and ecosystems. Eds. Baldwin I. T., Caldwell M. M., Heldmaier G., Jackson R. B., Lange O. L., Mooney H. A., Schulze E.-D. (New York: Springer), 83–113.
Keeling R. F., Piper S. C., Bollenbacher A. F., Walker S. J. (2010). “Monthly atmospheric 13C/12C isotopic ratios for 11 SIO stations,” in Trends: A compendium of data on global change, carbon dioxide information analysis center (Oak Ridge, USA: Oak Ridge National Laboratory, US Department of Energy).
Keeling C. D., Bacastow R. B., Carter A. F., Piper S. C., Whorf T. P., Heimann M., et al. (1989). “A three-dimensional model of atmospheric CO2 transport based on observed winds: 1. analysis of observational data,” in Aspects variability in the Pacific and the Western Americas. Ed. Peterson D. H. (Washington: AGU Publication), 165–236.
Key R. M. (1996). WOCE Pacific ocean radiocarbon program. Radiocarbon 38 (3), 415–423. doi: 10.1017/S003382220003006X
Key R. M., Kozyr A., Sabine C. L., Lee K., Wanninkhof R., Bullister J. L., et al. (2004). A global ocean carbon climatology: Results from global data analysis project (GLODAP). Global Biogeochem. Cycles 18, GB4031. doi: 10.1029/2004GB002247
Körtzinger A., Quay P. D., Sonnerup R. E. (2003). Relationship between anthropogenic CO2 and the 13C suess effect in the north Atlantic ocean. Global Biogeochem. Cycles 17 (1), 1005. doi: 10.1029/2001GB001427
Kroopnick P. M. (1985). The distribution of 13C of ΣCO2 in the world oceans. Deep Sea Res. I Oceanogr. Res. Pap. 32 (1), 57–84. doi: 10.1016/0198-0149(85)90017-2
Kumamoto Y., Murata A., Kawano T., Watanabe S., Fukasawa M. (2013). Decadal changes in bomb-produced radiocarbon in the Pacific Ocean from the 1990s to 2000s. Radiocarbon 55 (2–3), 1641–1650. doi: 10.2458/azu_js_rc.55.16238
Li C. L., Han L., Zhai W. D., Qi D., Wang X. C., Lin H. M., et al. (2022). Storage and redistribution of anthropogenic CO2 in the western North Pacific: The role of subtropical mode water transportation. Fundam. Res., 1–10. doi: 10.1016/j.fmre.2022.05.001
Liu Q., Zhang J., Huang Z., Huang N. (2010). The stable isotope geochemical characteristics of dissolved inorganic carbon in northern south China Sea. Chin. J. Geochem. 29 (3), 287–292. doi: 10.1007/s11631-010-0458-2
Lynch-Stieglitz J., Stocker T. F., Broecker W. S., Fairbanks R. G. (1995). The influence of air-sea exchange on the isotopic composition of oceanic carbon, observation and modeling. Global Biogeochem. Cycles 9, 653–665. doi: 10.1029/95GB02574
Ma X., Jing Z., Chang P., Liu X., Montuoro R., Justin S. R., et al. (2016). Western Boundary currents regulated by interaction between ocean eddies and the atmosphere. Nature 535 (7613), 533–537. doi: 10.1038/nature18640
McNichol A. P., Druffel E. R. (1992). Variability of the δ13C of dissolved inorganic carbon at a site in the North Pacific Ocean. Geochim. Cosmochim. Acta 56 (9), 3589–3592. doi: 10.1016/0016-7037(92)90402-5
McNichol A. P., Schneider R. J., von Reden K. F., Gagnon A. R., Elder K. L., Nosams K., et al. (2000). Ten years after–the WOCE AMS radiocarbon program. Nucl. Instrum. Methods Phys. Res. B. 172 (1–4), 479–484. doi: 10.1016/S0168-583X(00)00093-8
Mook W. G., Bommerson J. C., Staverman W. H. (1974). Carbon isotope fractionation between dissolved bicarbonate and gaseous carbon dioxide. Earth Planet. Sci. Lett. 22 (2), 169–176. doi: 10.1016/0012-821X(74)90078-8
Murata A., Kumamoto Y., Sasaki K. I., Watanabe S., Fukasawa M. (2009). Decadal increases of anthropogenic CO2 along 149 e in the western North Pacific. J. Geophys. Res. Oceans 114 (C4), C04018. doi: 10.1029/2008JC004920
Olsen A., Key R. M., Van Heuven S., Lauvset S. K., Velo A., Lin X., et al. (2016). The global ocean data analysis project version 2 (GLODAPv2)–an internally consistent data product for the world ocean. Earth Syst. Sci. Data 8 (2), 297–323. doi: 10.5194/essd-8-297-2016
Olsen A., Ninnemann U. (2010). Large δ13C gradients in the preindustrial north Atlantic revealed. Science 330 (6004), 658–659. doi: 10.1126/science.1193769
Qiu B., Chen S. (2005). Variability of the Kuroshio Extension jet, recirculation gyre, and mesoscale eddies on decadal timescales. J. Phys. Oceanogr. 35 (11), 2090–2103. doi: 10.1175/JPO2807.1
Qiu B., Chen S. (2010). Eddy-mean flow interaction in the decadally modulating Kuroshio Extension system. Deep Sea Res. II: Top. Stud. Oceanogr. 57 (13-14), 1098–1110. doi: 10.1016/j.dsr2.2008.11.036
Qiu B. O., Chen S. (2011). Effect of decadal Kuroshio Extension jet and eddy variability on the modification of North Pacific Intermediate Water. J. Phys. Oceanogr. 41 (3), 503–515. doi: 10.1175/2010JPO4575.1
Qiu B., Chen S., Schneider N., Taguchi B. (2014). A coupled decadal prediction of the dynamic state of the Kuroshio Extension system. J. Climate 27 (4), 1751–1764. doi: 10.1175/JCLI-D-13-00318.1
Quay P., Sonnerup R., Stutsman J., Maurer J., Körtzinger A., Padin X. A., et al. (2007). Anthropogenic CO2 accumulation rates in the north Atlantic ocean from changes in the 13C/12C of dissolved inorganic carbon. Global Biogeochem. Cycles 21, GB1009. doi: 10.1029/2006GB002761
Quay P., Sonnerup R., Westby T., Stutsman J., McNichol A. (2003). Changes in the 13C/12C of dissolved inorganic carbon in the ocean as a tracer of anthropogenic CO2 uptake. Global Biogeochem. Cycles 17 (1), 1004. doi: 10.1029/2001GB001817
Racapé V., Metzl N., Pierre C., Reverdin G., Quay P. D., Ólafsdóttir S. R. (2014). The seasonal cycle of δ13CDIC in the north Atlantic subpolar gyre. Biogeosciences 11 (6), 1683–1692. doi: 10.5194/bg-11-1683-2014
Rogachev K. A., Carmack E. C., Salomatin A. S. (2000). Recent thermohaline transition in the Pacific western subarctic boundary currents and their fresh core eddies: the response of sound-scattering layers. J. Mar. Syst. 26 (3), 239–258. doi: 10.1016/S0924-7963(00)00036-1
Schlitzer R. (2015) Ocean data view. Available at: http://odv.awi.de.
Schmittner A., Gruber N., Mix A. C., Key R. M., Tagliabue A., Westberry T. K. (2013). Biology and air–sea gas exchange controls on the distribution of carbon isotope ratios (δ13C) in the ocean. Biogeosciences 10 (9), 5793–5816. doi: 10.5194/bg-10-5793-2013
Schuur E. A. G., Carbone M. S., Pries C. E. H., Hopkins F. M., Natali S. M. (2016). “Radiocarbon in terrestrial systems,” in Radiocarbon and climate change. Eds. Schuur E. A. G., Druffel E., Trumbore S. E. (Cambridge: Springer), 167–220.
Shan S., Qi Y., Tian J., Wang X., Luo C., Zhou C., et al. (2020). Carbon cycling in the deep Mariana Trench in the western North Pacific Ocean: Insights from radiocarbon proxy data. Deep Sea Res. I Oceanogr. Res. Pap. 164, 103370–577. doi: 10.1016/j.dsr.2020.103370
Shiozaki T., Ito S., Takahashi K., Saito H., Nagata T., Furuya K. (2014). Regional variability of factors controlling the onset timing and magnitude of spring algal blooms in the northwestern North Pacific. J. Geophys. Res. Oceans 119, 253–265. doi: 10.1002/2013JC009187
Siegenthaler U., Sarmiento J. L. (1993). Atmospheric carbon dioxide and the ocean. Nature 365, 119–125. doi: 10.1038/365119a0
Sonnerup R. E., Quay P. D. (2012). 13C constraints on ocean carbon cycle models. Global Biogeochem. Cycles 26 (2), GB2014. doi: 10.1029/2010GB003980
Tagliabue A., Bopp L. (2008). Towards understanding global variability in ocean carbon-13. Global Biogeochem. Cycles 22, GB1025. doi: 10.1029/2007GB003037
Taguchi B., Xie S.-P., Schneider N., Nonaka M., Sasaki H., Sasai Y. (2007). Decadal variability of the Kuroshio Extension: Observations and an eddy-resolving model hindcast. J. Climate 20 (11), 2357–2377. doi: 10.1175/JCLI4142.1
Takahashi Y., Matsumoto E., Watanabe Y. W. (2000). The distribution of δ13C in total dissolved inorganic carbon in the central North Pacific Ocean along 175°e and implications for anthropogenic CO2 penetration. Mar. Chem. 69 (3-4), 237–251. doi: 10.1016/S0304-4203(99)00108-5
Takahashi T., Sutherland S. C., Wanninkhof R., Sweeney C., Feely R., Chipman D. W., et al. (2009). Climatological mean and decadal change in surface ocean pCO2, and net sea-air CO2 flux over the global oceans. Deep Sea Res. I Oceanogr. Res. Pap. 56 (8–10), 554–577. doi: 10.1016/j.dsr2.2008.12.009
Talley L. D., Nagata Y., Fujimura M., Iwao T., Kono T., Inagake D., et al. (1995). North Pacific Intermediate Water in the Kuroshio/Oyashio mixed water region. J. Phys. Oceanogr. 25 (4), 475–501. doi: 10.1175/1520-0485(1995)025<0475:NPIWIT>2.0.CO;2
Tsunogai S., Ono T., Watanabe S. (1993). Increase in total carbonate in the western North Pacific water and a hypothesis on the missing sink of anthropogenic carbon. J. Oceanogr. 49 (3), 305–315. doi: 10.1007/2FBF02269568
Yasuda I., Okuda K., Shimizu Y. (1996). Distribution and modification of North Pacific Intermediate Water in the Kuroshio-Oyashio interfrontal zone. J. Phys. oceanogr. 26 (4), 448–465. doi: 10.1175/1520-0485(1996)026<0448:DAMONP>2.0.CO;2
Yatsu A., Chiba S., Yamanaka Y., Ito S. I., Shimizu Y., Kaeriyama M., et al. (2013). Climate forcing and the Kuroshio/Oyashio ecosystem. ICES J. Mar. Sci. 70 (5), 922–933. doi: 10.1093/icesjms/fst084
Keywords: dissolved inorganic carbon, stable isotope carbon, Western North Pacific Ocean, Kuroshio Extension, North Pacific Intermediate Water
Citation: Ge T, Luo C, Ren P, Zhang H, Fan D, Chen H, Chen Z, Zhang J and Wang X (2022) Stable carbon isotopes of dissolved inorganic carbon in the Western North Pacific Ocean: Proxy for water mixing and dynamics. Front. Mar. Sci. 9:998437. doi: 10.3389/fmars.2022.998437
Received: 20 July 2022; Accepted: 07 September 2022;
Published: 23 September 2022.
Edited by:
Jun Sun, China University of Geosciences Wuhan, ChinaCopyright © 2022 Ge, Luo, Ren, Zhang, Fan, Chen, Chen, Zhang and Wang. This is an open-access article distributed under the terms of the Creative Commons Attribution License (CC BY). The use, distribution or reproduction in other forums is permitted, provided the original author(s) and the copyright owner(s) are credited and that the original publication in this journal is cited, in accordance with accepted academic practice. No use, distribution or reproduction is permitted which does not comply with these terms.
*Correspondence: Xuchen Wang, eHVjaGVud2FuZ0BvdWMuZWR1LmNu
†These authors have contributed equally to this work and share first authorship