Abstract
Study of resource and environmental carrying capacity is an important research content of sustainable development science and the theoretical support for land space optimization. Existing research theories need to be deepened, and spatial simulation studies are relatively lacking. This study aimed to assess the current and future resource and environmental carrying capacity in the Yangtze River Delta region’s coastal zone and enhance sustainable development by exploring the application of shared socioeconomic pathway (SSPs) scenarios at the spatial pattern scale in regional resource and environmental carrying capacity simulation studies. Based on the FLUS and InVEST models, this study introduced the Coastal Resource and Environmental Carrying Capacity Index (CRECC) from the dimensions of “pressure” and “support” using land use remote sensing monitoring data and SSPs scenario data. A CRECC evaluation index system and quantitative evaluation method for the Yangtze River Delta were constructed. The results showed that from 2000 to 2020, the CRECC of the Yangtze River Delta coastal zone increased, the carrying capacity decreased, and the spatial distribution was low in the north and high in the south. The carrying capacity under the five SSP scenarios did not improve. The mismatch between natural ecological conditions and the intensity of human activities in the shoreline area was more prominent than in the study area, with the SSP1 and SSP5 scenarios being the most obvious. The supporting indicators have a more significant influence on improving CRECC than the pressure indicators, among which the supply capacity of water resources, land resources, and atmospheric environmental quality are the main limiting factors in the process of future sustainable economic-ecological development. This study provides ideas and examples for exploring spatial and temporal predictions of resources and environmental carrying capacity in coastal zones.
1 Introduction
In China, coastal areas carry approximately 44.66% of the human population and 56.02% of the economic aggregate (according to the Statistical Bulletin of China’s National Economic and Social Development in 2020). Coastal zones, with their abundance of terrestrial and aquatic resources, are a rich source of material and ecosystem services, and constitute a complex system of human-ecological interactions (Díaz et al., 2018). As a result, they provide an excellent research opportunity for the field of Earth system science (Ramesh et al., 2015). Additionally, given continued resource depletion and industrial development, coastal areas face enormous pressures and challenges in securing human livelihoods while conserving their environment. Therefore, whether coastal zones can sustainably support human-economic demands while remaining environmentally sound is a widespread and critical concern for researchers, governments, and various other stakeholders (Nyima, 2015; Chen D. et al., 2020; Yan et al., 2022). Accordingly, achieving socioeconomic progress within the carrying capacity of coastal areas’ material resources and ecosystems has become a key focus of geography, ecology, and sustainability science, and a path to reaching Sustainable Development Goals (Sowman and Raemaekers, 2018).
Humans have a long history of understanding carrying capacity. Since the advent of the Anthropocene, the impact of socioeconomic activities on ecosystem structure and function, as well as the sustainable provision of ecosystem services, has become more profound. Consequently, their effects on human well-being have become more pronounced. “Carrying capacity” is a scientific concept that measures the relationship between human economic and social activities and the natural environment. Hence it is a crucial tool for managing sustainable development (Del Monte-Luna et al., 2004). It calculates the baselines and capacities of various elements, including population, land, water resources, and so on, and prompts equitable and sustainable use of resources in line with these environmental thresholds (Hák et al., 2016). This includes research on population carrying capacity (Lei et al., 2009), ecological carrying capacity (Rees, 1992; Nakajima and Ortega, 2016), and resource carrying capacity (Shi et al., 2013; Naimi-Ait-Aoudia and Berezowska-Azzag, 2014).
The concepts of sustainable resource use and environmental carrying capacity first emerged in China at the end of the 20th century (Yang and Ding, 2018; Liao et al., 2020). Current research methods include the ecological footprint (Mathis et al., 1999; Tang et al., 2022), state-space method (Mao and Yu, 2001), system dynamics model (Ercan et al., 2016), “pressure-state-response” and derived models (Matinzadeh et al., 2017), and comprehensive index method (Wu et al., 2020). Among these, the evaluation index system is currently the most widely used method, with index systems constructed using the following approaches: indicator systems based on the connotation of carrying capacity, such as “socio-economic-resource-environment,” “population-economy-resource-environment,” and other combinations of indicators (Cui et al., 2019); indicator systems based on the physical connotation of “carrying capacity,” with indicators divided into support and pressure systems and load and carrying systems (Shen et al., 2020; Du et al., 2021); and those based on element composition, such as land resource carrying capacity, water resource carrying capacity, atmospheric environment, and so on (Shi et al., 2013; Peng et al., 2019). However, there is a lack of authoritative methods for constructing index systems.
Studying the carrying capacity of coastal zone resources and ecosystems demands consideration of the unique characteristics of offshore resources, which are still being explored (Rani et al., 2015; Sowman and Raemaekers, 2018; Yang and Ding, 2018). Proposing a series of remediation measures, Wang et al. (2017) established a comprehensive method to identify important control factors in the Qingdao City Sea area, such as sewage discharge, livestock production, ammonia and nitrogen discharge, river runoff, and sewage treatment. Based on marine functional zoning, indicators showing human exploitation of marine and coastal areas, such as artificial shoreline classification and fishery farming areas, have been used to evaluate the marine utilization carrying capacity of Liaodong Bay (Xu et al., 2019).
Most resource and environmental carrying capacity studies have evaluated the current situation. However, to cope with resource and environmental problems arising from rapid urbanization and high-speed economic development, it is important to explore the coordinated development of coastal ecosystems and human activities in the future. Most studies on carrying capacity simulation adopt the system dynamics model to explore the relationship between carrying capacity and influencing factors and to predict its trends (Xing et al., 2019), or use the ecosystem service simulation method with land use simulation as the entry point (Yue et al., 2019). In the international field of sustainable science research, scenario analysis methods have gradually advanced in modeling future development (Duinker and Greig, 2007). Among multiple scenario frameworks, the Shared Socioeconomic Pathways (SSPs) developed by the Intergovernmental Panel on Climate Change (IPCC) depict different trajectories of future socioeconomic system development, resource use patterns, and environmental evolution. They are a powerful tool for exploring human and natural system development pathways (O’Neill et al., 2014; Elahi et al., 2021). SSPs have a unified and internationalized scenario framework that can provide several possibilities for the foreseeable future economic and social development of resources and environmental carrying capacity so that government organizations at all levels can improve the adaptability and support of decision-making based on different future development trends. Resource and environmental carrying capacity simulation and prediction based on SSPs can be connected to a higher degree with socioeconomic, agricultural production, or ecosystem fields.
Resource and environmental carrying capacity simulation studies often focus on predicting the future trend of the carrying capacity index, but fail to reveal the mechanisms of its carriers and carrying objects, which may not provide sufficient warning or foresight for the region’s future sustainable development. This study aimed to answer the following questions: i) How can we determine the influencing elements and assessment framework of coastal resources and environmental carrying capacity? ii) How can we determine the dynamic spatial and temporal evaluation mechanisms and simulation methods? iii) How can theoretical support be provided for sustainable regional optimization?
After examining current research progress, this study aims to explore the mechanism of resource and environmental carrying capacity, using the Yangtze River Delta as a case study area. We construct an evaluation framework for Coastal Resource and Environmental Carrying Capacity (CRECC), an index system, and a quantitative assessment method (Section 2). By conducting a simulation study from 2020 to 2050 based on the Shared Socioeconomic Pathways (SSPs), we display the current and future trends of regional CRECC changes and identify obstacles (Section 3). We then discuss and analyze the results (Section 4). This study makes the following contributions: i) presents new ideas for spatial and temporal simulation studies of resource and environmental carrying capacity, using an interdisciplinary approach that combines geography and sustainable development science; ii) tests the applicability and scalability of current theoretical methods and assessment frameworks in a typical coastal zone; and iii) provides new empirical analysis cases.
2 Materials and methods
2.1 Study area
Coastal and riverside areas have been strategically important for China to promote and achieve its coordinated regional development. The coastal provinces of the Yangtze River Delta (Shanghai, Jiangsu, and Zhejiang) are located at the intersection of the coast and river. The area has the greatest economic influence and largest industrial scale in China, with coastal cities along the river (Lianyungang, Yancheng, Nantong, and Shanghai in Jiangsu Province, and Jiaxing, Ningbo, Taizhou, and Wenzhou in Zhejiang Province) playing a pivotal role. By the end of 2020, the total resident population of the coastal provinces and cities in the Yangtze River Delta was approximately 174 million, and the total GDP reached 20.60 trillion yuan. The economic aggregates of Shanghai, Jiangsu, and Zhejiang rank among the top ten of China’s 31 provinces and cities in China. Eight coastal cities had a GDP of approximately 8.80 trillion-yuan, accounting for 42.72% of the total economic output of the Yangtze River Delta. In addition, according to the Global Port Development Report 2021, Shanghai and Ningbo ports rank first and third, respectively, in global port rankings and play a major role in international shipping and trade.
The Yangtze River Delta has a coastline of over 3,000 kilometers, which consists of extensive mudflats and other coastal ecosystems containing rich natural resources. The habitat of the Natural Heritage-listed Chinese Yellow (Bohai) Sea Migratory Bird is located in Yancheng City, which also houses 17 endangered IUCN species. However, since the 1990s, high-intensity beach reclamation, fishing, industrial production, and other human activities have led to the destruction and degradation of the local environment, resulting in a decline in biodiversity, the loss of coastal wetlands, and the degradation of fishery resources. Marine pollution and other disasters occur frequently, threatening the sustainability of the region. Therefore, the Yangtze River Delta coastal zone is a representative area for studying the carrying capacity of resources and the environment.
In this study, the eight coastal cities of Lianyungang, Yancheng, Nantong, Shanghai, Jiaxing, Ningbo, Taizhou, and Wenzhou were selected as the study area (Figure 1), covering 7.44×10⁴km2. A scenario simulation and prediction analysis for 2020-2050 was conducted based on the period between 2000 and 2020, during which economic and ecological conflicts were on the rise, serving as the base year for evaluation.
Figure 1
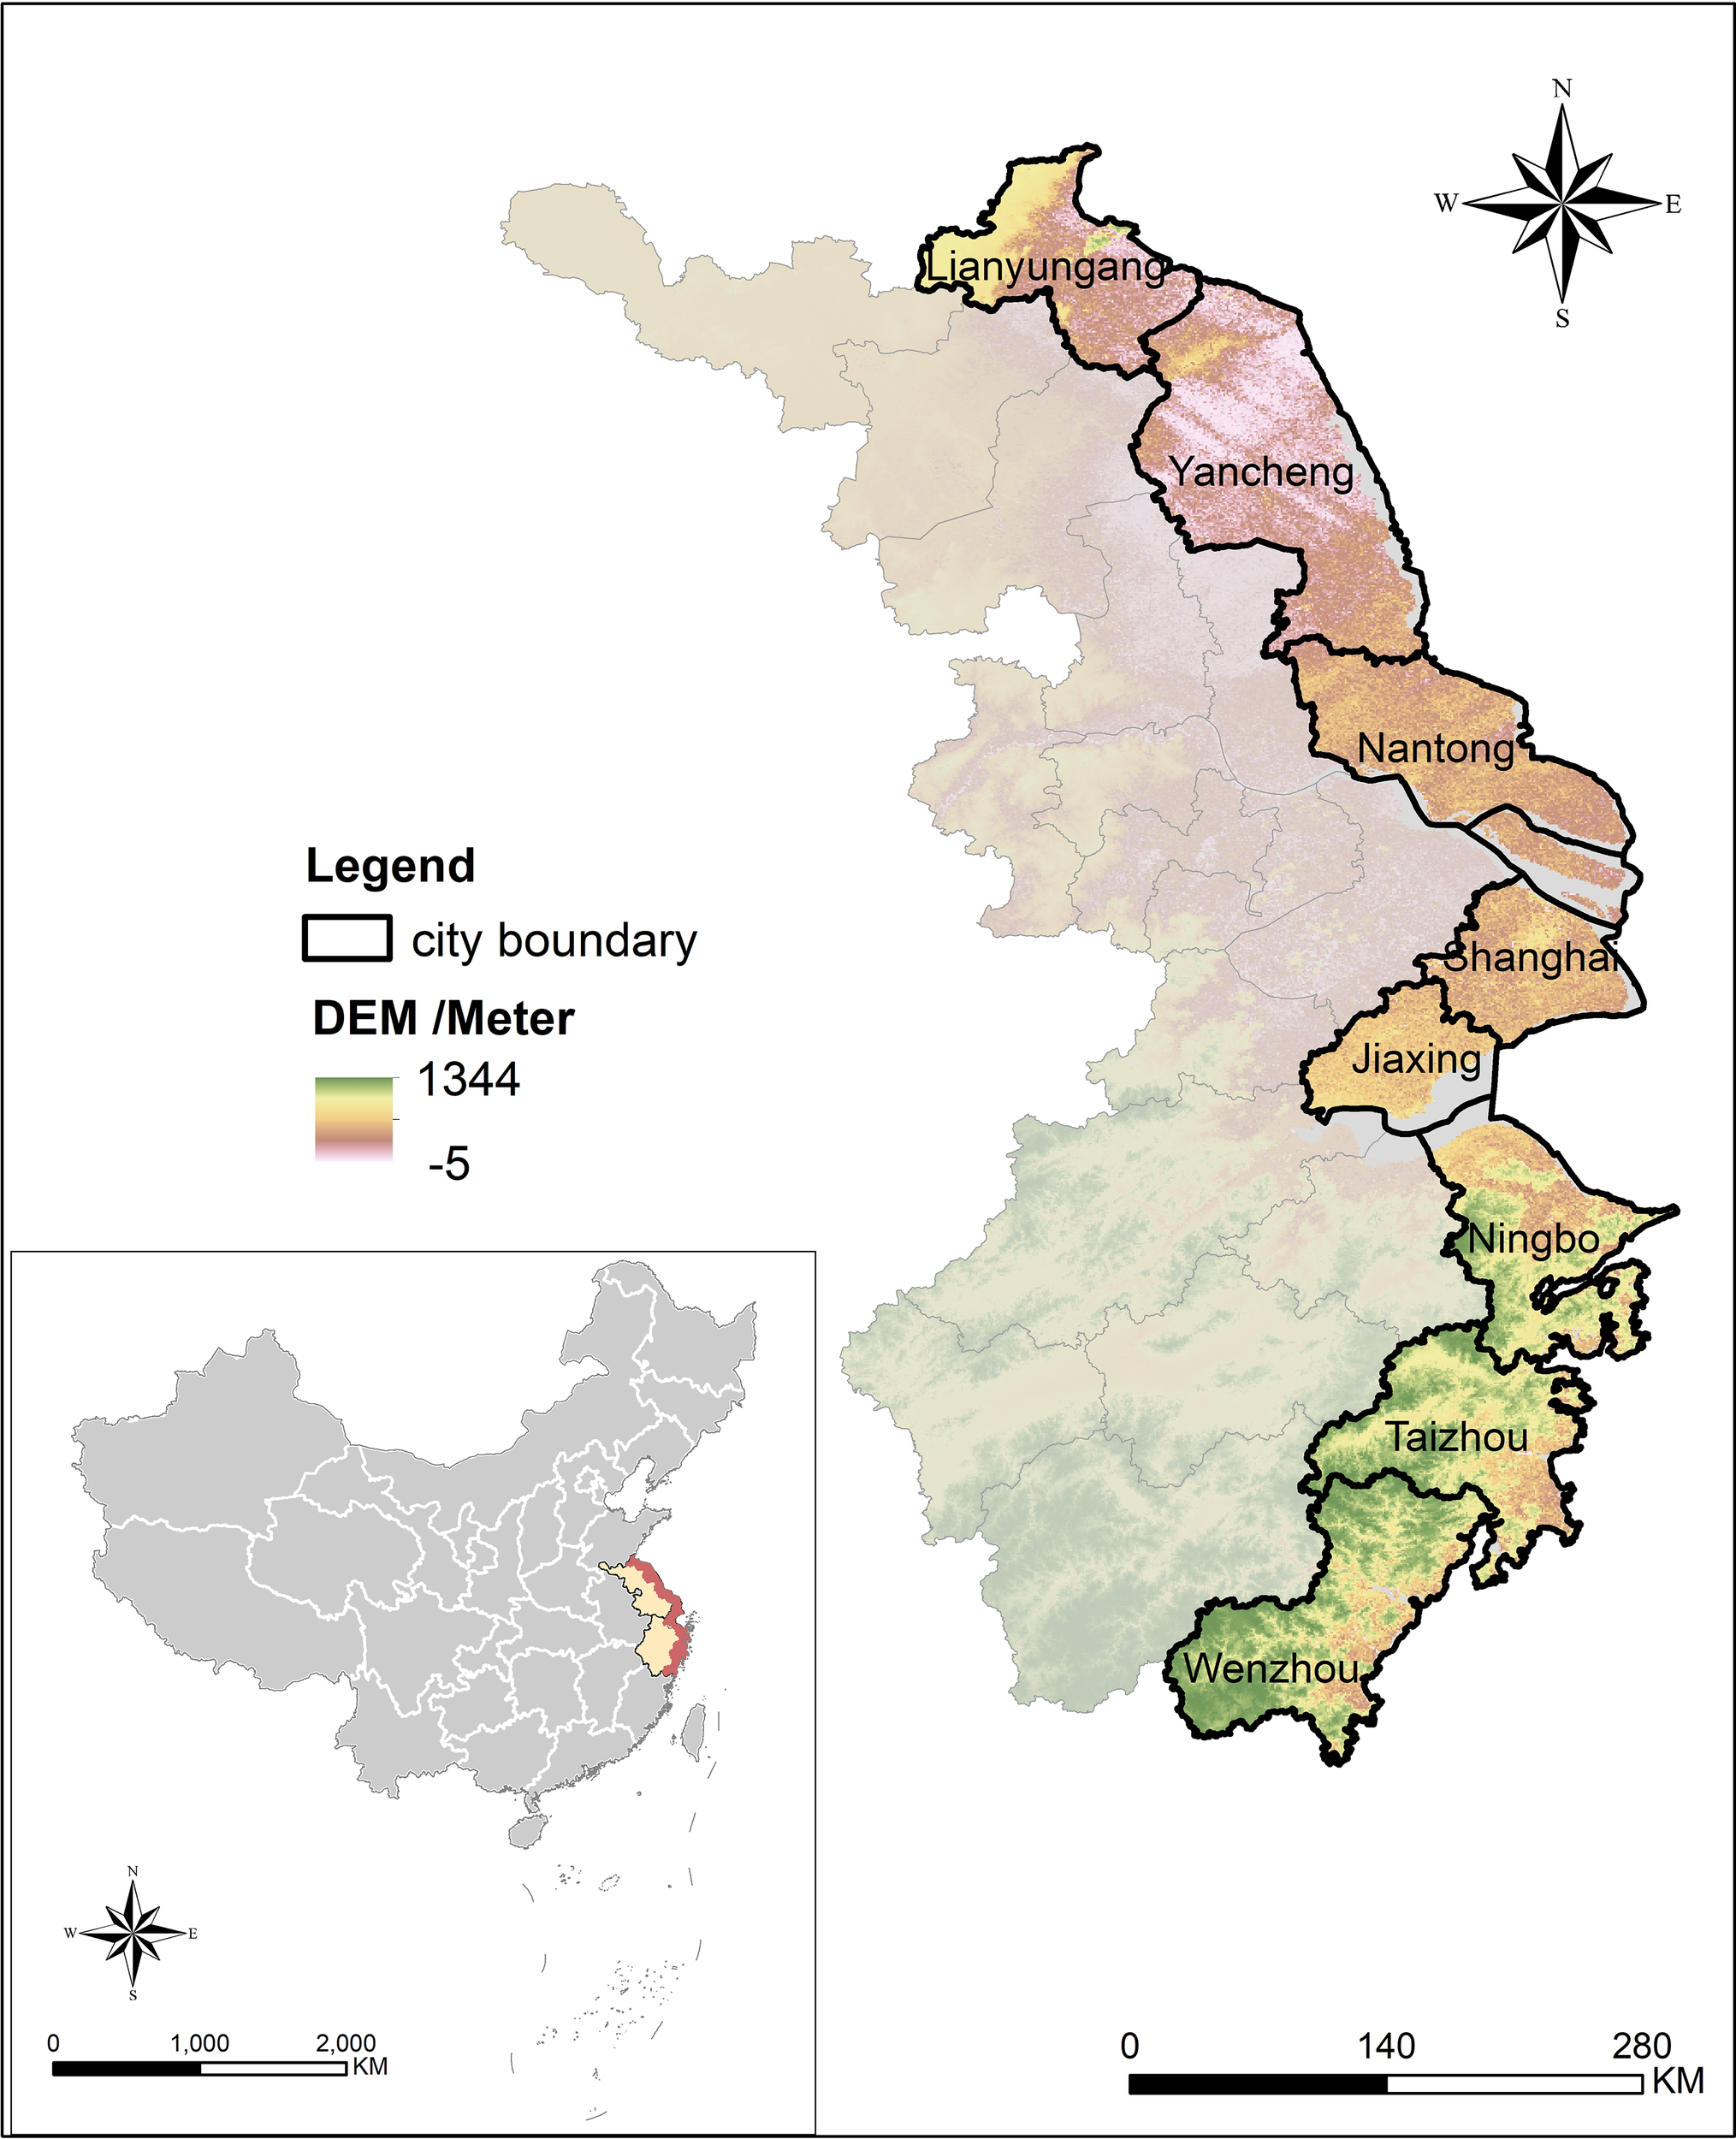
Geographical location of study area.
2.2 Data source
-
(1) Remote sensing data: land use data were obtained from Landsat satellite remote sensing images and generated by manual visual interpretation, which were reclassified into five categories: cultivated land (drylands and paddy fields), ecological land (forestland and grassland), wetlands (including rivers, lakes, and coastal mudflats), urban land (land in large, medium, and small cities and built-up areas above the county town), and other construction lands (rural settlements and other construction lands). The images for 2000 and 2020 were obtained from Landsat 5 TM and Landsat 8 OLI_TIRS satellites.
-
(2) Statistical data: agricultural, forestry, animal husbandry, and fishery production of various agricultural products, and other socioeconomic data were obtained from the China Statistical Yearbook, China Rural Statistical Yearbook, and China Urban Statistical Yearbook (2000-2020). Environmental monitoring data were obtained from the China Ecological Environment Quality Bulletin, the Global Ecological Environment Remote Sensing Monitoring Report, and the China Nearshore Marine Environment Quality Bulletin (2000-2020), etc.
-
(3) Other data: population and economic spatial data were calculated from land use types, nightlight data, and settlement density. The spatial resolution of the above data was 1 km, and they were all obtained from http://www.resdc.cn/. SSPs population and economic projections panel Spatial data for constructing the simulation scenarios in 2020-2050 were obtained from Chen Y. et al. (2020), Jiang et al. (2018); Murakami and Yamagata (2019), and from this online database: https:/www.cgd.ucar.edu/iam/modeling/spatial-population-scenarios.html. Shoreline data were obtained from the global multiscale sea–land (island) shoreline dataset based on Google Earth remote sensing images (Liu et al., 2019).
The grid evaluation scale was set to 1 km, and the projection format was uniformly set to “WGS_1984.” The nearest neighbor method was more applicable to discrete data (e.g., land use classification) and did not change the values of the image elements. The maximum spatial error was approximately half the image element size, which can preserve the original data attributes to the maximum extent. The spatial data were cropped and extracted using the vector layer of the study area as a mask to generate a raster dataset with uniform boundary and resolution for the calculation of the results. For statistical data, the per-capita value of an indicator is usually obtained based on the population of the data year and subsequently spatialized by overlaying spatial data on population density.
2.3 Methods
2.3.1 Study framework and theoretical basis
First, the CRECC framework and evaluation index system were constructed. Second, remote sensing, spatial, and statistical data were collected to establish a quantitative evaluation scheme for the indicators. Based on InVEST and other models, we analyzed spatial and temporal variation characteristics and dynamic mechanisms, and the SSPs and FLUS models were used to conduct CRECC simulation studies. Finally, an obstacle factor model was used to determine the main current and future limiting factors (Figure 2).
Figure 2
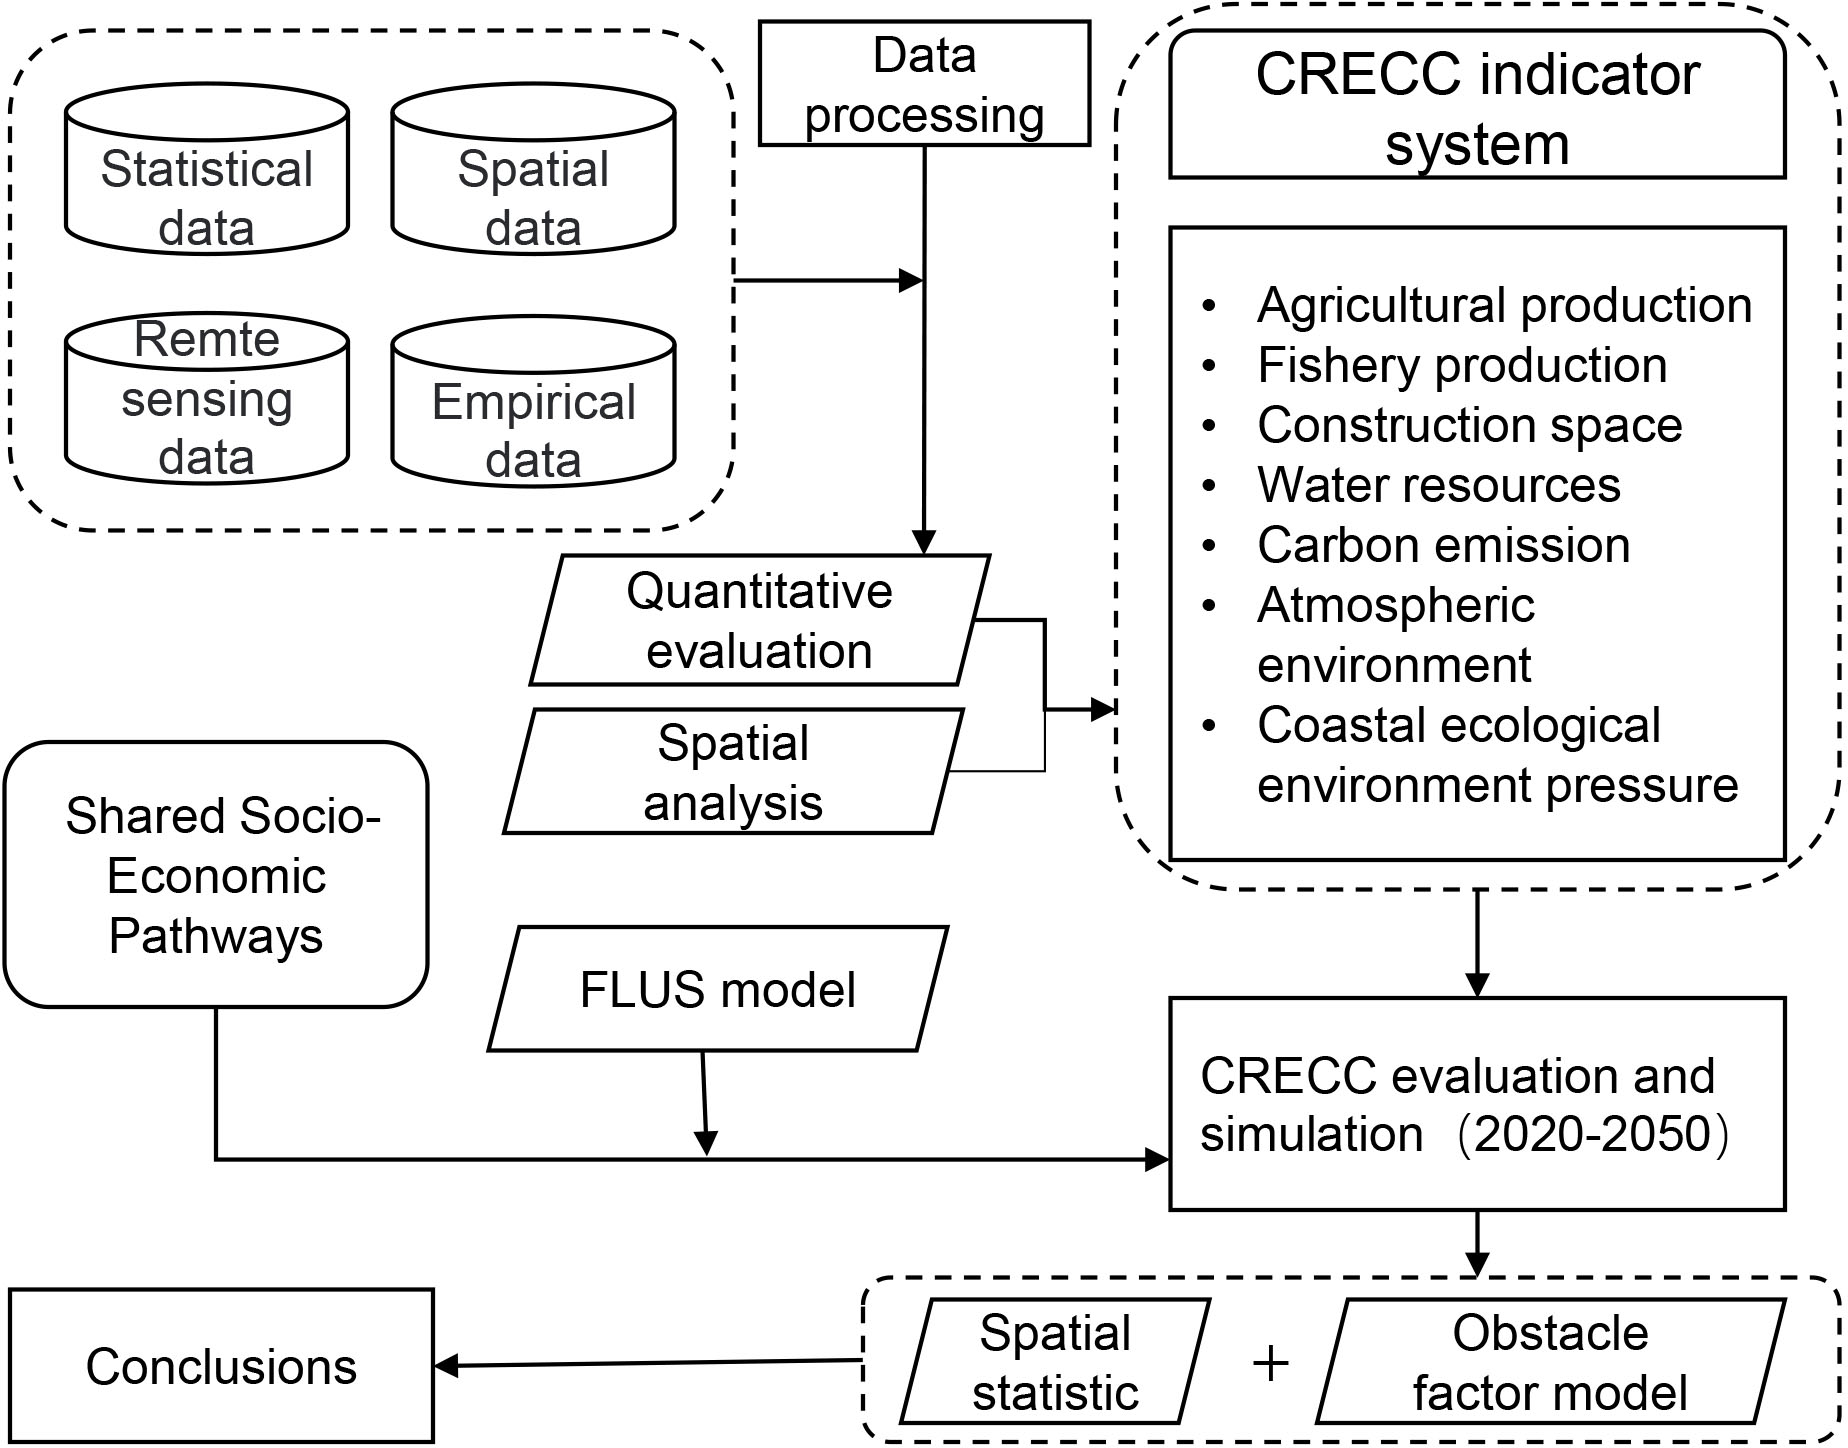
Flowchart of study.
To establish a reasonable measurement method, it is necessary to understand the components of regional resources and the environment, as well as their interrelationships, from a systematic perspective. Ideally, a geospatial system should maintain its function and structure in a relatively dynamic equilibrium. However, in reality, complex spatial systems rarely remain at the equilibrium point or in a stable state for a long time. When the pressure exerted by human activities is not in balance with the ecosystem’s carrying capacity, the regional resource-environment system may reach a critical point and enter a fluctuating phase. It can also be understood that whether a system can maintain its function and configuration depends on the pressure of human activity and ecosystem support capacity, as well as the interaction between them. Pressure mainly refers to human living and production activities, including agriculture, industry, urban construction, transportation, and daily life activities, during which resources are constantly consumed and pollutants affect the environment’s quality. The resource-environment system has carriers that are indispensable for supporting human activities, such as water, land, and energy (Elahi et al., 2022). Different pressures require corresponding carriers to support them. For example, agricultural activities extract biomass from nature, and industrial activities obtain raw materials from natural systems. These activities also generate various types of pollution and waste, which need to be dealt with by providing various socio-economic infrastructures and natural environments. The equilibrium state of the regional resource-environment system depends on the degree of impact that human activities have on natural resources and ecosystem subsystems.
According to Shen et al., 2020, the resource-environmental carrying capacity can be defined as the ratio of pressure to support, i.e. RECC = pressure/support, if 0< RECC ≤ 1, it indicates that the resource-environmental pressure is less than the support capacity. RECC > 1 means that the capacity to carry the pressure of human activities is insufficient, the region is at a higher risk of overload, and the sustainability of resources and the environment is poor.
2.3.2 Indicator system
The Yangtze River Delta coastal zone has long been facing a series of resource and environmental constraint problems due to population growth and economic development; marine economic development and shoreline environmental quality improvement are urgently needed. Based on the natural and socioeconomic characteristics of the coastal zone, a resource and environmental carrying capacity evaluation indicator system was constructed (Table 1). The indicator system contains the target layer (CRECC), two guideline indicators (support index and pressure index), and 14 sub-indicators (agricultural production carrying capacity, fishery production carrying capacity, construction space carrying capacity, water resources carrying capacity, carbon emissions carrying capacity, atmospheric environment carrying capacity, and coastal ecological environment stress) from the pressure and support dimensions.
Table 1
| Target layer | Rule layer | Primary indicator layer | Second indicator layer | Weight-2020 | Weight-2050 |
|---|---|---|---|---|---|
| Coastal Resources and Environmental Carrying Capacity | Pressure index | agricultural production carrying capacity | agricultural food demand | 0.155 | 0.189 |
| fishery production carrying capacity | fishery food demand | 0.183 | / | ||
| construction space carrying capacity | construction space demand | 0.112 | 0.137 | ||
| water resources carrying capacity | water resource demand | 0.212 | 0.214 | ||
| carbon emission carrying capacity | carbon emission | 0.155 | 0.189 | ||
| atmospheric environment carrying capacity | air pollutants emission | 0.176 | 0.215 | ||
| Coastal ecological environment stress | habitat risk | 0.007 | 0.056 | ||
| Support index | agricultural production carrying capacity | agricultural food production | 0.118 | 0.148 | |
| fishery production carrying capacity | fishery food production | 0.200 | / | ||
| construction space carrying capacity | total construction space | 0.121 | 0.150 | ||
| water resources carrying capacity | total water resource | 0.209 | 0.221 | ||
| carbon emission carrying capacity | carbon storage | 0.148 | 0.185 | ||
| atmospheric environment carrying capacity | air pollutants storage | 0.158 | 0.198 | ||
| Coastal ecological environment stress | habitat quality | 0.046 | 0.099 |
Index system and weight for Coastal Resources and Environmental Carrying Capacity.
Considering the characteristics of food supply and consumption in coastal areas, we divided them into agricultural production and fishery production carrying capacities and took total food production and demand and total fishery food production and demand as “support” and “pressure” dimensions, respectively. Construction spaces primarily undertake the functions of residence, development, and infrastructure construction, reflecting the carrying capacity of land resources for population growth and economic development. The demand and supply areas of the construction space were selected as pressure and support indicators, respectively. Nearly two-thirds of cities in coastal areas face different degrees of water shortage, and it is important to evaluate the quantity and quality of existing water resources to support socioeconomic development. Water resource consumption and total available water resources were selected as the pressure and support indicators, respectively, to assess the carrying capacity of water resources. In the context of China’s aggressive emission reduction targets, monitoring current carbon emission patterns and changing trends is important. Carbon emissions and carbon sequestration indicators were selected to assess the carbon balance. Enhancing the atmospheric quality is a critical objective for the development of ecological civilization, and the emission and absorption of significant atmospheric pollutants serve as key parameters to determine the carrying capacity of the atmospheric environment. Finally, habitat quality and potential habitat risk were coupled to assess the coastal ecological stresses.
2.3.3 Quantitative evaluation method
2.3.3.1 Agricultural production carrying capacity
Different land use types have varying capacities for producing food. Cultivated lands provide cereals, oilseeds, and vegetables; orchards provide fruits; and grasslands provide beef, lamb, and dairy products, all of which fall under the category of ecological land. Wetlands provide freshwater aquatic products. (Zhang et al., 2017). According to the total food production statistics of these land use types and the corresponding land use types in the study area, the average agricultural product yields in the cultivated land, ecological land, and wetland areas are 1214.27 t/km2, 222.57 t/km2 and 308.22 t/km2, respectively. The total food production, Cfood (tons), for each evaluation year was calculated by superimposing the spatial land use data.
Where is the total area provided by land use type k for the production of the food j (cereals, oils, dairy, vegetables, meat, and freshwater aquatic products), and is the production per unit area for the food j provided by the land use type k.
This was performed in accordance with the 2016 Chinese food guide (Supplementary Table 1). The given reference range of food demand is taken as its median value to obtain the per capita food demand, demandj, which is 539.36 kg/person, and superimposed on the population spatial distribution data (POP is the number of populations in the cell) to obtain the total food demand (ton), Lfood, which is calculated as:
2.3.3.2 Fishery production carrying capacity
Due to the limitations of data acquisition, the fishery production carrying capacity can only calculate the total fishery food production (Cfishery, ton) and demand (Lfishery, ton) between 2000 and 2020, and scenario simulation is not currently available for the time being.
Where Pn is the production of seawater products in the coastal city n, obtained from the China Rural Statistical Yearbook (2000-2020), demm is the per capita demand of seawater products, which is 10.23 kg/person according to the 2016 Chinese food guide and the China Statistical Yearbook (2000-2020), and pop is the population.
2.3.3.3 Construction space carrying capacity
To analyze the spatial carrying capacity, the actual supply and demand of rural living space and urban construction space were calculated separately using the following methods:
Where CC is the spatial supply of construction land (km2), representing the construction land support indicator. Cr and Cu are the actual supply of rural and urban living spaces respectively. Rx,y and Ux,y represent the proportion of rural living space and urban construction space in the cell, which is calculated by the “aggregation” tool of the ArcGIS10.5 platform; A is the actual area of the cell.
Lc is the spatial demand for construction land (km2), representing the pressure indicator for construction land; Lr and Lu are the demand for rural and urban living spaces, respectively; Rdemand and Udemand represent the per capita demand for rural and urban spaces, which were 150 and 77 m2/person, respectively (from the Urban and Rural Land Classification and Planning for Construction Land Standard) (Supplementary Table 2). Rpop and Upop are the total populations in rural and urban areas, respectively (https://www.cgd.ucar.edu/iam/modeling/spatial-population-scenarios.html).
2.3.3.4 Water resources carrying capacity
Water resources support capacity Cw includes surface water resources Wsu(m3) and groundwater resources Wgr(m3):
Where Wrep is the total amount of water resources double-counted when measuring surface water and groundwater resources. The per capita groundwater resources (Aw-gr) obtained from the statistical yearbooks from 2000 to 2020 were -0.65% and -0.62%, respectively, which can be used as the basis for simulation evaluation. A indicates the actual area of the cell (km2). Px,y is the annual precipitation of the cell (mm) (https://www.worldclim.org (2000–2100)), and Rk,x,y is the runoff coefficient of the cell (x,y) in land use type k, which refers to the proportion of precipitation converted into runoff (Yan et al., 2019).
The water load pressure, i.e., the total water consumption Lw (m3) could be expressed as :
Where Wdo, Win, War, and Wen are the regional per capita domestic, industrial, agricultural, and ecological water consumption, m3/person, respectively (the statistical yearbooks from 2000 ~ 2020) The annual average change rates of per capita water consumption for all years are - 0.60, - 0.17, 1.85, and 9.48%/a, respectively, which are also used as the basis for simulation evaluation; pop is the population.
2.3.3.5 Carbon emission carrying capacity
The InVEST model can assess the amount of carbon stored in each unit based on the carbon density of each land use type and land use map. The estimation of total carbon sequestration (Ccarbon, tons) considered four carbon pools: aboveground, belowground, soil organic matter, and dead organic matter. According to Goldstein et al. (2012); He et al. (2016), and Li (2004), the carbon density numbers were taken as shown in Supplementary Table 3 and calculated as:
where A denotes the actual area of each cell, , , , and represent the carbon density (t/km2) of above-ground, below-ground, soil organic matter, and dead organic matter in the kth land use type, respectively.
The total carbon emission Lcarbon (ton) can be expressed as: Where Cemission represents the carbon emissions from human socioeconomic activities and pop represents the population. According to Liu C. et al. (2020), the product of the standard coal carbon emission factor (0.69 tC/tce) and the energy consumption is taken as the carbon emission per capita, and the required data for coal, oil, natural gas, primary electricity, and other energy consumption are obtained from the China Statistical Yearbook (2000-2020). On this basis, according to the net-zero emission scenario proposed in the World Energy Outlook 2020 (BP Amocol, 2020), the rates of change in the consumption of oil, coal, natural gas, primary electricity, and other energy sources in China between 2018 and 2050 are - 4.1, - 8.2, 1.6, and - 0.9%/a. Based on these rates of change, the per capita carbon emissions in 2050 under different SSP scenarios are about 0.91 to 1.01 tC/person, combined with the SSP population projection panel data and the standard coal carbon emission coefficients.
2.3.3.6 Atmospheric environment carrying capacity
The current status and future trends of the atmospheric environmental support capacity of the coastal zone were estimated using PM10 as an example. The atmospheric environmental support capacity refers to the capture and sorption capacity of vegetation for PM air pollution.
Where Cair is the total amount of PM10 adsorbed (ton); Ax,y is the actual area of the cell; PMx,y is the amount of PM10 adsorbed per unit area of cell (x, y) in the land use type k. PM10 adsorption capacity of cultivated land and ecological land is 92 t/km2 and 445 t/km2(Landuyt et al., 2016; Zhang et al., 2017),.
According to the Technical Guide for the Preparation of Particulate Matter Emission Inventory of Dust Sources issued by the Ministry of Environmental Protection of China, the atmospheric environmental load pressure was calculated using the emission inventory method of soil wind erosion of dust particles (PM10) based on the land use distribution map.
2.3.3.7 Coastal ecological environment pressure
The Habitat Quality and Habitat Risk Assessment models in the InVEST model were coupled to comprehensively assess the impact of human activities on coastal ecosystems, and to determine current and future ecological and environmental stresses in the study area. In the Habitat Quality model, stressors are selected and assigned weights that reflect the intensity of disturbance to the habitat type, which decreases with increasing distance, such that the maximum distance of each stressor is set. The HQ index interval was [0, 1], and the larger the value, the higher the habitat quality. Simultaneously, the responses of different habitat types to stressors varied, and the different sensitivity levels are shown in Supplementary Table 4. In the Habitat Risk Assessment model, the risk or impact of human activities on ecosystems was assessed using six indicators in the “exposure” and “consequence” dimensions (Supplementary Table 5). The HRA index range is [0, 1]; the higher the value, the higher the habitat risk (Zhai et al., 2020).
2.3.3.8 CRECC evaluation
The extreme difference normalization method was used to normalize the original indicator result values such that the index values were between 0 and 1 (Sun et al., 2017), and the indicator weights were calculated based on the entropy weighting method (Mikulic et al., 2015) (Table 1).
Based on the standardized values of each carrying capacity indicator and weights (Wi), the linear weighting method is used to obtain the pressure (Li), index and support index (Ci), which is: and ; The indicator CRECC of region i is equal to the ratio of Li and Ci: .
Theoretically, according to the relationship between the pressure and the support index, the CRECC can be divided into three cases: when CRECC = 1, the resource and environment carrying capacity can just meet the pressure exerted by human activities; when CRECC< 1, the support capacity is greater than the pressure; When CRECC > 1, the support capacity is less than the pressure. The larger the CRECC value, the lower the carrying capacity level; the opposite is true.
2.3.4 Obstacle factors model
The obstacle degree model was used to diagnose the obstacle factors affecting the development of objects (Yang et al., 2022), and consisted of the factor contribution degree Iij and indicator deviation degree Jij, which was calculated as follows:
Where wi is the weight of the indicator i, Rj is the weight, and Mijis the degree of the obstacle to the support indicator.
3 Results
3.1 Spatial and temporal variation of CRECC from 2000 to 2020
Using the quantitative evaluation method described in Section 2.4, combined with the indicator weight, the pressure index, support index, and fourteen indicators were calculated for the study area between 2000 and 2020.
In the pressure dimension (Table 2), the average pressure index of the Yangtze River Delta coastal zone increased from 0.115 to 0.144 (+25.73%) between 2000 and 2020, mainly due to the growth in food demand and carbon emissions, with respective growths of 32.92% and 212.16%. All other pressure indicators exhibited a decreasing trend. The decreases in other pressure indicators were -49.90%, -75.40%, -1.31%, -23.71%, and -23.15% for fishery demand, construction space demand, water resource demand, air pollutant emissions, and habitat risk. At the city scale, Shanghai, Ningbo, and Lianyungang ranked top three in the pressure index, and the index of all cities showed an increasing trend, with the most significant change from 0.258 to 0.397 in Shanghai (53.94%), and the lowest change of 0.13% in Taizhou. Among the seven pressure indicators, food demand and carbon emissions in the eight cities showed increasing trends, whereas fishery food demand, construction space demand, air pollutant emissions, and habitat risk decreased.
Table 2
| Indicator | Agricultural food demand/106t | Fishery food demand/104t | Construction space demand/105km2 | Water resource demand/109m3 | Carbon emission/106t | Air pollutants emission/t | Habitat risk | Pressure index | ||||||||
|---|---|---|---|---|---|---|---|---|---|---|---|---|---|---|---|---|
| Year | 2000 | 2020 | 2000 | 2020 | 2000 | 2020 | 2000 | 2020 | 2000 | 2020 | 2000 | 2020 | 2000 | 2020 | 2000 | 2020 |
| YRD coastal zone | 27.7 | 36.84 | 130.44 | 65.36 | 53.03 | 13.04 | 33.57 | 33.1 | 46.00 | 143.60 | 685.97 | 523.36 | 0.19 | 0.15 | 0.115 | 0.144 |
| Lianyungang | 2.27 | 3.00 | 8.32 | 5.29 | 0.83 | 4.79 | 3.35 | 3.84 | 3.77 | 11.64 | 116.49 | 104.48 | 0.30 | 0.21 | 0.114 | 0.140 |
| Yancheng | 4.15 | 5.37 | 13.84 | 9.43 | 1.38 | 9.13 | 6.21 | 6.96 | 6.88 | 20.81 | 127.38 | 106.93 | 0.22 | 0.16 | 0.076 | 0.098 |
| Nantong | 3.74 | 4.68 | 13.72 | 8.27 | 1.37 | 6.41 | 5.58 | 6.09 | 6.21 | 18.31 | 84.97 | 55.16 | 0.21 | 0.19 | 0.099 | 0.127 |
| Shanghai | 7.54 | 11.35 | 43.30 | 20.45 | 4.33 | 15.86 | 9.78 | 8.72 | 12.51 | 44.21 | 93.63 | 67.64 | 0.17 | 0.16 | 0.258 | 0.397 |
| Jiaxing | 1.45 | 1.75 | 8.69 | 3.14 | 0.87 | 2.61 | 1.25 | 1.08 | 2.41 | 6.97 | 47.01 | 31.71 | 0.35 | 0.27 | 0.112 | 0.120 |
| Ningbo | 2.70 | 3.44 | 14.23 | 6.04 | 1.42 | 5.53 | 2.33 | 2.06 | 4.48 | 13.36 | 111.91 | 87.06 | 0.13 | 0.08 | 0.125 | 0.130 |
| Taizhou | 2.41 | 2.97 | 11.30 | 5.18 | 1.13 | 5.34 | 2.08 | 1.78 | 4.00 | 11.52 | 53.47 | 34.33 | 0.10 | 0.06 | 0.067 | 0.067 |
| Wenzhou | 3.45 | 4.29 | 17.05 | 7.56 | 1.71 | 6.65 | 2.98 | 2.59 | 5.73 | 16.77 | 51.11 | 36.04 | 0.08 | 0.05 | 0.067 | 0.076 |
Pressure index value in 2000-2020.
In Table 3, the average support index shows a slight growth trend, increasing from 0.570 to 0.596. This was mainly due to increases in fishery food production, total construction space, and total water resources, which reached 19.11%, 63.94%, and 8.84%, respectively. All other support indicators showed a downward trend. Agricultural food production, carbon storage, air pollutant emissions, and habitat risk decreased by -8.54%, -5.76%, -5.03%, and -30.70%, respectively. On the city scale, Wenzhou, Taizhou, and Ningbo ranked in the top three in terms of the support index in 2000 and 2020. The support index of Shanghai and Ningbo decreased most significantly by-5.97% and-1.04%, while all other cities showed an increasing trend, with Nantong and Lianyungang having the highest values of 5.36% and 5.29%, respectively. Among the seven pressure indicators, agricultural food production, carbon storage, air pollutant emissions, and habitat risk in the eight cities decreased, whereas most of the other support indicators increased.
Table 3
| indicator | Agricultural food production/106t | Fishery food production/104t | Total construction space/km2 | Total water resource/109m3 | Carbon storage/106t | Air pollutants storage/104t | Habitat quality | Support index | ||||||||
|---|---|---|---|---|---|---|---|---|---|---|---|---|---|---|---|---|
| Year | 2000 | 2020 | 2000 | 2020 | 2000 | 2020 | 2000 | 2020 | 2000 | 2020 | 2000 | 2020 | 2000 | 2020 | 2000 | 2020 |
| YRD coastal zone | 81.79 | 74.80 | 371.35 | 442.31 | 9978 | 16358 | 25.77 | 28.05 | 10.68 | 10.07 | 180.51 | 171.44 | 0.39 | 0.27 | 0.361 | 0.370 |
| Lianyungang | 9.58 | 9.02 | 23.40 | 41.50 | 2260 | 2648 | 1.63 | 1.50 | 0.69 | 0.66 | 9.30 | 8.93 | 0.31 | 0.23 | 0.270 | 0.284 |
| Yancheng | 22.44 | 21.93 | 19.34 | 34.16 | 2478 | 3003 | 3.78 | 3.58 | 1.60 | 1.44 | 21.11 | 18.04 | 0.20 | 0.16 | 0.257 | 0.260 |
| Nantong | 14.18 | 13.15 | 45.92 | 58.10 | 737 | 1724 | 2.36 | 2.55 | 0.92 | 0.85 | 11.08 | 10.07 | 0.15 | 0.12 | 0.259 | 0.273 |
| Shanghai | 8.96 | 7.17 | 12.23 | 16.10 | 2002 | 3745 | 1.97 | 2.04 | 0.57 | 0.48 | 6.94 | 5.98 | 0.37 | 0.32 | 0.230 | 0.216 |
| Jiaxing | 5.50 | 4.61 | 0.58 | 0.05 | 1068 | 1814 | 1.18 | 1.37 | 0.37 | 0.32 | 4.26 | 3.81 | 0.20 | 0.18 | 0.325 | 0.335 |
| Ningbo | 7.71 | 6.69 | 75.84 | 90.72 | 773 | 1716 | 3.31 | 3.40 | 1.60 | 1.51 | 30.10 | 28.83 | 0.61 | 0.39 | 0.447 | 0.442 |
| Taizhou | 6.68 | 6.15 | 135.25 | 142.28 | 313 | 807 | 4.72 | 5.42 | 2.14 | 2.08 | 42.08 | 41.08 | 0.66 | 0.38 | 0.526 | 0.553 |
| Wenzhou | 6.75 | 6.08 | 58.79 | 59.40 | 347 | 901 | 6.82 | 8.18 | 2.79 | 2.73 | 55.64 | 54.70 | 0.62 | 0.40 | 0.570 | 0.596 |
Support index value in 2000-2020.
According to the method utilized in 2.4.8, the spatial distribution of the CRECC from 2000 to 2020 was obtained in Figure 3. The larger the CRECC value, the lower the bearing capacity; otherwise, the higher the value. From 2000 to 2020, the CRECC increased from 0.535 to 0.578, which is a sustainable level. In 2020, the CRECC in Shanghai reached 1.525, making it the only city where the pressure index was greater than the support index. These eight cities were divided into four categories based on the natural-point method using ArcGIS. In 2000, the carrying capacity of Shanghai was the minimum, that of Wenzhou was the maximum, and three cities had low and high levels. In 2020, the rank of Shanghai remained unchanged, and Taizhou replaced the maximum level. The carrying capacities of Wenzhou and Jiaxing dropped by one, whereas those of Taizhou and Yancheng rose by one. From the perspective of the spatial distribution of change rate grades, the change rates of CRECC in Shanghai and Nantong were 1.57 and 0.56%/a, respectively, which were the maximum levels, indicating that the carrying capacity of these two regions has experienced the largest decline in the past 20 years. Taizhou is the only city that has improved its carrying capacity, at -0.0356%/a.
Figure 3
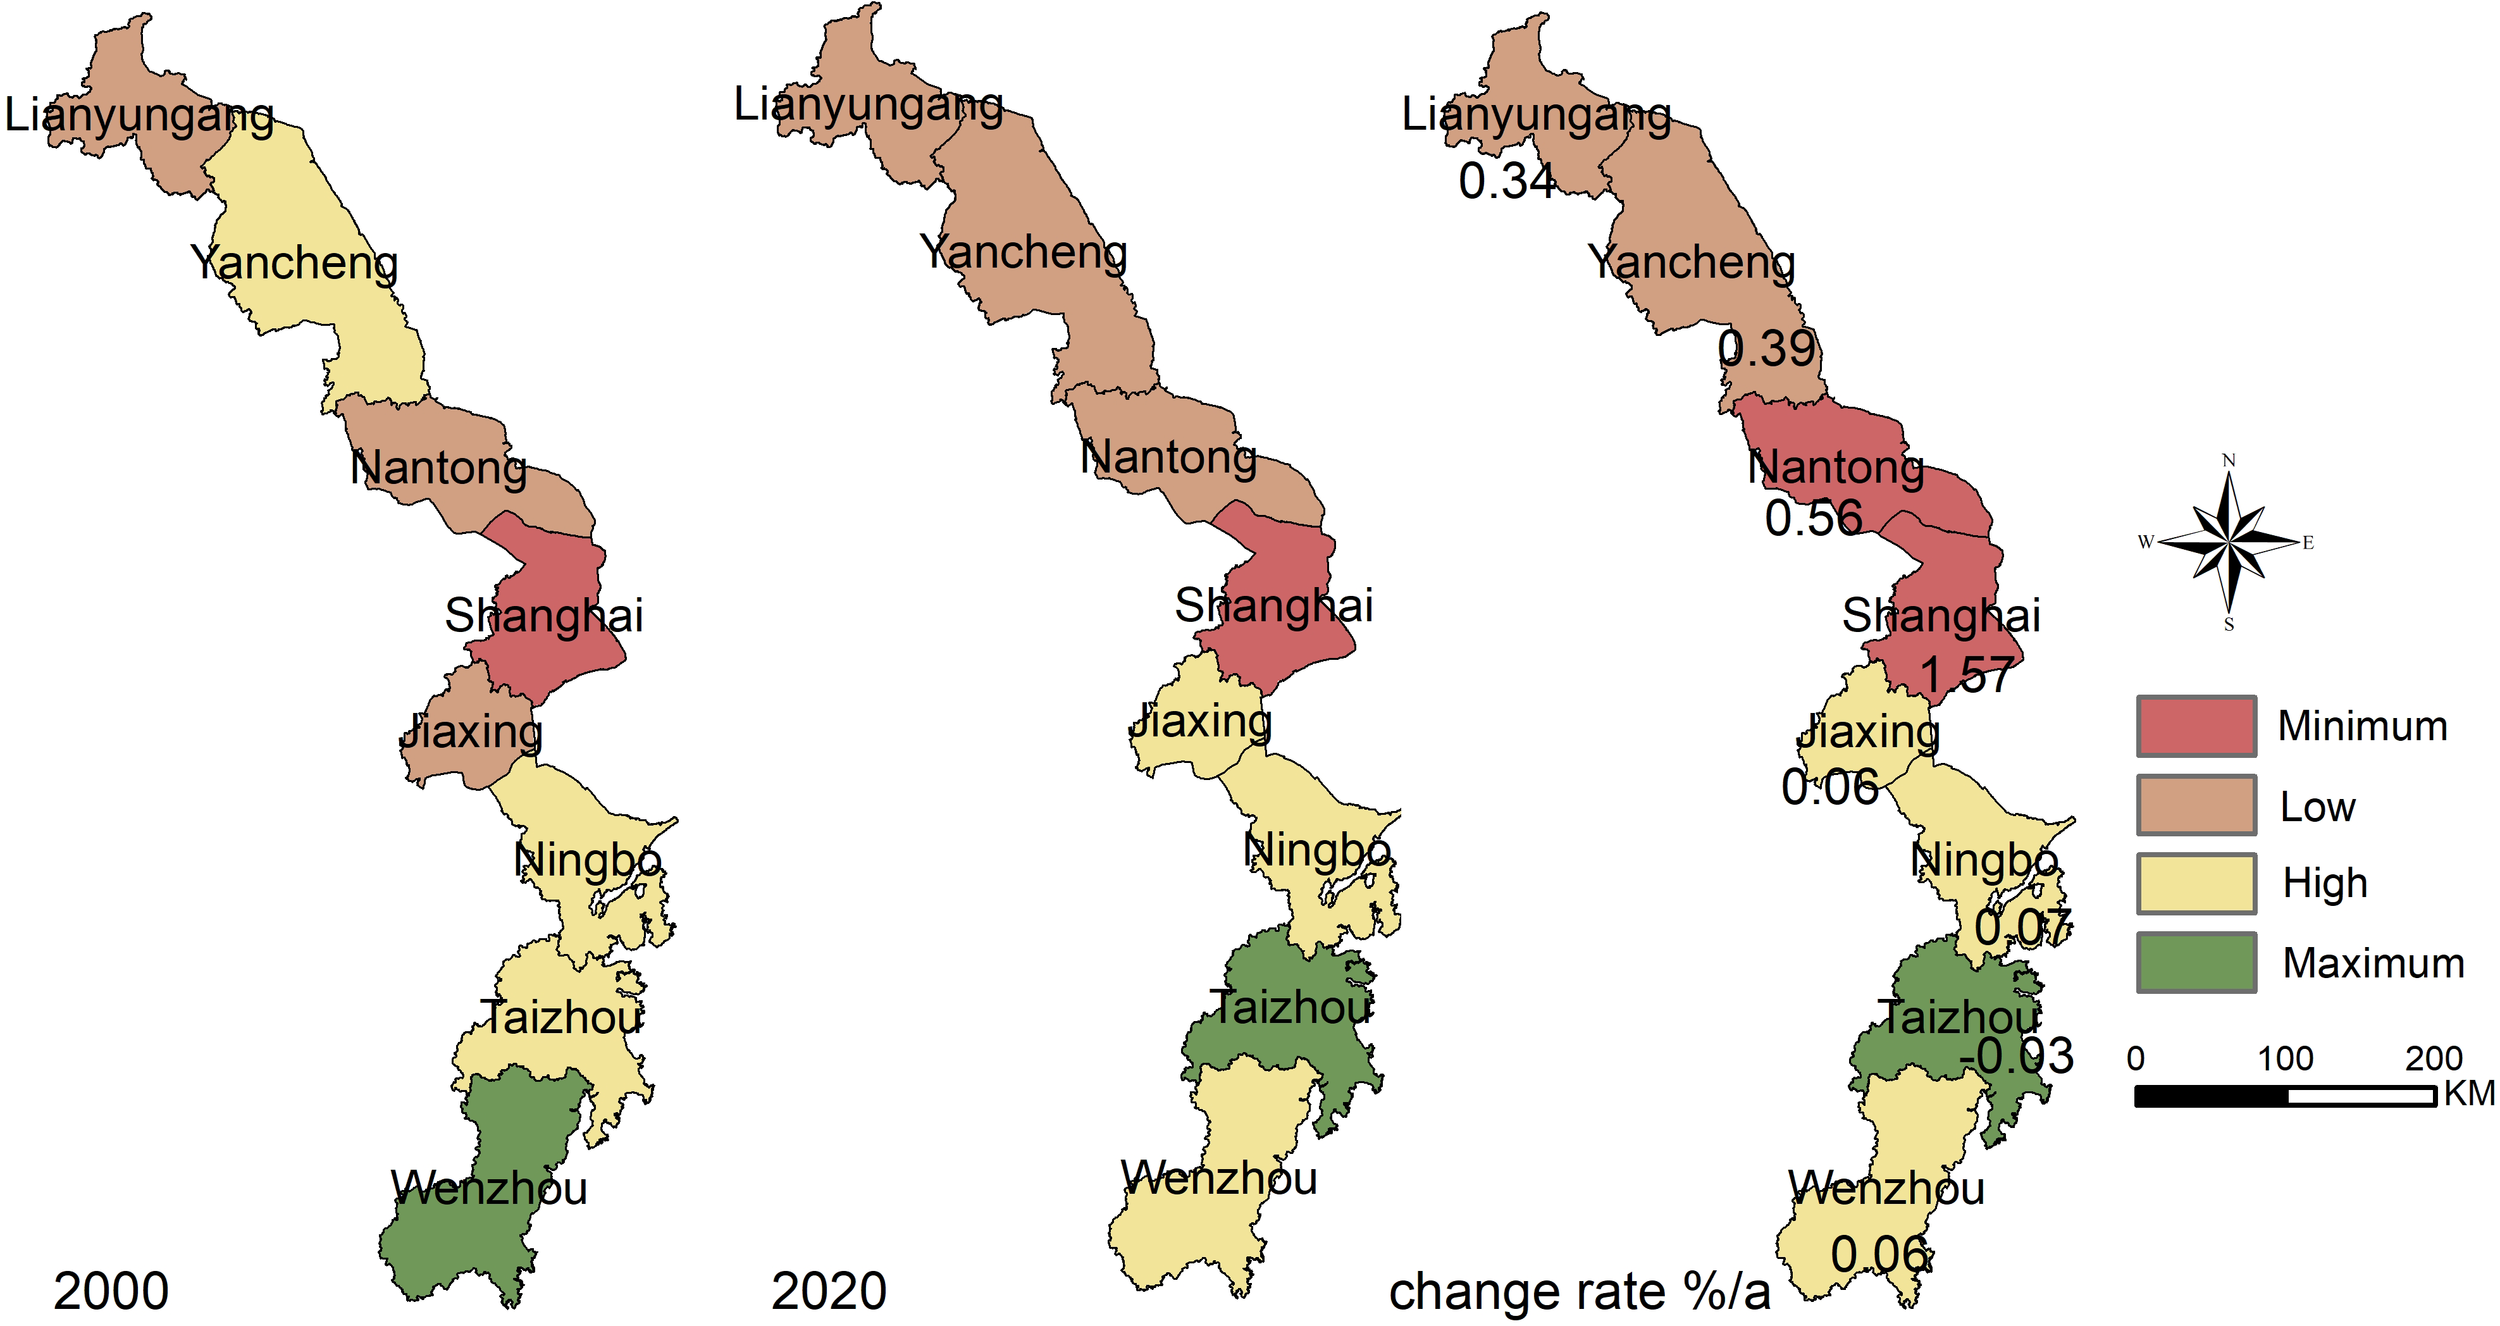
Spatial distribution of carrying capacity and change trend classification in the Yangtze River Delta coastal zone from 2000 to 2020.
Overall, the increasing trend of the support index was lower than that of the pressure index. Changes in food and water supply and demand, carbon emissions, and construction space resources were the most prominent. Shanghai was the only city in which the pressure index increased while the support index decreased. The three cities north of Shanghai experienced a much higher change in pressure than the four cities south of Shanghai, whereas the support index had a more balanced spatial distribution. The cities with a higher carrying capacity were mainly located in Zhejiang Province in the south of the study area, which had significantly higher levels than the three cities in Jiangsu Province to the north. Shanghai, which has the largest population and highest economic and urbanization levels, maintained the lowest carrying capacity and showed a decreasing trend.
3.2 Simulation of CRECC based on SSPs in 2020-2050
3.2.1 Scenarios description of SSPs
By coupling the SSP framework and a Future Land Use Simulation Model (FLUS model), the development prospects of coastal zone resources and the environmental carrying capacity of the Yangtze River Delta under different paths in 2050 were explored. The SSPs describe future changes in multiple key variables of scenarios (GDP, population, energy, land use/cover, emissions, climate, agricultural indicators, economic indicators, and technical indicators) and five scenarios (SSP1-sustainable pathway, SSP2-middle pathway, SSP3-regional rivalry pathway, SP4-divided pathway, and SSP5-fossil-fueled development pathway) (O’Neill et al., 2014).
Popp et al. (2017) classified the five SSP scenarios as follows, and this interpretation is adopted in this study: SSP1 has a relatively small population, high energy and resource utilization efficiency, small regional development differences, and a high level of urbanization. SSP2 is consistent with historical development trends, with regional differences still existing, but the process of economic growth and urbanization being relatively stable. The technological level is advanced, and the intensity of resource and energy consumption is reduced. SSP3 sees a rapidly growing population, with relatively slow economic development focused on ensuring regional energy and food security. The inequality between regions is more pronounced. SSP4 has the smallest population, with a large gap between the rich and poor. The achievement of sustainable development depends largely on the actions of relevant departments and institutions. Finally, SSP5 sees a significant increase in population mobility, with a large amount of funds, technologies, and fossil fuels being invested in the pursuit of economic growth. As a result, environmental protection may receive less attention.
Moreover, according to Chen Y. et al. (2020) and Jiang et al. (2018), the total population of the Yangtze River Delta coastal zone first increased and then decreased under different SSPs paths from 2020 to 2050. The population peak is predicted to appear around 2030, and the corresponding total GDP to continue to grow.
3.2.2 Land use simulation based on FLUS model
The FLUS model is a highly accurate and adaptable tool for simulating a wide range of land-use and land-cover change (LUCC) spatial trajectories on global and regional scales, as demonstrated by Chen G. et al. (2020). To predict urban land demand in 2050 under five scenarios, He et al. (2016) constructed a multiple regression model of urban land-use demand, which was based on per capita urban land area, per capita GDP, and urban population panel data from 1990 to 2020. To obtain the land-use demand data required for the FLUS model, Dong et al. (2018) scaled the areas of the remaining land-use types accordingly. The model operates through three specific processes: ① establishment of driving factors (as provided in Supplementary Table 6), ② calculation of suitability probability and conversion matrix (as provided in Supplementary Tables 7, 8), and ③ validation of accuracy and output of results. The kappa coefficient and Figure-of-Merit from the accuracy validation results were 0.81 and 19.96%, respectively, which are comparable to other studies (Chen Y. et al., 2020; Liu X. et al., 2020). Thus, the simulation accuracy of the FLUS model was deemed acceptable. Overall, the FLUS model is a valuable tool for predicting LUCC spatial trajectories, and its accuracy has been validated by multiple studies.
Under the SSPs scenarios, the land use simulation results for different years correlated heavily. Urban land expanded significantly, and the proliferation of small- and medium-sized cities near large cities was also observed. Cultivated land and ecological land shrank, while changes to wetlands were relatively small (Table 4). This phenomenon was most significant in SSP5.
Table 4
| Area/km2 | Variation/% | |||||
|---|---|---|---|---|---|---|
| 2020 | 2050ssp1 | 2050ssp2 | 2050ssp3 | 2050ssp4 | 2050ssp5 | |
| Cultivated land | 37733.00 | -19.53 | -19.53 | -12.92 | -12.42 | -21.92 |
| Green ecological land | 19595.39 | -11.48 | -11.48 | -9.29 | -9.37 | -11.93 |
| Wetland | 4593.73 | -1.81 | -1.81 | -3.05 | -1.55 | -3.58 |
| Urban land | 4041.70 | 263.69 | 263.69 | 184.98 | 187.64 | 303.23 |
| Other construction land | 6931.30 | -24.34 | -24.34 | -18.87 | -16.32 | -25.81 |
Area change of land use types under different scenarios from 2020 to 2050.
3.2.3 Simulation and spatial-temporal variation of CRECC under different SSPs scenarios from 2020 to 2050
Based on the SSP spatial and panel data and the results of the land use simulation, we calculated the simulation results, spatial and temporal distribution, and change characteristics of the pressure index, support index, and CRECC from 2020 to 2050.
In the pressure dimension (Table 5), the average pressure index predicted for 2050 is 0.131 ~ 0.135 (SSP1 > SSP5 > SSP2 > SSP4 > SSP3), and the predicted change rate is -0.31 ~ -0.20%/a compared with 2020. Among them, the average pressure indexes of agricultural food demand, construction space demand, water resource demand, and carbon emission show a decreasing trend, while carbon emission has the fastest rate of change, reaching -1.99~ -1.96%/a. Air pollutant emissions and habitat risk have an increasing trend of 0.92 ~ 1.24%/a and 0.20 ~ 0.61%/a, respectively. From a city perspective, the pressure indices of Lianyungang and Ningbo have decreased, by 0.46 ~ 0.53%/a and 0.10 ~ 0.41%/a, respectively. The pressure index of other cities showed a decreasing trend, and the rate of change in Shanghai was the fastest, ranging from -0.93 to -0.60%/a. The trends of the six pressure indices were consistent with those of the study area, with Jiaxing and Ningbo showing the highest rates of decrease in agricultural food demand, construction space demand, water resource demand, and carbon emissions. For air pollutant emissions and habitat risk, the increasing trend was relatively evident in Shanghai and cities to the north, such as Nantong and Lianyungang.
Table 5
| Agricultural food demand | Construction space demand | Water resource demand | Carbon emission | Air pollutants emission | Habitat risk | Pressure index | |
|---|---|---|---|---|---|---|---|
| YRD coastal zone | -0.42 ~ -0.22 | -0.70 ~ -0.25 | -0.88 ~ -0.71 | -1.98~ -1.93 | 0.97 ~ 1.14 | 0.17 ~ 0.38 | -0.31 ~ -0.20 |
| Lianyungang | -0.34 ~ -0.20 | -0.70 ~ -0.53 | -0.81 ~ -0.69 | -1.97~ -1.89 | 0.64 ~ 0.98 | 0.18 ~ 0.72 | 0.46 ~ 0.53 |
| Yancheng | -0.47 ~ -0.23 | -0.96 ~ -0.35 | -0.92 ~ -0.72 | -1.99~ -1.94 | 0.19 ~ 0.43 | 0.07 ~ 0.34 | -0.11 ~ 0.02 |
| Nantong | -0.58 ~ -0.26 | -0.46 ~ -0.03 | -1.02 ~ -0.74 | -2.02~ -2.00 | 1.27 ~ 1.93 | -0.20 ~ 0.13 | -0.11 ~ -0.05 |
| Shanghai | -0.40 ~ -0.04 | -0.44 ~ -0.12 | -0.55 ~ -0.19 | -1.90~ -1.59 | 1.38 ~ 1.57 | 0.00 ~ 0.11 | -0.93 ~ -0.60 |
| Jiaxing | -0.66 ~ -0.28 | -0.73 ~ -0.30 | -1.08 ~ -0.75 | -2.07~ -2.01 | 0.49 ~ 0.84 | -0.12 ~ 0.18 | -0.51 ~ -0.44 |
| Ningbo | -0.49 ~ -0.24 | -0.80 ~ -0.06 | -0.93 ~ -0.72 | -1.99~ -1.95 | 0.80 ~ 1.32 | 0.18 ~ 0.50 | 0.10 ~ 0.41 |
| Taizhou | -0.62 ~ -0.27 | -1.11 ~ -0.21 | -1.05 ~ -0.75 | -2.04~ -2.01 | 1.09~ 1.18 | 0.40 ~ 0.63 | -0.22 ~ 0.00 |
| Wenzhou | -0.48 ~ -0.24 | -0.61 ~ -0.09 | -0.94 ~ -0.73 | -1.99~ -1.96 | 0.92 ~ 1.24 | 0.20 ~ 0.61 | -0.69 ~ -0.57 |
Pressure index change in 2020-2050 (%/a).
In the support dimension (Table 6), the average support index in 2050 is 0.244 ~ 0.262 (SSP3 > SSP4 > SSP2 > SSP1 > SSP5), with a change rate of -1.14 ~ -0.98%/a compared to 2020. All other indicators showed a decreasing trend, among which total water resources, carbon storage, and habitat quality were the highest, with rates of change of -0.81 ~ -0.78%/a, -0.39 ~ -0.31%/a, and -0.39 ~ -0.24%/a, respectively. The support indexes of all eight cities decreased, with Jiaxing, Taizhou, and Wenzhou having the highest rates of -1.55 ~ -1.31%/a, -1.25 ~ -1.10%/a, and -1.23 ~ -1.00%/a, respectively. Nantong and Shanghai were more prominent in the changes in agricultural food production, carbon storage, air pollutants storage, and habitat quality. Taizhou and Wenzhou showed the highest rates of change in total construction space and total water resources.
Table 6
| Agricultural food production | Total construction space | Total water resource | Carbon storage | Air pollutants storage | Habitat quality | Support index | |
|---|---|---|---|---|---|---|---|
| YRD coastal zone | -0.70 ~ -0.37 | 1.81 ~ 3.53 | -0.40 ~ -0.37 | -0.75~ -0.44 | -0.72 ~ - 0.42 | -0.22 ~ -0.18 | -1.14 ~ -0.98 |
| Lianyungang | -0.83 ~ -0.32 | 0.92 ~ 2.28 | 0.04 ~ 0.15 | -0.92~ -0.39 | -0.93 ~ - 0.40 | -0.53 ~ -0.22 | -1.07 ~ -0.65 |
| Yancheng | -0.41 ~ -0.09 | 0.56 ~ 1.70 | -0.01 ~ 0.03 | -0.42~ -0.12 | -0.38 ~ - 0.22 | -0.19 ~ -0.07 | -0.71 ~ -0.49 |
| Nantong | -1.20 ~ -0.30 | 1.92 ~ 7.51 | -0.34 ~ -0.32 | -1.26~ -0.34 | -1.22 ~ - 0.29 | -0.38 ~ 0.17 | -1.01 ~ -0.78 |
| Shanghai | -1.52 ~ -1.15 | 1.49 ~ 2.49 | -0.61 ~ -0.56 | -1.70~ -1.31 | -1.68 ~ - 1.29 | -0.47 ~ -0.34 | -1.15 ~ -0.85 |
| Jiaxing | -0.98 ~ -0.01 | 0.01 ~ 1.70 | -0.59 ~ -0.55 | -1.02~ 0.01 | -0.99 ~ 0.01 | 0.34 ~ 2.43 | -1.55 ~ -1.31 |
| Ningbo | -0.52 ~ -0.04 | 0.71 ~ 3.01 | -0.36 ~ -0.26 | -0.45~ -0.11 | -0.43 ~ - 0.09 | -0.31 ~ -011 | -1.16 ~ -0.93 |
| Taizhou | -0.42 ~ -0.22 | 3.10 ~ 6.37 | -0.63 ~ -0.57 | -0.47~ -0.31 | -0.43 ~ - 0.25 | -0.45 ~ -0.22 | -1.25 ~ -1.10 |
| Wenzhou | -0.29 ~ -0.22 | 3.64 ~ 5.34 | -0.81 ~ -0.78 | -0.39~ -0.31 | -0.33 ~ - 0.26 | -0.39 ~ -0.24 | -1.23 ~ -1.00 |
Support index change in 2020-2050 (%/a).
The CRECC simulation and statistical results revealed that the predicted CRECC values for 2050 are 0.606 ~ 0.701 (SSP5 > SSP1 > SSP2 > SSP3 > SSP4), which shows an increasing trend of 0.027 ~ 0.123 compared to 2020. Among the eight cities, only Shanghai had a CRECC greater than 1, and the stress index was always higher than the support index. Spatial classification was based on the natural point method in ArcGIS. Figure 4 indicates that the spatial distributions of SSP1, SSP2, and SSP3 were relatively similar, with five, four, and five cities showing an increasing trend in CRECC, respectively, with Shanghai and Lianyungang at the maximum level. The decreasing trend of CRECC in Jiaxing was most significant in the SSP1 and SSP2 scenarios, whereas it was replaced by Nantong and Wenzhou in the SSP3 scenario. In the SSP4 scenario, only three cities displayed an increasing trend in CRECC, with Shanghai at the maximum level and Yancheng showing the most significant decrease in CRECC. The number of cities with an increasing trend in CRECC under the SSP5 scenario reached six, with Shanghai and Jiaxing being the most prominent, and Yancheng remaining as the city with the most significant decrease in CRECC.
Figure 4
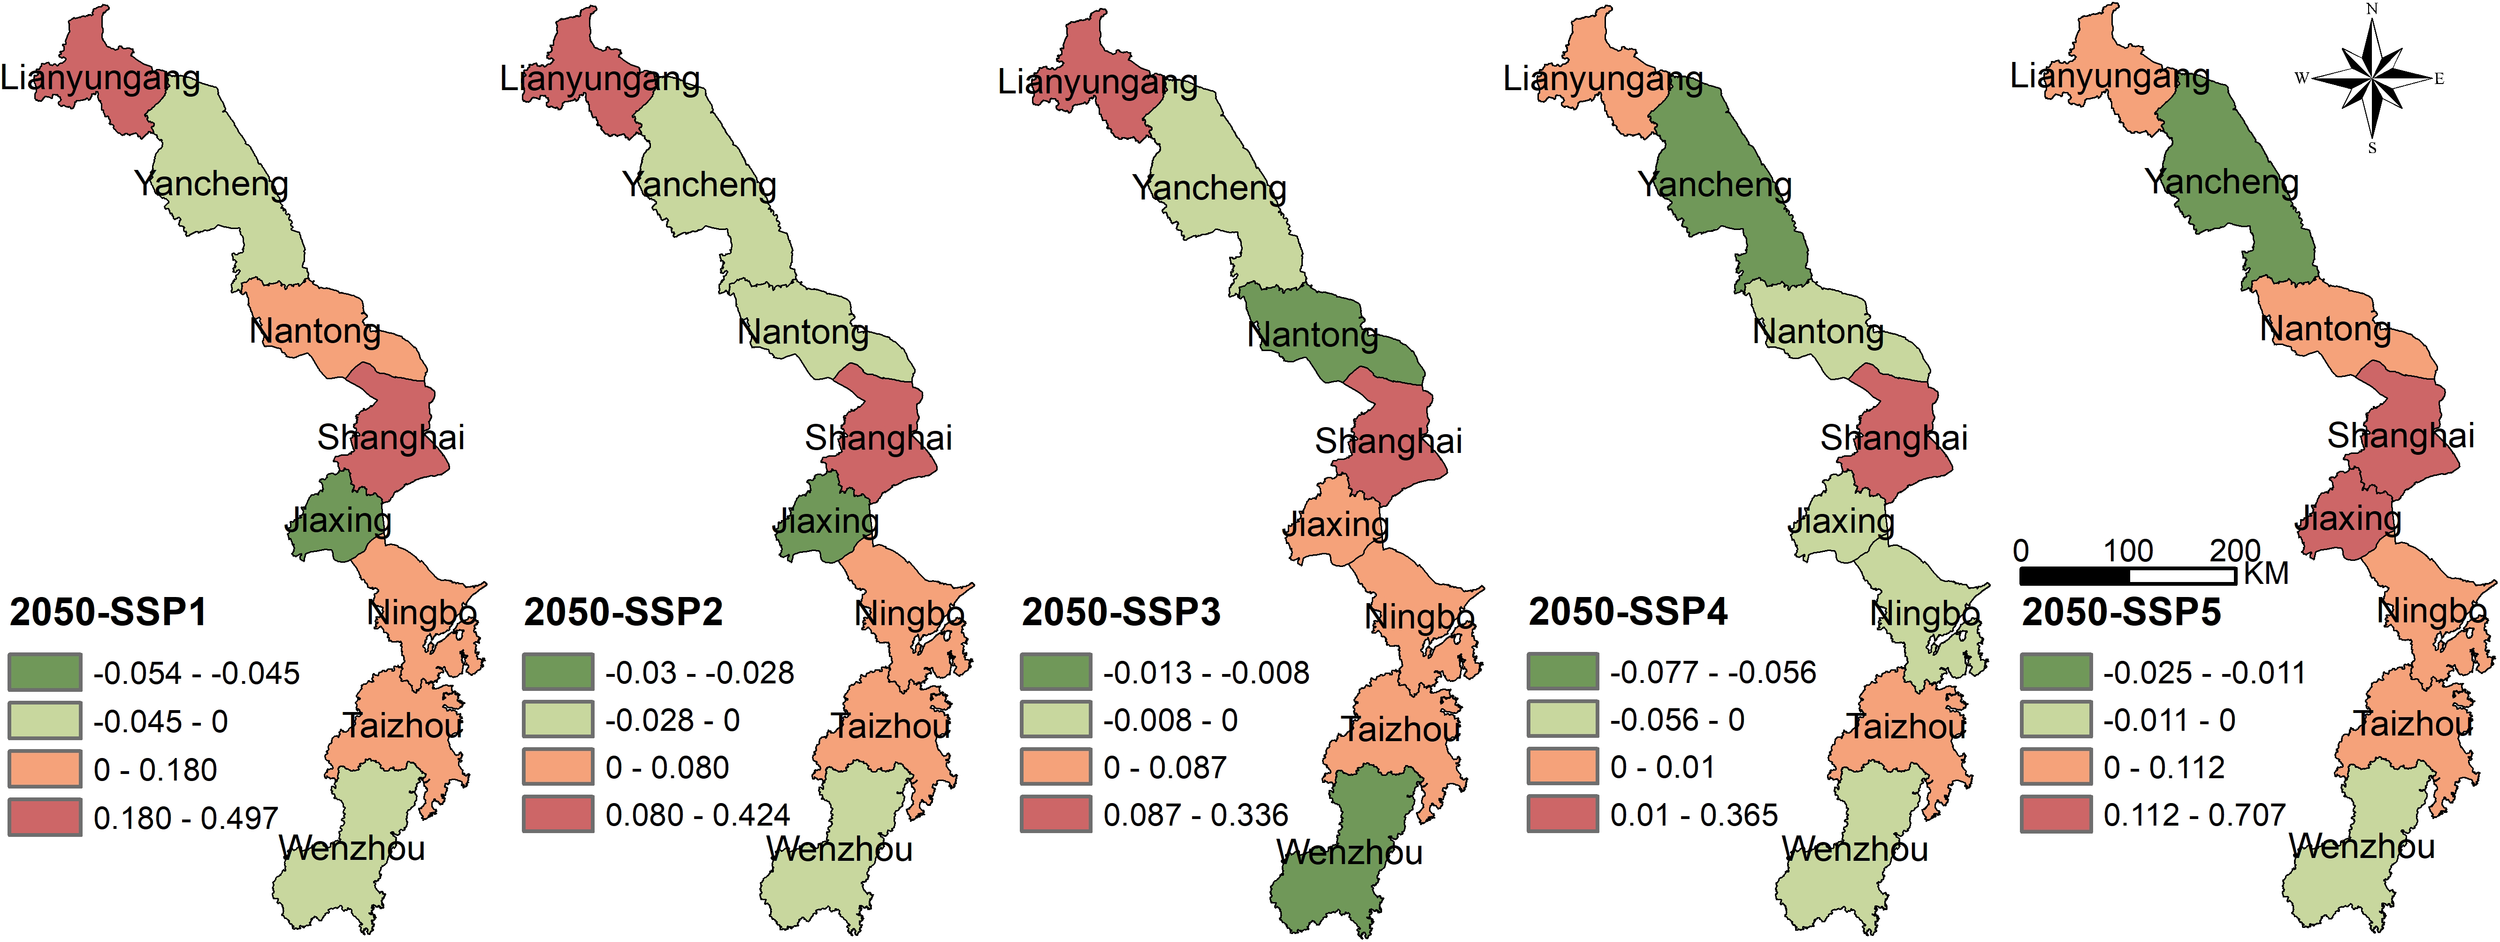
Trends of CRECC under different SSPs scenarios in the Yangtze River Delta coastal zone from 2020 to 2050.
Overall, the decrease in the support index was approximately triple that in the pressure index between 2020 and 2050, which was the principle reason for the increase in CRECC. This indicates that the resource and environmental carrying capacity is not expected to improve in the coming decades. While there are clear spatial differences in the CRECC trends under the different scenarios, Shanghai remains the most prominent case of a significant decrease in carrying capacity. The performance of neighbouring cities varied greatly under different scenarios, whereas the trends of several cities in northern Jiangsu and southern Zhejiang were more stable under different scenarios.
3.3 CRECC change in the shoreline area
Based on remote sensing data from China’s eastern coastline (Liu et al., 2019), a 10 km buffer zone was generated in the landward direction, and the heterogeneity of the carrying capacity within this buffer zone and the study area was investigated. The results show that the predicted pressure index and CRECC of the shoreline area in 2050 will be higher than the average values for the study area, and the support index is slightly lower for most cities under the five SSP scenarios.
Between 2020 and 2050, the pressure index of shoreline areas is predicted to increase from 0.155 to 0.157 ~ 0.162, and the support index to decrease from 0.259 to 0.212 ~ 0.240. The CRECC changed from 0.653 to 0.759 ~ 0.893 (SSP5 > SSP3 > SSP1 > SSP4 > SSP2), with an increase of 16.30 ~ 36.80%. This value was 3.82 ~ 15.54 percentage points higher than the mean value for the study area during the same period (Figure 5). The carrying capacity of the ecological environment and natural resources in the shoreline area was more severe than that in the study area.
Figure 5
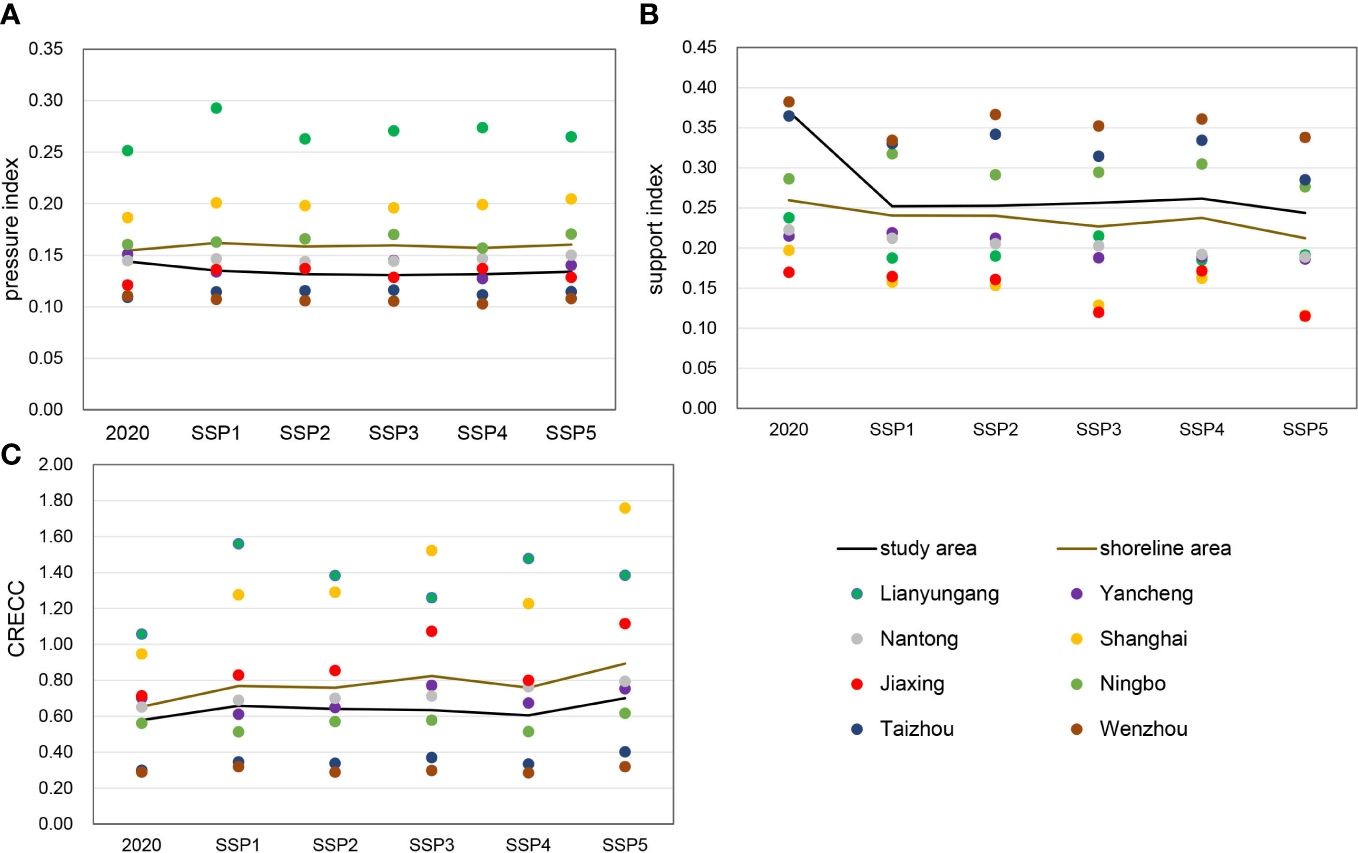
Changes of pressure index (A), support index (B) and CRECC (C) of 8 cities along the shoreline from 2020 to 2050.
Six of the eight cities, with Taizhou and Wenzhou being the exceptions, had pressure indices above the average stress index of the study area under the five SSP scenarios. Only three cities (Taizhou, Wenzhou, and Ningbo) had high support indices. This resulted in five cities (Lianyungang, Yancheng, Nantong, Shanghai, and Jiaxing) with higher CRECC, indicating a lower carrying capacity. It is significant that the shoreline areas are currently approaching a state of overload, and exhibit an increasing trend for the pressure index, by 2050. Moreover, it is important to acknowledge that the decreasing trend in the support index is moderate.
3.4 Obstacle factors analysis
Through obstacle-degree diagnosis, factors influencing CRECC in each region can be determined and analyzed. Table 7 shows that the most frequent obstacles in 2020 were P3 (water resource demand), S2 (construction space demand), and S5 (air pollutant emissions), which were seven, five, and four times higher, respectively. Under the five SSP scenarios for 2050, the main obstacle indicators for each province are the same. The obstacles with the highest frequencies were S3 (total water resources), S2 (total water resources), and S5 (air pollutant storage), which are 7 times, respectively, 5 and 3 times. This shows that the obstacle factors are mainly supporting indicators, and water resources, land resources, and the atmospheric environment are the main factors affecting the resource and environmental carrying capacity in the Yangtze River Delta coastal zone.
Table 7
| Lianyungang | Yancheng | Nantong | Shanghai | Jiaxing | Ningbo | Taizhou | Wenzhou | |
|---|---|---|---|---|---|---|---|---|
| 2020 | P3 | P6 | P3 | P3 | P3 | S4 | P3 | P3 |
| P2 | P2 | S5 | S5 | S2 | S2 | S5 | S2 | |
| S5 | P4 | S2 | P4 | S1 | P3 | S2 | P1 | |
| 2050 | S3 | S3 | S3 | S5 | S2 | S2 | S3 | S2 |
| S2 | S2 | S5 | S4 | P1 | S3 | S5 | P1 | |
| P5 | P5 | S4 | P3 | S3 | S1 | P4 | S3 |
Main obstacle factors of CRECC in Yangtze River Delta coastal zone.
4 Discussion
4.1 Expansion of urban land has important implications for future trends in CRECC
The predicted decrease in the pressure index between 2020 and 2050 is considered to be due to a reduction in resource demand, owing to the continued decrease in population size after 2030. The decrease in the support dimension index can be attributed to changes in future land use patterns. Land has important functions, such as the production of agricultural commodities, water conservation, and the maintenance of stable habitat quality. Changes in the spatial structure of land use and the intensity of development and utilization may change the distribution of the main regional functions and cause fluctuations in the effectiveness of regional resource use and ecological sustainability.
Many studies have shown that changes in urban land use are the principle causes of local ecosystem degradation and loss (McDonald et al., 2008; He et al., 2014). This study overlaid the spatial distribution maps of land use in 2020 and for 2050 under various SSPs scenarios. The results showed that the change in CRECC in the area not affected by the spatial expansion of urban land was negative, whereas the change in CRECC in the area where urban land occupied cultivated land, ecological land, and other construction land was positive. The urban expansion areas accounted for 7.12% ~ 8.48% of the total area between 2020 and 2050, and the CRECC increased by 0.023 ~ 0.052. This indicates that the more the land use pattern is affected by urban expansion, the more obvious the decreasing trend in carrying capacity (Table 8; Supplementary Figure 1). Cultivated land is the main land use type for food production, while ecological land and wetlands are important biological habitats. In the context of global development, urban expansion is an inevitable trend in economic growth, resulting in a reduction in the area of cultivated and ecological land. This trend could exacerbate regional food security problems and deteriorate habitat quality. This finding is supported by similar findings in previous studies (Soesbergen et al., 2017; Zhang et al., 2020).
Table 8
| Land use change path in 2020-2050 | SSP 1 | SSP 2 | SSP 3 | SSP 4 | SSP 5 | |||||
|---|---|---|---|---|---|---|---|---|---|---|
| Area ratio% | CRECC change | Area ratio% | CRECC change | Area ratio% | CRECC change | Area ratio% | CRECC change | Area ratio% | CRECC change | |
| Cultivated land → urban land | 5.05 | 0.017 | 4.61 | 0.014 | 3.78 | 0.044 | 4.33 | 0.010 | 4.89 | 0.082 |
| Green ecological land → urban land | 1.55 | 0.019 | 1.69 | 0.019 | 1.47 | 0.036 | 1.91 | 0.015 | 2.51 | 0.038 |
| Wetland → urban land | 0.14 | 0.004 | 0.16 | 0.028 | 0.15 | 0.039 | 0.10 | 0.039 | 0.17 | 0.049 |
| Other land → urban land | 1.02 | 0.009 | 0.96 | 0.030 | 0.84 | 0.041 | 0.78 | 0.027 | 0.91 | 0.038 |
| Total | 7.76 | 0.012 | 7.43 | 0.023 | 6.25 | 0.040 | 7.12 | 0.023 | 8.48 | 0.052 |
Effects of major land-use changes on CRECC changes under different SSPs scenarios from 2020 to 2050.
4.2 The pressure on resources and environment in the shoreline area is higher than the overall situation of the Yangtze River Delta coastal zone
The natural resource endowment and environmental management regimes of the Yangtze River Delta coastal zone differ, and their CRECC change processes exhibit clear spatial differences. The shoreline area is influenced by both land and sea economies, while also being constrained by the ecological environment, particularly the marine environment. It had a particularly low carrying capacity over the entire study area. This may have been due to the rapid development of coastal cities and marine economies. China’s coastal cities were the pioneers in the market economy stage, with Lianyungang, Nantong, Shanghai, Ningbo, and Wenzhou among the first open coastal cities in 1984. This was followed by the establishment of new coastal and economic zones in Shanghai and other places. A series of coastal development policies have accelerated population movement along the coast. Seaward activities and integration of land and sea transportation have developed rapidly. Coastal industries and port terminal construction have become increasingly active. The most significant impact was the artificialization of the coastline, with the length of the coastline growing by nearly 20% between 1990 and 2015 (Hou et al., 2016). These changes have resulted in the replacement of coastal habitats with artificially constructed surfaces. Biodiversity in some coastal zone areas has significantly declined due to the loss of biological shorelines, such as mangroves and coral reefs, as well as intertidal silty mudflats. This leads to the loss of ecological functions, which is an important cause of the low comprehensive carrying capacity.
4.3 Impact of major obstacle factors
According to obstacle factor analysis, water resources, land resources, and the atmospheric environment were the main factors. Support indicators exhibit a greater degree of influence than pressure indicators. This indicates that whether the carrying capacity of the Yangtze River Delta coastal zone can be improved in the future, it is necessary to focus on improving the capacity of natural resource supply, enhancing ecological environment management, and implementing rational construction land planning. In contrast to the findings of this study, Yang et al. (2022) concluded that the level of economic development is the primary obstacle to the comprehensive resource and environmental carrying capacity of Hainan Island, China. As the level of economic development in Hainan Island is comparatively lower than that of the coastal cities in the Yangtze River Delta, the development disparities between them are considerable. The coastal cities of the Yangtze River Delta have a high degree of economic development, and the natural resources and ecological environment-carrying capacity have become the main obstacles. Zheng et al. (2017) concluded that the obstacle degrees of energy consumption, investment in urban environmental infrastructure, and environmental protection have the greatest impact on Fujian’s comprehensive carrying capacity. These results indicate that Fujian and the Yangtze River Delta coastal provinces and cities share a high degree of similarity in terms of their comprehensive carrying capacity and development patterns.
5 Conclusion
Studying the current situation and future development trends of resource and environmental carrying capacities is of great significance for enhancing sustainable development and promoting further optimization of management strategies in coastal areas. This study proposes an evaluation framework for coastal resources and environmental carrying capacity (CRECC). We conducted an evaluation to explore the applicability of the scenario simulation method based on shared socioeconomic pathways, and to identify the main resource and environmental limiting factors of the Yangtze River Delta coastal zone. It provides ideas for the exploration of research on resource- and environment-carrying capacities in time and space predictions.
The main conclusions are as follows: (1) CRECC increased, and the carrying capacity decreased between 2000 and 2020. The increasing trend of the support index was lower than that of the pressure index. Shanghai had the lowest carrying capacity, and the carrying capacity of cities south of Shanghai was higher than that of the other cities. (2) During 2020–2050, the carrying capacities in all five predicted SSP scenarios decreased, with the SSP1 and SSP5 scenarios being the most obvious. This is because the decrease in the support index was much higher than that in the pressure index. The overall resource and environmental carrying capacity will not improve in the coming decades. Among these, the mismatch between natural ecological conditions and the intensity of human activities in the shoreline area is more prominent. (3) Support indicators had a more significant impact than pressure indicators. Among these, the supply capacity of water and land resources and the atmospheric quality were the main limiting factors for sustainable economic and ecological development.
We have long been committed to researching the resources and carrying capacities of coastal zones. In our previous research (Liu R. et al., 2020), the coastal resource–environmental carrying capacity index (CRECC) was evaluated based on three dimensions: resource, ecological, and socioeconomic systems. Within this, twenty indicators were selected, and the change characteristics of the CRECC for the Jiangsu coastal zone between 2000 and 2015, and the interaction relationship within the subsystem, were calculated using the entropy weight method, hierarchical analysis, and least squares method. On this basis, this paper presents obvious developments and breakthroughs in theoretical elaboration, model construction, and simulation prediction of coastal resource and environmental carrying capacity. However, this study has the following limitations: i) The uncertainty of the model has not been determined; ii) The number and interaction mechanisms of the influencing factors of resources and environmental carrying capacity were insufficiently explored. Consequently, we concur that future research should aim to enrich the data, continue to improve the model, enhance mathematical and statistical analyses, and evaluate the impact of the flow of resources and environmental factors in the regional space from an open system perspective.
Statements
Data availability statement
The original contributions presented in the study are included in the article/Supplementary Material. Further inquiries can be directed to the corresponding author.
Author contributions
RL planned the study, collected and analyzed the data, and wrote the manuscript. LP improved the research design and reviewed the manuscript. SH co-improved the research design and co-analyzed the data. All authors contributed to the article and approved the submitted version.
Funding
This work was funded by the National Natural Science Foundation of China (No. 42171245 and No. 41871083) and Ningbotech University Talent Introduction Project (20220315).
Conflict of interest
The authors declare that the research was conducted in the absence of any commercial or financial relationships that could be construed as a potential conflict of interest.
Publisher’s note
All claims expressed in this article are solely those of the authors and do not necessarily represent those of their affiliated organizations, or those of the publisher, the editors and the reviewers. Any product that may be evaluated in this article, or claim that may be made by its manufacturer, is not guaranteed or endorsed by the publisher.
Supplementary material
The Supplementary Material for this article can be found online at: https://www.frontiersin.org/articles/10.3389/fmars.2023.1008231/full#supplementary-material
References
1
BP Amoco . (2020). BP World energy outlook.
2
Chen Y. Guo F. Wang J. Cai W. Wang C. Wang K. (2020). Provincial and gridded population projection for China under shared socioeconomic pathways from 2010 to 2100. Sci. Data7 (1), 83. doi: 10.1038/s41597-020-0421-y
3
Chen. G. Li X. Liu X. Chen Y. Liang X. Leng J. et al . (2020). Global projections of future urban land expansion under shared socioeconomic pathways. Nat. Commun.11, 537. doi: 10.1038/s41467-020-14386-x
4
Chen D. Qi-gang Z. Lean Y. (2020). Response of resources and environment carrying capacity under the evolution of land use structure in chongqing section of the three gorges reservoir area. J. Environ. Manage.274, 111169. doi: 10.1016/j.jenvman.2020.111169
5
Cui G. M. Zhang X. L. Zhang Z. H. Cao Y. H. Liu X. J. (2019). Comprehensive land carrying capacities of the cities in the Shandong peninsula blue economic zone and their spatio-temporal variations. Sustainability11 (2), 439–450. doi: 10.3390/su11020439
6
Del Monte-Luna P. Brook B. W. Zetina-Rejón M. J. Cruz-Escalona V. H. (2004). The carrying capacity of ecosystems. Global Ecol. Biogeogr.13 (6), 485–495. doi: 10.1111/j.1466-822X.2004.00131.x
7
Díaz S. Pascual U. Stenseke M. Martín-López B. Watson R. T. Molnár Z. et al . (2018). Assessing nature's contributions to people. Science359 (6373), 270–272. doi: 10.1126/science.aap8826
8
Dong N. You L. Cai W. Li G. Lin H. (2018). Land use projections in China under global socioeconomic and emission scenarios: utilizing a scenario-based land-use change assessment framework. Global Environ. Change50, 164–177. doi: 10.1016/j.gloenvcha.2018.04.001
9
Du W. Yan H. Feng Z. Yang Y. Liu F. (2021). The supply-consumption relationship of ecological resources under ecological civilization construction in China. Res. Conserv. Recycling172, 105679. doi: 10.1016/j.resconrec.2021.105679
10
Duinker P. N. Greig L. A. (2007). Scenario analysis in environmental impact assessment: improving explorations of the future. Environ. Impact Assess. Rev.27 (3), 206–219. doi: 10.1016/j.eiar.2006.11.001
11
Elahi E. Khalid Z. Tauni M. Z. Zhang H. Lirong X. (2021). Extreme weather events risk to crop-production and the adaptation of innovative management strategies to mitigate the risk: a retrospective survey of rural punjab, Pakistan. Technovation4, 102255. doi: 10.1016/j.technovation.2021.102255
12
Elahi E. Khalid Z. Zhang Z. (2022). Understanding farmers’ intention and willingness to install renewable energy technology: a solution to reduce the environmental emissions of agriculture. Appl. Energy309, 118459. doi: 10.1016/j.apenergy.2021.118459
13
Ercan T. Onat N. C. Tatari O. (2016). Investigating carbon footprint reduction potential of public transportation in united states: a system dynamics approach. J. Cleaner Production133, 1260–1276. doi: 10.1016/j.jclepro.2016.06.051
14
Goldstein J. H. Caldarone G. Duarte T. K. Ennaanay D. Hannahs N. Mendoza G. et al . (2012). Integrating ecosystem-service tradeoffs into land-use decisions. Proc. Natl. Acad. Sci.109 (19), 7565–7570. doi: 10.1073/pnas.1201040109
15
Hák T. Janoušková S. Moldan B. . (2016). Sustainable development goals: A need for relevant indicators. Ecol. Indic.60, 565–573. doi: 10.1016/j.ecolind.2015.08.003
16
He Q. Bertness M. D. Bruno J. F. Li B. Chen G. Coverdale T. C. et al . (2014). Economic development and coastal ecosystem change in China. Sci. Rep.4 (1), 5995. doi: 10.1038/srep05995
17
He C. Y. Zhang D. Huang Q. X. Zhao Y. Y. (2016). Assessing the potential impacts of urban expansion on regional carbon storage by linking the LUSD-urban and InVEST models. Environ. Model. Softw.75, 44–58. doi: 10.1016/j.envsoft.2015.09.015
18
Hou X. Wu T. Hou W. Chen Q. Wang Y. Yu L. (2016). Characteristics of coastline changes in mainland China since the early 1940s. Sci. China:Earth Sci.46 (8), 1065–1075. doi: 10.1007/s11430-016-5317-5
19
Jiang T. Zhao J. Cao L. Wang Y. Su B. Jing C. et al . (2018). Projection of national and provincial economy under the shared socioeconomic pathways in China. Climate Change Res.14 (1), 50–58.
20
Landuyt D. Broekx S. Engelen G. Uljee I. van der Meulen M. Goethals P. L. M. (2016). The importance of uncertainties in scenario analyses - a study on future ecosystem service delivery in Flanders. Sci. Total Environ.553, 504–518. doi: 10.1016/j.scitotenv.2016.02.098
21
Lei K. P. Hu D. Wang Z. Yu Y. Y. Zhao Y. H. (2009). An analysis of ecological footprint trade and sustainable carrying capacity of the population in Macao. Int. J. Of Sustain. Dev. And World Ecol.16 (2), 127–136. doi: 10.1080/13504500902808685
22
Li S. (2004). The geography of ecosystem services (Beijing: Science Press).
23
Liao S. Wu Y. Wong S. W. Shen L. (2020). Provincial perspective analysis on the coordination between urbanization growth and resource environment carrying capacity (RECC) in China. Sci. Total Environ.730, 138964. doi: 10.1016/j.scitotenv.2020.138964
24
Liu X. Huang Y. Xu X. Xuecao L. Li X. Ciais P. et al . (2020). High-spatiotemporal-resolution mapping of global urban change from 1985 to 2015. Nat. Sustainability3, 564–570. doi: 10.1038/s41893-020-0521-x
25
Liu R. Pu L. Zhu M. Huang S. Jiang Y. (2020). Coastal resource-environmental carrying capacity assessment: a comprehensive and trade-off analysis of the case study in jiangsu coastal zone, eastern China. Ocean Coast. Manage.186, 105092. doi: 10.1016/j.ocecoaman.2020.105092
26
Liu C. Shi R. Zhang Y. Shen Y. Ma J. Wu L. et al . (2019). How many islands (reefs) are there in the world in 2015? how long is the land area and coastline?-data results based on Google earth remote sensing images. Global change data warehousing.
27
Liu. C. Wang W. Liu L. Li P. (2020). Supply-demand matching of county ecosystem services in Northwest China:A case study of gulang county. J. Natural Resour.35 (9), 2177–2190.
28
Mao H. Yu D. (2001). A study on the quantitative research of regional carrying capacity. Advance Earth Sci.16 (4), 549–555.
29
Mathis W. Larry O. Patricia B. Alejandro (1999). National natural capital accounting with the ecological footprint concept. Ecol. Econ.29, 375–390. doi: 10.1016/S0921-8009(98)90063-5
30
Matinzadeh M. M. Koupai J. A. Sadeghi-Lari A. Nozari H. Shayannejad M. (2017). Development of an innovative integrated model for the simulation of nitrogen dynamics in farmlands with drainage systems using the system dynamics approach. Ecol. Model.347, 11–28. doi: 10.1016/j.ecolmodel.2016.12.014
31
McDonald R. Kareiva P. Forman R. (2008). The implications of current and future urbanization for global protected areas and biodiversity conservation. Biol. Conserv.141, 1695–1703. doi: 10.1016/j.biocon.2008.04.025
32
Mikulic J. Kozic I. Kresic D. (2015). Weighting indicators of tourism sustainability: a critical note. Ecol. Indic.48, 312–314. doi: 10.1016/j.ecolind.2014.08.026
33
Murakami D. Yamagata Y. (2019). Estimation of gridded population and GDP scenarios with spatially explicit statistical downscaling. Sustainability11 (7), 2106. doi: 10.3390/su11072106
34
Naimi-Ait-Aoudia M. Berezowska-Azzag E. (2014). Algiers Carrying capacity with respect to per capita domestic water use. Sustain Cities Soc.13, 1–11. doi: 10.1016/j.scs.2014.03.006
35
Nakajima E. S. Ortega E. (2016). Carrying capacity using emergy and a new calculation of the ecological footprint. Ecol. Indic.60, 1200–1207. doi: 10.1016/j.ecolind.2015.08.054
36
Nyima Y. (2015). What factors determine carrying capacity? A Case study pastoral Tibet. Area47 (1), 73–80. doi: 10.1111/area.12137
37
O’Neill B. C. Kriegler E. Riahi K. Ebi K. L. Hallegatte S. Carter T. R. et al . (2014). A new scenario framework for climate change research: the concept of shared socioeconomic pathways. Climatic Change122 (3), 387–400. doi: 10.1007/s10584-013-0905-2
38
Peng B. Li Y. Elahi E. Wei G. (2019). Dynamic evolution of ecological carrying capacity based on the ecological footprint theory: a case study of jiangsu province. Ecol. Indic.99, 19–26. doi: 10.1016/j.ecolind.2018.12.009
39
Popp A. Calvin K. Fujimori S. Havlik P. Humpenöder F. Stehfest E. et al . (2017). Land-use futures in the shared socio-economic pathways. Global Environ. Change42, 331–345. doi: 10.1016/j.gloenvcha.2016.10.002
40
Ramesh R. Chen Z. Cummins V. Day J. D’Elia C. Dennison B. et al . (2015). Land–ocean interactions in the coastal zone: past, present & future. Anthropocene12, 85–98. doi: 10.1016/j.ancene.2016.01.005
41
Rani N. N. V. S. Satyanarayana A. N. V. Bhaskaran P. K. (2015). Coastal vulnerability assessment studies over India: a review. Natural Hazards77 (1), 405–428. doi: 10.1007/s11069-015-1597-x
42
Rees W. E. (1992). Ecological footprints and appropriated carrying capacity: what urban economics leaves out. Environ. Urbanization4 (2), 121–130. doi: 10.1177/095624789200400212
43
Shen L. Shu T. Liao X. Yang N. Ren Y. Zhu M. et al . (2020). A new method to evaluate urban resources environment carrying capacity from the load-and-carrier perspective. Resour. Conserv. Recycling154, 104616. doi: 10.1016/j.resconrec.2019.104616
44
Shi Y. S. Wang H. F. Yin C. Y. (2013). Evaluation method of urban land population carrying capacity based on GIS-a case of shanghai, China. Comput. Environ. And Urban Syst.39, 27–38. doi: 10.1016/j.compenvurbsys.2013.02.002
45
Soesbergen V. Arnell A. P. Sassen M. Stuch B. Schaldach R. Göpel J. et al . (2017). Exploring future agricultural development and biodiversity in Uganda, Rwanda and Burundi: a spatially explicit scenario-based assessment. Regional Environ. Change17 (5), 1409–1420. doi: 10.1007/s10113-016-0983-6
46
Sowman M. Raemaekers S. (2018). Socio-ecological vulnerability assessment in coastal communities in the BCLME region. J. Of Mar. Syst.188, 160–171. doi: 10.1016/j.jmarsys.2018.01.008
47
Sun L. Miao C. Li Y. (2017). Ecological-economic efficiency evaluation of green technology innovation in strategic emerging industries based on entropy weighted TOPSIS method. Ecol. Indic.73, 554–558. doi: 10.1016/j.ecolind.2016.10.018
48
Tang Y. Wang M. Liu Q. Hu Z. Zhang J. Shi T. et al . (2022). Ecological carrying capacity and sustainability assessment for coastal zones: a novel framework based on spatial scene and three-dimensional ecological footprint model. Ecol. Model., 466, 109881. doi: 10.1016/j.ecolmodel.2022.109881
49
Wang S. P. Li K. Q. Liang S. K. Zhang P. Lin G. H. Wang X. L. (2017). An integrated method for the control factor identification of resources and environmental carrying capacity in coastal zones: a case study in qingdao, China. Ocean Coast. Manage.142, 90–97. doi: 10.1016/j.ocecoaman.2017.03.024
50
Wu Y. Que W. Liu Y.-g. Cao L. Liu S.-b. Zhang J. (2020). Is resilience capacity index of Chinese region performing well? evidence from 26 provinces. Ecol. Indic.112, 106088. doi: 10.1016/j.ecolind.2020.106088
51
Xing L. Xue M. Hu M. (2019). Dynamic simulation and assessment of the coupling coordination degree of the economy–resource–environment system: case of wuhan city in China. J. Environ. Manage.230, 474–487. doi: 10.1016/j.jenvman.2018.09.065
52
Xu J. P. Li F. Suo A. N. Zhao J. H. Su X. (2019). Spatio-temporal change and carrying capacity evaluation of human coastal utilization in liaodong bay, China from 1993 to 2015. Chin. Geographical Sci.29 (3), 463–473. doi: 10.1007/s11769-019-1044-0
53
Yan H. Du W. Feng Z. Yang Y. Xue Z. (2022). Exploring adaptive approaches for social-ecological sustainability in the belt and road countries: from the perspective of ecological resource flow. J. Environ. Manage.311, 114898. doi: 10.1016/j.jenvman.2022.114898
54
Yan J. Jia S. Lv A. Zhu W. (2019). Water resources assessment of china's transboundary river basins using a machine learning approach. Water Resour. Res.55 (1), 632–655. doi: 10.1029/2018WR023044
55
Yang J. B. Ding H. (2018). A quantitative assessment of sustainable development based on relative resource carrying capacity in jiangsu province of China. Int. J. Environ. Res. Public Health15 (12), 2786–2798. doi: 10.3390/ijerph15122786
56
Yang X. Geng J. Xu Y. Zhuang H. Chen W. (2022). Spatialtemporal change and obstacle degree diagnosis of comprehensive land carrying capacity in hainan island based on TOPSIS model. Acta Ecologica Sin.42 (22), 1–11.
57
Yue D. Y. C. J B. G. J. X. X. (2019). Patio-temporal pattern prediction of the biocapacity in the shiyang river basin on the basis of the CAMarkov model. Acta Ecologica Sin.39 (6), 1993–2003.
58
Zhai T. L. Wang J. Fang Y. Qin Y. Huang L. Y. Chen Y. (2020). Assessing ecological risks caused by human activities in rapid urbanization coastal areas: towards an integrated approach to determining key areas of terrestrial-oceanic ecosystems preservation and restoration. Sci. Total Environ.708, 135153. doi: 10.1016/j.scitotenv.2019.135153
59
Zhang D. Huang Q. X. He C. Y. Wu J. G. (2017). Impacts of urban expansion on ecosystem services in the Beijing-Tianjin-Hebei urban agglomeration, China: a scenario analysis based on the shared socioeconomic pathways. Resour. Conserv. Recycling125, 115–130. doi: 10.1016/j.resconrec.2017.06.003
60
Zhang D. Wang X. Qu L. Li S. Lin Y. Yao R. et al . (2020). Land use/cover predictions incorporating ecological security for the Yangtze river delta region, China. Ecol. Indic.119, 106841. doi: 10.1016/j.ecolind.2020.106841
61
Zheng J. Yu H. Huang S. (2017). Evaluation and obstacle factors study on eco-environmental carrying capacity in fujian province based on DPSIR TOPSIS model. Acta Scientiae Circumstantiae37 (11), 4391–4398.
Summary
Keywords
coastal resource and environmental carrying capacity, scenario simulation, shared socioeconomic pathways, The Yangtze River Delta coastal zone, temporal and spatial variation
Citation
Liu R, Pu L and Huang S (2023) Simulation of coastal resource and environmental carrying capacity in the Yangtze River delta coastal zone based on shared socioeconomic pathways. Front. Mar. Sci. 10:1008231. doi: 10.3389/fmars.2023.1008231
Received
31 July 2022
Accepted
11 April 2023
Published
24 April 2023
Volume
10 - 2023
Edited by
Chao Chen, Zhejiang Ocean University, China
Reviewed by
Ehsan Elahi, Shandong University of Technology, China; Qinghua Ye, Deltares (Netherlands), Netherlands; Hesham Mostafa Elasmar, Damietta University, Egypt
Updates
Copyright
© 2023 Liu, Pu and Huang.
This is an open-access article distributed under the terms of the Creative Commons Attribution License (CC BY). The use, distribution or reproduction in other forums is permitted, provided the original author(s) and the copyright owner(s) are credited and that the original publication in this journal is cited, in accordance with accepted academic practice. No use, distribution or reproduction is permitted which does not comply with these terms.
*Correspondence: Lijie Pu, ljpu@nju.edu.cn
This article was submitted to Marine Conservation and Sustainability, a section of the journal Frontiers in Marine Science
Disclaimer
All claims expressed in this article are solely those of the authors and do not necessarily represent those of their affiliated organizations, or those of the publisher, the editors and the reviewers. Any product that may be evaluated in this article or claim that may be made by its manufacturer is not guaranteed or endorsed by the publisher.