 Hong Song
 Syed Raza Mehdi
 Zixin Li1
 Mengjie Wang
- 1Department of Marine Engineering, Ocean College, Zhejiang University, Zhoushan, Zhejiang, China
- 2Faculty of Physics, St.-Petersburg State Electrotechnical University “LETI”, St.-Petersburg, Russia
- 3Hainan Institute, Zhejiang University, Sanya, Hainan, China
Spectral reflectance detection of the targeted object is considered a vital inherent optical property for its potential to provide abundant spectral information, which is crucial in underwater spectral imaging. However, the coarse condition of the underwater environment due to turbidity causes extreme distortions in spectral reflectance detection due to the high absorption and scattering of light. To cope with the effects of light degradation on underwater spectral reflectance detection accuracy, the rate of the impacts of turbidity on spectral reflectance should be examined thoroughly. Therefore, we utilize a stare-type underwater spectral imaging system based on a liquid crystal tunable filter (LCTF) to study the effects of turbidity in underwater spectral imaging of various colored bodies. To examine the accuracy of underwater spectral reflectance detection based on escalating turbidity, the paper models the rate of increase in scattering intensity of the water body. Results show that, based on the non-linear increase in the pixel response of the black and white board, the rapid upsurge in scattering intensity occurs between 400nm to 500nm at different turbidity levels. Additionally, the spectral reconstruction of color bodies relative to the black and white board shows the maximum absolute deviation of 5.3% in spectral reflectance detection accuracy under varying turbidity. While employing underwater spectral imaging, the above findings of optimal band selection can find significant applications to improve the quality of underwater object detection.
1 Introduction
Since the 1980s, optical-based marine observation has become a vital technology in various marine sciences research (Jian et al., 2021; Shahani et al., 2021). However, the techniques for marine observation are still very limited due to the minimal knowledge of underwater environment conditions. For instance, turbidity limits the light penetration capacity to the depths of any water body due to absorption and scattering by total suspended particles (Tananaev and Debolskiy, 2014). This leads to underwater light degradation which poses significant challenges in underwater observation through optical imaging (Zhang et al., 2019); resulting in a considerable amount of undiscoverable information.
Meanwhile, the necessity for adequate underwater imaging systems for marine observation is pushing scientific horizons on multiple fronts (Akiba and Kakui, 2000). In the past decade, the concept of underwater spectral imaging technology has been developed by combining two-dimensional spatial information with one-dimensional spectral data, revealing the spectral features hidden in the narrow band (Polerecky et al., 2009). Because of its advantages of high spectral and spatial resolution, it has shown great potential in remote sensing applications (Yasir et al., 2023), exploration and mapping of seabed minerals, investigation of seabed ecological environment (Johnsen et al., 2013; Liu et al., 2020), marine archaeology (Ødegård et al., 2018), and classification of marine species such as sponges and corals (Song et al. 2021b).
Currently, a variety of underwater spectral imagers have been applied to various underwater detection applications. In 2009, the Norwegian University of science and technology and Ecotone developed a push broom underwater spectral imager for spectral detection of corals, submarine pipelines, algae, and mining ships (Johnsen et al., 2016). In 2016, another underwater spectral imaging was developed based on the rotary spectral imager, the system used 31 filters with different transmission bands to acquire spectral images in various bands. The system has been tested within a 50 m underwater depth range and carried out short-range spectral imaging research of coral reefs (Guo et al., 2016). In 2018, Zhejiang University cooperated with the Helmholtz Institute of Oceanography in Germany to develop a multispectral imaging system to monitor the underwater ecosystem (Liu et al., 2018). More recently, a push broom underwater hyperspectral imager was developed, which demonstrated high stability and a good detection effect for large-scale targets (Xue et al., 2021).
Distinguishing wavelengths in different spectral bands lies at the core of spectral imaging technology. Spectroscopic technology directly affects the structural complexity, volume, weight, and performance of the spectral imaging system. According to spectroscopy principles, spectra generation methods can be divided into dispersion, interference, computed tomography, coded aperture, and filter types. A liquid crystal tunable filter (LCTF) can switch its central wavelength through electrical signal control without moving mechanical structure, simplify the system structure, and improve reliability, response speed, and automation. Based on a stare-type underwater spectral imager based on LCTF (Song et al., 2021a), this paper explores the influence of different water turbidity and lighting conditions on the accuracy of spectral reflectance detection methods.
Spectral reflectance is an inherent optical property of an object widely used for target identification. Using appropriate methods to reconstruct the spectral reflectance of the targeted objects is the premise of spectral analysis and spectral image processing. There are two ways to reconstruct the spectral reflectance of underwater spectral images: first is the spectral irradiation calibration of the imaging and lighting system to obtain the spectral irradiation energy distribution of incident light. The obtained absolute spectral radiation energy is then inverted according to the pixel response of the target position in the spectral image resulting in the spectral irradiation energy of reflected light at the target position. Finally, the ratio of reflected light spectral irradiation energy to incident light spectral irradiation energy is taken as the spectral reflectance (Ping et al., 2017). The second spectral reflectance reconstruction method is a comparative measurement method reliant upon the known spectral reflectance of the standard target (Xia et al., 2018). In this paper, a method of underwater spectral reflectance reconstruction of a black and white board based on a comparative measurement method is proposed: the spectral reflectance of the target is reconstructed by introducing standard reference objects (standard black and white board with known spectral reflectance). This method synchronously collects the spectral image data of a standard whiteboard, blackboard, and target, and reconstructs the spectral reflectance of the target object through post-processing.
2 The underwater spectral imaging system
Figure 1 shows the underwater spectral imaging system based on LCTF. The imaging system takes LCTF as the core element spectrum splitter element, and the internal optical structure design mainly adopts the form of “imaging lens + LCTF + image sensor”. Compared with the “filter + imaging lens + image sensor” system, the above-discussed structure makes the spectral imaging system more compact and smaller. The imaging lens adopts a large-diameter electric focusing lens, which can be focused by a stepping motor. Using LCTF as a spectral device, an electrical signal can control the transmission wavelength of LCTF to generate narrowband scanning in the range of visible light. A scientific-grade charged coupled device (CCD) is used as an image sensor to improve imaging sensitivity in the underwater environment. Later, the underwater spectral imaging system is sealed for waterproofing followed by the optical system installation and underwater pressure test analysis. To ensure the accuracy and reliability of the spectral imaging system, imaging parameters such as spectral resolution, spectral response sensitivity, and underwater detection sensitivity are tested and calibrated with a standard monochromator and spectrometer (Song et al. 2021a).
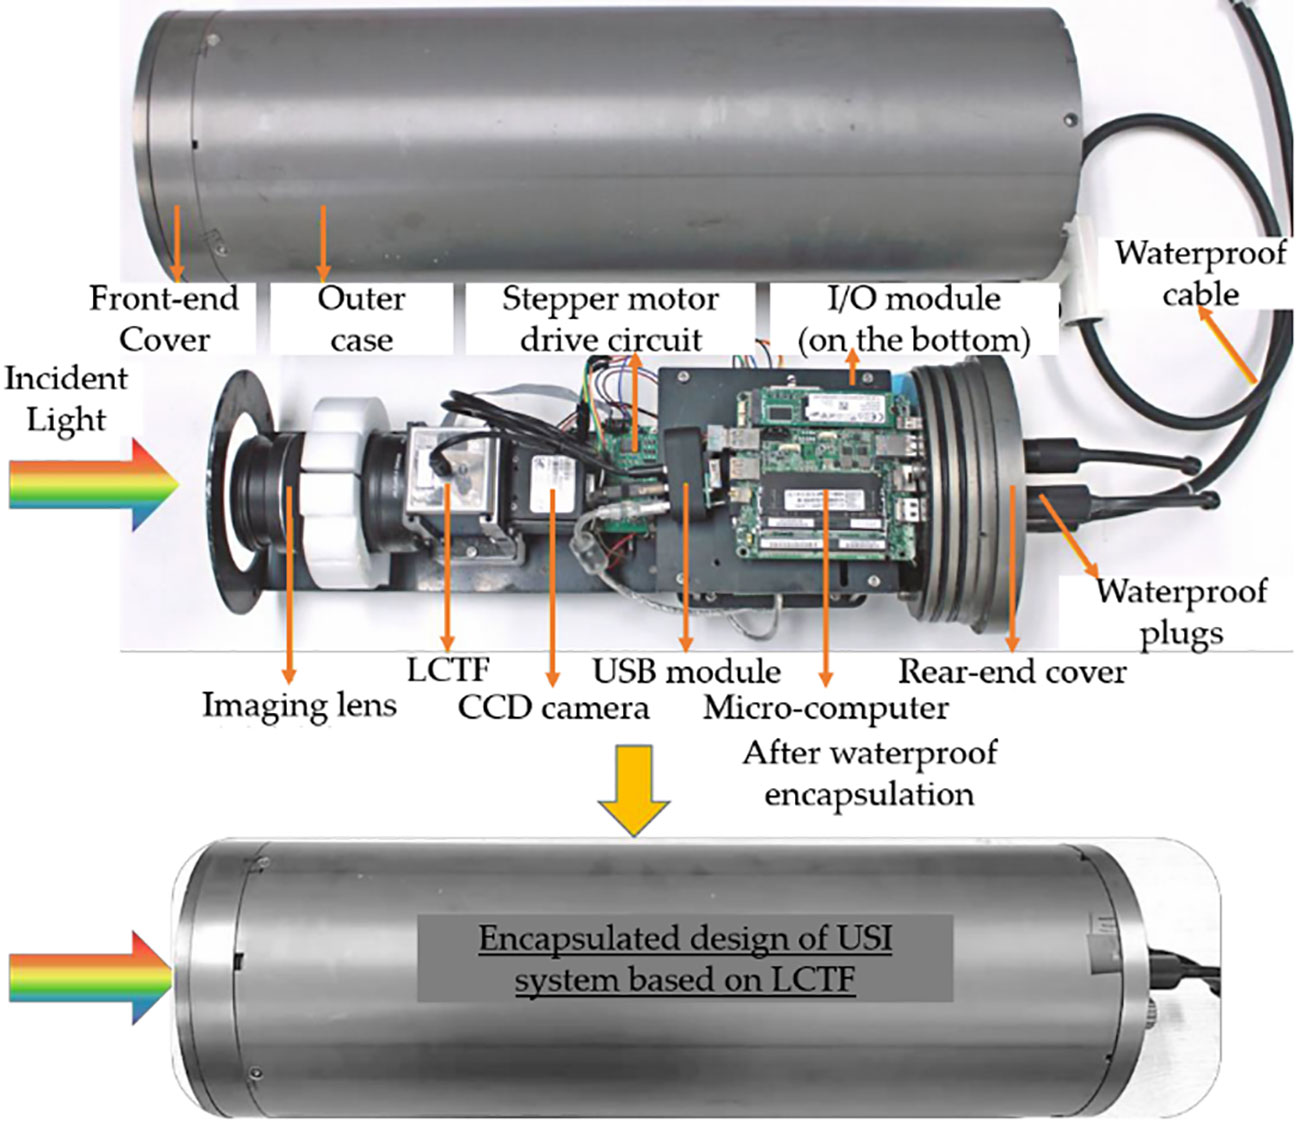
Figure 1 Encapsulated structure of the designed USI system. The hardware includes optical (lens, LCTF, and imaging sensor) and control (microcomputer, motor drive circuit, remote I/O circuitry, and voltage converter) modules installed in a waterproof mechanical structure (Song et al. 2021a).
The underwater spectral imaging system isolates the water body through the compressive cabin glass. Since the optical medium on the sides of compressive glass is water and air respectively, the refraction of the water body and the glass window must be considered in imaging. To simplify the model and ignore the influence of the illumination source, it is assumed that the self-luminous target is used for underwater spectral imaging, and the light emitted by the target is refracted twice by water-optical glass-air interface before incident into the imaging lens. As shown in Figure 2, the optical path of underwater spectral imaging can be equivalent to imaging the object plane (refracted virtual plane in case of underwater) in the air after removing the optical glass. Therefore, the image distance zw in the imaging model can be defined as:
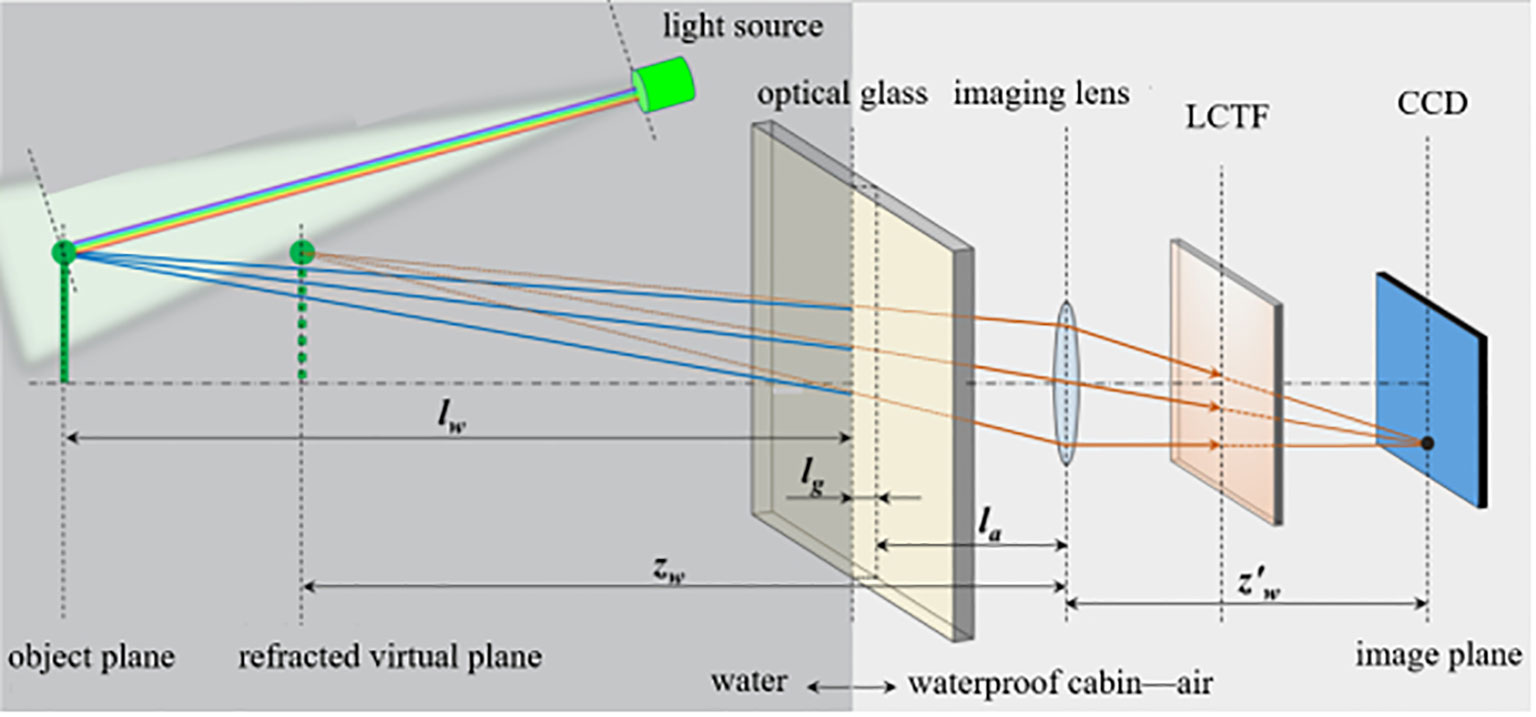
Figure 2 Schematics of underwater spectral imaging and spectral reflectance measurement by underwater spectral imaging system based on LCTF.
where la is the distance between the optical center of the lens and the inner surface of the optical glass, lg is the thickness of the optical glass, lw is the distance between the target plane and the outer surface of the optical glass, ng is the refractive index of the optical glass (that is approximately equal to 1.49 for acrylic glass), and nw is the refractive index of the water body (that is 1.33).
Defining the spatial position coordinate on the object plane of a point on the underwater target as P(xw, yw), focal length of the camera f, and the distance between image plane and optical center of the lens . The position coordinates of the conjugate point on the image plane of the image sensor are recorded as P(, ), the three conjugate coordinate are defined as:
3 Experimental setup
The spectral reflectance curve information of the object surface can be used as important feature information of object recognition. In the air, the spectral reflectance reconstruction generally adopts the comparison measurement method: the spectral reflectance and spectral response value of the standard whiteboard are Rw(λc) and Iw, respectively, and the spectral response value of the target is Ic,then the spectral reflectance of the target Rc(λc) is as follow;
In water, it is difficult to detect the spectral reflectance of the target. Especially in turbid water, suspended particles have a significant scattering effect on light, resulting in blurred imaging and a considerable loss of color and other characteristic information. To mitigate these distortions, this work proposes a method of underwater spectral reflectance reconstruction of a black and white board based on a comparative measurement method. Standard black and white board is introduced as correction plates to reconstruct the spectral reflectance of targets in the water. The spectral reflectance and spectral response of the whiteboard are Rw(λc) and Iw, respectively. The spectral reflectance and spectral response of the blackboard are Rb(λc) and Ib, respectively, and the spectral response of the target is Ic,then the spectral reflectance of the underwater targeted object Rc(λc) is as follows;
3.1 Spectral imaging setup
The bandwidth of the absorption peak or reflection peak caused by the spectral reflection of the underwater target is generally about 5nm to 50nm. In this work, the underwater spectral imager based on LCTF collects the spectral image data of the target in 2nm steps and extracts the spectral response curve of any pixel or combination of pixels in the image space.
Due to the dominant Rayleigh scattering of turbid water in the test tank, the optical thickness is 1.155, and the extinction coefficient is considered equivalent to seawater. Figure 3 shows the details of experimental device for measuring the spectral reflectance of underwater targets. The setup quantitatively analyze the influence of water turbidity and illumination conditions on the measurement of spectral reflectance and then identify the accuracy of underwater spectral reflectance reconstruction method. The execution of the experimental process in the darkroom environment is as follows: initially, the underwater target object (i.e. white, black and color board) is illuminated with two white white light emitting diaodes (LED) sources (refered as illumination A). After setting the focus and exposure time, the spectral images of target boards were collected in 151 wave bands ranging from 400 nm to 700 nm with 2 nm step difference. With the addition of certain amount of milk emulsion, the degree of turbidity of water body is varied from minimum to maximum of 51 NTU to simulate natural turbid water body. The results were calculated for 0 NTU, 11 NTU, 12 NTU, 21 NTU, 39 NTU, and 51 NTU. The experiment is repeated several times to collect spectral image data under varying water turbidity. Furthermore, the spectral data of target boards were also collected under the illumination of two blue LED light sources (refered as illumination B).
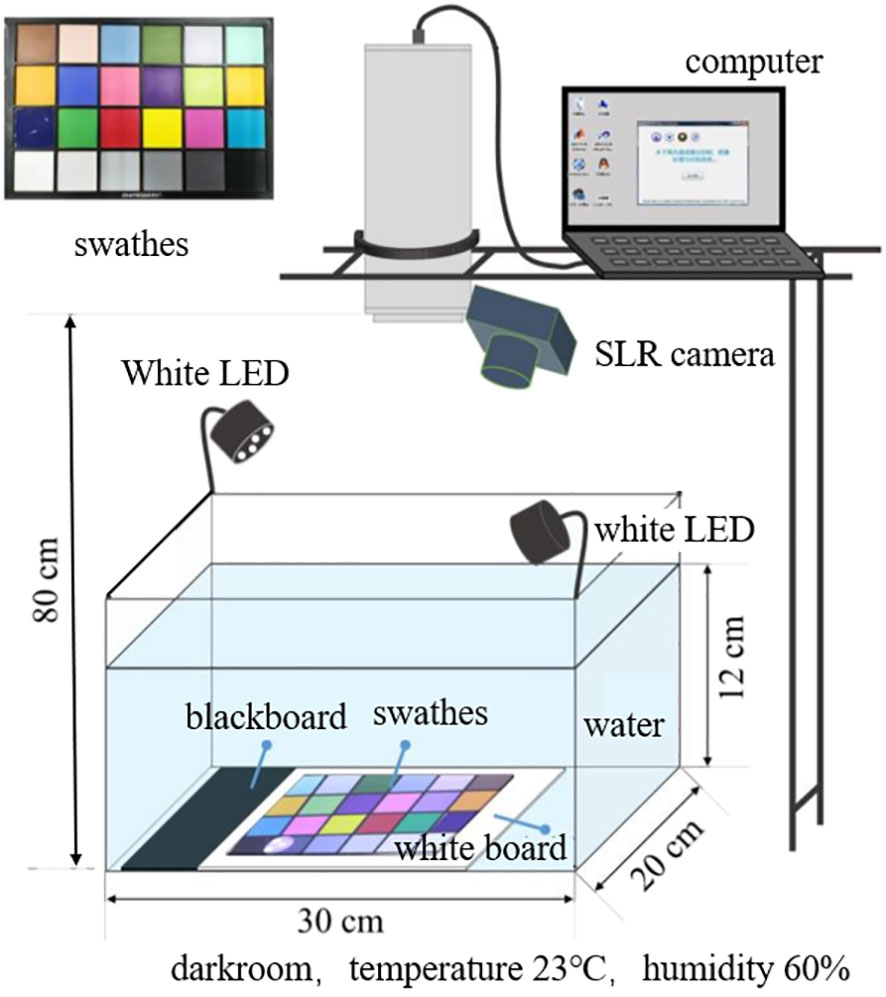
Figure 3 Schematic diagram of the experimental setup to measure the underwater spectral reflectance by LCTF-based spectral imaging system under varying conditions of turbidity and illumination.
3.2 Data processing
For the spectral image collected at a particular central wavelength, the pixel response is related to the response bandwidth of the system and the spectral characteristics of each device within the bandwidth. Assuming that the spectral characteristics are evenly distributed within the bandwidth, the pixel response I(x, y, λc) is:
where,(x,y) represents the pixel position in the image corresponding to a specific pixel,λc signifies the central wavelength of the band corresponding to the spectral image,K(λc) characterizes the mapping relationship from the spectral energy to the pixel response,R(λc) embodies the spectral reflectance of the target,Es(λc) represents the incident spectral radiation energy at the target position,Et(λc) denotes the water body or water surface stray light entering the image surface,c(λc) shows the spectral attenuation coefficient of the water body, andlw represents the water depth.
The data processing technique involves denoising all the spectral images of the whiteboard, blackboard, and color board. Seven areas of equally spaced array distribution are selected on the color board. The size of each area is 5 × 5 pixels. Median pixel response as the pixel response of the color board is considered. Similarly, pixel spectral responses of the white and blackboard are extracted. The pixel response of the pixel area in row ith and column jth of the color block can be recorded as Ic, the pixel response at the exact position of the whiteboard spectral image can be recorded as Iw, and the pixel response of the blackboard spectral image can be recorded as Ib. Since the pixel spectral response is in the same position, it is approximately considered that K(λc), Es(λc), c(λc), and Et(λc) remain unchanged, and the spectral reflectance corresponding to the pixel region is as the spectral reflectance of the underwater targeted object Rc(λc).
4 Results and discussion
As shown in Figure 4, under illumination A, the ratio of spectral image pixel responses of the blackand whiteboard at the same position represents the spectral response of the system to the water body under different turbidity. When the turbidity of the water body is minimum or below 4 NTU, the black and whiteboard pixel response ratio is low and stable in the range of 450 nm to 700 nm, and the average value is 3.9%. When the water turbidity gradually increases, the concentration of emulsion dispersed particles in the water body increases so that the scattering effect of the water body is significantly enhanced. The proportion of the scattered light signal received by the CCD image plane is increased dramatically compared with the reflected signal of the target, resulting in the non-linear increase of the pixel response ratio of the black and whiteboard and the scattering effect of the water body in the range of 400 nm to 500 nm is enhanced rapidly.
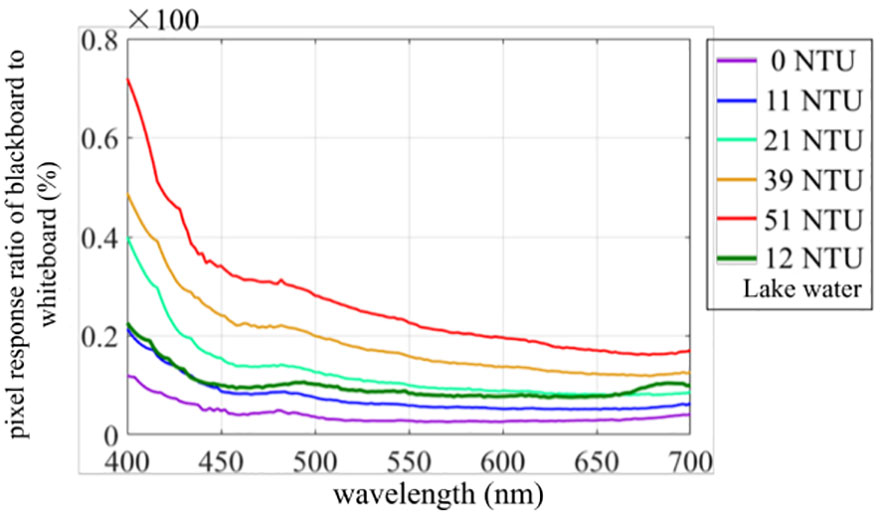
Figure 4 Pixel-based spectral response ratio of blackboard and whiteboard under varying turbidity conditions of the water body.
As shown in Figure 5, under illumination A in clear water, the spectral image data of the color plate collected by the system are corrected by the black and white board to obtain the spectral reflectance data of different color blocks. The spectral reflectance of blocks of various hues, such as red, yellow, green, and blue, has varying spectral characteristics. It is also noticed that the color blocks with different saturation and lightness in the same hue also have different spectral characteristics. For example, dark red color blocks have high and stable spectral reflectance in the wavelength band of 630 nm to 700 nm, with an average of 36.6%. The spectral reflectance curve of the pink color block has three peak characteristics, and the peak wavelengths are 446 nm, 604 nm, and 672 nm respectively. The light pink color block has high and stable spectral reflectance in the wave band of 610 nm to 700 nm, with an average of 51.9%; The yellow color block has high and stable spectral reflectance in the 540 nm to 700 nm band, with an average of 48.2%.
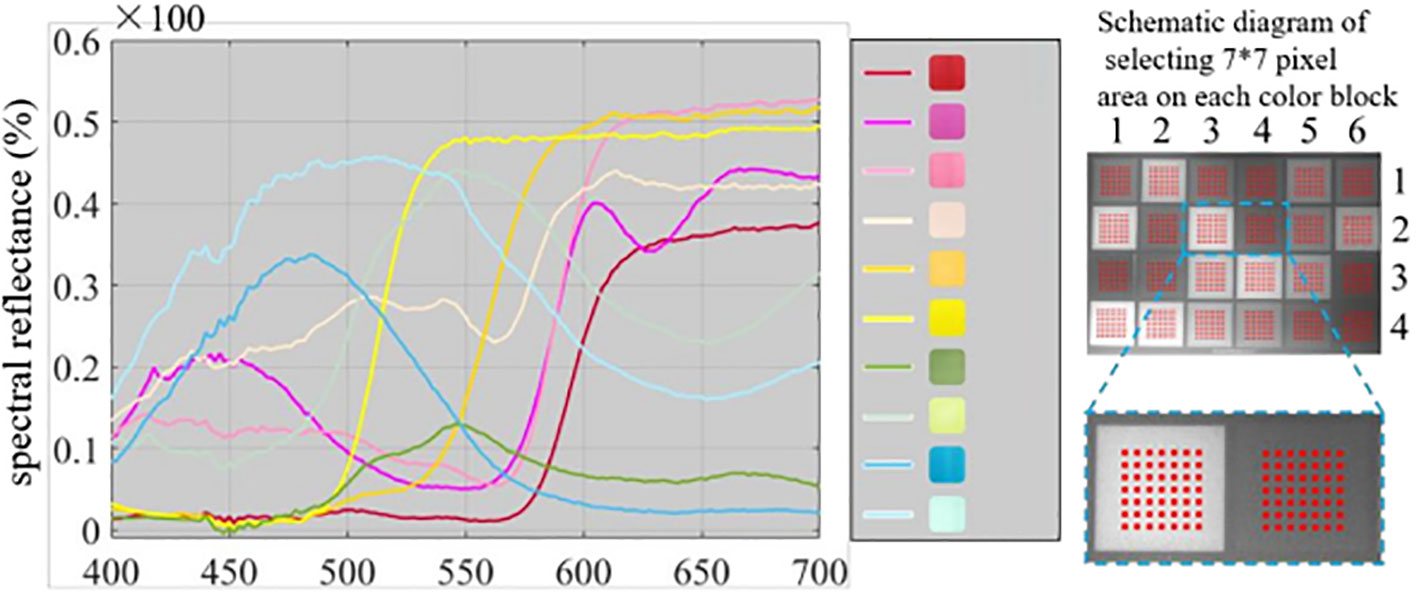
Figure 5 Pixel-based spectral reflectance detection of different color blocks in water at turbidity below 4NTU.
Furthermore, the spectral images are collected under illumination A and B in varying turbidity of minimum turbidity as 0 NTU and 11 NTU, as in Figure 6, and the spectral reflectance of the color plate is calculated. Under the turbidity of 11 NTU, the maximum absolute deviation of the spectral reflectance of the color plate under illumination condition A is 1.9%, and the maximum relative deviation is 4.1%. The maximum absolute deviation of the spectral reflectance of the color plate under light condition B from the benchmark is 2.3%, and the maximum relative deviation is 4.9%. In the lake water (collected from Minghui Lake in Zhoushan campus of Zhejiang University, with a turbidity of 11 NTU), compared with the benchmark, the maximum absolute deviation and the spectral reflectance of the color plate under illumination B are 2.8% and 6.1% respectively.
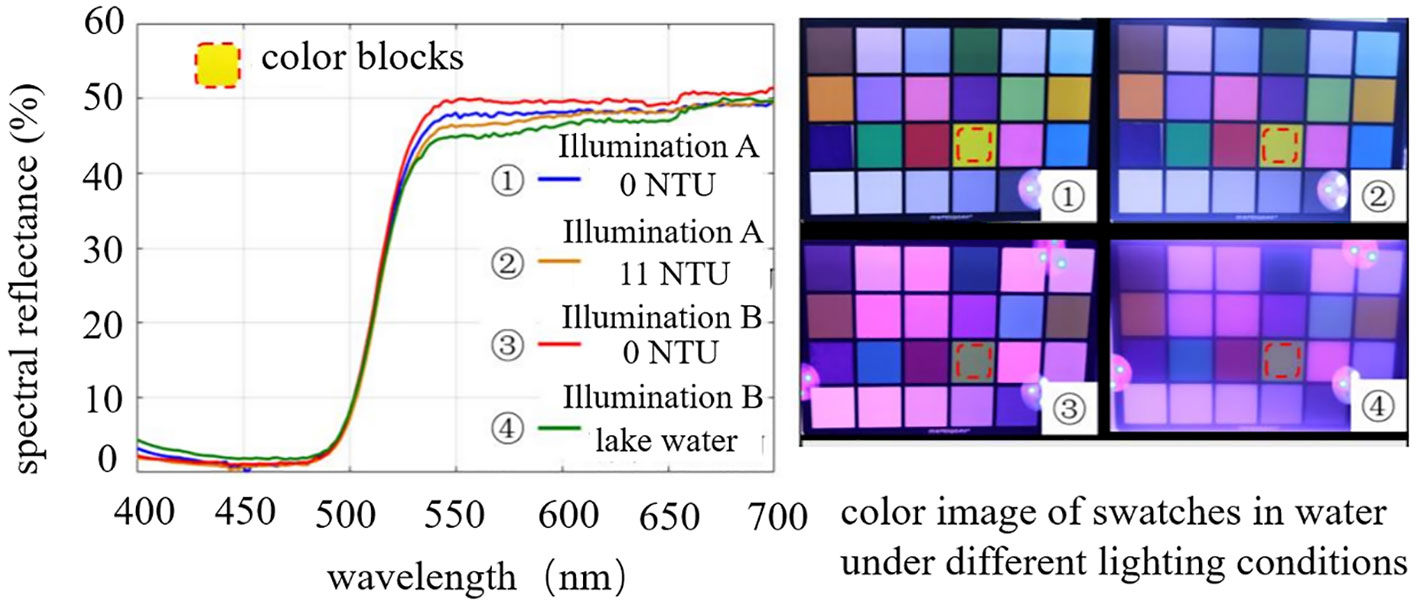
Figure 6 Explanation of spectral reflectance detection of specific color block; yellow patch under varying turbidity and illumination.
As shown in Figure 7, under illumination A, the turbidity of the water body is gradually increased, and the color plate’s spectral images are collected simultaneously. The spectral reflectance curves of different color blocks under varying turbidity conditions can be obtained through black and whiteboard correction. When the water turbidity is lower, the results of spectral reflectance of the same color block under different water turbidity are close to the same. However, when the water turbidity is high, spectral reflectance fluctuates, and the maximum absolute deviation of 5.3% is noted. It is also observed that the overall spectral characteristics of color plates have not changed. Through the black and whiteboard correction, underwater targets’ spectral reflectance reduction results are close to the actual values, and the changes in lighting conditions and water turbidity have little impact on spectral reflectance.

Figure 7 Spectral reflectance detection of color blocks after the spectral reconstruction process through black and white board correction technique.
5 Conclusion
In this work, underwater spectral imaging is observed under the impact of varying turbidity of water body. The paper also described the spectral reflectance reconstruction method of the underwater target by utilizing the underwater spectral imaging system based on LCTF. In order to overcome the influence of water turbidity causing light scattering on the measurement of spectral reflectance, a comparison-based black and white board correction method is introduced for spectral reconstruction. The experiments showed that by changing the water turbidity and using various illumination conditions, the spectral reflectance measurement method based on the black and white board correction method could be applied. The spectral response and reflectance curves of several targets were accurately obtained. The results also verified the peak spectral response of different underwater color bodies in the wave spectrum in the varying turbidity of water body. The system obtained the maximum absolute deviation of 5.3% for various colors under varying turbidity conditions. The reliability and accuracy of the data obtained by the underwater spectral imaging system based on LCTF can be further utilized in the applications of underwater spectral imaging for target detection. The significance of this work lies in the fact that it can enable researchers to determine the possible spectral range needed for a specific degree of turbidity thereby enhancing the quality of underwater spectral reflectance detection.
Data availability statement
The original contributions presented in the study are included in the article/Supplementary Material. Further inquiries can be directed to the corresponding author.
Author contributions
HS, SRM, and HH contributed to the conceptualization of the experiment. SRM, ZL, MW, and CW devised and conducted the experiment and organized the data processing. HH and SRM wrote the original manuscript. SRM and VV conducted the comprehensive revision. All authors contributed to the article and approved the submitted version.
Funding
This study was financially supported by the Key Research and Development Plan of Zhejiang Province, China (Grant number: 2020C03012, 2021C03181).
Acknowledgments
The authors present special gratitude to the Intelligent Underwater Optics laboratory team of Ocean College, Zhejiang University, for their assistance during the work.
Conflict of interest
The authors declare that the research was conducted in the absence of any commercial or financial relationships that could be construed as a potential conflict of interest.
Publisher’s note
All claims expressed in this article are solely those of the authors and do not necessarily represent those of their affiliated organizations, or those of the publisher, the editors and the reviewers. Any product that may be evaluated in this article, or claim that may be made by its manufacturer, is not guaranteed or endorsed by the publisher.
References
Ødegård Ø., Mogstad A. A., Johnsen G., Sørensen A. J., Ludvigsen M. (2018). Underwater hyperspectral imaging: A new tool for marine archaeology. Appl. Opt. 57 (12), 3214–3223. doi: 10.1364/AO.57.003214
Akiba T., Kakui Y. (2000). Design and testing of an underwater microscope and image processing system for the study of zooplankton distribution. IEEE J. Ocean. Eng. 25 (1), 97–104. doi: 10.1109/48.820741
Guo Y., Song H., Liu H., Wei H., Yang P., Zhan S., et al. (2016). Model-based restoration of underwater spectral images captured with narrowband filters. Opt. Express 24 (12), 13101–13120. doi: 10.1364/OE.24.013101
Jian M., Liu X., Luo H., Lu X., Yu H., Dong J. (2021). Underwater image processing and analysis: A review. Signal Process.: Image Commun. 91, 116088. doi: 10.1016/j.image.2020.116088
Johnsen G., Ludvigsen M., Sørensen A., Aas L. M. S. (2016). The use of underwater hyperspectral imaging deployed on remotely operated vehicles-methods and applications. IFAC-PapersOnLine 49 (23), 476–481. doi: 10.1016/j.ifacol.2016.10.451
Johnsen G., Volent Z., Dierssen H., Pettersen R., Van Ardelan M., Søreide F., et al. (2013). “Underwater hyperspectral imagery to create biogeochemical maps of seafloor properties,” in Subsea optics and imaging (Woodhead Publishing), 508–540e.
Liu B., Liu Z., Men S., Li Y., Ding Z., He J., et al. (2020). Underwater hyperspectral imaging technology and its applications for detecting and mapping the seafloor: A review. Sensors 20 (17), 4962. doi: 10.3390/s20174962
Liu H., Sticklus J., Köser K., Hoving H. J. T., Song H., Chen Y., et al. (2018). TuLUMIS-a tunable LED-based underwater multispectral imaging system. Opt. express 26 (6), 7811–7828. doi: 10.1364/OE.26.007811
Ping Y., Yilu G., He W., Dan S., Hong S., Yunfei Z., et al. (2017). Method for spectral restoration of underwater images: Theory and application. Infrared Laser Eng. 46 (3), 323001–0323001. doi: 10.3788/IRLA201746.0323001
Polerecky L., Bissett A., Al-Najjar M., Faerber P., Osmers H., Suci P. A., et al. (2009). Modular spectral imaging system for discrimination of pigments in cells and microbial communities. Appl. Environ. Microbiol. 75 (3), 758–771. doi: 10.1128/AEM.00819-08
Shahani K., Song H., Mehdi S. R., Sharma A., Tunio G., Qureshi J., et al. (2021). Design and testing of an underwater microscope with variable objective lens for the study of benthic communities. J. Mar. Sci. Appl. 20 (1), 170–178. doi: 10.1007/s11804-020-00185-9
Song H., Mehdi S. R., Wu C., Li Z., Gong H., Ali A., et al. (2021a). Underwater spectral imaging system based on liquid crystal tunable filter. J. Mar. Sci. Eng. 9 (11), 1206. doi: 10.3390/jmse9111206
Song H., Mehdi S. R., Zhang Y., Shentu Y., Wan Q., Wang W., et al. (2021b). Development of coral investigation system based on semantic segmentation of single-channel images. Sensors 21 (5), 1848. doi: 10.3390/s21051848
Tananaev N. I., Debolskiy M. V. (2014). Turbidity observation in sediment flux studies: Example from Russian rivers in cold environments. Geomorphology 218, 63–71. doi: 10.1016/j.geomorph.2013.09.031
Xia W., Ning-fang L., Ya-sheng L., Hao-bo C., Bin C., Wen-ming Y., et al. (2018). The research on reconstruction of spectral reflectance in LCTF imaging system based on comparative measurement. Spectrosc. Spectral Anal. 38 (1), 290–295.
Xue Q., Tian Z., Yang B., Liang J., Li C., Wang F., et al. (2021). Underwater hyperspectral imaging system using a prism–grating–prism structure. Appl. Opt. 60 (4), 894–900. doi: 10.1364/AO.415351
Yasir M., Shanwei L., Mingming X., Hui S., Hossain M. S., Colak A. T. I., et al. (2023). Multi-scale ship target detection using SAR images based on improved Yolov5. Front. Mar. Sci. 9, 1086140. doi: 10.3389/fmars.2022.1086140
Keywords: spectral reflectance, spectral imaging, turbidity, spectral detection, liquid crystal tunable filters, spectral features, underwater scattering
Citation: Song H, Mehdi SR, Li Z, Wang M, Wu C, Venediktov VY and Huang H (2023) Investigating the rate of turbidity impact on underwater spectral reflectance detection. Front. Mar. Sci. 10:1031869. doi: 10.3389/fmars.2023.1031869
Received: 30 August 2022; Accepted: 20 February 2023;
Published: 13 March 2023.
Edited by:
Andrew James Manning, HR Wallingford, United KingdomReviewed by:
Jessica Lunt, Dauphin Island Sea Lab, United StatesXiaoping Wang, Zhejiang University, China
Copyright © 2023 Song, Mehdi, Li, Wang, Wu, Venediktov and Huang. This is an open-access article distributed under the terms of the Creative Commons Attribution License (CC BY). The use, distribution or reproduction in other forums is permitted, provided the original author(s) and the copyright owner(s) are credited and that the original publication in this journal is cited, in accordance with accepted academic practice. No use, distribution or reproduction is permitted which does not comply with these terms.
*Correspondence: Hui Huang, aHVpaEB6anUuZWR1LmNu
†ORCID: Hong Song, orcid.org/0000-0002-1000-4764
Syed Raza Mehdi, orcid.org/0000-0002-7727-1859