 Riccardo Melis1‡
 Laura Vacca1‡
 Alessia Cariani2*
 Laura Carugati1
 Alessandro Cau1
 Charis Charilaou3
 Simone Di Crescenzo1
 Alice Ferrari2
 Maria Cristina Follesa1Farid Hemida4
 Sarah Helyar5
 Sabrina Lo Brutto6†
 Letizia Sion7
 Fausto Tinti2*
 Rita Cannas1*
- 1Department of Life and Environmental Sciences, University of Cagliari, Cagliari, Italy
- 2Department of Biological, Geological and Environmental Sciences, Alma Mater Studiorum University of Bologna, Ravenna, Italy
- 3Department of Fisheries and Marine Research, Ministry of Agriculture, Rural Development and Environment, Nicosia, Cyprus
- 4Ecole Nationale Supeírieure des Sciences de la Mer et de l’Amenagement du Littoral, Dely Ibrahim, Algiers, Algeria
- 5School of Biological Sciences, Institute for Global Food Security, Queen’s University Belfast, Belfast, United Kingdom
- 6Department of Biological, Chemical and Pharmaceutical Sciences and Technologies, University of Palermo, Palermo, Italy
- 7Department of Biology, University of Bari Aldo Moro, Bari, Italy
The present study, based on microsatellite markers, describes a population genetic analysis of the small-spotted catshark Scyliorhinus canicula (Linnaeus, 1758), representing one of the most abundant and commonly caught cartilaginous fishes in the Mediterranean Sea and adjacent areas. The analyses were performed to unravel the genetic features (variability, connectivity, sex-biased dispersal) of their relative geographic populations, both at the small (around the coast of Sardinia, Western Mediterranean Sea) and at a larger spatial scale (pan-Mediterranean level and between the Atlantic Ocean and the Mediterranean Sea). Individual clustering, multivariate and variance analyses rejected the hypothesis of genetic homogeneity, with significant genetic differences mainly within the Mediterranean between the Western and Eastern basins, as well as between the Mediterranean and the NE Atlantic Ocean. In detail, our results seem to confirm that the Strait of Gibraltar could not represent a complete barrier to the exchange of individuals of small-spotted catshark between the Atlantic Ocean and the Mediterranean Sea. In the latter area, a complex genetic structuring for S. canicula was found. Apart from differences among the Western, Eastern and Adriatic sites, within the Western basin the small-spotted catsharks around Sardinian waters are strongly differentiated from all others (both from the eastern Tyrrhenian Sea and southernmost part of the Algerian basin) and are demographically stable. Several possible mechanisms, both biological and abiotic (e.g., migratory behavior, waterfronts, and oceanographic discontinuities), are discussed here to explain their peculiar characteristics. Overall, the genetic data presented, both at the local and regional level, could represent a baseline information, useful for the temporal monitoring of populations, and to assess the effects of present or future fishing/management/conservation measures.
1 Introduction
Elasmobranchs are by far the most endangered group of fishes in the Mediterranean Sea, with over 40% of species classified by the IUCN as threatened: Vulnerable (8.1%), Endangered (12.8%) and Critically Endangered (19.8%) (Ebert and Dando, 2021). The remarkable increase in fishing effort and the inherent low resilience of this taxon to harvesting have led to the decrease of Mediterranean shark and batoid populations during the last 50 years (Serena et al., 2020). Characteristic life-history traits such as slow growth, late maturity, low fecundity and productivity, long gestation periods, and a long-life span make elasmobranchs vulnerable and highly impacted by fisheries. Other factors, such as habitat loss and environmental degradation, have contributed to abundance and diversity decline in the Mediterranean area (Peristeraki et al., 2020) and highlight the urgent need for a conservation action plan for chondrichthyan populations of the Basin (Dulvy et al., 2014; Dulvy et al., 2017; SPA/RAC–UN Environment/MAP, 2020; Jorgensen et al., 2022). However, specific management measures to improve their status are still limited due to insufficient information on many species (Elliott et al., 2020; Dulvy et al., 2021). In the Mediterranean Sea, nearly 30% of species are still classified as Data Deficient (18.6%) or Not Evaluated (10.5%) (Ebert and Dando, 2021).
Intense harvesting and related population declines may induce genetic effects such as the loss of genetic variation, inbreeding, genetic drift, and selective genetic changes, reducing the resilience of overfished species (Domingues et al., 2018; Pacoureau et al., 2021). Therefore, genetic studies, describing the intraspecies diversity of sharks and rays, are urgently needed.
It has been suggested that, apart from relying only on studies on the basic biology, life history and population ecology, shark and ray fisheries management and conservation policies should also consider genetic diversity metrics. Because the long-term survival of a species is strongly dependent on the levels of genetic diversity within and between populations, knowing the effective population size, observed heterozygosity, and allelic richness is of priority interest (Ovenden et al., 2015; Domingues et al., 2018). Thus, urgency should be placed on genetic studies of shark and ray species that are currently heavily exploited, conducting not only analyses essential to determining management priorities, but a genetic monitoring program producing temporal replicates to assess genetic variation over time. These data series would enable the assessment of temporal stability of the population structure, the loss of genetic diversity over time, and/or changes in population size (Domingues et al., 2018; Jorgensen et al., 2022).
In this context, the present paper deals with population genetic analysis of an exploited elasmobranch which is widespread and abundant in the Mediterranean and the adjacent eastern Atlantic Ocean: the small-spotted catshark Scyliorhinus canicula (Linnaeus, 1758) (Cashion et al., 2019; Follesa et al., 2019). S. canicula inhabits the continental shelf and uppermost slope waters throughout the Mediterranean Sea as well as the continental shelves of the Northeastern Atlantic Ocean, from Norway and the British Isles to Senegal and possibly Benin, from nearshore to a depth of 800 m (Finucci et al., 2021). Recent fishery data indicate it is a commonly caught species in the western Mediterranean and encountered less regularly in the eastern basin (Follesa et al., 2019). The small-spotted catshark is frequently captured accidentally but is often retained as a valuable by-catch of fisheries that focus on more productive teleost fish species (Follesa et al., 2019). However, there is no evidence of significant population decline in S. canicula; on the contrary, stable or even increasing population trends are reported in some parts of their range, justifying the inclusion of the species in the global IUCN Red List in the lower-risk categories as Least Concern (Finucci et al., 2021). The acquisition of genetic data, both at the local and regional level, could represent useful baseline information for the temporal monitoring of S. canicula populations, which constitute a valuable tool to assess the effects of present or future fishing/management/conservation measures.
Previous microsatellite-based studies on S. canicula have consistently identified genetic structuring within the Mediterranean Sea but not among Atlantic sites (Gubili et al., 2014; Kousteni et al., 2015b; Ramírez-Amaro et al., 2018). In Kousteni et al. (2015b) data were exclusively limited to the Mediterranean Sea, with a denser sampling in the Eastern Mediterranean Sea. In Gubili et al. (2014) the samples were more abundant in the Atlantic Ocean, while Ramírez-Amaro et al. (2018) concentrated the sampling effort in the Alboran area, the Balearic Islands and northern Mediterranean coasts of Spain.
Recently, using genome wide nuclear SNPs, Manuzzi et al. (2019) revealed fine-scale genetic differentiation across the northeastern Atlantic, between the British Isles and southern Iberia.
The present study deals with the analysis of genetic diversity, population structure and connectivity of small-spotted catsharks within the Mediterranean Sea, and between the Mediterranean Sea and the Atlantic Ocean. The main aim of the study is to complement and compare the genetic data obtained in previous studies with a very similar set of microsatellite loci (Gubili et al., 2014; Kousteni et al., 2015b; Ramírez-Amaro et al., 2018), but implementing quite a different sampling scheme, with a denser sampling on the Central-Western Mediterranean Sea and a focus around the Sardinia Island. A tested panel of nuclear microsatellite markers has been used to evaluate the dispersal capabilities and the occurrence of potential physical barriers to gene flow and hence to improve the knowledge of S. canicula populations for appropriate management and protection of the species. The outcomes are discussed under an overview of the population structure of the species. The new genetic data represent the main strength of the study, as they guarantee a reference point for future monitoring.
2 Material and methods
2.1 Sampling
A total of 229 S. canicula specimens were collected between 2008 and 2012 during scientific bottom trawling campaigns (e.g., MEDITS; Spedicato et al., 2020) or by commercial fishermen, from 11 sites located in the northeastern Atlantic Ocean (Nor) and throughout the Mediterranean Sea (Figure 1 and Tables 1, S1).
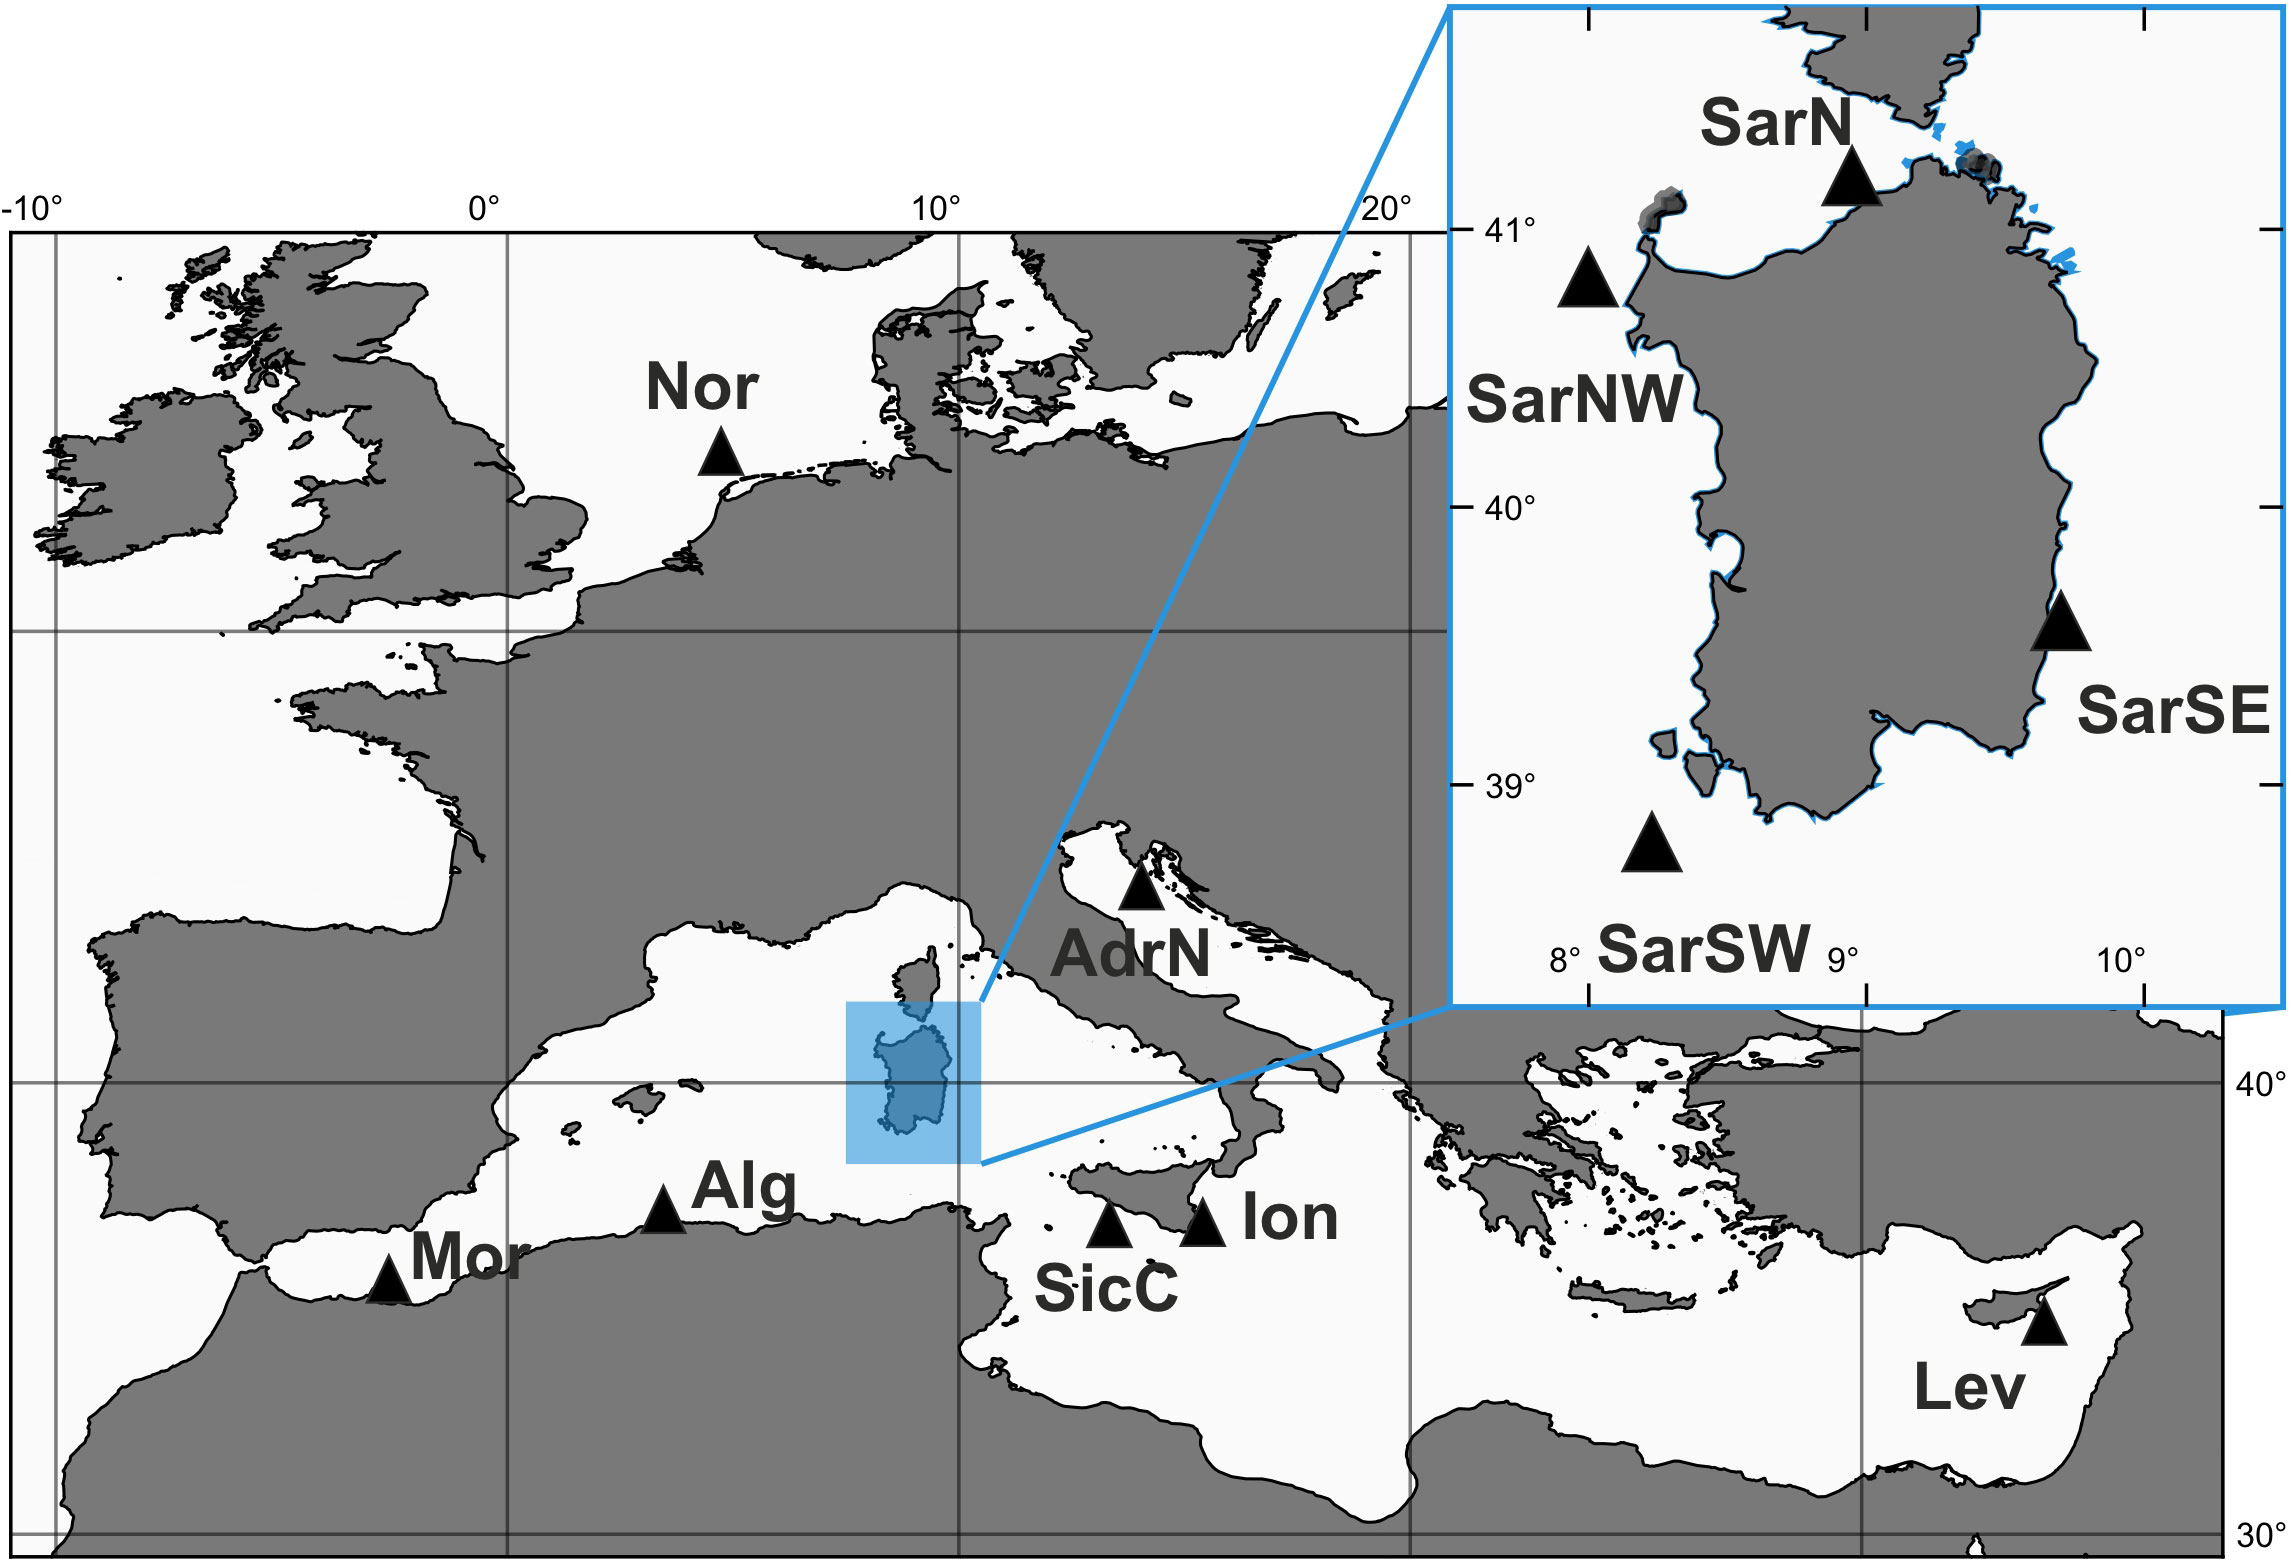
Figure 1 Sampling sites of Scyliorhinus canicula samples. SarSE, Sardinia South East; SarNE, Sardinia North East; SarNW, Sardinia North West; SarSW, Sardinia South West; AdrN, North Adriatic (Fano); Mor, Moroccan Coasts; Alg, Algerian Coasts; SicC, Sicilian Channel; Ion, Ionian Sea; Lev, Levantine Sea (Cyprus); Nor, North Sea.
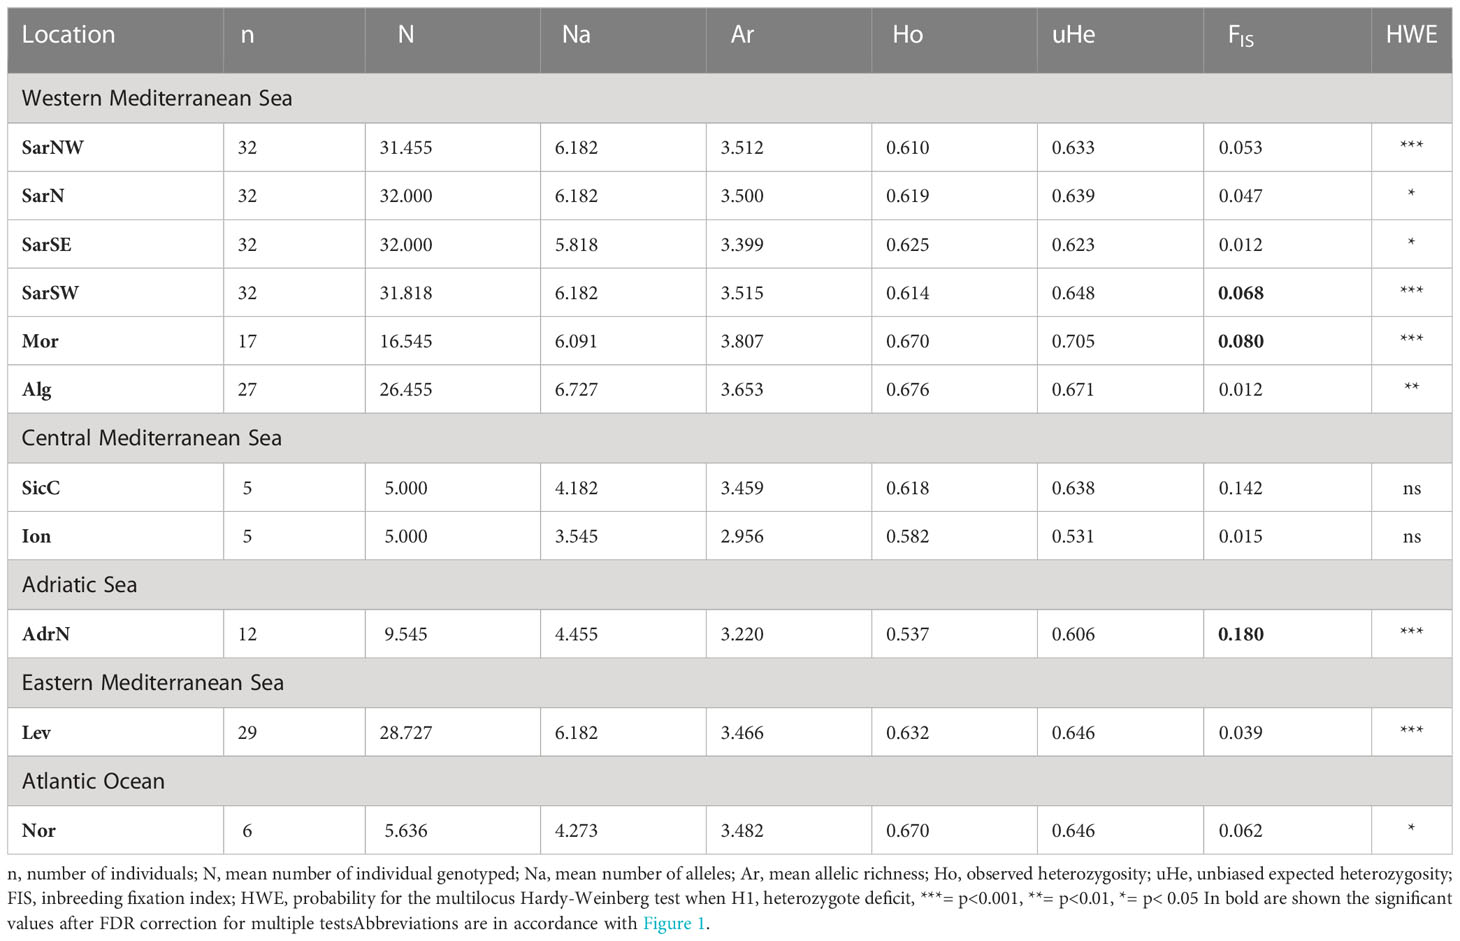
Table 1 Descriptive statistics of Scyliorhinus canicula population samples.
Laboratory procedures for tissue sampling and storage are described in the Supplementary Information (SI).
2.2 DNA extraction, loci amplification, and microsatellite data variability
DNA extraction protocols, and PCR conditions with primer pairs are described in SI and Table S2, respectively. Individuals of S. canicula were genotyped at 12 microsatellite loci (Griffiths et al., 2011). Locus Scan7 failed to amplify in Adriatic sample (AdrN) and hence it was excluded from the final dataset. The microsatellites’ allele size was scored using GENEMARKER v.1.8 (SoftGenetics Inc.) after setting the proper panels for binning analysis. Micro-Checker v.2.2.3 was used to check the data for genotyping errors and null alleles (Van Oosterhout et al., 2004) whose frequency for each locus and population was inspected with the program FreeNA (Chapuis and Estoup, 2007), using the algorithm by Dempster et al. (1977). Mean number of alleles (Na), observed (Ho) and unbiased expected heterozygosity (UHe) were calculated using GenAlEx v.6.5 (Peakall and Smouse, 2012). Total number of alleles per sample and Allelic richness (Ar) were estimated using the R package PopGenReport v.3.0.4 (Adamack and Gruber, 2014). All loci and samples were tested for linkage disequilibrium (LD) and deviations from Hardy-Weinberg expectations (henceforth HWE, null hypothesis H1 = heterozygote deficiency) using exact tests in Genepop v.4.2 (Rousset, 2008) with default settings. The inbreeding coefficient FIS was computed over all loci for each sample and for single locus over all samples with GenoDive v. 3.04 (Meirmans, 2020).
2.3 Genetic differentiation and population structure
The software POWSIM v.4.1 (Ryman and Palm, 2006) was used to assess the statistical power to detect genetic population differences with the sets of microsatellite loci (SI).
In order to corroborate the results, the occurrence of population structuring within the studied area was investigated using multiple individual-based approaches: 1) Bayesian clustering with STRUCTURE v.2.3.4 (Pritchard et al., 2000) and BAPS v.6 (Bayesian Analysis of Population Structure) (Corander and Marttinen, 2006; Corander et al., 2006; Corander et al., 2008); 2) Discriminant Analysis of Principal Components (DAPC) using the R package Adegenet v.2.0.1 (Jombart et al., 2010) implemented in R v.4.0.5 (R Core Team, 2020); 3) K-Means clustering in GenoDive.
Genetic differentiation among population samples was investigated based on pairwise fixation indices, whose significance was calculated with 1,000 permutations using GenoDive. Pairwise FST values were also calculated using the ENA (Excluding Null Alleles) method implemented in FreeNA to account for the possible effect of null alleles. Given that FST tends to underestimate differentiation when heterozygosity is high (as in our case), we also calculated an allelic differentiation measure (Jost’s DEST; Jost, 2008) with GenoDive. The two indices, FST and DEST, are reported to quantify different but complementary aspects of population structure (Jost et al., 2018). All statistical tests with multiple pairwise comparisons were corrected, calculating the false discovery rate (FDR) according to Benjamini and Hochberg (1995) as implemented in Myriads (Carvajal-Rodríguez, 2017). A priori grouping of sampling sites were also tested with the Analysis of Molecular Variance (AMOVA) in Arlequin (Excoffier and Lischer, 2010); further details on the groups tested are provided in SI. To determine whether genetic differentiation was driven by geographical distance creating a pattern of isolation by distance (IBD), linearized pairwise FST estimates (FST/1- FST) were correlated against log-transformed geographical distances between samples (Rousset, 1997) in GENODIVE using Mantel tests (standard and stratified; Meirmans, 2020) with all the sites and the Mediterranean locations only. Given that null alleles can have important consequences on inferences, we used the pairwise FST ENA values as recommended by Sere et al. (2017). Geographical distances were estimated as the minimum linear distance between pairs of locations by sea on Google Earth.
2.4 Demography, population size and connectivity
Microsatellite data were checked for the occurrence of recent demographic changes, namely genetic bottlenecks and population growth using the software BOTTLENECK v.1.2.02 (Piry et al., 1999).
NEESTIMATOR v.2.1 (Do et al., 2014) was used to calculate effective population size (Ne) and the number of effective breeders (Neb) for each sampling site. The LD method and the molecular coancestry method of Nomura (2008) were used to evaluate Ne and Neb, respectively.
To reconstruct source-sink population dynamics and the evolutionary processes leading to the present genetic diversity distribution, relative migration rates among all populations were estimated based on allele frequency data according to the method of Sundqvist et al. (2016) using the divMigrate function implemented in the R package diveRsity (Keenan et al., 2013), using GST (Nei, 1973) as a differentiation measure based on allele fixation.
Detection of first-generation-migrants was performed using GENECLASS 2.0 (Piry et al., 2004). For each individual, the likelihood of being a resident (i.e., born in the sampling location) or a migrant from another reference population was estimated using the Bayesian method (Rannala and Mountain, 1997). Monte Carlo resampling with 10,000 simulated individuals following a simulation algorithm (Paetkau et al., 2004).
2.5 Sex-biased dispersal
Tests for sex-biased dispersal were conducted following Goudet et al. (2002). To test for possible effects of sex-biased dispersal on partitioning of genetic variation, a corrected assignment index (AIc) (Paetkau et al., 1995) was computed in GenAlEx. The difference in AIc values between males and females was tested using Wilcoxon’s rank-sum test (Wilcoxon, 1945). Pairwise FST and FIS values were calculated for both females and males to detect differences in their gene flow and inbreeding. Furthermore, relatedness (Re), the mean assignment index (mAIc) and variance of the assignment index (vAIc) were tested for significance for each sex using 10,000 permutations in FSTAT v2.9.4 (Goudet, 2003).
Details of each of the aforementioned analyses are provided in the S1.
2.6 Comparison of gene diversity among areas
Considering that in recent years S. canicula populations from different areas have been analyzed using 9 microsatellite loci used also in the present study, gene diversity estimates from previous papers (Gubili et al., 2014; Kousteni et al., 2015b; Ramírez-Amaro et al., 2018) were recalculated and compared with our data. After the elimination of areas with low sampling size or reduced representativity (Central Mediterranean and Adriatic), samplings were grouped in macro-areas and differences were tested with a nonparametric Kruskal–Wallis test, while pairwise comparisons between macro-areas were analyzed for differences between means in XLSTAT v2019.1.1 following the Dunn’s procedure with a Bonferroni correction.
3 Results
3.1 Genetic diversity
The final dataset was composed of 229 individuals genotyped at 11 loci. After false discovery rate correction, none of the loci was found to be in linkage disequilibrium. The statistics of the microsatellite data for both population samples and loci are described in Tables 1, S3. The microsatellite loci showed a moderate polymorphism varying from six alleles at locus Scan5 to 14 alleles at Scan17. The number of alleles per sample varied from 39 in the Ionian (Ion) to 74 in Algeria (Alg). Allelic richness ranged from 2.956 in the Ionian (Ion) to 3.807 in Morocco (Mor). The level of observed heterozygosity was slightly lower than the unbiased expected heterozygosity (uHe) in most populations. Significant deviations from probability for the multilocus Hardy-Weinberg test occurred at nine of the 11 loci and in all populations except for SicC and Ion sampling locations (Table 1). However, many of the population-by-locus combinations tests showed no deviation of Hardy-Weinberg equilibrium. The inbreeding coefficient FIS ranged from 0.012 to 0.180; it was significantly higher than zero only in four sites (SarSW, Mor, SicC, AdrN). The proportion of null alleles (Fnu) ranged from 0 to 17.50%, with an average of 3.77%, and the estimation of overall FST gave comparable results (0.048 vs. 0.051 with vs. without the ENA correction, with overlapping 95% CI), consequently, as above, all the loci were considered as adequate for the following analyses.
3.2 Genetic differentiation and population structure
The simulation obtained with POWSIM highlighted the high-resolution power of the dataset. Both Chi-square and Fisher’s tests revealed genetic differentiation in most runs and were able to detect FST values of as low as 0.0075 in > 99% of the runs (t45: χ2 = 0.99, F = 1.000, Pvalue < 0.05).
Pairwise FST and DEST values were mostly statistically significant, with FSTranging from 0 to 0.133 and DESTfrom 0 to 0.297 (Table 2).
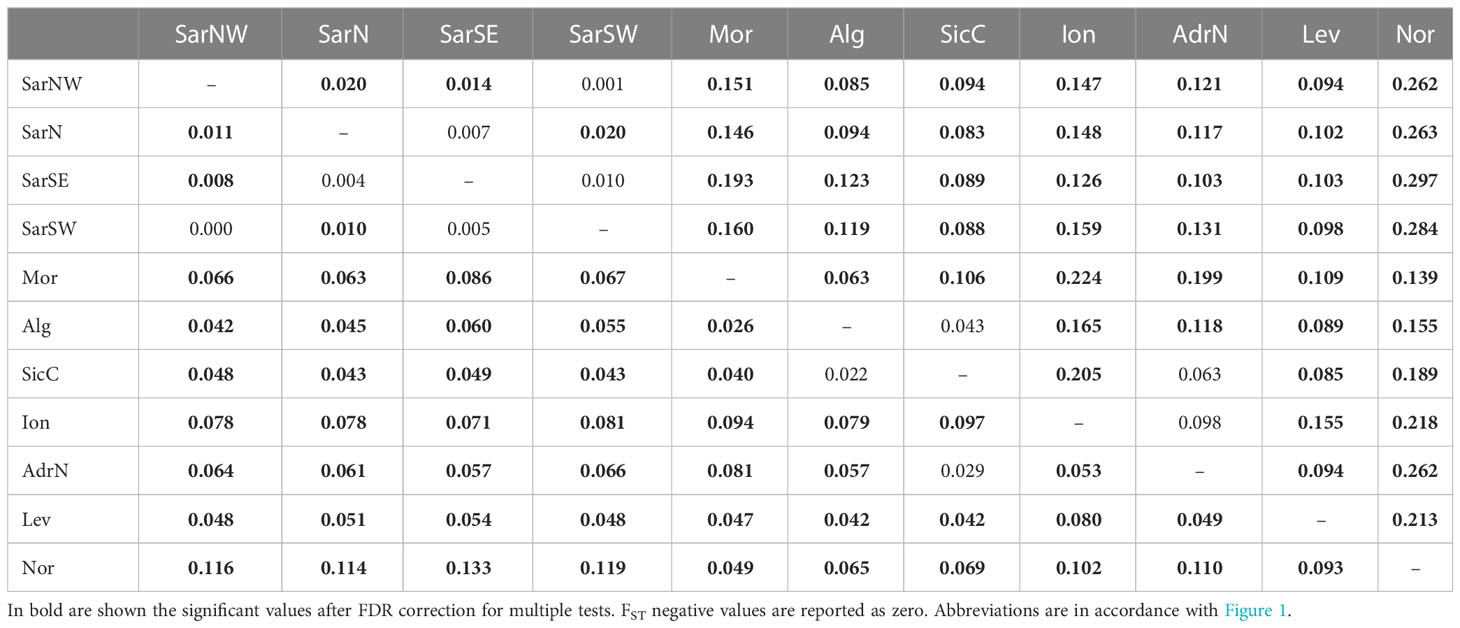
Table 2 Pairwise FST (below diagonal) and DEST (above diagonal) values among Scyliorhinus canicula population samples.
Pairwise FST and DEST values for genetic differentiation were mostly statistically significant, with FSTranging from 0 to 0.133 and DESTfrom 0 to 0.297 (Table 2).
The Bayesian clustering analysis in STRUCTURE revealed the highest support for the presence of two or three genetic clusters (Figures 2, S1A, B). Delta K statistics, and Likelihood peaked at K = 2: one cluster coinciding with Sardinian samples, and the second one containing the remaining locations. However, K = 3 was also estimated as a possible number of genetic clusters, according to MaxMedK and MasMeanK Puechmaille’s estimators (Figures S1C, D); along with the cluster including all the Sardinian samples, the other two clusters grouped the samples from the Atlantic Ocean and the North African coast (Nor+Mor+Alg), and the third one with all the remaining sites east of the Sicilian Strait (SicC, Ion, AdrN, Lev). No substantial differences were found when the combination of the alternative ancestry priors and an uncorrelated frequencies model was tested as suggested by Wang (2017) to account for the unbalanced sampling (Figure S2). Similar to STRUCTURE, BAPS results indicated the best scenario at K = 2 (log(ml) = -7635.434), followed by K = 3 (log(ml) = -7638.007), while further substructures had lower support (Figure 2). DAPC yielded overall congruent results with STRUCTURE K = 3, with Sardinian population differentiated from all other populations along the first axis, while Atlantic and North African samples (Nor+Mor+Alg) differed from all the remaining sites east of the Sicilian Strait (SicC, Ion, AdrN, Lev), separated along the second axis (Figure 3). When the DAPC analysis was restricted to the Mediterranean locations, the eastern-central Mediterranean (Lev+AdrN+Ion+Sic) appeared distinct from the southern-western (Mor+Alg) and Sardinian samples (Figure S3). The ‘K-clustering means’ results indicated two possible outcomes: the best clustering at K = 2 (SarN+SarSE+SarNW+SarSW/all other locations) according to pseudo-F, or, according to BIC, at K = 8 (Nor/SarN+SarSE+SarNW+SarSW/Mor/Alg/SicC/Ion/AdrN/Lev).
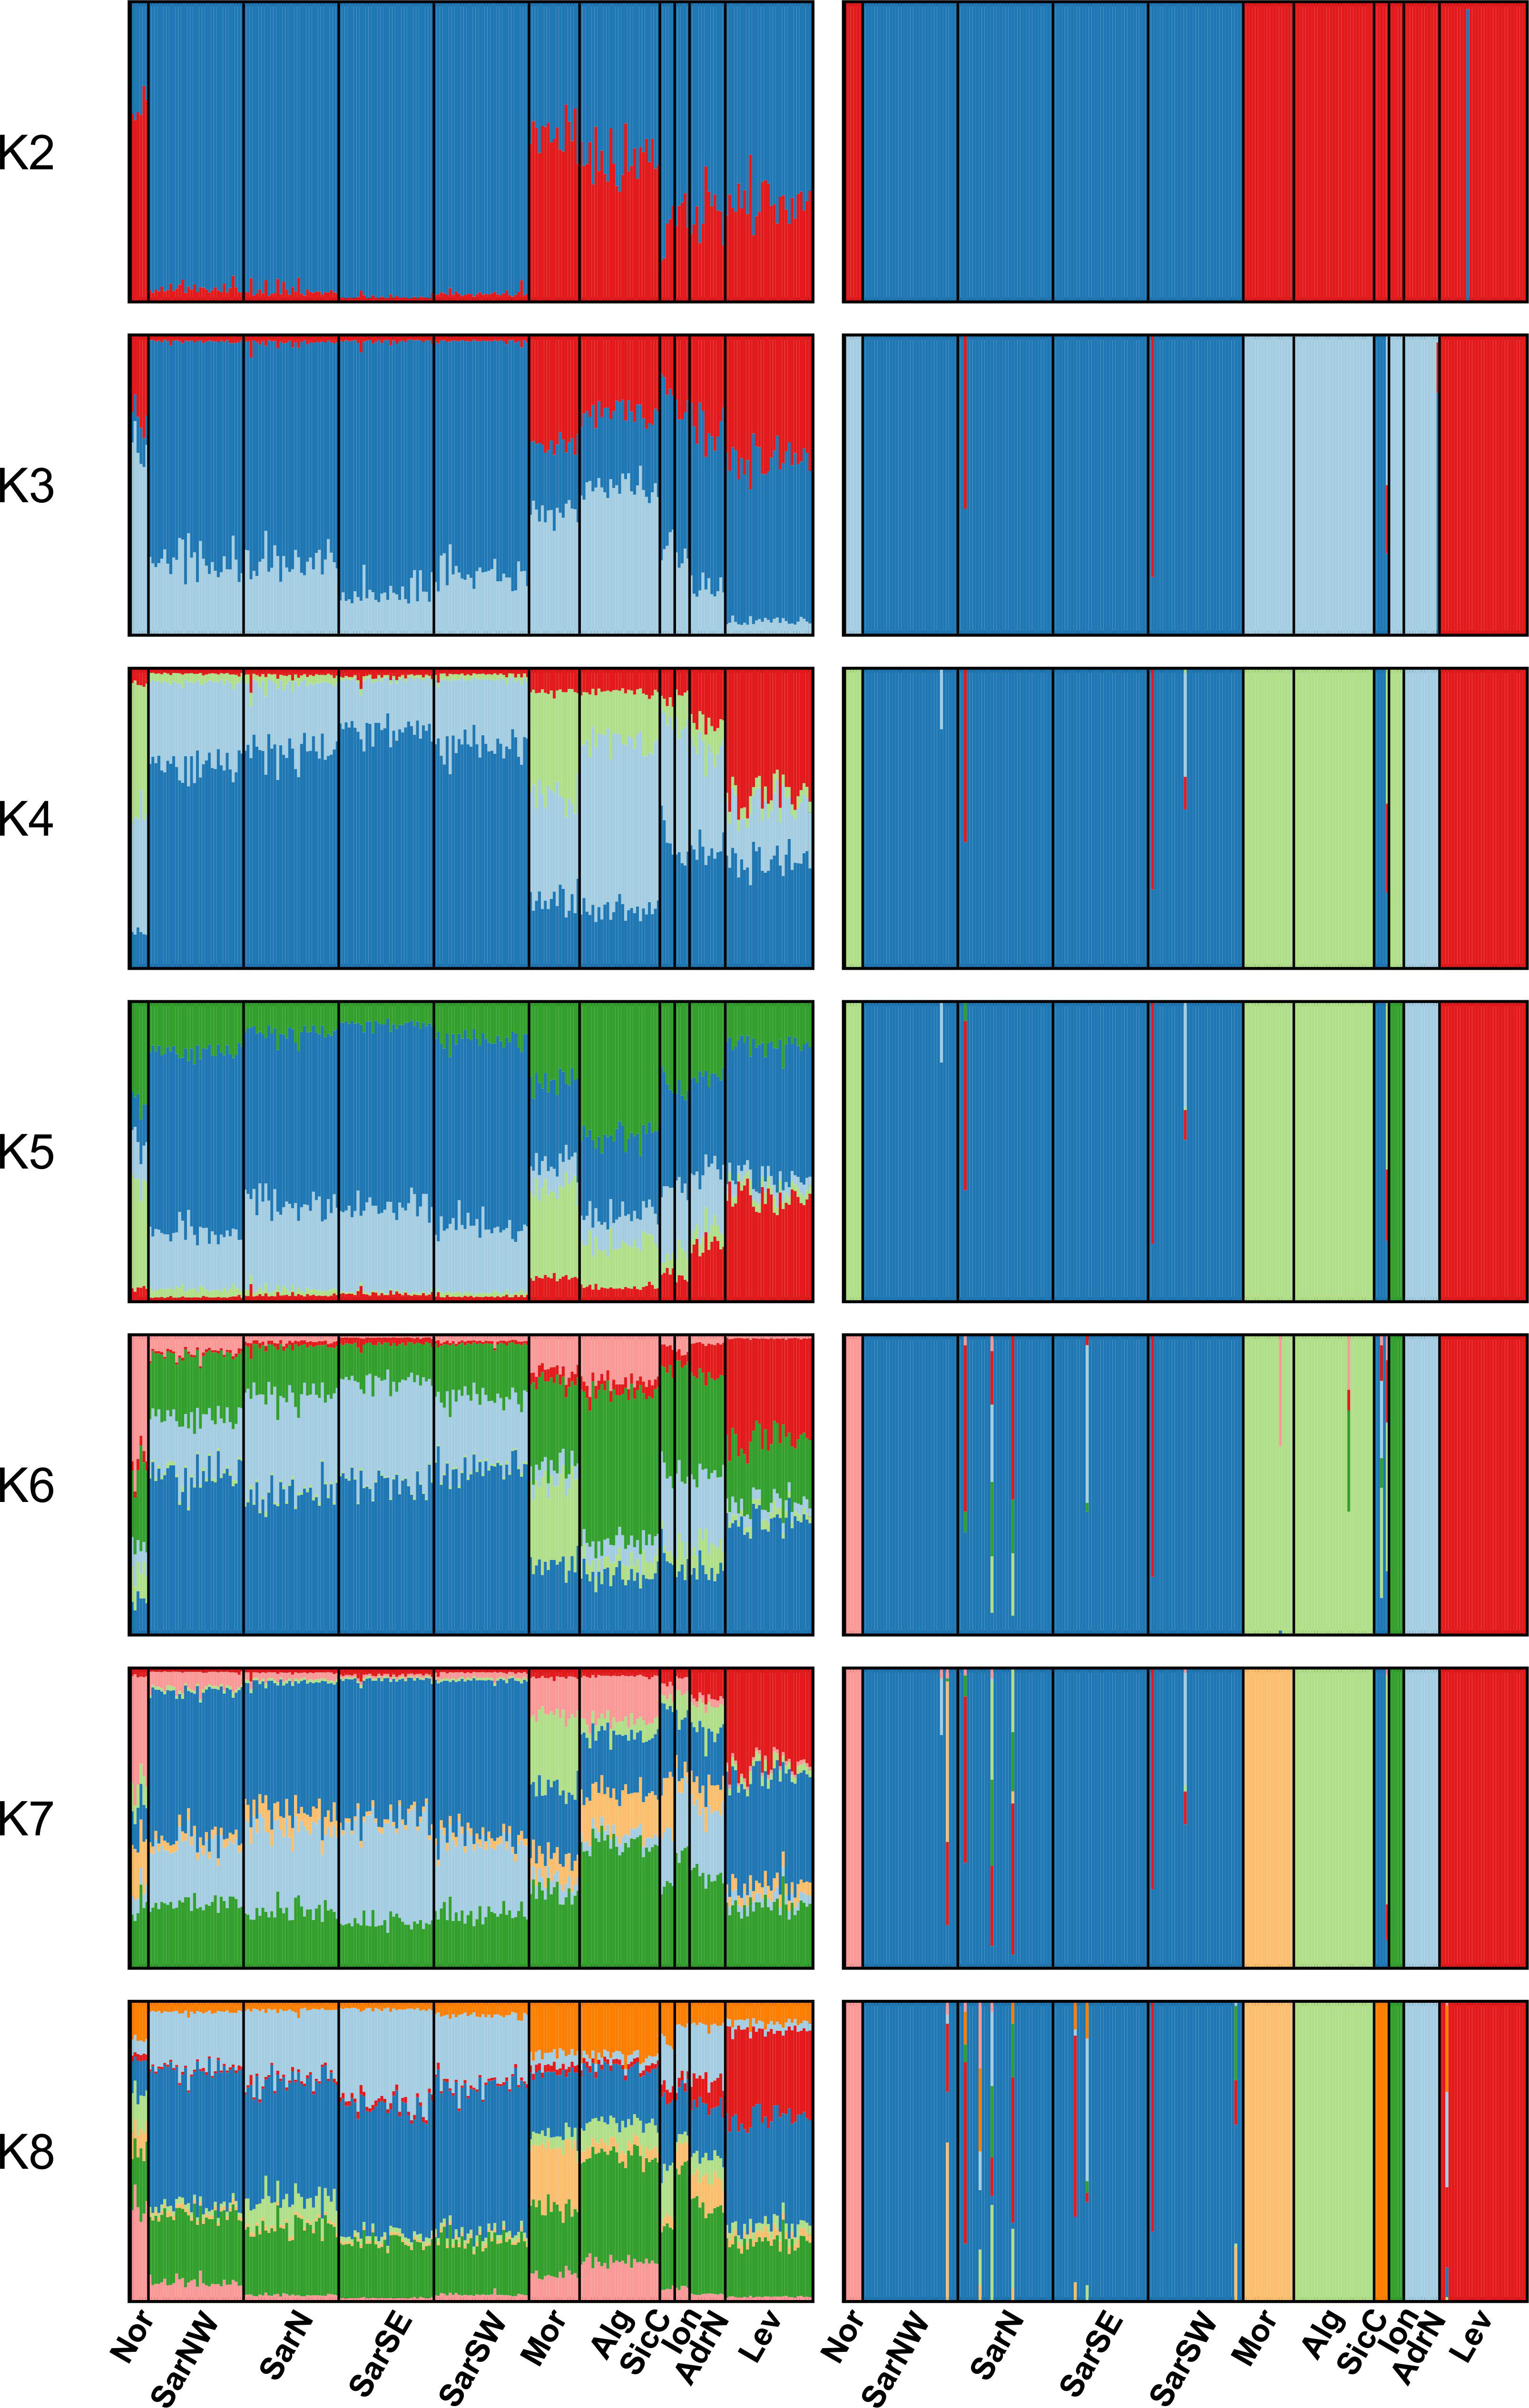
Figure 2 STRUCTURE (left) and BAPS (right) clustering barplots for Scyliorhinus canicula samples. Membership probabilities (q) for each individual from K = 2 to K = 8 are shown, see Table 1 for geographical location codes. Abbreviations are in accordance with Figure 1.
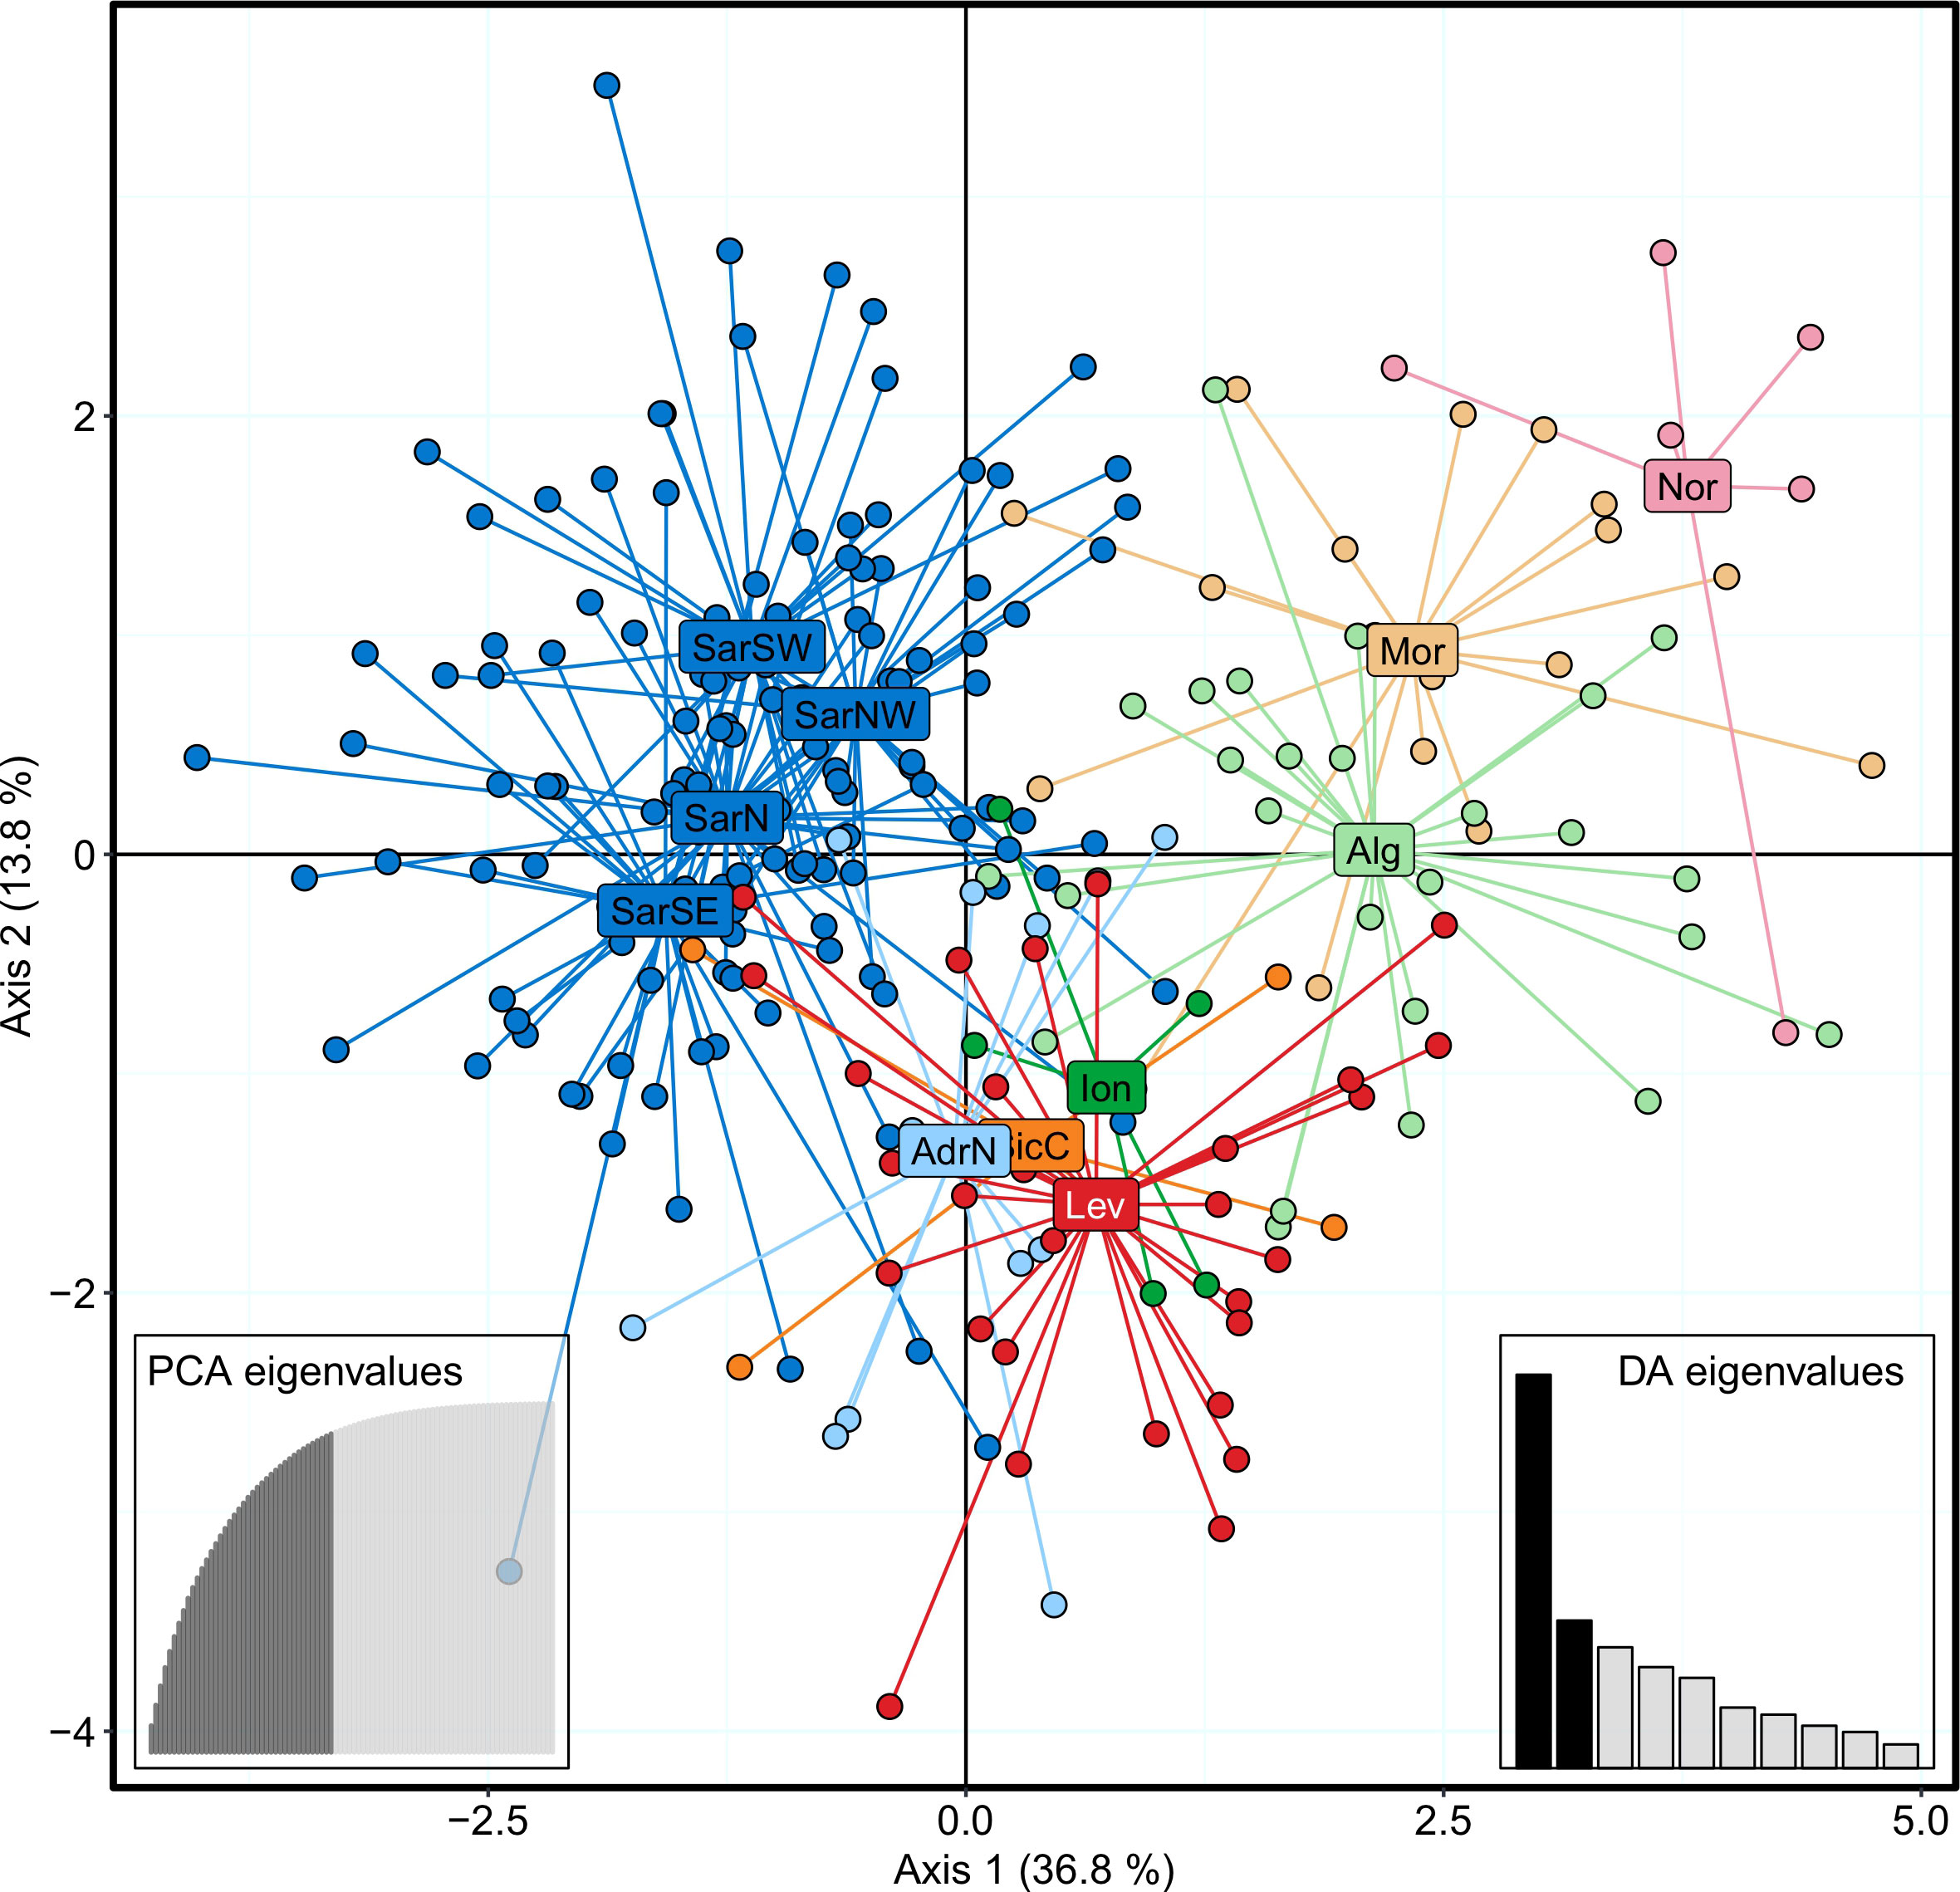
Figure 3 DAPC scatterplot for Scyliorhinus canicula samples, colored according to the BAPS plot in Figure 2. Abbreviations are in accordance with Figure 1.
Hierarchical AMOVA showed a global FST = 0.040 (p = 0.000), rejecting the hypothesis of genetic homogeneity (Table 3). However, less than 3.96% of the total variance was explained by differences among populations and 96.04% was within populations. AMOVA arranged by the two clusters identified by previous analyses (STRUCTURE, BAPS, K-clustering) confirmed the structuring (FCT = 0.031). However, when additional structures were tested, some of them indicated the occurrence of separation among clusters, especially the three groups structure (FCT = 0.035), and the eight groups, the last one characterized by a differentiation among groups (FCT = 0.0444) and the lowest differentiation within groups (FSC = 0.007) (Table 3).
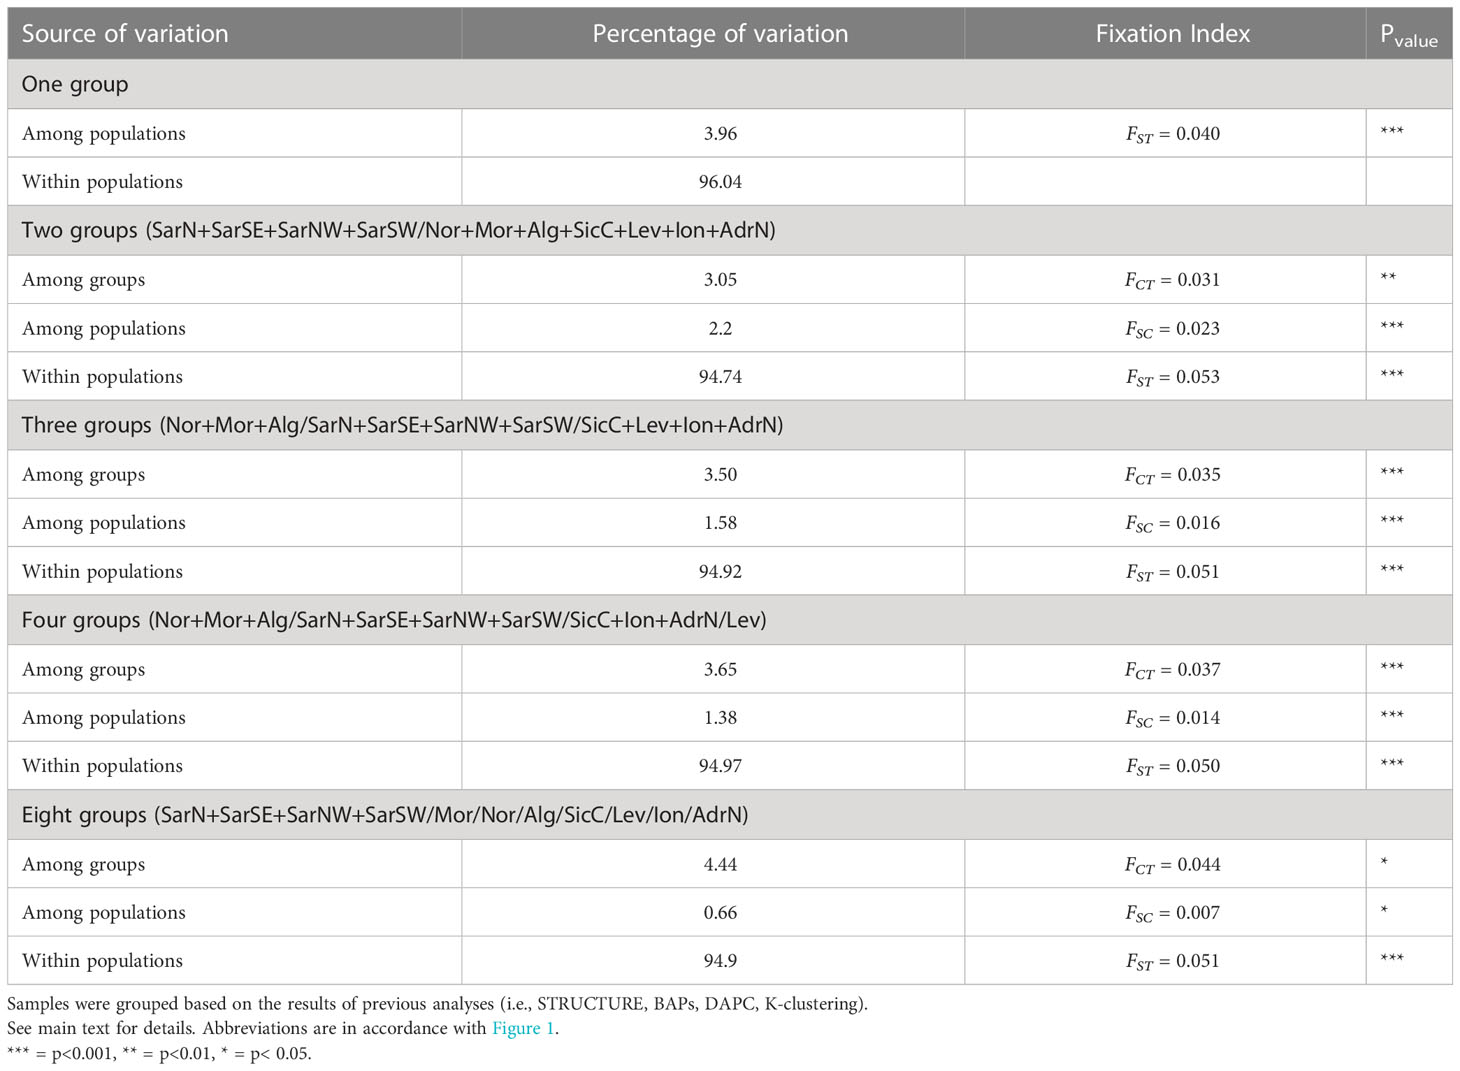
Table 3 AMOVA results.
The Mantel test, performed to find out whether the population differentiation observed with the FST pairwise analyses was due to an isolation by distance, showed that the variation observed could be attributable to isolation by distance both for the whole dataset (r2 = 0.354, p = 0.012) and the Mediterranean sites only (r2 = 0.218, p = 0.036). However, due to the limitations of the Mantel test (Meirmans, 2012; Meirmans, 2015), we also performed stratified Mantel tests within each of the identified clusters (see above), finding no significant isolation by distance in all cases.
3.3 Demography, population size and connectivity
Bottleneck tests failed to show statistical evidence that S. canicula populations from different origins had undergone a recent reduction in population size, except for Nor, even when locations were grouped in clusters as identified in previous analyses (Table S4).
High disparity of contemporaneous effective population size (Ne) in respect to location was recorded, with the lowest values in Nor (Table 4). The lowest estimate for the number of effective breeders within a cohort was recorded in AdrN and Alg (Table 4).
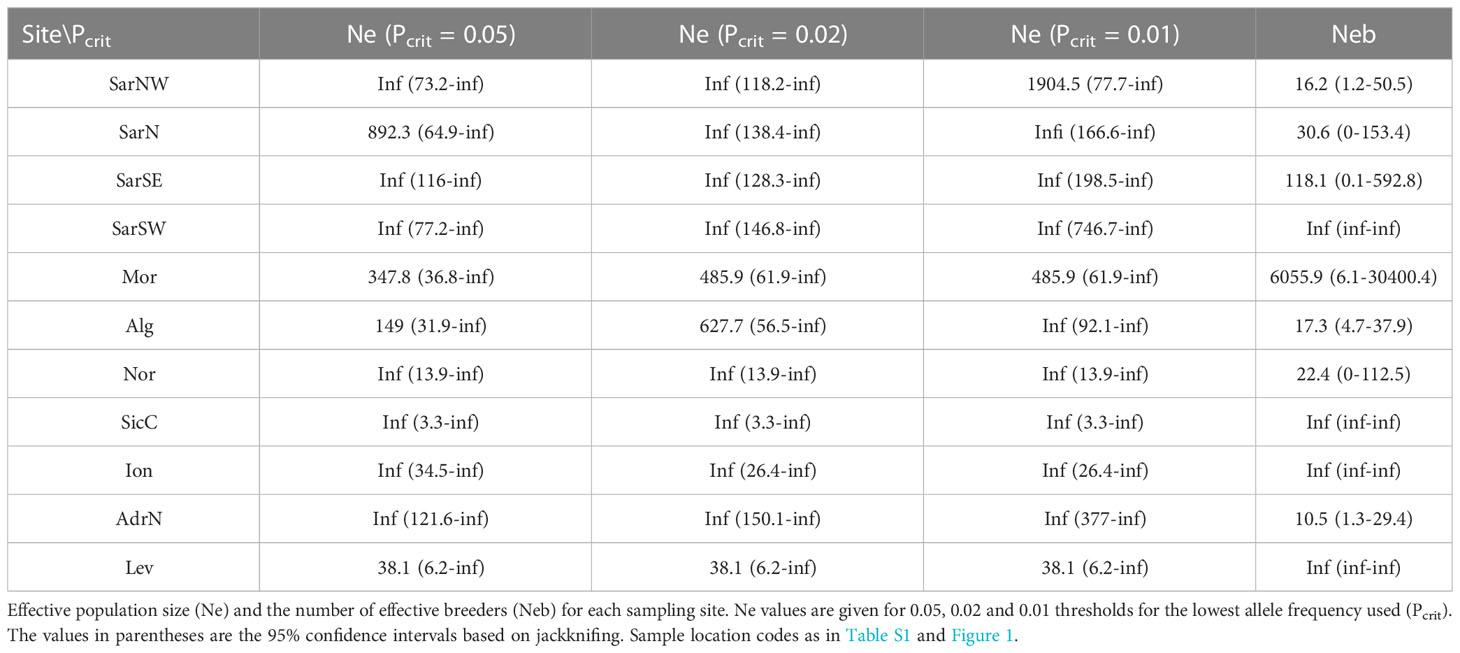
Table 4 NEESTIMATOR results for Scyliorhinus canicula populations.
Directional relative migration networks, based on the proportion of genetic diversity that resides among populations (GST) of S. canicula populations constructed with divMigrate, show that gene flow exists among the studied localities at different levels (Figure 4A). Migration networks show that the predominance of gene flow was in general symmetrical, since directional migration was found statistically significant in a limited number of cases (Figure 4B). When applying arbitrary filter thresholds to retain the most informative connectivity values, the highest gene flow was detected among the neighboring localities in the Western Mediterranean basin (i.e., among Sardinian sites, and Alg/Mor), whereas migration to the most distant localities seems to be limited or very scarce (Figures 4C, D).
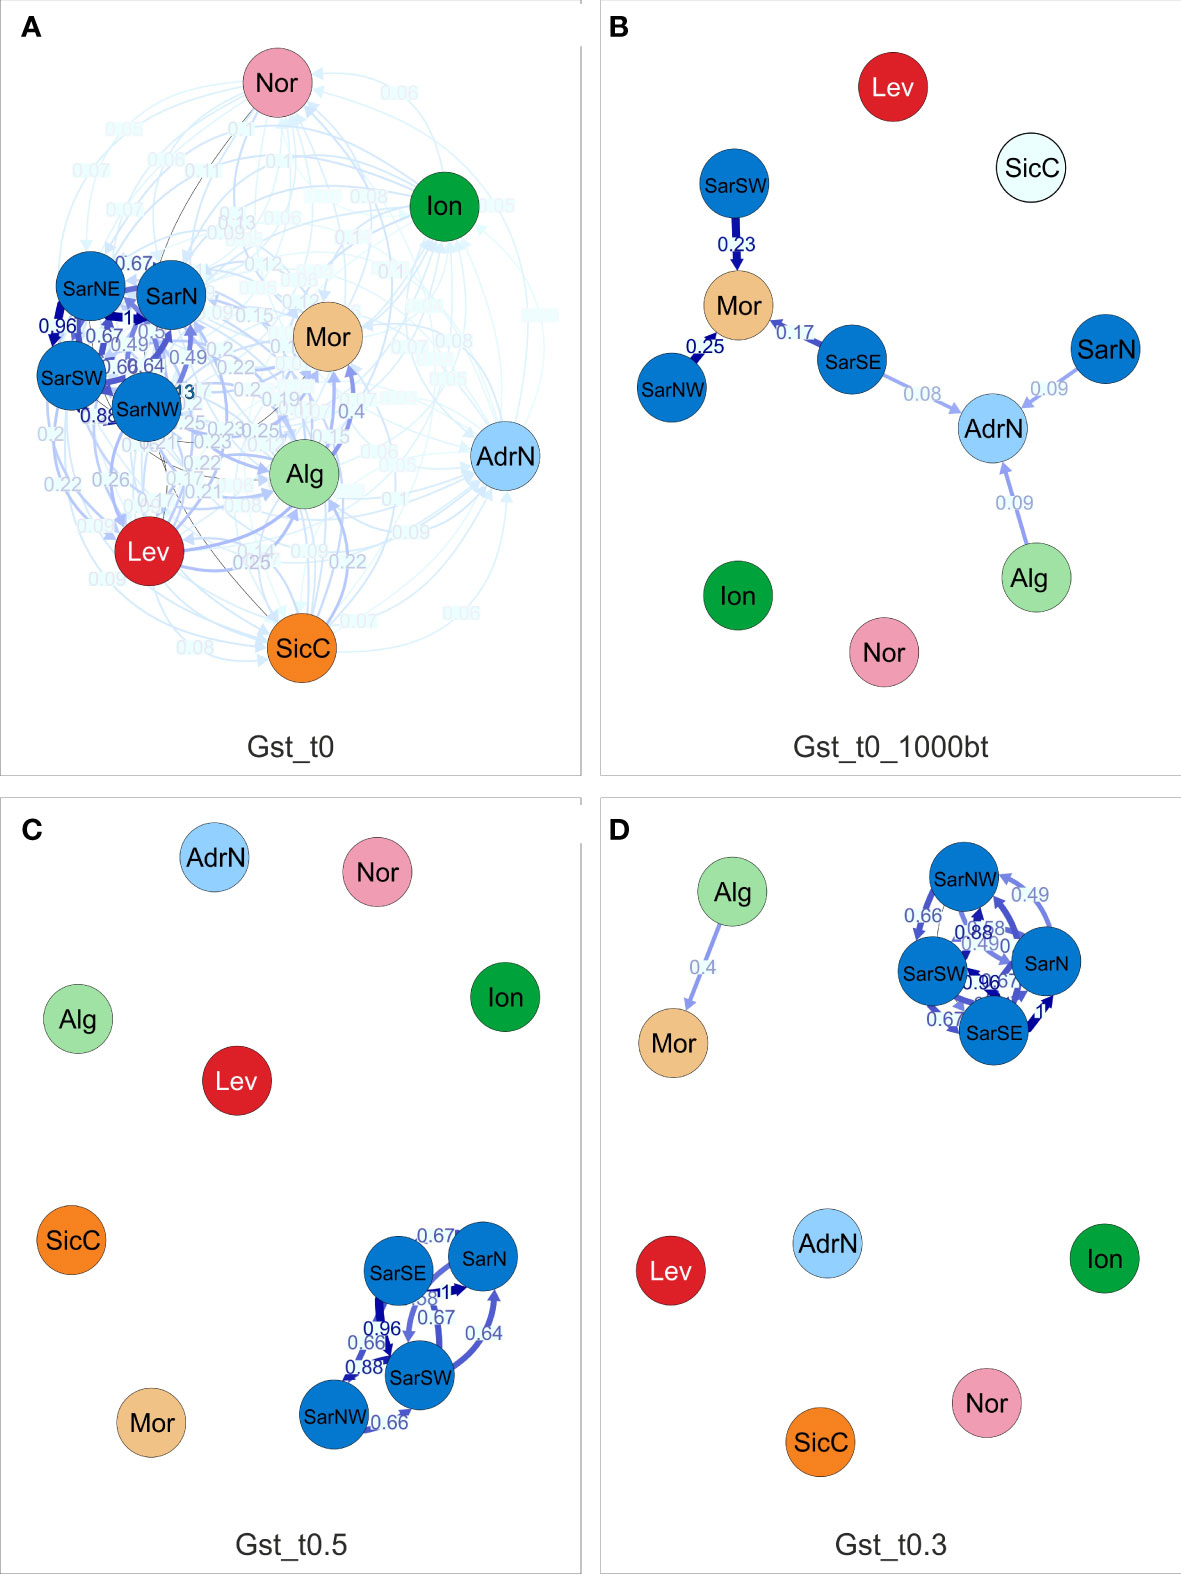
Figure 4 Directional relative migration network for Scyliorhinus canicula populations based on the Gst distance calculated with DivMigrate. (A) illustrates the calculated migration values, (B) includes only the values found to be asymmetric, that is they are statistically higher in the shown direction after 10,000 bootstrap replicates. The filter threshold for the asymmetric values was set to 0.5 in (C) and 0.3 in (D). Abbreviations are in accordance with Figure 1.
Results from the first-generation-migrants detection analysis (Table 5) showed that about 80.70% (60.00-96.30%) of the individuals were residents (i.e., born in the sampling locations). Individuals detected as migrants were not necessarily from neighboring locations. The highest percentage of migrants (40%) were found in SicC and Ion, while the lowest values were recorded in SarNW and AdrN. However, the very small sample size of some location (i.e., SicC, Ion, Nor) call for a cautious interpretation of results.
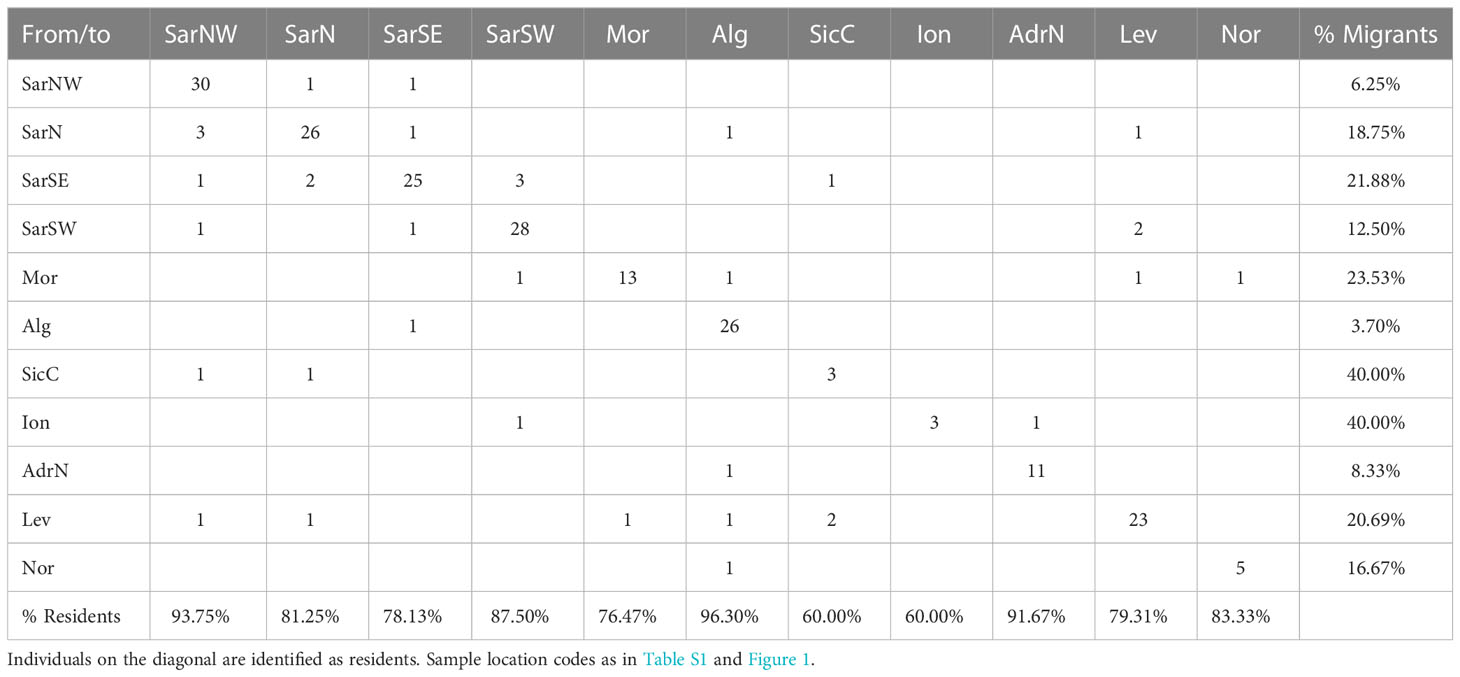
Table 5 First generation migrants as detected by Geneclass.
3.4 Sex-biased dispersal
Analyses of sex-biased dispersal were conducted on a reduced dataset consisting only of individuals for which sex data and genotypes without missing data were available: S. canicula (86 females and 96 males, most of them from Sardinia, 61 females and 59 males). In the current study, patterns of molecular variation across sexes trended toward signals of female-biased dispersal in S. canicula. Indeed, the inbreeding coefficient, the fixation index, the relatedness, and the mean assignment indices indicate signals of female-biased dispersal, but in all cases the results are not statistically supported (Table 6).
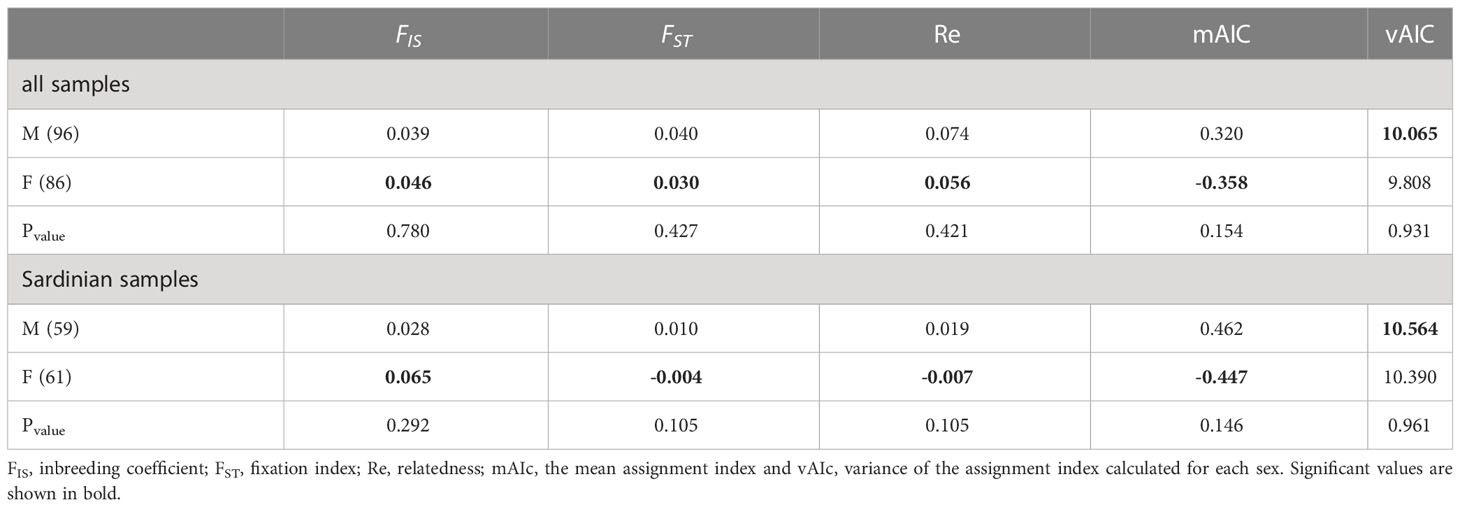
Table 6 Results of the sex-bias dispersal test.
3.5 Comparison of gene diversity among areas
The highest values of gene diversity were found in the Atlantic and Western Mediterranean (North African coasts) and the lowest in Alboran, Balearic basin, and Sardinia (Table S5). Differences in gene diversity between the macro-areas: (Atlantic = ATL; ANA = Alboran+NAfrica; BSA = Balearic + Sardinia; EMED = East Mediterranean) were statistically significant (Kruskal-Wallis P = 0.001; Table S6). In particular, the Atlantic and the most western Mediterranean samples (North African+Alboran) were found to be significantly different from all the other groups (Table S7).
4 Discussions
In this study, the population genetic structure of the small-spotted catshark was assessed at different spatial scales (within the Mediterranean Sea, and between the Mediterranean and the Atlantic Ocean, respectively) using polymorphic nuclear microsatellite loci. The new data acquired in this study complement the information obtained in previous studies (Gubili et al., 2014; Kousteni et al., 2015b; Ramírez-Amaro et al., 2018) with a very similar set of loci but a different sampling coverage, especially focused on the Western Mediterranean basin, around the Sardinia Island. Primarily, we used these data to test the hypothesis of genetic heterogeneity among populations. In fact, the life history traits (slow growth rate, late maturity, low fecundity, and no pelagic larval phase) suggest limited dispersal capabilities of the species, and the complex geomorphology of the Mediterranean Sea indicates the occurrence of potential physical barriers to gene flow.
Results confirmed the occurrence of significant genetic differentiation in the investigated areas.
A weak to moderate but significant population differentiation was detected in S. canicula. Most of the pairwise FST values were statistically significant except for few comparisons involving the Sardinian and Sicilian Channel samples (SicC-Alg and SicC-AdrN). However, the results for the Sicilian Channel, as well as Ionian Sea, and North Sea samples should be interpreted cautiously, due to their low sample size (<10 individuals).
The number of genetic clusters detected (from two to eight clusters) depended on analytical approaches. Individual-based analyses (STRUCTURE and BAPS) revealed the highest support for two clusters corresponding to the Sardinian samples in relation to all the remaining locations. Discriminant Analysis of Principal Components indicated that a subdivision in three clusters was also possible (Sardinian populations, as well as Atlantic and North African samples differentiated from other populations east of the Sicilian channel). In the same way, AMOVA rejected the hypothesis of genetic homogeneity and confirmed the occurrence of structuring at K = 2, K = 3, and K = 8 (each location different from others, apart from Sardinian populations grouped together).
Genetic differentiation of the Sardinian population has already been reported, unfortunately, no information on the precise origin of Sardinian small-spotted catshark was available in Gubili et al. (2014), so a direct comparison with our study is difficult. Genetic distinctiveness of Sardinian small-spotted catsharks has been reported in both close species (i.e., longnosed skate Dipturus oxyrinchus (Linnaeus, 1758) Melis et al., 2020), and in very distant taxa (i.e., mollusks Gopel et al., 2022; and corals Cannas et al., 2015; Cannas et al., 2016). Our data clearly indicate that S. canicula from all over Sardinia, both from the east and west side located in different basins, are plausibly connected by movements of adults in the coastal waters of the island, while the deepest waters, separating Sardinia from the Balearic archipelago and the North African coasts, cannot be easily crossed, potentially acting as a barrier to dispersal. Indeed, the genetic distinctiveness between Sardinian samples and Algerian ones could be ascribed to the role of the Channel of Sardinia-Tunisia, a stretch of deep (∼1900 m) and wide sea (∼70 km at 500 m depth) (Bouzinac et al., 1999; Testor and Gascard, 2005), that is the passage between the Algerian basin, on the west side, and the Tyrrhenian basin and the Sicily Channel on the east side (Bouzinac et al., 1999). Similarly, significant divergence between the sample collections from the Balearic Islands and the Algerian Basin was ascribed by Kousteni et al. (2015b) to the deep waters of the Balearic Abyssal Plain, a strong natural barrier to dispersal. Indeed, S. canicula is an obligate bottom-dweller, inhabiting the continental shelves; it is known for its non oceanodromous behaviour, avoiding open seas or abyssal plains (Kousteni et al., 2015a).
Hirschfeld et al. (2021) performed a global overview of population genetic studies to investigate how marine barriers and dispersal ecology shape genetic connectivity in Elasmobranchs. They found that the three most common barriers are related to ocean bathymetry, with the maximum depth of occurrence, maximum body size and habitat of each species recognized as predictors of genetic connectivity, along with environmental tolerance and reproductive behavior (Hirschfeld et al., 2021). In particular, depth was described as the most common barrier generating genetic structure at intermediate down to surprisingly small geographical scales in the Mediterranean Sea were the depths of sub-basins (i.e., Algerian, Balearic, Sicilian Strait; Hirschfeld et al., 2021) form barriers at distances of less than 500 km in benthopelagic sharks and skates (maximum depth of occurrence of 800 and 630 m, respectively) that maintain connectivity along continuous shelf habitat (Gubili et al., 2014; Kousteni et al., 2015b; Frodella et al., 2016). Similarly, in Galeus melastomus Rafinesque, 1810, biotic factors such as bathymetry and water circulations might be contributing to the differentiation of samples (Di Crescenzo et al., 2022). Furthermore, Catalano et al. (2022) reported the genetic structuring of populations of the starry ray, Raja asterias Delaroche 1809, to be related to the extended deep marine waters in the western and eastern Mediterranean, acting as dispersal barriers for the species.
Apart from bathymetry, other abiotic drivers such as water circulations and temperature were indicated as affecting the dispersion of benthic sharks (Di Crescenzo et al., 2022 and reference therein). In the present study, the known complex hydrography of the area, with the formation of gyres and fronts in the water south-west of Sardinia and between the Baleares and Sardinia (Bouzinac et al., 1999; Millot and Taupier-Letage, 2005; Testor and Gascard, 2005) could represent additional obstacles to dispersal, even if the role of fronts as factors affecting connectivity was found not strongly relevant for benthic-vagile species such as the species under study as it was for pelagic species (Pascual et al., 2017).
The Sardinian area is peculiar also for its substantial demographic stability in the recent past and relatively high Ne values, where the recorded variance in Ne estimates across a range of Pcrit values suggests a history of gene flow and/or the presence of first-generation dispersers (Waples and England, 2011). Our bottleneck tests failed to show statistical evidence that S. canicula populations from different origins had undergone a recent reduction in population size. These results are in line with a previous study in which sample collections from Sardinia and Crete showed demographic stability (Gubili et al., 2014), but in contrast with the findings of other studies in different areas as highlighted by Ramírez-Amaro et al. (2018) who observed signals of past population bottleneck events in both the close Alboran and Balearic basins through analyses based on microsatellite data. This population event could have been caused by climate change during the Pleistocene glacial/interglacial periods, when much of the outer continental shelf in the area was exposed because of the sea-level drop, severely restricting the habitat available to S. canicula and causing a decrease in their populations (Ramírez-Amaro et al., 2018). Similarly, a weak decline has been described in the Aegean Sea related to the restricted habitat availability during the Pleistocene (Kousteni et al., 2015b). On the other hand, mitochondrial data indicated S. canicula experienced a slow and constant increase in population size over the last 350,000 years all over its distributional range (Ferrari et al., 2018), as well as a slight increase of the population size in the Ionian Sea (Kousteni et al., 2015b). However, the reliability of genetic bottleneck tests for detecting recent population declines has been questioned in long lived species such as S. canicula (Lippé et al., 2006; Peery et al., 2012; Bradke et al., 2021), and hence these results are to be interpreted cautiously.
The dispersal of species could be influenced by sea bottom topography and current patterns, morphological traits, and even by their reproductive behaviour. S. canicula is oviparous, producing egg cases anchored to macroalgae or various objects in the substrate, with behavioural strategies characterized by site fidelity and philopatry, as documented by biological, tagging, and several studies (Gubili et al., 2014; Kousteni et al., 2015b and references therein). According to Goudet et al. (2002) in general members of the most dispersing sex should display the following combination: a higher FIS and vAIC values, lower FST, relatedness and mAIc values than the resident sex. Genetic data has provided evidence of male-biased dispersal and female philopatry in S. canicula populations (Gubili et al., 2014), but regrettably the sample from Sardinia was removed from their analyses as no information on sex was available. In the current study, patterns of molecular variation across sexes trended toward signals of female-biased dispersal in S. canicula, both in Sardinia and all over the Mediterranean, however, these were not statistically supported. Therefore, we should hypothesize that, among our samples, patterns of gene flow were symmetric across females and males, as estimated in about 48% of the elasmobranch species investigated so far (Phillips et al., 2021). To date, possible female biased dispersal (FBD) has been documented only in a single Carcharhiniformes species but only in a single population of its entire geographical range: the Galapagos Islands population of Carcharhinus galapagensis (Snodgrass and Heller, 1905) represents an uncommon case of documented female biased dispersal in shark that appears a rare condition in elasmobranchs (Phillips et al., 2021).
Alternatively, the remarkable genetic diversity could be explained by the fact that the Sardinian populations correspond to or are close to some putative glacial refugia for the species in the past (at the Last Glacial Maximum), as already proposed for red corals (Cannas et al., 2016), with an opportunity for divergence due to local adaptation. Similarly, in the NE Atlantic Ocean, the three genetic clusters have been proposed to derive from three putative ancestral populations of S. canicula (Manuzzi et al., 2019). As a matter of fact, in species with limited dispersal capability, such as the small-spotted catshark, due to the limited ability of sustained swimming related to the tail morphology (Scacco et al., 2010), gene flow may be slow in breaking down the genetic differences accumulated during previous periods (Manuzzi et al., 2019).
It is largely demonstrated that geographic distance between sampling locations may be not sufficient to explain the presence or absence of connectivity in marine species. Nevertheless, in the present study, a significant pattern of isolation by distance (IBD) was identified, contrary to previous studies where no pattern of isolation by distance was detected (Barbieri et al., 2014) or it was found significant only when Atlantic and Mediterranean S. canicula were analysed together but not within the Atlantic or within the Mediterranean separately (Gubili et al., 2014). Although we detected a pattern of isolation by distance with standard Mantel tests only (when all locations were analyzed together), stratified Mantel tests (within each of the identified clusters) were not significant and suggested that other factors, such as oceanographic barriers impeding the gene flow among certain areas, could be playing a more prominent role than isolation by distance.
Overall, our results are in line with the previous genetic studies carried out on S. canicula, based both on mitochondrial and microsatellite markers, used separated or combined (Barbieri et al., 2014; Gubili et al., 2014; Kousteni et al., 2015b). In our study, despite the small sample size, the Atlantic sample was found statistically different from all the Mediterranean samples in all pairwise comparisons. Several authors concordantly indicated the distinction between the Atlantic and Mediterranean S. canicula (Barbieri et al., 2014; Gubili et al., 2014; Kousteni et al., 2015b). Intraspecific variation between the Atlantic and Mediterranean has also been described for biological features of populations such as adult size, mean length for the egg deposition, first maturity age, and sexual dimorphism (Gubili et al., 2014 and references therein; Ebert et al., 2021), suggesting they could represent different subspecies, especially for geographically distant subpopulation as West Africa (Gubili et al., 2014 and references therein). Additional differences such as teeth morphology, and color pattern, were listed to suggest the existence of a second species in the Mediterranean Sea distinct from S. canicula, named Scyliorhinus duhameli (Garman, 1913), distributed in the Adriatic and Mediterranean seas, along the continental shelves of Croatia, Greece, Tunisia, and Algeria (Soares and Carvalho, 2019).
However, DAPC and AMOVA analyses grouped the North Sea (Nor) sample with those from the North African coasts (Morocco and Algeria); similarly, the results from the first-generation-migrants analysis suggest the possible gene flow brought by individuals entering from the Atlantic Ocean and connecting locations along the African coasts, even if the very small sample sizes call for a cautious interpretation of these results. Considering the data from this and previous studies (Gubili et al., 2014; Kousteni et al., 2015b; Ramírez-Amaro et al., 2018), the Atlantic and North African samples are similar also in respect to the gene diversity, being characterized by higher values than other Mediterranean areas (Balearic, Sardinia, East Mediterranean).
Contrary to the findings of previous studies both on bony (e.g., Lo Brutto and Arculeo, 2004; Šegvić-Bubić et al., 2016) and cartilaginous fishes (e.g., Catarino et al., 2015; Gubili et al., 2016) that report a clear division between Atlantic and Mediterranean populations, our results seem to confirm that the Strait of Gibraltar could not represent a complete barrier to the exchange of individuals of this species between the Atlantic Ocean and the Mediterranean Sea as suggested by Ramírez-Amaro et al. (2018). According to Ramírez-Amaro et al. (2018), the Alboran Sea, the westernmost portion of the Mediterranean located east of the Strait of Gibraltar, could represent a transitional zone between the Atlantic and the Mediterranean S. canicula populations, being genetically different from the adjacent Mediterranean (Spanish coasts and Balearic Islands), but similar to the southern Portuguese Atlantic area (Ramírez-Amaro et al., 2018). In the past, the occurrence of at least four main groups of genetically distinct small-spotted catshark have been proposed: North Atlantic, Atlantic Transition (Portugal and Alboran), Western and Eastern Mediterranean Sea (Gubili et al., 2014; Kousteni et al., 2015b; Ramírez-Amaro et al., 2018).
Recently, in contrast with previous studies that found no evidence of genetic structure across the northeastern Atlantic using traditional molecular markers (Gubili et al., 2014), additional fine-scale genetic differentiation was detected using SNPs in the mentioned area, with marked genetic divergence described for the Celtic Sea and South Portugal collections from their closest neighbors (Manuzzi et al., 2019). Similarly in the Mediterranean Sea, our results indicate that further structuring exists. For instance, in the Western basin, the Sardinian samples (four sites, two located in the Algero-Provençal basin and two in the western Tyrrhenian Sea) were strongly differentiated from all others (both from the eastern Tyrrhenian Sea and southernmost part of the Algerian basin). Additionally, the Adriatic samples were genetically distinct from the populations both from the Eastern and Western Mediterranean. The distinctiveness of the Adriatic area has been previously described (Barbieri et al., 2014; Gubili et al., 2014), as well as the differentiation between the Balearic and Algerian basins (Kousteni et al., 2015b; Ramírez-Amaro et al., 2018), and between the islands of Mallorca and Sardinia (Gubili et al., 2014).
The role of the oceanographic discontinuities can be invoked for geographically isolating and hence genetically differentiating the Adriatic samples and the easternmost from the Levantine Sea. Indeed, the Otranto Channel has been involved in limiting gene flow between the Adriatic and adjacent seas (Pascual et al., 2017), while the Sicily Channel could represent a barrier for the genetic exchanges between the eastern and the western Mediterranean, similarly to the deep Hellenic Trench (4,000 m deep), isolating the S. canicula populations both from the Aegean and Ionian Seas from the central-western Mediterranean (Kousteni et al., 2015b). Similar patterns of genetic differentiation across the Siculo-Tunisian area were also detected in other chondrichthyan species such as Raja miraletus Linnaeus, 1758 (Ferrari et al., 2018) and Raja asterias Delaroche, 1809 (Cariani et al., 2017; Catalano et al., 2022) as well as in bony fishes (Mejri et al., 2009; Mejri et al., 2011).
Yet, although the evolutionary history of the species has more to be revealed, here we support that the genetic differentiation described for S. canicula is probably linked to bathymetry, water currents, past events, coupled with life-history traits and ecology.
4.1 Final conclusions and management implications
In this research, the sampling was designed to obtain geographical coverage at both small (around the coast of Sardinia, Western Mediterranean Sea) and larger spatial scales (at the pan-Mediterranean level, and between the Atlantic and the Mediterranean Sea). Additionally, experimental analyses were designed to primarily acquire useful information to support potential management, describing the genetic features such as variability, connectivity, sex-biased dispersal of small-spotted catshark populations.
In agreement with the results of the different analytical approaches carried out (individual clustering, multivariate and variance analyses), the hypothesis of genetic homogeneity was rejected, finding significant genetic differences between the Mediterranean and Atlantic sharks, as well as within the Mediterranean between the Western and Eastern basins.
Our results confirm that structuring exists in the Mediterranean Sea, especially evident in the Western Mediterranean where small-spotted catsharks from the Sardinian waters were strongly differentiated from all others (both from the eastern Tyrrhenian Sea and southernmost part of the Algerian basin). Special attention and close monitoring of these populations are strongly necessary and warmly suggested, also due to the fishing pressure regularly exerted on them, to fill the gaps in knowledge and acquire data useful for the effective management and conservation plan for this commercial species.
Future research actions should be directed to gathering information to investigate the occurrence of discrete groups of populations in areas not covered or underrepresented in previous studies to fill the gaps in our knowledge and acquire data useful for the effective management and conservation plan for this commercial species.
Data availability statement
The original contributions presented in the study are included in the article/Supplementary Material. Further inquiries can be directed to the corresponding authors.
Ethics statement
Ethical review and approval was not required for the animal study because the following information was supplied relating to ethical approvals (i.e., approving body and any reference numbers): samples of shark individuals analysed in the present work were obtained from commercial and scientific fisheries. The activity was conducted with the observation of the Regulation of the European Parliament and the Council for fishing in the General Fisheries Commission for the Mediterranean (GFCM) Agreement area and amending Council Regulation (EC) No. 1967/2006. This Regulation is de facto the unique authorisation needed to conduct this type of activity.
Author contributions
RM and LV: Investigation, formal analysis, data curation, visualization, writing- original draft preparation. ACar, and FT: Conceptualization, methodology, formal analysis, visualization, writing - review & editing. SDC, AF: Formal analysis, data curation, writing - review & editing. LC, ACau, SH, SLB: Writing - review & editing. CC, MCF, FH, LS: Resources (samples). RC: Conceptualization, methodology, formal analysis, visualization, resources, supervision, writing- original draft preparation, writing - review & Editing. SLB was partially supported by NBFC to UNIPA, funded by the Italian Ministry of University and Research, PNRR, Missione 4 Componente 2, “Dalla ricerca all’impresa”, Investimento 1.4, Project CN00000033. All authors contributed to the article and approved the submitted version.
Acknowledgments
We thank all contributors to this research. We are grateful to all the participants in the scientific surveys, as well as the crew of each research vessel for their sampling effort. Special thanks to Prof Corrado Piccinetti, Dr Marco Stagioni and Dr. Chiara Manfredi (Laboratorio di Biologia Marina e Pesca – Fano – UNIBO) for providing the Adriatic samples.
Conflict of interest
The authors declare that the research was conducted in the absence of any commercial or financial relationships that could be construed as a potential conflict of interest.
Publisher’s note
All claims expressed in this article are solely those of the authors and do not necessarily represent those of their affiliated organizations, or those of the publisher, the editors and the reviewers. Any product that may be evaluated in this article, or claim that may be made by its manufacturer, is not guaranteed or endorsed by the publisher.
Supplementary material
The Supplementary Material for this article can be found online at: https://www.frontiersin.org/articles/10.3389/fmars.2023.1050055/full#supplementary-material
References
Adamack A. T., Gruber B. (2014). PopGenReport: simplifying basic population genetic analyses in r. Methods Ecol. Evol. 5 (4), 384–387. doi: 10.1111/2041-210x.12158
Barbieri M., Maltagliati F., Roldan M. I., Castelli A. (2014). Molecular contribution to stock identification in the small-spotted catshark, Scyliorhinus canicula (Chondrichthyes, scyliorhinidae). Fish. Res. 154, 11–16. doi: 10.1016/j.fishres.2014.01.021
Benjamini Y., Hochberg Y. (1995). Controlling the false discovery rate: A practical and powerful approach to multiple testing. J. R. Stat. Soc. B: Stat. Methodol 57 (1), 289–300. doi: 10.1111/j.2517-6161.1995.tb02031.x
Bouzinac C., Font J., Millot C. (1999). Hydrology and currents observed in the channel of Sardinia during the PRIMO-1 experiment from November 1993 to October 1994. J. Mar. Syst. 20 (1-4), 333–355. doi: 10.1016/S0924-7963(98)00074-8
Bradke D. R., Altobelli J. T., Russell A. L., Jaeger C. P., Moore J. A. (2021). Low bottleneck detection in long-lived species despite lost genetic diversity: A case study of tuatara and Eastern massasauga rattlesnakes. J. Hered 112, 346–356. doi: 10.1093/jhered/esab025
Cannas R., Sacco F., Cau A., Coluccia E., Follesa M. C., Cau A. (2015). New insights into connectivity patterns of mesophotic red coral (Corallium rubrum) populations. Hydrobiologia 759 (1), 63–73. doi: 10.1007/s10750-015-2198-0
Cannas R., Sacco F., Cau A., Cuccu D., Follesa M. C., Cau A. (2016). Genetic monitoring of deep-water exploited banks of the precious Sardinia coral Corallium rubrum (L. 1758): useful data for a sustainable management. Aquat. Conserv.: Mar. Freshw. Ecosyst. 26 (2), 236–250. doi: 10.1002/aqc.2522
Cariani A., Messinetti S., Ferrari A., Arculeo M., Bonello J. J., Bonnici L., et al. (2017). Improving the conservation of Mediterranean chondrichthyans: The ELASMOMED DNA barcode reference library. PloS One 12 (1), e0170244. doi: 10.1371/journal.pone.0170244
Carvajal-Rodríguez A. (2017). Myriads: P-value-based multiple testing correction. Bioinformatics 34 (6), 1043–1045. doi: 10.1093/bioinformatics/btx746
Cashion M. S., Bailly N., Pauly D. (2019). Official catch data underrepresent shark and ray taxa caught in Mediterranean and black Sea fisheries. Mar. Policy 105, 1–9. doi: 10.1016/j.marpol.2019.02.041
Catalano G., Crobe V., Ferrari A., Baino R., Massi D., Titone A., et al. (2022). Strongly structured populations and reproductive habitat fragmentation increase the vulnerability of the Mediterranean starry ray Raja asterias (Elasmobranchii, rajidae). Aquat. Conserv.: Mar. Freshw. Ecosyst. 32 (1), 66–84. doi: 10.1002/aqc.3739
Catarino D., Knutsen H., Verissimo A., Olsen E. M., Jorde P. E., Menezes G., et al. (2015). The pillars of Hercules as a bathymetric barrier to gene flow promoting isolation in a global deep-sea shark (Centroscymnus coelolepis). Mol. Ecol. 24, 6061–6079. doi: 10.1111/mec.13453
Chapuis M. P., Estoup A. (2007). Microsatellite null alleles and estimation of population differentiation. Mol. Biol. Evol. 24 (3), 621–631. doi: 10.1093/molbev/msl191
Corander J., Marttinen P. (2006). Bayesian Identification of admixture events using multilocus molecular markers. Mol. Ecol. 15 (10), 2833–2843. doi: 10.1111/j.1365-294X.2006.02994.x
Corander J., Marttinen P., Mäntyniemi S. (2006). A Bayesian method for identification of stock mixtures from molecular marker data. Fish. Bull. 104 (4), 550–558.
Corander J., Marttinen P., Sirén J., Tang J. (2008). Enhanced Bayesian modelling in BAPS software for learning genetic structures of populations. BMC Bioinf. 9, 539. doi: 10.1186/1471-2105-9-539
Dempster A. P., Laird N. M., Rubin D. B. (1977). Maximum likelihood from incomplete data Via the EM algorithm. J. R. Stat. Soc. B: Stat. Methodol. 39 (1), 1–22. doi: 10.1111/j.2517-6161.1977.tb01600.x
Di Crescenzo S., Ferrari A., Barría C., Cannas R., Cariani A., Drewery J., et al. (2022). First evidence of population genetic structure of the deep-water blackmouth catshark Galeus melastomus rafinesque 1810. Front. Mar. Sci. 9. doi: 10.3389/fmars.2022.953895
Do C., Waples R. S., Peel D., Macbeth G. M., Tillett B. J., Ovenden J. R. (2014). NeEstimator v2: Re-implementation of software for the estimation of contemporary effective population size (Ne) from genetic data. Mol. Ecol. Resour. 14 (1), 209–214. doi: 10.1111/1755-0998.12157
Domingues R. R., Hilsdorf A. W. S., Gadig O. B. F. (2018). The importance of considering genetic diversity in shark and ray conservation policies. Conserv. Genet. 19 (3), 501–525. doi: 10.1007/s10592-017-1038-3
Dulvy N. K., Fowler S. L., Musick J. A., Cavanagh R. D., Kyne P. M., Harrison L. R., et al. (2014). Extinction risk and conservation of the world's sharks and rays. Elife 3, e00590. doi: 10.7554/eLife.00590
Dulvy N. K., Pacoureau N., Rigby C. L., Pollom R. A., Jabado R. W., Ebert D. A., et al. (2021). Overfishing drives over one-third of all sharks and rays toward a global extinction crisis. Curr. Biol. 21), 4773–4787.e4778. doi: 10.1016/j.cub.2021.08.062
Dulvy N. K., Simpfendorfer C. A., Davidson L. N. K., Fordham S. V., Brautigam A., Sant G., et al. (2017). Challenges and priorities in shark and ray conservation. Curr. Biol. 27, R565–R572. doi: 10.1016/j.cub.2017.04.038
Ebert D. A., Dando M. (2021). Field guide to sharks, rays, & chimaeras of Europe and the Mediterranean. (Princeton, New Jersey: WILDNATUREPRESS, Plymouth, UK and Princeton University Press).
Ebert D. A., Dando M., Fowler S. (2021). Sharks of the world: A complete guide (Princeton, New Jersey: WILDNATUREPRESS, Plymouth, UK and Princeton University Press).
Elliott S. A. M., Carpentier A., Feunteun E., Trancart T. (2020). Distribution and life history trait models indicate vulnerability of skates. Prog. Oceanogr. 181:102256. doi: 10.1016/j.pocean.2019.102256
Excoffier L., Lischer H. E. L. (2010). Arlequin suite ver 3.5: a new series of programs to perform population genetics analyses under Linux and windows. Mol. Ecol. Resour. 10 (3), 564–567. doi: 10.1111/j.1755-0998.2010.02847.x
Ferrari A., Tinti F., Bertucci Maresca V., Velona A., Cannas R., Thasitis I., et al. (2018). Natural history and molecular evolution of demersal Mediterranean sharks and skates inferred by comparative phylogeographic and demographic analyses. PeerJ 6, e5560. doi: 10.7717/peerj.5560
Finucci B., Derrick D., Neat F. C., Pacoureau N., Serena F., Vanderwright W. J. (2021). “Scyliorhinus canicula ,” in The IUCN red list of threatened species 2021, e.T161307554A124478351 (Accessed on 10 September 2022) doi: 10.2305/IUCN.UK.2021-2.RLTS.T161307554A124478351.en
Follesa M. C., Marongiu M. F., Zupa W., Bellodi A., Cau A., Cannas R., et al. (2019). Spatial variability of Chondrichthyes in the northern Mediterranean. Sci. Mar. 83, 81–100. doi: 10.3989/scimar.04998.23A
Francis R. M. (2017). Pophelper: An r package and web app to analyse and visualize population structure. Mol. Ecol. Resour 17, 27–32. doi: 10.1111/1755-0998.12509
Frodella N., Cannas R., Velona A., Carbonara P., Farrell E. D., Fiorentino F., et al. (2016). Population connectivity and phylogeography of the Mediterranean endemic skate Raja polystigma and evidence of its hybridization with the parapatric sibling R. montagui. Mar. Ecol. Prog. Ser. 554, 99–113. doi: 10.3354/meps11799
Gopel A., Oesterwind D., Barrett C., Cannas R., Caparro L. S., Carbonara P., et al. (2022). Phylogeography of the veined squid, Loligo forbesii, in European waters. Sci. Rep. 12 (1), 7817. doi: 10.1038/s41598-022-11530-z
Goudet J. (2003) FSTAT (version 2.9.4), a program (for windows 95 and above) to estimate and test population genetics parameters (Accessed September 2022).
Goudet J., Perrin N., Waser P. (2002). Tests for sex-biased dispersal using bi-parentally inherited genetic markers. Mol. Ecol. 11 (6), 1103–1114. doi: 10.1046/j.1365-294x.2002.01496.x
Griffiths A. M., Casane D., McHugh M., Wearmouth V. J., Sims D. W., Genner M. J. (2011). Characterisation of polymorphic microsatellite loci in the small-spotted catshark (Scyliorhinus canicula l.). Conserv. Genet. Resour. 3 (4), 705–709. doi: 10.1007/s12686-011-9438-z
Gubili C., Macleod K., Perry W., Hanel P., Batzakas I., Farrell E. D., et al. (2016). Connectivity in the deep: Phylogeography of the velvet belly lanternshark. Deep-Sea Res. Part I-Oceanographic Res. Papers 115, 233–239. doi: 10.1016/j.dsr.2016.07.002
Gubili C., Sims D. W., Veríssimo A., Domenici P., Ellis J., Grigoriou P., et al. (2014). A tale of two seas: Contrasting patterns of population structure in the small-spotted catshark across Europe. R. Soc Open Sci. 1 (3), 140175. doi: 10.1098/rsos.140175
Hirschfeld M., Dudgeon C., Sheaves M., Barnett A. (2021). Barriers in a sea of elasmobranchs: From fishing for populations to testing hypotheses in population genetics. Global Ecol. Biogeography 30, 2147–2163. doi: 10.1111/geb.13379
Jombart T., Devillard S., Balloux F. (2010). Discriminant analysis of principal components: A new method for the analysis of genetically structured populations. BMC Genet. 11 (1), 94. doi: 10.1186/1471-2156-11-94
Jorgensen S. J., Micheli F., White T. D., Van Houtan K. S., Alfaro-Shigueto J., Andrzejaczek S., et al. (2022). Emergent research and priorities for shark and ray conservation. Endangered Species Res. 47, 171–203. doi: 10.3354/esr01169
Jost L. (2008). GST and its relatives do not measure differentiation. Mol. Ecol. 17 (18), 4015–4026. doi: 10.1111/j.1365-294X.2008.03887.x
Jost L., Archer F., Flanagan S., Gaggiotti O., Hoban S., Latch E. (2018). Differentiation measures for conservation genetics. Evolutionary Appl. 11, 1139–1148. doi: 10.1111/eva.12590
Keenan K., McGinnity P., Cross T. F., Crozier W. W., Prodöhl P. A. (2013). diveRsity: An r package for the estimation and exploration of population genetics parameters and their associated errors. Methods Ecol. Evol. 4 (8), 782–788. doi: 10.1111/2041-210X.12067
Kousteni V., Kasapidis P., Kotoulas G., Megalofonou P. (2015a). Evidence of high genetic connectivity for the longnose spurdog Squalus blainville in the Mediterranean Sea. Mediterr. Mar. Sci. 17 (2), 371–383. doi: 10.12681/mms.1222
Kousteni V., Kasapidis P., Kotoulas G., Megalofonou P. (2015b). Strong population genetic structure and contrasting demographic histories for the small-spotted catshark (Scyliorhinus canicula) in the Mediterranean Sea. Heredity 114 (3), 333–343. doi: 10.1038/hdy.2014.107
Lippé C., Dumont P., Bernatchez L. (2006). High genetic diversity and no inbreeding in the endangered copper redhorse, Moxostoma hubbsi (Catostomidae, pisces): The positive sides of a long generation time. Mol. Ecol. 15, 1769–1780. doi: 10.1111/j.1365-294X.2006.02902.x
Lo Brutto S., Arculeo M. (2004). Congruence in genetic markers used to describe Mediterranean and Atlantic populations of European hake (Merluccius merluccius l. 1758). J. Appl. Ichthyology 20, 81–86. doi: 10.1046/j.1439-0426.2003.00514.x
Manuzzi A., Zane L., Munoz-Merida A., Griffiths A. M., Verissimo A. (2019). Population genomics and phylogeography of a benthic coastal shark (Scyliorhinus canicula) using 2b-RAD single nucleotide polymorphisms. Biol. J. Linn. Soc 126 (2), 289–303. doi: 10.1093/biolinnean/bly185
Meirmans P. G. (2012). The trouble with isolation by distance. Mol. Ecol. 21, 2839–2846. doi: 10.1111/j.1365-294X.2012.05578.x
Meirmans P. G. (2015). Seven common mistakes in population genetics and how to avoid them. Mol. Ecol. 24, 3223–3231. doi: 10.1111/mec.13243
Meirmans P. G. (2020). Genodive version 3.0: Easy-to-use software for the analysis of genetic data of diploids and polyploids. Mol. Ecol. Resour. 20 (4), 1126–1131. doi: 10.1111/1755-0998.13145
Mejri R., Arculeo M., Hassine O. K. B., Lo Brutto S. (2011). Genetic architecture of the marbled goby Pomatoschistus marmoratus (Perciformes, gobiidae) in the Mediterranean Sea. Mol. Phylogenet. Evol. 58, 395–403. doi: 10.1016/j.ympev.2010.12.001
Mejri R., Lo Brutto S., Hassine O. K., Arculeo M. (2009). A study on pomatoschistus tortonesei miller 1968 (Perciformes, gobiidae) reveals the siculo-Tunisian strait (STS) as a breakpoint to gene flow in the Mediterranean basin. Mol. Phylogenet Evol. 53, 596–601. doi: 10.1016/j.ympev.2009.04.018
Melis R., Vacca L., Bellodi A., Cau A., Porcu C., Follesa M. C., et al. (2020). Insights into population genetics, connectivity and demographic history of the longnosed skate Dipturus oxyrinchus (Linnaeus 1758) in the western Mediterranean Sea. Aquat. Conservation-Marine Freshw. Ecosyst. 30, 86–103. doi: 10.1002/aqc.3241
Millot C., Taupier-Letage I. (2005). “Circulation in the Mediterranean Sea,” In: Saliot, A. (eds) The Mediterranean Sea. Handbook of Environmental Chemistry, vol 5K. (Berlin, Heidelberg: Springer), 29–66. doi: 10.1007/b107143
Nei M. (1973). Analysis of gene diversity in subdivided populations. Proceedings of the National Academy of Sciences, Vol. 70. 3321–3323. doi: 10.1073/pnas.70.12.3321
Nomura T. (2008). Estimation of effective number of breeders from molecular coancestry of single cohort sample. Evol. Appl. 1 (3), 462–474. doi: 10.1111/j.1752-4571.2008.00015.x
Ovenden J. R., Berry O., Welch D. J., Buckworth R. C., Dichmont C. M. (2015). Ocean's eleven: A critical evaluation of the role of population, evolutionary and molecular genetics in the management of wild fisheries. Fish. 16 (1), 125–159. doi: 10.1111/faf.12052
Pacoureau N., Rigby C. L., Kyne P. M., Sherley R. B., Winker H., Carlson J. K., et al. (2021). Half a century of global decline in oceanic sharks and rays. Nature 589 (7843), 567–571. doi: 10.1038/s41586-020-03173-9
Paetkau D., Calvert W., Stirling I., Strobeck C. (1995). Microsatellite analysis of population structure in Canadian polar bears. Mol. Ecol. 4 (3), 347–354. doi: 10.1111/j.1365-294x.1995.tb00227.x
Paetkau D., Slade R., Burden M., Estoup A. (2004). Genetic assignment methods for the direct, real-time estimation of migration rate: A simulation-based exploration of accuracy and power. Mol. Ecol. 13 (1), 55–65. doi: 10.1046/j.1365-294x.2004.02008.x
Pascual M., Rives B., Schunter C., Macpherson E. (2017). Impact of life history traits on gene flow: A multispecies systematic review across oceanographic barriers in the Mediterranean Sea. PloS One 12 (5), e0176419. doi: 10.1371/journal.pone.0176419
Peakall R., Smouse P. E. (2012). GenAlEx 6.5: genetic analysis in excel. population genetic software for teaching and research–an update. Bioinformatics 28 (19), 2537–2539. doi: 10.1093/bioinformatics/bts460
Peery M. Z., Kirby R., Reid B. N., Stoelting R., Doucet-Bëer E., Robinson S., et al. (2012). Reliability of genetic bottleneck tests for detecting recent population declines. Mol. Ecol. 21, 3403–3418. doi: 10.1111/j.1365-294X.2012.05635.x
Peristeraki P., Tserpes G., Kavadas S., Kallianiotis A., Stergiou K. I. (2020). The effect of bottom trawl fishery on biomass variations of demersal chondrichthyes in the eastern Mediterranean. Fish. Res. 221:105367. doi: 10.1016/j.fishres.2019.105367
Phillips N. M., Devloo-Delva F., McCall C., Daly-Engel T. S. (2021). Reviewing the genetic evidence for sex-biased dispersal in elasmobranchs. Rev. Fish Biol. Fish. 31 (4), 821–841. doi: 10.1007/s11160-021-09673-9
Piry S., Alapetite A., Cornuet J. M., Paetkau D., Baudouin L., Estoup A. (2004). GENECLASS2: A software for genetic assignment and first-generation migrant detection. J. Hered. 95 (6), 536–539. doi: 10.1093/jhered/esh074
Piry S., Luikart G., Cornuet J.-M. (1999). Computer note. BOTTLENECK: A computer program for detecting recent reductions in the effective size using allele frequency data. J. Hered. 90 (4), 502–503. doi: 10.1093/jhered/90.4.502
Pritchard J. K., Stephens M., Donnelly P. (2000). Inference of population structure using multilocus genotype data. Genetics 155 (2), 945–959. doi: 10.1093/genetics/155.2.945
Ramírez-Amaro S., Picornell A., Arenas M., Castro J. A., Massutí E., Ramon M. M., et al. (2018). Contrasting evolutionary patterns in populations of demersal sharks throughout the western Mediterranean. Mar. Biol. 165 (1), 3. doi: 10.1007/s00227-017-3254-2
Rannala B., Mountain J. L. (1997). Detecting immigration by using multilocus genotypes. Proc. Natl. Acad. Sci. U.S.A. 94 (17), 9197–9201. doi: 10.1073/pnas.94.17.9197
R Core Team (2020). R: A language and environment for statistical computing (Vienna, Austria: R Foundation for Statistical Computing).
Rousset F. (1997). Genetic differentiation and estimation of gene flow from f-statistics under isolation by distance. Genetics 145, 1219–1228. doi: 10.1093/genetics/145.4.1219
Rousset F. (2008). genepop'007: A complete re-implementation of the genepop software for windows and Linux. Mol. Ecol. Resour. 8 (1), 103–106. doi: 10.1111/j.1471-8286.2007.01931.x
Ryman N., Palm S. (2006). POWSIM: A computer program for assessing statistical power when testing for genetic differentiation. Mol. Ecol. Notes 6 (3), 600–602. doi: 10.1111/j.1471-8286.2006.01378.x
Scacco U., La Mesa G., Vacchi M. (2010). Body morphometrics, swimming diversity and niche in demersal sharks: A comparative case study from the Mediterranean Sea. Sci. Mar. 74 (1), 37–53. doi: 10.3989/scimar.2010.74n1037
Šegvić-Bubić T., Marrone F., Grubišić L., Izquierdo-Gomez D., Katavić I., Arculeo M., et al. (2016). Two seas, two lineages: How genetic diversity is structured in Atlantic and Mediterranean greater amberjack Seriola dumerili riss (Perciformes, carangidae). Fisheries Res. 179, 271–279. doi: 10.1016/j.fishres.2016.03.018
Sere M., Thevenon S., Belem A. M. G., De Meeus T. (2017). Comparison of different genetic distances to test isolation by distance between populations. Heredity (Edinb) 119, 55–63. doi: 10.1038/hdy.2017.26
Serena F., Abella A. J., Bargnesi F., Barone M., Colloca F., Ferretti F., et al. (2020). Species diversity, taxonomy and distribution of Chondrichthyes in the Mediterranean and black Sea. Eur. Zool. J. 87 (1), 497–536. doi: 10.1080/24750263.2020.1805518
Soares K. D. A., Carvalho M. R. (2019). The catshark genus Scyliorhinus (Chondrichthyes: Carcharhiniformes: Scyliorhinidae): Taxonomy, morphology and distribution. Zootaxa 4601 (1), Zootaxa 4601.1.1. doi: 10.11646/zootaxa.4601.1.1
SPA/RAC–UN Environment/MAP (2020). Action plan for the conservation of cartilaginous fishes (Chondrichtyans) in the Mediterranean Sea. Ed. Bradai M. N. (Tunis: SPA/RAC), 18.
Spedicato M. T., Massuti E., Merigot B., Tserpes G., Jadaud A., Relini G. (2020). The MEDITS trawl survey specifications in an ecosystem approach to fishery management. Sci. Mar. 84 (3), 309–309. doi: 10.3989/scimar.04915.11X
Sundqvist L., Keenan K., Zackrisson M., Prodöhl P., Kleinhans D. (2016). Directional genetic differentiation and relative migration. Ecol. Evol. 6 (11), 3461–3475. doi: 10.1002/ece3.2096
Testor P., Gascard J. C. (2005). Large Scale flow separation and mesoscale eddy formation in the Algerian basin. Prog. Oceanogr. 66 (2), 211–230. doi: 10.1016/j.pocean.2004.07.018
Van Oosterhout C., Hutchinson W. F., Wills D. P. M., Shipley P. (2004). Micro-checker: Software for identifying and correcting genotyping errors in microsatellite data. mol. ecol. Notes 4 (3), 535–538. doi: 10.1111/j.1471-8286.2004.00684.x
Wang J. (2017). The computer program STRUCTURE for assigning individuals to populations: Easy to use but easier to misuse. Mol. Ecol. Resour 17, 981–990. doi: 10.1111/1755-0998.12650
Waples R. S., England P. R. (2011). Estimating contemporary effective population size on the basis of linkage disequilibrium in the face of migration. Genetics 189 (2), 633–644. doi: 10.1534/genetics.111.132233
Keywords: genetic assessment, reference baseline, elasmobranchs, microsatellites, Mediterranean Sea, population structure, small-spotted catshark, commercial species
Citation: Melis R, Vacca L, Cariani A, Carugati L, Cau A, Charilaou C, Di Crescenzo S, Ferrari A, Follesa MC, Hemida F, Helyar S, Lo Brutto S, Sion L, Tinti F and Cannas R (2023) Commercial sharks under scrutiny: Baseline genetic distinctiveness supports structured populations of small-spotted catsharks in the Mediterranean Sea. Front. Mar. Sci. 10:1050055. doi: 10.3389/fmars.2023.1050055
Received: 21 September 2022; Accepted: 07 February 2023;
Published: 24 February 2023.
Edited by:
Bianca Maria Lombardo, University of Catania, ItalyReviewed by:
Jean-baptiste Ledoux, University of Porto, PortugalMaria Flavia Gravina, University of Rome “Tor Vergata”, Italy
Copyright © 2023 Melis, Vacca, Cariani, Carugati, Cau, Charilaou, Di Crescenzo, Ferrari, Follesa, Hemida, Helyar, Lo Brutto, Sion, Tinti and Cannas. This is an open-access article distributed under the terms of the Creative Commons Attribution License (CC BY). The use, distribution or reproduction in other forums is permitted, provided the original author(s) and the copyright owner(s) are credited and that the original publication in this journal is cited, in accordance with accepted academic practice. No use, distribution or reproduction is permitted which does not comply with these terms.
*Correspondence: Rita Cannas, cmNhbm5hc0B1bmljYS5pdA==; Fausto Tinti, ZmF1c3RvLnRpbnRpQHVuaWJvLml0; Alessia Cariani, YWxlc3NpYS5jYXJpYW5pQHVuaWJvLml0
†Present address: Sabrina Lo Brutto, National Biodiversity Future Center (NBFC), Palermo, Italy
‡These authors share first authorship