 John F. Marra
 W. Sean Chamberlin
 Carol A. Knudson4
- 1Earth and Environmental Sciences, Brooklyn College of the City University of New York, Brooklyn, NY, United States
- 2Earth and Environmental Sciences, Graduate Center of the City University of New York, New York, NY, United States
- 3Earth Sciences, Fullerton College, Fullerton, CA, United States
- 4Lamont-Doherty Earth Observatory of Columbia University, Palisades, NY, United States
- 5Naval Research Laboratory, Washington, DC, United States
Here we compare various parameters that are used to define the depth of the ocean’s productive layer, the euphotic zone, during the initiation of the spring phytoplankton bloom in the North Atlantic (47°N/20°W). These are (1) the compensation depth (Zc, where gross photosynthesis balances autotrophic respiration), (2) the depth horizon of 1% of surface photosynthetic active irradiance (Ed(0-,PAR), (3) depth horizon of 1% of surface Ed(488), and (4) the depth of the bottom of the fluorescence maximum. We also use two related parameters, the depth of the mixed layer and the ratio of integral gross production to integral respiration as a scaling factor for a proxy for the critical depth. Over the course of the observational period (25 April - 7 May, 1989), the mixed layer decreased from 162 to 20 m, and Zc decreased from 64 to 35 m. The depth of 1%Ed(0-,PAR) followed the trajectory of Zc, while Ed(488) and the depth of the bottom of the fluorescence maximum were about 10 m deeper, on average. These data support the criterion of the depth of “1%PAR” to describe the productive layer for more productive areas of the ocean. However, 1% of Ed(488) or the bottom of the fluorescence maximum could be used over a broader range of trophic conditions.
Introduction
For decades, oceanographers have defined the depth limit of ocean productivity operationally, that is, by mutual agreement. Following Ryther (1956), the productive layer, or euphotic zone, extends to the depth at which irradiance declines to 1% of its surface value. Below that depth, according to Ryther (1956), “no appreciable photosynthesis” occurs. It is a definition that has endured. However, the actual depth of the ocean’s productive layer is complicated by the ability of phytoplankton to adapt to low levels of irradiance, including a lowered respiratory demand at depth. Further, the productive layer may be defined by species differences. Observations of significant chlorophyll-a concentrations below the 1% light level have been widely reported (e.g., Laws et al., 2014), and many species (e.g., Planktoniella sp. and Navicula sp. in Goldman, 1993) appear able to thrive at very low irradiance levels. Thus, the so-called “euphotic zone” may be considered an optical parameter with limited biological relevance, as noted by Ryther (1956), and recently by Wu et al. (2021). As Banse (2004) pointed out, “The 1% depth for moonlight is about as deep as that for sunlight.”
Oceanographers often approximate the irradiance decline with depth using an attenuation coefficient averaged over depth. The corresponding compensation irradiance—a light intensity where gross photosynthesis is balanced by respiration—may be applied at physiological time scales (e.g., Falkowski et al., 1985; Geider et al., 1986), over the growth of a population (Langdon, 1987), or even at the community level (Regaudie-de-Gioux and Duarte, 2010). Knowledge of the compensation irradiance permits calculation of an analogous compensation depth, the distance below the sea surface at which the compensation irradiance is reached. Thus, if we know the compensation irradiance, we can also know the compensation depth and the depth of the ocean’s productive layer. As Patten (1961) puts it, “All the complexity of trophodynamic action devolves to this single variable….”
Gran and Braarud (1935) and later, Riley (1942), introduced mixing into the dynamics of the productive layer, noting that if respiration was a small fraction of production, that phytoplankton could be mixed below the compensation depth and still have positive primary production. Sverdrup (1953) extended these ideas such that they could be applied more broadly (Behrenfeld and Boss, 2017). His “critical depth” theory also addressed the balance between respiration and photosynthesis integrated over depth, and including surface irradiance and light attenuation. When the mixing depth (from the surface) of the phytoplankton is less than the depth where integral photosynthesis equals integral respiration, then the phytoplankton can accumulate. In Sverdrup (1953) model, shoaling of the mixed layer shallower than the critical depth initiates the spring bloom in the North Atlantic.
Outside of laboratory studies, the compensation irradiance for phytoplankton is poorly known (e.g., Geider et al., 1992; Langdon, 1998). Marra (2004) calculated a compensation irradiance that corresponded with the 1% light depth for PAR using the time courses of chlorophyll-a at different depths over the course of the boreal North Atlantic spring bloom, assuming a critical depth criterion, and arguing for an autotrophic compensation irradiance. Even so, the 1% irradiance horizon for the euphotic zone depth has been widely criticized. In middle and high latitudes, the compensation irradiance changes seasonally (Lorenzen, 1976; Banse, 2004; Kirk, 2011). Using satellite-derived ocean color to mark the initiation of the North Atlantic spring bloom, Siegel et al. (2002) found compensation irradiances higher than those observed in laboratory culture. But since ocean color measures only biomass changes, it includes losses from grazing as well as autotrophic respiration.
Determining the compensation irradiance, the compensation depth, or the critical depth, in natural populations remains challenging largely because autotrophic respiration is not directly measurable by the methods used to measure primary production. Fluxes of oxygen will estimate respiration, but the autotrophic component to community respiration cannot be discriminated. Dissolved oxygen fluxes will estimate community respiration in incubations kept in the dark. Autotrophic respiration may only be estimated assuming the dark consumption of oxygen is the same as that occurring in the light. Marra and Barber (2004) showed how autotrophic respiration could be estimated from dawn-to-dusk and 24-hr incubations with 14C. Based on a larger data set, Marra (2009) confirmed Marra and Barber (2004) and showed agreement between gross production estimated from both 14C and from 18O incubations.
Marra et al. (2014) estimated the depth of the productive layer in the NW Atlantic using measured rates of net primary production and calculations of respiration and gross primary production. Although the data are limited, the depth of the productive layer exceeded the 1% light depth and corresponded most closely with the 1% depth for blue light, i.e., 490 nm, the most penetrating wavelength. Laws et al. (2014) reported similar findings at station ALOHA with a compensation irradiance equal to 0.1% of surface light (400–700 nm) and 1% of blue light at 475 nm. Using optical and biological measurements to estimate the euphotic zone depth at the Hawaii Ocean Time-series and Bermuda Atlantic Time-series, Wu et al. (2021) found compensation irradiances generally aligned with the 0.5% depth of surface intensity or 1.5% depth for blue light (490 nm).
Compensation irradiance from various studies (compiled in Table 1) vary by an order of magnitude and seem not to depend on whether the community or autotrophic compensation depth is estimated. Thus, considerable disagreement remains over the appropriate definition of compensation depth based on surface light intensity. Here, we re-analyze data from the first (pilot) experiment of the Joint Global Ocean Flux Study (JGOFS), the North Atlantic Bloom Experiment (NABE) in April-May 1989. Data from the first process leg of that experiment (24 April–8 May) still retain features that speak to current ideas surrounding the specification of the ocean’s productive layer.

Table 1 Literature values of the compensation depth estimated in nature.
Methods
The North Atlantic Bloom Experiment (NABE) was the initial process study of the Joint Global Ocean Flux Study (JGOFS), an international program. NABE included ships from the United Kingdom, Germany, Netherlands, and Canada. The U. S. component of NABE consisted of three cruises aboard the RV Atlantis II in April and May of 1989. The first cruise deployed sediment traps, and the succeeding two cruises observed the initiation and progression of the North Atlantic spring bloom from 34°N to 60°N along the longitude of 20°W. The data reported here came from the second of the three cruises, Atlantis II cruise 119-4.
The relevant core data are listed on the JGOFS website (http://usjgofs.whoi.edu/jg/dir/jgofs/nabe/atlantisII/), although not all the data collected was submitted to the website. For example, only 24-hr incubations for primary production measurements were an identified JGOFS data contribution. We also did 14-hr (dawn-to-dusk) incubations for 14C assimilation (e.g., Knudson et al., 1989), and together with the 24-hr incubation data, were used to calculate gross primary production, autotrophic respiration and the compensation depth, as described below. The JGOFS website includes a summary of the methods for each of the parameters reported here. Details of the methods for in situ primary productivity can also be found in Knudson et al. (1989); Chipman et al. (1993), and Marra and Ho (1993), and Kiddon et al. (1995). Importantly, depths for the productivity measurements were collected at 5-10 m intervals over 3-50 m, and not in accordance with light depths. A typical set of sampling depths would be 3, 10, 20, 30, 40, and 50 m. The complete set of values is reported on the JGOFS website noted above.
Surface daily PAR data are provided on the JGOFS website by W. Broenkow (Moss Landing Marine Laboratories). PAR as a function of depth was measured with a Biospherical 4-pi PAR sensor lowered through the water column at local noon each day (Knudson et al., 1989). These data are also reported by Kiddon et al. (1995). Attenuation coefficients were calculated from linear regressions of the natural logarithm of PAR as a function of depth. We also calculated attenuation coefficients from (less frequent) casts using a Biospherical Marine Environmental Recorder (MER-2040) for PAR (quanta cm-2 s-1), Ed(488) (mW cm-2 nm-1), and chlorophyll-a fluorescence. These data are also available through the JGOFS data website with the methods specified.
Mixed layer depths were determined from the early-morning CTD casts near the time of the collection of water for the biological measurements (see Marra and Ho, 1993; Marra, 1995).
Calculations for the parameters
We calculate five separate parameters. First is the depth where 1% of surface irradiance (PAR) remains, the traditional and consensus definition for the depth of the euphotic zone. Thus,
where PAR refers to photosynthetically active radiation, 4.506 is the natural log of 1%, i.e., ln(0.01). Kd(PAR) was determined from the slope of the linear regression of ln(Ed(PAR,z), where z is depth.
Similarly, for downwelling blue light,
Inspection of the profiles reveals that ln(PAR) and ln(Ed488) as a function of depth are very close to linear, resulting in a depth-independent value for each day of the cruise.
The second parameter is the depth of the mixed layer, which regulates much of surface ocean dynamics. Here we define the depth of the mixed layer as the depth at which the difference from the surface temperature is 0.2°C.
The remaining three parameters result from biological processes. These are the compensation depth, the depth of the base of the fluorescence maximum, and a proxy for the critical depth.
The compensation depth occurs where gross primary productivity equals autotrophic respiration. Autotrophic respiration, Rp (mmols C m-3 d-1) was calculated as in Marra and Barber (2004) and Marra et al. (2014). Thus,
where AL is the assimilation after a dawn-dusk incubation, and AL+D is the carbon assimilation after 24 h, dawn to dawn. Using this method, Rp can only be calculated at the daily time scale. The factor f is the fraction of darkness each day, which for the late April–early May timeframe at 47°N is 10/24 = 0.42. Daily gross production, G (mmols C m-3 d-1), can be calculated similarly as,
and we define net production, P (mmols C m-3 d-1), as
The compensation depth, Zc, is the depth where
To estimate Zc, we determined the intersection of the regression lines from values at the bottom three depths for both G and Rp.
There have been questions about the importance of “dark uptake” of 14C during the incubations, which has potential importance deeper in the euphotic zone. It can be shown, however, that if dark uptake during the day is the same as at night, then in relating daytime and nighttime assimilation, dark uptake cancels out in both estimates.
The fourth parameter is the depth of the base of the fluorescence maximum. Estimating this depth objectively is a difficult problem. As for estimating Zc, we used the intersection of two regression lines, one from the bottom of the profile and the other from the depth of the fluorescence maximum itself to the depth where fluorescence is at background. An example profile is presented in the Appendix.
Finally, we use a related parameter, a proxy for the critical depth (Sverdrup, 1953). Since we have daily measurements of the depth of the mixed layer, it is useful to see if our approximation of the critical depth can be interpreted with those changes. Our simplified proxy derives from Gran and Braarud (1935) and Riley (1942), where the ratio of photosynthesis to respiration in phytoplankton subject to vertical mixing indicates how deep the productive layer can extend. For example, if respiration is 20% of photosynthesis, phytoplankton can be mixed to five times (1/0.2) the compensation depth and maintain their population. We use the ratio of the integrated gross production (G) to integrated autotrophic respiration (Rp) to thus extend the compensation depth (with the integrals approximated according to the trapezoidal rule), and use the 1% light depth as a more direct estimate of the compensation depth, as shown below (see Results). Accordingly,
where here, Dc is the proxy critical depth, E1% refers to the 1% light depth, as defined above, and z = 50 m. We chose this simplified proxy for the critical depth to be more independent of the other parameters. Following Gran and Braarud (1935), we recognize that this parameter is approximate and, in relation to the mixed layer depth, describes only a potential for increasing phytoplankton biomass (provided no other loss processes apply).
Results
The results are summarized in Figure 1 and Table 2. Mixed layer depths decrease throughout the observational period, with the exception of 4 May (YD124). On that day, the Atlantis II re-positioned for other projects and passed through a hydrographic boundary (see McGillicuddy et al., 1995). Nevertheless, after 1 May, the mixed layer depth remained shallower than 60 m and most often, 30 m or less (see also Marra, 1995). Plots of the vertical distributions of 14C assimilation can be found in Kiddon et al. (1995) and the depth-time changes to chlorophyll-a can be found in Marra and Ho (1993).
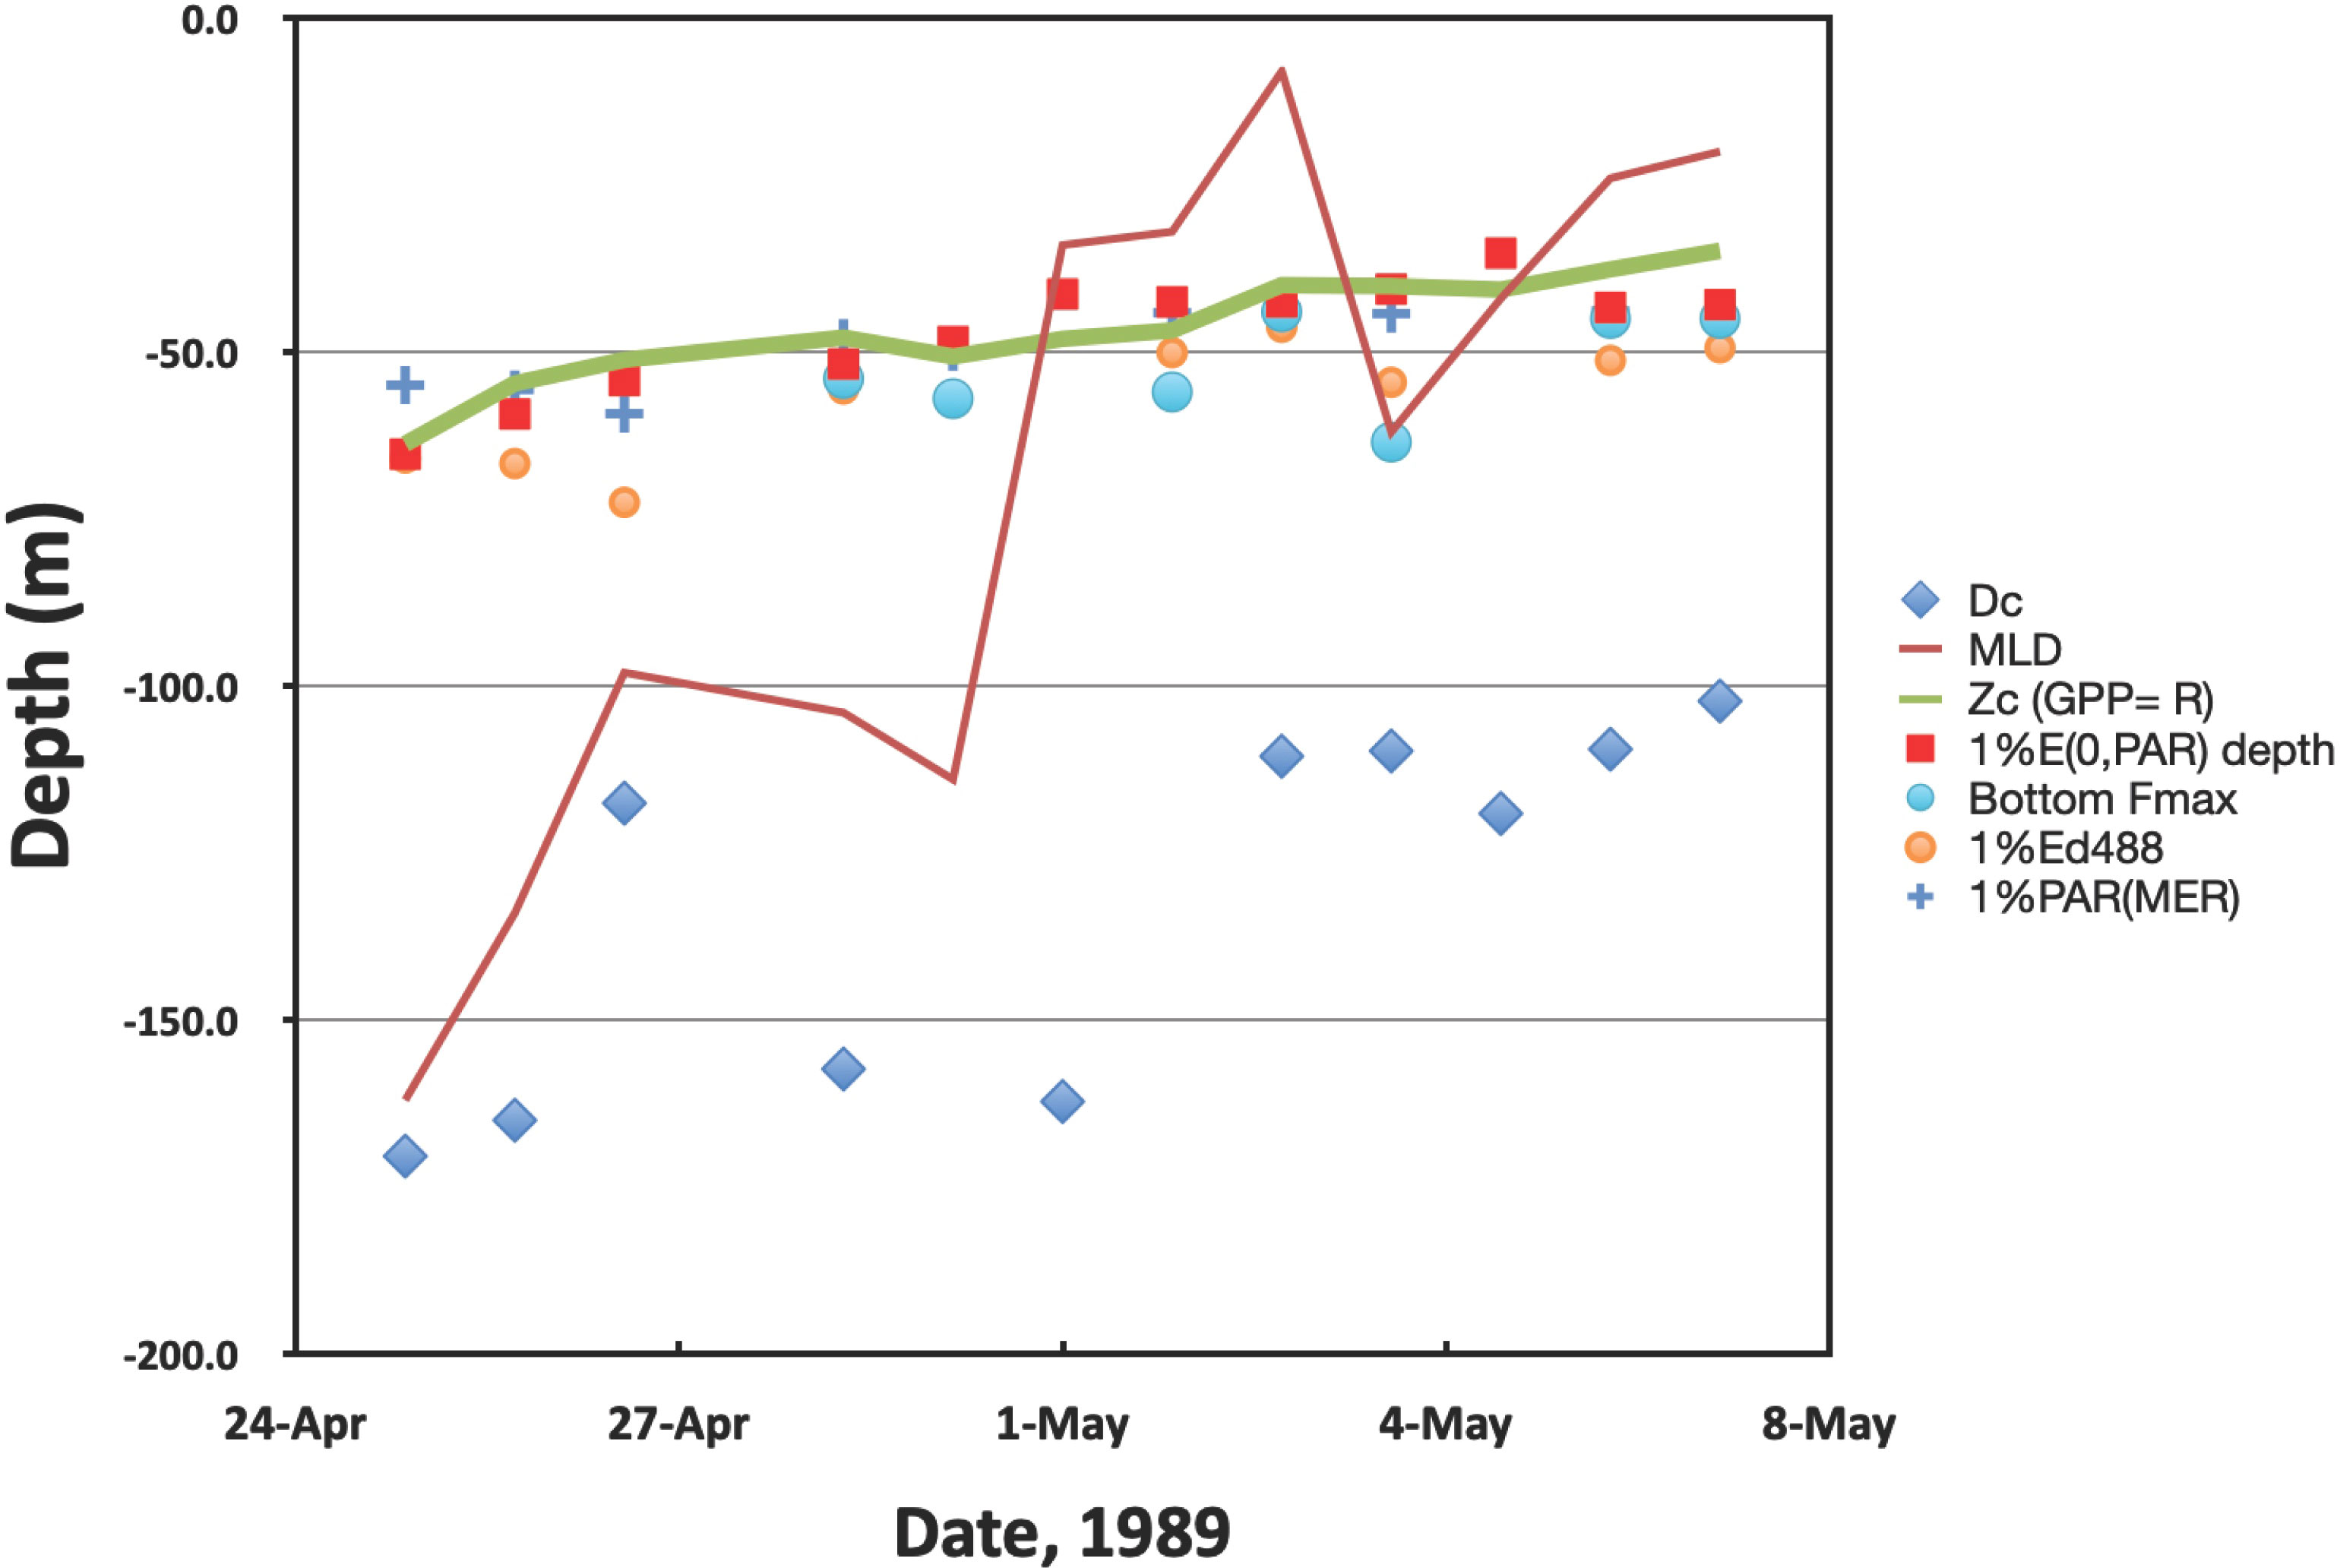
Figure 1 Time course of the various parameters over the observational period. There are no appropriate 14C assimilation data for 28 April. Also, there was no fluorescence maximum for the first three days of observations. Dc is a proxy for the critical depth (Eq. 8). Dc for 29 April and 2 May exceed -200 m (see Table 2) and are not plotted. MLD = mixed layer depth, Zc is the compensation depth. 1% Ed(488) and 1%PAR(MER) are data from the Biospherical Marine Environmental Recorder (MER-2040).
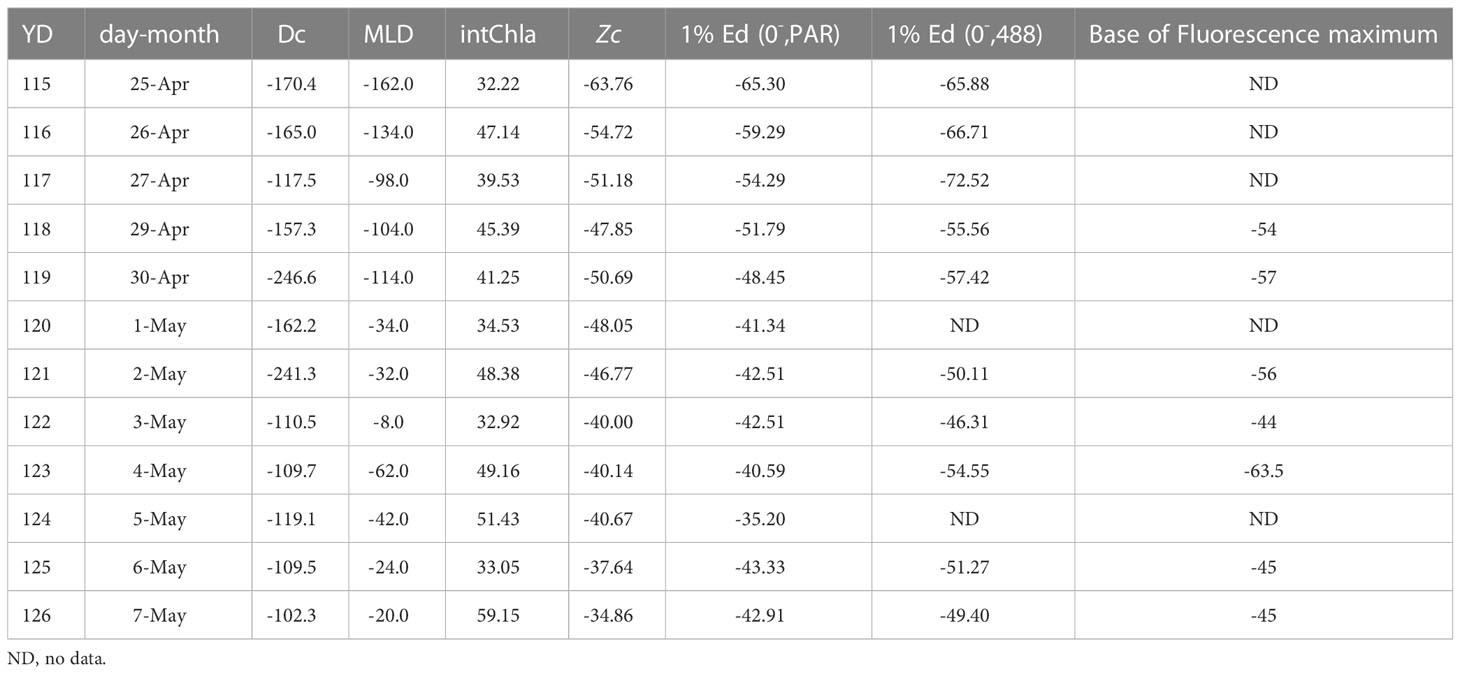
Table 2 Values (in meters) of the five parameters associated with euphotic zone depth (see Figure 1) plus areal chlorophyll-a (intChla; mg m-3).
The compensation depth (Zc), where G = Rp, also decreased more or less steadily over the observational period, from about 60 m to about 35 m. For the first three days of observation (25, 26, 27 April), our proxy for the critical depth (Dc in Figure 1) approximates the mixed layer depth, but slightly deeper. After that, Dc is always deeper than the mixed layer depth.
The results for the optical properties conflict at times with previous work. First, regardless of whether the measurements come from the submersible radiometers (Knudson et al., 1989) or the MER-2040, the depth of 1% of E(PAR,0-) closely approximates the compensation depth, Zc. In addition, the depth of 1% of Ed(488) was uniformly greater than Zc (see Figure 1 and Table 2).
No defined sub-surface fluorescence maximum was observed for the first three days of observations (25, 26, 27 April). Subsequently, a sub-surface fluorescence maximum developed on 28 April. However, we have no day-long experiments on that day. The first defined sub-surface fluorescence maximum during productivity measurements occurred on 29 April (YD118). On this date, the depth of the bottom of the fluorescence maximum is slightly deeper than Zc, and more so on 4 May when the ship re-positioned. On balance, however, there is good agreement between the depth of the base of the fluorescence maximum and Zc.
Discussion
Overall, we find good agreement among the four parameters estimating the compensation depth, and therefore the depth of the productive layer during the initiation of the spring bloom at the NABE site. Based on our proxy for the critical depth, we conclude that the phytoplankton community always had the physiological capability to bloom, mostly as a result of the shoaling of the mixed layer, with the possible exception of the initial three days of observations.
As suggested by Marra et al. (2014), the best indicators of the depth of the productive layer are the depth of penetration to 1% of near-surface Ed(488) and the depth at the base of the fluorescence maximum. The justification for these parameters is that 488 nm is the wavelength of light with maximum penetration in the open ocean (e.g., Liu et al., 2020). The base of the fluorescence maximum would be the depth that encompasses the entire autotrophic community. The samples analyzed in that work were locations in the Sargasso Sea, Gulf Stream, and Slope Water, obtained in summer, and generally oligotrophic. The exception was a continental shelf station where the most penetrating wavelength shifted from the blue to the green [Ed(532)].
For the North Atlantic Bloom Experiment (NABE) in the northeast Atlantic, the closest agreement with optical properties and the compensation depth is the 1% light depth for Ed(PAR) (Figure 1). While Ed(488) remained the most penetrating wavelength of light, the 1% light depth for Ed(488) was, on average, 13 m deeper than the 1% light depth for Ed(PAR) (Figure 2). Similarly, the bottom of the fluorescence maximum was about 7 m deeper on average than the compensation depth.
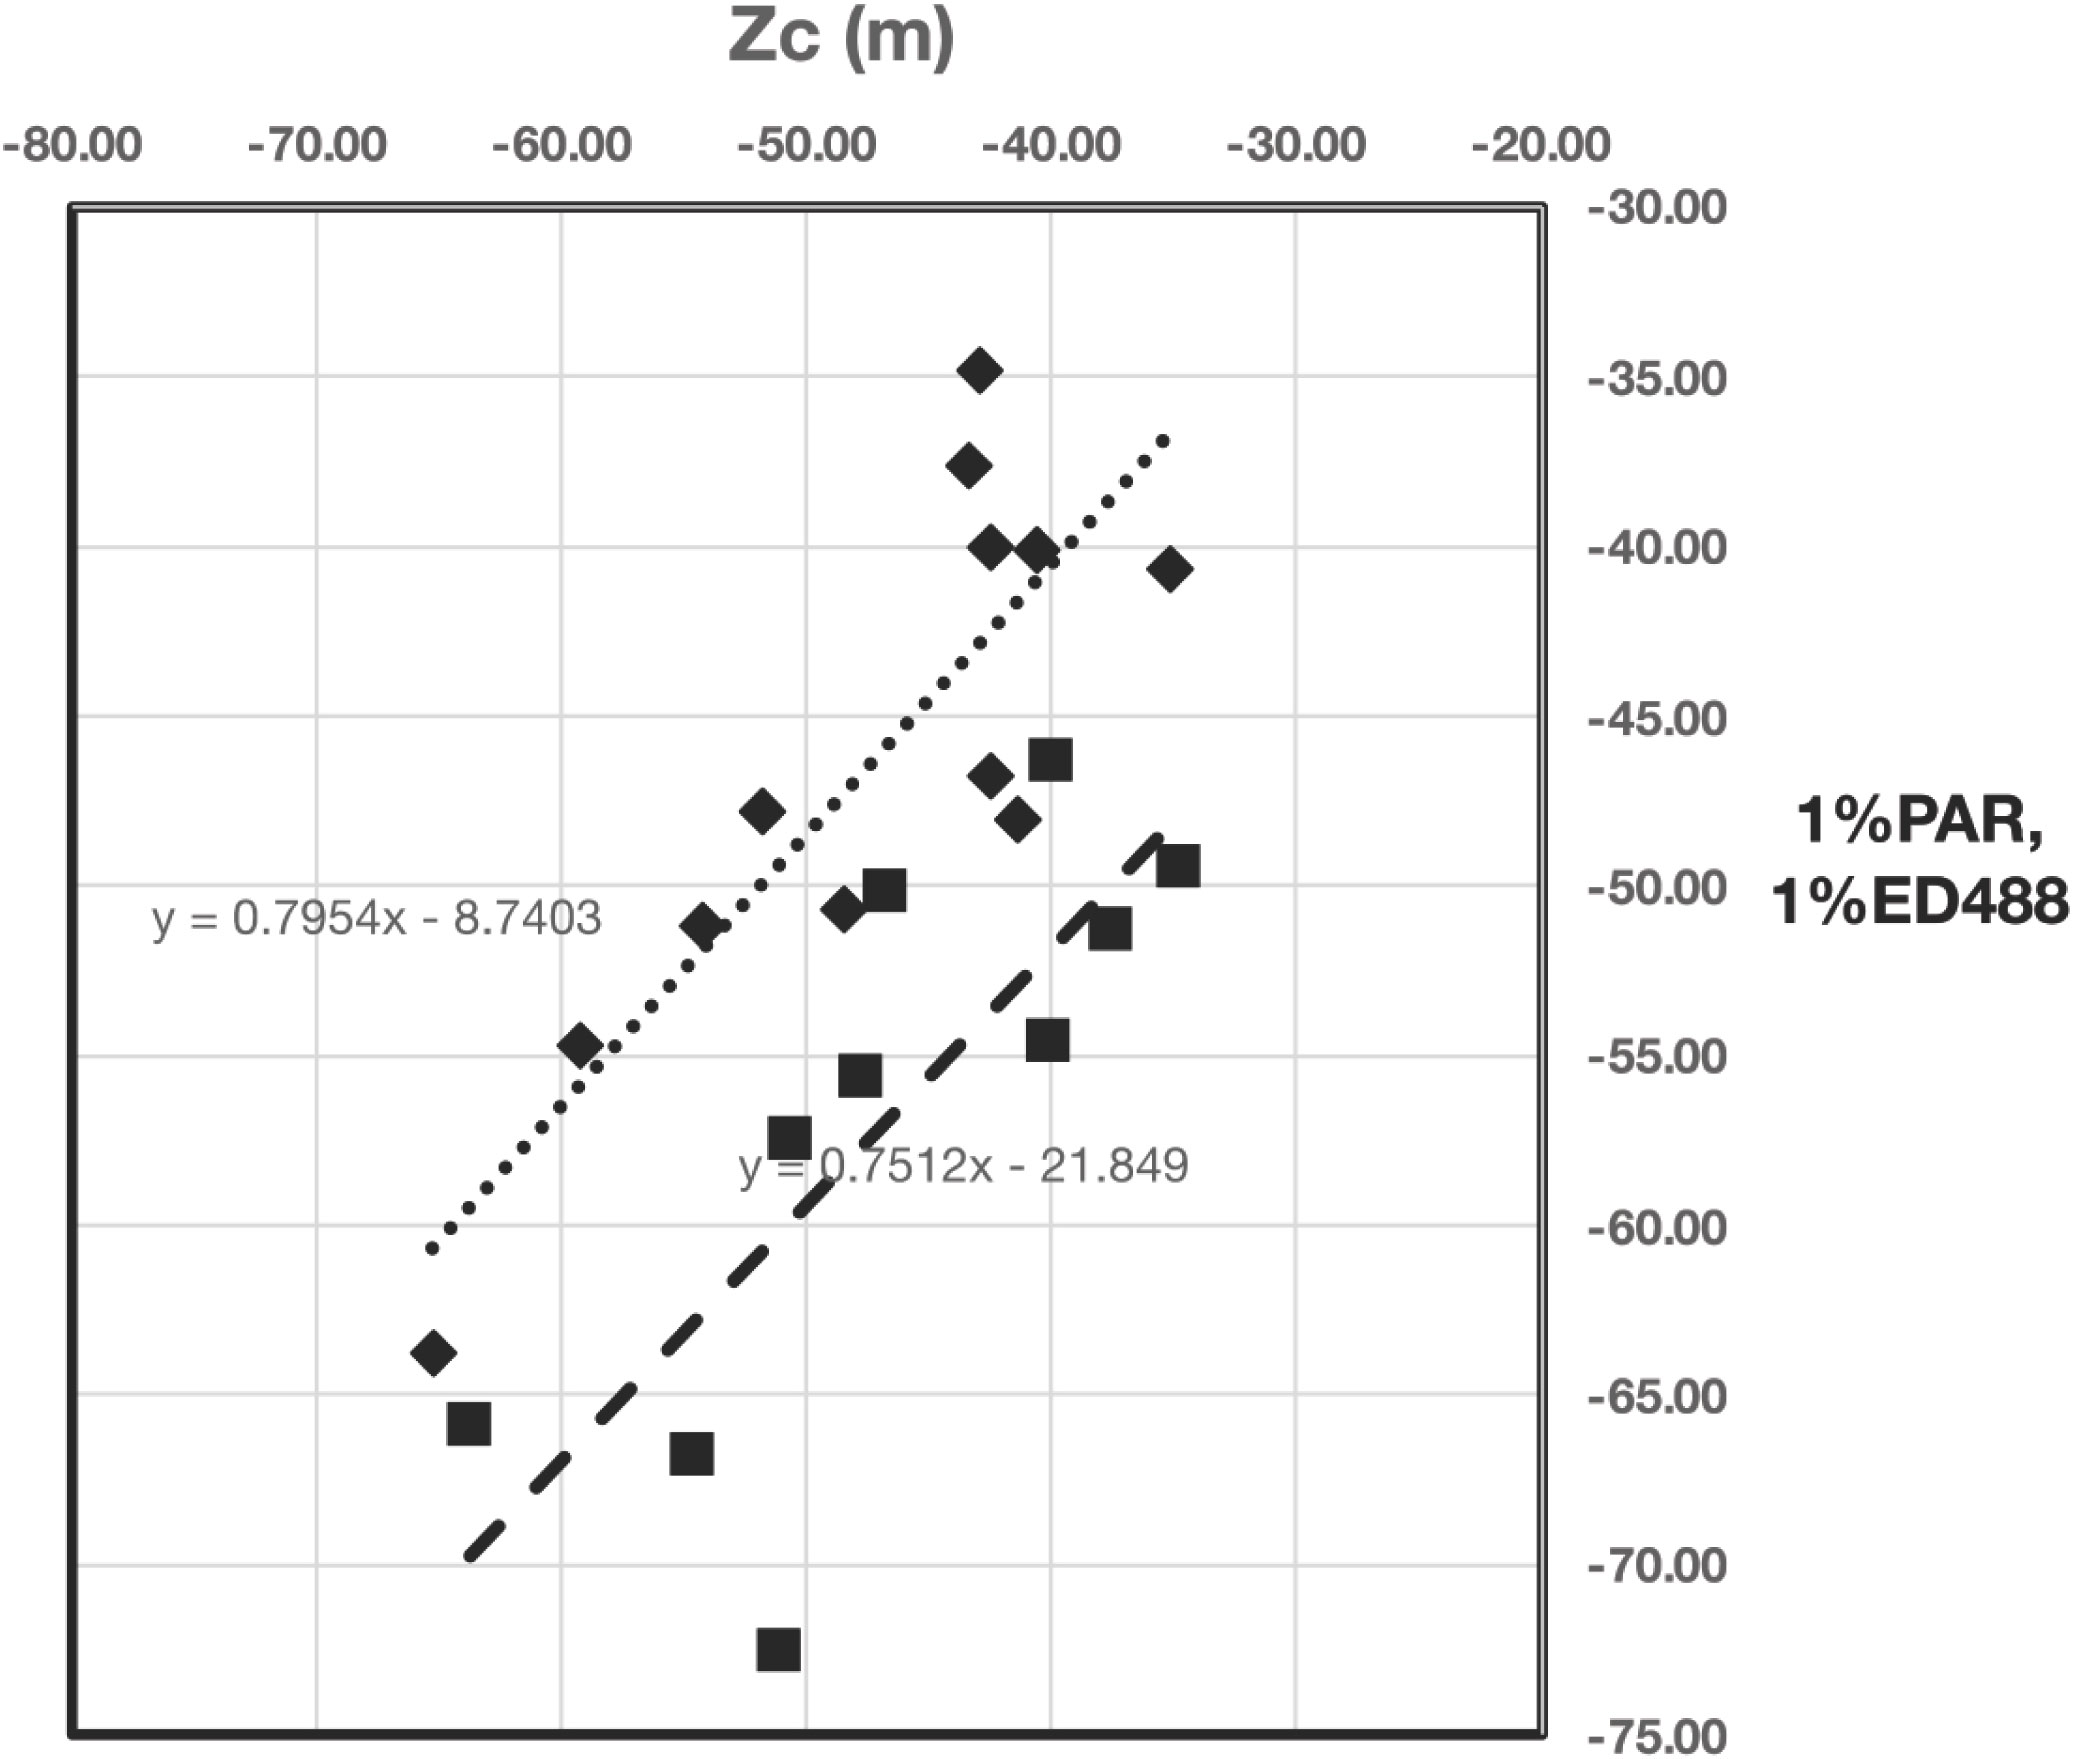
Figure 2 Linear regressions of the depth of 1%Ed(0-,PAR) (diamonds) and 1%Ed(488) (squares) with Zc (x-axis). The slope of the regression of 1%Ed(0-,PAR) on Zc is not significantly different from 1.
These results are at odds with those of Marra et al. (2014) and Wu et al. (2021). They do agree, however, with the assessment given in Marra (2004), for 60°N/20°W in the North Atlantic at a similar time of year. The reason may be the differing communities on either side of the Atlantic, which span the phytoplankton species inhabiting oligotrophic waters in the Sargasso Sea and Gulf Stream, and the mesotrophic waters in the eastern North Atlantic during the spring bloom period. In an analysis of pigments, Vaillancourt et al. (2018) found that Prochlorococcus and haptophytes dominated the phytoplankton communities in the Sargasso Sea and Gulf Stream, where deeper compensation depths were found. On the other hand, diatoms were abundant during the NABE, until about 5 May (YD 124) when silicate became undetectable, giving way to prasinophytes (Sieracki et al., 1993).
The differing communities of phytoplankton brings up the question of whether irradiance percentages (as used here) or absolute values should be reported for the compensation irradiance and corresponding depth. Many have criticized the use of percentages, such as the “1% light depth” (e.g., Lorenzen, 1976; Banse, 2004) because over seasons and latitudes, the actual values will change appreciably. However, if we accept that different phytoplankton will have differing compensation points (Falkowski and Owens, 1978; Hobson and Guest, 1983; Langdon, 1993), then a compensation depth based on irradiance percentages would seem to capture the variability that absolute values of irradiance would not. Also, 1% of Ed(488) or the bottom of the fluorescence maximum are also found to be good indicators of the depth of the productive layer, and could be used over a broader range of trophic conditions. In any case, these observations warrant further measurements of the compensation depths for phytoplankton photosynthesis across seasons and geographic areas.
Data availability statement
The raw data supporting the conclusions of this article will be made available by the authors, without undue reservation.
Author contributions
JM is the primary author with contributions from WC. WC and CK supplied critical assistance with data collection at sea and data organization. WR supplied the spectral radiometer data. AK organized the data and prepared the data report, with assistance from CH. All authors contributed to the article and approved the submitted version.
Conflict of interest
The authors declare that the research was conducted in the absence of any commercial or financial relationships that could be construed as a potential conflict of interest.
Publisher’s note
All claims expressed in this article are solely those of the authors and do not necessarily represent those of their affiliated organizations, or those of the publisher, the editors and the reviewers. Any product that may be evaluated in this article, or claim that may be made by its manufacturer, is not guaranteed or endorsed by the publisher.
Supplementary material
The Supplementary Material for this article can be found online at: https://www.frontiersin.org/articles/10.3389/fmars.2023.1052307/full#supplementary-material
Supplementary Figure 1 | Example relative fluorescence profile from 30 April. The base of the fluorescence maximum was estimated to be the intersection of two regression lines, one from the fluorescence maximum to an inflection point, and the other from the bottom of the profile to the inflection point.
References
Banse K. (2004). Should we continue to use the 1% light depth convention for estimating the compensation depth of phytoplankton for another 70 years? Limnol. Oceanogr. Bull. 13, 49–51. doi: 10.1002/lob.200413349
Behrenfeld M. J., Boss E. S. (2017). Student’s tutorial on bloom hypotheses in the context of phytoplankton annual cycles. Global Change Biol. 24, 55–77. doi: 10.1111/gcb.13858
Chipman D. W., Marra J., Takahashi T. (1993). Primary production at 47N and 20W in the north Atlantic ocean: A comparison between 14C incubation method and the mixed layer carbon budget. Deep-Sea Res. II 40, 151–169. doi: 10.1016/0967-0645(93)90011-B
Falkowski P. G., Owens T. G. (1978). Effects of light intensity on photosynthesis and dark respiration in six species of marine phytoplankton. Mar. Biol. 45, 289–295. doi: 10.1007/BF00391815
Falkowski P. G., Dubinsky Z., Wyman K. (1985). Growth-irradiance relationships in phytoplankton. Limnol. Oceanogr. 30, 311–321. doi: 10.4319/lo.1985.30.2.0311
Geider R. J. (1992). “Respiration: Taxation without representation?,” in Primary productivity and biogeochemical cycles in the sea. Eds. Falkowski P. G., Woodhead A. D. (New York: Plenum Press), 333–360.
Geider R. J., Osborne B. A., Raven J. A. (1986). Growth photosynthesis and maintenance metabolic cost in the diatom Phaeodactylum tricornutum at very low light levels. J. Phycol. 22, 39–48. doi: 10.1111/j.1529-8817.1986.tb02513.x
Goldman J. C. (1993). Potential role of large oceanic diatoms in new primary production. Deep Sea Res. I 40, 159168. doi: 10.1016/0967-0637(93)90059-C
Gran H. H., Braarud T. (1935). A quantitative study on the phytoplankton of the bay of fundy and the gulf of Maine (including observations on hydrography, chemistry, and morbidity). J. Biol. Board Canada 1, 219–467. doi: 10.1139/f35-012
Hobson L. A., Guest K. P. (1983). Values of net compensation irradiation and their dependencies on photosynthetic efficiency and respiration in marine unicellular algae. Mar. Biol. 74, 1–7. doi: 10.1007/BF00394268
Jenkin P. M. (1937). Oxygen production by the diatom Cosinodiscus exentricus (Ehr.) in relation to submarine illumination in the English channel. J. Mar. Biol. Assoc. United Kingdom 22, 301–342. doi: 10.1017/S0025315400012030
Kiddon J., Bender M. L., Marra J. (1995). Production and respiration in the 1989 north Atlantic spring bloom: An analysis of irradiance-dependent changes. Deep-Sea Res. I 42, 553–576. doi: 10.1016/0967-0637(95)00008-T
Kirk J. T. O. (2011). Light and photosynthesis in aquatic ecosystems. 3rd ed (Cambridge: Cambridge University Press), 649.
Knudson C., Chamberlin W. S., Marra J. (1989). Primary production and irradiance data for U.S. JGOFS (Leg 2) ATLANTIS II (Cruise 119-4) (Palisades, NY: Lamont-Doherty Earth Observatory), 11.
Langdon C. (1987). On the causes of interspecific differences in the growth-irradiance relationship for phytoplankton. part 1. a comparative study of the growth-irradiance relationship of three marine phytoplankton species: Skeletonema costatum, olisthodiscus luteus and Gonyaulax tamarensis. J. Plankton Res. 9 (3), 459–482. doi: 10.1093/plankt/9.3.459
Langdon C. (1988). On the causes of interspecific differences in the growth-irradiance relationship for phytoplankton. II. a general review. J. Plankton Res. 10 (6), 1291–1312. doi: 10.1093/plankt/10.6.1291
Langdon C. (1993). The significance of respiration in production measurements based on oxygen. ICES Mar. Sci. Symposium 197, 69–78.
Laws E. A., Letelier R. M., Karl D. M. (2014). Estimating the compensation irradiance in the ocean: The importance of accounting for non-photosynthetic uptake of inorganic carbon. Deep-Sea Res. 193, 35–40. doi: 10.1016/j.dsr.2014.07.011
Liu Q., Liu D., Zhu X., Zhou Y., Le C., Mao Z., et al. (2020). Optimum wavelength of spaceborne oceanic lidar in penetration depth. J. Quantitative Spectrosc. Radiative Transfer 256, 1–7. doi: 10.1016/j.jqsrt.2020.107310
Lorenzen C. J. (1976). “Primary production in the sea,” in Ecology of the seas. Eds. Cushing D., Walsh J. J. (Hoboken: Blackwell Scientific Publications), 173–185.
Marra J. (1995). Primary production in the north Atlantic ocean: Scaling, measurements, and optical determinants. Phil. Trans. R. Soc. Lond. B 348, 153–160. doi: 10.1098/rstb.1995.0057
Marra J. (2004). The compensation irradiance for phytoplankton in nature. Geophysical Res. Lett. 31, L06305. doi: 10.1029/2003GL018881
Marra J. (2009). Net and gross productivity: Weighing in with 14C. Aquat. Microbial Ecol. 56. doi: 10.3354/ame01306
Marra J., Barber R. T. (2004). Phytoplankton and heterotrophic respiration in the surface layer of the ocean. Geophys. Res. Lett. 31, L09314. doi: 10.1029/2004GL019664
Marra J., Ho C. (1993). Initiation of the spring bloom in the northeast Atlantic (47°N, 20°W): a numerical simulation. Deep Sea Res. 40, 55–73. doi: 10.1016/0967-0645(93)90006-9
Marra J., Lance V. P., Vaillancourt R. D., Hargreaves B. R. (2014). Resolving the ocean's euphotic zone. Deep Sea Res. I 83, 45–50. doi: 10.1016/j.dsr.2013.09.005
McGillicuddy D., McCarthy J., Robinson A. (1995). Coupled physical- biological modeling of the spring bloom in the north Atlantic (I): Three dimensional bloom and post-bloom processes. Deep Sea Res. I 42, 1313–1357. doi: 10.1016/0967-0637(95)00035-5
Najjar R. G., Keeling R. F. (1997). Analysis of the mean annual cycle of the dissolved oxygen anomaly in the world ocean. J. Mar. Res. 55, 117–151. doi: 10.1357/0022240973224481
Patten B. (1961). Plankton energetics in raritan bay. Limnol. Oceanogr. 6, 369–387. doi: 10.4319/lo.1961.6.4.0369
Regaudie-de-Gioux A., Duarte C. M. (2010). Compensation irradiance for planktonic community metabolism in the ocean. Global Biogeochem. Cycles 24, GB4013. doi: 10.1029/2009GB003639
Riley G. A. (1942). The relationship of vertical turbulence and spring diatom flowering. J. Mar. Res. 5, 67–87.
Ryther J. H. (1956). Photosynthesis in the ocean as a function of light intensity. Limnol. Oceanogr. 1, 61–70. doi: 10.4319/lo.1956.1.1.0061
Siegel D. A., Doney S. C., Yoder J. A. (2002). The north Atlantic spring phytoplankton bloom and sverdrup's critical depth hypothesis. Science 296, 730–733. doi: 10.1126/science.1069174
Sieracki M. E., Verity P. G., Stoecker D. K. (1993). Plankton community response to sequential silicate and nitrate depletion during the 1989 north Atlantic spring bloom. Deep-Sea Res. II 40, 213–225. doi: 10.1016/0967-0645(93)90014-E
Sverdrup H. U. (1953). On conditions for the vernal blooming of phytoplankton. J. Conseil perm. Int. Explor. Mer 18, 287–295. doi: 10.1093/icesjms/18.3.287
Vaillancourt R. D., Lance V. P., Marra J. F. (2018). Phytoplankton chemotaxonomy within contiguous optical layers across the western north Atlantic ocean and its relationship to environmental parameters. Deep-Sea Res. I 139, 14–26. doi: 10.1016/j.dsr.2018.05.007
Wiggert J. D., Murtugudde R. G., McClain C. R. (2002). Processes controlling interannual variations in wintertime (Northeast monsoon) primary productivity in the central Arabian Sea. Deep-Sea Res. II 49 (12), 2319–2343. doi: 10.1016/S0967-0645(02)00039-5
Keywords: radiometer, productivity, respiration, euphotic depth, PAR, fluorescence
Citation: Marra JF, Chamberlin WS, Knudson CA, Rhea WJ and Ho C (2023) Parameters for the depth of the ocean’s productive layer. Front. Mar. Sci. 10:1052307. doi: 10.3389/fmars.2023.1052307
Received: 23 September 2022; Accepted: 13 March 2023;
Published: 03 April 2023.
Edited by:
Victor Martinez-Vicente, Plymouth Marine Laboratory, United KingdomReviewed by:
Stella Psarra, Hellenic Centre for Marine Research (HCMR), GreeceŽarko Kovač, University of Split, Croatia
Copyright © 2023 Marra, Chamberlin, Knudson, Rhea and Ho. This is an open-access article distributed under the terms of the Creative Commons Attribution License (CC BY). The use, distribution or reproduction in other forums is permitted, provided the original author(s) and the copyright owner(s) are credited and that the original publication in this journal is cited, in accordance with accepted academic practice. No use, distribution or reproduction is permitted which does not comply with these terms.
*Correspondence: John F. Marra, amZtNzc4MEBicm9va2x5bi5jdW55LmVkdQ==