 Yassine Kasmi1*†
 Tina Blancke1†
 Erik Eschbach1Benita Möckel1Laura Casas2Matthias Bernreuther3Pedro Nogueira1Gertrud Delfs3Samira Kadhim3Timo Meißner3Marcellus Rödiger3Amina Eladdadi4,5Christoph Stransky3
 Reinhold Hanel1
- 1Thünen Institute of Fisheries Ecology, Bremerhaven, Germany
- 2Institute of Marine Research, Instituto de Investigaciones Marinas (IIM-CSIC), Vigo, Spain
- 3Thünen Institute of Sea Fisheries, Bremerhaven, Germany
- 4Department of Mathematics, The College of Saint Rose, Albany, NY, United States
- 5Division of Mathematical Sciences, National Science Foundation, Alexandria, VA, United States
The assessment of fish stocks is often dependent on scientific trawl fisheries surveys, which are both invasive and costly. The analysis of environmental DNA (eDNA) from water samples is regarded as a non-invasive and cost-effective alternative, but meaningful performance evaluations are required for a wider application. The goal of this study was to comparatively analyze a newly developed, more sensitive real-time PCR based eDNA approach with bottom trawl fisheries catches to locally detect and quantify Atlantic cod (Gadus morhua) in the North and Baltic Seas. With a species-specificity of the qPCR assay of 100%, a minimal limit of 15 Cytochrome b eDNA copies was determined for the detection of cod. In addition, a Gaussian processing regression proved a significant correlation (95%) between eDNA (copies per L of water) and cod biomass (CPUE/Ha) found by bottom trawling. The results presented here prove the potential of eDNA analyses for quantitative assessments of commercial fish stocks in the open ocean, although additional comparative analyses are needed to demonstrate its performance under different oceanographic conditions.
1 Introduction
A sustainable fishery requires accurate and up-to-date information on the status of the fished stocks. Over the last decade, several studies have demonstrated the potential of exploiting eDNA for marine biodiversity assessment and monitoring (Tillotson et al., 2018; Andruszkiewicz et al., 2019; Jerde, 2019; Jo et al., 2021; Stoeckle et al., 2021). The increased interest in applying eDNA tools is mainly due to their non-invasive properties with a half-life of the eDNA in sea water of up to 48 h (Tsuji et al., 2017; Collins et al., 2018).
The monitoring and surveillance of fish diversity and the estimation of fish abundance are usually carried out with methods based on visual census, remotely operated vehicles (ROVs), as well as fishing techniques, such as bottom trawls (Thompson et al., 1982; Groeneveld, 2000; Sward et al., 2019; Trenkel et al., 2019). Despite all the standardization and optimization protocols, these traditional sampling methods provide information only on short sampling/monitoring time within the stations that span over a few minutes to an hour (Baudrier et al., 2018; Sward et al., 2019; Jourdain et al., 2020) and can be altered by behavioral responses, like observer or gear avoidance. In addition, fishing methods are invasive and cause disturbances and disequilibrium in the marine ecosystems, and can therefore threaten the conservation efforts for marine species.
Advances in molecular biology have allowed the extraction of eDNA from water samples avoiding any invasive effects (Lacoursière-Roussel et al., 2016; Dickie et al., 2018; Jerde, 2019). Water-extracted eDNA is therefore increasingly used for biodiversity assessments as well as for semi-quantitative biomass surveys based on eDNA copy numbers of specific species.
Knudsen et al. (2019) reported on the development of a new PCR assay for quantifying eDNA copy numbers with a Limit of Quantification (LoQ) of 665 copies per reaction, equivalent to a minimum detection limit of 200 kg/h of trawling for Atlantic cod (Gadus morhua). However, a significant correlation between eDNA concentration and bottom trawl catches could not be found. A similar study by Salter et al. (2019), based on a commercial qPCR kit (Techne) to target Atlantic cod mitochondrial control region, showed significantly positive correlations between regional integrals of cod biomass (kg) and eDNA copy number (R2 = 0.79, P = 0.003) as well as between catch per unit effort, normalized by sampling effort (kg/h), and eDNA concentrations (copies L-1) (R2 = 0.71, P = 0.008). Nonetheless, despite first promising results in the interpretation of eDNA copy number analysis, the technology is still in its infancy and needs a much more robust calibration to assist or even replace invasive routine methods for quantitative fish stock assessments. Furthermore, eDNA based methods can also not yet provide important stock structure information such as length or age class distributions, even though a few studies tried to tackle this issue with methylome approaches (Sigsgaard et al., 2020; Minamoto, 2022; Zhao et al., 2023). The goal of this study was to refine the existing quantitative eDNA based assessment approaches for Atlantic cod, by focusing on the development of a more sensitive qPCR assay with an improved LoQ value compared to existing methods. In addition, the suitability of various computational models to establish a correlation between eDNA copy number and bottom trawl sampling are evaluated.
2 Methods
2.1 Primer development
2.1.1 Sequence selection
Reference sequences of whole mitochondrial genomes of northeastern Atlantic fishes were downloaded from the public databases Aquagene (Thünen Institute of Fisheries Ecology) (Hanel, 2019) and NCBI-GenBank (Benson et al., 2013) together with single mitochondrial sequences of cytochrome oxidase (COI) subunit 1, small unit ribosomal RNA (12S rRNA), NADH dehydrogenase (NADH) subunits, cytochrome b (CYTB), ATPase6 genes and control region (D-loop) of Atlantic cod (Gadus morhua) and untargeted gadid species (Table S1:Sequences Accession).
2.1.2 Primer development
The collected sequences were aligned using Bioedit (Hall et al., 2011) and MAFFT (Katoh et al., 2018). Plotcon plots were produced for every alignment to check for conserved regions between species and the regions that distinguish Atlantic cod from other gadid species. Subsequently, primers and probes were designed for the COI, 12S rRNA, NADH5, NADH3 and CYTB regions manually or by using PrimerMiner (Elbrecht and Leese, 2017) and the R script DECIPHER (Wright et al., 2012). All primers and probes targeted regions with low intraspecific divergence while maximizing mismatches between related species at the 3′ end as described by (Wilcox et al., 2013). Primers were designed to amplify fragments in the size range of 80 to 250 bp. Annealing temperatures and cross-amplifications of untargeted species were verified using Primer Blast (Ye et al., 2012) and were adjusted to be adequate to the PCR/qPCR kit used.
All designed primers and probes underwent a screening according to their ability to amplify the target species (G. morhua) versus cross-amplification of various untargeted species, abundant in the region (Brosme brosme, Chelidonichthys lucerna, Clupea harengus, Enchelyopus cimbrius, Engraulis encrasiolus, Helicolenus dactylopterus, Lota lota, Melanogrammus aeglefinus, Merlangius merlangus, Merluccius merluccius, Micromesistius poutassou, Molva molva, Pollachius virens, Scophthalmus maximus, Trachurus trachurus, Trisopterus luscus, Trisopterus minutus) (Table S2).
A preliminary primer screening was performed in a conventional PCR using Phusion® High-Fidelity PCR Master Mix with HF Buffer, 2X (New England Biolabs, Germany) on a BioRad T100™ PCR system in a final volume of 20 µl: 10 µl of Phusion Master Mix (2X), 0.5 µl of each primer (10 µM), 3 µl of DNA (5 -10 ng) and 6 µl of ultrapure distilled water, following these conditions: 98°C for 30 s, 34 cycles × [98°C for 10 s, 54-70*°C for 30 s], 72°C for 20s, in which (*) refers to a gradient PCR. Then, the PCR products were visualized on a 1% electrophoresis agarose gel.
Those primer pairs that showed strong amplification of the target and weak or even no amplification of the non-targeted species were selected and passed on for a second screening. This was performed on SYBR Green qPCR, using Luna® Universal qPCR Mastermix (New England Biolabs, Germany) in a qTOWER³ real-time PCR thermal cycler (Analytik Jena, Germany), in a final volume of 20 µl: 10 µl of Luna® Universal qPCR Master Mix (2X), 0.5 µl of each primer (10 µM), 2 µl of DNA (5 -10 ng) and 7 µl of ultrapure distilled water, following these conditions: 95°C for 60 s, 44 cycles × [95°C for 15 s, 54-70°C for 30 s]. Data collection was enabled at each combined annealing/extension step. The amplification cycle was followed by a melting curve protocol: 60-95°C each for 15 s with an increment of 1°C.
At this stage, the selection of the potential primers was done using two criteria: the specificity to the target species (i. e. Atlantic cod) and in which cycle the first amplification signal started. The two primers/probe pairs that fulfilled these criteria were then tested on different polymerases: TaqMan assay with TaqMan™ Environmental Master Mix 2.0 (ThermoFisher, Germany), KAPA PROBE FORCE qPCR kit (Roche, Germany) and Luna Universal probe qPCR mastermix (New England Biolabs, Germany), according to the manufacturer’s protocols. All probes carried 5’FAM fluorescence modifications and BHQ1 as a 3’ quencher. Some probes were additionally tested with alternative fluorescence technologies (Locked Nucleic Acids (LNA) and Minor Groove Binder (MGB)) to increase specificity.
All PCR preparations were performed in a designated DNA-free hood in a pre-PCR room.
2.2 Standard curve and assay sensitivity
A standard curve experiment was performed using purified and diluted target amplicons as templates. The PCR products were first purified by Monarch® PCR & DNA Cleanup Kit (New England Biolabs, Frankfurt, Germany) and after 24 h at 4°C quantified by Qubit using Qubit™ dsDNA BR-Assay-Kits (Thermofisher).
PCR-products of Atlantic cod amplified with universal primers for the complete CytB gene (Sevilla et al., 2007): FishCytbF (5’ ACC ACC GTT GTT ATT CAA CTA CAA GAA C-3’), TruccytbR (5’ CGA CTT CCG GAT TAC AAG ACC G-3’) served as a target amplicon for CytB standard curves. For the NADH5 gene, the corresponding qPCR primers were used to create the template including the target amplicon sequence.
From the amplicon stock solutions, diluted to 1.00E+10 copies/µl, a series of tenfold dilutions (1,000,000, 1,00,000, 10,000, 1,000, 100, 10, 1, as well as 5000, 500, 50, and 25 copies per reaction) were prepared. Nine replicates of each dilution were run to determine the amplification efficiency and limit of detection defined as the lowest copies per reaction with >95% amplification success for each primer/probe set (Bustin et al., 2009).
In real-time PCR (qPCR), false positives can be caused by various sources of molecular biological noise. Establishing a false-positive threshold for the quantification of nucleic acids is essential for the performance of a robust and reliable qPCR assay. Establishing the analytical performance indicators of an assay, including the limit of blank (LoB) that can also be referred to as the Negative Control, and limit of detection (LoD), is fundamental and must be done according to precise procedures. The LoB is the upper limit of the target concentration that is considered acceptable in a blank sample. The LoB is then used to calculate the LoD, the target concentration limit above which the presence of the target can be asserted and quantified with a given statistical confidence. The method to calculate the LoB, LoD and LoQ is described in the Supplementary Data.
2.3 Sea sampling
2.3.1 Baltic Sea
In the Baltic Sea, 21 water samples (5L per sample) were collected from seven sampling stations during research survey No. 441 of FRV Walther Herwig III from 30.11. to 20.12.2020, conducted by the Thünen Institute of Fisheries Ecology in the frame of the North and Baltic Sea monitoring of environmental radioactivity. Water samples were collected from 3 different positions along the drag line of each bottom trawl station (start, middle and end of each drag line). The sampling was performed as described in the North Sea section.
In the Baltic Sea a 140 ft. bottom trawl gear with rock hoppers and a mesh size of 20 mm in the cod-end was used immediately after water sampling to collect Baltic cod. Catch time was 60 min each with a towing speed of 3.9- 4.1 kn during daytime. Atlantic cod catches varied between 0.00 and 9.25 kg/Ha.
2.3.2 North Sea
A total of 32 water samples consisting on 5L each were collected during research survey No. 428 of FRV Walther Herwig III in the North Sea in summer 2019, conducted by the Thünen Institute of Sea Fisheries (Figure 1). The procedure was performed before trawling to minimize contamination from trawl-derived DNA sources and possible disturbance due to the resuspension of sediment caused by the bottom trawler gear. Six water samples were collected along the drag line of each bottom trawl station (two replicates each at the start, the middle and at the end).
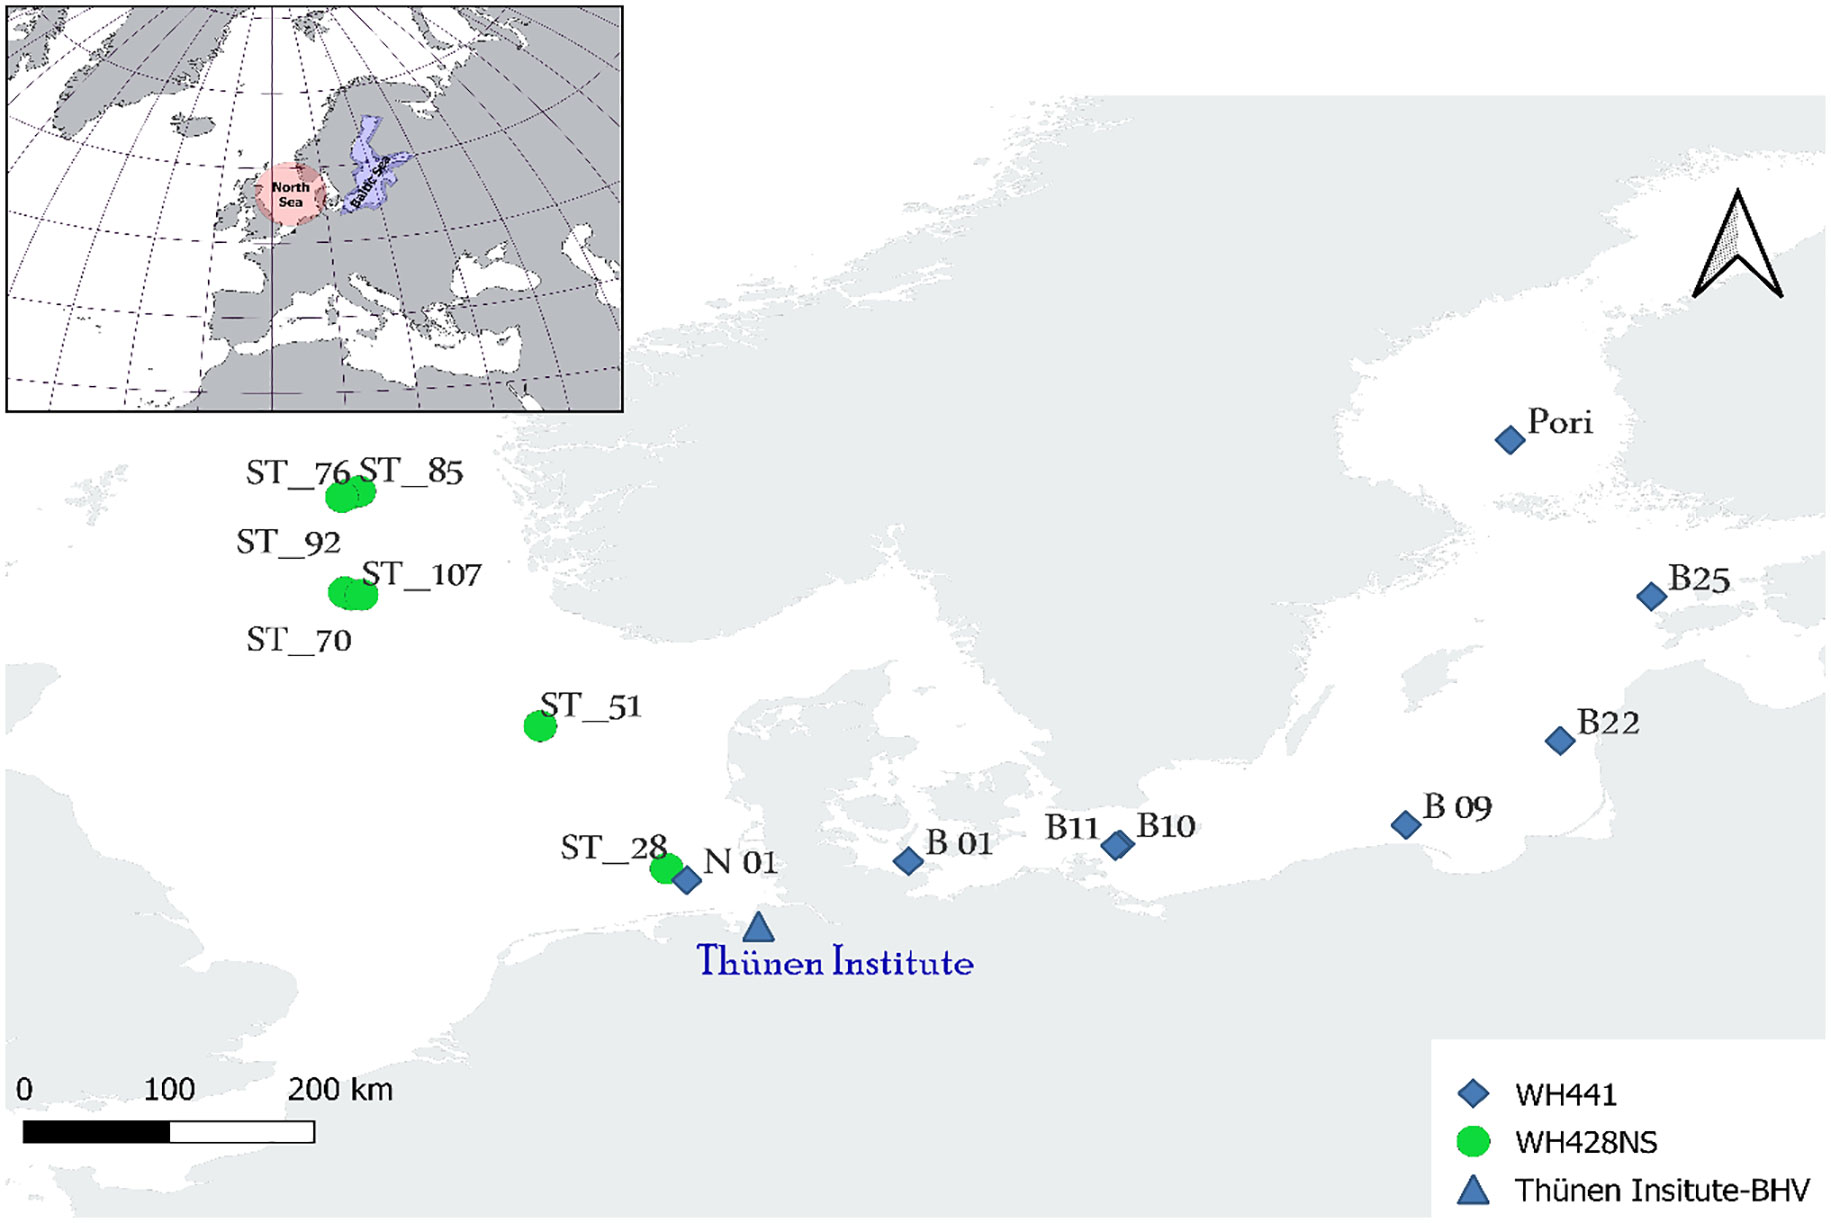
Figure 1 Sampling sites in the North Sea and Baltic Seas (Latitude: 2.00°-8.00° and Longitude: 52.00°-63.00°), WH441 and WH428 refer to the research missions aboard FFS Walther Herwig III conducted by the Thünen Institute in the Baltic Sea and North Sea, respectively. The map is constructed by QGIS.
Demersal trawling was carried out immediately after water sampling to collect North Sea cod, according to International Bottom Trawl Survey (IBTS) standards (ICES, 2020). Catch time was up to 30 min each at a trawling speed of approximately 4 knots, Total weight of each trawl catch was recorded, before sorting by species. On predefined species, such as Atlantic cod (ICES, 2020), individual length and weight were measured, sex and maturity stage discrimination were performed and otoliths were removed for subsequent age determination in the laboratory.
A total of 32 5 L seawater samples were collected at 16 trawl positions (Figure 1) by Niskin bottles mounted on a stainless steel CTD frame at a depth of 4 m above the seafloor to match the trawl height of 5 m and to minimize the possibility of sampling eDNA from non-recent sediment sources. Immediately after sampling, the water was filtered through Sartorius™ PES membranes (pore size: 0.45 µm, diameter: 47 mm) with a vacuum pump. Filters were subsequently stored at -20°C until DNA extraction at the laboratory.
2.3.3 Negative controls and contamination avoidance
Contamination avoidance was key throughout the analysis. Two negative control samples were taken from the ultrapure water which was used to rinse the Niskin bottles before each sampling. Field blanks consisted of 2.5 L of ultrapure water rinsed through the corresponding Niskin Bottles before water sample collection onboard the research vessel. After recovery of the CTD rosette, all Niskin sample bottles were thoroughly rinsed with fresh water on deck, removed from the sampling frame and transported to a CTD control laboratory isolated from the deck area where they were mounted on wall mounts for further processing. Prior to sub-sampling, the exterior of the Niskin bottles and the sampling nozzle were rinsed with a solution of sodium hypochlorite (10% commercial bleach), followed by ultrapure water. The on-board workbench area was covered with aluminium foil and rinsed with a 20% commercial bleach solution followed by ultrapure water. Each subsample bottle was rinsed three times with sample water and then filled to a 2.5 L mark. Negatives samples were treated as real samples and were filtered immediately. All further processing of the samples took place in a sterile environment in a molecular biology lab on land.
2.4 eDNA extraction
eDNA was extracted from the water according to the protocol of (Renshaw et al., 2015). In brief, the frozen PES membranes from each samples were placed in 2 ml tubes filled with 700 µL of CTAB-buffer (2% CTAB (w/v), 1.4 M NaCl, 100 mM Tris, 20 mM EDTA) and incubated at 65°C for 10 min while shaking at 650 rpm. Subsequently, 900 µl PCI phenol/chloroform/isoamyl alcohol (25:24:1) was added and vortexed for 5 s, prior to centrifugation at 15.000 x g for 5 min. 700 µl of supernatant were transferred to a new 2 ml tube, and 700 µl of chloroform was added, followed by centrifugation at 15.000 x g for 5 min. 500 µL of supernatant was transferred to a new 2 mL tube, and from here we proceeded with Monarch® Cleanup Kit (New England Biolabs, Frankfurt, Germany) from the step of adding 1000 µl of binding buffer. The final elution step was accomplished with 20 µl of elution buffer. The eDNA extracts were either stored at -20°C until qPCR or archived at -80°C. All steps of eDNA extractions were performed in a dedicated lab area under a chemical hood.
2.5 Atlantic cod qPCR from North Sea water samples
Quantitative Real-time PCR of Atlantic cod eDNA was performed using the best primer/probe couple developed in the first and second phase of this study. The primers Gm_Cytb_For2a (5’-TACACTATACCTCAGACATCGAGAC-3’) and Gm_Cytb_Rev2b (5’-GGCAATGTGCATATAAAGACAAATG-3’), coupled with the LNA-based TaqMan probe GmCytb-LNA-P (5’-[FAM] A[+C]TA[+C]GGCTGA[+C]TAATTCG[+G]A[BHQ1]-3’) were used for the amplification of the CytB gene. A qTOWER³ Real-time PCR thermal cycler (Analytik Jena, Germany) was used for amplification. The 20 µL qPCR reaction mix contained 5.5 µL eDNA template, 10 µL 2 × TaqMan™ Environmental Master Mix 2.0 (Thermofisher, Germany), 0.4 µM of each primer, 0.2 µM of Atlantic cod probe (GmCytb-LNA-P probe), 0.1 µL of AmpErase™ Uracil N-Glycosylase (UNG) (ThermoFisher, Germany) and 2.4 µL of ultrapure water. qPCR reactions were performed under thermal cycler conditions of 10 min at 95°C followed by 45 cycles of 15 s at 95°C and 59 s at 62°C. Data collection was enabled at each combined annealing/extension step. eDNA samples were measured in triplicate reactions without dilution. Numerous qPCR assays were carried out to determine the optimal PCR condition, including primers/probe concentrations as well as the DNA amount to be added in each reaction.
During the DNA extraction and qPCR assays, negative controls for extractions and no template controls (NTCs) were included in all manipulations to ensure that no cross- contamination occurred. All controls and NTCs contained only nuclease-free water. A positive control consisting of Atlantic cod genomic DNA was used to prove the qPCR reaction performance. Extractions were performed identically. Field blanks consisted of 2.5 L of ultrapure water rinsed through the corresponding Niskin Bottles before water sample collection onboard the research vessel. Neither the extraction blanks nor the field sample blanks showed amplification with Atlantic cod qPCR primers.
2.6 Computational modeling of trawling and eDNA data
The relationship between Atlantic cod eDNA concentrations and trawl catches in the standard survey area was assessed by various combinations of covariates where eDNA levels were above LoQ. The response variable, eDNA level per fishing position, and all explanatory variables were log10 transformed with the exception noted in the comment column in section 3.3. The Shapiro-Wilk test was used to validate the dependent and independent variables before the regression model. All variables and residuals used in the regional regression models were characterized by Shapiro-Wilk p-values > 0.05 confirming normal distributions.
The correlation between the number of Atlantic cod gene copies obtained by qPCR and the catch per unit effort (CPUE) was tested by simple correlation regression, generalized least squares (GLS), forest-tree, nonlinear regression, and neural network. A model was developed based on the data obtained by Knudsen et al., 2019 and then readjusted according to the output of this study. The model with the best correlation degree between real and predictive data with a minimal RMSD and MRE was selected as the best model. The model was developed using R and MATLAB scripts.
3 Results
3.1 Atlantic cod primer-probes development
3.1.1 Primer screening
Four primer pairs targeting the mitochondrial genes ATPase6, ND5, COI, and CytB, were designed in silico to distinguish Atlantic cod from other species of the family Gadidae. By comparing the four designed primers with the ones published by Knudsen et al. (2019), ATPase6, ND5, and CytB showed more than 6 additional mutations (Table 1). A first screening for cross-amplification of other gadids via conventional PCR for ATPase6, ND5, COI, and CytB was negative in each of the three technical replicates (Tables 2, 3).
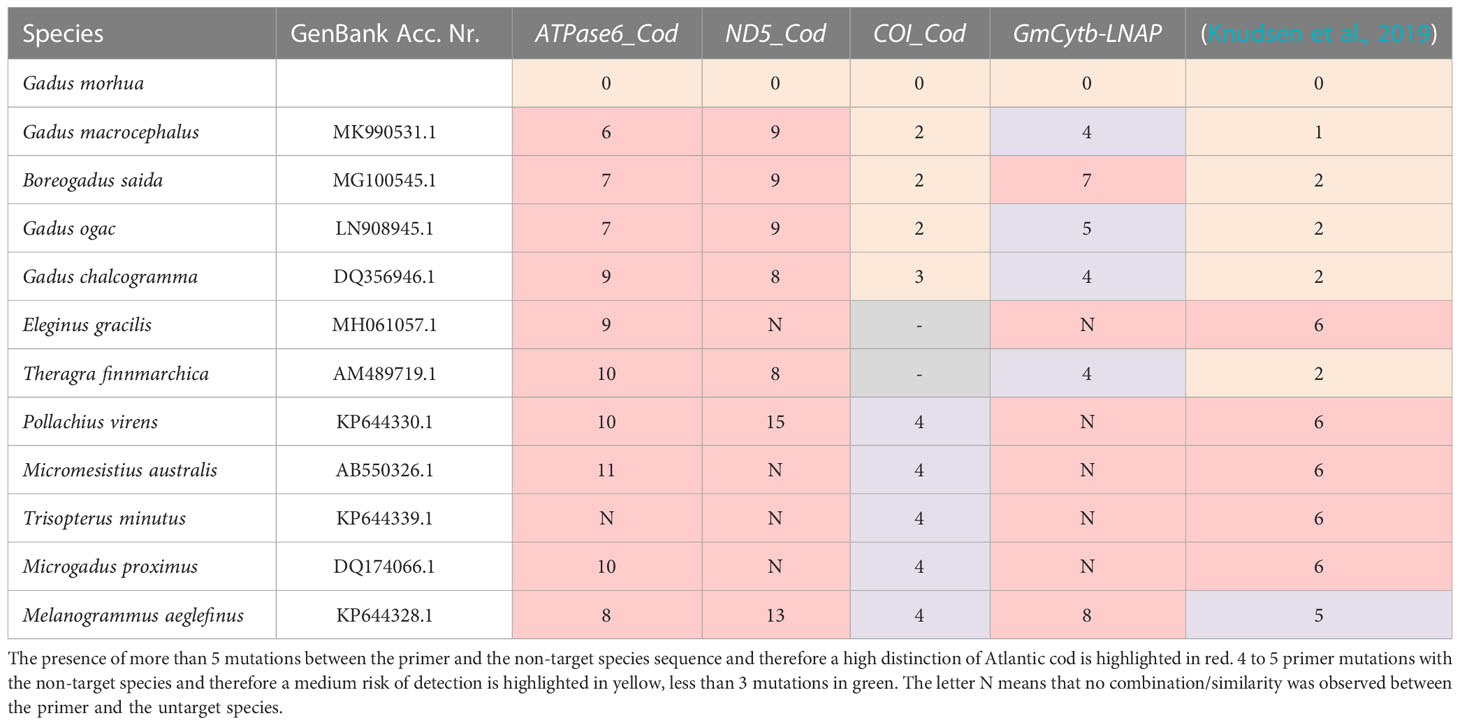
Table 1 The number of mutations observed In-silico between the primers designed or published compared to the reference Gadidae mitochondrial genomes.
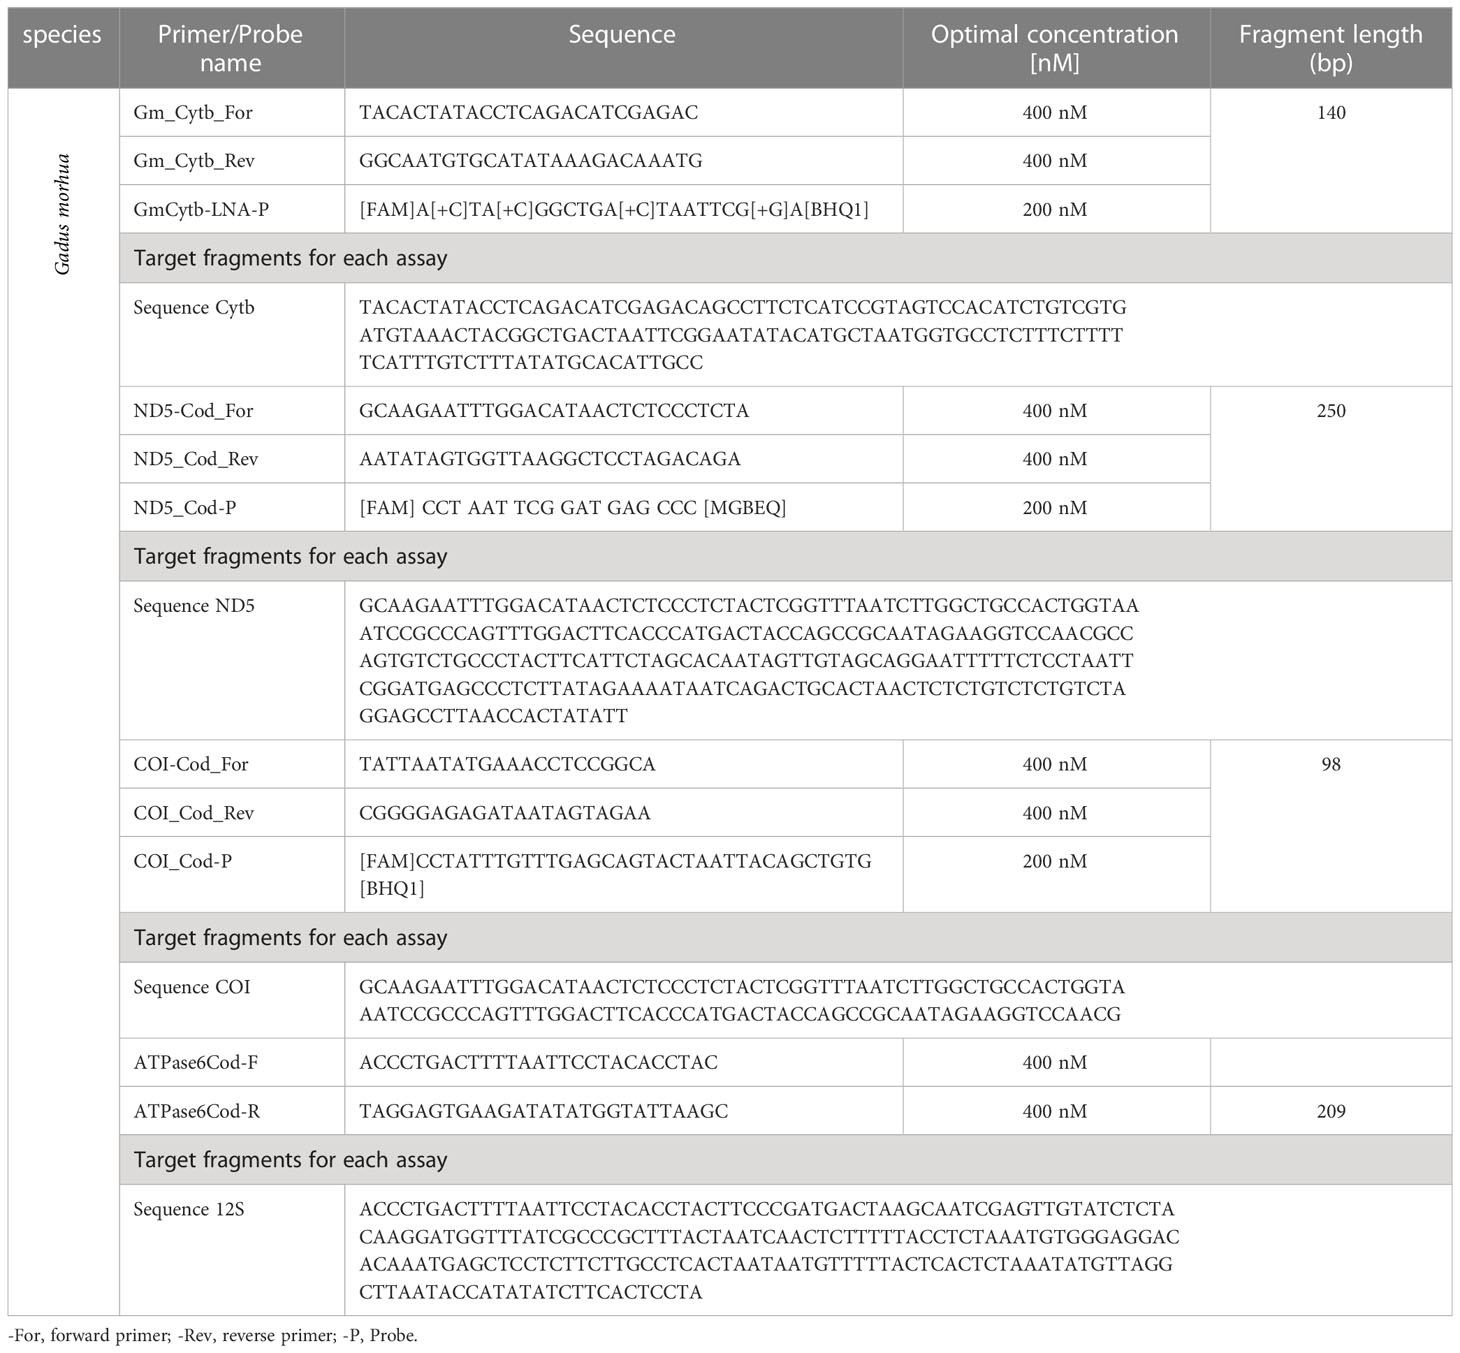
Table 2 List of primers/probes pairs developed and tested, with the optimal concentrations and lengths of target fragments.
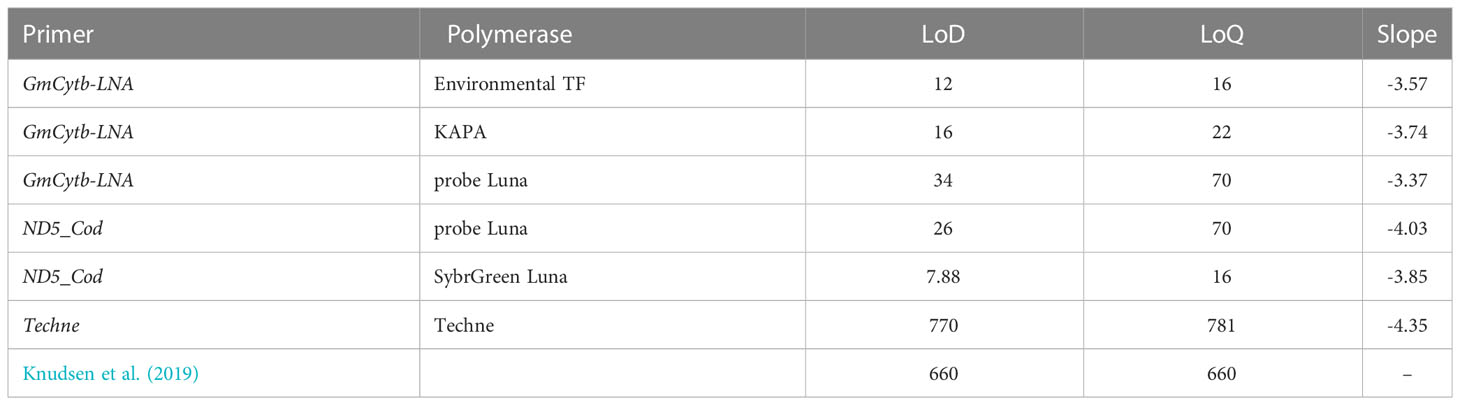
Table 3 Comparison of polymerase performance based on LoD and LoQ values.
However, when using SybrGreen PCR, some replicates showed unintended cross-amplification of untargeted gadid species, generally in the late cycles of the qPCR. The same bias was observed when using the probe, resulting in a strategy of defining specificity and sensitivity individually for each primer/probe pair with LoQ being a minimum accepted specificity value, and LoD the minimum sensitivity of a qPCR assay.
For ATPase, even both primers (forward and reverse) are located in hypervariable sites and should allow high specificity, it was problematic to determine probe regions for an unambiguous discrimination of Atlantic cod. Therefore, the ATPase-targeted primer pair is proposed for a qPCR assay coupled to SyberGreen. For this primer pair, the initial Ct value for DNA control was in the range of 12.02, while all investigated untargeted species would start from 32, with an equivalent LoQ Ct value of 31.
For the COI primers/probes, we obtained an initial amplification at Ct 18.3 for genomic DNA control, however, all untargeted species started to show some Ct values equal to 33.43. the same genomics DNA amount were used in all assays, the quantification of the genomics DNA were made by Qubit 4.0. The in-silico evaluation revealed a borderline number of mutations which allowed a distinction between Atlantic cod (Gadus morhua), the congeneric Pacific cod (Gadus macrocephalus), Greenland cod (Gadus ogac) and Alaska pollock (Gadus chalcogramma) as well as the Polar cod (Boreogadus saida).
The GmCytb-LNAP and ND5_Cod primers/probes were found to amplify only Cytb, and ND5 DNA of Atlantic cod as the target species. Cross-amplification tests on untargeted species collected during different missions to the North Sea were performed to test the specificity of the designed primers in qPCR. For the GmCytb-LNA primer pair, DNA extracted from cod tissue samples amplified at an initial Ct value of 18.8 ± 0.25, whereas for non-target species amplification was only proven after Ct 36.5, knowing that the LoQ value equals Ct=35.5, equivalent to 15 copies per reaction. The ND5_Cod primer/probe pair was able to reliably detect cod DNA at an initial Ct value of 11.56 corresponding to 8 x 10⁷ copies, its LoQ value was 16.27 copies per reaction, equivalent to a Ct value of 29, while non-target species appeared after a Ct value of 31. To prevent the inclusion of false-positive test results, LoQ Ct values were established as the positive threshold for the test. The standard curve based on the genomic control had a slope of -3.57 and -3.85 for CytB and ND5, respectively.
3.1.2 Comparison of polymerase screening
The use of TaqMan™ Environmental Master Mix 2.0 (Thermofisher, Germany) increased the specificity and sensitivity of the assay compared to KAPA qPCR kit and Luna Universal probe qPCR mastermix kit, observed at the initial Ct level for the control, which was in the order of 16.80 and a final Ct of 36.1 for 10 copies per reaction, whereas non-target species only began to appear after a Ct of 36.01, with an LoQ value that went up to 16 copies per reaction when the Environmental Master Mix 2.0 kit was used (Figure 2). Similarly, the sensitivity also increased with the KAPA qPCR kit, but less significantly than with the Environmental Master mix. Using KAPA qPCR kit, the initial control Ct value was 16.45, and final Ct was 35.04 for 10 copies per reaction, while the non-target species started only after a Ct of 34.9, making the LoQ value equal to 22 copies per reaction (equivalent to a Ct of 33.8). Whereas for the Luna Universal probe qPCR mastermix kit, untarget species started to appear at a Ct of 34.5 which is equivalent to 57 copies per reaction, and therefore the LoQ value was 70 copies per reaction. Similarly, the ND5_Cod results had almost similar results concerning the sensitivity of the Environmental Taq polymerase compared to Luna Probe (Table 3). Techne has an LoQ value equivalent to 781 copies per reaction.
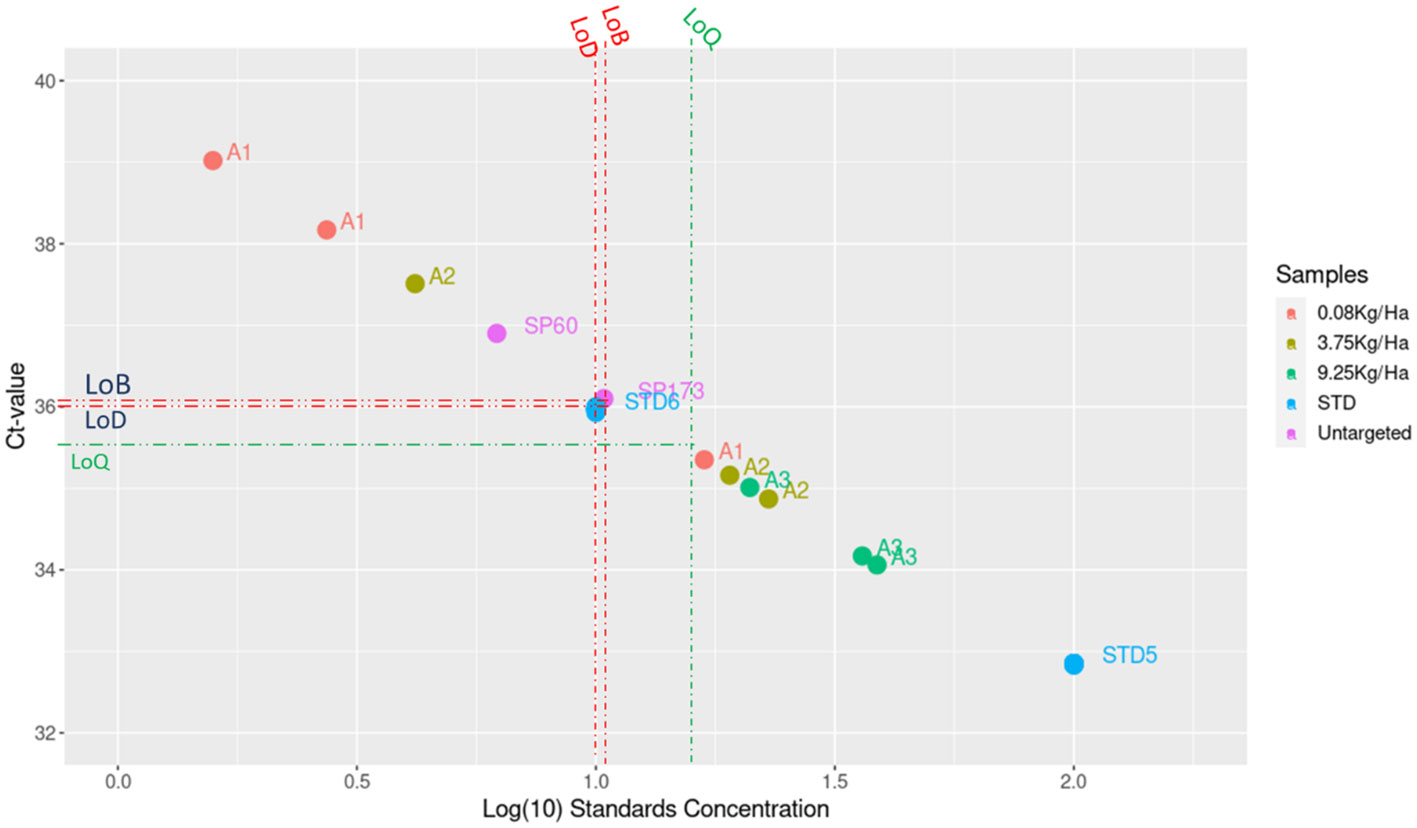
Figure 2 The results from different qPCR assays of in situ validation as well as the standard curve of threshold cycle number (Ct values) plotted against the log concentration (copy number). Dark green dots represent 9 replicates for each dilution. STD: the qPCR Standards. Positive control sample A1, A2, A3 with 0.08, 3.75, 9.25 kg/Ha of Atlantic cod in catch, respectively.
3.2 Artificial and in situ validation
Considering that the GmCytb-LNA assay performed best in the evaluation part (with a slope of about -3.5), we opted to proceed with in situ validation steps only with the primer/probe pair, setting the threshold of positive signal to a value of 1.7 for the GmCytb-LNA primer/probe pair.
For the Baltic sea samples, all technical replicates from stations with trawl catches of 9.25 and 3.75 kg/Ha of Atlantic cod were positive with eDNA signals between Ct 34.06 and 35.48, equivalent to copy numbers between 38.75 and 19.06 copies per reaction. For the stations with trawl catches of 0.08 kg/ha, only one of the three replicates was positive.
In the analysis of eDNA North Sea samples, the obtained Atlantic cod eDNA copy numbers were above the LOQ in 12 of the 17 samples, with a maximum copy number equivalent to 153 copies L-1, clearly higher than those found in the Baltic Sea. Within single stations, water samples taken in the middle of each drag line were generally richer in Atlantic cod eDNA than those at the start and the end (Figure 3). The highest Atlantic cod biomass recorded by bottom trawling in this study was 9.5 kg/Ha in the Baltic Sea (Station B10:54°49,377N; 013°55,848E), which corresponded to a concentration of 134 eDNA copies per L. Conversely, with 153 copies per L, the highest eDNA concentration was found in the North Sea, corresponding to a trawl biomass of 1.25 kg/Ha.
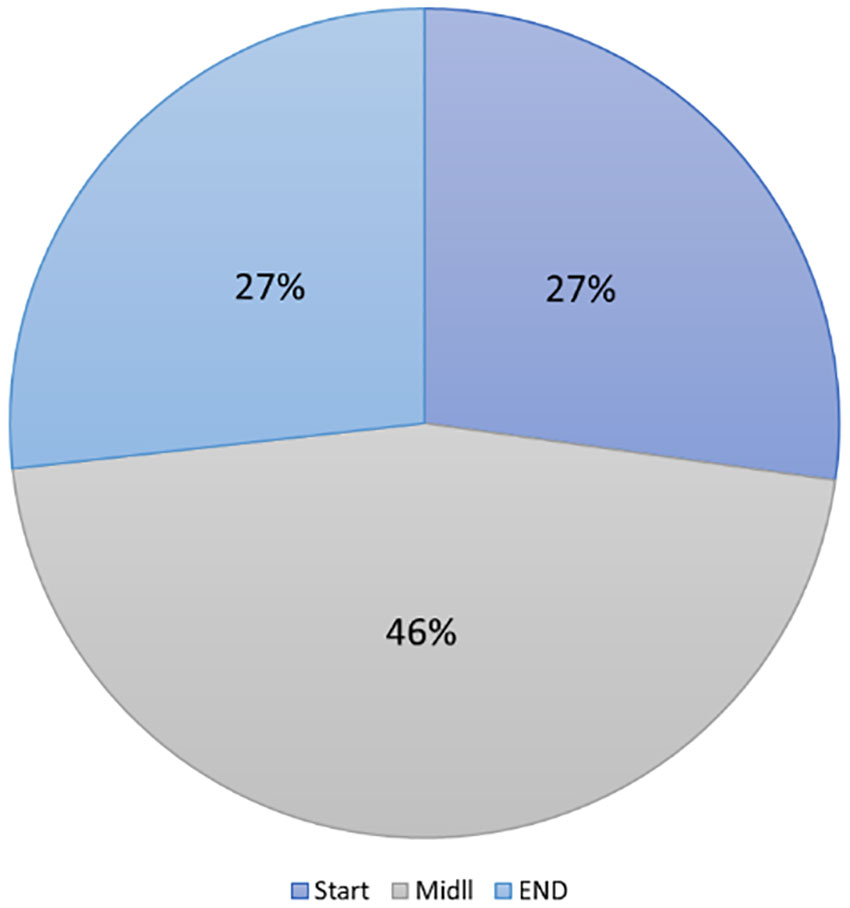
Figure 3 Percent of the number of copies per station, 46% of DNA copies obtained by qPCR were in middle stations of trawling. (p=0.004168*).
Overall, the GmCytb-LNA qPCR analysis of 15 eDNA samples resulted in the detection of Atlantic cod at all sites where the species was found in the concomitant trawl catches. Additionally, at station ST51-2, where cod was absent in the trawl catch, eDNA analysis was positive with 20 copies per reaction while all other negative trawl stations tested also negative using qPCR. This means that our qPCR assay was able to detect G. morhua in 112% of eDNA samples. All the expected positive samples produced an amplification signal in all three qPCR replicates for each sample (Table 4). The qPCR assays had an efficiency of 94.04% +/- 1.0%, with a slope equal to -3.53 +/-0.27. The R2 values ranged from 0.99 +/-0.2%. All negative extraction and PCR controls tested were negative with no sign of contamination.
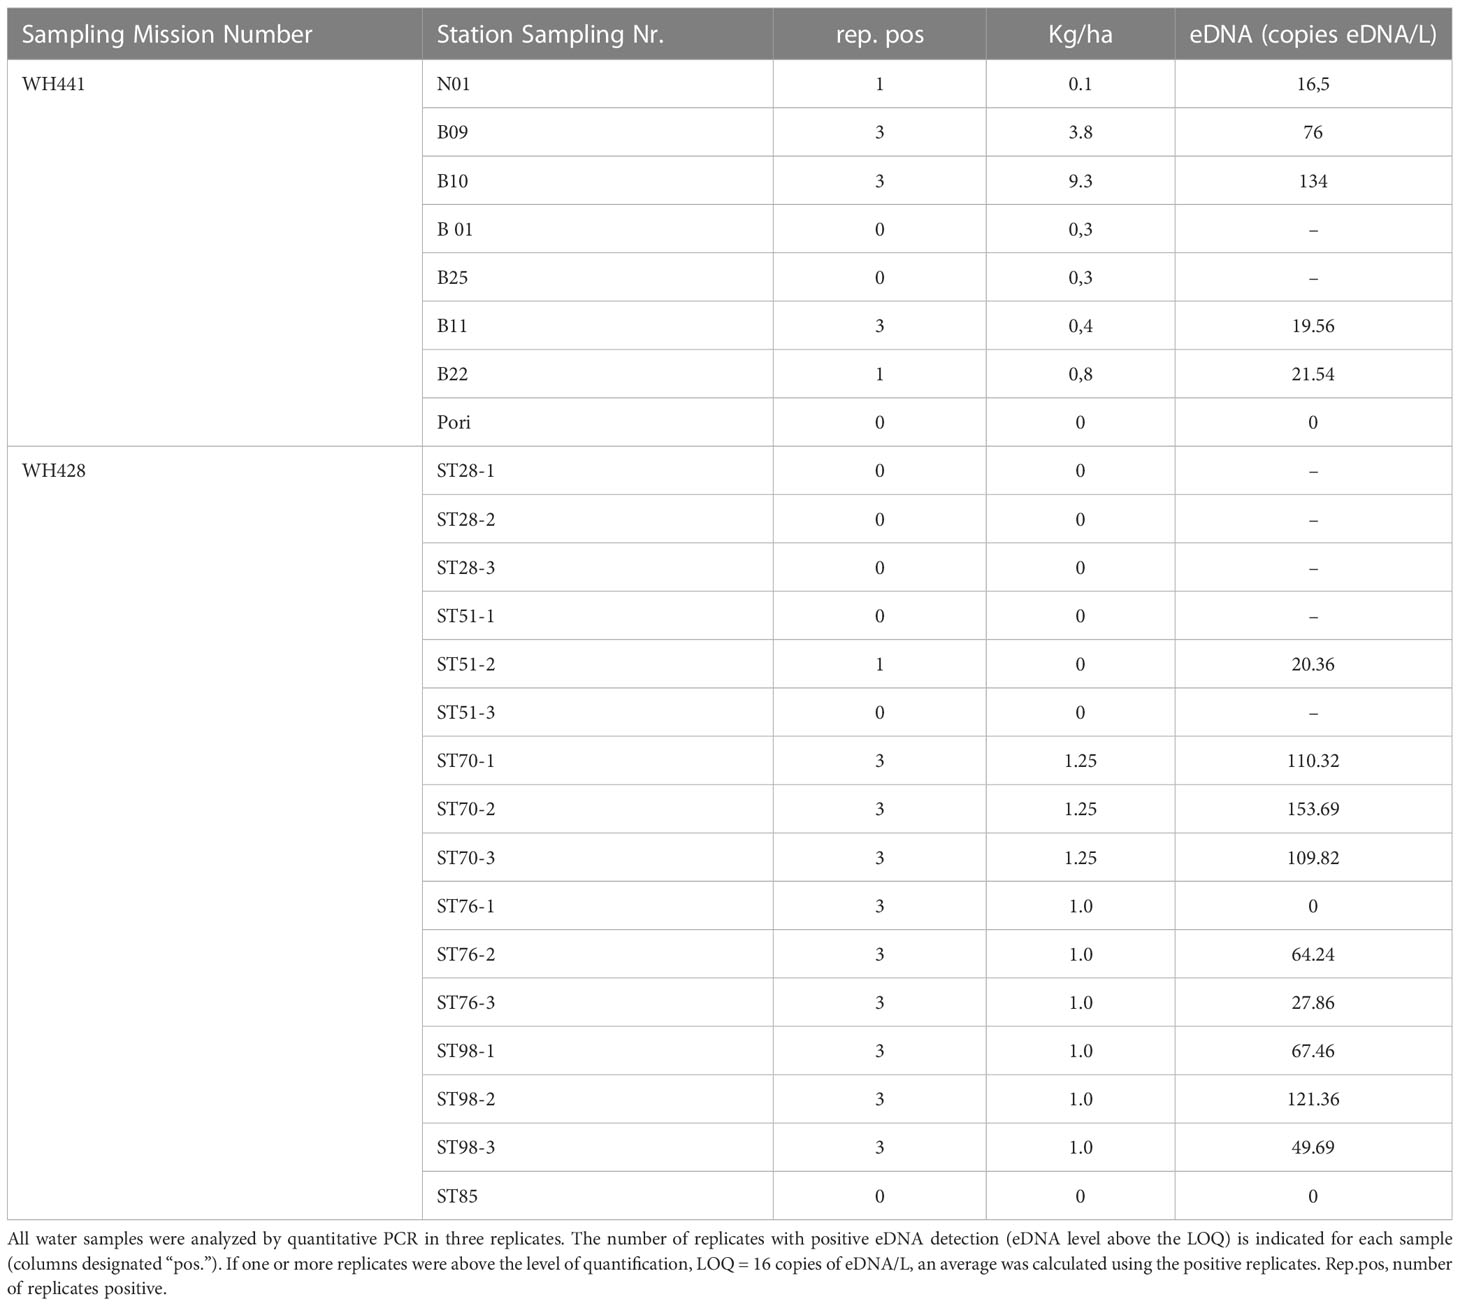
Table 4 The average measured eDNA (copies/L of seawater) in seawater samples from 17 stations is presented together with catches (kg), eDNA levels (copies/L of filtered water), and catches per unit effort (unit/ha).
Overall, Atlantic cod was detected in 60% (9/16) of the analyzed trawl hauls at the North Sea.
3.3 Computational modeling of trawling and eDNA data
The correlation between eDNA copy number and the amount of Cod found by the simple models was insignificant and weak. Despite attempts to standardize the data by logarithmic, exceptional, (max-min)/max, (max-min)/(average-x) functions, the best regression obtained was 28% between eDNA copy number per L and biomass, for the abundance in CPUE/Ha the best correlation obtained with the Log of eDNA copies/L was 40%. The correlation between eDNA copy number and CPUE in ordinary least squares (OLS) models was less than 25%, while for biomass it was around 0. By adopting Gaussian process regression (GPR), Neural network and non-linear regression modelling, we observed an increase in the regression rate. However, the use of only one variable (eDNA/L copy number) achieved only 55%. The use of two variables (eDNA/L copy number and sampling depth) significantly increased the regression rates. This allowed us to achieve 96% regression between the trawl results and the model outputs by GPR and Neural Network method. At the same time, the error rate was significantly reduced to 0.002 (MAE) (Table 5).
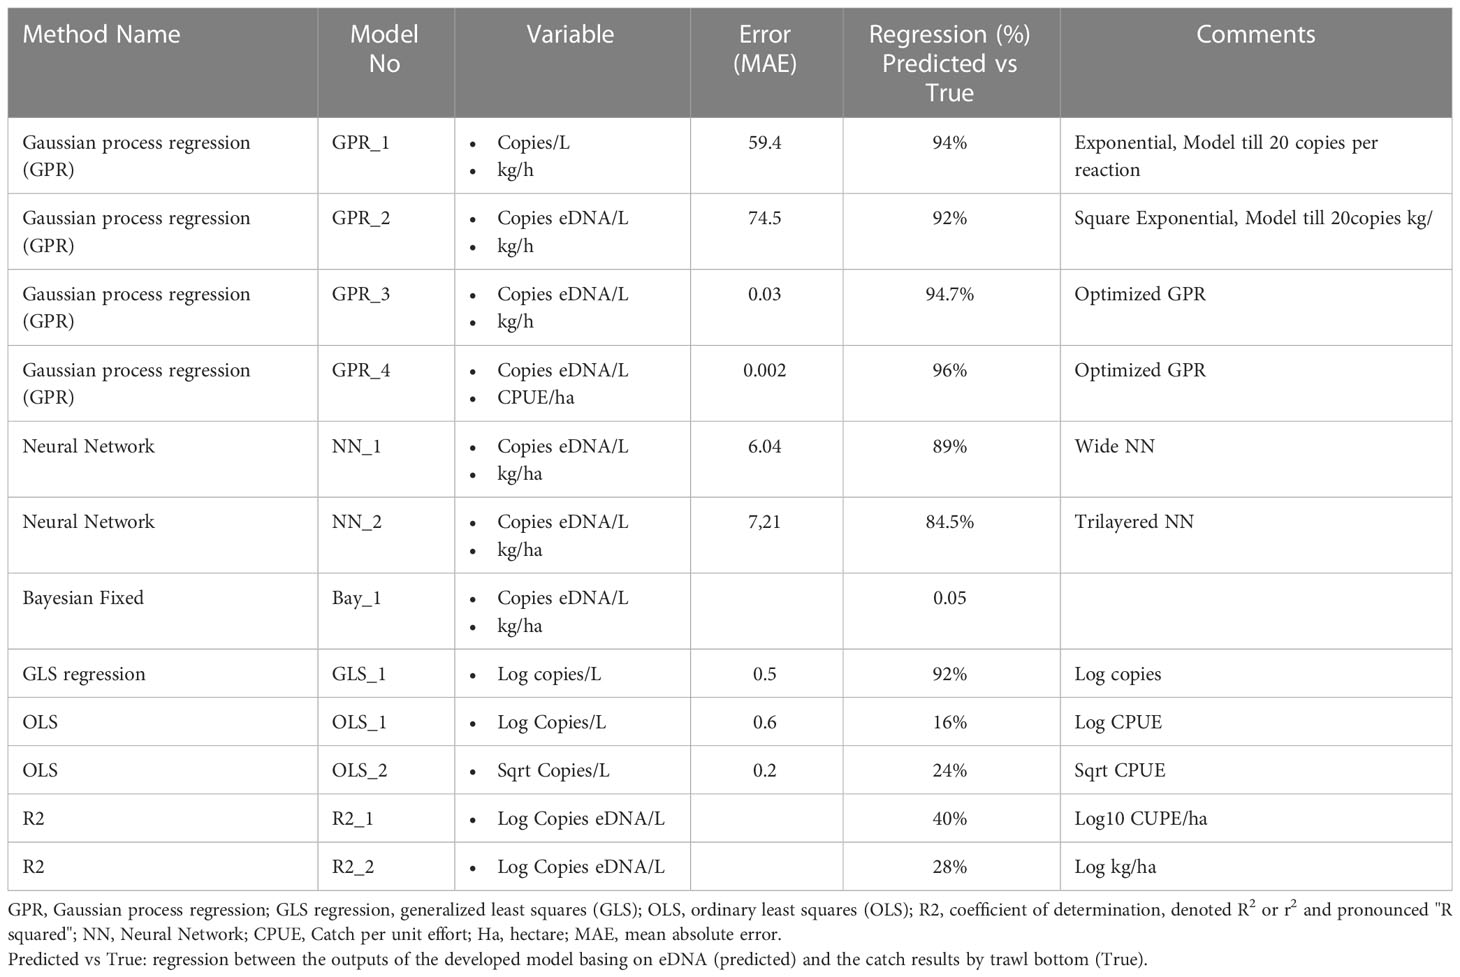
Table 5 Modeling results with tests for various combinations of covariates on cod eDNA concentrations at fishing positions where eDNA levels were above the level of quantification.
The Gaussian process regression (GPR) model (GPR_4) with two explanatory variables was the best at explaining eDNA levels for the fishing position (GPR_4, R2 98%, MAE=0,002), compared to other models with only one (eDNA/L copy number) or two (eDNA/L copy number and sampling depth) explanatory variables. In this model, we did not consider the fishing position and the latitude of the fishing position. The positive correlation between eDNA concentrations and catch per unit effort (CPUE) per Hectare on a station-by-station basis was statistically significant but considerably weaker than the regional comparisons.
4 Discussion
eDNA promises to provide reliable answers on marine diversity for marine and fisheries resource management studies, without posing a risk to dangerous species, due to the non-invasive approach. The objective of this study was to evaluate the performance of eDNA tools for revealing the abundance of Gadus morhua in the North and Baltic Sea, based on the qPCR approach.
The results of this research provide a basis for future studies to use this non-invasive tool. Significant differences were found by comparing the performance of the primers previously published and the ones designed in this study, and the type of primer used, as well as the computational model, used to predict the relationship between eDNA and the number of fishes per Ha. In addition, the three sampling positions at the same station were comparable, although the samples from the middle station were significantly better to provide more eDNA than both others positions, (according to Anova test, the f-ratio value is 6.5003. The p-value is.004168. The result is significant at p < 0.05). Also, the models used in this study were significantly different, with Gaussian process regression (GPR) applied to logarithmic data offering the best correlation between observed and predicted data.
4.1 Atlantic cod qPCR test/primer development
Four primer pairs targeting the mitochondrial genes mt-ATPase6, mt-ND5, mt-COI, and mt-CytB were designed in silico and validated in-situ. All designed qPCR assays were found to be specific to Gadus morhua in the North and Baltic Sea regions, with high sensitivity and specificity. Although the primers may give a positive signal for other untargeted species, this occurs only after a Ct value higher than 36, which is equivalent to 16 copies per reaction or less, which means that every signal after Ct 36 is a false positive signal. This false positive signal may be only due to primer breaks or incomplete hybridization due to thermic exchange during PCR cycles.
The GmCytb-LNA and Cod_ND5 pair was found to be highly specific to Gadus morhua with the Environmental Thermo-Fisher polymerase/master mix and the KAPA master mix than with other polymerases. This highlights the importance of polymerase choice in eDNA studies. (Knudsen et al., 2019) determined the LoQ value of their Gadus morhua primers to be 669 copies per reaction, while the commercial qPCR (Techne, Bibby Scientific, United Kingdom) has an LoQ value of around 771 copies per reaction. With an LoQ value equivalent to 16 copies per reaction, the GmCytb-LNA pair, coupled with TaqMan™ Environmental Master Mix 2.0, has proven to provide more sensitive and reliable results than previously available or published Gadus morhua primers/kits. This means that environmental DNA studies are more accurate and possible with the GmCytb-LNA pair than with other primers.
4.2 eDNA and Stock assignment
A study of the variation in the number of eDNA copies was carried out to determine the best horizontal position to sample the water. Based on the data obtained (Figure 3), we observed that samples taken at the middle/center of the station would cover 46% of the total copy number obtained by qPCR, whereas samples taken at the beginning and end of the station would only cover 27%. The center of the station was, moreover, more consistent with the trawling data than the other two sampling points. We note here that only one station had more significant samples taken at the beginning of the station than at the middle or end of the station.
Despite the large number of studies that have dealt with the subject of eDNA, on different organisms, there are still crucial open questions that need further consideration, especially in the field of fish stock assessment in the sea. These not only include the quantitative aspect, but also the richness of mathematical models, which can offer solutions to accelerate the use of eDNA methods in the field of standard fish population assessment and monitoring, being a non-invasive method.
The comparison of eDNA data with trawling data showed that simple regression models were less effective in establishing a significant relationship between the number of eDNA copies and the amount of fish caught or the CPUE number, where the regression percentage did not exceed 40%. On the contrary, the regression models based on neural networks and the Gaussian process allowed obtaining a high percentage of correlation between the predicted results of the model and those obtained from the trawling, especially when the predictor is the value of CPUE, coupled with a standardization by log10. Therefore, the GPR-based model (GPR_4), predicting the CPUE based on the copy number per liter, achieved a degree of correlation in the order of 95% with an error rate in the order of 0.002 (Figure 4). In the same line with our results, the outputs of modelling by (Lacoursière-Roussel et al., 2016), showed that a simple regression is only able to offer a maximum of 40% regression between the trawling data and the predictive. In addition, the works of (Tillotson et al., 2018; Moushomi et al., 2019), showed that generalized least squares (GLS) regression was able to provide a 90% regression, which is observed in our results, however, the error rate is of the order of 0.5 which may introduce a bias in the predictive data. The autoregressive integrated moving average (ARIMA) model invented by (Thalinger et al., 2019) also offers significant results between predicted and observed, however, this model focuses on studying the relationship between target eDNA concentration and fish numbers via time series modelling. Salter et al. (2019) found that their qPCR test could detect cod only at catch densities higher than 200 kg/h. Furthermore, data published by (Mahon et al., 2013) suggested that positive detection increased with the relative abundance of fish species in the Chicago area waterway system. In the same context, but in a controlled environment, (Doi et al., 2015) found a positive correlation between fish biomass and eDNA concentration in two experimental ponds.
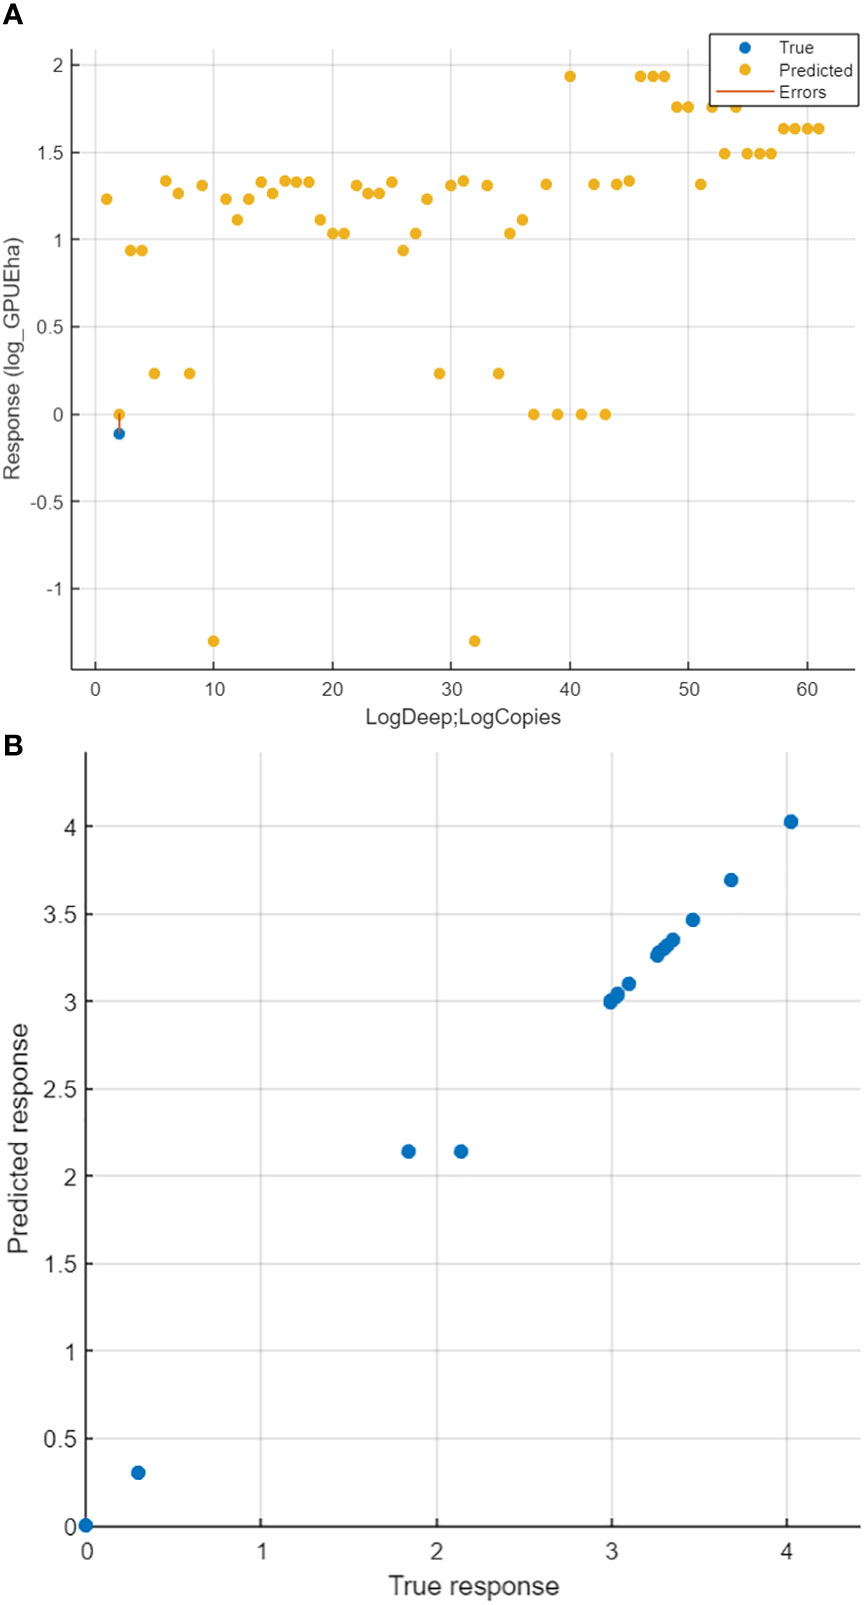
Figure 4 Comparison between output of Catch results and output of GPR model for eDNA copies. (R = 96%, Error MAE = 0,002). (A) co-Plot of the real data from trawl (blue) and the predicted basing on the eDNA model (yellow), the x-axis present predictive values of Log Depth (log Deep) of sampling and number of DNA copies (Log Copies); most of data were in predicted as it was observed. (B) The correlation between predicted data by the model (Predicted response) and the real data collected from trawl (True response).
In the present study, we were able to predict the stock abundance of cod in the North Sea and the Baltic Sea using eDNA tools from the samples. The results were similar to those obtained by trawling and CPUE for cod. Therefore, the compatibility between the trawl and eDNA data, supports also that eDNA can be used as a tool to reveal the cod stock situation in real time. In addition, as the half-life of eDNA in water samples is significantly short - around 48h- (Maruyama et al., 2014; Collins et al., 2018; Harrison et al., 2019), which makes the effects of eDNA accumulation in water through time negligible, and then eliminates the assumption that the amount of eDNA due to the long-term fishery repertoire of stations. But only for short times prior to trawling (maximum 48h). The issues of transport from other areas via currents are important to study, but the results from the three sampling positions for each station show that transport by current was not significant in our study. The sampling sites in the middle of the stations are counted as the most eDNA rich sites in Gadus morhua compared to the stations within the boundaries. The results obtained at the different stations show that the intermediate samples were richer in DNA copy numbers than those taken at the beginning or end of the station. To the best of our knowledge, there are currently no studies explaining these results. In this respect, we suspect that it is a question of random chance or that the ship created a secondary current along the flight path inside the station, causing an accumulation of DNA in the middle. However, this interpretation has been abandoned, as the amount of eDNA in the samples from the end of the station were often lower than in the center and the starting point, which contradicts this proposaland therefore negates it. The true reasons remain unknown, and subject to further studies in different locations and times of year, to examine their results and compare them to the current results, as well as to understand the impact of spatio-temporal variation on the validity of the current results.
5 Conclusions
Our results support the idea that eDNA can be used in the assessment of commercial fish stocks species to estimate the abundance of marine species, and elaborate a new non-invasive complementary method to the conventional methods currently used. Although a total replacement of the reference methods in the short term is not envisaged, a complementary integration of eDNA tools and especially of our eDNA method, will be a plus to put these technical tools on the right track of implementation and familiarization for monitoring and stock assessment teams in the short and medium term. This allows also to standardize and determine the effect of biotic and abiotic conditions on the performance and predictive capacity of fish stock assessment by eDNA from marine waters for other marine species.
Data availability statement
The datasets presented in this study can be found in online repositories. The names of the repository/repositories and accession number(s) can be found in the article/Supplementary Material. All data are available upon request to YK (eWFzc2luZS5rYXNtaUB0aHVlbmVuLmRl) or to RH (cmVpbmhvbGQuaGFuZWxAdGh1ZW5lbi5kZQ==).
Author contributions
BM and TB: Filtration and DNA Extraction. EE, TB, and YK: qPCR test development, optimization and Molecular Biology analysis. AE and YK: Bioinformatics and computational modeling. BM, EE, GD, MB, PN, SK, and TM, Water sampling of water from North Sea and Baltic Sea, Fisheries data. CS, EE, LC, RH, and YK: Conception of research and establish the methodology. LC, CS, and RH: Funding, Supervision, Orientation, and Coordination. RH: Correction of manuscript. YK: First draft manuscript. All authors contributed to the article and approved the submitted version.
Funding
The information and views set out in this manuscript are based on scientific data and information collected under Service Contract “Improving cost-efficiency of fisheries research surveys and fish stocks assessments using next-generation genetic sequencing methods [EMFF/2018/015]” signed with the European Climate, Infrastructure and Environment Executive Agency (CINEA) and funded by the European Union.
Acknowledgments
The authors gratefully acknowledge comments from the editor and the reviewers, which markedly improved the quality of this manuscript.
Conflict of interest
The authors declare that the research was conducted in the absence of any commercial or financial relationships that could be construed as a potential conflict of interest.
Publisher’s note
All claims expressed in this article are solely those of the authors and do not necessarily represent those of their affiliated organizations, or those of the publisher, the editors and the reviewers. Any product that may be evaluated in this article, or claim that may be made by its manufacturer, is not guaranteed or endorsed by the publisher.
Author disclaimer
The information and views set out in this publication are those of the author(s) and do not necessarily reflect the official opinion of CINEA or of the European Commission. The information and views set out in this manuscript are based on scientific data and information collected under Service Contract “Improving cost-efficiency of fisheries research surveys and fish stocks assessments using next-generation genetic sequencing methods [EMFF/2018/015]” signed with the European Climate, Infrastructure and Environment Executive Agency (CINEA) and funded by the European Union. The information and views set out in this publication are those of the author(s) and do not necessarily reflect the official opinion of CINEA or of the European Commission. Neither CINEA nor the European Commission can guarantee the accuracy of the scientific data/information collected under the above Specific Contract or the data/information included in this publication. Neither CINEA nor the European Commission or any person acting on their behalf may be held responsible for the use which may be made of the information contained therein. AE is a Rotating Program Director at the US National Science Foundation (NSF). Any opinions, findings, and conclusions or recommendations expressed in this material are those of the authors and do not necessarily reflect the views of the National Science Foundation.
Supplementary material
The Supplementary Material for this article can be found online at: https://www.frontiersin.org/articles/10.3389/fmars.2023.1058354/full#supplementary-material
References
Andruszkiewicz E. A., Koseff J. R., Fringer O. B., Ouellette N. T., Lowe A. B., Edwards C. A., et al. (2019). Modeling environmental DNA transport in the coastal ocean using Lagrangian particle tracking. Front. Mar. Sci. 6. doi: 10.3389/fmars.2019.00477
Baudrier J., Lefebvre A., Galgani F., Saraux C., Doray M. (2018). Optimising French fisheries surveys for marine strategy framework directive integrated ecosystem monitoring. Mar. Policy 94, 10–19. doi: 10.1016/j.marpol.2018.04.024
Benson D. A., Cavanaugh M., Clark K., Karsch-Mizrachi I., Lipman D. J., Ostell J., et al. (2013). GenBank. Nucleic Acids Res. 41, 36–42. doi: 10.1093/nar/gks1195
Bustin S. A., Benes V., Garson J. A., Hellemans J., Huggett J., Kubista M., et al. (2009). The MIQE guidelines: Minimum information for publication of quantitative real-time PCR experiments. Clin. Chem. 55, 611–622. doi: 10.1373/clinchem.2008.112797
Collins R. A., Wangensteen O. S., O’Gorman E. J., Mariani S., Sims D. W., Genner M. J. (2018). Persistence of environmental DNA in marine systems. Commun. Biol. 1, 1–11. doi: 10.1038/s42003-018-0192-6
Dickie I. A., Boyer S., Buckley H. L., Duncan R. P., Gardner P. P., Hogg I. D., et al. (2018). Towards robust and repeatable sampling methods in eDNA-based studies. Mol. Ecol. Resour. 18, 940–952. doi: 10.1111/1755-0998.12907
Doi H., Uchii K., Takahara T., Matsuhashi S., Yamanaka H., Minamoto T. (2015). Use of droplet digital PCR for estimation of fish abundance and biomass in environmental DNA surveys. PLoS One 10, e0122763. doi: 10.1371/journal.pone.0122763
Elbrecht V., Leese F. (2017). PrimerMiner: An r package for development and in silico validation of DNA metabarcoding primers. Methods Ecol. Evol. 8, 622–626. doi: 10.1111/2041-210X.12687
Groeneveld J. C. (2000). Stock assessment, ecology and economics as criteria for choosing between trap and trawl fisheries for spiny lobster palinurus delagoae. Fish. Res. 48, 141–155. doi: 10.1016/S0165-7836(00)00178-8
Hall T., Biosciences I., Carlsbad C. (2011). BioEdit: An important software for molecular biology. GERF Bull. Biosci. 2, 60–61.
Hanel R. (2019) Aqugen database: The curated genetic reference database for FISH SPECIES. Available at: http://www.aquagene.org/.
Harrison J. B., Sunday J. M., Rogers S. M. (2019). Predicting the fate of eDNA in the environment and implications for studying biodiversity. Proc. R Soc. B 286, 20191409. doi: 10.1098/RSPB.2019.1409
ICES (2020)Manual for the north Sea international bottom trawl surveys. In: Ser. ICES surv. protoc. SISP 10-IBTS 10. Available at: https://ices-library.figshare.com/articles/_/19051361 (Accessed April 25, 2022).
Jerde C. L. (2019). Can we manage fisheries with the inherent uncertainty from eDNA? J. Fish Biol. 98, jfb.14218. doi: 10.1111/jfb.14218
Jo T., Takao K., Minamoto T. (2021). Linking the state of environmental DNA to its application for biomonitoring and stock assessment: Targeting mitochondrial/nuclear genes, and different DNA fragment lengths and particle sizes. Environ. DNA 00, 1–13. doi: 10.1002/edn3.253
Jourdain N. O. A. S., Breivik O., Fuglebakk E., Aanes S., Vølstad J. H. (2020). Evaluation of sampling strategies for age determination of cod (Gadus morhua) sampled at the north Sea international bottom trawl survey. ICES J. Mar. Sci. 77, 859–869. doi: 10.1093/icesjms/fsaa013
Katoh K., Rozewicki J., Yamada K. D. (2018). MAFFT online service: Multiple sequence alignment, interactive sequence choice and visualization. Brief Bioinform. 20, 1160–1166. doi: 10.1093/bib/bbx108
Knudsen S. W., Ebert R. B., Hesselsøe M., Kuntke F., Hassingboe J., Mortensen P. B., et al. (2019). Species-specific detection and quantification of environmental DNA from marine fishes in the Baltic Sea. J. Exp. Mar. Biol. Ecol. 510, 31–45. doi: 10.1016/j.jembe.2018.09.004
Lacoursière-Roussel A., Côté G., Leclerc V., Bernatchez L. (2016). Quantifying relative fish abundance with eDNA: a promising tool for fisheries management. J. Appl. Ecol. 53, 1148–1157. doi: 10.1111/1365-2664.12598
Mahon A. R., Jerde C. L., Galaska M., Bergner J. L., Chadderton W. L., Lodge D. M., et al. (2013). Validation of eDNA surveillance sensitivity for detection of Asian carps in controlled and field experiments. PLoS One 8, e58316. doi: 10.1371/journal.pone.0058316
Maruyama A., Nakamura K., Yamanaka H., Kondoh M., Minamoto T. (2014). The release rate of environmental DNA from juvenile and adult fish. PLoS One 9, e114639. doi: 10.1371/JOURNAL.PONE.0114639
Minamoto T. (2022). Environmental DNA analysis for macro-organisms: Species distribution and more. DNA Res. 29, dsac018. doi: 10.1093/dnares/dsac018
Moushomi R., Wilgar G., Carvalho G., Creer S., Seymour M. (2019). Environmental DNA size sorting and degradation experiment indicates the state of daphnia magna mitochondrial and nuclear eDNA is subcellular. Sci. Rep. 9, 1–9. doi: 10.1038/s41598-019-48984-7
Renshaw M. A., Olds B. P., Jerde C. L., Mcveigh M. M., Lodge D. M. (2015). The room temperature preservation of filtered environmental DNA samples and assimilation into a phenol–chloroform–isoamyl alcohol DNA extraction. Mol. Ecol. Resour. 15, 168–176. doi: 10.1111/1755-0998.12281
Salter I., Joensen M., Kristiansen R., Steingrund P., Vestergaard P. (2019). Environmental DNA concentrations are correlated with regional biomass of Atlantic cod in oceanic waters. Commun. Biol. 2, 1–9. doi: 10.1038/s42003-019-0696-8
Sevilla R. G., Diez A., Norén M., Mouchel O., Jérôme M., Verrez-Bagnis V., et al. (2007). Primers and polymerase chain reaction conditions for DNA barcoding teleost fish based on the mitochondrial cytochrome b and nuclear rhodopsin genes. Mol. Ecol. Notes 7, 730–734. doi: 10.1111/j.1471-8286.2007.01863.x
Sigsgaard E. E., Jensen M. R., Winkelmann I. E., Møller P. R., Hansen M. M., Thomsen P. F. (2020). Population-level inferences from environmental DNA–current status and future perspectives. Evol. Appl. 13, 245–262. doi: 10.1111/eva.12882
Stoeckle M. Y., Adolf J., Charlop-Powers Z., Dunton K. J., Hinks G., Vanmorter S. M. (2021). Trawl and eDNA assessment of marine fish diversity, seasonality, and relative abundance in coastal new Jersey, USA. ICES J. Mar. Sci. 78, 293–304. doi: 10.1093/icesjms/fsaa225
Sward D., Monk J., Barrett N. (2019). A systematic review of remotely operated vehicle surveys for visually assessing fish assemblages. Front. Mar. Sci. 6. doi: 10.3389/fmars.2019.00134
Thalinger B., Wolf E., Traugott M., Wanzenböck J. (2019). Monitoring spawning migrations of potamodromous fish species via eDNA. Sci. Rep. 2019 91 9, 1–11. doi: 10.1038/s41598-019-51398-0
Thompson M. J., Putt R. E., Gettleson D. A., Hammer R. M., Stevens R. C. (1982). “Utilization of remotely operated vehicles (Rovs) for fish survey standing stock assessment,” in Oceans Conference Record (IEEE). 82, 1288–1293. doi: 10.1109/oceans.1982.1151911
Tillotson M. D., Kelly R. P., Duda J. J., Hoy M., Kralj J., Quinn T. P. (2018). Concentrations of environmental DNA (eDNA) reflect spawning salmon abundance at fine spatial and temporal scales. Biol. Conserv. 220, 1–11. doi: 10.1016/j.biocon.2018.01.030
Trenkel V. M., Vaz S., Albouy C., Amour A. B., Duhamel E., Laffargue P., et al. (2019). We can reduce the impact of scientific trawling on marine ecosystems. Mar. Ecol. Prog. Ser. 609, 277–282. doi: 10.3354/meps12834
Tsuji S., Ushio M., Sakurai S., Minamoto T., Yamanaka H. (2017). Water temperature-dependent degradation of environmental DNA and its relation to bacterial abundance. PLoS One 12, e0176608. doi: 10.1371/journal.pone.0176608
Wilcox T. M., McKelvey K. S., Young M. K., Jane S. F., Lowe W. H., Whiteley A. R., et al. (2013). Robust detection of rare species using environmental DNA: The importance of primer specificity. PLoS One 8, e59520. doi: 10.1371/journal.pone.0059520
Wright E. S., Yilmaz L. S., Noguera D. R. (2012). DECIPHER, a search-based approach to chimera identification for 16S rRNA sequences. Appl. Environ. Microbiol. 78, 717–725. doi: 10.1128/AEM.06516-11
Ye J., Coulouris G., Zaretskaya I., Cutcutache I., Rozen S., Madden T. L. (2012). Primer-BLAST: A tool to design target-specific primers for polymerase chain reaction. BMC Bioinf. 13, 134. doi: 10.1186/1471-2105-13-134
Keywords: Environmental DNA (eDNA), quantitative eDNA analysis, bottom trawl sampling, Gadus morhua, North Sea, Baltic Sea, eDNA modeling
Citation: Kasmi Y, Blancke T, Eschbach E, Möckel B, Casas L, Bernreuther M, Nogueira P, Delfs G, Kadhim S, Meißner T, Rödiger M, Eladdadi A, Stransky C and Hanel R (2023) Atlantic cod (Gadus morhua) assessment approaches in the North and Baltic Sea: A comparison of environmental DNA analysis versus bottom trawl sampling. Front. Mar. Sci. 10:1058354. doi: 10.3389/fmars.2023.1058354
Received: 30 September 2022; Accepted: 13 March 2023;
Published: 24 March 2023.
Edited by:
Marty Riche, Florida Atlantic University, United StatesReviewed by:
Luca Mirimin, Galway-Mayo Institute of Technology, IrelandStephan Koblmüller, University of Graz, Austria
Copyright © 2023 Kasmi, Blancke, Eschbach, Möckel, Casas, Bernreuther, Nogueira, Delfs, Kadhim, Meißner, Rödiger, Eladdadi, Stransky and Hanel. This is an open-access article distributed under the terms of the Creative Commons Attribution License (CC BY). The use, distribution or reproduction in other forums is permitted, provided the original author(s) and the copyright owner(s) are credited and that the original publication in this journal is cited, in accordance with accepted academic practice. No use, distribution or reproduction is permitted which does not comply with these terms.
*Correspondence: Yassine Kasmi, eWFzc2luZS5rYXNtaUB0aHVlbmVuLmRl
†These authors have contributed equally to this work