 Alina Blume
 Avi Putri Pertiwi
 Chengfa Benjamin Lee
 Dimosthenis Traganos
- German Aerospace Center (DLR), Remote Sensing Technology Institute, Photogrammetry and Image Analysis Department, Berlin, Germany
Seagrasses are among the world’s most productive ecosystems due to their vast ‘blue’ carbon sequestration rates and stocks, yet have a largely untapped potential for climate change mitigation and national climate agendas like the Nationally Determined Contributions of the Paris Agreement. To account for the value of seagrasses for these agendas, spatially explicit high-confidence seagrass ecosystem assessments guided by nationally aggregated data are necessary. Modern Earth Observation advances could provide a scalable technological solution to assess the national extent and blue carbon service of seagrass ecosystems. Here, we developed and applied a scalable Earth Observation framework within the Google Earth Engine cloud computing platform to account the national extent, blue carbon stock and sequestration rate of seagrass ecosystems across the shallow waters of The Bahamas—113,037 km2. Our geospatial ecosystem extent accounting was based on big multi-temporal data analytics of over 18,000 10-m Sentinel-2 images acquired between 2017-2021, and deep feature engineering of multi-temporal spectral, color, object-based and textural metrics with Random Forests machine learning classification. The extent accounting was trained and validated using a nationwide reference data synthesis based on human-guided image annotation, recent space-borne benthic habitat maps, and field data collections. Bahamian seagrass carbon stocks and sequestration rates were quantified using region-specific in-situ seagrass blue carbon data. The mapped Bahamian seagrass extent covers an area up to 46,792 km2, translating into a carbon storage of 723 Mg C, and a sequestration rate of 123 Mt CO2 annually. This equals up to 68 times the amount of CO2 emitted by The Bahamas in 2018, potentially rendering the country carbon-neutral. The developed accounts fill a vast mapping blank in the global seagrass map—29% of the global seagrass extent—highlighting the necessity of including their blue carbon fluxes into national climate agendas and showcasing the need for more cost-effective conservation and restoration efforts for their meadows. We envisage that the synergy between our scalable Earth Observation technology and near-future nation-specific in-situ observations can and will support spatially-explicit seagrass and ocean ecosystem accounting, accelerating effective policy-making, blue carbon crediting, and relevant financial investments in and beyond The Bahamas.
1 Introduction
One of the most widespread coastal ecosystems is seagrass, a functional group of intertidal and subtidal flowering plants, which can be found in at least 159 countries across all continents except Antarctica (Short et al., 2011; UNEP, 2020). It contributes to animal and human well-being through a variety of ecosystem services, including carbon sequestration, coastal protection, and biodiversity preservation (UNEP, 2020). These services are estimated to have an economic value of US $3,400,000 per km2 per year (Short et al., 2011). Analogous to terrestrial plants, seagrasses photosynthesize to store carbon in their biomass and soil, and therefore act as ‘blue carbon’ sinks and natural climate solutions (Macreadie et al., 2014). They can sequester carbon 35 times faster than tropical rain forests and account for up to 10% of the annual oceanic carbon burial, while only covering 0.2% of the ocean floor (Mcleod et al., 2011; Fourqurean et al., 2012; Duarte et al., 2013; Macreadie et al., 2015). More than 90% of the sequestered carbon is stored within the underlying soil, where it can be sustained for millennia due to anoxic conditions, vertical sediment accretion, and slow composition rates (Mcleod et al., 2011; Fourqurean et al., 2012; Macreadie et al., 2012; Duarte et al., 2013). Globally, the soil of seagrasses alone is estimated to store up to 8.4 Pg carbon (Fourqurean et al., 2012).
Seagrasses’ ability to reduce atmospheric carbon dioxide concentrations supports the Paris Agreements’ goal of limiting the global average temperature rise to below 1.5°C above pre-industrial levels (UNFCCC, 2016). However, the importance of integrating seagrass blue carbon into national climate agendas like the Nationally Determined Contributions (NDCs) remains largely overlooked (Dencer-Brown et al., 2022). Out of the 159 countries in which seagrasses grow, only 13 countries explicitly recognise seagrasses in their mitigation and/or adaptation strategies (UNEP, 2020; Cabo Verde, 2021; Republic of Seychelles, 2021; The Government of Mozambique, 2021). Moreover, this ecosystem has been declining globally at a rate of 1-2% per year since 1880, yet only 26% of its area lies within Marine Protected Areas (MPAs) (Waycott et al., 2009; UNEP, 2020; Dunic et al., 2021). Habitat loss is driven by a number of human and climate change induced factors like coastal development, boating, increased urban/agricultural run-off, sea level rise, and increased ocean temperatures (Waycott et al., 2011; Grech et al., 2012; Saunders et al., 2013).
The lack of recognition and protection arises from insufficient knowledge of spatially explicit seagrass distribution and related carbon accounts, especially in remote and/or data-poor areas (McKenzie et al., 2020; Macreadie et al., 2021). Recent advances in Earth Observation utilize high temporal and spatial resolution satellite data archives, cloud computing, and machine learning to minimize mapping uncertainties (Lyons et al., 2020; Traganos et al., 2022a; Traganos et al., 2022b). This provides an alternative to traditionally expensive and time-consuming surveying methods (Hossain et al., 2015; Veettil et al., 2020). The incorporation of country-scale seagrass carbon data with high-quality mapping products supports the assessment of the seagrass ecosystems’ importance and its implementation into national climate agendas, and benefits relevant seascape management and conservation efforts (Roelfsema et al., 2014; McKenzie et al., 2020; Traganos et al., 2022b).
In this study, we aim to minimize the aforementioned data gaps by producing physical accounts of spatially explicit seagrass extent, carbon stock and sequestration rate for The Bahamas. For this, we developed a cloud-native Earth Observation framework using the cloud computing platform Google Earth Engine (GEE), multi-temporal high-resolution Sentinel-2 archives, and the machine learning classifier Random Forest (Breiman, 2001). The generated maps were combined with country- and region-specific in-situ carbon data to evaluate the importance of the seagrass ecosystem for the NDCs of The Bahamas.
2 Methods
2.1 Study site
The Bahamas is one of 13 countries which recognize seagrass in their NDCs, and the first one which set a measurable target—protecting 20% of their nearshore marine environment by 2020 (The Government of the Bahamas, 2015). The Bahamian archipelago consists of about 700 carbonate islands and is located in the tropical Western Atlantic (Buchan, 2000; The Commonwealth, 2022). Its coastline stretches along 3,542 km and its Exclusive Economic Zone covers an area of approximately 619,785 km2 (Dataset ChartsBin statistics collector team, 2010; Flanders Marine Institute, 2019). Almost 20% of the Bahamian seascape is shallow with water depths under 25m (Landfall, 2021). It features coastal habitats like coral reefs, mangrove forests and seagrass beds (Mandoske, 2017). According to the best available information seagrasses cover an area between 26,400 and 56,930 km2 (Schill et al., 2021; Dataset Allen Coral Atlas, 2022). The three main Bahamian seagrass species are Thalassia testudinum, Syringodium filiforme, and Halodule wrightii (Buchan, 2000; Green and Short, 2003; Dierssen et al., 2010). Low energy sites on San Salvador Island have been found to be dominated by the dense seagrass species of Thalassia testudinum, while the sparse species (Syringodium filiforme and Halodule wrightii) dominate higher-energy sites (Smith et al., 1990; Dierssen et al., 2010). Higher density seagrass species feature higher biomass and productivity (Buchan, 2000; van Tussenbroek et al., 2014).
2.2 Data
2.2.1 Earth Observation data
For our country-scale seagrass mapping procedure, we processed four years’ worth of Sentinel-2 (S2) Bottom Of Atmosphere (Level 2A) imagery at 10m spatial resolution, acquired between March 28th, 2017 and March 28th, 2021 and available in GEE. The employed archive consists of 18,881 single 100x100-km tiles, covering an area of 633,063 km2 (the country’s Exclusive Economic Zone + land area).
2.2.2 Reference data
Our mapping procedure utilizes reference data of four coastal habitat classes: Seagrass, Sand, Coral/Algae and Rock/Rubble. These classes were selected following the requirements for remotely sensed benthic habitat classification of Kennedy et al. (2021).
Training data were assembled through a combination of expert-guided photo interpretation using the pre-processed S2 composite (Section 2.3.1 and Figure 4A) and modified seagrass mapping results of the Allen Coral Atlas (Dataset Allen Coral Atlas, 2022). Validation data were based on multiple data sources leveraging field data acquisitions with remotely sensed covariates, aggregated throughout the entire Bahamas (Roelfsema et al., 2021). Section 2.3.2 describes the pre-processing and modification of the reference data before sample points were taken.
2.2.3 Carbon data
We conducted a systematic literature review of seagrass blue carbon data before calculating areal carbon stock ranges and sequestration rates. A combination of keywords (locations, ‘seagrass’, species, ‘(blue) carbon’, ‘soil carbon’ ‘biomass’, ‘sequestration’) was used to identify relevant articles. These were then screened for region- or species-specific data ranges and discarded when only averaged numbers for biomass and carbon stocks were stated.
The collected data were harmonized to calculate areal carbon stock ranges, which equal the sum of above-ground biomass (AGB) carbon, below-ground biomass (BGB) carbon, and soil carbon. Harmonization efforts were based on an AGB : BGB ratio of 1:2 and a biomass carbon to dry weight biomass ratio of 1:2.86 (Fourqurean et al., 2012). Final ranges were calculated after creating species-specific ranges, and the prevalence of species was taken into account to prevent incorrect weighting. Due to the lack of country-specific soil carbon data, a bioregional average was used (Fourqurean et al., 2012). Areal sequestration potentials of Bahamian seagrasses were based on averaged in-situ data.
2.3 Cloud-based Earth Observation framework
Our developed cloud-based Earth Observation framework features a plethora of successive big satellite and reference data analytics which transform pixels into nationwide seagrass ecosystem accounts (Figure 1). These big data analytics are split into three main technological pillars within our framework: (a) Multi-temporal Sentinel-2 Composition (2.3.1), (b) Training and Validation Data Harmonisation (2.3.2), and (c) Supervised Machine Learning Classification (2.3.3).
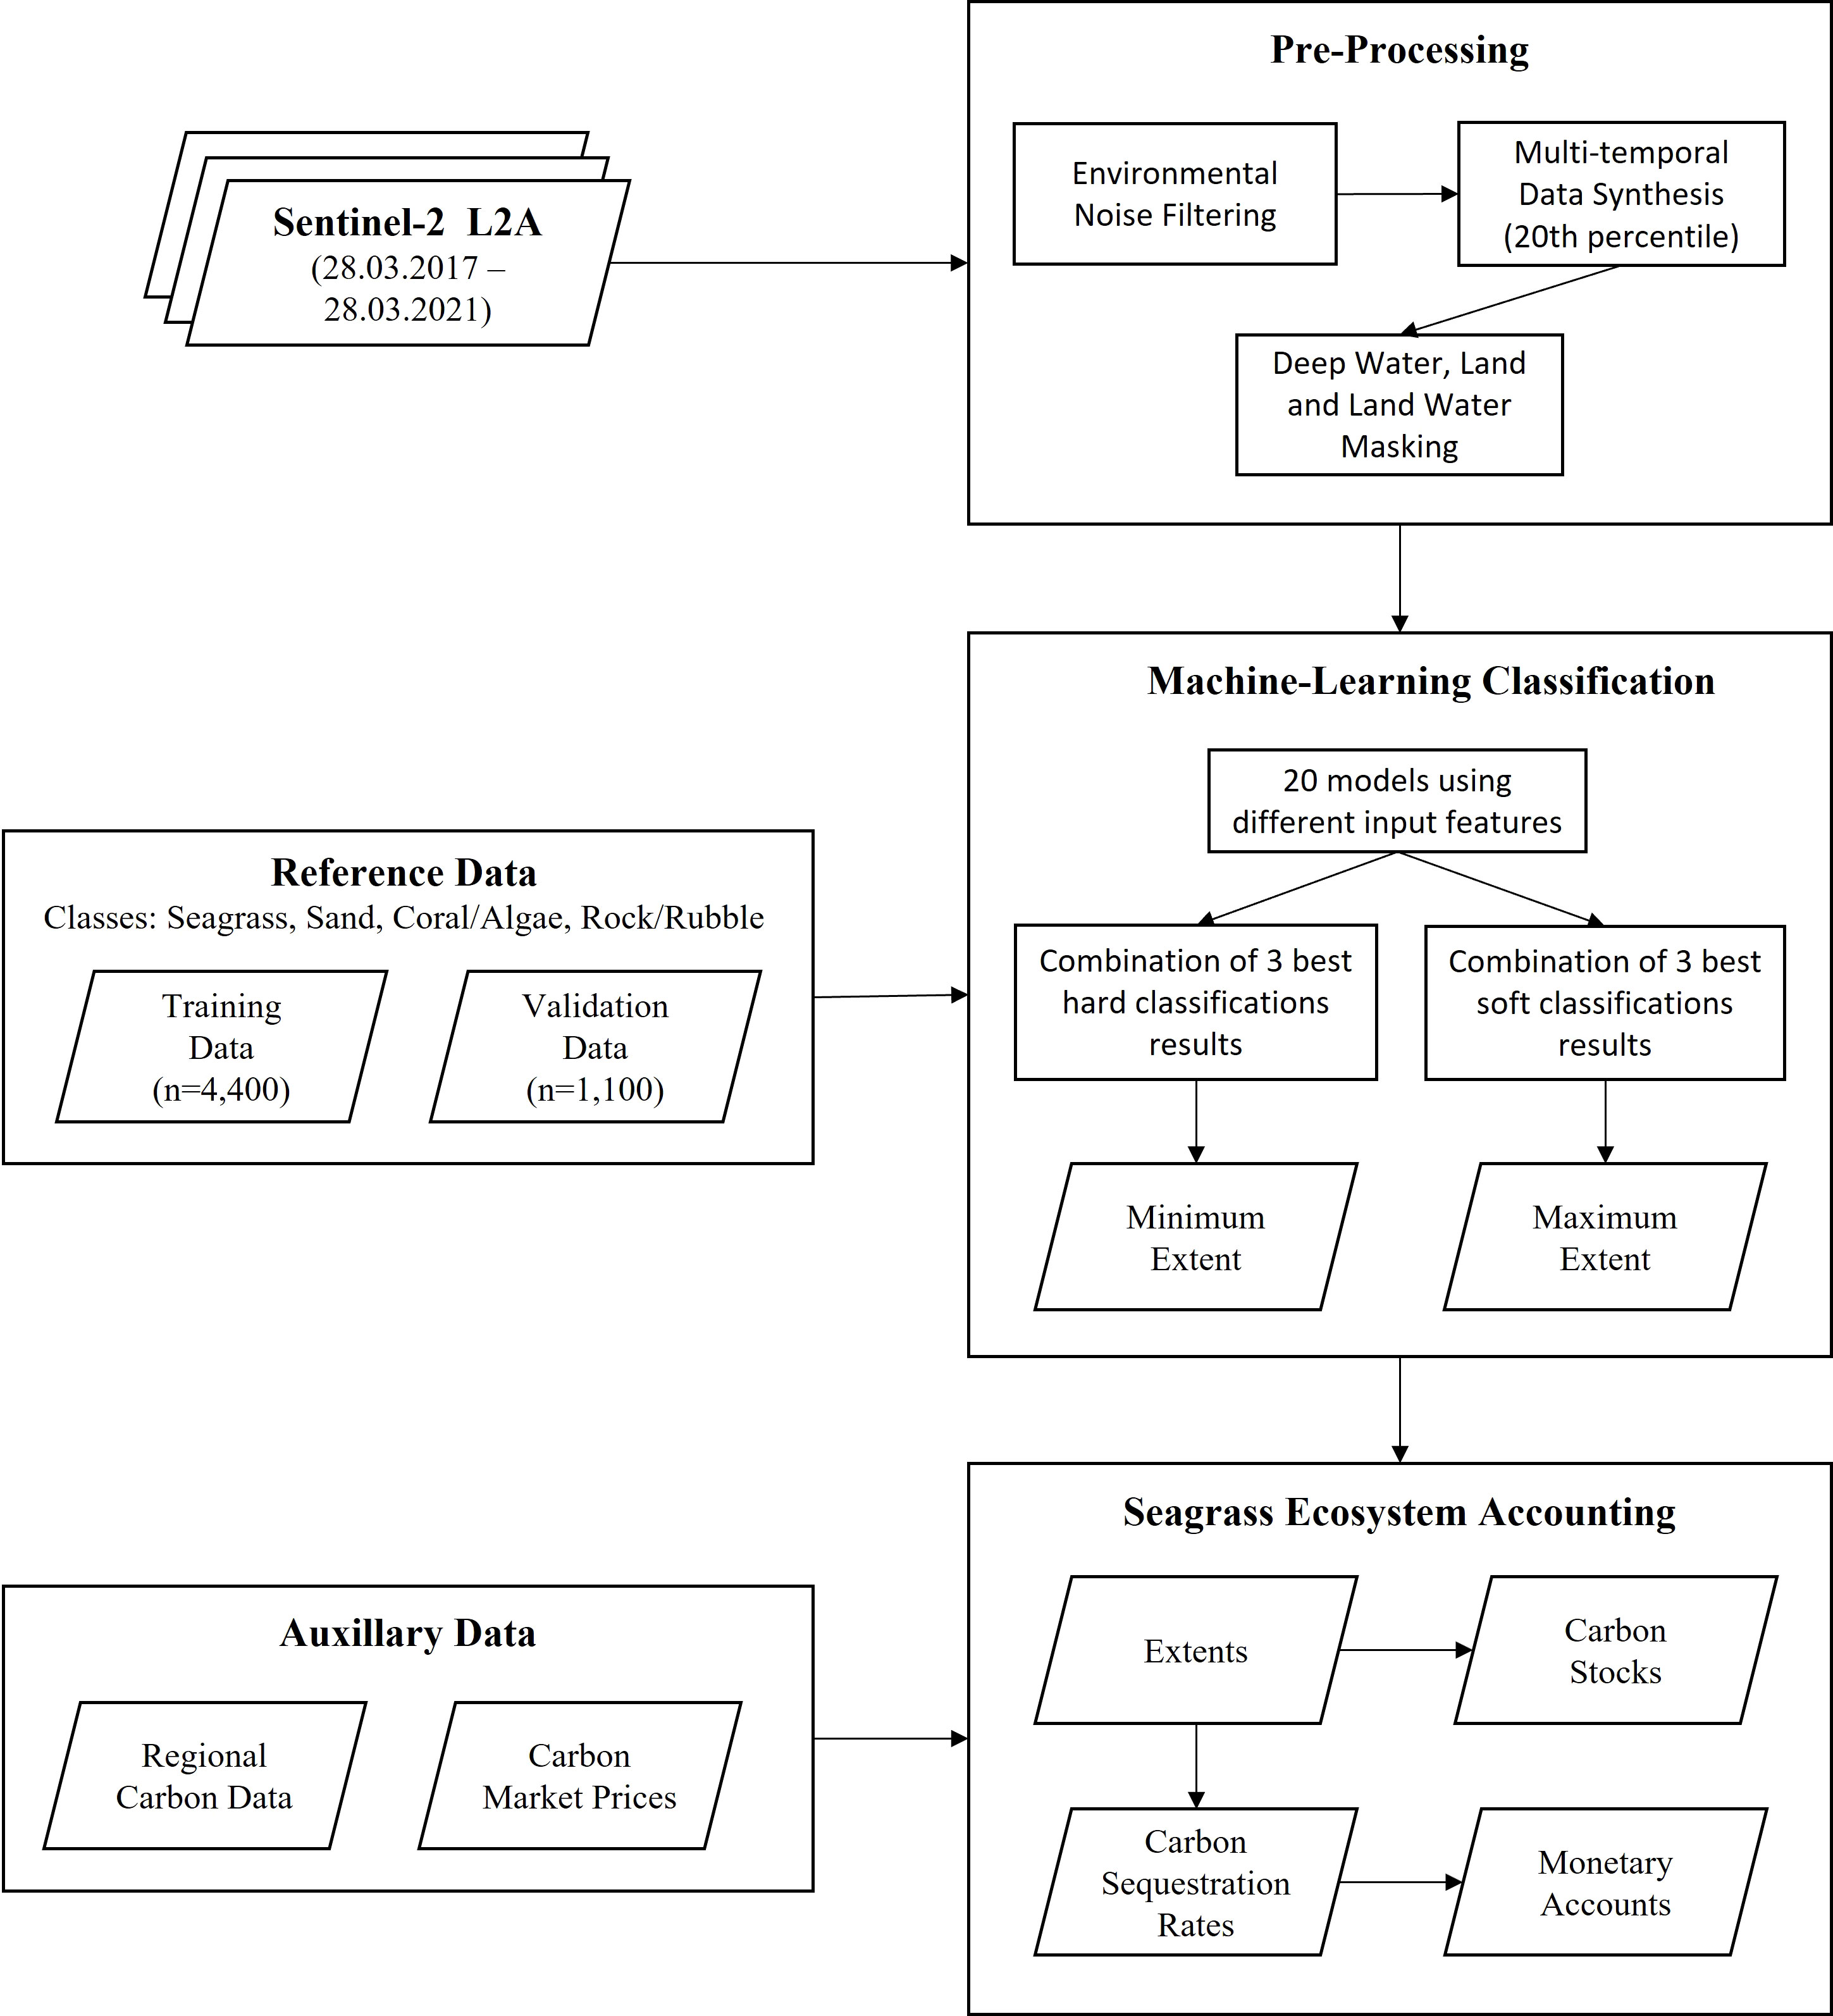
Figure 1 Schematic workflow of the cloud-native Earth Observation seagrass ecosystem accounting framework.
2.3.1 Multi-temporal Sentinel-2 composition
To create a high-quality S2 composite of the entire optically shallow water area of The Bahamas, the archive described in Section 2.2.1 was filtered for images with minimum cloud coverage and sun glint effects. To reduce the possibility of sun glint, images with a mean solar zenith angle of more than 70% were discarded. The collection was further filtered for cloud coverage, retaining images with a cloudy pixel percentage under 25%. This reduced the size of the S2 archive to 9,909 single tiles (52% of the original amount). After joining the archive with the corresponding S2 Cloud Probability dataset1, pixels with a cloud probability over 30% were masked. Moreover, the QA60 and Scene Classification Map bands were utilized to discard pixels featuring cloud shadows, and opaque and cirrus clouds (Louisand L2A Team, 2019). The filtered archive was then statistically reduced to a single multi-temporal composite using the 20th percentile of each pixel’s spectral value. This approach further reduces high-reflectance obstacles like remaining clouds and sun glint effects, waves, turbidity, and haze (Thomas et al., 2021; Traganos et al., 2022b). To further minimize misclassification, optically deep water, land and land water pixels were masked. The combined Otsu-thresholding and Canny edge filter method of Donchyts et al. (2016) was applied to the Modified Normalised Difference Water Index (MNDWI) to differentiate land from coastal waters (Xu, 2006). Optically deep waters were masked using Otsu-thresholding of the MNDWI and Shallow Water Index (Otsu, 1979; Traganos and Reinartz, 2018; Alkhatlan et al., 2019). All thresholding methods were based on suitable image subsets which allowed for a strong bi-modal histogram distribution and therefore better masking results. Input parameters like the Canny edge sensitivity threshold and the number of buckets for the Otsu-histograms were chosen based on an iterative approach (Traganos et al., 2022b). Land water bodies were masked using an edited version of the Global Administrative Unit Layers 2015 (Dataset FAO UN, 2014). The resulting optically shallow S2 composite was transformed to the below-surface remote sensing reflectance (rrs) following Lee et al. (1998) and Traganos and Reinartz (2018).
We improved the model accuracy by incorporating a variety of features as the raster input for the classification: Simple Non-Iterative Clustering (SNIC)-based statistical properties, selected Gray-Level Co-occurrence Matrix (GLCM) layers of the first five bands, Hue, Saturation, and Value (HSV) of bands 2 to 4, and the first three eigenvalues of a Principal Component Analysis (PCA)2 (Hassanein et al., 2018; Tassi and Vizzari, 2020; Google Earth Engine, 2022). We ran a Random Forest variable importance measure (VIM) of the GLCM layers to select the ten most important properties and eliminate the least relevant layers for the classification. These properties were then used as a base for the PCA. All additional layers were stacked together with the derived rrs band layers.
2.3.2 Training and validation data harmonisation
We converted the validation and training data vectors into rasters of 10-m resolution and concatenated them with the corresponding S2 pixel values. To minimize the creation of mixed pixels through this approach, we used the minimum and the 80th percentile of the seagrass validation data to filter both validation and training data. This reduces the number of high-reflectance mixed pixels which are likely to represent a combination of the sand and seagrass habitat. Moreover, it harmonizes training and validation data by discarding training data pixels that do not fall into the spectral properties of the validation data. To prevent spatial auto-correlation between training and validation data, a 2,000m buffer was applied around the validation data and used as a mask for the training data. Figure 2 shows the spectral ranges of all four classes of the training and validation data.

Figure 2 Spectral ranges of the training and validation data for the first five multi-temporal Sentinel-2 below-surface reflectance (rrs) bands. [sr-1] denotes the unit of the below-surface remote sensing reflectance.
2.3.3 Supervised machine learning classification
We designed 20 different supervised classification frameworks which were based on different input features (Supplement Table S1, S2) and the ensemble machine learning classifier RF. This classifier incorporates multiple self-learning decision trees and is robust against noise and outliers (Breiman, 2001). Following Lyons et al. (2020), the number of seeds was set to 42 and the number of trees to 15.
Each framework was based on training and validation points aggregated across the same locations (Figure 3). The RF classifier was trained using 2,000 seagrass data points and 800 points per non-seagrass class (sand, coral/algae, and rock/rubble). The validation data were based on 500 seagrass data points and 200 points per non-seagrass class. Due to the main focus of this work being the detection of seagrass, non-seagrass classes were later merged into one class to create a binary accuracy assessment.
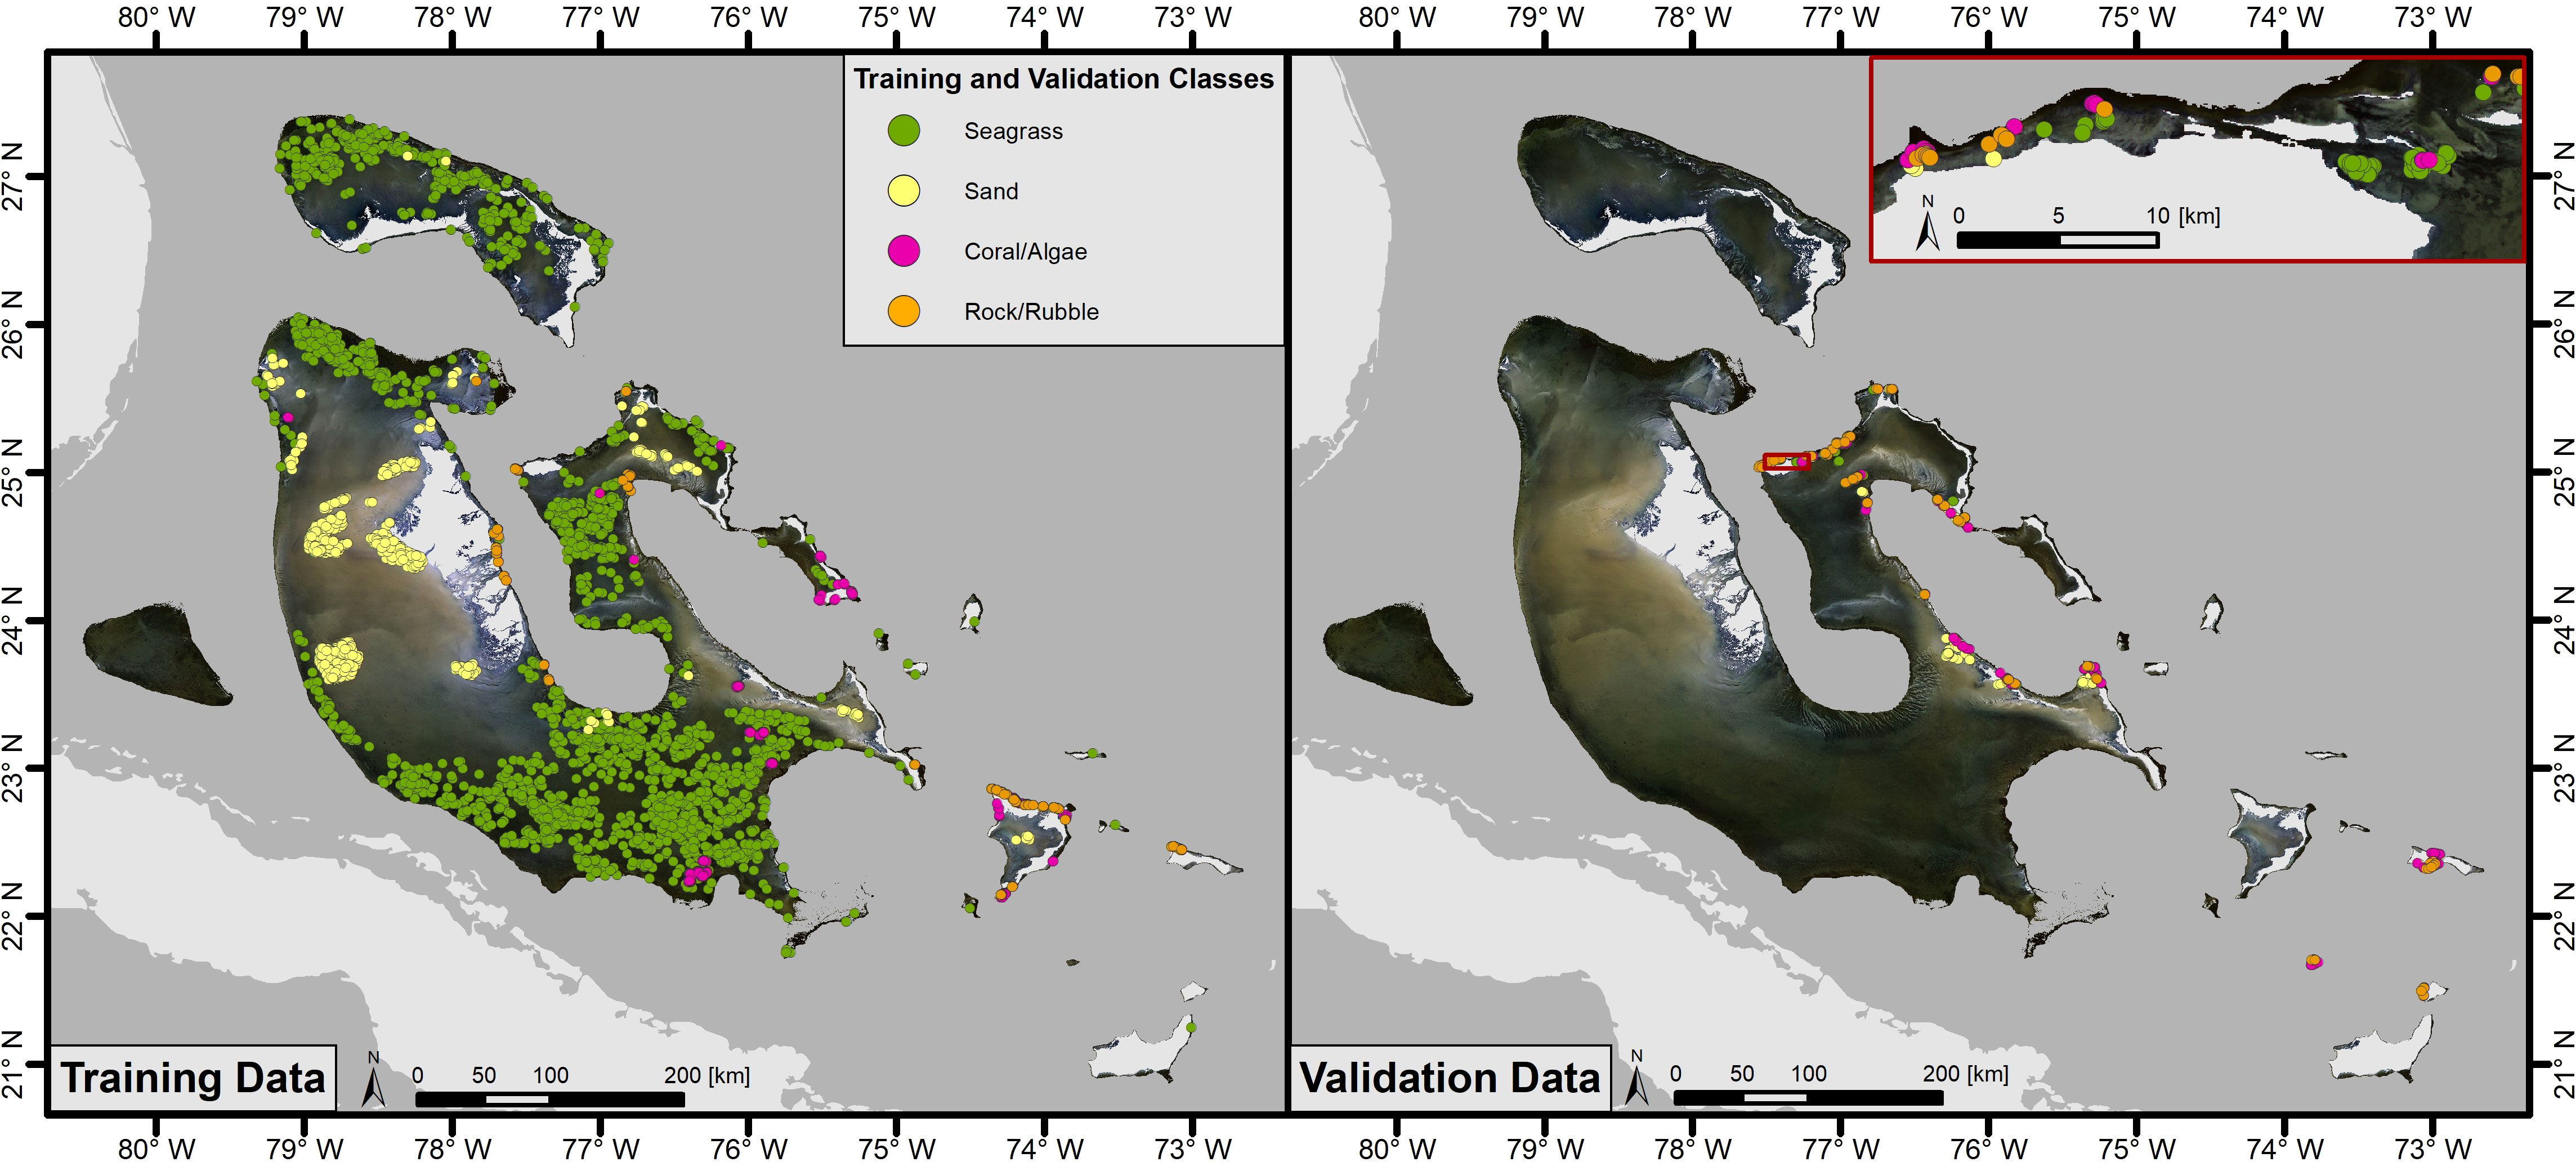
Figure 3 Distribution of the 4,400 training data and 1,100 validation data points of the four classes used in the supervised machine learning classification.
The final results for the seagrass ecosystem extent were created by combining multiple classification frameworks. First, a hard classification of each framework was used to identify the three models with the highest F1-scores (the harmonized mean of producer’s and user’s accuracy) for seagrass. The corresponding maps of seagrass versus non-seagrass were then composed using the most common class per stacked pixel (ee.ImageCollection.mode) (Google Earth Engine, 2022). The resulting map equals the maximum seagrass ecosystem extent. Next, classification frameworks with F1-score for seagrass over 70% were used to generate per-pixel probabilities for each class—the so-called soft classification. Pixels which featured seagrass as the most probable class and which reached probabilities over 50% were assigned to seagrass. Akin to the maximum seagrass extent creation, the three frameworks with the highest F1-scores for seagrass were composed and the resulting map equals the minimum seagrass ecosystem extent. In the post-processing stage, we visually assessed the classification results and manually masked out optically deeper waters which were misclassified as seagrass.
2.3.4 Accuracy assessment
The accuracy of the Bahamian seagrass ecosystem extent was assessed using the metrics of overall accuracy (OA), producer’s accuracy (PA), user’s accuracy (UA), and the F1-score through error matrices based on 1,100 validation points for both the seagrass and non-seagrass class (Story and Congalton, 1986).
2.4 Blue carbon accounting
2.4.1 Physical accounting
Bahamian seagrass carbon stock ranges were calculated by multiplying our estimated minimum and maximum seagrass ecosystem extent with the corresponding areal carbon stock range (Supplement Table S3). We ran both Tier 1 and Tier 2 assessments following Howard et al. (2014). These assessments represent different levels of certainty, with Tier 1 featuring the highest uncertainty based on the use of published IPCC globally averaged carbon estimates. Tier 2 incorporates regional and/or county-specific carbon data (Section 2.2.3), therefore featuring reduced uncertainties (Howard et al., 2014). Seagrass carbon sequestration rates were calculated based on our calculated minimum and maximum seagrass ecosystem extent, and country-specific average sequestration rates.
2.4.2 Monetary accounting
We estimated the yearly monetary value of Bahamian seagrass blue carbon sequestration based on the European (European Commission, 2022) and California (C2ES, 2022) carbon credit market). Prices were acquired from Carbon Credits (Carbon Credits, 2022) on the 13th September, 2022 at 3.10pm and converted to EUR (Oanda, 2022). The European carbon credit market price for one ton of CO2 was 67.71 EUR, while the California market price was 26.93 EUR.
3 Results
3.1 Ecosystem extent accounting
Figure 4 displays the mapped minimum and maximum extent of the seagrass ecosystem for Bahamian shallow waters at 10m resolution. Seagrasses cover an area between 39,210 and 46,792 km2, which equals 6 to 8% of the country’s Exclusive Economic Zone, and 35 to 41% of its optically shallow area. About 9 to 11% of the ecosystem lies within Marine Protected Areas (Dataset UNEP-WCMC, S.F, 2021).
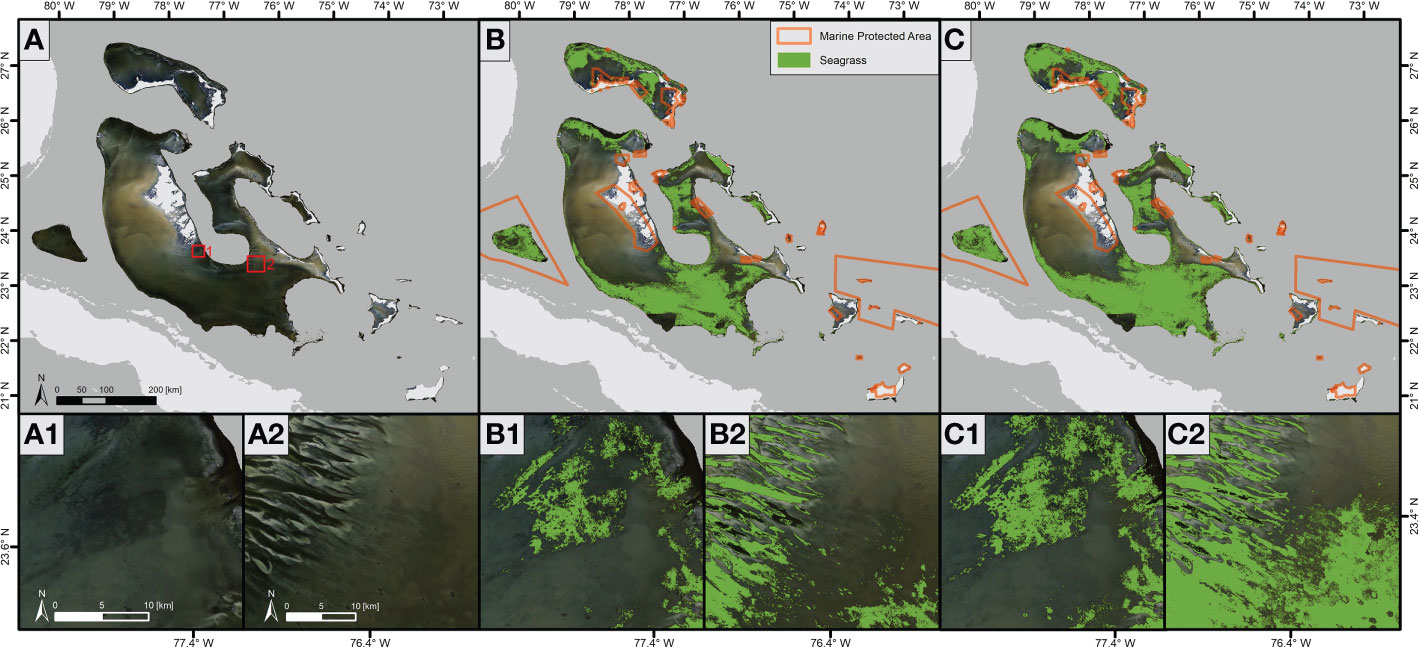
Figure 4 False-color Sentinel-2 composite (Bands 3-2-1) (A) overlaid with the mapped minimum (B) and maximum (C) seagrass extent, and Marine Protected Areas across The Bahamas. The location of the zoomed-in insets (A1) - (C2) is shown in panel (A).
Our mapping frameworks for minimum and maximum extent reach OAs of 71.00 and 76.55%, respectively. F1-scores for seagrass extent are at 61.71 and 74.76%, PAs at 51.40 and 76.40%, and UAs at 77.18 and 73.18%, respectively. Accuracies for the non-seagrass class can be found in the Supplementary Tables S4 and S5.
3.2 Blue carbon accounting
3.2.1 Physical accounting
Based on our classified ecosystem extent and the globally averaged aerial carbon estimates of the Tier 1 assessment, Bahamian seagrass can store between 35.7 million and 3.9 billion Mg C. Using the region-specific carbon data of the Tier 2 assessment, we estimate a Bahamian seagrass carbon storage of 594 to 723 million Mg. Moreover, we estimate that the classified ecosystem extent can sequester between 103 and 123 Mt CO2, annually. Therefore, in 2018, Bahamian seagrasses had the potential to remove 57 to 68 times their annual CO2 emissions (Friedlingstein et al., 2020).
3.2.2 Monetary accounting
At a European carbon market price of 67.71 EUR per ton of CO2, Bahamian seagrass carbon sequestration is valued at 178,296 EUR per km2 per year. This, combined with our classified ecosystem extents, translates to a total sequestration potential value of 6.99 billion to 8.34 billion EUR per year. The California carbon market price of 26.93 EUR per t CO2 results in a yearly sequestration potential value of 70,913 EUR per km2 and a total sequestration potential value of 2.78 billion to 3.32 billion EUR per year.
4 Discussion
4.1 National seagrass ecosystem accounts in The Bahamas
Leveraging our cloud-based, multi-temporal Earth Observation ecosystem accounting framework with country and region-specific reference data inventories, we produced the first national high-resolution (10m), spatially-explicit, ecosystem accounts of seagrass extent, carbon stock, and sequestration rate for The Bahamas, across more than 113,000 km2 of shallow seafloor (Figure 3). Featuring a multitude of cutting-edge technological novelties—big satellite and reference data analytics, machine learning, cloud computing and dense feature engineering—we mapped up to 46,792 km2 of nationwide seagrass meadows with an observed F1-score of 74.76% (Figure 4). Utilizing region-specific seagrass carbon data, this spatially-explicit extent translates to a Tier 2 blue carbon assessment up to 771.4 million Mg C and an annual blue carbon sequestration rate of 123 Mt CO2 (Table 1). The second most important finding is that our seagrass ecosystem accounting efforts enrich our previously published research in 27 different tropical and temperate countries across the Mediterranean, East Africa and the Western Indian Ocean (Lee et al., 2022; Traganos et al., 2022a; Traganos et al., 2022b). The common denominator of all 28 national seagrass ecosystem accounting endeavors is the utilization of a standardized technological Earth Observation framework which supports an effective qualitative and quantitative comparison of its yielded physical accounts by minimizing both technological and environmental differences.
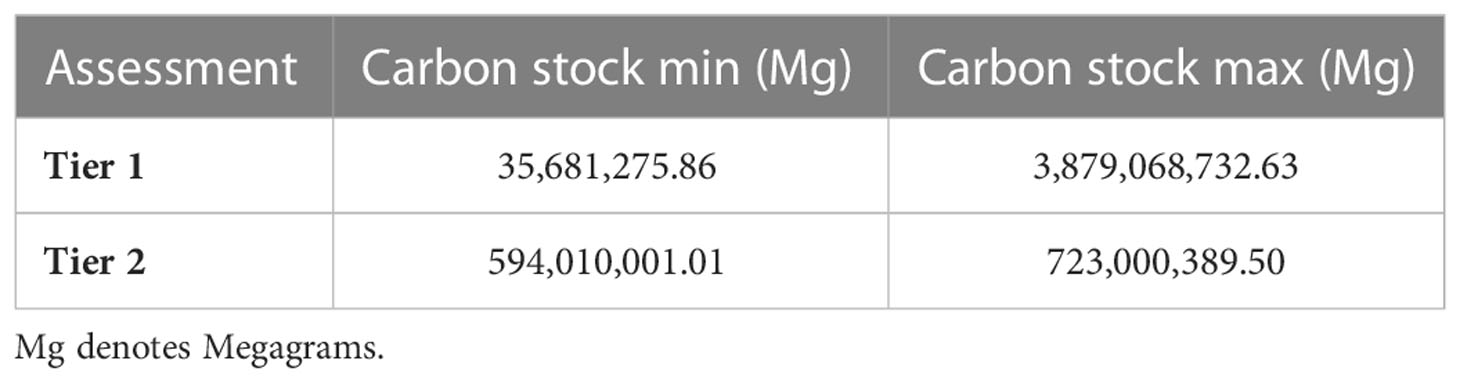
Table 1 Tier 1 and 2 carbon stocks for the classified minimum and maximum seagrass ecosystem extent.
4.2 Mapping comparisons
In a global context, our maximum mapped seagrass extent shows that The Bahamas features the second largest seagrass meadow area after Australia (74,555 km2). It is nearly three times larger than the Cuban seagrass meadow area, which represents the third largest seagrass habitat in the world (16,073 km2). Moreover, our mapped maximum extent represents ~29% of the global seagrass extent (McKenzie et al., 2020).
Zooming in on the Bahamian EEZ, our remotely sensed seagrass extents can be quantitatively compared to five existing nationwide seagrass areal estimates—three of which have been calculated using moderate to high-resolution satellite image archives resulting in equally spatially-explicit Bahamian seagrass extents.
In the first-ever national-scale seagrass mapping effort, Wabnitz et al. (2008) employed the 30-m satellite image archives of Landsat 5 TM and 7 ETM+ to map 65,436 km2 of nationwide dense and sparse seagrass meadows in The Bahamas; 33.2% more than our maximum seagrass extent. Based on their reported PAs and UAs, and the consensus that tropical seagrass beds are generally stable in their extent, we infer that the areal deviation might have been induced by technology: the 30-m spatial resolution of Landsat sensors results in a nine-times greater mapping unit (900 m2) than the 10-m Sentinel-2 data (100 m2). This means that one potentially misclassified seagrass pixel at 30 m would equal nine misclassified pixels at 10 m, amplifying the overestimation of the former mapping endeavor and reflecting the shortcoming of national seagrass extent mapping in Greece (Traganos et al., 2018). The two most recent spatially coincident mapping efforts utilized the 5-m PlanetScope image archive and a similar state-of-the-art Earth Observation framework to map between 26,3543 and 53,930 km2 of Bahamian seagrass meadows (Schill et al., 2021). Our minimum and maximum seagrass extents fall within the estimated range of the two aforementioned efforts. We, however, infer that the narrower quantitative differences between our nationwide extent and these two estimates are induced more by environmental factors (e.g., challenging discrimination between seagrasses and hard bottom algae of variable densities and, thus, spectral properties)—and less by technological factors like the difference in the mapping units of Sentinel-2 (100 m2) and PlanetScope (25 m2).
On the other hand, both remaining non-spatially-explicit estimates by UNEP-WCMC and Short (2018) and McKenzie et al. (2020) feature wide underestimating trends—2,227 and 2,250 km2, respectively—approximately one order of magnitude less than our mapped minimum seagrass extent of 39,210 km2. This observation corroborates our recent findings in the Mediterranean and East Africa (Traganos et al., 2018; Traganos et al., 2022a; Traganos et al., 2022b) reflecting the potential biases introduced by the utilization of non-data-driven and non-nation-specific mapping designs in blue carbon and, more broadly, coastal ecosystem accounting at both the physical and monetary level in and beyond The Bahamas (Bertram et al., 2021). We expand more into this latter issue in Section 4.4, namely the downstream implication regarding the uptake of such accounts in policy and financial crediting frameworks. It is important to note that all of the mapping comparisons were regionally-aggregated mapping efforts, at a minimum, which might have introduced biases due to the differences in spatial scales with the national scale of The Bahamas—in contrast to our nationally-aggregated seagrass extent account.
4.3 Current uncertainties
As every novel remote sensing assessment based on research and development, our presented and utilized ecosystem accounting framework is characterized by certain biases and uncertainties, induced by environmental and technological factors, including the reference data in use.
Despite our testing of an intensive feature engineering of pixel, object, colour and texture features (Section 2.3.1) and reference data normalization (Section 2.3.2) in our RF supervised machine learning models (Section 2.3.3), our seagrass ecosystem extent accounting was impacted by misclassifications mainly due to mixed pixels, spectral confusion between certain classes, and larger water depths. As shown in Supplementary Tables S1 and S4, which indicate PAs and UAs of both maximum seagrass and non-seagrass distribution, our tested models feature a somewhat solid balance between PAs and UAs for the seagrass class, with PAs consistently being 3-5% greater than UAs. Even the use of Bands 1-5 as the only input features in our RF machine learning experiments explain the variability in both classes, as demonstrated by their larger PA than UA (77.6 vs 73.1%). This shows that our machine learning feature engineering was already complex enough, as was the mode of the best models (Supplementary Table S1). Yet a greater PA means that our maximum seagrass extent is slightly overestimated while we observe an underestimation of ~1.4% of the merged class of coral/algae, sand, rocks and rubble. Additional biases might have been introduced due to the issue of mixed pixels owing to the spectral similarity between seagrasses and the mixed coral/algae class across the first Sentinel-2 bands (Figure 2), as well as the coarse mapping unit of 100 m2 which is potentially unable to capture sparser seagrass meadows. Such spectral confusion and mixed pixels’ impedance situation have been also observed across 5 to 30-m resolution optical remote sensing endeavors in The Bahamas (Wabnitz et al., 2008; Schill et al., 2021).
To test whether an improved training data design would benefit our seagrass extent ecosystem accounting, we ran a metadata analysis applying more accurate training data annotation for the seagrass and coral class following the suggestions of C. Roelfsema (personal communication, 10 August 2019). This analysis yielded qualitatively more accurate minimum and maximum Bahamas-wide seagrass extents of 55,388 and 64,481 km2, respectively, and are closer to the national estimates of Wabnitz et al. (2008) and Schill et al. (2021). While the PA of the new maximum seagrass extent is identical to the original maximum one, the UA of the new maximum estimate dropped by 5.7% (Supplementary Table S6). This means that we introduced greater spectral variability in the seagrass training data points compared to the ones contained in the respective validation data points, which resulted in a greater overestimation of the Bahamian seagrass meadows. This indicates the need for more fit-for-purpose, i.e., spatially and temporally richer, in situ validation data points to improve coastal ecosystem accounting efforts using Earth Observation, like ours, highlighting the logistical importance of allocating more funding towards such high-quality field data collections.
The articulation of the various biases in our seagrass extent accounting is important because it justifies cascading biases in our blue carbon accounting. Utilizing the Tier 1 seagrass carbon assessment, and, thus, globally-averaged carbon values, results in a 100-fold difference between the minimum and maximum blue carbon stocks for Bahamian seagrasses. Utilizing the Tier 2 assessment, region-specific total seagrass carbon stocks and bioregional averages, the range is narrowed to just a percentage difference of around 24.2% (Table 2). Despite the lack of country-specific seagrass soil carbon data in our blue carbon accounting, the Tier 2 maximum estimate (771.4 million Mg C) is only 3.8% lower than the only other existing nationwide seagrass blue carbon stock estimate (801.4 million Mg C; Mandoske, 2017) which relied on a Landsat 7-derived seagrass extent (57,481 km2) and biophysical modeling. Yet, seagrass blue carbon features wide-ranging variability (due to e.g., soil carbon depth, density, patchiness, edge effects, proximity to the coastline, mangroves and tidal flats, seagrass bathymetry, species, sediment, inter-annual productivity). Added to the considerable contribution of Bahamian seagrass meadows to mitigate carbon emissions within the country, according to our accounting, new intensive field data collections of blue carbon stocks and fluxes, and respective blue carbon accounting should be established to improve our current estimates and support their effective uptake into current policy-making and carbon crediting frameworks for The Bahamas.
4.4 Applications of blue carbon accounting using Earth Observation
The synergy of Earth Observation technology and Ecosystem Accounting has more recently showcased promising results towards quantifying the nationwide natural climate solutions of blue carbon ecosystems4 (Traganos et al., 2022a; Traganos et al., 2022b).
Our targeted case study area, The Bahamas, is the first country to include an explicit reference to seagrasses in its NDC and set a measurable target for the protection of its nearshore marine ecosystems—20% by 2020 (The Government of the Bahamas, 2015). Our spatially explicit seagrass ecosystem accounting for The Bahamas fills a significant mapping blank in the global estimates of seagrass extent, blue carbon stocks and sequestration rates. According to our accounts and the best available global estimates, Bahamian seagrass meadows potentially comprise up to 29% of the global seagrass area (McKenzie et al., 2020) and store up to 18.3% of the global seagrass blue carbon stocks (Fourqurean et al., 2012). These data turn the spotlight on The Bahamas as a global hot spot of seagrass distribution and blue carbon pool. More importantly, they provide a comprehensive and transparent basis for the uptake of seagrass meadows into Multilateral Environmental Agreements (e.g., NDC, MPAs, etc.) and blue carbon crediting mechanisms5 (Macreadie et al., 2022). Here, we estimated that in 2018 Bahamas-wide seagrasses could sequester at least 57 times the annual carbon dioxide emissions of the country (Friedlingstein et al., 2020) with a potential annual value of at least 70,913 EUR/km2. Yet, only up to 11% of these highly-productive seagrass meadows lie within the current MPAs of The Bahamas (Figure 4; UNEP-WCMC, 2021). The Bahamas and countries with equally extensive blue carbon ecosystems should establish long-term monitoring systems and policy-making strategies using the recent blueprint seagrass extent and blue carbon mapping project of Seychelles—the first to leverage dense Earth Observations and nationally aggregated field data to account and incorporate nationwide seagrasses into the NDC and climate change mitigation efforts (Lee et al., 2022).
4.5 Next steps
Our Bahamian seagrass ecosystem accounting increases the total mapped seagrass extent of DLR’s Global Seagrass Watch project to around 76,000 km2 across more than 306,000 km2 of mapped seabed, 74,000 km of coastline in 28 temperate and tropical countries, and three seagrass bioregions (Lee et al., 2022; Traganos et al., 2022a; Traganos et al., 2022b). All of these high-resolution spatially explicit seagrass ecosystem extent accounts are produced through an ever-advancing standardized Earth Observation framework. Here, the two main advances are the synthesis of a harmonized nationally-aggregated reference dataset and deep feature engineering for the machine learning classification component. These resulted in qualitative and quantitative improvements in our nationwide seagrass mapping in contrast to our initial mapping endeavors in the Mediterranean and East Africa.
There are still considerable yet well-mapped showstoppers and uncertainties towards mainstreaming the natural climate solutions of blue carbon ecosystems to the biodiversity, societies and economies (Section 4.3; Macreadie et al., 2019; Macreadie et al., 2022; Williamson and Gattuso, 2022). While we showcase here that the state-of-the-art of Earth Observation technology can now provide scalability, confidence, and repeatability in blue carbon accounting, there is a notable lack of high-quality nation-specific in situ data on seagrass distribution, blue carbon stocks, and fluxes. Such data gaps impede the transparency, standardization and funding of long-term blue carbon accounting systems and their much-needed high-quality scalable insights. We envisage that these holistic monitoring systems could benefit from the amalgamation of Earth Observation technology, Ecosystem Accounting, biophysical and socio-economic modeling, and targeted nationally aggregated field data collections. This conceptual systems-level approach would ultimately evolve into a long-term decision support system for transparent and sustainable strategies for resilient blue carbon ecosystems, societies and economies. This interconnected resilience can and will be realized only through the effective collaboration and communication of all the pertinent stakeholders—scientists, NGOs, private technological entities, governments, policymakers, investors, and philanthropic foundations.
Data availability statement
The datasets generated during the current study—including the Sentinel-2 mosaic, and the minimum and maximum Bahamian seagrassextent, but excluding the validation data due to copyright, are available inthe following link: https://ablume.users.earthengine.app/view/bahamian-seagrass-extent-and-blue-carbon-accounting-using-eo.
Author contributions
AB co-designed the work; annotated training data; developed the reference data harmonization; designed and executed the cloud-based Earth Observation framework; ran the Tier 1 and Tier 2 blue carbon accounting; designed all figures and tables; and wrote the manuscript with the input of all co-authors. AP created the Simple Non-Iterative Clustering (SNIC)-based statistical properties and annotated training data. CL conceived and developed the HSV features. DT conceived the idea and supervised the entire research, from concept to writing. All authors contributed to the article and approved the submitted version.
Funding
AB, AP and DT acknowledge support from the DLR-funded Global Seagrass Watch Project. CL acknowledges support from a DLR-DAAD Research Fellowship (No. 57478193).
Acknowledgments
The authors acknowledge Chris Roelfsemma for sharing information regarding benthic habitats in the Bahamas.
Conflict of interest
The authors declare that the research was conducted in the absence of any commercial or financial relationships that could be construed as a potential conflict of interest.
Publisher’s note
All claims expressed in this article are solely those of the authors and do not necessarily represent those of their affiliated organizations, or those of the publisher, the editors and the reviewers. Any product that may be evaluated in this article, or claim that may be made by its manufacturer, is not guaranteed or endorsed by the publisher.
Supplementary material
The Supplementary Material for this article can be found online at: https://www.frontiersin.org/articles/10.3389/fmars.2023.1058460/full#supplementary-material
Footnotes
- ^ https://developers.google.com/earth-engine/datasets/catalog/COPERNICUS_S2_CLOUD_PROBABILITY
- ^ https://developers.google.com/earth-engine/guides/arrays_eigen_analysis
- ^ https://allencoralatlas.org/atlas/#6.92/24.0443/-77.0209
- ^ https://www.abs.gov.au/methodologies/national-ocean-account-experimental-estimates-methodology/aug-2022
- ^ http://www.tribune242.com/news/2022/apr/29/pm-were-first-sell-blue-carbon-credits/
References
Alkhatlan A., Bannari A., Ali T. S., Abahussain A., Hameid N. (2019). “Mapping submerged aquatic vegetation in shallow water of Arabian gulf using water spectral indices, field observations and landsat-OLI data,” in IGARSS 2019 - 2019 IEEE International Geoscience and Remote Sensing Symposium. 302–305.
Bertram C., Quaas M., Reusch T. B. H., Vafeidis A. T., Wolff C., Rickels W. (2021). The blue carbon wealth of nations. Nat. Climate Change 11 (8), 704–709. doi: 10.1038/s41558-021-01089-4
Buchan K. C. (2000). The Bahamas. Mar. pollut. Bull. 41 (1), 94–111. doi: 10.1016/S0025-326X(00)00104-1
Cabo Verde (2021) 2020 update to the first nationally determined contribution (NDC). Available at: https://unfccc.int/sites/default/files/NDC/2022-06/Cabo%20Verde_NDC%20Update%202021.pdf.
Carbon Credits (2022) Live carbon prices today. Available at: https://carboncredits.com/carbon-prices-today/ (Accessed 29 September 2022).
C2ES (2022) California Cap and Trade. Available at: https://www.c2es.org/content/california-cap-and-trade/ (Accessed 29 September 2022).
Dataset Allen Coral Atlas (2022) Imagery, maps and monitoring of the world's tropical coral reefs. Available at: https://www.allencoralatlas.org/.
Dataset ChartsBin statistics collector team (2010). Length of coastline by country (ChartsBin). Available at: http://chartsbin.com/view/ofv.
Dataset FAO UN (2014). Global administrative unit layers 2015, country boundaries. Available at: https://developers.google.com/earth-engine/datasets/catalog/FAO_GAUL_2015_level1.
Dataset UNEP-WCMC, S.F (2021). Global distribution of seagrasses (version 7.1). seventh update to the data layer used in green and short, (2003) (Cambridge, UK: UN Environment World Conservation Monitoring Centre). doi: 10.34892/x6r3-d211
Dencer-Brown A. M., Shilland R., Friess D., Herr D., Benson L., Berry N. J., et al. (2022). Integrating blue: How do we make nationally determined contributions work for both blue carbon and local coastal communities? Ambio 51 (9), 1978–1993. doi: 10.1007/s13280-022-01723-1
Dierssen H. M., Zimmerman R. C., La Drake and Burdige D. (2010). Benthic ecology from space: optics and net primary production in seagrass and benthic algae across the great bahama bank. Mar. Ecol. Prog. Ser. 411, 1–15. doi: 10.3354/meps08665
Donchyts G., Schellekens J., Winsemius H., Eisemann E., Van de Giesen N. (2016). A 30 m resolution surface water mask including estimation of positional and thematic differences using landsat 8, SRTM and OpenStreetMap: A case study in the Murray-darling basin, Australia. Remote Sens. 8 (5), 386. doi: 10.3390/rs8050386
Duarte C. M., Kennedy H., Marbà N., Hendriks I. (2013). Assessing the capacity of seagrass meadows for carbon burial: Current limitations and future strategies. Ocean Coast. Manage. 83, 32–38. doi: 10.1016/j.ocecoaman.2011.09.001
Dunic J. C., Brown C. J., Connolly R. M., Turschwell M. P., Côté I. M. (2021). Long-term declines and recovery of meadow area across the world’s seagrass bioregions. Global Change Biol. 27, 4096–4109. doi: 10.1111/gcb.15684
Flanders Marine Institute (2019) Maritime boundaries geodatabase: Maritime boundaries and exclusive economic zones (200NM). Available at: https://www.marineregions.org/.
Fourqurean J. W., Duarte C. M., Kennedy H., Marbà N., Holmer M., Mateo M. A., et al. (2012). Seagrass ecosystems as a globally significant carbon stock. Nat. Geosci. 5 (7), 505–509. doi: 10.1038/ngeo1477
Friedlingstein P., Jones M. W., O'Sullivan M., Andrew R. M., Bakker D. C. E., Hauck J., et al. (2020). Global carbon budget 2020. Earth Syst. Sci. Data 12 (4), 3269–3340. doi: 10.5194/essd-12-3269-2020
Google Earth Engine (2022) ee.ImageCollection.mode [Online]. Available at: https://developers.google.com/earth-engine/apidocs/ee-imagecollection-mode (Accessed 29 September 2022).
Grech A., Chartrand-Miller K., Erftemeijer P., Fonseca M., McKenzie L., Rasheed M., et al. (2012). A comparison of threats, vulnerabilities and management approaches in global seagrass bioregions. Environ. Res. Lett. 7. doi: 10.1088/1748-9326/7/2/024006
Green E., Short F. (2003). World atlas of seagrasses (Berkeley, USA: University of California Press).
Hassanein M., Lari Z., El-Sheimy N. (2018). A new vegetation segmentation approach for cropped fields based on threshold detection from hue histograms. Sensors 18 (4), 1253. doi: 10.3390/s18041253
Hossain M. S., Bujang J. S., Zakaria M. H., Hashim M. (2015). The application of remote sensing to seagrass ecosystems: an overview and future research prospects. Int. J. Remote Sens. 36 (1), 61–114. doi: 10.1080/01431161.2014.990649
Howard J., Hoyt S., Isensee K., Telszewski M., Pidgeon E. (2014). Coastal blue carbon: Methods for assessing carbon stocks and emissions factors in mangroves, tidal salt marshes, and seagrasses (Arlington, Virginia, USA: Conservation International, Intergovernmental Oceanographic Commission of UNESCO, International Union for Conservation of Nature).
Kennedy E. V., Roelfsema C. M., Lyons M. B., Kovacs E. M., Borrego-Acevedo R., Roe M., et al. (2021). Reef cover, a coral reef classification for global habitat mapping from remote sensing. Sci. Data 8 (1), 196. doi: 10.1038/s41597-021-00958-z
Landfall (2021) Explorer chart: Bahamas. Available at: https://www.landfallnavigation.com/explorer-charts-bahamas-turks-caicos.html (Accessed 6 August 2022).
Lee Z., Carder K. L., Mobley C. D., Steward R. G., Patch J. S. (1998). Hyperspectral remote sensing for shallow waters. i. a semianalytical model. Appl. Optics 37 (27), 6329–6338. doi: 10.1364/AO.37.006329
Lee C. B., Traganos D., Martin L., Rowlands G., Reinartz P. (2022). Nationwide seagrass mapping using analysis-ready sentinel-2 and PlanetScope data to support the nationally determined contributions of Seychelles (Annapolis, Maryland, USA: International Seagrass Biology Workshop 14).
Lyons M. B., Roelfsema C. M., Kennedy E. V., Kovacs E. M., Borrego-Acevedo R., Markey K., et al. (2020). Mapping the world's coral reefs using a global multiscale earth observation framework. Remote Sens. Ecol. Conserv. 6 (4), 557–568. doi: 10.1002/rse2.157
Macreadie P. I., Allen K., Kelaher B. P., Ralph P. J., Skilbeck C. G. (2012). Paleoreconstruction of estuarine sediments reveal human–induced weakening of coastal carbon sinks. Global Change Biol. 18 (3), 891–901. doi: 10.1111/j.1365-2486.2011.02582.x
Macreadie P. I., Anton A., Raven J. A., Beaumont N., Connolly R. M., Friess D. A., et al. (2019). The future of blue carbon science. Nat. Commun. 10 (1), 3998. doi: 10.1038/s41467-019-11693-w
Macreadie P. I., Baird M. E., Trevathan-Tackett S. M., Larkum A. W. D., Ralph P. J. (2014). Quantifying and modelling the carbon sequestration capacity of seagrass meadows – a critical assessment. Mar. pollut. Bull. 83 (2), 430–439. doi: 10.1016/j.marpolbul.2013.07.038
Macreadie P. I., Costa M. D. P., Atwood T. B., Friess D. A., Kelleway J. J., Kennedy H., et al. (2021). Blue carbon as a natural climate solution. Nat. Rev. Earth Environ. 2 (12), 826–839. doi: 10.1038/s43017-021-00224-1
Macreadie P. I., Robertson A. I., Spinks B., Adams M. P., Atchison J. M., Bell-James J., et al. (2022). Operationalizing marketable blue carbon. One Earth 5 (5), 485–492. doi: 10.1016/j.oneear.2022.04.005
Macreadie P. I., Trevathan-Tackett S. M., Skilbeck C. G., Sanderman J., Curlevski N., Jacobsen G., et al. (2015). Losses and recovery of organic carbon from a seagrass ecosystem following disturbance. Proc. R. Soc. B: Biol. Sci. 282 (1817), 20151537. doi: 10.1098/rspb.2015.1537
Mandoske J. (2017). Can blue carbon further conservation? approaches to conservation through a portfolio of blue carbon options: A case study in the Bahamas (San Diego, USA: Capstone Projects).
McKenzie L. J., Nordlund L. M., Jones B. L., Cullen-Unsworth L. C., Roelfsema C., Unsworth R. K. F. (2020). The global distribution of seagrass meadows. Environ. Res. Lett. 15 (7), 074041. doi: 10.1088/1748-9326/ab7d06
Mcleod E., Chmura G. L., Bouillon S., Salm R., Björk M., Duarte C. M., et al. (2011). A blueprint for blue carbon: toward an improved understanding of the role of vegetated coastal habitats in sequestering CO2. Front. Ecol. Environ. 9 (10), 552–560. doi: 10.1890/110004
Oanda (2022) Währungsumrechner. Available at: https://www.oanda.com/currency-converter/de/?from=EUR&to=USD&amount=1 (Accessed 13 September 2022).
Otsu N. (1979). A threshold selection method from Gray-level histograms. IEEE Trans. Systems Man Cybernetics 9 (1), 62–66. doi: 10.1109/TSMC.1979.4310076
Republic of Seychelles (2021). Seychelles’ updated nationally determined contribution (Seychelles: NDC Registry). Available at: https://unfccc.int/sites/default/files/NDC/2022-06/Seychelles%20-%20NDC_Jul30th%202021%20_Final.pdf.
Roelfsema C. M., Lyons M., Kovacs E. M., Maxwell P., Saunders M. I., Samper-Villarreal J., et al. (2014). Multi-temporal mapping of seagrass cover, species and biomass: A semi-automated object based image analysis approach. Remote Sens. Environ. 150, 172–187. doi: 10.1016/j.rse.2014.05.001
Roelfsema C. M., Lyons M., Murray N., Kovacs E. M., Kennedy E., Markey K., et al. (2021). Workflow for the generation of expert-derived training and validation data: A view to global scale habitat mapping. Front. Mar. Sci. 8. doi: 10.3389/fmars.2021.643381
Saunders M. I., Leon J., Phinn S. R., Callaghan D. P., O’Brien K. R., Roelfsema C. M., et al. (2013). Coastal retreat and improved water quality mitigate losses of seagrass from sea level rise. Global Change Biol. 19 (8), 2569–2583. doi: 10.1111/gcb.12218
Schill S. R., McNulty V. P., Pollock F. J., Lüthje F., Li J., Knapp D. E., et al. (2021). Regional high-resolution benthic habitat data from planet dove imagery for conservation decision-making and marine planning. Remote Sens. 13 (21), 4215. doi: 10.3390/rs13214215
Short F. T., Polidoro B., Livingstone S. R., Carpenter K. E., Bandeira S., Bujang J. S., et al. (2011). Extinction risk assessment of the world’s seagrass species. Biol. Conserv. 144 (7), 1961–1971. doi: 10.1016/j.biocon.2011.04.010
Smith G. W., Short F. T., Kaplan D. I. (1990). “Distribution and biomass of seagrasses in San Salvador, Bahamas,” in Proceedings of the third symposium on the botany of the Bahamas. Ed. Smith R.(Bahamian Field Station, San Salvador, Bahamas), 83.
Story M., Congalton R. G. (1986). Accuracy assessment: A user’s perspective. Photogrammetric Eng. Remote Sens. 52 (3), 397–399.
Tassi A., Vizzari M. (2020). Object-oriented LULC classification in Google earth engine combining SNIC, GLCM, and machine learning algorithms. Remote Sens. 12 (22), 3776. doi: 10.3390/rs12223776
The Commonwealth (2022) The Bahamas. Available at: https://thecommonwealth.org/our-member-countries/bahamas (Accessed 29 August 2022).
The Government of Mozambique (2021) Update of the first nationally determined contribution to the united nations framework convention on climate change. Available at: https://unfccc.int/sites/default/files/NDC/2022-06/NDC_EN_Final.pdf.
The Government of The Bahamas (2015). Intended nationally determined contribution (INDC) under the united nations framework convention on climate change (UNFCCC) (NDC Registry).
Thomas N., Pertiwi A. P., Traganos D., Lagomasino D., Poursanidis D., Moreno S., et al. (2021). Space-borne cloud-native satellite-derived bathymetry (SDB) models using ICESat-2 and sentinel-2. Geophysical Res. Lett. 48 (6), e2020GL092170. doi: 10.1029/2020GL092170
Traganos D., Aggarwal B., Poursanidis D., Topouzelis K., Chrysoulakis N., Reinartz P. (2018). Towards global-scale seagrass mapping and monitoring using sentinel-2 on Google earth engine: The case study of the Aegean and Ionian seas. Remote Sens. 10 (8), 1227. doi: 10.3390/rs10081227
Traganos D., Lee C. B., Blume A., Poursanidis D., Čižmek H., Deter J., et al. (2022a). Spatially explicit seagrass extent mapping across the entire Mediterranean. Front. Mar. Sci. 9. doi: 10.3389/fmars.2022.871799
Traganos D., Pertiwi A. P., Lee C. B., Blume A., Poursanidis D., Shapiro A. (2022b). Earth observation for ecosystem accounting: spatially explicit national seagrass extent and carbon stock in Kenya, Tanzania, Mozambique and Madagascar. Remote Sens. Ecol. Conserv. doi: 10.1002/rse2.287
Traganos D., Reinartz P. (2018). Mapping Mediterranean seagrasses with sentinel-2 imagery. Mar. pollut. Bull. 134, 197–209. doi: 10.1016/j.marpolbul.2017.06.075
UNEP (2020). “Seagrasses, the forgotten ecosystems,” in Foresight brief, vol. 16. . Available at: https://wedocs.unep.org/20.500.11822/32643.
UNEP-WCMC, IUCN (2022) Protected planet: Protected area profile for Bahamas from the world database of protected areas, July 2022 (Cambridge, UK: UNEP-WCMC and IUCN). Available at: www.protectedplanet.net (Accessed 29 September 2022).
UNFCCC (2016). “Report of the conference of the parties on its twenty-first session, held in Paris from 30 November to 13 December 2015. part one: Proceedings,” in Paris Climate Change Conference - November 2015 (Paris, France).
van Tussenbroek B. I., Cortés J., Collin R., Fonseca A. C., Gayle P. M. H., Guzmán H. M., et al. (2014). Caribbean-Wide, long-term study of seagrass beds reveals local variations, shifts in community structure and occasional collapse. PloS One 9 (3), e90600. doi: 10.1371/journal.pone.0090600
Veettil B. K., Ward R. D., Lima M. D. A. C., Stankovic M., Hoai P. N., Quang N. X. (2020). Opportunities for seagrass research derived from remote sensing: A review of current methods. Ecol. Indic. 117, 106560. doi: 10.1016/j.ecolind.2020.106560
Wabnitz C. C., Andréfouët S., Torres-Pulliza D., Müller-Karger F. E., Kramer P. A. (2008). Regional-scale seagrass habitat mapping in the wider Caribbean region using landsat sensors: Applications to conservation and ecology. Remote Sens. Environ. 112 (8), 3455–3467. doi: 10.1016/j.rse.2008.01.020
Waycott M., Duarte C. M., Carruthers T. J. B., Orth R. J., Dennison W. C., Olyarnik S., et al. (2009). Accelerating loss of seagrasses across the globe threatens coastal ecosystems. Proc. Natl. Acad. Sci. 106 (30), 12377–12381. doi: 10.1073/pnas.0905620106
Waycott M., McKenzie L. J., Mellors J., EllisonJoanna C J. C., Sheaves M. T., Collier C., et al. (2011). “Vulnerability of mangroves, seagrasses and intertidal flats in the tropical pacific to climate change,” in Vulnerability of tropical pacific fisheries and aquaculture to climate change. Eds. Bell J. D., Johnson J. E., Hobday A. J., 297–368*.
Williamson P., Gattuso J.-P. (2022). Carbon removal using coastal blue carbon ecosystems is uncertain and unreliable, with questionable climatic cost-effectiveness. Front. Climate 4. doi: 10.3389/fclim.2022.853666
Keywords: blue carbon, seagrass, ecosystem accounting, Sentinel-2, Google Earth Engine (GEE), Earth Observation (EO), The Bahamas
Citation: Blume A, Pertiwi AP, Lee CB and Traganos D (2023) Bahamian seagrass extent and blue carbon accounting using Earth Observation. Front. Mar. Sci. 10:1058460. doi: 10.3389/fmars.2023.1058460
Received: 30 September 2022; Accepted: 16 January 2023;
Published: 06 February 2023.
Edited by:
Astrid Bracher, Alfred Wegener Institute Helmholtz Centre for Polar and Marine Research (AWI), GermanyReviewed by:
Jenny R. Hillman, The University of Auckland, New ZealandMaria Adelaide Ferreira, Center for Marine and Environmental Sciences (MARE), Portugal
Copyright © 2023 Blume, Pertiwi, Lee and Traganos. This is an open-access article distributed under the terms of the Creative Commons Attribution License (CC BY). The use, distribution or reproduction in other forums is permitted, provided the original author(s) and the copyright owner(s) are credited and that the original publication in this journal is cited, in accordance with accepted academic practice. No use, distribution or reproduction is permitted which does not comply with these terms.
*Correspondence: Alina Blume, YWxpbmFAYmx1bWUxLmRl; Dimosthenis Traganos, ZGltb3N0aGVuaXMudHJhZ2Fub3NAZGxyLmRl