 José María Landeira1*†
 Diego Deville2†
 Effrosyni Fatira1
 Zhixin Zhang3
 Sven Thatje4
 Qiang Lin3
 Santiago Hernández-León1
 Kaori Wakabayashi2
- 1Instituto de Oceanografía y Cambio Global, IOCAG, Universidad de Las Palmas de Gran Canaria, Canary Islands, Spain
- 2Graduate School of Integrated Sciences for Life, Hiroshima University, Higashi-Hiroshima, Japan
- 3CAS Key Laboratory of Tropical Marine Bio-resources and Ecology, South China Sea Institute of Oceanology, Innovation Academy of South China Sea Ecology and Environmental Engineering, Chinese Academy of Sciences, Haizhu, Guangzhou, China
- 4Centro Austral de Investigaciones Científicas et Técnicas (CADIC), Ushuaia, Tierra del Fuego, Argentina
Slipper (Scyllaridae) and spiny (Palinuridae) lobsters show a complex life cycle with a planktonic larval phase, named phyllosoma. This unique larval form within Achelata (Decapoda) is characterized by a transparent dorsoventrally compressed body and a pair of antennae. This conspicuous morphology has been attributed to adaptive specialization of planktonic life. Early studies suggest that phyllosoma morphology has remained constant over the evolutionary history of Achelata, while recent evidence points out large morphological changes and that diversification of phyllosoma larvae is a consequence of radiation and specialization processes to exploit different habitats. Given the ecological and evolutive significance of phyllosoma, we used shape variation of the first phyllosoma stage (phyllosoma I) and a time-calibrated phylogeny of extant Achelata to study how diversification of phyllosoma I shape occurred along with the evolutionary history of Achelata. Our results show a conserved phyllosoma I with a pear-shaped cephalic shield and large antennae in spiny lobsters and older groups of slipper lobsters, yet highly specialized phyllosoma I with wide rounded cephalic shield and short antennae in younger groups of slipper lobsters. Analyses revealed two bursts of lineage diversification in mid and late history without a slowdown in recent times. Both bursts preceded large bursts of morphological disparity. These results joined with the allopatric distribution of species and convergence of phyllosoma I shapes between largely divergent groups suggest that diversification involves nonadaptive radiation processes. However, the correlation of a major direction of shape with the maximum distribution depth of adults and the occurrence of the second burst of diversification post-extinction of competitors within Achelata presuppose some ecological opportunities that might have promoted lineage and morphological diversification, fitting to the characteristic components of adaptive radiations. Therefore, we conclude that diversification of Achelata presents a main signature of nonadaptive radiation with some components of adaptive radiation.
1 Introduction
Theoretical models and empirical evidence suggest that diversification of some species groups is a consequence of adaptive or nonadaptive radiation processes. Adaptive radiation involves species’ lineages occupying a wide variety of ecological roles (Simpson, 1949). This type of radiation is mainly triggered by ecological opportunities, which can be originated from three main sources: key innovations, dispersal into a new habitat, or extinction of competitors (Simpson, 1949; Yoder et al., 2010). Conversely, nonadaptive radiation refers to lineage diversification with similar ecological roles, and often absent or scarce overlapping distribution (i.e., allopatric or parapatric taxa) (Gittenberger, 1991; Rundell and Price, 2009; Czekanski-Moir and Rundell, 2019). In this type of radiation, species proliferation can occur because of restricted gene flow, with species facing similar environmental conditions causing an absence of divergent selection and slow speciation. Despite their differences, we should be aware that some radiations might also contain some elements of each type as visualized in Tetragnatha spiders (Gillespie, 2004; Cotoras et al., 2018).
Within decapod crustaceans, slipper lobsters (Scyllaridae) and spiny lobsters (Palinuridae) compose the infraorder Achelata, one of the most iconic decapod groups that play a key role in the ecosystem functioning and sustain some of the most profitable fisheries in the world (Holthuis, 1991). The crown divergence of Achelata’s families occurred in the Early Cretaceous and the Late Triassic, respectively (Wolfe et al., 2019). Fossil records and geographic distribution of species suggest that speciation of palinurid lobsters follows an allopatric mode (George, 2006), while this mode of speciation is not completely supported in scyllarid lobsters. This group has ecologically diversified to exploit different environments with some genera presenting scarce geographic overlap (Webber and Booth, 2007) as signal of competitive exclusion (Gittenberger, 1991; Rundell and Price, 2009), and others with parapatric distribution but subtle morphological differences that suggest low character displacement, a response for interspecific competition reflected in accentuated phenotypic differences (Brown and Wilson, 1956). Achelata lobsters are distributed worldwide throughout warm waters with a vertical range from very shallow to deep waters (more than 1000m), in different types of sediments (Webber and Booth, 2007). They share a unique larval form, named phyllosoma. This larva links the previous embryonic phase in the parental benthic habitat with its planktonic life allowing long-distance dispersal. Given the fossil evidence, geographic distribution of species, and presence of a larvae phase, it is suggested that diversification within Achelata has primarily happened due to nonecological processes and subtle ecological differentiation might have occurred later.
Phyllosomata are astonishing organisms that can reach several centimetres and spend up to two years in the water column through a series of moulting stages (4-17 stages) before they metamorphose into a pelagic-benthic transitional larval form called “nisto” in slipper lobsters or “puerulus” in spiny lobsters (Phillips et al., 2006; Hidaka et al., 2022). They have wide, transparent, and dorsoventrally compressed bodies, as well as stalked eyes, and two pairs of antennae frontally inserted in the cephalic shield (Phillips et al., 2006). Regarding the body shape of phyllosomata, it has been suggested that the compressed body should facilitate control of their swimming direction against a water flow using their natatory setae to generate appropriate lift or downward force (Hamasaki et al., 2012). Thus, shape and size of the cephalic shield control the drag force and may compensate for that phyllosomata are not good horizontal swimmers. In contrast, laboratory and field observations provide evidence that phyllosoma larvae are strong vertical swimmers since early life stages are frequently found in surface waters due to positive phototaxis (and likely negative geotaxis) (Butler et al., 2011). This behaviour facilitates the upward movement of phyllosoma from the sea bottom in the parental habitat (sometimes at hundreds of meters depth) to the surface. As the phyllosoma grows and develops, larvae are found deeper and are even able to perform diel vertical migrations, likely to avoid predators and to forage for food (Bradford et al., 2005). Phyllosoma larvae are also equipped with specialized receptors in the antennae and antennules, to detect mechanical and chemical stimuli (Phillips and Macmillan, 1987) that might be involved in foraging and predator avoidance. All the mentioned conspicuous morphological traits have been attributed to adaptive specialization of planktonic life, pointing out their ecological significance. However, we still have little understanding of their phylogenetic significance and their role in diversification of phyllosoma larvae.
The first attempts to assess the phylogenetic significance of phyllosoma traits were performed by Baisre and De Quevedo (1982) and Baisre (1994). The first study used phyllosoma traits to distinguish two species groups within Panulirus, while the second discussed the taxonomic value of eight characters that encompass the presence or absence of a naupliosoma stage, some appendices, size at hatching, and the number of setae. They found correlation between these phyllosoma traits and adult morphology, highlighting their utility to separate Scyllaridae and Palinuridae, and main subcategories within them. Regarding diversification of phyllosoma larvae, based on fossil evidence Williamson (1985) stated that phyllosoma has experienced few modifications since the origin of Achelata. Later, compiled paleontological and taxonomical studies indicated that diversification of phyllosoma forms is a consequence of processes of radiation and specialization to exploit current habitats (Webber and Booth, 2007) (i.e., ecological speciation) (Yoder et al., 2010). Moreover, recently uncovered fossils shed light on the gradual evolution of antenna forms along with Achelata’s history (Haug et al., 2016) and that the ancestral (Jurassic) palinurid Palinurina tenera presented more phyllosoma stages than the extant species (Lavalli and Spanier, 2010; Haug and Haug, 2016). From this evidence, Schram and Koenemann (2021) hypothesized that the gradual morphological evolution of scyllarids from palinurids, and significant changes in early-developmental stages of Achelata species occurred during the Mesozoic. Considering that, phyllosoma larvae can possess morphological traits with evolutionary significance for diversification of Achelata.
Given the ecological and evolutionary significance of phyllosoma larvae, we used shape variation of the first stage (hereinafter, phyllosoma I) and a time-calibrated phylogeny of extant Achelata to investigate diversification along with the evolutionary history of this clade. We used a comparative evolutionary framework to specially assess: (1) whether shape variation has phylogenetic significance; (2) if shape can be related to adult traits like maximum size and distribution depth; and (3) tempo and mode of diversification of phyllosoma shape along with the evolutionary history of Achelata. Our results provide a new framework to better understand diversification of slipper and spiny lobsters.
2 Materials and methods
2.1 Morphological data collection
Morphological data were obtained from published taxonomic descriptions in which phyllosoma I was illustrated (see Supplementary Table S1 for full list of references). To avoid any taxonomic confusion, only descriptions based on larvae obtained from laboratory-reared ovigerous lobsters or collected in the field and identified by DNA barcoding, were used in this study. Moreover, those descriptions with low quality drawings, without a scale bar or without an upright dorsal/ventral view, were discarded. We restricted our study to the phyllosoma I because it is the larval stage for which more reliable taxonomic descriptions exist. As a result, a total of 37 species were retained for this study (Figure S1), which cover the most ecological divergent species within Achelata.
Phyllosoma I drawings were digitized and the outlines of the cephalic shield including antennae were manually traced. We used the “polygon selection” option to trace drawings and the “spline fitting” option for smoothing outlines in ImageJ v. 1.52p (Schneider et al., 2012). Outlines were manually fitted to the nearest possible to the original drawings and saved as binary masks. Then, tpsDig v.2.31 (Rohlf, 2017) was used to measure the height and width of the cephalic shield, as well as the antenna lengths based on the original drawings.
To relate parental traits with the phyllosoma I shape, we collected data of the maximum body size and maximum distribution depth of the adult phase for each species. Data were extracted from Holthuis (1991; 2002; 2006), Chan and Yu (1993) and from published taxonomic descriptions of larval morphology, as mentioned before.
2.2 Outline processing and elliptic Fourier analysis
A total of 350 coordinates from the binary mask of each cephalic shield were selected for analyses. The middle point between the two antennae was considered as starting point of the outline (Figure 1). The coordinates were sampled along the outline adapting the “stage2outline” and “stage2landmark” R codes of Wong et al. (2018) to our data.
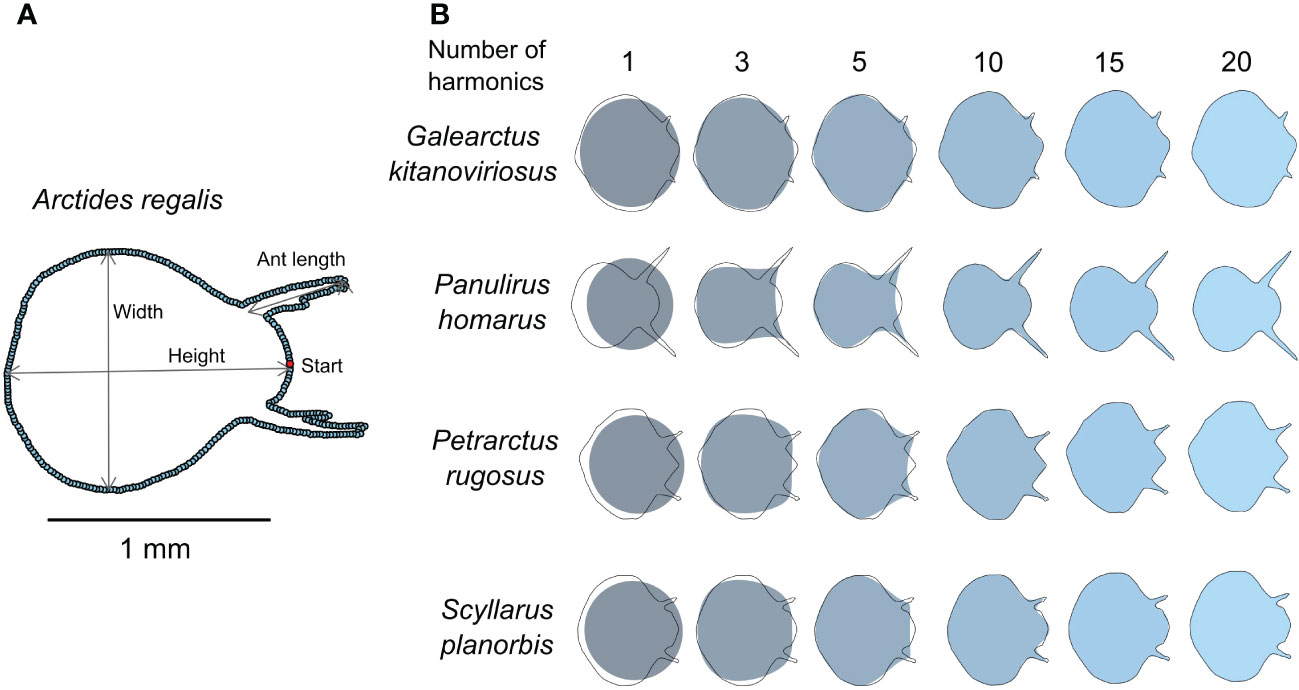
Figure 1 Outline processing and analysis of phyllosoma larvae I shape. (A) Shape mask labelled with the outline sampling scheme and some of the linear measurements used. Start denotes standardized starting point of outline sampling at the medium point between antennae; Ant length = antenna length. (B) Outline reconstructed from elliptic Fourier analysis. Black lines are the masks of the original outline while colour-scaled shades are the reconstructed outline shapes using different number of harmonics.
We ran an elliptic Fourier analysis (EFA) (Rohlf and Archie, 1984) using the efourier function of the Momocs package (Bonhomme et al., 2014). After running Fourier power tests for each species’ shape, we decided to preserve the first twenty harmonics since they accounted for 99% of the cumulative variability of the shapes and closely fitted the original outlines (Figure 1). Each harmonic has four coefficients; thus 80 coefficients were obtained from each phyllosoma I shape. However, we excluded the first three coefficients of the first harmonic to standardize the orientation, size, and rotation of outlines.
2.3 Shape variation and measurements
We used principal component analysis (PCA) to ordinate the Fourier coefficients. We plotted PCA scores and the major shape changes from the first two principal components (PC1 and PC2) to observe shape variation of phyllosoma I. To model the outlines on PCs, coefficients of harmonics were calculated from the product of the PC scores and their corresponding eigenvector using mean ± standard deviation (SD) of PC scores from the first two principal axes. Then, inverse Fourier transformations were used to rebuild the hypothetical shapes from the estimated coefficients. Shape differences regarding the average shape outline and the ± SD and ± 2SD of each axis were drawn within thin-plate splines
The correlations (R) and angles (θ = arccos(R)) between regression vectors of shape (PC1 and PC2) on linear measurements (height, width, aspect ratio = width/height, and relative antenna length = antenna length/height) were estimated using the rv.test function of the barnlarv package. R ranges from 0 to 1, and both represent orthogonal and parallel positions of the compared vectors, respectively.
2.4 Phylogenetic inference and lineage diversification
We constructed a time-calibrated phylogenetic tree including 112 out of the 155 Achelata species described (last checklist, Chan, 2019) (Table S2). We retrieved sequences of six genetic regions (12S, 16S, 18S, and 28 S ribosomal subunits (rRNAs), cytochrome oxidase c subunit I, and histone 3) from the 112 Achelata species and four outgroups: two Astacidae (Homarus americanus and Metanephrops thomsoni), and two Glypheidea (Laurentaeglyphea neocaledonica and Neoglyphea inopinata) species since they are sister suborders of Achelata (Schram and Koenemann, 2021). For those species with multiple available sequences for one gene, we selected the longest one. When necessary, we used the reverse complement of the original retrieved sequence or concatenated partial sequences of a specific genetic region (28S rRNA) (Table S2). Each genetic region was independently aligned and then alignments were processed with Gblocks 0.9.1 (Castresana, 2000) to discard poorly aligned positions, but allowing the inclusion of gaps to increase the number of phylogenetically informative variable sites. The processed alignments were concatenated to form a final alignment of 3877 bp. Then, a time-calibrated phylogenetic tree was constructed using BEAST v.2.6 (Bouckaert et al., 2019). For this tree, we included two calibration points from fossil records: (1) for the Achetala clade, Yunnanopalinura schrami (241–247 Millions of years ago, Mya) (Feldmann et al., 2012); and (2) for the Palinuridae, Archaeopalinurus (210–221 Mya) (Pinna, 1974). To construct the tree, we used the best substitution model from BEAST model test (Bouckaert and Drummond, 2017) under all reversible model search, the Yule process to build the prior tree, and a fast relaxed Lognormal clock (Zhang and Drummond, 2020). The analysis was run with a Markov Chain Monte Carlo simulation of 2x10⁸ steps, storing 10000 trees from the posterior distribution. The maximum clade credibility tree (MCC) was calculated considering a 10% of burn-in with the program TreeAnnotator included in BEAST v.2.6. Then, the MCC tree was pruned to only contain 34 out of the 37 species from which phyllosoma I shape information is available (bold species, Supplementary Table S2) given the lack of DNA sequences for three species. The MCC tree of 112 species was used to study lineage diversification, while the MCC tree only containing 34 species was used in comparative phylogenetic analyses of phyllosoma I shape.
We assessed whether lineage accumulation has experienced a slowdown along the evolutionary history of Achelata following an early burst of diversification. We constructed a lineage-through-time (LTT) plot and evaluated the fit of the LTT curve to a model of diversification with constant rate through a Monte Carlo Constant Rate (MCCR) test using the phytools package (Revell, 2012). This test estimates the γ statistic for incompletely sampled phylogenies by contrasting the distribution of inter-node distances between the root and its time-calibrated midpoint to the distribution of distances between this midpoint and the tips (Pybus and Harvey, 2000). Negative values of γ indicate that inter-node distances between the root and midpoint are shorter at early history than those from midpoint to the tips, suggesting that most branching events occurred in early history of Achelata. In contrast, if lineage diversification follows a constant rate process, γ has a mean value of 0. It has been demonstrated that incomplete taxon sampling in the phylogeny increases type I error rates in diversification analyses. Hence, the MCCR test calculates distributions of γ through simulations of phylogenies with taxon sizes equalling the known number of species (~155 species in Achelata) (Chan, 2019) under the null hypothesis of diversification with constant rate. Species within the simulated trees were randomly pruned to equal the number of species with retrieved sequences (112), replicating the incomplete taxon sampling. The LTT plot was built for each simulated pruned tree to construct the confidence interval.
To complement the LTT plot and MCCR test, we fitted six lineage accumulation models to branching times extracted from the time-calibrated MCC tree. Two of the models assumed constant rates of diversification: the pure-birth (Yule) model that does not incorporate extinctions, and the constant rate birth-death (crBD) model that includes extinctions but with a constant rate for speciation and extinction along evolutionary history (Nee et al., 1994). The next two models were Yule models with one (Yule2R) and two (Yule3R) shifts in speciation rate at some point along with the evolutionary history. The last two models: density-dependent logistic (DDL) and density-dependent exponential (DDE) assume diversity-dependence and estimate diversification rates in relation to the accumulation of diversity over time while accounting for extinctions. All these models were fitted using the fitdAICrc function of the laser package (Rabosky, 2006). To determine the model with best fit, we considered the bias-corrected version of the Akaike Information Criterion (AICc) approach (Burnham and Anderson, 2002; Posada and Buckley, 2004) and chose the model with the lowest AICc score.
2.5 Macroevolutionary assessment of shape variation
We evaluated whether phyllosoma I shapes, centroid size and antenna length are more similar between more related species, and less similar between distant species (i.e., phylogenetic signal). Phylogenetic signal was estimated in the extent of the multidimensional shape data using Kmult (Adams, 2014), which indicates whether shape variation is as arranged by phylogenetic position of species as expected under a Brownian motion (BM) model of evolution (Felsenstein, 1985) (Kmult = 1) or has higher (Kmult > 1) or lower (Kmult < 1) phylogenetic signal. Kmult and its significance were estimated using the physignal function of the geomorph package (Adams and Otárola-Castillo, 2013). In addition, we estimated phylogenetic signals of PC1, PC2, centroid size (CS), and antenna length through the λ estimator (Pagel, 1999), which indicates the level of correlation between species regarding the expected correlation under the BM model. The λ estimators and their significances were calculated utilizing the phylosig function of the phytools package. For visualization, a “phylomorphospace” was constructed using the first two PCs of the shape analysis as reference of morphological information. The phylomorphospace projects the phylogenetic tree into a space of morphological traits (Sidlauskas, 2008). For interpretation, the morphological diversity or “disparity” among species was considered: on the one hand, when a subclade occupies broad regions of the morphospace, recent divergence considerably contributes to the overall “disparity”; on the other hand, when a subclade occupies small regions, its greater “disparity” is explained by earlier divergence, supporting an early burst of trait evolution.
We assessed whether shape divergences between species pairs show a tendency to stasis/convergence or rapid diversification. Small shape divergences between largely distant species suggest convergent evolution or stasis, while large shape distances between closely related species indicate rapid diversification. Thus, we built pairwise distance-contrast plots in the same way as Muschick et al. (2012). We plotted phylogenetic divergences against shape divergences of species pairs. Phylogenetic divergences were estimated using the cophenetic function, while shape divergences were calculated using the dist function in R. Then, we compared the observed shape divergences with the ones obtained from 1000 simulated datasets under the BM model. For these simulations, we used the ratematrix and sim.char functions of the geiger package (Harmon et al., 2008). The simulated divergences under BM were extracted from the observed ones. Negative values were obtained when the observed species pairs comparisons were more similar than expected due to their phylogenetic distance, and positive values when the observed species pair comparisons were less similar in the simulated dataset. For visualization, the plots were color-scaled using the differences between the observed and simulated shape datasets. To account for variation among simulations, we counted the number of species pairs with lower observed shape divergence than the expected under BM in 95% of the simulations and plotted the observed and simulated Procrustes distances with a grey-scale colouration based on the number of simulations in which the observed Procrustes distances were lower than the simulated ones for each species pair.
2.6 Shape variation associated to adult traits
We fitted phylogenetic multiple regression models to predict phyllosoma shape in relation to body size (here CS), antenna length, and maximum distribution depth and maximum size of adults, while accounting for the phylogenetic position of species through the procD.pgls function of the geomorph package. This function performs regression models in a phylogenetic context under a BM model, accommodating high-dimensional datasets. In addition, since the main trajectories of shape variation (PC1 and PC2) were correlated with body size, antenna length, and aspect ratio (see Results section), we fitted univariate regression models to evaluate whether these variables were independently correlated to maximum size and maximum distribution depth of adults while considering phylogenetic position of species. For these univariate models, we log-transformed the variables and specified an expected covariance under the BM model.
2.7 Disparity through time analysis
We explored how shape disparity has changed over the Acheleta’s evolutionary history. We used the ddt function of the geiger package to calculate and plot disparity-through-time (DTT). The DTT plot exhibits the contribution of subclades to the total disparity as the linage diversity of the clade increases (Harmon et al., 2003). The observed DDT is usually contrasted by the expected value under the BM model, thus the difference between the observed and median expected values is called the morphological disparity index (MDI). Negative values of MDI are indicative of an early burst of disparity in trait evolution within the clade, while positive values suggest a higher variation than expected by phylogeny. Finally, we estimated the ancestral states of PC1 and PC2 to visualize changes at specific trajectories of shape along with the evolutionary history of Achelata. We estimated the ancestral state using the fitContinuous of the geiger package and superimposed them over the time-calibrated phylogenetic tree with the contMap function of the phytools package.
3 Results
3.1 Variation of phyllosoma I shape and environment
The first two PCs explained 76% of the total variation of phyllosoma I shapes (Figure 2). Species were divided into two clusters located in the negative and positive extremes of PC1. For PC1, species with negative values had large antennae and pear-shaped cephalic shields, while species with positive values had small antennae and wider rounded cephalic shields (Figure 2). For PC2, positive values were characterized by a wider anterior cephalic shield and antennae, while negative values represented narrower anterior cephalic shields and antennae (Figure 2). Few species with intermediate shapes appeared far from the two main clusters located at extremes of PC1. For instance, the shape of Panulirus argus, which was the closest one to the mean shape configuration (Figure 2). PC1 was significantly correlated with relative antenna length and presented a moderate non-significant correlation with aspect ratio. PC2 only showed moderate non-significant correlation with body width (Table 1).
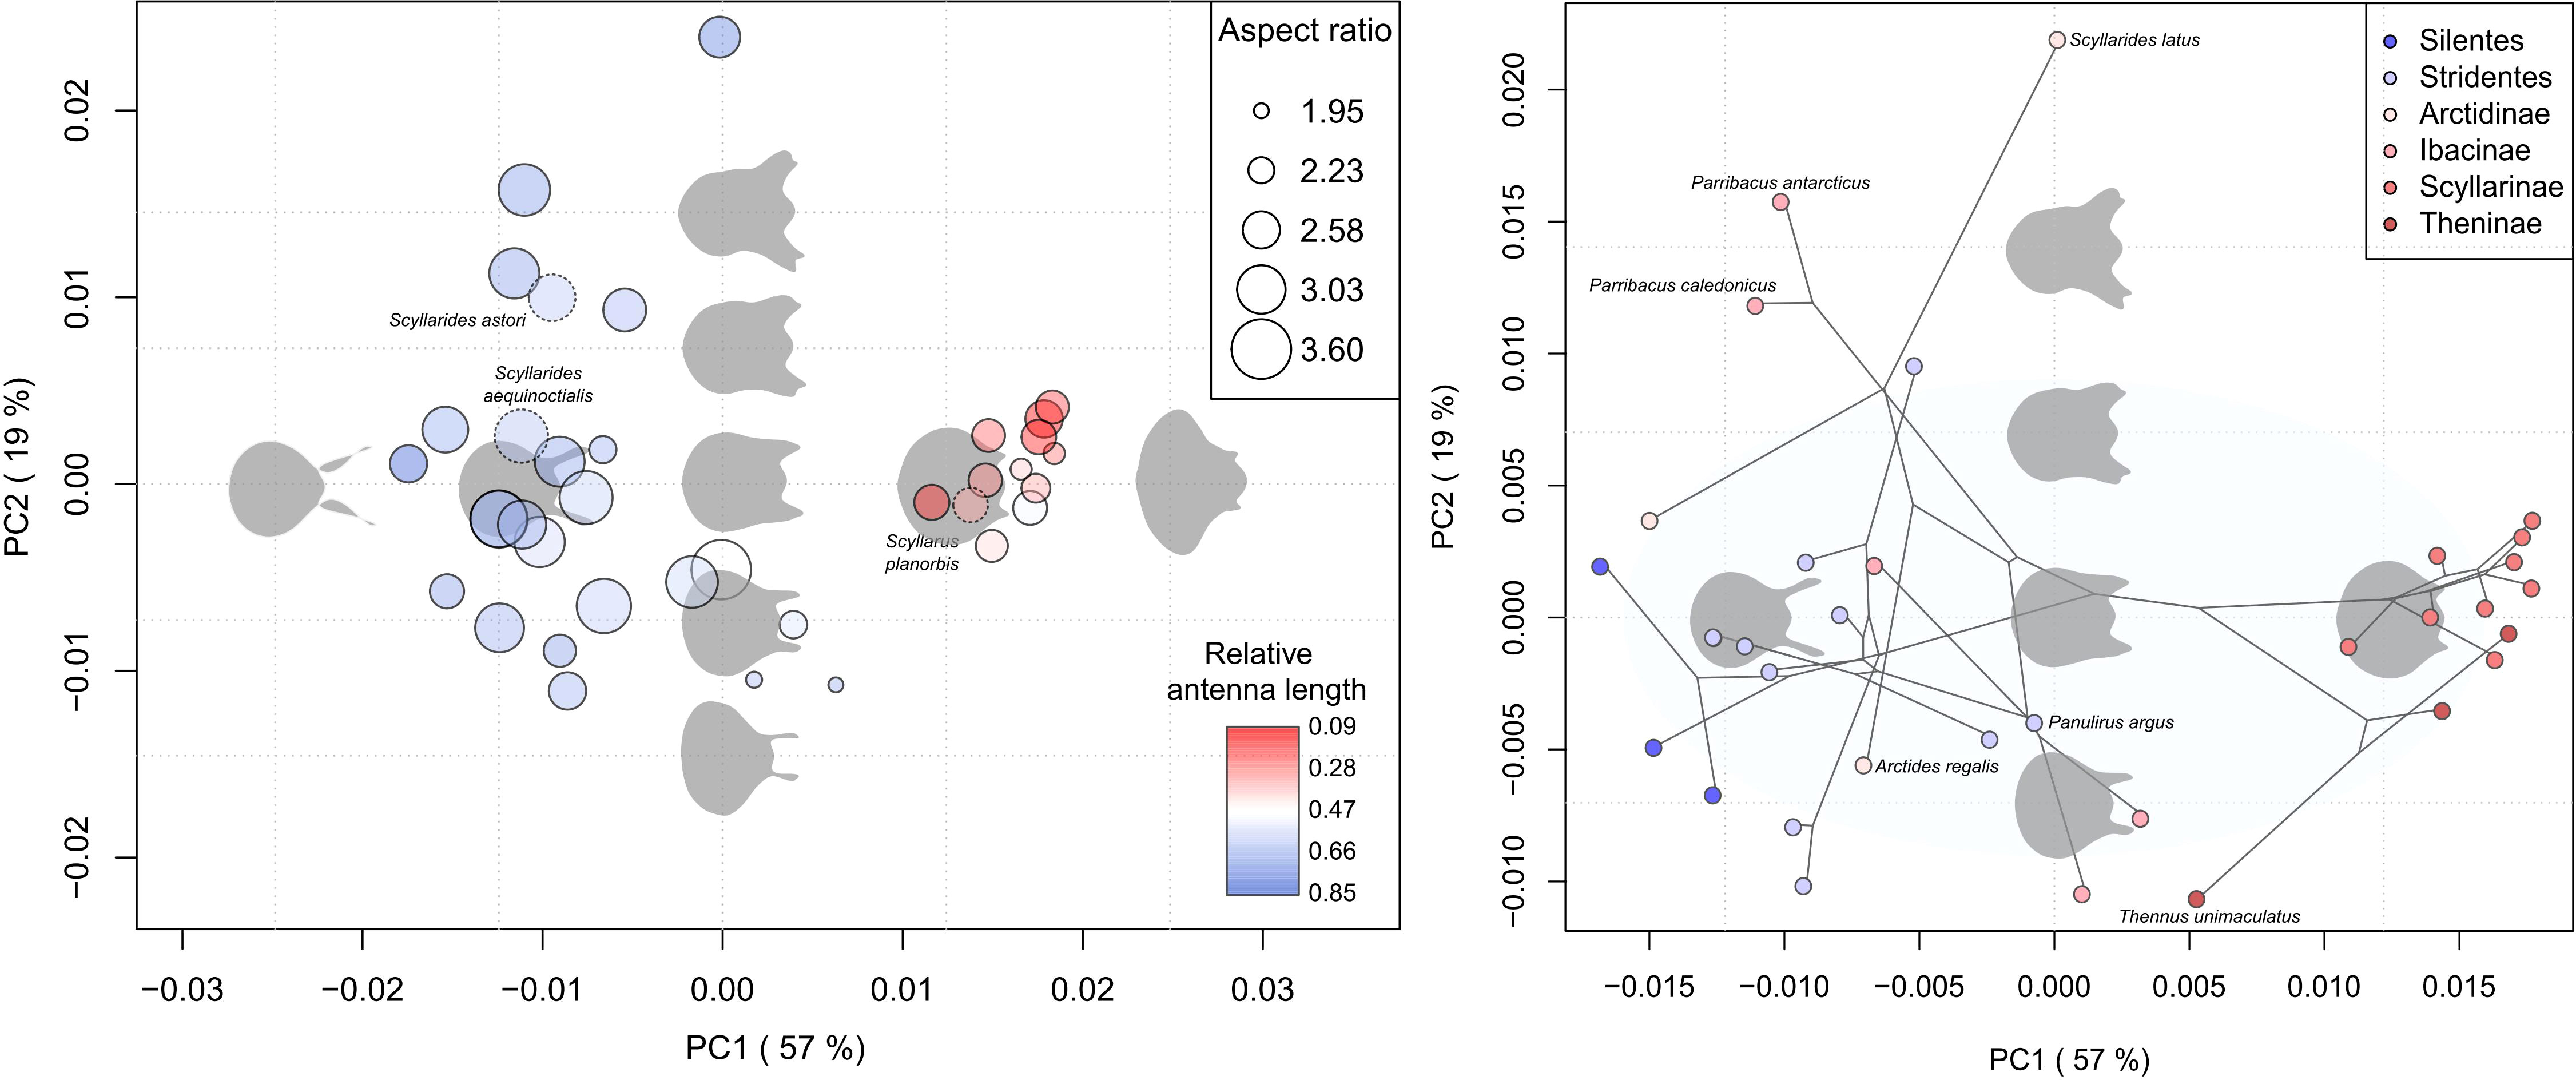
Figure 2 Left: Major directions of shape variation (PC1 and PC2) of phyllosoma I (37 species) summarized through principal component analysis. Data points were coloured based on relative antenna length (antenna length/height) and their sizes were scaled accounting for the aspect ratio of cephalic shield. Points with dashed edges represent species excluded in the phylogenetic comparative analyses. Right: Phylomorphospace of 34 species (subset of phylogeny over PCA scores). Sky-blue circle indicates the confidence ellipse at 90% level. The phylomorphospace was constructed from the estimated time-calibrated maximum clade credibility tree. Reconstructed shape outlines at mean, ± SD and ± 2SD PC score values, display the trend of shape changes along the PC axes.
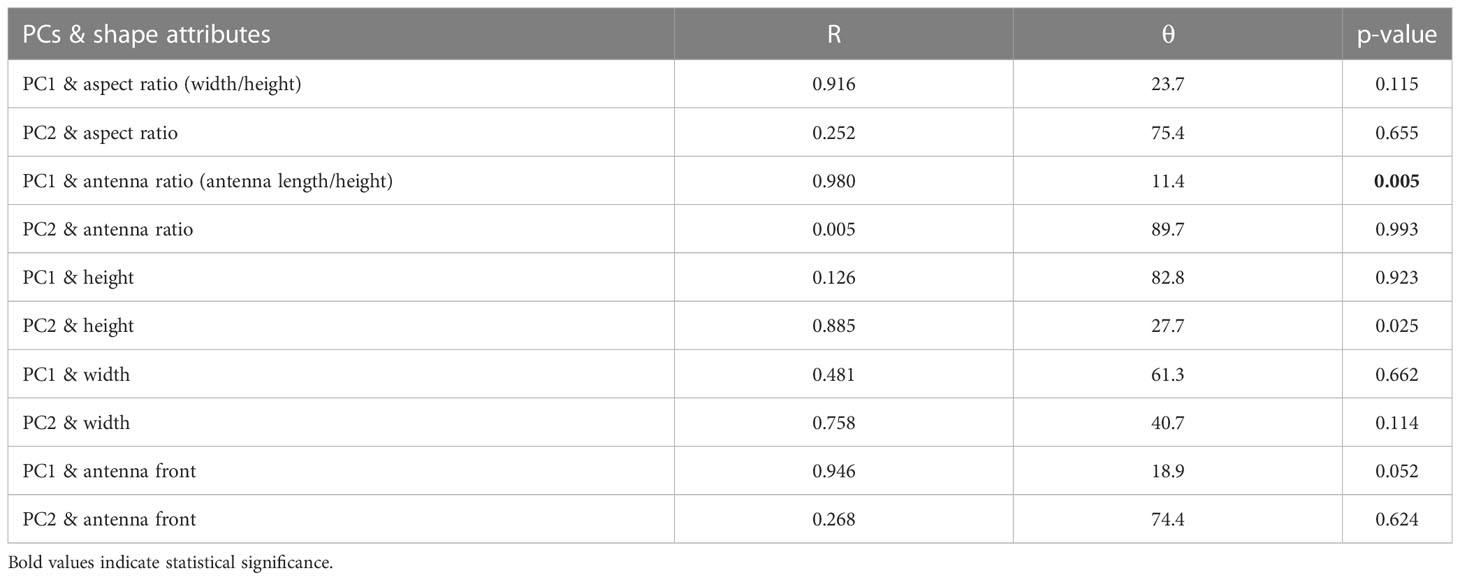
Table 1 Correlation between the first two components (PC1 and PC2) of phyllosoma I shape and regression vectors (regression of shape on size, width, aspect ratio, and relative antenna length).
3.2 Phylogenetic inference and lineage diversification
The maximum clade credibility tree of the Achelata species (Figure 3: 34 species, Supplementary Figure S2: 112 species tree) was congruent with previous multi-locus phylogenies of Achelata (Palero et al., 2009; Tsang et al., 2009; Yang et al., 2012). The monophyly of Stridentes and Silentes groups within Palinuridae, and monophylies of subfamilies within Scyllaridae were also supported in these trees except for Ibacinae, which was paraphyletic. Ibacinae genera were placed next to the subfamily Arctidinae. Also, our tree supported the polyphyletic state of genera within Scyllarinae subfamily observed in a previous phylogeny (Tsang et al., 2009).
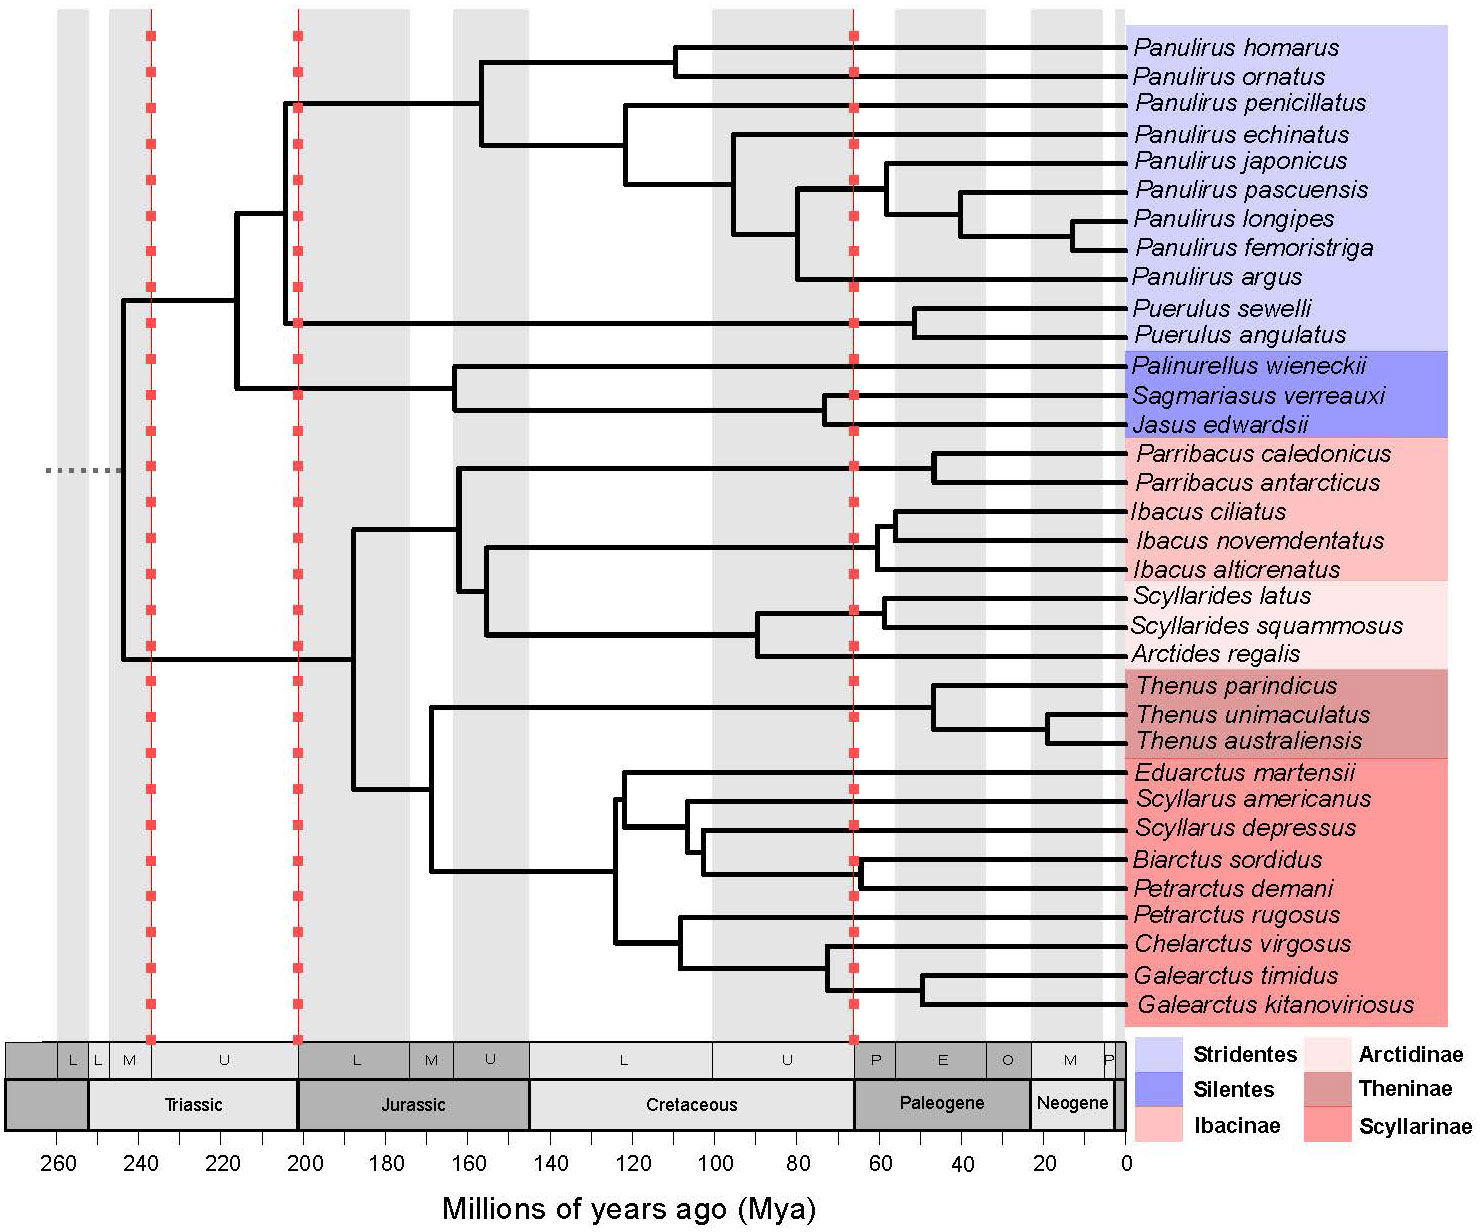
Figure 3 Time-calibrated maximum clade credibility tree of Achelata species used in phylogenetic comparative analyses (34 species). Blue-scaled coloured tips designate Palinuridae species, while red-scaled designate Scyllaridae species. Red-dotted lines indicate massive extinction events.
The MCCR test did not find significant evidence for bursts of lineage diversification in late evolutionary history of Achelata (γ = -2.3992, P = 0.138) as suggested by the LTT plot (Figure 4), which showed two bursts of lineage diversification. These bursts occurred about mid- (ca. 160–125 Mya) and late-history (ca. 50 Mya afterwards) of the Achelata clade. However, the pattern of LTT was slightly supported by the fitting of branching times to a Yule model with two shifts in diversification rate (Yule3R) in late history over models of diversity-dependence diversification (DDL and DDX) dAICcDDL = 2.7908 and dAICcDDX = 5.497) and a Yule model with one shift in diversification rate (dAICcYULE2 = 2.09).
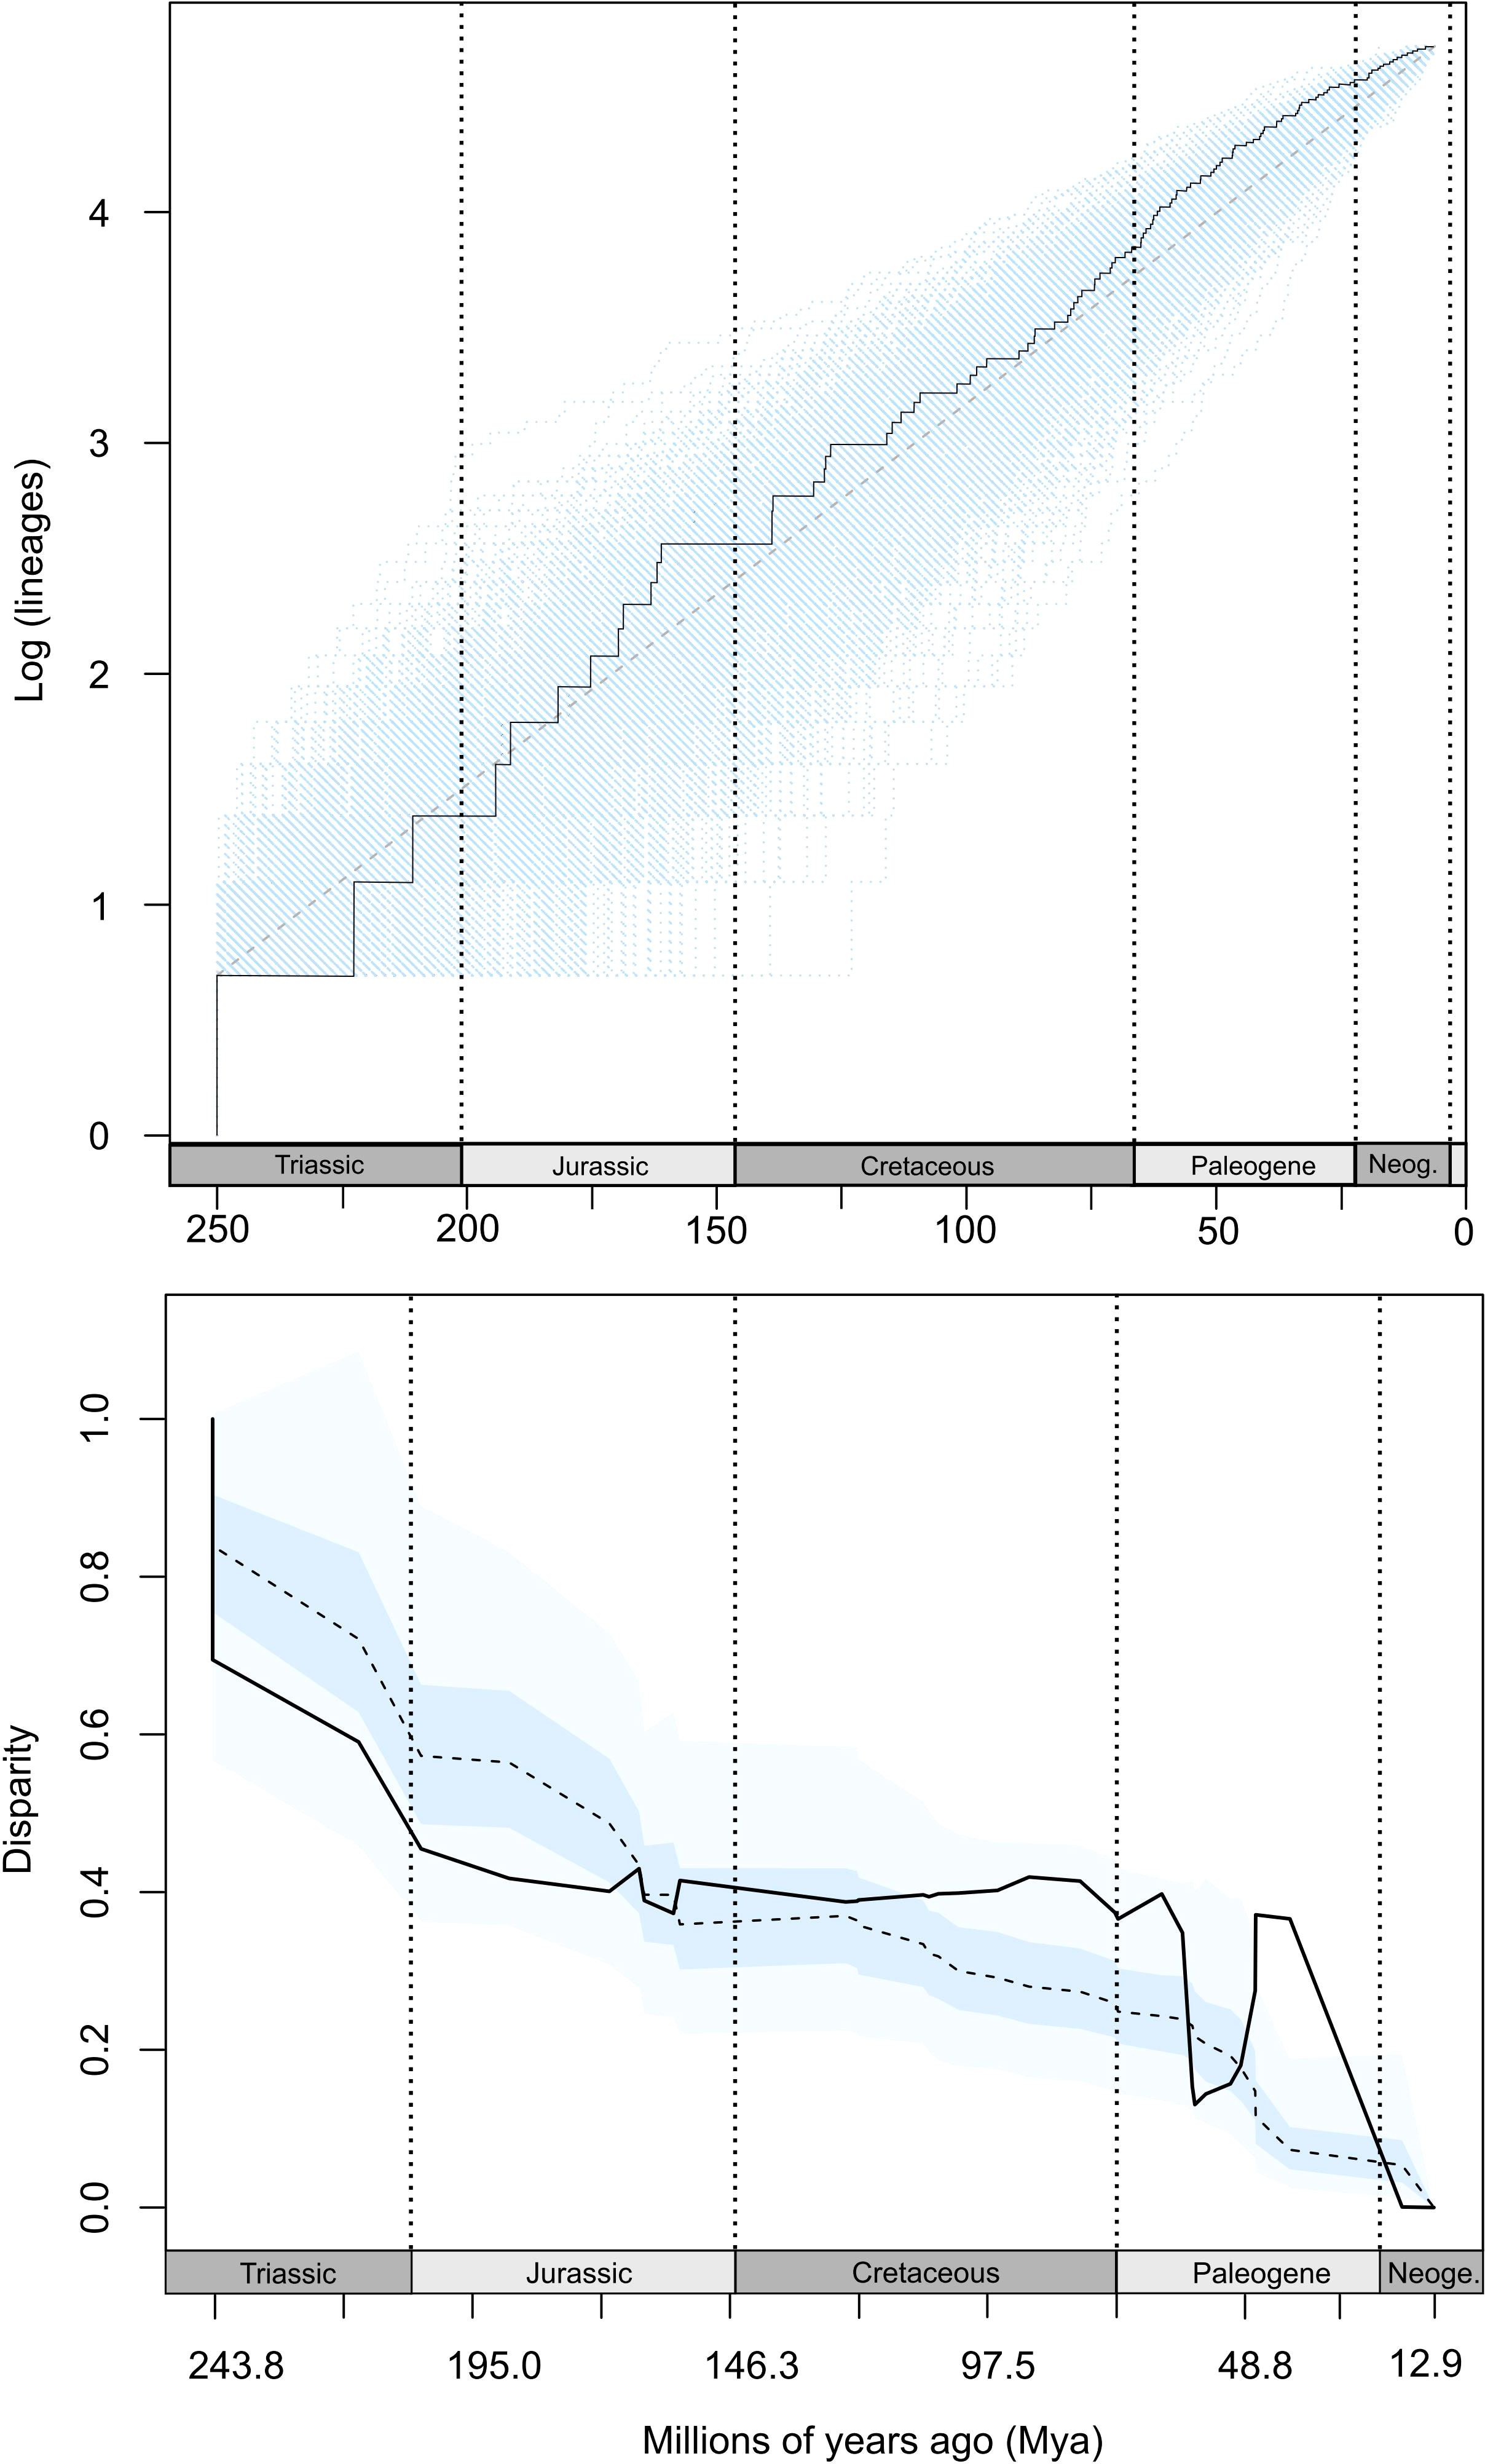
Figure 4 Top: Lineage-through time (LTT) accumulation curve for Achelata clade (solid line), from 112 species. Sky-blue-coloured area represents confidence interval estimated from 1000 simulated trees under the pure-birth null model. Diagonal dashed line designates the mean value from simulations. Bottom: Disparity-through-time (DTT) for shape (solid line). Coloured areas represent confidence intervals estimated from simulations under BM. Dashed line is the median disparity from simulations. Vertical dotted lines indicate divisions between geological periods.
3.3 Phylogenetic signal of shape
The multivariate measure of phylogenetic signal was Kmult = 0.929, indicating that shape of phyllosoma I had a significant phylogenetic signal (P < 0.0002) under the BM expectation of 1. The Kmult value corresponded to a shape variation pattern in which closely related species’ shapes were more similar than expected under BM. However, the phylomorphospace revealed overlaps between some groups of Palinuridae and Scyllaridae species (see Figure 2). For instance, some Ibacinae (Parribacus antarcticus and P. caledonicus) and Arctidinae species (Arctides regalis and Scyllarides aequinoctialis) had large antennae and pear-shaped cephalic shield that resemble some palinurids. Among Scyllaridae subfamilies, Scyllarinae showed a characteristic shape (short antennae and wide rounded cephalic shield) absent in Arctidinae and Ibacine, yet like the ones present in Theninae (Figure 2). Within Palinuridae, Silentes were marginally separated from Stridentes species. The broad occupation of palinurids in the morphospace suggested a more recent burst of shape variation in relation to the other subclades, while narrow occupation of Theninae and Scyllarinae indicated an early burst of morphological diversification within these subclades (Figure 2). The phylogenetic signals of PC1 (λPC1 = 0.927, P < 0.0001), and antenna length (λANT = 0.869, P < 0.0001) pointed out that correlation of each independent trait was closely linked to the expected correlation under BM. In contrast, phylogenetic signals of PC2 (λPC2 = 0.683, P = 0.099) and CS (λCS = 0.168, P = 0.413) indicated that variation of these traits may be independently determined by some external condition rather than the intrinsic phylogenetic position of species.
Pairwise-contrast plots exhibited shape convergence between phylogenetically distant species (Figure 5, red-scale points) and shape divergences larger than expected under the BM model (Figure 5, blue-scale points). Comparing our dataset of observed species-pair shape divergences with species-pair shape divergences simulated under the BM model, we found a total of 150 species pairs comparisons with lower observed divergence than expected under BM in 95% of the simulations (Figure 5, black points), indicating a significant shape convergence in species conforming these pair comparisons. A total of 74 out of these comparisons contained any species belonging to Scyllarinae or Panulirus species.
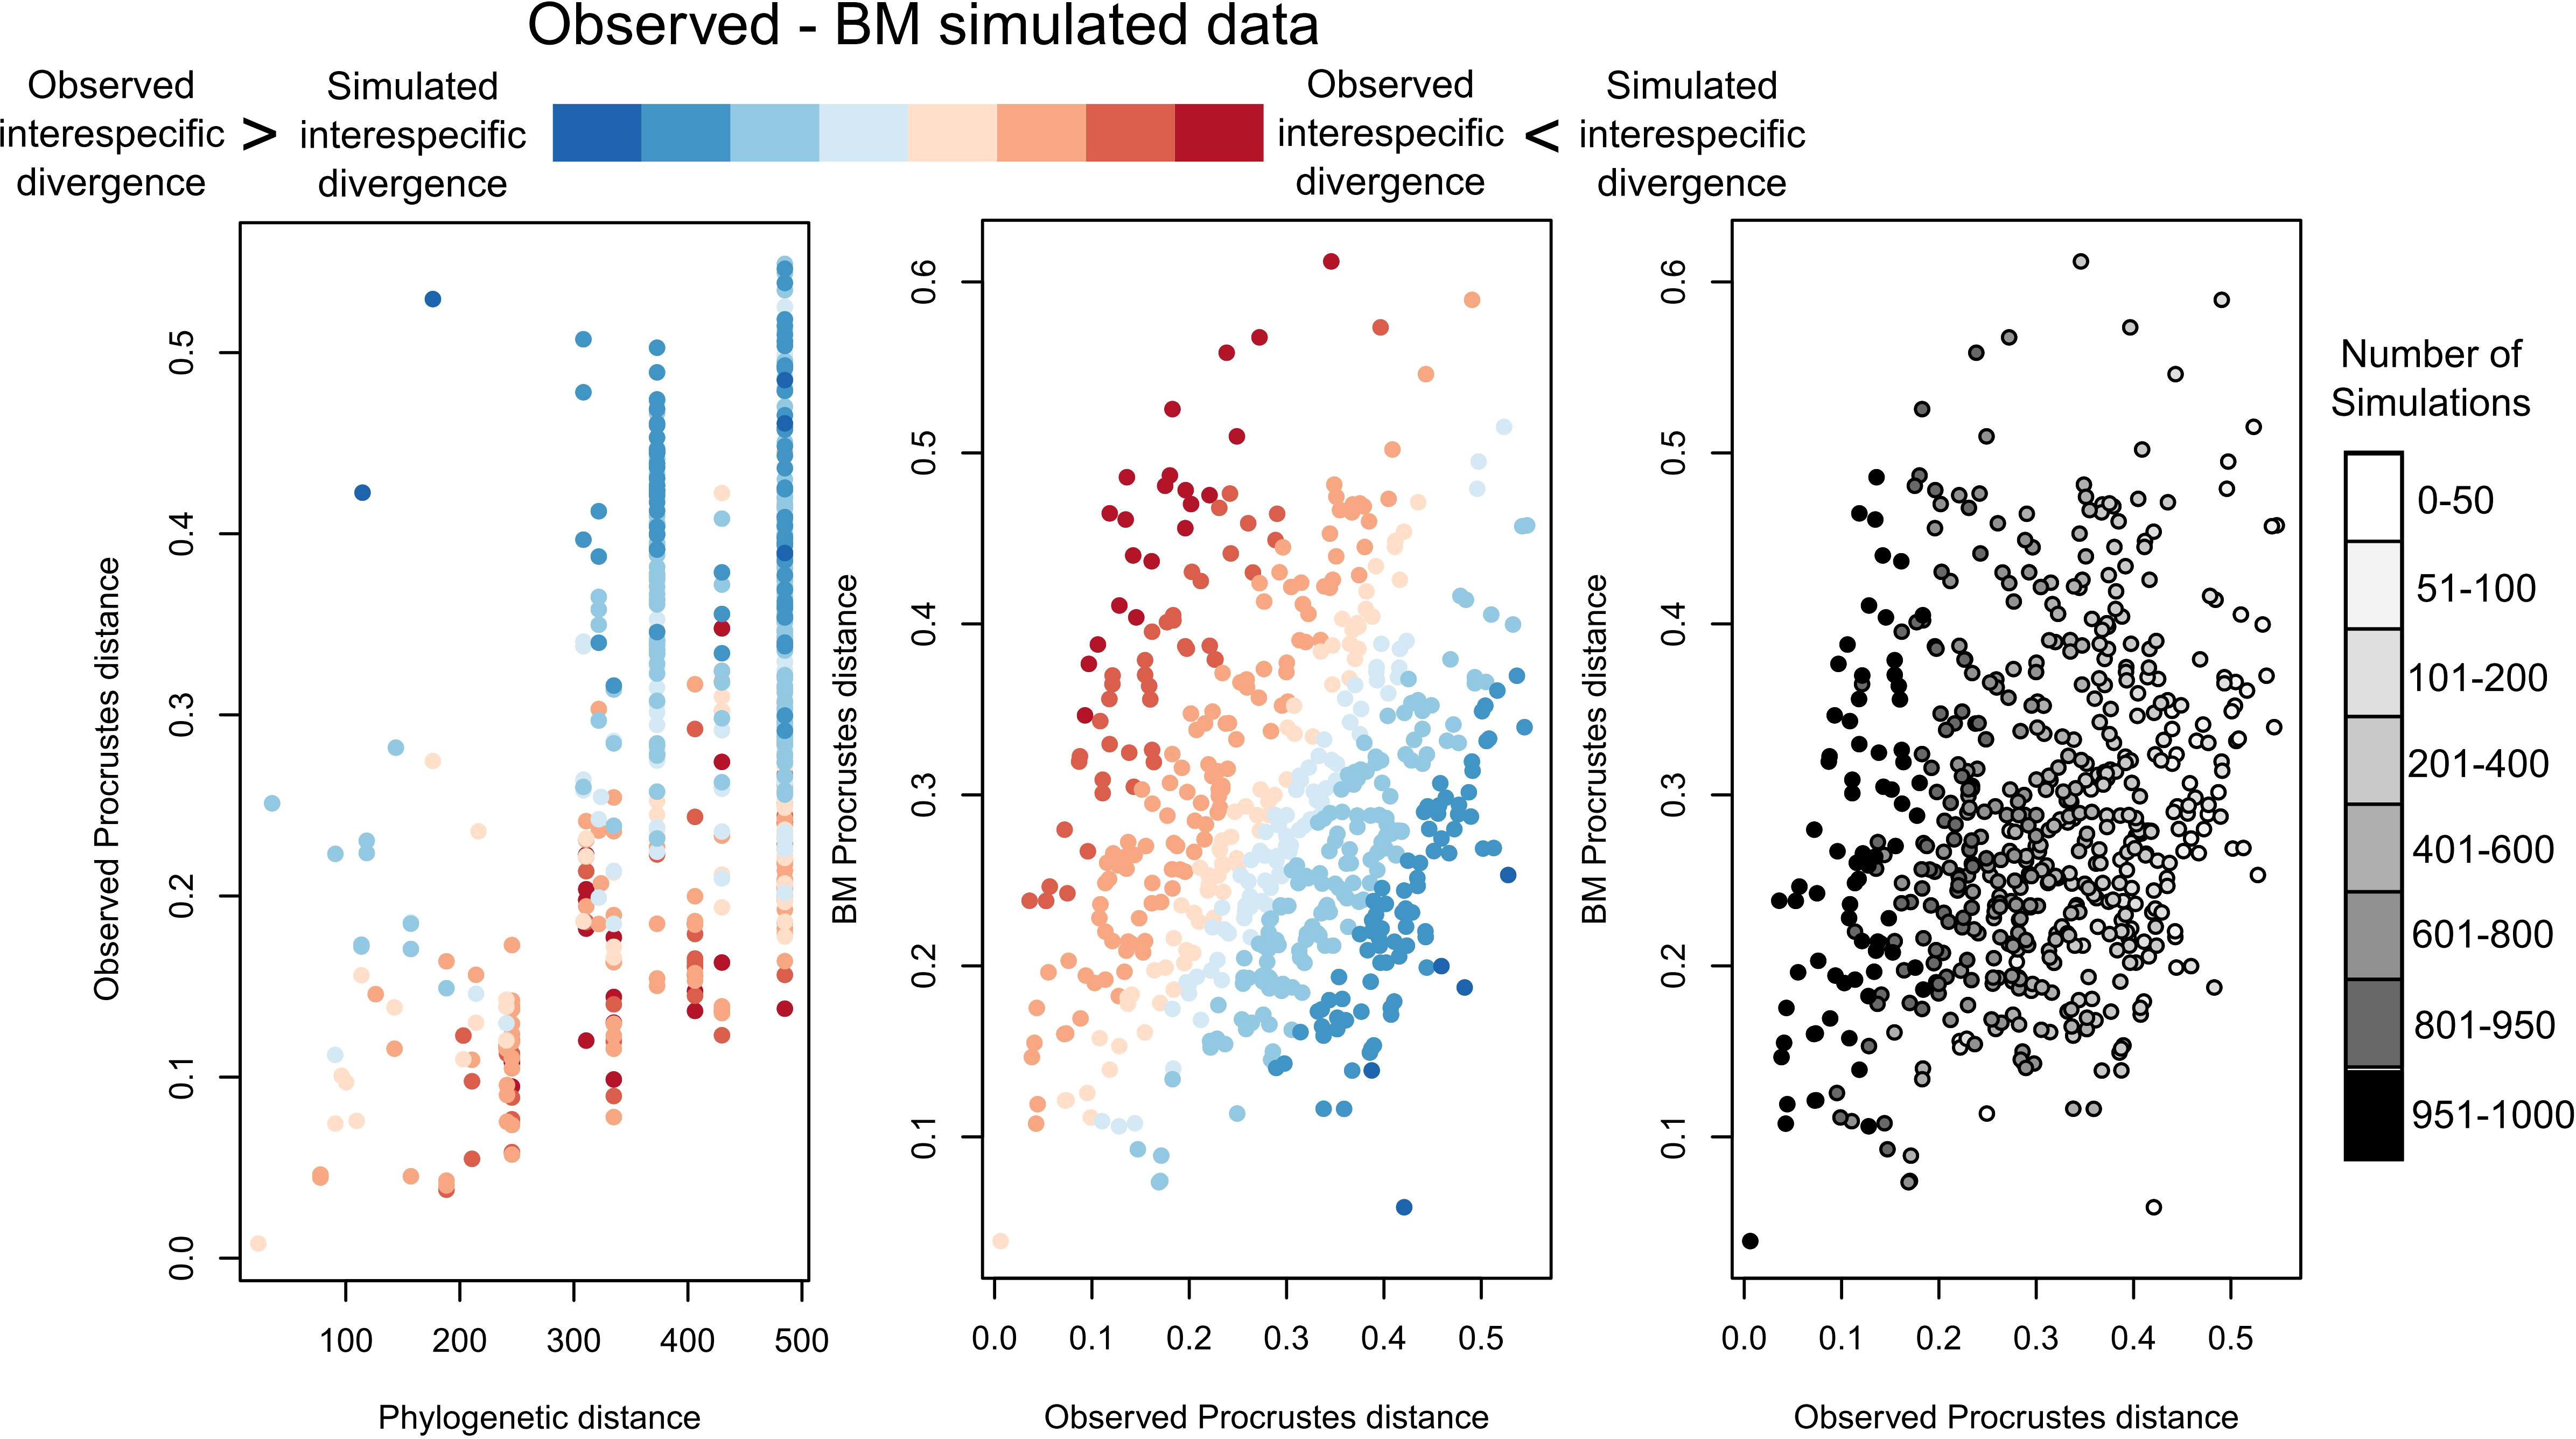
Figure 5 Pairwise distance-contrast plots. Red and blue colour scale was set from the difference between observed Procrustes distances and simulated distances under the Brownian motion model, while grey-scale colouration was set based on the number of simulations presenting lower observed Procrustes distances than the ones simulated under Brownian motion model.
3.4 Correlation between shape, size, and adult traits
We found that body size and antenna length were significant predictors of multidimensional shape (body size: Z = 3.267, P < 0.002; antenna length: Z = 3.626, P < 0.002), while maximum distribution depth and maximum size at adult phase were not significant predictors. In case of the individual regressions of PCs, CS, and antenna length on adult variables, only the maximum distribution depth of adults was negatively correlated with PC2 (λPC2 = 0.419, P < 0.02), while the other correlations were not significant (Supplementary Figure S3). This suggest that maximum depth of adults might be an evolutionary driver of shape variation in phyllosoma I.
3.5 Tempo and mode of shape diversification
The DTT analysis displayed a lower disparity than the median expected under BM from early to middle (Late Jurassic) history of Achelata. Then, disparity increased over the median expected under BM along with the whole Cretaceous, and then slowed down until mid-Paleogene, from which it experienced a positive peak (see Figure 4). The nonsignificant MDI value (0.007, P = 0.926) indicated that the DDT curve was closely fitted to the expectations of the BM, that in this case was translated into a compensating trend of disparity along with the whole evolutionary history of Achelata. The ancestral state reconstructions of PC1 and PC2 showed that the common ancestor of Achelata might had presented PC scores (PC1 = -0.0037, PC2 = -0.0006) whose shape closely corresponded with the shape of Panulirus argus (Figure 6). This species had a phyllosoma with medium-size antennae and pear-shape shield (Figure 2). In addition, the ancestral reconstruction indicated that main changes in states of PC1 occurred after the divergence of Palinuridae and Scyllaridae. The main changes in PC1 were concentrated at early history of Scyllarinae and Silentes, while later variations took place within Panulirus (Stridentes, Palinuridae) and Parribacus (Ibacinae, Scyllaridae). PC2 remained more stable throughout evolutionary history, the main changes in this component of shape occurred in Puerulus (Stridentes), Ibacinae and Arctidinae (Figure 6). Scyllaridae species retained PC2 scores close to the common ancestor of Achelata.
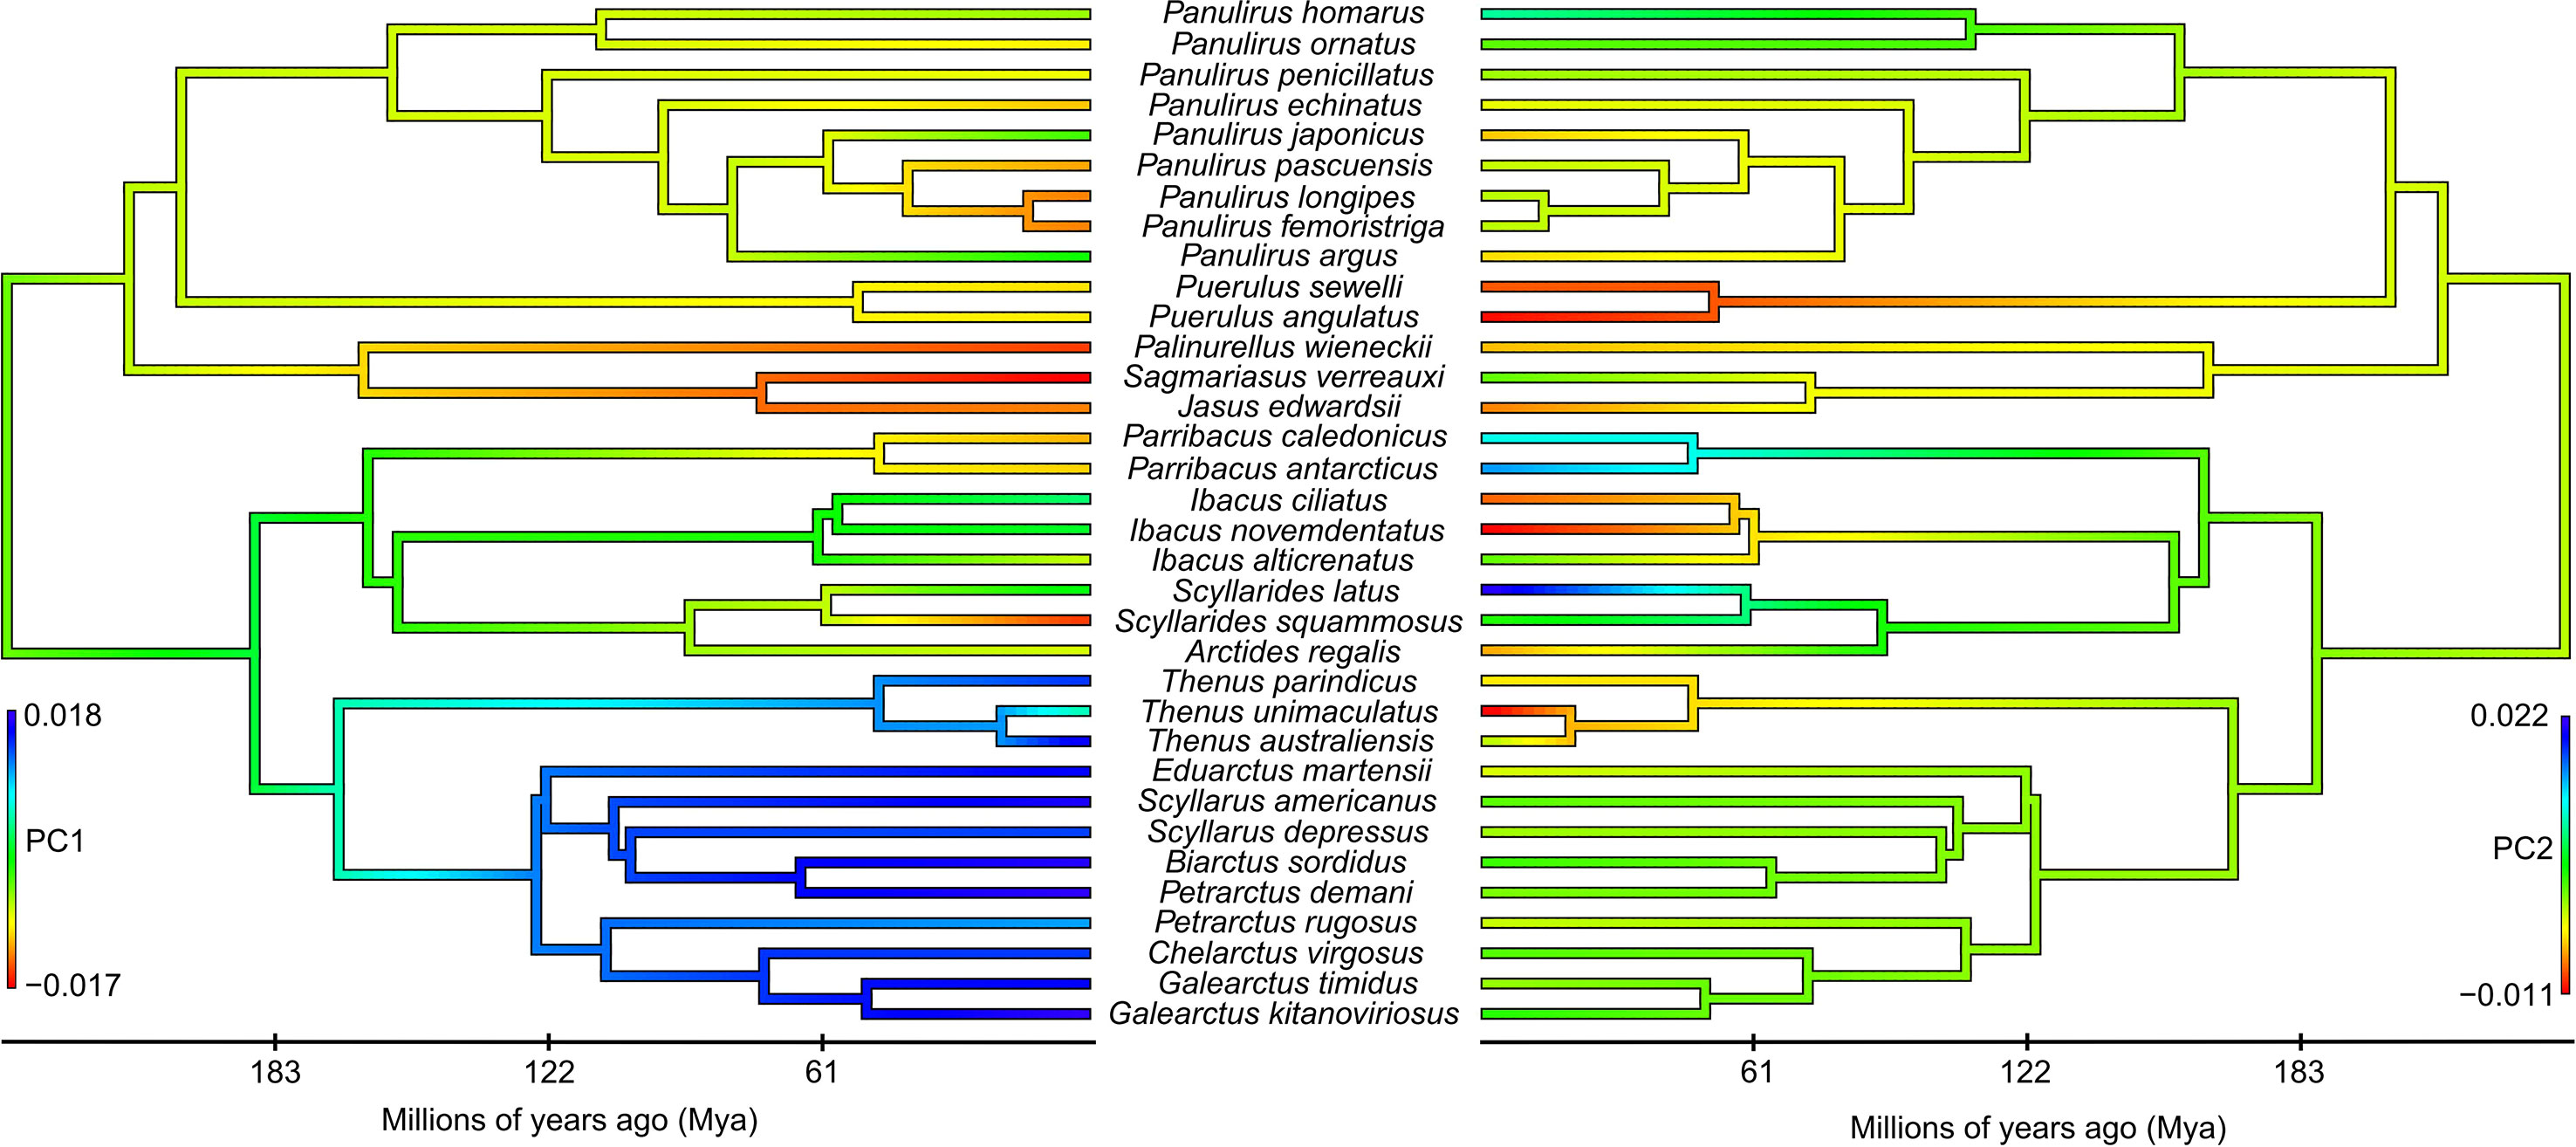
Figure 6 Ancestral state reconstruction of PC1 (left) and PC2 (right). Legends depict reference values for colour gradients in contour-map phylogenies and scales indicate ages in millions of years ago (Mya).
4 Discussion
4.1 Phylogenetic significance of shape
Our findings partially support an association of phylogenetic and shape divergences between Palinuridae and Scyllaridae. As expected, phyllosoma I with more rounded cephalic shields and short antennae mainly belong to Scyllaridae, whereas Palinuridae grouped those larvae with more pear-shaped shields and large antennae. These shape differences were reflected in the high phylogenetic signals detected in the multivariate shape, main shape trajectory (PC1) and antenna length. At the family level, these shapes have been traditionally used to discriminate scyllarid from palinurid phyllosomata collected in the field (Santos and González-Gordillo, 2004). These differences in phyllosoma shape are even more evident in more developed larval stages (Baisre, 1994).
Based on our shape data, in combination with other phyllosoma traits previously used (Baisre, 1994), fossil records, distribution ranges, and genetic information (George, 2006; Palero et al., 2009; Yang et al., 2012), we can mention some insights about the phylogenetic significance of the shape of phyllosoma I. The shape data could not separate Arctidinae and Ibacinae of Scyllaridae from Palinuridae species, reflecting a discordance between taxonomic and morphological diversity. It occurred because the antennae in these Scyllaridae subfamilies are as large as those present in Palinuridae and share the biramous state of this trait with Silentes species (Jasus, Palinurellus, and Sagmariasus). Interestingly, most scyllarid featuring this shape hatch in an ontogenetic state before phyllosoma, which is named naupliosoma and is also present in palinurid lobster (Webber and Booth, 2007). The absence/presence of this ontogenetic state across Achelata families might indicate that hatching as phyllosoma is a derived state. The absence of naupliosoma has been related to shortened development (Baisre, 1994), and their association with phyllosoma larvae I with short antenna and wider cephalic shield might indicate a developmental link between the state at hatching and the two main phyllosoma shapes described here.
Within Scyllaridae, the shape variation of phyllosoma I supported the sister relationship of subfamilies Theninae and Scyllarinae observed on traits from first and last phyllosoma instars (Baisre, 1994), adult traits (Yang et al., 2012), and genetic information (Palero et al., 2009; Yang et al., 2012, this study). In addition, the pear-shaped cephalic shield and large antennae found in Parribacus (Ibacinae) and Arctidinae are concordant with previous evidence to place Parribacus closer to Arctidinae rather than to other Ibacinae genus (Baisre, 1994; Booth et al., 2005). However, this closer morphological relationship between Parribacus and Arctidinae was not observed in our phylogeny including most of species from these subclades but reported in a previous phylogenetic study (Yang et al., 2012).
In the case of Stridentes within Palinuridae, the largest genus Panulirus occupied a wide region of the morphospace, indicating broader ecological speciation. However, shape data of phyllosoma I did not separate this genus into the two main groups as previously observed in phylogenetic analyses (Ptacek et al., 2001) and morphological characters of adults and phyllosoma (Patek and Oakley, 2003; George, 2006). Interestingly, the reconstructions of the ancestral state of PC1 and PC2 suggest that the common ancestor of Achelata (PC1 = -0.0037, PC2 = -0.0006) had a similar shape to Panulirus argus (PC1 = -0.0069, PC2 = 0.0001) (Figure 6, Figure 1), the hypothetical basal species of this genus (George, 2006). This might indicate a stasis of this shape in ancestors of Panulirus and that further shape variations in this genus occurred later.
In addition, shape data provides more evidence of phyllosoma similarity between Jasus and Puerulus suggesting a phylogenetic significance of the shape. Baisre (1994) has already proposed the common ancestry of these genera. Their phyllosoma have biramous antennae, but in comparison to scyllarid species with the biramous state, in Jasus and Puerulus the outer branch is much shorter than the inner one (Supplementary Figure S1). In Puerulus, the antennae are bifurcated near the basal part, while in Silentes, bifurcation occurs in the distal part. The biramous antennae are conserved within Silentes, but this state is alternated with the uniramous state within Stridentes. Thus, uniramous antennae have been observed in Panulirus, Palinustus (final stage, Palero et al., 2010), Justitia (J. longimana stage VII, Konishi et al., 2021) and Nupalirus (N. japonicus stage VIII, Konishi et al., 2021); and biramous in Puerulus, Palinurus (stage I, Palero and Abelló, 2007), and Linuparus (L. sordidus stage IV?, Inoue et al., 2001).
The alternance of both states in Palinuridae and Scyllaridae, and the divergence times of subfamilies and groups within each family indicate that both states of antennae emerged multiple times across Achelata. Given the contrasting variation of a trait such as antenna within this clade, which plays an important role in food selection and predator detection, further analysis assessing variation of antennae among species would shed light on ecological changes over the evolutionary history of Achelata.
4.2 Association with adult variables
We expected that shape of phyllosoma should be more influenced by the embryonic phase, directly related to the adult benthic habitat and mother condition. Among arthropods, larger females frequently give rise to larger offspring because of their more efficient nutrient provision than those of smaller mothers, but this relationship is often weak and is certainly not ubiquitous (Oliphant and Thatje, 2021). For instance, in the European lobster Homarus gammarus, belonging to Astacidea, mean larval size at hatching is closely linked to maternal size (Moland et al., 2010). In our study, we did not find a relationship between the maximum adult size and the size of phyllosoma I, suggesting that this relationship, if any, may occur more frequently at intraspecific level or that any existing correlation between adult and larvae size is accounted for the phylogenetic position of species. However, our analyses suggest that maximum distribution depth of adults is an ecological driver of shape variation. This adult trait has a negative correlation with PC2 (Supplementary Figure S3). This correlation shows that variation of PC2 scores occurred across different groups going from shallow to deep waters. High PC2 scores were present in Parribacus in shallow waters while small PC2 scores occurred in Ibacus and Puerulus, both genera occupying waters deeper than 300 m. High PC2 scores are related to species possessing a phyllosoma with wider anterior cephalic shields and large antenna, while low PC2 scores are associated with species with narrower anterior cephalic shields and smaller antenna. Phyllosomata of deep-water species must travel longer distance upwards to reach the upper layers of the water column, being exposed to higher predation risk. Longer relative antennae should facilitate tracking a bigger volume of surrounding water, increasing the perception of mechanical stimuli as happens in other planktonic organisms (i.e., copepods, Kiørboe, 2008). Considering that predation is a major evolutionary driver in Achelata (Spanier and Weihs, 1990), environments with higher predation pressure may have favored the selection for larger antennae. This negative correlation is also concordant with the multiple transition from shallow to deep waters found in analysis of scyllarid lobsters (Tsang et al., 2009; Yang et al., 2012) since Arctidinae that is distributed in shallow waters, has the oldest fossil records within Scyllaridae (Scyllarides punctatus, 120 Mya at mid-Cretaceous, Woods, 1925; Webber and Booth, 2007). On the other hand, the correlation contradicts the deep-shallow water transition previously proposed for palinurid lobsters (George, 2006) and documented for other decapods (Rodríguez-Flores et al., 2022) and marine invertebrate groups (Jablonski et al., 1983).
4.3 Tempo and mode of lineage and shape diversification
Adaptive radiations are characterized by a pattern of early lineage, morphological, and ecological diversification mainly triggered by ecological opportunities (Simpson, 1949) and followed by subsequent asymptotic declines in diversification rates over time (Schluter, 2000; Harmon et al., 2010). Our evidence suggests that Achelata did not experience an early burst of diversification and neither present a decline in lineage diversification at recent evolutionary history, rather it passed through two bursts of lineage and morphological diversification at mid and late evolutionary history (Figure 4). A similar pattern of nonearly radiation was also found in analyses of body plans of adults including Achelata and other groups within Decapoda (Schweitzer and Feldmann, 2014). The bursts of lineage diversification were concordant with the fit of branching times to a Yule model with shifts in speciation rate across time (Yule3rate) over models of diversity-dependence diversification (DDL, DDE), which are expected in clades diversifying through adaptive radiation processes (Schluter, 2000).
Nonelection of a diversity-dependence model is supported by low competition for resources between species as suggested by: (1) the scarce or absent geographical overlap and asymmetric depth distribution of Palinuridae species (George and Main, 1967; George, 2006) and some Scyllaridae genera; and (2) morphological specialization of some scyllarid clades that allow them to exploit a variety of different environments (Webber and Booth, 2007). Allopatric distribution and reduced competition joined with the two bursts of lineage diversification precluding long-temporal bursts of morphological disparity (over millions of years) indicate that they were produced through geographic isolation after punctual episodes of colonization followed by subsequent subtle ecological speciation (Rundell and Price, 2009; Czekanski-Moir and Rundell, 2019). Hence, lineage diversification of Achelata has been primarily triggered by nonadaptive radiation with minimal ecological diversification (Gittenberger, 1991; Gillespie, 2004; Rundell and Price, 2009). This mode of radiation explains the presence of some groups of closely related species with subtle ecological divergences but clear reproductive isolation within Palinuridae (see cases of Jasus (Brasher et al., 1992), and Panulirus (Chan and Chu, 1996) and Scyllaridae (e.g. Thenus (Burton and Davie, 2007), Galearctus and Petrarctus (Yang et al., 2012). Nonadaptive radiation is concordant with the absence of a diversity-dependence slowdown in lineage diversification at the end of the evolutionary history. This last finding also indicates that Achelata has not reached equilibrium yet and continue diversifying, in agreement with the highest diversity levels of reported at Holocene for this clade (Schweitzer and Feldmann, 2014).
Going into detail, the first burst of lineage diversification was dated around the transition from Jurassic to Cretaceous (ca. 160–80 Mya) as supported by previous estimates from fossil records (Schweitzer and Feldmann, 2014). It occurred posterior to the beginning of the major phase of Gondwana breakup (around 180 Mya) that separated Africa, South America, India, Antarctica, and Australia and allowed the widening of the Atlantic Ocean (Mcloughlin, 2001). As expected in a clade whose diversification follows a nonadaptive radiation mode, the formation of isolated lineages preluded a posterior increase of morphological disparity over millions of years as a slow response to the environmental conditions presented for each separate lineage (Gittenberger, 1991). The DDT plot indicates that morphological disparity remained higher than expected under the BM model across the whole Cretaceous, in which an episode of radiation occurred as suggested by diversity estimations from body plans (Schweitzer and Feldmann, 2014) and fossil records of several extinct genera (Astacodes, Cancrinos, Palinurina, and Palaeopalinurus) succeeding Yannanopalinurus schrani, the earliest known Achelata (Schram and Koenemann, 2021). Interestingly, this episode of radiation is coincident with changes in early ontogenetic stages of Achelata visualized in fossil records of Palinurina tenera possessing additional instars that are absent in extant species (Lavalli and Spanier, 2010), and variations in ancestral states of the main trajectories of shape principally occurring in ancestors of Stridentes, Silentes, Scyllarinae and Theninae (Figure 6).
The second burst of lineage diversification started in Late Cretaceous towards present (Figure 4) and is concordant with a major radiation previously reported (Schweitzer and Feldmann, 2014). Following the allopatric speciation hypothesis proposed by George (2006), this burst of lineage diversification occurred as consequence of tectonic changes that separated marine basins and then gave rise islands, providing new available environments for colonization and the subsequent second burst of morphological diversification (Figure 4). This burst might be related to changes in distribution depth as shown by variations in ancestral reconstruction of PC2 scores (Figure 6) and their negative significant correlation with the maximum distribution depth of adults (Supplementary Figure S3). Hence, colonization of different depths (i.e., new habitats) by ancestors might have represented an ecological opportunity that allowed lineage and ecological diversification (Simpson, 1949; Yoder et al., 2010). In addition, for this second burst, we cannot discard an ecological diversification of Achelata prompted by the presence of ecological opportunities due to prolonged extinction events around the Cretaceous-Paleogene limit that affected several decapod groups (Schweitzer and Feldmann, 2014). This is because one of the extinct groups that left available environments for colonization is Cancrinidae, whose members were present from Early Jurassic to Late Cretaceous (Schweitzer and Feldmann, 2014; Schram and Koenemann, 2021) and are considered the intermediate between palinurids and scyllarids (Haug et al., 2016; Schram and Koenemann, 2021).
Given the low shape divergences between largely distant species (Figure 5), their overlap in the phylomorphospace (Palinuridae with Arctidinae and Ibacinae) (Figure 2), and the conserved shape (phyllosoma I with biramous large antennae and pear-shaped cephalic shields) present in the old groups from each respective family (Scyllaridae: Scyllarides punctatus, 110–120 Mya (Woods, 1925); Palinuridae: Silentes (163 Mya, median estimated age)) (Figure 3, Supplementary Figure S2), it is likely that this shape might had also been present in the extinct Cancrinidae lobsters despite they possessed intermediate states of adult antenna forms between scyllarids and palinurids (Haug et al., 2016). However, they were intermingled with an allopatric speciation mode and subtle morphological differences (i.e., are attributes of a nonadaptive radiation, Gittenberger, 1991), not causing a substantial increase of the slow lineage diversification occurred over millions of years (Figure 3). This highlights the possibility that components of both types of radiation processes could have contributed to diversification of Achelata as reported in other invertebrate groups (Gillespie, 2004; Cotoras et al., 2018).
Nevertheless, as explained above some strong arguments for the dominance of nonadaptive radiation in diversification of Achelata are the degree of specialization of scyllarid species (Scyllarinae and Theninae), the overlap within the phylomorphospace (Figure 2), the pairwise-distance plots showing lower shape divergence than expected under the BM model (Figure 5, black points); the shape convergence in 150 species pairs (Figure 5, dark red points), the absence of a slowdown in lineage diversification and rather the highest diversifying trend at recent times (Schweitzer and Feldmann, 2014). However, under a hypothetical scenario of complete adaptive radiation, the possibility of geographic overlap between some species of Scyllaridae (Webber and Booth, 2007) and their shape similarities, indicate low levels of character displacement (Brown and Wilson, 1956; Schluter, 2000). This refers to accentuated phenotypic differences as response of competition for resources between sympatric species (Brown and Wilson, 1956), being a clear signal of slowdown in lineage diversification as consequence of diversity-dependence accumulation (Monroe and Bokma, 2017). However, the low level of character displacement detected here, and absent signature of lineage-diversification slowdown may indicate only a marginal contribution of some components of adaptive radiation in the dominant nonadaptive radiation processes occurred along with the diversification of Achelata lobsters.
It is a fact that diversification of early life stages (e.g. larval stages) is rarely considered in evolutionary studies. Like our study in slipper and spiny lobsters, others in echinoderms (Raff and Byrne, 2006), barnacles (Wong et al., 2018), and sparid fishes (Colangelo et al., 2019) indicated that morphological novelties present in adult stages are related to conspicuous morphologies originated since early life stages that allow species to exploit different environments and to reduce interspecific competition. Thus, these morphologies not only play a crucial role within a lifespan of a single specimen, but rather along with the evolutionary history of a clade. In this sense, we encourage the scientific community to further investigate the diversification of larval forms to increase our understanding of the evolution of target groups.
Data availability statement
The original contributions presented in the study are included in the article/Supplementary Materials. Further inquiries can be directed to the corresponding author.
Author contributions
KW, ST and JML contributed to conception and design of the study. EF organized the database. DD and ZZ performed the analysis. KW, DD and JML obtained funding needed to perform the study. JML, DD, wrote the mansucript with inputs by KW, ST, ZZ, QL, SH-L. All authors contributed to the article and approved the submitted version.
Funding
This study was funded by the Projects TRIATLAS (nº ref. 817578) and SUMMER from the H2020 program of the European Union and DESAFIO (PID2020- 118118RB-I00) from the Spanish Government. This work was partly supported by Grant-in-aid for the Promotion of Joint International Research (Fostering Joint International Research) (KAKENHI no. 17KK0157) to Kaori Wakabayashi. Diego Deville was supported by The Ministry of Education, Culture, Sports, Science and Technology (MEXT) fellowship. José M Landeira was supported by the “Beatriz Galindo” grant (BEAGAL 18/00172) from the Spanish Ministry of Science and Innovation. Effrosyni Fatira was funded from the European Union's Horizon Europe research and innovation programme under the Marie Skłodowska-Curie grant agreement No 101090322 PLEASE.
Conflict of interest
The authors declare that the research was conducted in the absence of any commercial or financial relationships that could be construed as a potential conflict of interest.
Publisher’s note
All claims expressed in this article are solely those of the authors and do not necessarily represent those of their affiliated organizations, or those of the publisher, the editors and the reviewers. Any product that may be evaluated in this article, or claim that may be made by its manufacturer, is not guaranteed or endorsed by the publisher.
Supplementary material
The Supplementary Material for this article can be found online at: https://www.frontiersin.org/articles/10.3389/fmars.2023.1070296/full#supplementary-material
References
Adams D. C. (2014). A generalized K statistic for estimating phylogenetic signal from shape and other high-dimensional multivariate data. Syst. Biol. 63, 685–697. doi: 10.1093/sysbio/syu030
Adams D. C., Otárola-Castillo E. (2013). Geomorph: an r package for the collection and analysis of geometric morphometric shape data. Methods Ecol. Evol. 4, 393–399. doi: 10.1111/2041-210X.12035
Baisre J. A. (1994). Phyllosoma larvae and the phylogeny of palinuroidea (Crustacea: Decapoda): A review. Mar. Freshw. Res. 45, 925–944. doi: 10.1071/mf9940925
Baisre J. A., De Quevedo M. E. R. (1982). Two phyllosome larvae of Panulirus laevicauda (Latreille 1817) (Decapoda, palinuridae) from the Caribbean Sea with a discussion about larval groups within the genus. Crustaceana 43, 147–153. doi: 10.1163/156854082X00470
Bonhomme V., Picq S., Gaucherel C., Claude J. (2014). Momocs: Outline analysis using r. J. Stat. Software 56, 1–24. doi: 10.18637/jss.v056.i13
Booth J. D., Webber W. R., Sekiguchi H., Coutures E. (2005). Review. diverse larval recruitment strategies within the scyllaridae. N. Z. J. Mar. Freshw. Res. 39, 581–592. doi: 10.1080/00288330.2005.9517337
Bouckaert R. R., Drummond A. J. (2017). bModelTest: Bayesian phylogenetic site model averaging and model comparison. BMC Evol. Biol. 17, 42. doi: 10.1186/s12862-017-0890-6
Bouckaert R., Vaughan T. G., Barido-Sottani J., Duchêne S., Fourment M., Gavryushkina A., et al. (2019). BEAST 2.5: An advanced software platform for Bayesian evolutionary analysis. PloS Comput. Biol. 15, e1006650. doi: 10.1371/journal.pcbi.1006650
Bradford R. W., Bruce B. D., Chiswell S. M., Booth J. D., Jeffs A., Wotherspoon S. (2005). Vertical distribution and diurnal migration patterns of Jasus edwardsii phyllosomas off the east coast of the north island, new Zealand. N. Z. J. Mar. Freshw. Res. 39, 593–604. doi: 10.1080/00288330.2005.9517338
Brasher D. J., Ovenden J. R., White R. W. G. (1992). Mitochondrial DNA variation and phylogenetic relationships of Jasus spp. (Decapoda: Palinuridae). J. Zool. 227, 1–16. doi: 10.1111/j.1469-7998.1992.tb04340.x
Brown W. L., Wilson E. O. (1956). Character displacement. Syst. Zool. 5, 49–64. doi: 10.2307/2411924
Burnham K. P., Anderson D. R. (2002). Model selection and multimodel inference. a practical information-theoretic approach (New York: Springer).
Burton T. E., Davie P. (2007). A revision of the shovel-nosed lobsters of the genus Thenus (Crustacea: Decapoda: Scyllaridae), with descriptions of three new species. Zootaxa 1429, 1–38. doi: 10.11646/zootaxa.1429.1.1
Butler M. J. IV, Paris C. B., Goldstein J. S., Matsuda H., Cowen R. K. (2011). Behavior constrains the dispersal of long-lived spiny lobster larvae. Mar. Ecol. Prog. Ser. 422, 223–237. doi: 10.3354/meps08878
Castresana J. (2000). Selection of conserved blocks from multiple alignments for their use in phylogenetic analysis. Mol. Biol. Evol. 17, 540–552. doi: 10.1093/oxfordjournals.molbev.a026334
Chan T.-Y. (2019). “Updated checklist of the world’s marine lobsters,” in Lobsters: Biology, fisheries and aquaculture. Eds. Radhakrishnan E. V., Phillips B. F., Achamveetil G. (Singapore: Springer), 35–64. doi: 10.1007/978-981-32-9094-5_5
Chan T. Y., Chu K. H. (1996). On the different forms of Panulirus longipes femoristriga (von martens 1872) (Crustacea: Decapoda: Palinuridae), with description of a new species. J. Nat. Hist. 30, 367–387. doi: 10.1080/00222939600770201
Colangelo P., Ventura D., Piras P., Pagani Guazzugli Bonaiuti J., Ardizzone G. (2019). Are developmental shifts the main driver of phenotypic evolution in diplodus spp. (Perciformes: Sparidae)? BMC Evol. Biol. 19, 1–12. doi: 10.1186/s12862-019-1424-1
Cotoras D. D., Bi K., Brewer M. S., Lindberg D. R., Prost S., Gillespie R. G. (2018). Co-Occurrence of ecologically similar species of Hawaiian spiders reveals critical early phase of adaptive radiation. BMC Evol. Biol. 18, 100. doi: 10.1186/s12862-018-1209-y
Czekanski-Moir J. E., Rundell R. J. (2019). The ecology of nonecological speciation and nonadaptive radiations. Trends Ecol. Evol. 34, 400–415. doi: 10.1016/j.tree.2019.01.012
Feldmann R. M., Schweitzer C. E., Hu S., Zhang Q., Zhou C., Xie T., et al. (2012). Macrurous decapoda from the luoping biota (Middle Triassic) of China. J. Paleontol. 86, 425–441. doi: 10.1666/11-113.1
Felsenstein J. (1985). Phylogenies and the comparative method. Am. Nat. 125 (1), 1–15. doi: 10.1086/284325
George R. W. (2006). Tethys origin and subsequent radiation of the spiny lobsters (Palinuridae). Crustaceana 79, 397–422. doi: 10.1163/156854006777554848
George R. W., Main A. R. (1967). The evolution of spiny lobsters (Palinuridae): A study of evolution in the marine environment. Evolution 21, 803–820. doi: 10.2307/2406775
Gillespie R. (2004). Community assembly through adaptive radiation in Hawaiian spiders. Science 303, 356–359. doi: 10.1126/science.1091875
Gittenberger E. (1991). What about non-adaptive radiation? Biol. J. Linn. Soc 43, 263–272. doi: 10.1111/j.1095-8312.1991.tb00598.x
Hamasaki K., Mizumoto Y., Jinbo T., Murakami K. (2012). Ontogenetic change of body density and shape of the phyllosoma larvae of the Japanese spiny lobster Panulirus japonicus. J. Crust. Biol. 32, 395–404. doi: 10.1163/193724012X626548
Harmon L. J., Losos J. B., Davies T. J., Gillespie R. G., Gittleman J. L., Jennings W. B., et al. (2010). Early bursts of body size and shape evolution are rare in comparative data. Evol.; Int. J. Org. Evol. 64, 2385–2396. doi: 10.1111/j.1558-5646.2010.01025.x
Harmon L. J., Schulte J. A., Larson A., Losos J. B. (2003). Tempo and mode of evolutionary radiation in iguanian lizards. Science 301, 961–964. doi: 10.1126/science.1084786
Harmon L. J., Weir J. T., Brock C. D., Glor R. E., Challenger W. (2008). GEIGER: investigating evolutionary radiations. Bioinformatics 24, 129–131. doi: 10.1093/bioinformatics/btm538
Haug J. T., Audo D., Charbonnier S., Palero F., Petit G., Abi Saad P., et al. (2016). The evolution of a key character, or how to evolve a slipper lobster. Arthropod Struct. Dev. 45, 97–107. doi: 10.1016/j.asd.2015.08.003
Haug J. T., Haug C. (2016). Intermetamorphic” developmental stages in 150 million-year-old achelatan lobsters – the case of the species tenera oppel 1862. Arthropod Struct. Dev. 45, 108–121. doi: 10.1016/j.asd.2015.10.001
Hidaka C., Yang C. H., Wakabayashi K. (2022). Finding the missing puzzle piece of the nisto stage in the larval cycle of the slipper lobster Scyllarides squammosus: a molecular and morphological approach. Zool. Stud. 61, 73. doi: 10.6620/ZS.2022.61-73
Holthuis L. B. (2002). The indo-pacific scyllarine lobsters (Crustacea, decapoda, scyllaridae). Zoosystema 24, 499–693.
Holthuis L. B. (2006). Revision of the genus Arctides holthuis 1960 (Crustacea, decapoda, scyllaridae). Zoosystema 28 (2), 417–433.
Inoue N., Sekiguchi H., Yeh S. P. (2001). Spatial distributions of phyllosoma larvae (Crustacea: Decapoda: Palinuridae and scyllaridae) in Taiwanese waters. J. Oceanogr. 57, 535–548. doi: 10.1023/A:1021243301320
Jablonski D., Sepkoski J. J., Bottjer D. J., Sheehan P. M. (1983). Onshore-offshore patterns in the evolution of phanerozoic shelf communities. Science 222, 1123–1125. doi: 10.1126/science.222.4628.1123
Kiørboe T. (2008). A mechanistic approach to plankton ecology (Princeton: Princeton University Press), 209.
Konishi K., Yanagimoto T., Chow S. (2021). Morphological descriptions for late stage phyllosomas of furrow lobsters (Crustacea, decapoda, achelata, palinuridae) collected off Okinawa islands, Japan. Aquat. Anim. AA2021–7. doi: 10.34394/aquaticanimals.AA2021.0_AA2021-7
Lavalli K. L., Spanier E. (2010). “Infraorder palinura latreille,” in Treatise on zoology— the Crustacea, vol. 9A . Eds. Schram F. R., von Vaupel Klein J. C. (the Netherlands: Brill, Leiden), 425–532. 1802.
Mcloughlin S. (2001). The breakup history of gondwana and its impact on pre-Cenozoic floristic provincialism. Aus. J. Bot. 49, 271–300. doi: 10.1071/BT00023
Moland E., Olsen E. M., Stenseth N. C. (2010). Maternal influences on offspring size variation and viability in wild European lobster Homarus gammarus. Mar. Ecol. Prog. Ser. 400, 165–173. doi: 10.3354/meps08397
Monroe M. J., Bokma F. (2017). Does density-dependent diversification mirror ecological competitive exclusion? PloS One 12, e0184814. doi: 10.1371/journal.pone.0184814
Muschick M., Indermaur A., Salzburger W. (2012). Convergent evolution within an adaptive radiation of cichlid fishes. Curr. Biol. 22, 2362–2368. doi: 10.1016/j.cub.2012.10.048
Nee S., May R. M., Harvey P. H. (1994). The reconstructed evolutionary process. Philos. Trans. R. Soc Lond. B. Biol. Sci. 344, 305–311. doi: 10.1098/rstb.1994.0068
Oliphant A., Thatje S. (2021). Variable shrimp in variable environments: reproductive investment within Palaemon varians. Hydrobiologia 848, 469–484. doi: 10.1007/s10750-020-04455-z
Pagel M. (1999). Inferring the historical patterns of biological evolution. Nature 401, 877–884. doi: 10.1038/44766
Palero F., Abelló P. (2007). The first phyllosoma stage of Palinurus mauritanicus (Crustacea: Decapoda: Palinuridae). Zootaxa 1508, 49–59. doi: 10.11646/zootaxa.1508.1.2
Palero F., Crandall K. A., Abelló P., Macpherson E., Pascual M. (2009). Phylogenetic relationships between spiny, slipper and coral lobsters (Crustacea, decapoda, achelata). Mol. Phylogenet. Evol. 50, 152–162. doi: 10.1016/j.ympev.2008.10.003
Palero F., Guerao G., Clark P. F., Abelló P. (2010). Final-stage phyllosoma of Palinustus a. Milne-edwards 1880 (Crustacea: Decapoda: Achelata: Palinuridae)–the first complete description. Zootaxa 2403, 42–58. doi: 10.11646/zootaxa.2403.1.4
Patek S. N., Oakley T. H. (2003). Comparative tests of evolutionary trade-offs in a palinurid lobster acoustic system. Evolution 57, 2082–2100. doi: 10.1016/0022-0981(91)90003-F
Phillips B. F., Booth J. D., Cobb J. S., Jeffs A. G., McWilliam P. (2006). “Larval and postlarval ecology,” in Lobsters: Biology, management, aquaculture and fisheries. Ed. Phillips B. F. (Oxford: Blackwell Publishing).
Phillips B. F., Macmillan D. L. (1987). Antennal receptors in puerulus and postpuerulus stages of the rock lobster Panulirus cygnus (Decapoda: Palinuridae) and their potential role in Puerulus navigation. J. Crust. Biol. 7, 122–135. doi: 10.2307/1548631
Pinna G. (1974). I Crostacei della fauna triassica di cene in Val seriana (Bergamo). Atti Soc Ital. Sci. Nat. Mus. Civico Storia Nat. Milano 21, 5–34.
Posada D., Buckley T. R. (2004). Model selection and model averaging in phylogenetics: advantages of akaike information criterion and Bayesian approaches over likelihood ratio tests. Syst. Biol. 53, 793–808. doi: 10.1080/10635150490522304
Ptacek M., Sarver S., Childress M., Herrnkind W. (2001). Molecular phylogeny of the spiny lobster genus Panulirus (Decapoda: Palinuridae). Mar. Freshw. Res. 52 (8), 1037–1047. doi: 10.1071/MF01070
Pybus O. G., Harvey P. H. (2000). Testing macro-evolutionary models using incomplete molecular phylogenies. Philos. Trans. R. Soc Lond. B. Biol. Sci. 267, 2267–2272. doi: 10.1098/rspb.2000.1278
Rabosky D. L. (2006). LASER: A maximum likelihood toolkit for detecting temporal shifts in diversification rates from molecular phylogenies. Evol. Bioinform. Online 2, 117693430600200030. doi: 10.1177/117693430600200024
Raff R. A., Byrne M. (2006). The active evolutionary lives of echinoderm larvae. Heredity. 97, 244–252. doi: 10.1038/sj.hdy.6800866
Revell L. J. (2012). Phytools: an r package for phylogenetic comparative biology (and other things). Methods Ecol. Evol. 3, 217–223. doi: 10.1111/j.2041-210X.2011.00169.x
Rodríguez-Flores P. C., Macpherson E., Schnabel K. E., Ahyong S. T., Corbari L., Machordom A. (2022). Depth as a driver of evolution and diversification of ancient squat lobsters (Decapoda, galatheoidea, phylladiorhynchus). Mol. Phylogenet. Evol. 171, 107467. doi: 10.1016/j.ympev.2022.107467
Rohlf F. J. (2017) tpsDig, digitize landmarks and outlines, version 2.31 (Department of Ecology and Evolution, State University of New York at Stony Brook). Available at: https://life.bio.sunysb.edu/morph/ (Accessed 20 Jun 2018).
Rohlf F. J., Archie J. W. (1984). A comparison of fourier methods for the description of wing shape in mosquitoes (Diptera: Culicidae). Syst. Biol. 33, 302–317. doi: 10.2307/2413076
Rundell R. J., Price T. D. (2009). Adaptive radiation, nonadaptive radiation, ecological speciation and nonecological speciation. Trends Ecol. Evol. 24, 394–399. doi: 10.1016/j.tree.2009.02.007
Santos A.d., González-Gordillo J. I. (2004). Illustrated keys for the identification of the pleocyemata (Crustacea: Decapoda) zoeal stages, from the coastal region of south-western Europe. J. Mar. Biolog. Assoc. U.K. 84, 205–227. doi: 10.1017/S0025315404009075h
Schneider C. A., Rasband W. S., Eliceiri K. W. (2012). NIH Image to ImageJ: 25 years of image analysis. Nat. Methods 9, 671–675. doi: 10.1038/nmeth.2089
Schram F. R., Koenemann S. (2021). Evolution and phylogeny of pancrustacea: A story of scientific method (New York: Oxford University Press). doi: 10.1093/oso/9780195365764.001.0001
Schweitzer C. E., Feldmann R. M. (2014). Lobster (Decapoda) diversity and evolutionary patterns through time. J. Crust. Biol. 34, 820–847. doi: 10.1163/1937240X-00002288
Sidlauskas B. (2008). Continuous and arrested morphological diversification in sister clades of characiform fishes: A phylomorphospace approach. Evolution 62, 3135–3156. doi: 10.1111/j.1558-5646.2008.00519.x
Spanier E., Weihs D. (1990). Escape swimming of the Mediterranean slipper lobster Scyllarides latus: behavioral and hydrodynamic aspects. Am. Zool. 30, 122.
Tsang L. M., Chan T.-Y., Cheung M. K., Chu K. H. (2009). Molecular evidence for the southern hemisphere origin and deep-sea diversification of spiny lobsters (Crustacea: Decapoda: Palinuridae). Mol. Phylogenet. Evol. 51, 304–311. doi: 10.1016/j.ympev.2009.01.015
Webber W. R., Booth J. D. (2007). “Taxonomy and evolution,” in The biology and fisheries of the slipper lobster. Eds. Lavalli K. L., Spanier E. (Boca Raton: Taylor & Francis/CRC Press), 25–52.
Williamson D. I. (1985). “Evolutionary trends in larval form,” in Aspects of decapod crustacean biology. Ed. Fincham A. A., Rainbow P. S.. Symposia of the Zoological Society of London. 59, 11–25.
Wolfe J. M., Breinholt J. W., Crandall K. A., Lemmon A. R., Lemmon E. M., Timm L. E., et al. (2019). A phylogenomic framework, evolutionary timeline and genomic resources for comparative studies of decapod crustaceans. Philos. Trans. R. Soc Lond. B. Biol. Sci. 286, 20190079. doi: 10.1098/rspb.2019.0079
Wong J. Y., Chan K. Y. K., Chan B. K. K. (2018). Phylogenetic, ecological and biomechanical constraints on larval form: A comparative morphological analysis of barnacle nauplii. PloS One 13, e0206973. doi: 10.1371/journal.pone.0206973
Woods H. (1925). A monograph on the fossil macrurous crustacea of England (London: Adlard & Son Ltd), 122.
Yang C.-H., Bracken-Grissom H., Kim D., Crandall K. A., Chan T.-Y. (2012). Phylogenetic relationships, character evolution, and taxonomic implications within the slipper lobsters (Crustacea: Decapoda: Scyllaridae). Mol. Phylogenet. Evol. 62, 237–250. doi: 10.1016/j.ympev.2011.09.019
Yoder J. B., Clancey E., Des Roches S., Eastman J. M., Gentry L., Godsoe W., et al. (2010). Ecological opportunity and the origin of adaptive radiations. J. Evol. Biol. 23, 1581–1596. doi: 10.1111/j.1420-9101.2010.02029.x
Keywords: plankton, diversification, phyllosoma, shape variation, nonadaptive radiation, adaptive radiation
Citation: Landeira JM, Deville D, Fatira E, Zhang Z, Thatje S, Lin Q, Hernández-León S and Wakabayashi K (2023) Diversification of cephalic shield shape and antenna in phyllosoma I of slipper and spiny lobsters (Decapoda: Achelata). Front. Mar. Sci. 10:1070296. doi: 10.3389/fmars.2023.1070296
Received: 14 October 2022; Accepted: 10 March 2023;
Published: 27 March 2023.
Edited by:
Katrin Linse, British Antarctic Survey (BAS), United KingdomReviewed by:
Benny K. K. Chan, Academia Sinica, TaiwanPatricia Briones-Fourzan, Academic Unit of Reef Systems, National Autonomous University of Mexico, Mexico
Copyright © 2023 Landeira, Deville, Fatira, Zhang, Thatje, Lin, Hernández-León and Wakabayashi. This is an open-access article distributed under the terms of the Creative Commons Attribution License (CC BY). The use, distribution or reproduction in other forums is permitted, provided the original author(s) and the copyright owner(s) are credited and that the original publication in this journal is cited, in accordance with accepted academic practice. No use, distribution or reproduction is permitted which does not comply with these terms.
*Correspondence: José María Landeira, am9zZS5sYW5kZWlyYUB1bHBnYy5lcw==
†These authors have contributed equally to this work and share first authorship