 Shuhui Niu1,2,3
 Kai Zhang1,2
 Zhifei Li1,2
 Guangjun Wang1,2
 Hongyan Li1,2
 Yun Xia1,2
 Jingjing Tian1,2
 Ermeng Yu1,2
 Wangbao Gong1,2*
 Jun Xie1,2*
- 1Key Laboratory of Tropical and Subtropical Fishery Resource Application and Cultivation, Ministry of Agriculture, Pearl River Fisheries Research Institute, Chinese Academy of Fishery Sciences, Guangzhou, Guangdong, China
- 2Guangdong Ecological Remediation of Aquaculture Pollution Research Center, Guangzhou, Guangdong, China
- 3National Demonstration Center for Experimental Fisheries Science Education, Shanghai Ocean University, Shanghai, China
The zero-water exchange aquaculture has been identified as a promising method of farming to decrease the environment pressure of aquaculture and to increase profits. However, the ecological functions (e.g., nitrogen removal) and microbial biodiversity of the zero-water exchange pond aquaculture system are relatively understudied. In the present study, the zero-water exchange pond aquaculture system were constructed to investigated the microbial communities, sediment potential nitrification and denitrification production rates. And five functional genes (AOA amoA, AOB amoA, nirS, nosZ, and hzsB) were used to quantify the abundance of nitrifying and denitrifying microorganisms. The results showed that the sediment of the system had excellent potential nitrification-denitrification performance, with potential nitrification and denitrification rate were 149.77-1024.44 ng N g−1 h−1 and 48.32-145.01 ng N g−1 h−1, respectively. The absolute copy numbers of nitrogen functional genes and total bacterial 16S rRNA were 1.59×10⁵-1.39×10⁹ and 1.55×10¹⁰-2.55×10¹⁰copies g−1, respectively, with the dominant phyla, i.e., Proteobacteria, Actinobacteriota, Chloroflexi, Cyanobacteria, and Firmicutes. The relative abundances of the genera related to nitrification and denitrification, varied from 0.01% to 0.79% and from 0.01% to 15.54%, respectively. The potential nitrification rate was positively related to the sediment TOC concentration; and the potential denitrification rate had a positive correlation with sediment nitrate concentration. The genera Bacillus positively correlated with sediment NO3‐-N concentration, whereas Flavobacterium and Shewanella positively correlated with sediment NH4+-N concentration, which could be the functional bacteria for nitrogen removal. These findings may shed light on quantitative molecular mechanisms for nitrogen removal in zero-water exchange ponds, providing a sustainable solution to nitrogen pollution problem in the freshwater aquaculture ecosystems.
1 Introduction
Chinese aquaculture plays an important role in the global supply of aquatic products (Cao et al., 2015). In 2018, the total output of aquatic products in China expanded to 47.6 million tons, and accounted for 58% of global aquaculture production (Food and Agriculture Organization of the United Nations (FAO), 2020). Intensive pond aquaculture relies on increasing the breeding density in order to increase the production and economic benefits (Hou et al., 2021). With the increasing density of culture ponds, large amounts of feed and manure are deposited into the aquaculture pond system, causing severe pollution (Shen et al., 2020). Long-term accumulation of these nutrient-rich materials can destroy the ecological balance of the aquaculture system, leading to the death of cultured animals through eutrophication (Liu et al., 2020). Eco-friendly aquaculture pattern including zero-water exchange ponds were recently adopted in China to address such concerns, along with accelerating the sustainable development of aquaculture by the Chinese government (Hou et al., 2021; Zhang et al., 2022b).
Pond stock aquatic animals with different feeding habits and take advantage of the differences in nutritional levels of the cultured species to achieve multilevel utilization of food resources, which is an environmentally friendly and high-efficiency culture model (Rahman et al., 2008). To reduce the impact of aquaculture wastewater, we developed a zero–water exchange mode for the intensive polyculture ponds of Ctenopharyngodon idella (grass carp), Carassius auratus (crucian carp) and Aristichthys nobilis (bighead carp), by determining the pond capacity based on various parameters, such as water quality indicators and feeding situation (Zhang et al., 2022b). Studies of the zero–water exchange ponds are of great significance for improving aquaculture methods to achieve optimal balance between increasing production and ecological sustainability. The composition of bacterial communities in the aquaculture environment can serve as an indicator to reflect the ecological status of the ecosystem (Zhao et al., 2020). Previous studies have described the bacterial communities in aquaculture ponds, especially in polyculture ponds where many bacteria accumulate during culture activities (Tang et al., 2021; Zeng et al., 2021). The microbial communities, processes and N cycling functional potentials and functional microbes are vertical stratification in the pond (Deng et al., 2020b). Several researchers evaluated the dynamics of bacterial communities in aquaculture ponds and reported that surface sediment plays important role for the integral geochemical cycle of N nutrient in aquaculture pond (Gao et al., 2019; Shen et al., 2020). However, the ecological functions (e.g., nitrogen removal) and microbial biodiversity of the zero-water exchange pond aquaculture system are relatively understudied.
Nitrogen metabolism is the most critical microbial process in intensive aquaculture systems because of the large quantity of high protein feed input (Avnimelech and Ritvo, 2003). Nonetheless, nitrogen is one of the main nutrients that can cause eutrophication (Conley et al., 2009). As previously reported, nitrogen removal in freshwater habitats is strongly associated with two microbial processes: nitrification and denitrification (McCrackin and Elser, 2010). In the nitrification process, ammonia is oxidized via nitrite to nitrate by the ammonia monooxygenase (AMO) enzyme (Kutvonen et al., 2015). Archaeal and bacterial amoA genes have been extensively used as molecular markers to quantify the abundance and diversity of ammonia-oxidizing archaea (AOA) and bacteria (AOB) in soils and sediments (Wankel et al., 2011). The reduction of NO2‐‐N to NO in denitrification is the rate-limiting step, which is catalyzed by either a copper-containing enzyme encoded by the nirK gene or a cytochrome-cd1 enzyme encoded by the nirS gene (Wallenstein et al., 2006). The conversion of N2O to N2 is catalyzed by N2O reductase, which is encoded by the nosZ gene (Liu et al., 2013). Anaerobic ammonium oxidation (anammox) has been discovered in various environments, where nitrite is reduced to N2 utilizing ammonia as electron donor under anaerobic circumstances (Zhang et al., 2022a). Anammox contribute up to 30% of the N2 production in freshwater habitats (Kim et al., 2016). Both anammox and denitrification lead to a loss of nitrogen by transforming nitrate to nitrogen gas. This process is considered a potentially important contributor to nitrogen removal. The functional genes associated with nitrogen cycles, such as amoA, nirS, hzsB, and nosZ, are usually utilized as biomarkers to reflect the potential rates of nitrogen removal (Shan et al., 2016). However, the understanding of the mechanisms and factors of nitrogen removal through collaborative microbial pathways in zero-water exchange ponds is still incomplete despite extensive studies.
Therefore, the aims of the present study were to investigate the microbial diversity and community composition related to nitrogen removal in zero-water exchange ponds in South China and to examine the potential rates of nitrification and denitrification. To better understand potential mechanisms for nitrogen removal, we also determine the absolute abundance of nitrogen removal functional genes. This study would expands our knowledge of nitrogen removal in the zero-water exchange ponds and provides key insight into how nutrient loads could be reduced in zero-water exchange ponds.
2 Materials and methods
2.1 Experimental site and aquaculture system design
The experiments were conducted at Huachen Aquaculture Farm, located in Zhongshan City, Guangdong Province, China (22°36′36.74′′N, 113°30′50.93′′E). The zero–water exchange pond aquaculture system consisted of grass carp (Ctenppharyngodon idella) (0.6 kg ind−1, 12000 fish/hm2), bighead carp (Aristichthys nobilis) (0.5 kg ind−1, 2500 fish/hm2) and crucian carp (Carassius auratus) (0.05 kg ind−1, 12000 fish/hm2). Eight replicates were constructed for this system. Each pond covers an area of 1.0 hm2, and has an average depth of 2.5 m. The fish were fed twice per day (9 am and 5 pm), and the daily feeding rate was 3-5% of total body mass with artificial feed. All fish were caught at the end of the year. The yield of fish was 96000 kg/hm2. The operation management of this system has been described in detail in our team’s previous report (Zhang et al., 2022b).
The zero–water exchange ponds has achieved zero–water exchange effect for four years. Eight zero–water exchange ponds were sampled on September 23, October 27, and November 21, 2021 (Supplementary Figure 1). Three 1-L water samples (approximately 50 cm below the water level) and three 500 g of upper surface sediment samples were randomly collected in and around the center of each pond, located around and in the middle of the pond. Three water or sediment samples collected from each pond were thoroughly mixed into composite biological sample per pond. All samples were kept in an insulated box and were maintained at 4°C before being sent to the laboratory within 4 h of collection. In the laboratory, each composite sample was aseptically divided into three subsamples: one part was used for physicochemical analyses, one part for the microbial metabolism characteristics, and the final part for the microbial community composition analysis. The sediment samples was kept at −80°C until DNA extraction. For the water samples, approximately 500 mL of water was pre-filtered through a 200-μm pore mesh to remove large particles and then filtered through a 0.22-μm pore polycarbonate membrane (47 mm diameter, Whatman, Maidstone, UK). All filters were stored at −80°C until DNA extraction.
2.2 Analysis of environmental variables
Field measurements of water temperature (Temp), dissolved oxygen (DO), pH, total dissolved solids (TDS), and salinity were performed using a multi-parameter water quality probe YSI Professional Plus system (YSI Incorporated, Yellow Springs, OH, USA). Water samples were also analyzed for nutrients, including total nitrogen (TN), nitrate (NO3‐-N), nitrite (NO2‐-N), ammonia (NH4+-N), total phosphorus (TP), phosphate (PO43−), and chemical oxygen demand (COD), as previously described (Zhang et al., 2019). TN and TP were measured with the potassium persulfate digestion method. NH4+-N was measured with the spectrophotometric method with salicylic acid, NO3‐-N was measured with the phenol disulfonic acid method, NO2‐-N was measured with the Griess-saltzman method, soluble reactive phosphorus was measured with the molybdenum blue method. COD was detected using Hach reagents (HR, Hach, America). Chlorophyll a (Chl a) were determined using a spectrophotometer after acetone extraction and calculated as previously described (Lichtenthaler, 1987). Total suspended solids (TSS) were measured by the gravimetric method, as previously described (Zheng et al., 2021).
All sediment samples were dried at 65°C to a constant weight. Thereafter, the sediment subsamples were treated with 0.5 M HCl to remove carbonate and then used to analyze total organic carbon. The TN content of the sediment was measured using a Vario ELIII Elemental Analyzer (Elementar, Dortmund, Germany). The TP content of the sediment was measured using the alkali fusion method (Zhang et al., 2022b).
2.3 Changes in microbial metabolism characteristics
The metabolic characteristics and functional diversity of carbon in the microflora of the aquaculture ponds were assessed using a BIOLOG Ecoplate™ (BIOLOG, Hayward, CA, USA). Microorganisms were extracted from 10 g of sediment samples using 90 mL PBS. The Ecoplate™ wells were inoculated using 150 μL of suspension, and the plates were incubated at 28°C for 10 days. The original water samples were inoculated directly into the plates at a volume of 150 μL per well. Next, the absorbance was measured at wavelengths of 590 and 750 nm using a Biolog Micro Station™ (BIO-TEK Instruments Inc., Winooski, USA). Average well color development (AWCD) was used to indicate the utilization of carbon sources and the average metabolic capacity of the total carbon source. AWCD was calculated as previously described (Zhou et al., 2016). The Shannon index (H) and McIntosh index (U) were used to investigate metabolic functional diversity at the community level. In the present study, data obtained within 144 h were used to calculate the AWCD, Shannon index, and McIntosh index values.
2.4 Determination of nitrification, denitrification, and N2O production
Potential nitrification rates of the sediments were measured according to the shaken-slurry method (Hou et al., 2013). Briefly, approximately 10 g of fresh sediment was added to 250 mL brown glass bottles containing 100 mL of phosphate buffer (1 mM, pH 7.4) and mixed with 0.5 mL of (NH4)2SO4 (1 M). All bottles were incubated at room temperature (25°C) on a shaker (180 rpm) for 24 h. Concentrations of NH4+-N and NO3‐-N infiltrates were measured, and potential nitrification rates were calculated based on the change in NO3‐-N concentration during incubation, divided by the incubation time and sample weight.
The potential sediment denitrification rates were analyzed using the acetylene (C2H2) inhibition technique (Groffman et al., 2006). Approximately 20 g of fresh sediment from each site was slurried in 250-mL glass bottles with 20 mL unfiltered pond water. Parallel incubations with and without acetylene were used to differentiate between potential denitrification and N2O production (McCrackin and Elser, 2010). All bottles were incubated in the dark at room temperature (25°C, approximate in situ water temperature) for 4 h. N2O concentration was measured using a gas chromatograph (Agilent 7890, Santa Clara, CA, USA) equipped with an electron capture detector (Liu et al., 2015). Potential denitrification and N2O production rates were calculated as the difference between the start and end N2O concentrations and were expressed as ng N g−1 h−1.
2.5 DNA extraction and amplicon sequencing
Sedimentary DNA was extracted from sediment samples (0.3 g each) using the E.Z.N.A. Soil DNA Kit (Omega, Bio-tek, Inc., Norcross, GA, USA) according to the manufacturer’s instructions, and water DNA was extracted using the E.Z.N.A. water DNA Kit (Omega, Bio-tek, Inc., Norcross, GA, USA) according to the manufacturer’s instructions. The quality and quantity of isolated DNA were determined using a NanoDrop 2000 spectrophotometer (Thermo Scientific, Waltham, MA, USA). The V3-V4 region of the total bacterial 16S rRNA gene was amplified using universal primers (338F and 806R) (Gao et al., 2019). The polymerase chain reaction (PCR) conditions and primers used in this study are summarized in Supplementary Table 1. The PCR products were subjected to high-throughput sequencing using the Illumina MiSeq PE300 platform (Majorbio, Shanghai, China). Alpha diversity was used to analyze the complexity of species diversity in each sample using QIIME to calculate the alpha-diversity index, including the Shannon and Chao1 indices. Beta diversity was calculated based on the weighted UniFrac distance using the vegan package in R (version 2.15.3; R Core Team, 2018). In total, 2,455,026 high-quality sequences were obtained from all 48 samples (41,875–64,313 sequences per sample; Supplementary Table 2). Raw reads obtained in the present study are deposited in the NCBI Sequence Read Archive database with the accession number: PRJNA898355.
2.6 Quantitative real-time PCR (qPCR)
qPCR was performed to determine the absolute abundances of the bacterial 16S rRNA gene and target fragments of five functional genes, as follows: denitrification functional genes (nirS and nosZ), nitrification functional genes (AOA amoA, and AOB amoA), and anammox functional gene (hzsB). All primers and standard plasmids were synthesized by Majorbio and their sequences are listed in Supplementary Table 1. qPCR was performed using the SYBR Green Master Mix in a qPCR instrument (Bio-Rad, Hercules, CA, USA) with the default thermal cycling program. The protocol and parameters for each target gene are presented in Supplementary Table 1. Standard curves were produced from a 10-fold dilution series of plasmid DNA for these functional genes and the 16S rRNA gene (103–1010 copies). The results of the quantitative analysis were expressed as gene copies g−1of wet weight sediment.
2.7 Statistical analysis
IBM® SPSS® Statistics version 19.0 was used to conduct statistical analysis. The differences in environmental parameters, microorganism, and functional gene abundance among the three different samples (both water and sediment) were analyzed using one-way analysis of variance and are presented as mean values ± SD (standard deviation). Significant differences in the means between treatments were determined using the Duncan’s multiple range tests. P values < 0.05 were considered significant. Operational taxonomic units (OTUs) based on the 16S rRNA gene sequences were determined with an identity cutoff of 97% using the Mothur software (Schloss et al., 2009). OTU reference sequences were blasted against the Silva 16S rRNA database (http://www.arb-silva.de; accessed on 1 December 2019), and the OTU distributions were then used to further analysis. The vegan package in R was also used for principal component analysis (PCA) and draw heat maps, which were applied to assess differences in species complexity and evaluate the bacterial community structure. Redundancy analysis (RDA) was performed using CANOCO software to reveal the relative influence of water and sediment physicochemical properties on the bacterial community composition.
3 Results
3.1 Physicochemical characteristics of fish ponds
The water and sediment samples physicochemical properties were analyzed to understand the physicochemical conditions in these microbial habitats. The DO, pH, Temp, TP, TSS, PO43-, NO3‐-N, and NO2‐-N concentrations of the water samples showed significant differences among times (P < 0.05; Table 1). The concentrations of TN, NH4+-N, Chl a, and COD had no significant difference across times were 3.82–8.37, 0.14–0.53, 0.03–0.28, and 34.00–85.33 mg/L, respectively (P > 0.05) (Table 1). In the sediment, there were significant differences among times in EC, TN, NH4+-N, and NO3‐-N (P < 0.05). The concentrations of pH, water content (WC), TOC, and TP had no significant difference across times were 7.44–8.16, 54.21–63.52%, 19.51–26.71 g kg−1, and 1.63–2.69 g kg−1, respectively (P > 0.05). The results revealed a trend toward higher nitrate levels in water, and higher TN and NH4+-N but lower nitrate levels in sediment.
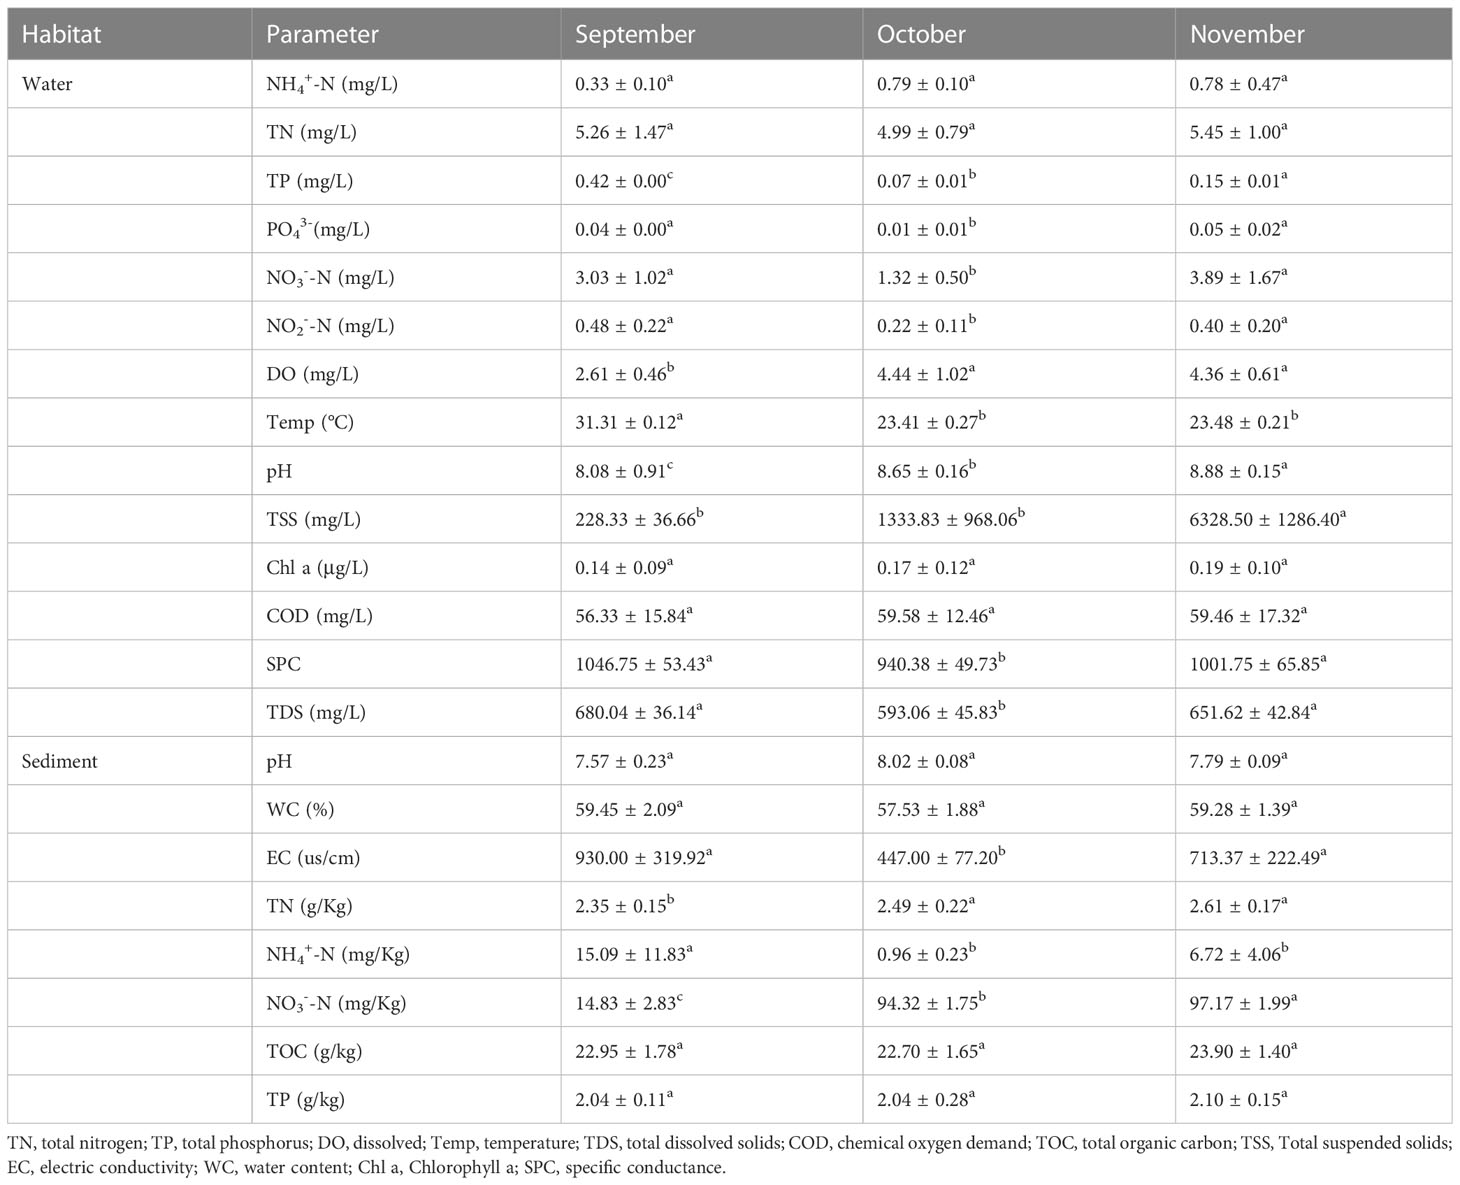
Table 1 Water and sediment physicochemical factors in different months.
3.2 Microbial metabolism characteristics
The rate of increase and the final AWCD values depended on the abundance and activity of the microbial community; the faster the increase in the AWCD value, the higher the metabolism of the microflora (Figures 1A, B). Overall, there was little change in the AWCD values of all samples within 24 h, but these values increased over time from 24 h. After 144 h, there was a stable increase in the AWCD values, indicating accelerated microbial metabolism to meet physiological needs. Comparisons of data between September and November in the aquaculture ponds revealed that the rate of change in AWCD varied, as the significantly increased in water (P < 0.05), but did not increase significantly in sediment (P > 0.05). The intensity of carbon source metabolism is generally proportional to the quantity, ability, and diversity of corresponding microbes. As shown in Figures 1C, D the AWCD value of the sediment increased from September to November 2021, whereas the AWCD value significantly (P < 0.05) decreased in water. The sampling time was accompanied by the accumulation of contaminants. Sampling time did significantly (P < 0.05) affect Shannon indices, and significantly increased the McIntosh index (P < 0.05) which presents the evenness of carbon sources metabolism (Figures 1E–H). The evenness rather than the richness facilitated the rapid response of the natural communities to external contamination. The results suggest that homogenization of carbon source utilization may help withstand accumulation of pollutants.
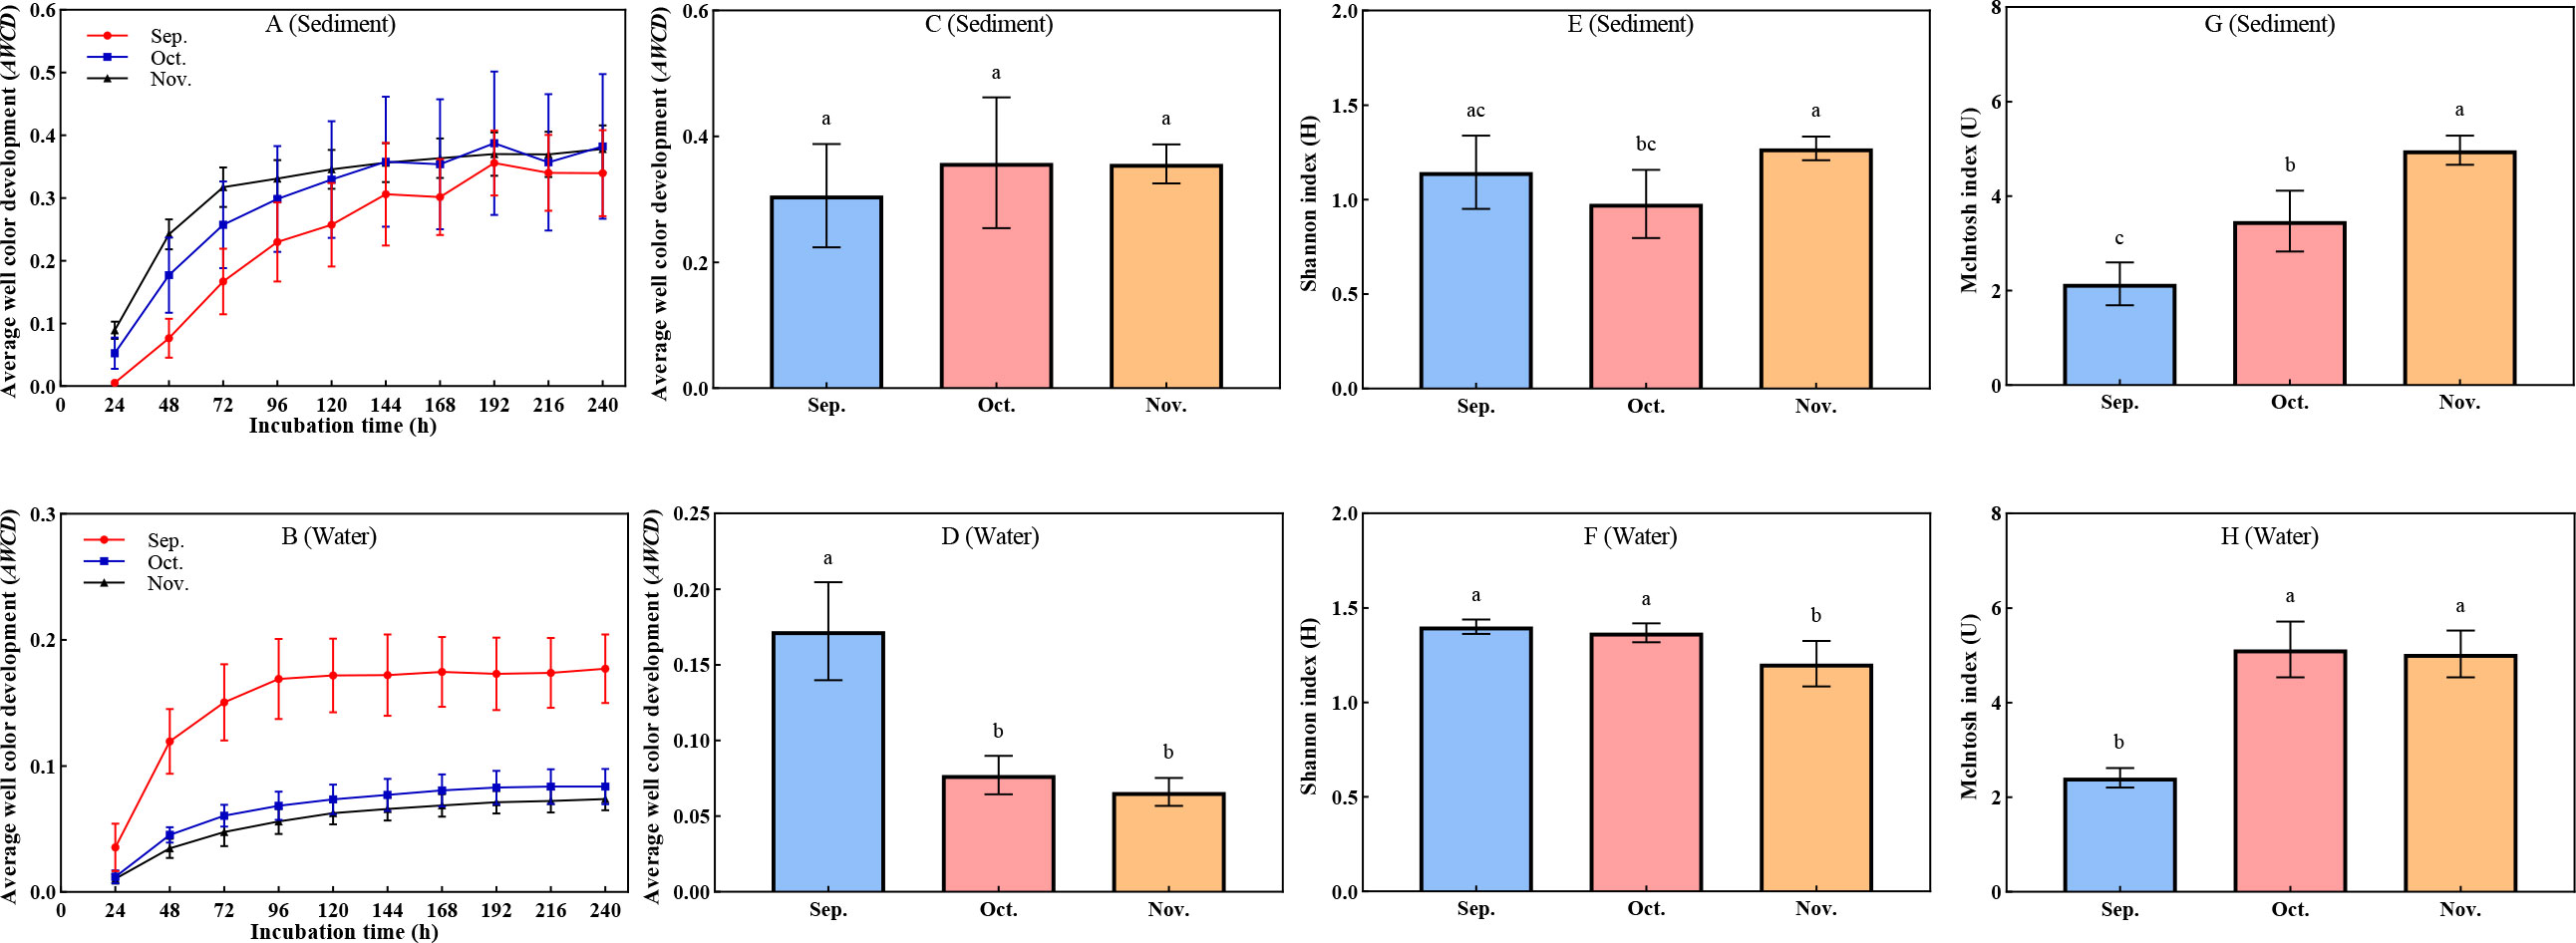
Figure 1 Metabolic characteristics and functional diversity in water and sediment. (A–D) Changes in average well color development (AWCD). (E, F) Changes in Shannon index (H). (G, H) Changes in McIntosh index (u). The superscripts without same letter in the same row indicate significant difference (P<0.05).
3.3 Diversity and structure of microorganisms in the water and sediment
All detected OTUs in this study were classified into 63 bacterial phyla, and sequences that did not fall into any of the previous categories were classified as ‘others.’ Figure 2A shows the top 10 most abundant phyla in each sample. The most abundant phylum was Proteobacteria, followed by Actinobacteria, Chloroflexi, Cyanobacteria, and Firmicutes. Several bacterial species belonging to Proteobacteria were denitrifying species, implying that the habitats in the zero–water exchange ponds enhanced denitrification. The relative abundances of these dominant phyla varied among the different habitats. For the sediment samples, Proteobacteria was the most abundant phylum, and accounted for 17.60–33.16% of all phyla, followed by Chloroflexi (8.28–18.89%), and Firmicutes (7.59–15.98%). In addition, the abundance of Chloroflexi was remarkably lower in the October sediment than in other months (P < 0.05; Supplementary Figure 2). In water, Actinobacteria was the most abundant phylum, accounting for 11.47–51.98% of all phyla, followed by Proteobacteria (18.46–40.20%), and Cyanobacteria (3.02–33.23%). Notably, the abundance of Proteobacteria and Chloroflexi in the October water sample was significantly different (P < 0.05) from that of other months; the abundance of Firmicutes was remarkably higher in the September sediment than in November (Supplementary Figure 2).
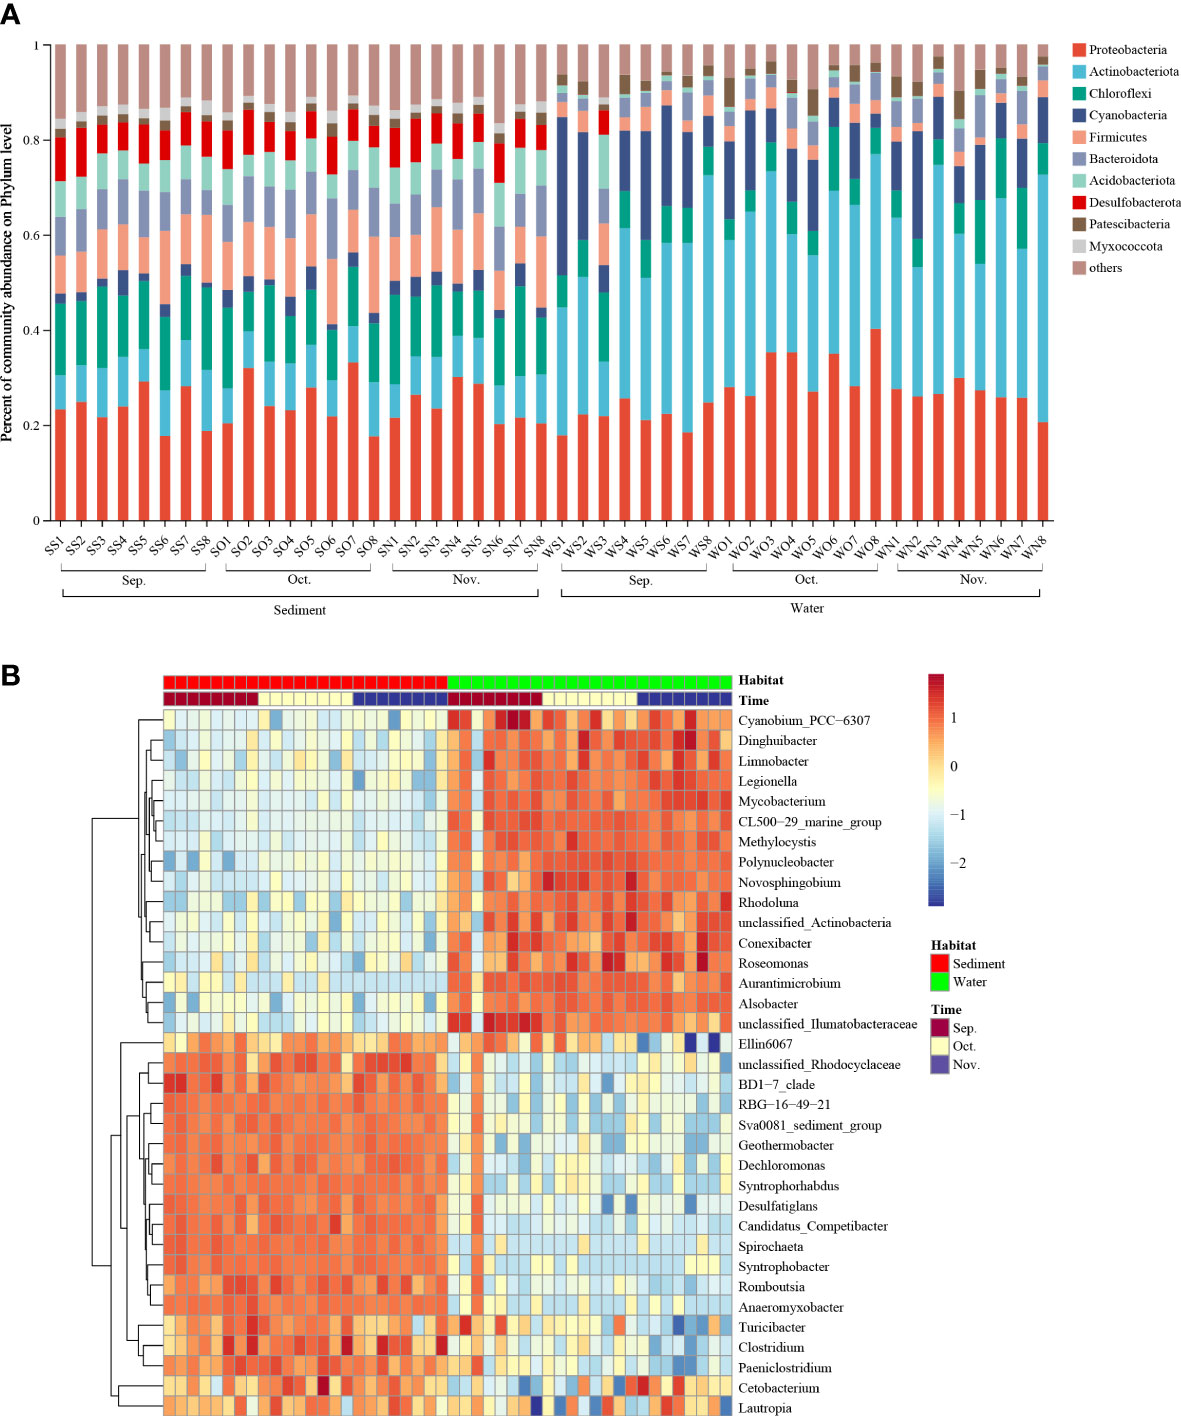
Figure 2 Relative abundance of dominant phyla and genera. (A) Relative abundance of dominant phyla in all communities. (B) Relative abundance of dominant phyla in 3 months. Rows represent the 35 most abundant bacterial genera, and the square-root-transformed relative percentage of each genus is depicted by color intensity. Sep., September; Oct., October; Nov., November.
A total of 1238 genera were identified at the genus level. The heatmap plot indicates the relative abundance of the genera (top 35) in different samples (Figure 2B). The distribution of the first 35 genera in sediments and water samples showed that September, October, and November samples exhibited similar bacterial community composition. The most abundant genera in sediment were Clostridium, Dechloromonas, Geothermobacter, Romboutsia, and Romboutsia; and the most abundant genera in water were Mycobacterium, Polynucleobacter, Methylocystis, Novosphingobium, and Alsobacter. Notably, common denitrifiers (Clostridium and Dechloromonas) were more abundant in sediment than in water. In addition, the phylum detected in the zero–water exchange ponds included a series of organisms involved in nitrogen transformations. The relative abundances of microbial genera involved in nitrogen transformation detected in this study are shown in Supplementary Figure 3. The most abundant genera were Flavobacterium, Hyphomicrobium, Rubrivivax, Rhodobacter, Bacillus, and Dechloromonas. The relative abundances of nitrogen cycling-related genera varied among the different habitats. The relative abundances of Shewanella, Geobacter, Halomonas, Candidatus Brocadia, Bradyrhizobium, Desulfovibrio, Nitrospira, Nitrosomonas, Streptomyces, and Thiobacillus in the sediment were higher than those in the water samples. The relative abundances of Paracoccus, Enterobacter, Achromobacter, and Acinetobacter were also higher in the water samples than in the sediment.
3.4 Microbial similarities in sediment and water among the three sampling times
To estimate the overall richness and diversity of the bacterial communities in the two aquaculture habitats, the OTUs of each sample were used to calculate alpha-diversity indices (Simpson, Shannon, and Coverage indices) (Figures 3A–D). At different time points, the venn diagram showed that 6460 and 1597 OTUs were shared in sediment and water, respectively (Figure 3E). Hence, we further investigated the differences and similarities between sediment and water at different time points using PCA (Figures 3F, G). The PCA results revealed that the microbial communities of at different time points in sediment and water were not clearly distinct.
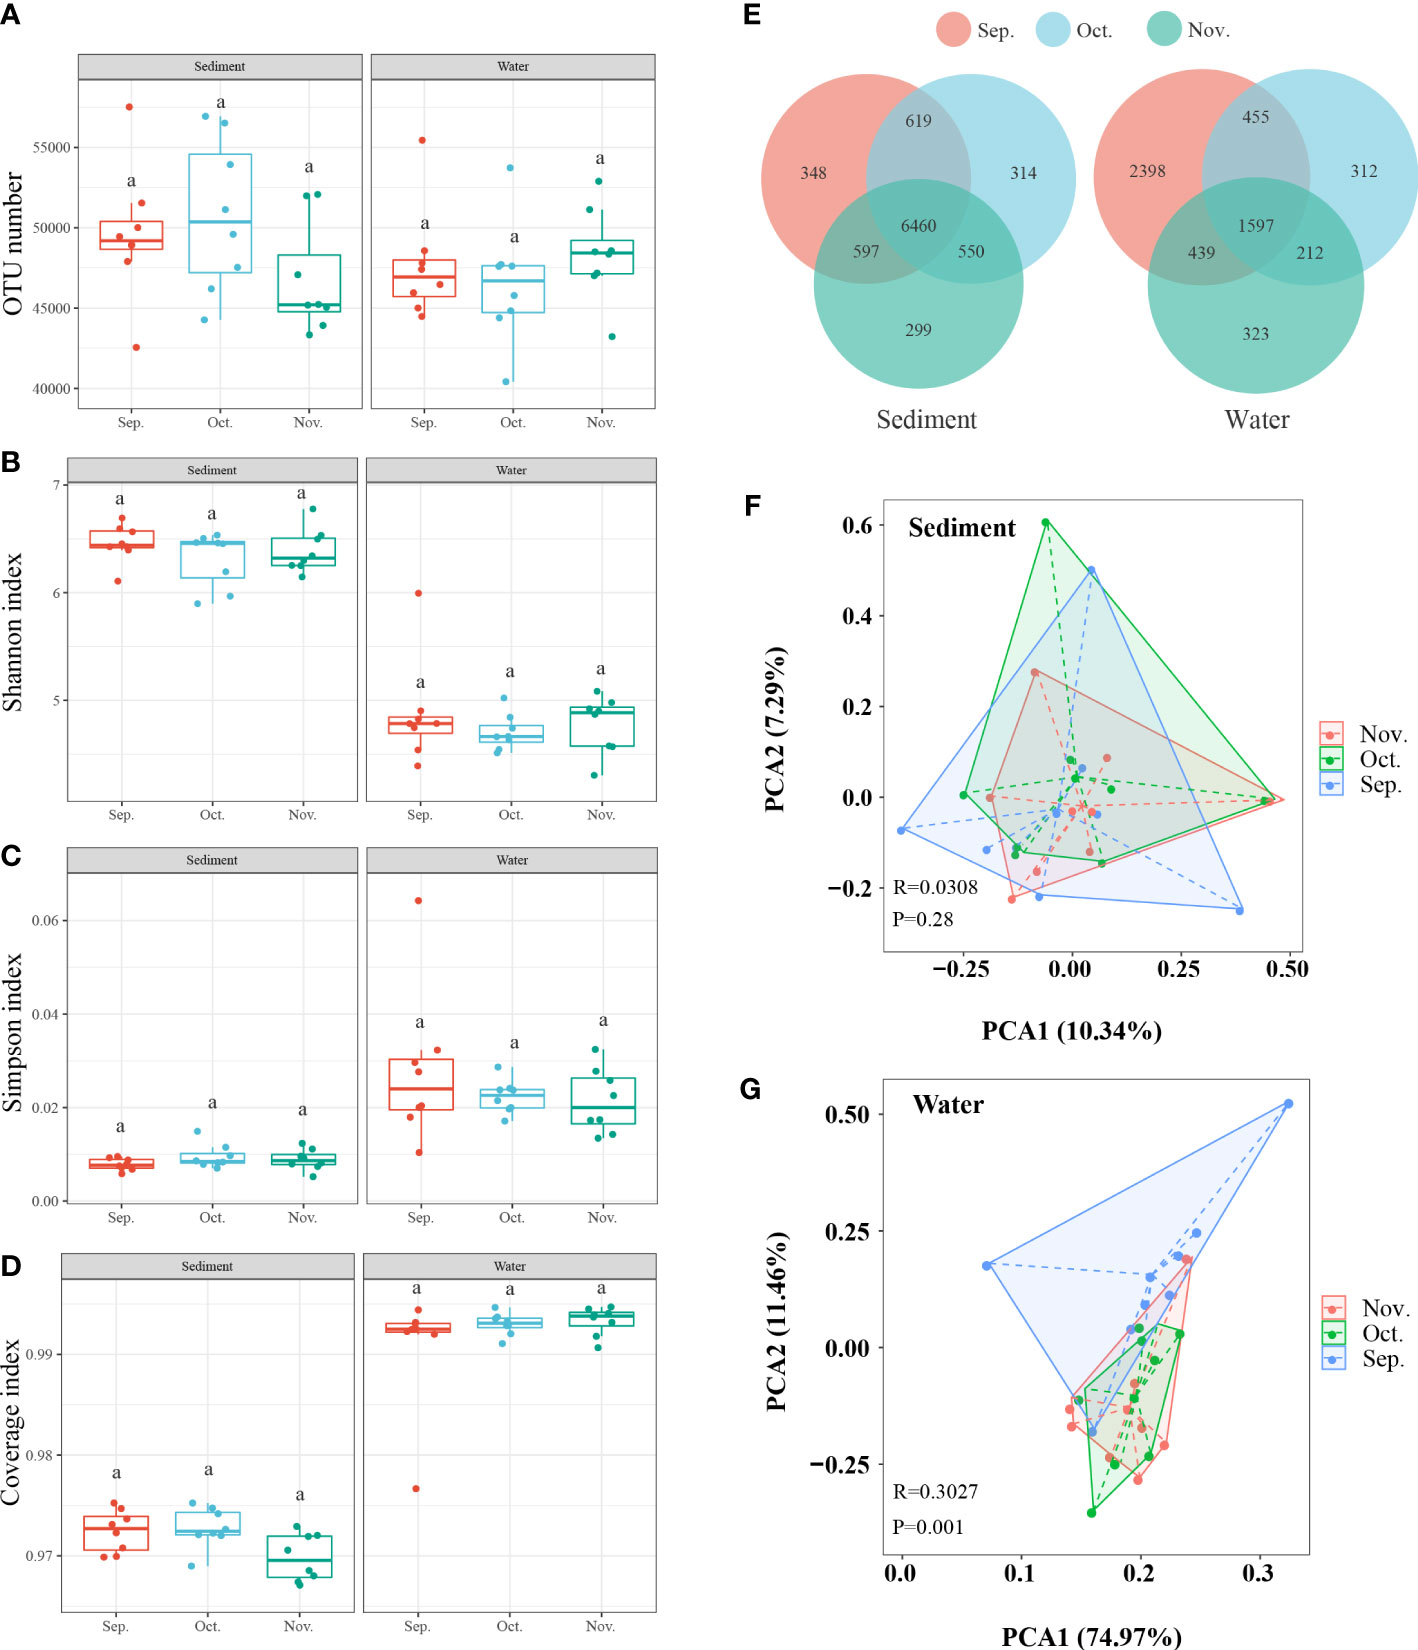
Figure 3 The microbial similarity in sediment and water among the three months. (A–D) The α-diversity comparison among the three sampling times. (E) Venn diagram shows the unique and shared OTUs. (F, G) PCA based on Operational taxonomic units (OTU) profiles. Sep., September; Oct., October; Nov., November. The superscripts without same letter in the same row indicate significant difference (P<0.05).
To identify the specific bacterial taxa that differed in all samples, a random forest machine learning classifier model was used to further identify taxa in each group. Ten-fold cross-validation using the training data was conducted to detect unique OTU markers. The cross-validation error curve stabilized when the 22 most relevant OTUs were used. Thus, 22 OTUs were defined as biomarker taxa (Figure 4A), and these biomarkers were difficult to distinguish between different collection time points but differed significantly between the aquaculture habitats (Figure 4B). These 22 OTUs main belonged to Actinobacteriota, Proteobacteria, and Firmicutes. Of these, 15 OTUs showed higher relative abundance in sediment and 5 OTUs showed higher relative abundance in water. Although the hierarchical clustering algorithm could not cluster the individual samples into groups according to time points, it successfully distinguished the specific taxa in each aquaculture habitat. The higher number of bacterial families enriched in sediment was consistent with the observation that sediment varieties showed higher microbial diversity.
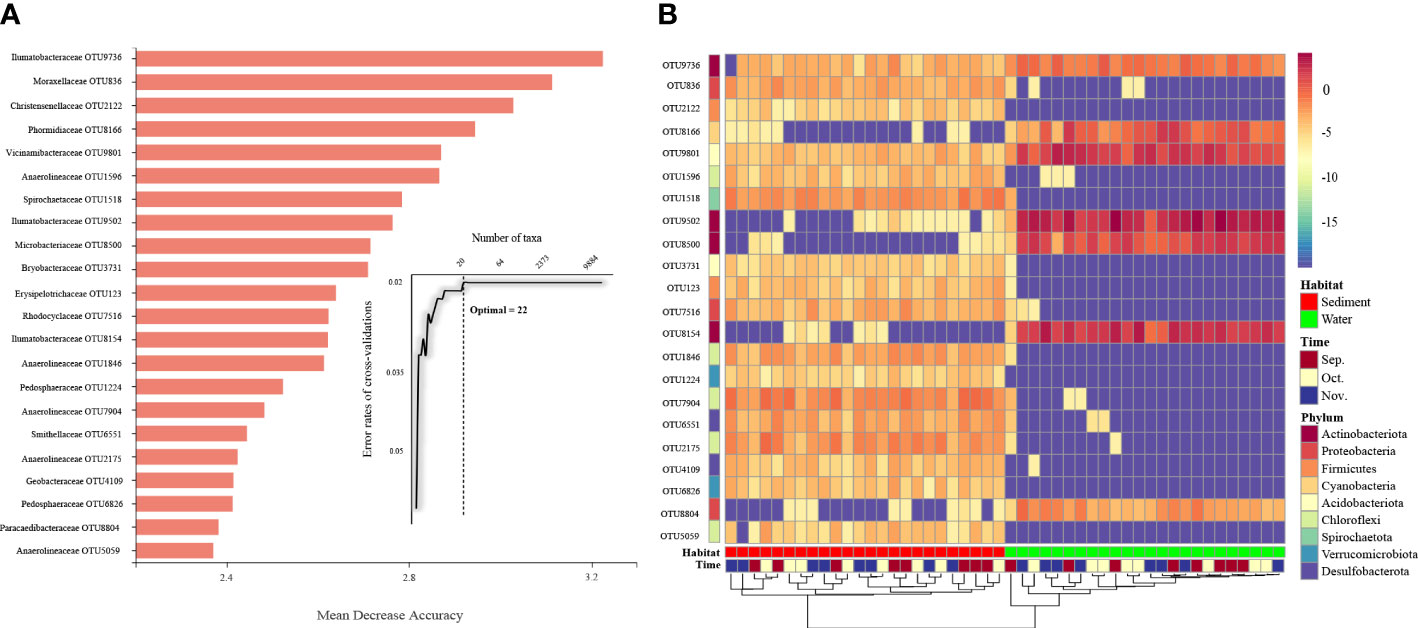
Figure 4 Classification of the OTU markers for the samples. (A) A total of 22 OTU markers were selected as the optimal marker set by a ten-fold CV-error curve. (B) The relative abundance of the OTU markers in each group. Sep., September; Oct., October; Nov., November.
3.5 Sediment nitrification and denitrification rates
Sediment potential nitrification rates varied between 149.77 and 1109.06 ng N g−1 h−1, with a mean value of 761.09 ng N g−1 h−1. The potential nitrification rate in November was 149.77 ng N g−1 h−1, and was significantly lower than that in September (1024.44 ng N g−1 h−1) and October (1109.06 ng N g−1 h−1) (P <0.05) (Supplementary Figure 4A). The potential denitrification rates varied between 48.32 and 145.01 ng N g−1 h−1, with a mean value of 88.15 ng N g−1 h−1. The September had the highest potential denitrification rate (145.01 ng N g−1 h−1), and with no significantly different from October and November (Supplementary Figure 4B).The average N2O production rates were 1.01 ng N g−1 h−1 (Supplementary Figure 4C). The October had the highest N2O production rates (1.19 ng N g−1 h−1), followed by September (1.00 ng N g−1 h−1), and the November had the lowest (0.84 ng N g−1 h−1).
3.6 Functional gene abundances
The absolute abundances of bacterial 16S rRNA and selected genes involved in nitrification and denitrification processes were assessed based on the corresponding gene copy numbers using qPCR. The 16S RNA gene copies varied from 1.18 × 10¹⁰ to 3.43 × 10¹⁰ copies g−1 in sediment, which supported nitrogen removal (Figure 5). The AOA amoA and AOB amoA were used to evaluate the number of nitrifiers. The AOB amoA copy number (average 2.77 × 10⁶ copies g−1) exceeded the AOA amoA copy number (average 1.71 × 10⁵ copies g−1) in all sediment samples. The AOB amoA gene was present significantly higher abundance in October (3.61 × 10⁶ copies g−1) compared with September (1.53 × 10⁶ copies g−1) (P <0.05). Anammox was enumerated based on the hzsB gene, and the copy numbers were 3.63 × 10⁶ copies g−1 in September and 6.59–7.11 × 10⁶ copies g−1 in October and November. The abundance of the hzsB gene in September was significantly lower than that in October and November (P <0.05). The genes nirS and nosZ were used to enumerate the denitrifying bacteria. The nosZ gene copy numbers gradually increased from 1.66 × 10⁸ to 4.00 × 10⁸ copies g−1 in the sediment over the experimental period. The absolute abundance of the nirS gene ranged from 1.07 × 10⁹ to 1.39 × 10⁹ copies g−1, which was 1–2-fold higher than that of the nosZ gene.
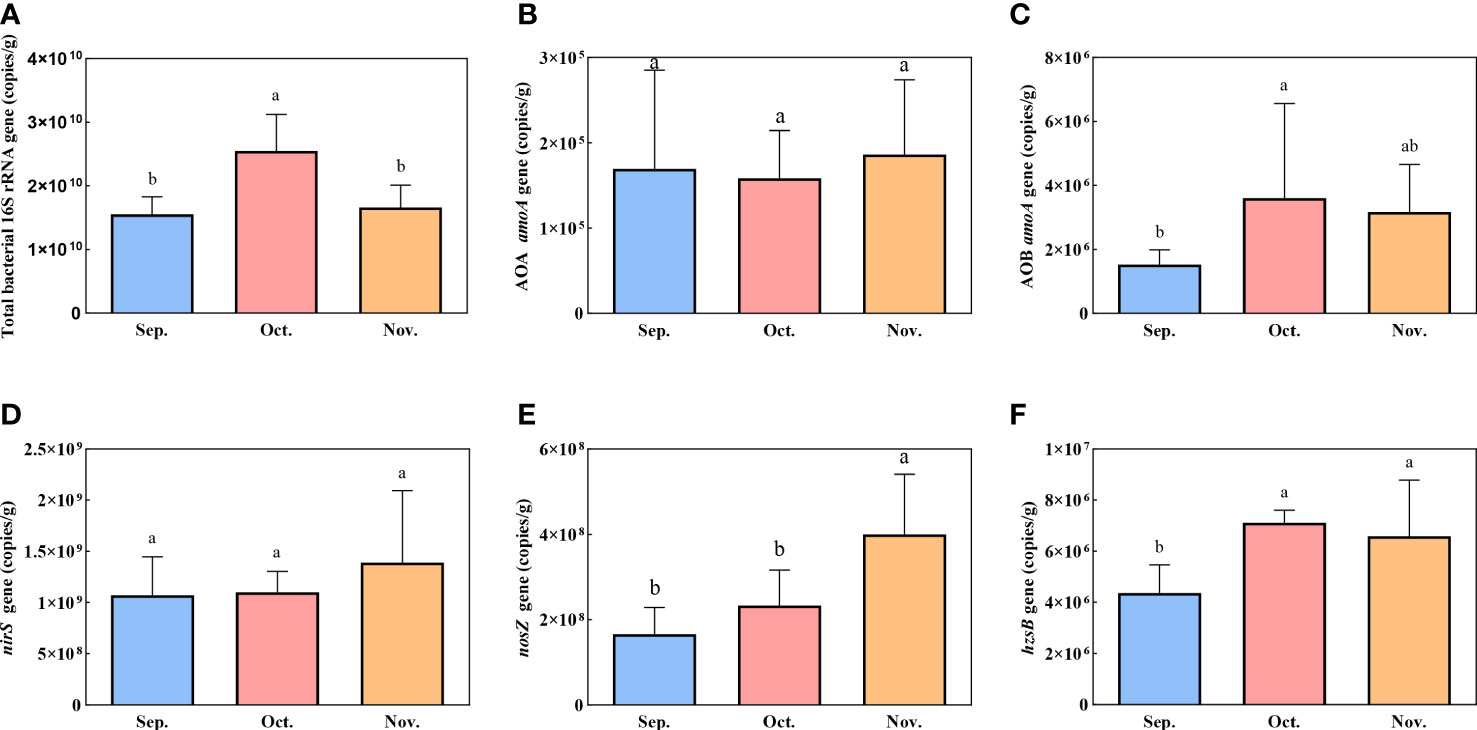
Figure 5 Spatial variation of gene copies for 16S rRNA (A) and associated with nitrification and denitrification: AOA amoA (B), AOB amoA (C), nirS (D), nosZ (E), and hzsB (F). Error bars indicate standard deviation. The superscripts without same letter in the same row indicate significant difference (P<0.05).
3.7 Relationships between environmental parameters and the microbial community
RDA was performed on 24 water and sediment samples to explore the relationship between microbial community structure and environmental factors. Sediment samples explained 9.06% of the constrained variation in microbial communities, whereas the second explanation accounted for 5.26% (Figure 6A). Three environmental variables, pH, WC, and TOC, were significantly associated with bacterial communities. In addition, both first and second RDA axes explained approximately 19.30% and 3.768% of the variation in water bacterial communities, respectively (Figure 6B). Significant correlations were detected among pH, Chl a, Temp, DO, TDS, and COD. Mantel test was used to study the relationship between the predominant phyla, nitrogen cycling functional genera, and environmental factors. The results showed that sediment pH was significantly positively correlated with some phyla such as Proteobacteria, Actinobacteria, and Cyanobacteria. The TOC and EC were significantly positively correlated with Cyanobacteria (Supplementary Table 3). In the water samples, Cyanobacteria were significantly positively correlated with Chl a, COD, Temp, DO, TDS, and pH (Supplementary Table 4). The nitrogen cycling functional genera in the sediment were positively correlated with the environmental factors (Figure 6C). Bacillus was positively correlated with NO3‐-N and WC (P < 0.05), whereas Achromobacter and Acinetobacter were negatively correlated with NH4+-N and TOC (P < 0.05). Flavobacterium and Shewanella were significantly positively correlated with NH4+-N and negatively correlated with EC (P < 0.05). Some of the nitrogen cycling functional genera, including Rhodobacter, Shewanella, and Flavobacterium, in the water were significantly correlated with environmental factors (P < 0.05) (Figure 6D).
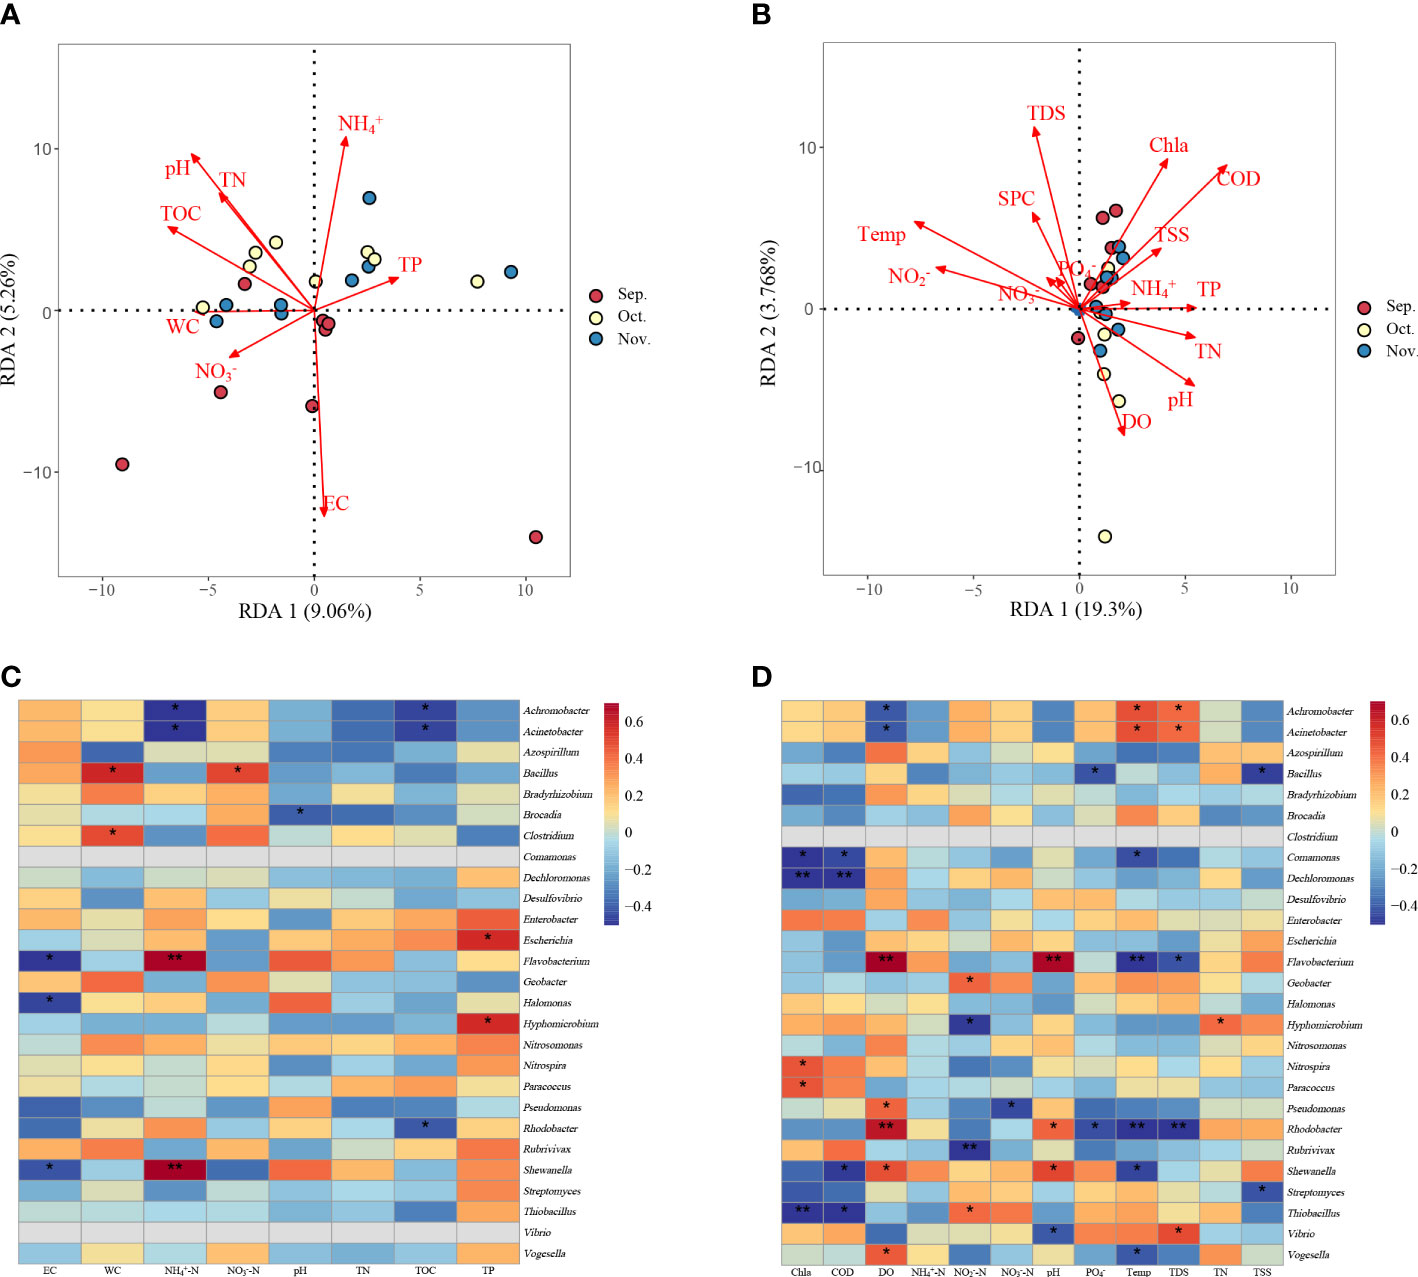
Figure 6 Redundancy analysis (RDA) shows the relationships between the community composition and physicochemical properties of sediment (A) or water (B) determined in the zero–water exchange ponds. Correlation analyses between physicochemical properties and functional genera associated with nitrogen cycling found in the microbial communities from the sediment samples (C) and water (D). The color intensity shows the R-value of correlation in each panel, and the asterisk represents significant correlations at P < 0.05 level. TN, total nitrogen; TP, total phosphorus; DO, dissolved oxygen; Temp, temperature; TDS, total dissolved solids; COD, chemical oxygen demand; TOC, total organic carbon; TSS, Total suspended solids; EC, electric conductivity; WC, water content; Chl a, Chlorophyll a; SPC, specific conductance. *P < 0.05; **P < 0.01.
4 Discussion
4.1 Microbiome diversity and stability under the influence of anthropogenic load on ecosystems of zero–water exchange ponds
Understanding nitrogen removal and microbial communities in aquaculture systems is essential for identifying mechanisms that shape better health, sustainable agriculture, and ecosystem functioning. This study explored the characteristics of nitrification and denitrification processes and microbial communities in zero–water exchange ponds. Contrary to expectations, this study did not find a significant difference between community diversity and culture period. In an intensive aquaculture pond system, the high potential for N mineralization in both the water and sediment was consistent with the large quantity of allochthonous feed protein present throughout the pond (Deng et al., 2020b). Previous studies indicated the average amounts of nutrients from feed retained by fish and shrimp are 13% for C and 29% for N (Avnimelech and Ritvo, 2003). Hence, a high percentage of the organic C and N compounds were released to the surrounding water and deposited on the sediment. In our study, Proteobacteria and Actinobacteria were the dominant phyla in zero–water exchange ponds. In the sediment samples microbial communities were similar, although there was a significant difference of environmental factors among sampling times. This result may be explained by the adoption of silver carp and bighead carp as filter-feeding fish to control the water quality in this study. These fish allowed nutrients to be fully recycled and contributed to a more stable pond environment.
The analysis of microbial diversity and community characteristics can provide basic information regarding nitrogen cycling in aquaculture ponds (Zeng et al., 2021). In the present study, Clostridium and Mycobacterium were the dominant genera in the sediment and water. As a representative fermentative bacterium, Clostridium was the dominant bacteria in the early incubation of hypoxic paddy soil (Noll et al., 2005), which is involved in the removal of anammox and biological phosphorus in sludge fermentation reactors (Wang et al., 2013; Wang et al., 2019). The DO concentration was 1.5 mg L−1 at the water-sediment interface of an aquaculture pond (average depth 1.6 m), and it reached zero at sediment depths >500 μm (Lu et al., 2016). Therefore, we speculate that the high abundance of Clostridium could be attributed to the anaerobic environment in the sediments. Mycobacterium, a genus of aerobic actinomycetes, is often isolated from reservoirs (Delghandi et al., 2020). From August to October, the abundance of Mycobacterium in the metal immune layer and the low immune layer increased slightly, which may be closely related to the concentration of dissolved oxygen (Zhang et al., 2022a). Our studies have suggested that variation in environmental factors of different habitats may explain the high abundance of Mycobacterium and Clostridium detected in farming ponds. The growth of some bacteria may be favored after acclimation to aquaculture environmental conditions, resulting in these groups becoming major components of the microbial community in the pond.
Furthermore, differences in the metabolic characteristics of microorganisms in the water and sediment of aquaculture ponds indicate that microorganisms in the various habitats of ponds perform different metabolic functions, which will contribute to nutrient cycling in zero–water exchange ponds. AWCD values indicate the overall activity of microorganisms in the process of carbon source utilization (Yi et al., 2022). The intensity of carbon source metabolism usually reflects the quantity, capacity, and diversity of microorganisms (Li et al., 2020; Koner et al., 2022). The McIntosh index, which represents the evenness of carbon sources metabolism, increased significantly during the sampling period, which would contribute to the cycling of nutrients in the zero–water exchange ponds. Previous studies have shown that the rapid response of natural communities to external pollution is evenness rather than richness (Wittebolle et al., 2009). These suggest that the homogenization of carbon source utilization might contribute to the relative homeostasis of the zero–water exchange ponds microbial community.
4.2 Microbial nitrogen metabolism in zero–water exchange ponds under steady-state conditions
From a functional perspective, many of the genera that differed significantly between the two habitats in our study were associated with nitrogen metabolism, which is a critical function of pond microbiota (Ettinger et al., 2017). The nitrogen removal-related genera with relative abundance (shown in Supplementary Figure 3) were assessed as previously described (Zhang et al., 2021b). Nitrosomonas and Nitrospira, two genera involved in nitrification, were detected in this study. These genera are dominant in sediments and are connected to the nitrite-oxidizing pathway (NOB) and ammonia-oxidizing pathway (AOB), respectively (Li and Tao, 2017). Notably, complete nitrification can be accomplished by Nitrospira, which directly converts either ammonium to nitrate or nitrite to nitrate without nitrous oxide production (Daims et al., 2016). The finding indicates the comammox pathway might be involved in nitrogen transformation in the zero–water exchange ponds where Nitrospira was more abundant, as suggested by previous reports (Daims et al., 2015). Nevertheless, the data obtained in the current study were insufficient to confirm this assumption, because only high-throughput sequencing technology was utilized to detect the existence of the comammox process in the zero–water exchange ponds. It is necessary to conduct more experiments in the future from different aspects for verification (such as community metagenomic assembly). In the present study, we only identified one genus, Brocadia, which was highly abundant in the sediment and almost absent in the water. This observation suggests anoxic or anaerobic conditions in the sediment were beneficial for the growth and metabolism of anammox bacteria and the inhibition of the anammox process under the oxygen concentration in the surface water.
In all samples, the relative abundance of denitrification genera was higher than that of nitrification genera, which provides the conditions in the aquaculture pond for removing nitrogen through denitrification under the condition of high exogenous nutrient input. In general, differences in microbiota function between the two habitats might be attributed to environmental factors. Aquaculture ponds need to continuously increase oxygen levels to ensure sufficient dissolved oxygen content in the water, and the decomposition of unconsumed bait residues significant oxygen consumption, thus creating a highly reductive environment in the sediment (Gao et al., 2019). This finding that the culture pond had a relatively unique habitat, which might explain the distinct microbial communities in sediment and water.
4.3 Nitrification and denitrification processes mediated by functional gene and environmental factors
Nitrification and denitrification are essential steps in the global nitrogen cycle (Bothe et al., 2000). As the major forces driving the nitrogen cycle, denitrification and nitrification have an important regulatory effect on nitrogen loss and N2O emissions (Cui et al., 2021). Sediment nitrification rates in zero–water exchange ponds showed strong temporal variability, which is similar to previous studies (Yao et al., 2018). In addition, nitrification rates were positively correlated with water T, sediment NH4+-N content, TOC content, NO3- content, and moisture content (Supplementary Table 5). This implies that elevated water T, organic carbon accumulation and oxygen content, which increase the practicality of NH4+-N in sediment, may limit the nitrification rates. Previous study has shown that the potential nitrification rate is positively correlated with amoA gene abundances in both bacteria and archaea (Sims et al., 2012). Moreover, the sediment potential nitrification rate in two Yangtze lakes was also positively correlated with the abundance of bacterial amoA (Hou et al., 2013). However, there was no significant correlation between sediment nitrification rate and amoA gene abundance in this study. This suggests that not all NO3‐-N was oxidized into NO3‐-N, or that gene abundance is not correlated with the process.
The potential denitrification rate is generally considered a conservative estimate of actual in situ denitrification (Yao et al., 2016). Sediment potential denitrification rate showed a pronounced temporal heterogeneity pattern. Nitrate and temperature mainly explained these temporal potential denitrification variations. These factors (temperature and nitrate concentration) have been demonstrated to be important determinants of denitrification rates in other studies (Pfenning and McMahon, 1997; Yao et al., 2018; Deng et al., 2020a). In general, sediment potential denitrification rate was positively related to sediment temperature (Song et al., 2012). Similarly, these positive relationships were found in the zero–water exchange ponds. Our study also revealed that sediment nitrate concentration had a positive correlation with the potential denitrification rate in the zero–water exchange ponds. This relationship is understandable because nitrate is the terminal electron receptor of denitrification process (Deng et al., 2020a). Most of the reported high denitrification rates were observed in high-nutrient loaded systems such as treatment wetlands (Song et al., 2012). However, these relationships were not found in this study. A large number of nutrients will be stored in sediments during the aquaculture farming practice (Deng et al., 2020b). Also in the present zero–water exchange ponds, sediment nitrate concentrations increased significantly with culture. In this study, low temperature explained low potential denitrification while temperature-controlled denitrification when not limited by nitrate concentration.
We found that the mean abundance of bacterial amoA gene was considerably higher than that of the archaeal amoA gene in sediments, which was consistent with previous studies conducted in aquatic ecosystems (Wankel et al., 2011). Some studies reported N-related variables were the key factors that determined the community structure of AOB in soils and sediments because NH4+ was the key energy source for ammonia oxidizers (Verhamme et al., 2011). Given that a positive correlation between bacterial amoA abundance and NH4+-N concentration in sediment was observed in this study (Supplementary Table 6), we may conclude that bacterial nitrifiers, but not archaeal nitrifiers, may prefer the environment with high NH4+ levels. Consistent with previous studies (Bru et al., 2011), we found that the abundance of nirS and nosZ genes showed a strong temporal variation and was significantly related to water quality and sediment properties (Supplementary Table 6). Seasonal variations in microbial community structure in lake sediments were generally assumed to be driven by changing environmental factors (e.g., temperature, ORP and NO3‐-N concentration) and stochastic processes (Laverock et al., 2014). On a temporal scale, the most important determinants of denitrifiers abundance may be temperature, which has a marked effect on all life forms.
In conclusion, the findings of this study revealed the importance of nitrification and denitrification in zero–water exchange ponds. The results suggest that the sediment had excellent potential nitrification-denitrification performance in the zero–water exchange ponds. Physiological responses of denitrifiers to environmental conditions mainly regulate the denitrification rate, rather than a shift in microbial community composition in zero–water exchange ponds. In addition, potential nitrification rates were positively correlated with sediment TOC concentration, and the potential denitrification rate had a positive correlation with sediment nitrate concentration. These findings provide fundamental information about the mechanisms underlying the benefits of the zero–water exchange ponds. However, this study only focused on potential nitrification and denitrification rates. The contribution of nitrogen cycle structure should be further explored to reveal the process of nitrogen conversion and its contribution to nitrogen removal in zero–water exchange ponds.
Data availability statement
The datasets presented in this study can be found in online repositories. The names of the repository/repositories and accession number(s) can be found below: BioProject, PRJNA898355.
Author contributions
Conceptualization, WG; methodology, SN, WG, ZL, and KZ; software, SN and WG; validation, GW, EY, YX, JT, and HL; resources, WG and JX; data curation, GW, EY, YX, and JT; writing-original draft preparation, SN and WG; writing-review and editing, WG; visualization, SN, ZL, KZ, and GW; project administration, WG and JX; funding acquisition, WG and JX. All authors contributed to the article and approved the submitted version.
Funding
This study was funded by the National Key R&D Program of China (2019YFD0900302), Central Public-interest Scientific Institution Basal Research Fund, CAFS (No.2020TD58), and the Modern Agroindustry Technology Research System of China (CARS-45-21).
Acknowledgments
The authors would like to give thanks to the reviewers for their helpful suggestions.
Conflict of interest
The authors declare that the research was conducted in the absence of any commercial or financial relationships that could be construed as a potential conflict of interest.
Publisher’s note
All claims expressed in this article are solely those of the authors and do not necessarily represent those of their affiliated organizations, or those of the publisher, the editors and the reviewers. Any product that may be evaluated in this article, or claim that may be made by its manufacturer, is not guaranteed or endorsed by the publisher.
Supplementary material
The Supplementary Material for this article can be found online at: https://www.frontiersin.org/articles/10.3389/fmars.2023.1072911/full#supplementary-material
Abbreviations
TN, total nitrogen; TP, total phosphorus; DO, dissolved; Temp, temperature; TDS, total dissolved solids; COD, chemical oxygen demand; TOC, total organic carbon; TSS, Total suspended solids; EC, electric conductivity; WC, water content; Chl a, Chlorophyll a; SPC, specific conductance.
References
Avnimelech Y., Ritvo G. (2003). Shrimp and fish pond soils: processes and management. Aquaculture 220 (1-4), 549–567. doi: 10.1016/S0044-8486(02)00641-5
Bothe H., Jost G., Schloter M., Ward B. B., Witzel K. P. (2000). Molecular analysis of ammonia oxidation and denitrification in natural environments. FEMS Microbiol. Rev. 24 (5), 673–690. doi: 10.1111/j.1574-6976.2000.tb00566.x
Bru D., Ramette A., Saby N. P. A., Dequiedt S., Ranjard L., Jolivet C., et al. (2011). Determinants of the distribution of nitrogen-cycling microbial communities at the landscape scale. ISME J. 5 (3), 532–542. doi: 10.1038/ismej.2010.130
Cao L., Naylor R., Henriksson P., Leadbitter D., Metian M., Troell M., et al. (2015). China's aquaculture and the world's wild fisheries. Science 347, 133–135. doi: 10.1126/science.1260149
Conley D. J., Paerl H. W., Howarth R. W., Boesch D. F., Seitzinger S. P., Havens K. E. (2009). Controlling eutrophication: nitrogen and phosphorus. Science 323 (5917), 1014–1015. doi: 10.1126/science.1167755
Cui Y., Wang J., Hao S. (2021). Spatial variability of nitrate pollution and its sources in a hilly basin of the Yangtze river based on clustering. Sci. Rep. 11 (1), 16752. doi: 10.1038/s41598-021-96248-0
Daims H., Lebedeva E. V., Pjevac P., Han P., Herbold C., Albertsen M., et al. (2015). Complete nitrification by Nitrospira bacteria. Nature 528 (7583), 504–509. doi: 10.1038/nature16461
Daims H., Lücker S., Wagner M. (2016). A new perspective on microbes formerly known as nitrite-oxidizing bacteria. Trends Microbiol. 24, 699–712. doi: 10.1016/j.tim.2016.05.004
Delghandi M. R., Waldner K., El-Matbouli M., Menanteau-Ledouble S. (2020). Identification mycobacterium spp. in the natural water of two Austrian rivers. Microorganisms 8, 1305. doi: 10.3390/microorganisms8091305
Deng M., Hou J., Song K., Chen J., Gou J., Li D., et al. (2020b). Community metagenomic assembly reveals microbes that contribute to the vertical stratification of nitrogen cycling in an aquaculture pond. Aquaculture 520, 734911. doi: 10.1016/j.aquaculture.2019.734911
Deng D., Pan Y., Liu G., Liu W., Ma L. (2020a). Seeking the hotspots of nitrogen removal: a comparison of sediment denitrification rate and denitrifier abundance among wetland types with different hydrological conditions. Sci. Total Environment 737, 140253. doi: 10.1016/j.scitotenv.2020.140253
Ettinger C. L., Voerman S. E., Lang J. M., Stachowicz J. J., Eisen J. A. (2017). Microbial communities in sediment from zostera marina patches, but not the z. marina leaf or root microbiomes, vary in relation to distance from patch edge. PeerJ 5, e3246. doi: 10.7717/peerj.3246
Food and Agriculture Organization of the United Nations (FAO) (2020). The state of world fisheries and aquaculture 2020 (Rome: Sustainability in action).
Gao D., Liu M., Hou L., Derrick Y. L., Wang W., Li X., et al. (2019). Effects of shrimp-aquaculture reclamation on sediment nitrate dissimilatory reduction processes in a coastal wetland of southeastern China. Environ. Pollution 255, 113219. doi: 10.1016/j.envpol.2019.113219
Groffman P. M., Altabet M. A., Böhlke J., Butterbach-Bahl K., David M. B., Firestone M. K., et al. (2006). Methods for measuring denitrification: diverse approaches to a difficult problem. Ecol. Applications 16, 2091–2122. doi: 10.1890/1051-0761(2006)016[2091:MFMDDA]2.0.CO;2
Hou Y., Li B., Xu G., Li D., Zhang C., Jia R., et al. (2021). Dynamic and assembly of benthic bacterial community in an industrial-scale in-pond raceway recirculating culture system. Front. Microbiol. 12, 4083. doi: 10.3389/fmicb.2021.797817
Hou J., Song C., Cao X., Zhou Y. (2013). Shifts between ammonia-oxidizing bacteria and archaea in relation to nitrification potential across trophic gradients in two large Chinese lakes (Lake taihu and lake chaohu). Water Res. 47, 2285–2296. doi: 10.1016/j.watres.2013.01.042
Kim H., Bae H. S., Reddy K. R., Ogram A. (2016). Distributions, abundances and activities of microbes associated with the nitrogen cycle in riparian and stream sediments of a river tributary. Water Res. 106, 51–61. doi: 10.1016/j.watres.2016.09.048
Koner S., Chen J. S., Hsu B. M., Rathod J., Huang S. W., Chien H. Y., et al. (2022). Depth-resolved microbial diversity and functional profiles of trichloroethylene-contaminated soils for biolog EcoPlate-based biostimulation strategy. J. Hazardous Materials 424, 127266. doi: 10.1016/j.jhazmat.2021.127266
Kutvonen H., Rajala P., Carpén L., Bomberg M. (2015). Nitrate and ammonia as nitrogen sources for deep subsurface microorganisms. Front. Microbiol. 6, 1079. doi: 10.3389/fmicb.2015.01079
Laverock B., Tait K., Gilbert J. A., Osborn A. M., Widdicombe S. (2014). Impacts of bioturbation on temporal variation in bacterial and archaeal nitrogen-cycling gene abundance in coastal sediments. Environ. Microbiol. Rep. 6 (1), 113–121. doi: 10.1111/1758-2229.12115
Li H., Tao W. (2017). Efficient ammonia removal in recirculating vertical flow constructed wetlands: complementary roles of anammox and denitrification in simultaneous nitritation, anammox and denitrification process. Chem. Eng. J. 317, 972–979. doi: 10.1016/j.cej.2017.02.143
Li Z., Yu E., Zhang K., Gong W., Xia Y., Wang G., et al. (2020). Water treatment effect, microbial community structure, and metabolic characteristics in a field-scale aquaculture wastewater treatment system. Front. Microbiol. 11. doi: 10.3389/fmicb.2020.00930
Lichtenthaler H. K. (1987). Chlorophylls and carotenoids: pigments of photosynthetic biomembranes. Meth. Enzymol. 148:350–382.
Liu W., Wang Z., Zhang Q., Cheng X., Lu J., Liu G. (2015). Sediment denitrification and nitrous oxide production in Chinese plateau lakes with varying watershed land uses. Biogeochemistry 123, 379–390. doi: 10.1007/s10533-015-0072-9
Liu X., Chen C., Wang W., Hughes J., Lewis T., Hou E., et al. (2013). Soil environmental factors rather than denitrification gene abundance control N2O fluxes in a wet sclerophyll forest with different burning frequency. Soil Biol. Biochem. 57, 292–300. doi: 10.1016/j.soilbio.2012.10.009
Liu Z., Iqbal M., Zeng Z., Lian Y., Zheng A., Zhao M. (2020). Comparative analysis of microbial community structure in the ponds with different aquaculture model and fish by high-throughput sequencing. Microbial pathogenesis 142, 104101. doi: 10.1016/j.micpath.2020.104101
Lu S., Liu X., Ma Z., Liu Q., Wu Z., Zeng X., et al. (2016). Vertical segregation and phylogenetic characterization of ammonia-oxidizing bacteria and archaea in the sediment of a freshwater aquaculture pond. Front. Microbiol. 6. doi: 10.3389/fmicb.2015.01539
McCrackin M. L., Elser J. J. (2010). Atmospheric nitrogen deposition influences denitrification and nitrous oxide production in lakes. Ecology 91, 528–539. doi: 10.1890/08-2210.1
Noll M., Matthies D., Frenzel P., Derakshani M., Liesack W. (2005). Succession of bacterial community structure and diversity in a paddy soil oxygen gradient. Environ. Microbiol. 7, 382–395. doi: 10.1111/j.1462-2920.2005.00700.x
Pfenning K. S., McMahon P. B. (1997). Effect of nitrate, organic carbon, and temperature on potential denitrification rates in nitrate-rich riverbed sediments. J. hydrology 187 (3-4), 283–295. doi: 10.1016/S0022-1694(96)03052-1
Rahman M. M., Nagelkerke L. A., Verdegem M. C., Wahab M. A., Verreth J. A. (2008). Relationships among water quality, food resources, fish diet and fish growth in polyculture ponds: a multivariate approach. Aquaculture 275 (1-4), 108–115. doi: 10.1016/j.aquaculture.2008.01.027
Team, R. C. (2018). R: a language and environment for statistical computing. Vienna, Austria: R Foundation for Statistical Computing.
Schloss P. D., Westcott S. L., Ryabin T., Hall J. R., Hartmann M., Hollister E. B., et al. (2009). Introducing mothur: open-source, platform-independent, community-supported software for describing and comparing microbial communities. Appl. Environ. Microbiol. 75 (23), 7537–7541. doi: 10.1128/AEM.01541-09
Shan J., Zhao X., Sheng R., Xia Y., Ti C., Quan X., et al. (2016). Dissimilatory nitrate reduction processes in typical Chinese paddy soils: rates, relative contributions, and influencing factors. Environ. Sci. Technology 50 (18), 9972–9980. doi: 10.1021/acs.est.6b01765
Shen X., Xu M., Li M., Zhao Y., Shao X. (2020). Response of sediment bacterial communities to the drainage of wastewater from aquaculture ponds in different seasons. Sci. Total Environment 717, 137180. doi: 10.1016/j.scitotenv.2020.137180
Sims A., Horton J., Gajaraj S., McIntosh S., Miles R. J., Mueller R., et al. (2012). Temporal and spatial distributions of ammonia-oxidizing archaea and bacteria and their ratio as an indicator of oligotrophic conditions in natural wetlands. Water Res. 46, 4121–4129. doi: 10.1016/j.watres.2012.05.007
Song K., Kang H., Zhang L., Mitsch W. J. (2012). Seasonal and spatial variations of denitrification and denitrifying bacterial community structure in created riverine wetlands. Ecol. Engineering 38 (1), 130–134. doi: 10.1016/j.ecoleng.2011.09.008
Tang Y., Zhao L., Cheng Y., Yang Y., Sun Y., Liu Q. (2021). Control of cyanobacterial blooms in different polyculture patterns of filter feeders and effects of these patterns on water quality and microbial community in aquacultural ponds. Aquaculture 542, 736913. doi: 10.1016/j.aquaculture.2021.736913
Verhamme D. T., Prosser J. I., Nicol G. W. (2011). Ammonia concentration determines differential growth of ammonia-oxidising archaea and bacteria in soil microcosms. ISME J. 5 (6), 1067–1071. doi: 10.1038/ismej.2010.191
Wallenstein M. D., Myrold D. D., Firestone M., Voytek M. (2006). Environmental controls on denitrifying communities and denitrification rates: insights from molecular methods. Ecol. applications 16, 2143–2152. doi: 10.1890/1051-0761(2006)016[2143:ECODCA]2.0.CO;2
Wang D., Chen Y., Zheng X., Li X., Feng L. (2013). Short-chain fatty acid production from different biological phosphorus removal sludges: the influences of PHA and gram-staining bacteria. Environ. Sci. technology 47, 2688–2695. doi: 10.1021/es304673s
Wang B., Guo Y., Zhao M., Li B., Peng Y. (2019). Achieving energy-efficient nitrogen removal and excess sludge reutilization by partial nitritation and simultaneous anammox denitrification and sludge fermentation process. Chemosphere 218, 705–714. doi: 10.1016/j.chemosphere.2018.11.168
Wankel S. D., Mosier A. C., Hansel C. M., Paytan A., Francis C. A. (2011). Spatial variability in nitrification rates and ammonia-oxidizing microbial communities in the agriculturally impacted elkhorn Slough estuary, California. Appl. Environ. Microbiol. 77, 269–280. doi: 10.1128/AEM.01318-10
Wittebolle L., Marzorati M., Clement L., Balloi A., Daffonchio D., Heylen K., et al. (2009). Initial community evenness favours functionality under selective stress. Nature 458, 623–626. doi: 10.1038/nature07840
Yao L., Chen C., Liu G., Liu W. (2018). Sediment nitrogen cycling rates and microbial abundance along a submerged vegetation gradient in a eutrophic lake. Sci. Total Environment 616-617, 899–907. doi: 10.1016/j.scitotenv.2017.10.230
Yao L., Jiang X., Chen C., Liu G., Liu W. (2016). Within-lake variability and environmental controls of sediment denitrification and associated N2O production in a shallow eutrophic lake. Ecol. Engineering 97, 251–257. doi: 10.1016/j.ecoleng.2016.10.023
Yi M., Zhang L., Li Y., Qian Y. (2022). Structural, metabolic, and functional characteristics of soil microbial communities in response to benzo[a]pyrene stress. J. Hazardous Materials 431, 128632. doi: 10.1016/j.jhazmat.2022.128632
Zeng S., Wei D., Hou D., Wang H., Liu J., Weng S., et al. (2021). Sediment microbiota in polyculture of shrimp and fish pattern is distinctive from those in monoculture intensive shrimp or fish ponds. Sci. Total Environment 787, 147594. doi: 10.1016/j.scitotenv.2021.147594
Zhang M., Huang J., Sun S., Rehman M. M. U., He S., Zhou W. (2021a). Nitrogen removal through collaborative microbial pathways in tidal flow constructed wetlands. Sci. Total Environment 758, 143594. doi: 10.1016/j.scitotenv.2020.143594
Zhang H., Ma M., Huang T., Miao Y., Li H., Liu K., et al. (2022a). Spatial and temporal dynamics of actinobacteria in drinking water reservoirs: novel insights into abundance, community structure, and co-existence model. Sci. Total Environment 814, 152804. doi: 10.1016/j.scitotenv.2021.152804
Zhang K., Wang G., Fu D., Gong W., Yu E., Li Z., et al. (2022b). Nutrient dynamics and balance of zero–water exchange ponds of grass carp, crucian carp and bighead carp. Aquaculture 561, 738565. doi: 10.1016/j.aquaculture.2022.738565
Zhang M., Wang Z., Huang J., Sun S., Cui X., Zhou W., et al. (2021b). Salinity-driven nitrogen removal and its quantitative molecular mechanisms in artificial tidal wetlands. Water Res. 202, 117446. doi: 10.1016/j.watres.2021.117446
Zhang K., Yu D., Li Z., Xie J., Wang G., Gong W., et al. (2019). Influence of eco-substrate addition on organic carbon, nitrogen and phosphorus budgets of intensive aquaculture ponds of the pearl river, China. Aquaculture 520, 734868. doi: 10.1016/j.aquaculture.2019.734868
Zhao Z., Jiang J., Pan Y., Dong Y., Chen Z., Zhang G. (2020). Temporal dynamics of bacterial communities in the water and sediments of sea cucumber (Apostichopus japonicus) culture ponds. Aquaculture 528, 735498. doi: 10.1016/j.aquaculture.2020.735498
Zheng X., Zhang K., Yang T., He Z., Shu L., Xiao F., et al. (2021). Sediment resuspension drives protist metacommunity structure and assembly in grass carp (Ctenopharyngodon idella) aquaculture ponds. Sci. Total Environment 764, 142840. doi: 10.1016/j.scitotenv.2020.142840
Keywords: zero-water exchange system, microbial community, nitrification, denitrification, nitrogen removal
Citation: Niu S, Zhang K, Li Z, Wang G, Li H, Xia Y, Tian J, Yu E, Gong W and Xie J (2023) Nitrification and denitrification processes in a zero-water exchange aquaculture system: characteristics of the microbial community and potential rates. Front. Mar. Sci. 10:1072911. doi: 10.3389/fmars.2023.1072911
Received: 10 November 2022; Accepted: 10 April 2023;
Published: 24 April 2023.
Edited by:
Liping Liu, Shanghai Ocean University, ChinaReviewed by:
Sanni Leea Aalto, Technical University of Denmark, DenmarkYale Deng, University of Minnesota Twin Cities, United States
Copyright © 2023 Niu, Zhang, Li, Wang, Li, Xia, Tian, Yu, Gong and Xie. This is an open-access article distributed under the terms of the Creative Commons Attribution License (CC BY). The use, distribution or reproduction in other forums is permitted, provided the original author(s) and the copyright owner(s) are credited and that the original publication in this journal is cited, in accordance with accepted academic practice. No use, distribution or reproduction is permitted which does not comply with these terms.
*Correspondence: Wangbao Gong, Z29uZ3diQHByZnJpLmFjLmNu; Jun Xie, WGllanVuaHkwMUAxMjYuY29t