 Ana Genua-Olmedo
 Gregory M. Verutes
 Heliana Teixeira
 Ana I. Sousa
 Ana I. Lillebø
- 1CESAM – Centre for Environmental and Marine Studies, Department of Biology, University of Aveiro, Aveiro, Portugal
- 2Centro Interdisciplinar de Investigación en Tecnoloxías Ambientais (CRETUS)-Department of Applied Economics, University of Santiago de Compostela, Santiago de Compostela, Spain
In line with the global trend, the Ria de Aveiro coastal lagoon is subjected to multiple co-occurring pressures threatening vital benefits flowing from nature to people. The main objective of this research was to assess the status of habitats important for ecosystem services in the Ria de Aveiro by identifying vulnerable areas to anthropogenic threats. The pressures from seven relevant human activities (recreation, services, aquaculture, agriculture, commercial development, unintended impacts from management, and invasive alien species) were analysed based on their spatiotemporal distribution (exposure) and impact over the EUNIS habitats (EUNIS codes A2.2, A2.22 – sand flats and beaches; A2.3 – mud flats; A2.61 – seagrasses; A2.5, A2.53C, A2.535, A2.545, A2.554 – salt marshes; and, X10 – ‘Bocage,’ a landscape of small-hedged fields) in seven distinct landscape units. A prospective scenario, co-developed for the year 2030, was evaluated using a map-based risk assessment tool and brought forward the near-term vulnerability of the seagrass biotope. The highest risks posed to intertidal habitats (mud flats and salt marshes) were driven mainly by environmental management activities that support critical socio-economic sectors. Our methodology evaluated plausible threats to habitats in the near term, established baseline knowledge for the adaptive management process in Ria de Aveiro Natura 2000 site, and showcased how future assessments can inform the operationalization of ecosystem-based management as new information becomes available.
1 Introduction
Human-driven global changes threaten the integrity of coastal areas and the provision of ecosystem services (ES). Coastal socio-ecological systems worldwide evidence vulnerability to climate change, namely through mean sea level rise, flooding and storms extreme events, coastal erosion, salinization, and wetland loss and fragmentation (e.g., Cazenave and Cozannet, 2014). Due to their natural capital richness, these shoreline areas have been desirable for many sectoral activities for centuries (e.g., tourism, recreation, fishing, aquaculture, agriculture, shipping and transportation, industrial activities) being currently densely populated and under multiple pressures (Neumann et al., 2015). One of the major challenges nowadays is to increase resilience to climate change by promoting sustainable development, targeting social, environmental, and economic objectives, and mitigating the risks that affect the supply of ES. Ecosystem-based management (EBM) combines science-based knowledge from different fields of research with local knowledge (Röckmann et al., 2015) and integrate the concept of adaptive management (Webb et al., 2017). Several definitions of EBM are available in the literature, many conceptual (e.g., Long et al., 2015). Our study will follow the operational description by Delacámara et al. (2020): “EBM can be understood as any management or policy option intended to restore, enhance and/or protect the resilience of the ecosystem”. Some relevant examples of the operationalization of the concept are found in Australia’s Great Barrier Reef, often given as a reference for a comprehensive EBM (McCook et al., 2010); the Yellow Sea Large Marine Ecosystems, as an example of a global effort to implement EBM from economically developing countries (Sherman, 2014); large marine ecosystems in Alaska, to provide indicators to inform about the management of marine resources (Zador et al., 2017); the Western Mediterranean, to explore participatory research methods (Gómez and Maynou, 2021).
The operationalization of management options, is often supported by modelling tools, such as the InVEST (Integrated Valuation of Ecosystem Services and Trade-offs; https://naturalcapitalproject.stanford.edu/software/invest), an open-source software for analysing how changes in ecosystems are likely to affect the flow of benefits to people. The InVEST model calculates the cumulative risk posed to habitats by human activities in two dimensions: exposure (degree to which a habitat experiences a pressure produced by human activities, given the effectiveness of management practices), and consequence (sensitivity of the habitat to the effects of the pressure). InVEST also explores consequences for the delivery of ES and is designed to inform decisions about natural resources management. Relevant studies have applied InVEST to estimate the cumulative risk to habitats combined with vulnerability indexes at different coastal areas, such as the United States of America (Wyatt et al., 2017), South Korea (Chung et al., 2015), Belize (Arkema et al., 2014), or France (Cabral et al., 2015). In Portugal, Willaert et al. (2019) applied InVEST in a coastal region north of Lisbon, and Caro et al. (2020) in the Mondego estuary.
Ria de Aveiro coastal lagoon (Western Atlantic coast of Portugal) is a Long-Term Socio-Ecological Research (LTsER) platform that gathered a high-resolution and robust data set at the local scale during the last decade, supported by national and EU projects involving natural and social scientists, and the active participation of stakeholders (e.g., LAGOONS (FP7), AQUACROSS (H2020), BioPradaRia (MAR2020/EMFF). This data set is paramount to operationalizing the EBM concept. Ria de Aveiro is classified under Natura 2000 and lays between marine and terrestrial domain, where anthropogenic pressures and natural areas overlap in space and time, being a complex area in terms of environmental management (e.g., Lillebø et al., 2015; O’Higgins et al., 2019; Lillebø et al., 2020).
The primary objective of this work is to identify opportunities for EBM by showing how the InVEST tool can be applied to improve adaptive management. Specifically, how future scenarios for the year 2030, co-developed with stakeholders, could be validated with the InVEST tool, combining the Habitat Risk Assessment model (hereafter InVEST HRA tool) with the spatial explicit supply of ES. The previous projects that enabled the socio-ecologic data set addressed the integrated management of water resources from catchment to coast in the context of climate change (Lillebø et al., 2015), the management of seagrass biotope and restoration actions to mitigate the bioturbation pressure by non-indigenous species (Costa et al., 2022) and the EBM for aquatic biodiversity and ES across EU policies (Lago et al., 2019) complemented with ecological data gathered as part of the LTsER platform monitoring. The year 2030 was chosen because it corresponds to different EU policy and strategy revision cycles, as well as the target year for the United Nations Sustainable Development Goals to which the European Green Deal contributes; and 2021-2030 is the United Nations Decade for Ecosystems Restoration aiming at preventing, halting, and reversing the degradation of ecosystems worldwide.
To address the main objective and showcase Ria de Aveiro Natura 2000, three stepwise research questions were identified: i) Which landscape units and respective habitats are most at risk and where? ii) Which human activities pose the greatest risk in the near term (2030)? iii) What management options might minimise the risk? And iv) How might future delivery of ES in a Natura 2000 site be compromised? Our methodology evaluated plausible threats to habitats in the near-term, established baseline knowledge for the adaptive management process in Ria de Aveiro Natura 2000 site, and showcased how future assessments can inform the operationalization of ecosystem-based management as new information becomes available.
2 Materials and methods
2.1 Study area
Ria de Aveiro is a shallow coastal lagoon that comprises the estuary of the Vouga River (3500 km2 of catchment area), having a single artificial connection to the Atlantic Ocean (1.3 km length, 350 m wide, and 20 m depth). The lagoon has semi-diurnal tides with a tidal range from 0.6 m (neap tides) to 3.2 m (spring tides); tidal circulation and wind are the main hydrological forcing functions. The tidal phase lag is in the order of 6 hours in the upper reaches of the channels; whilst the water residence time in the lagoon varies from less than 2 days near the ocean boundary, to more than 1 week in the upstream channels (Dias et al., 2000). Under the EU Water Framework Directive (WFD), Ria de Aveiro includes five transitional water bodies (WB): WB1 (Mira), WB2 (São Jacinto-Espinheiro), WB3 (Ílhavo), WB4 (Murtosa), WB5 (Ovar). Except for WB2, which is heavily modified, the others are natural water bodies. In addition, there are three coastal water bodies (CWB) (CWB-II-1B; CWB-I-2; CWB-II-2) here grouped as WB7. These, together with the ‘Bocage’ landscape that is characterised by small agriculture fields surrounded by living hedges and a network of water channels, are defined as the seven landscape units in this study (Figure 1). The management boundaries of the Ria de Aveiro Natura 2000 were set within 500 m from the margin, as specified for the river basin and estuary management plans under the EU Water Framework Directive. Both Plans aim to establish priorities, rules, and measures for the integrated management of water resources and associated ES (Lillebø et al., 2015; Lillebø et al., 2020).
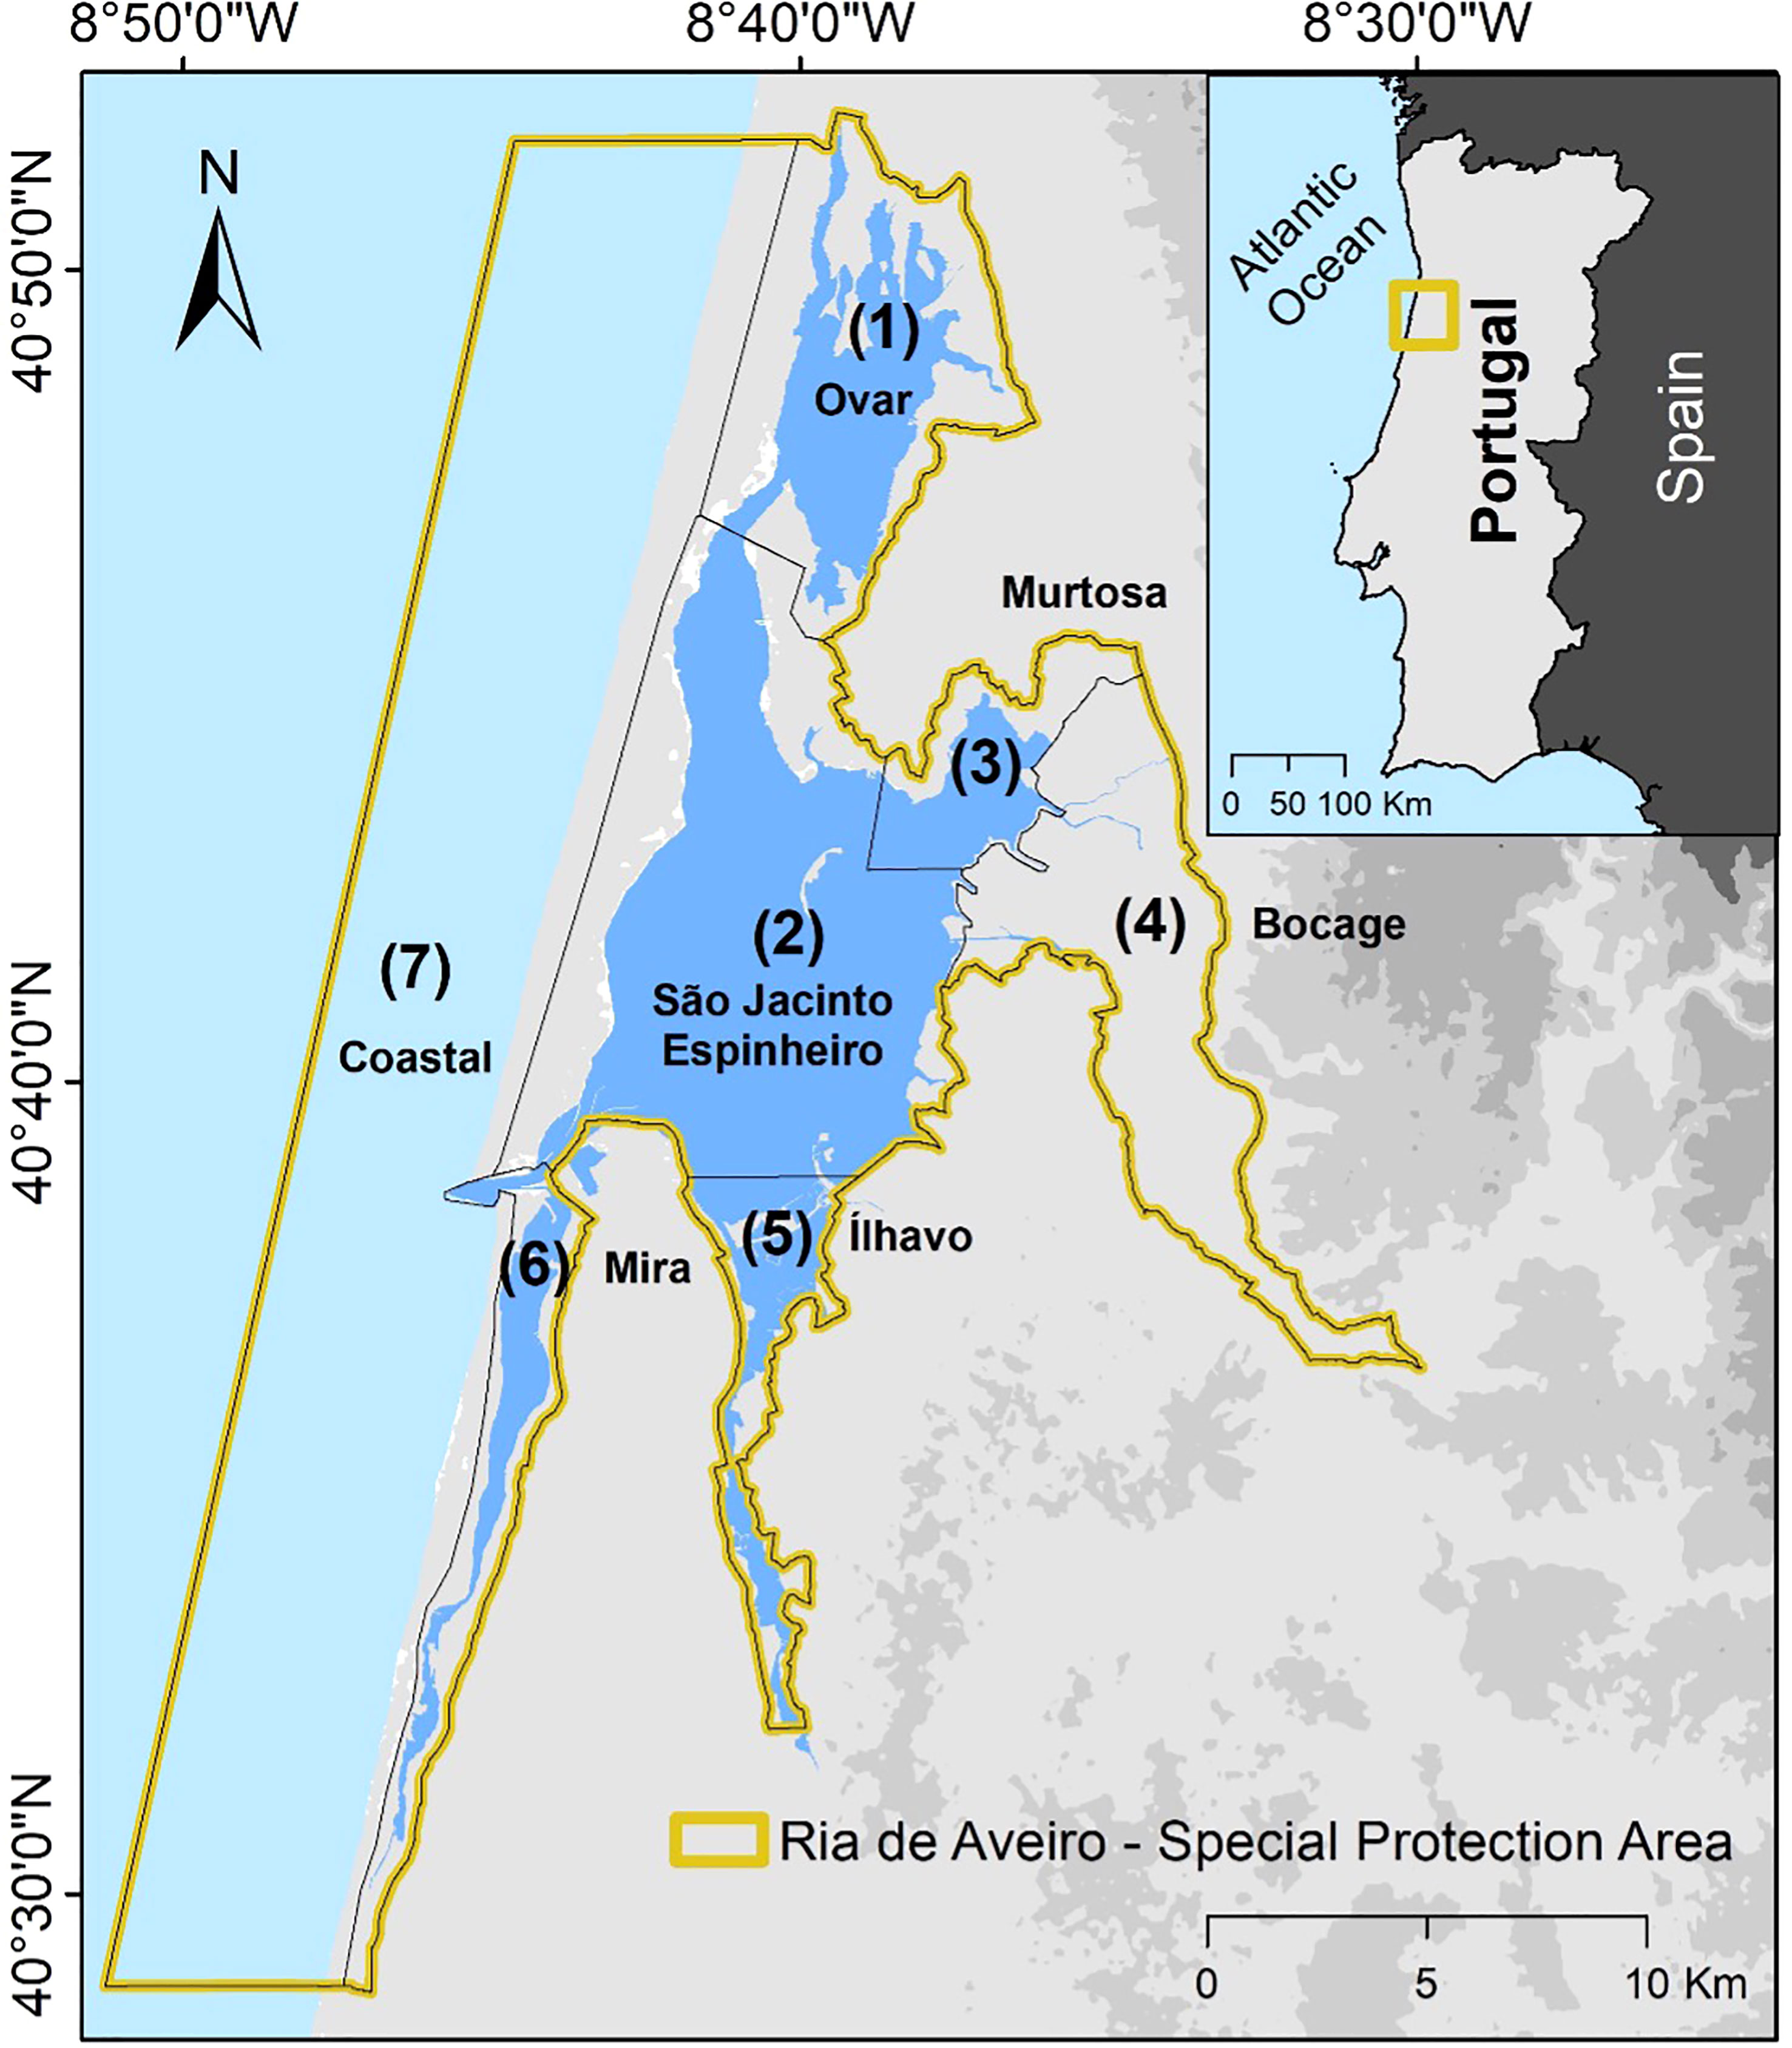
Figure 1 Ria de Aveiro and its location in northwest Portugal. The map shows the water bodies (WB) from the EU Water Framework Directive as five transitional WB and one group of coastal WBs. These six together with the terrestrial ‘Bocage’ landscape are defined as landscape units in this study. They are shown in clockwise order: (1) Ovar - WB5, (2) São Jacinto-Espinheiro - WB2, (3) Murtosa - WB4, (4) Bocage - terrestrial, (5) Ílhavo - WB3, (6) Mira - WB1, (7) Coastal - WB7.
The Ria de Aveiro comprises a variety of biotopes, including natural to highly modified habitats, such as large areas of intertidal sand and mud flats, seagrass meadows, salt marshes, open fields, forests, freshwater lakes, and urban areas. It also comprises the ‘Bocage’ landscape, a human-shaped habitat with water channels and treelined riparian corridors divided by living hedges for agriculture and livestock production. ‘Bocage’ landscape is located at the Baixo Vouga Lagunar (3000 ha), where the Vouga River meets the lagoon water body. The selected Ria de Aveiro Natura 2000 coastal area is classified as a Special Protection Area of ca. 515 km2 from which ca. 40% are considered marine areas and is classified as a Site of Community Importance. This recognises its importance to the conservation status of the natural habitats of the Mediterranean and, to a minor extent, Atlantic biogeographical regions to which Ria de Aveiro belongs. This coastal area offers a set of ES with significant associated socio-economic activities of high economic value. Relevant examples are agriculture and livestock, industry, traditional activities (e.g., salt production and bait digging), tourism and recreation (e.g., sailing and surf), maritime port activity, aquaculture, and commercial fishing, where the Aveiro region plays an important role in the Portuguese fisheries market (Lillebø et al., 2015; O’Higgins et al., 2019).
2.2 Data collection
2.2.1 Habitats
Five habitats were identified following the European Nature Information System (EUNIS) from the European Environmental Agency (Table 1 and Figure 2). These habitats were mapped in ArcGIS v10.5 using database from the Long-Term Socio-Ecological Research (LTsER) Ria de Aveiro platform and Sousa et al., 2017; Sousa et al., 2019a; Sousa et al., 2019b. They correspond to five Ria de Aveiro biotopes: (1) sand flats and beaches, (2) mud flats, (3) seagrasses, (4) salt marshes, and (5) ‘Bocage’ landscape, including the associated network of water channels.
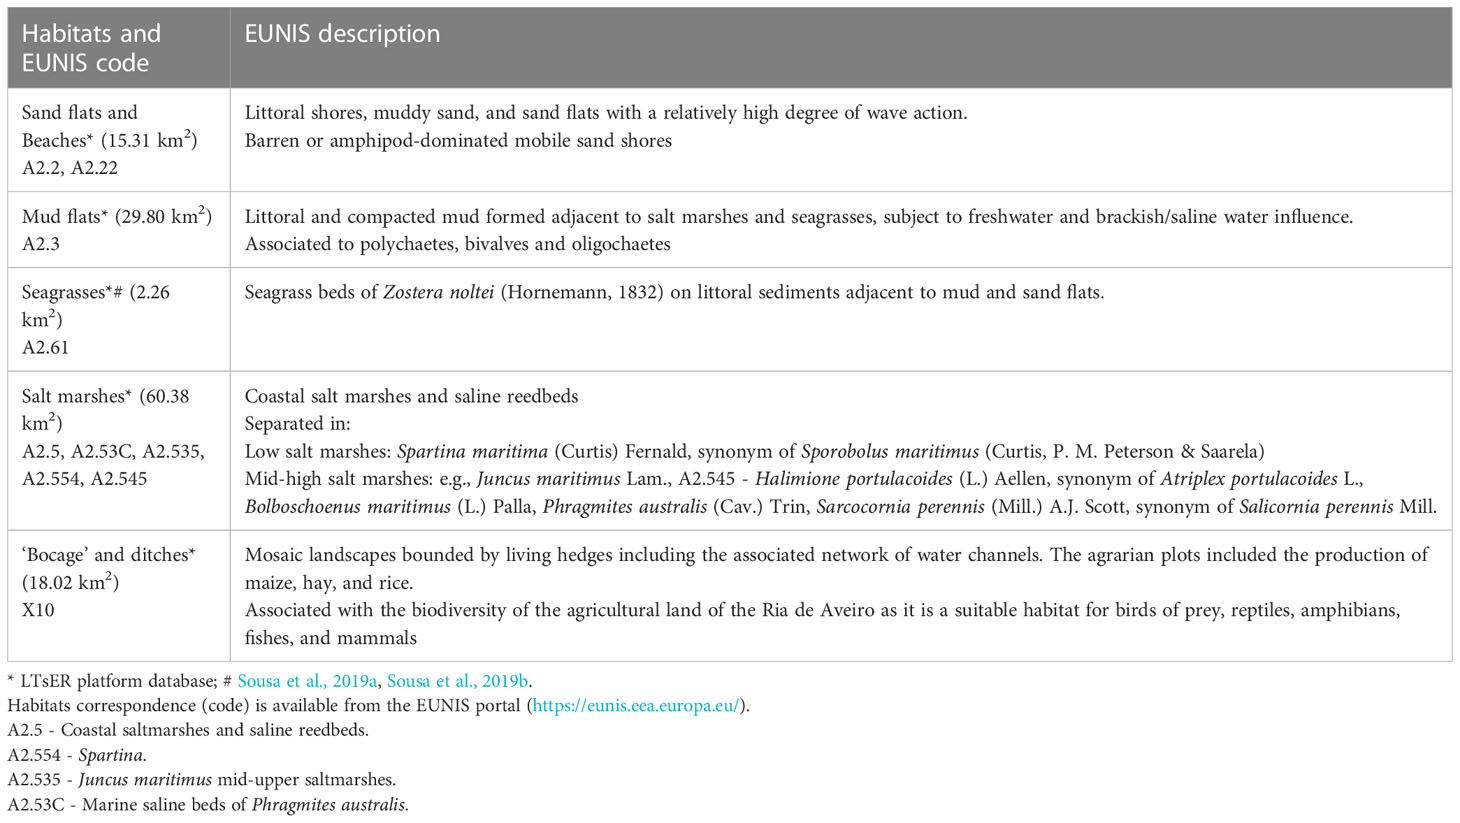
Table 1 Description of the habitats evaluated by this study, with respective occupied areas, in square kilometres, at Ria de Aveiro (Portugal).
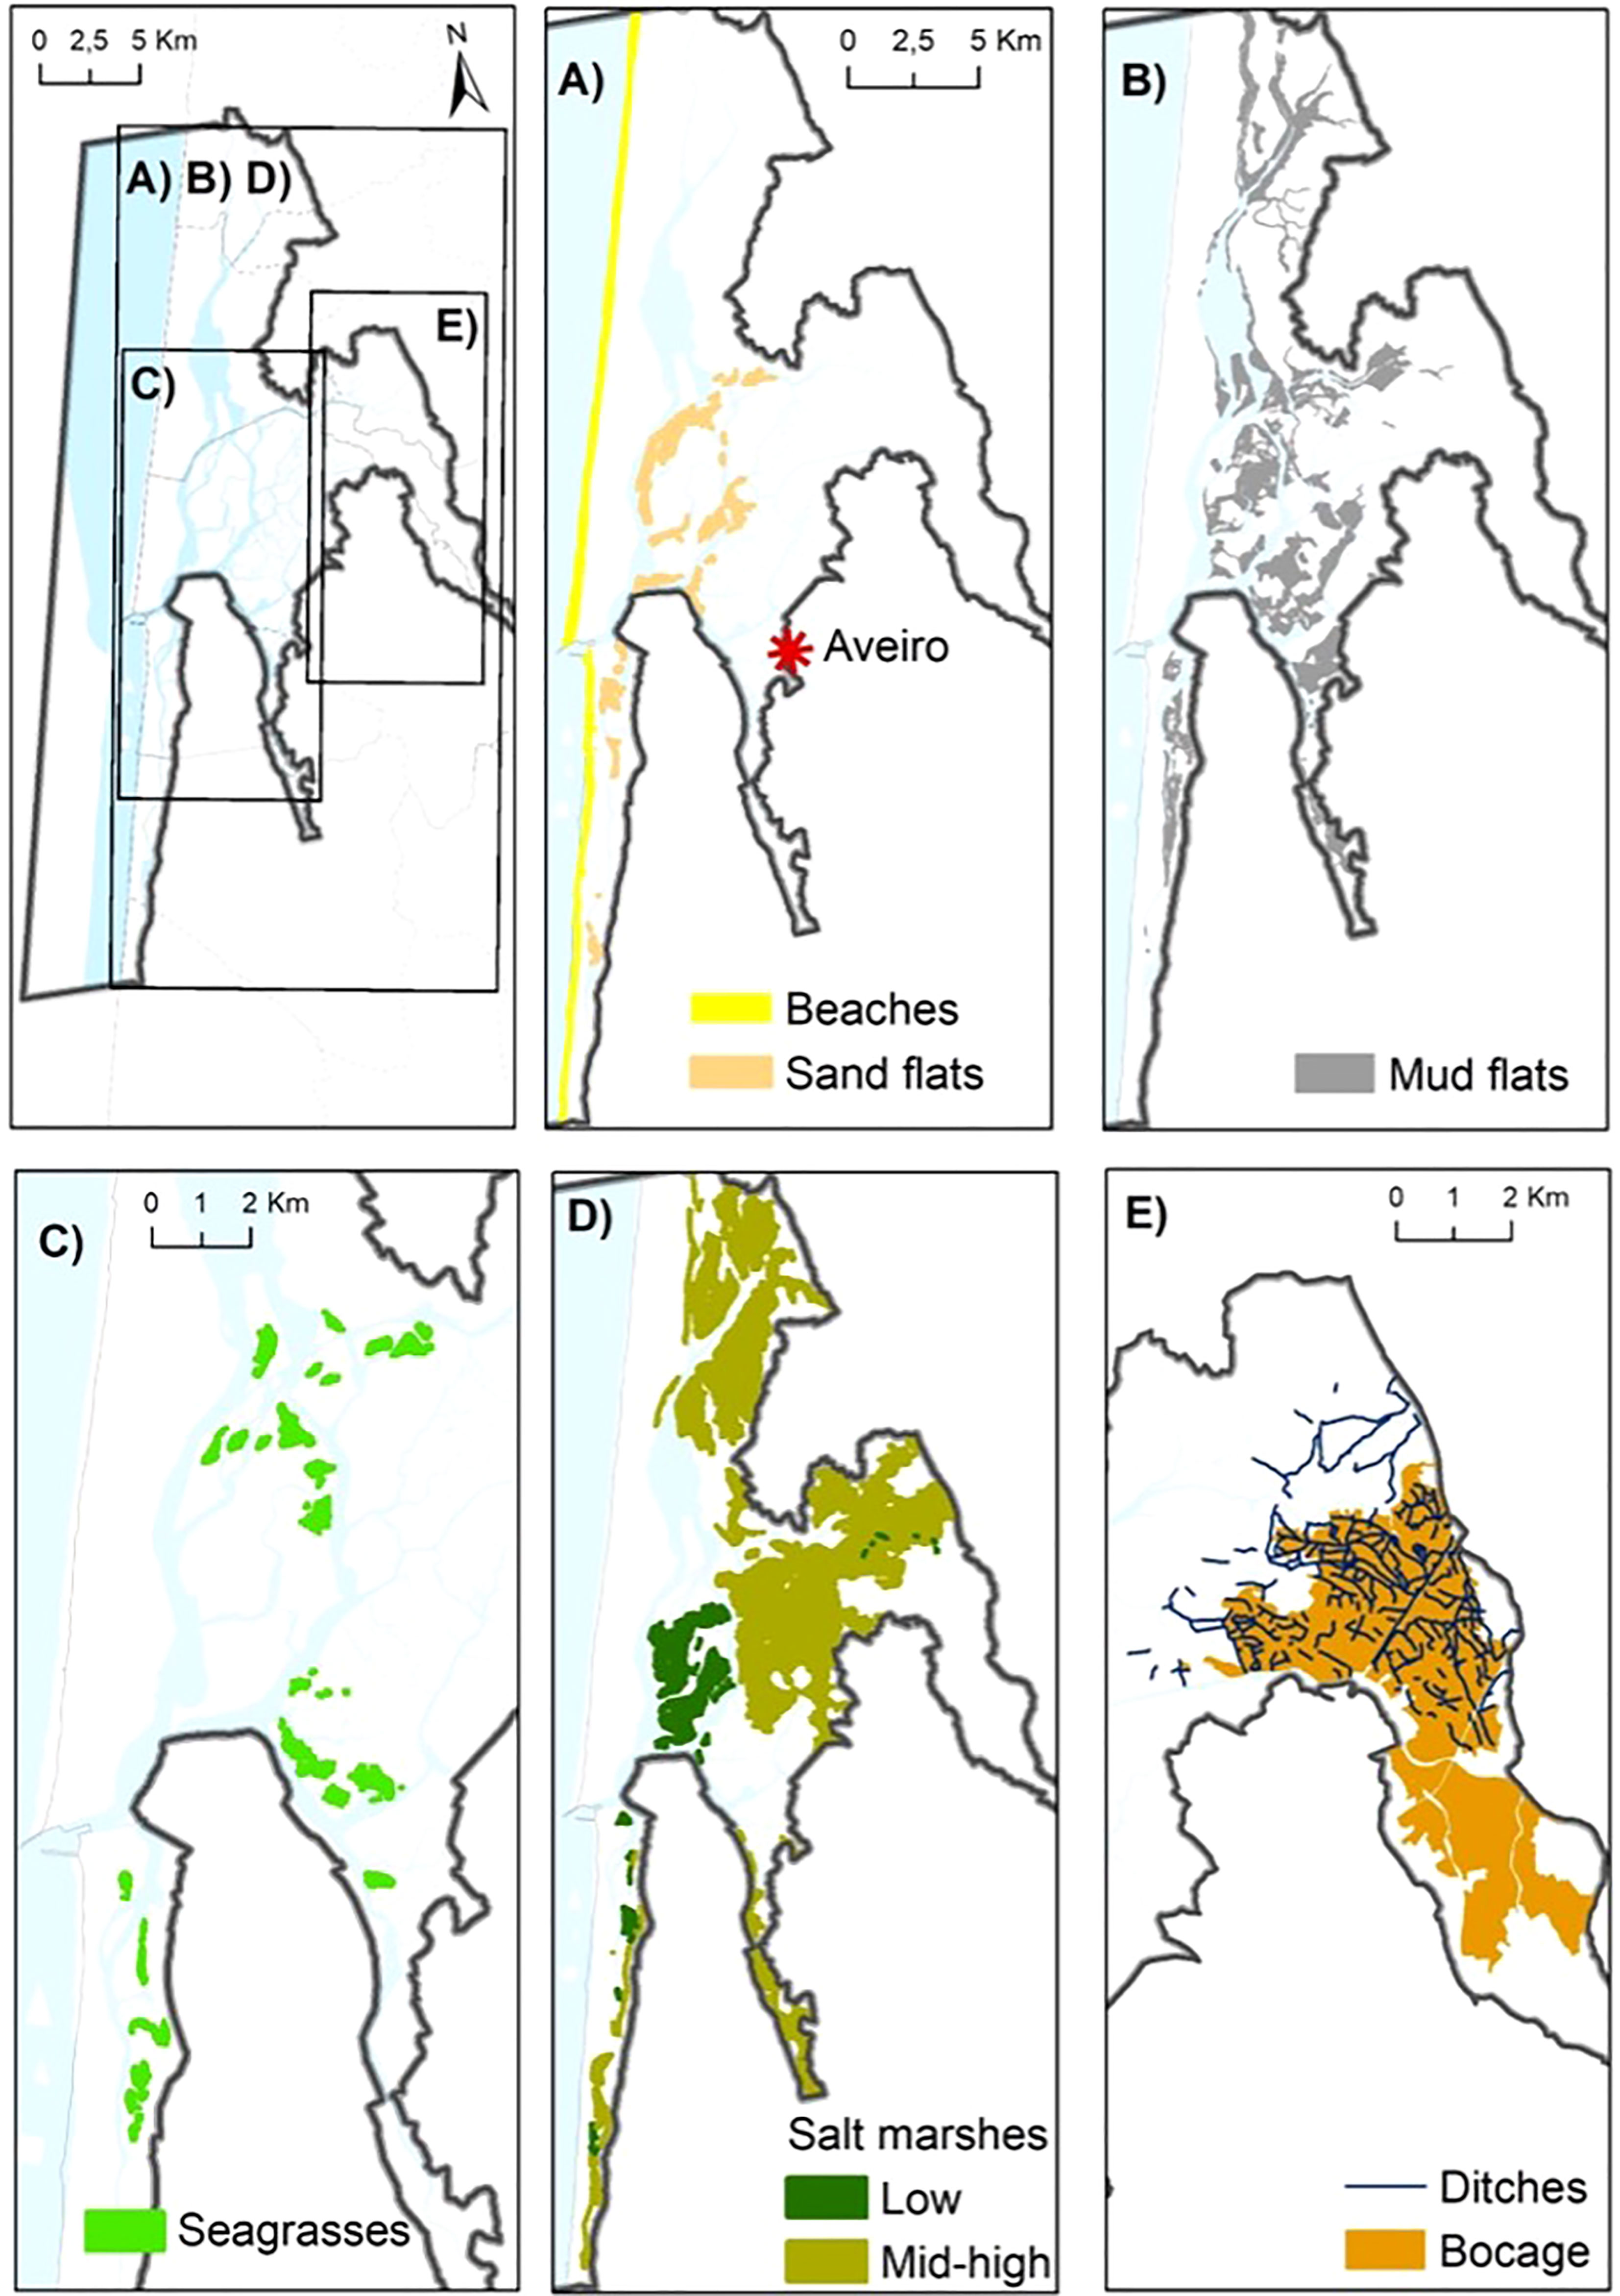
Figure 2 Selected habitats identified in the Ria de Aveiro: (A) beaches and sand flats, (B) mud flats, (C) seagrasses, (D) salt marshes (low and mid-high height) and (E) ‘Bocage’ with associated ditches. The Aveiro city (red asterisk), counties (dashed line) and the Special Protection Area (black line) are also shown.
Sand flats and beaches included littoral shores comprising sandy and muddy sand with a relatively high degree of wave action. The mud flats layer focused on littoral mud formed adjacent to salt marshes and seagrasses. Seagrasses included intertidal Zostera noltei meadows on littoral sediments adjacent to mud and sand flats (Sousa et al., 2019a; Sousa et al., 2019b). The saltmarshes layer covered saltmarshes and saline reedbeds with additional layers differentiating the low Spartina maritima (Curtis) Fernald, synonym of Sporobolus maritimus (Curtis) P.M. Peterson & Saarela, and mid-high (e.g., Halimione portulacoides (L.) Aellen, synonym of Atriplex portulacoides L., Juncus maritimus Lam.) zonation. The list of the dominant species considered as salt marshes layer is provided in Table 1. ‘Bocage’ landscape, including the associated network of water channels, was placed in the agricultural land of the Ria de Aveiro. Detailed description of the habitats is provided in Table 1.
2.2.2 Human activities
Seven types of human activity and the pressures these activities introduce to habitats were identified and mapped by combining different sources of information (Supplementary Table 1). The activity type and pressures were obtained from Borgwardt et al. (2019). They identified activities from seven case studies, including Ria de Aveiro. Ria de Aveiro experts/scientific community identified activities from previous classifications from the European Habitats Directive, WFD, and Marine Strategy Framework. The activities were structured under primary activity types according to the European Commission (EC, 2006). In this study, the selected seven types of human activity were: (1) tourism and recreation, (2) services, (3) aquaculture, (4) agriculture and forestry, (5) commercial development and residential, (6) unintended impacts from environmental management, and (7) multiple activities linked. The spatial extent of consequences of these human activities is provided in Figure 3. Description of the activities and pressures is provided in Supplementary Table 1.
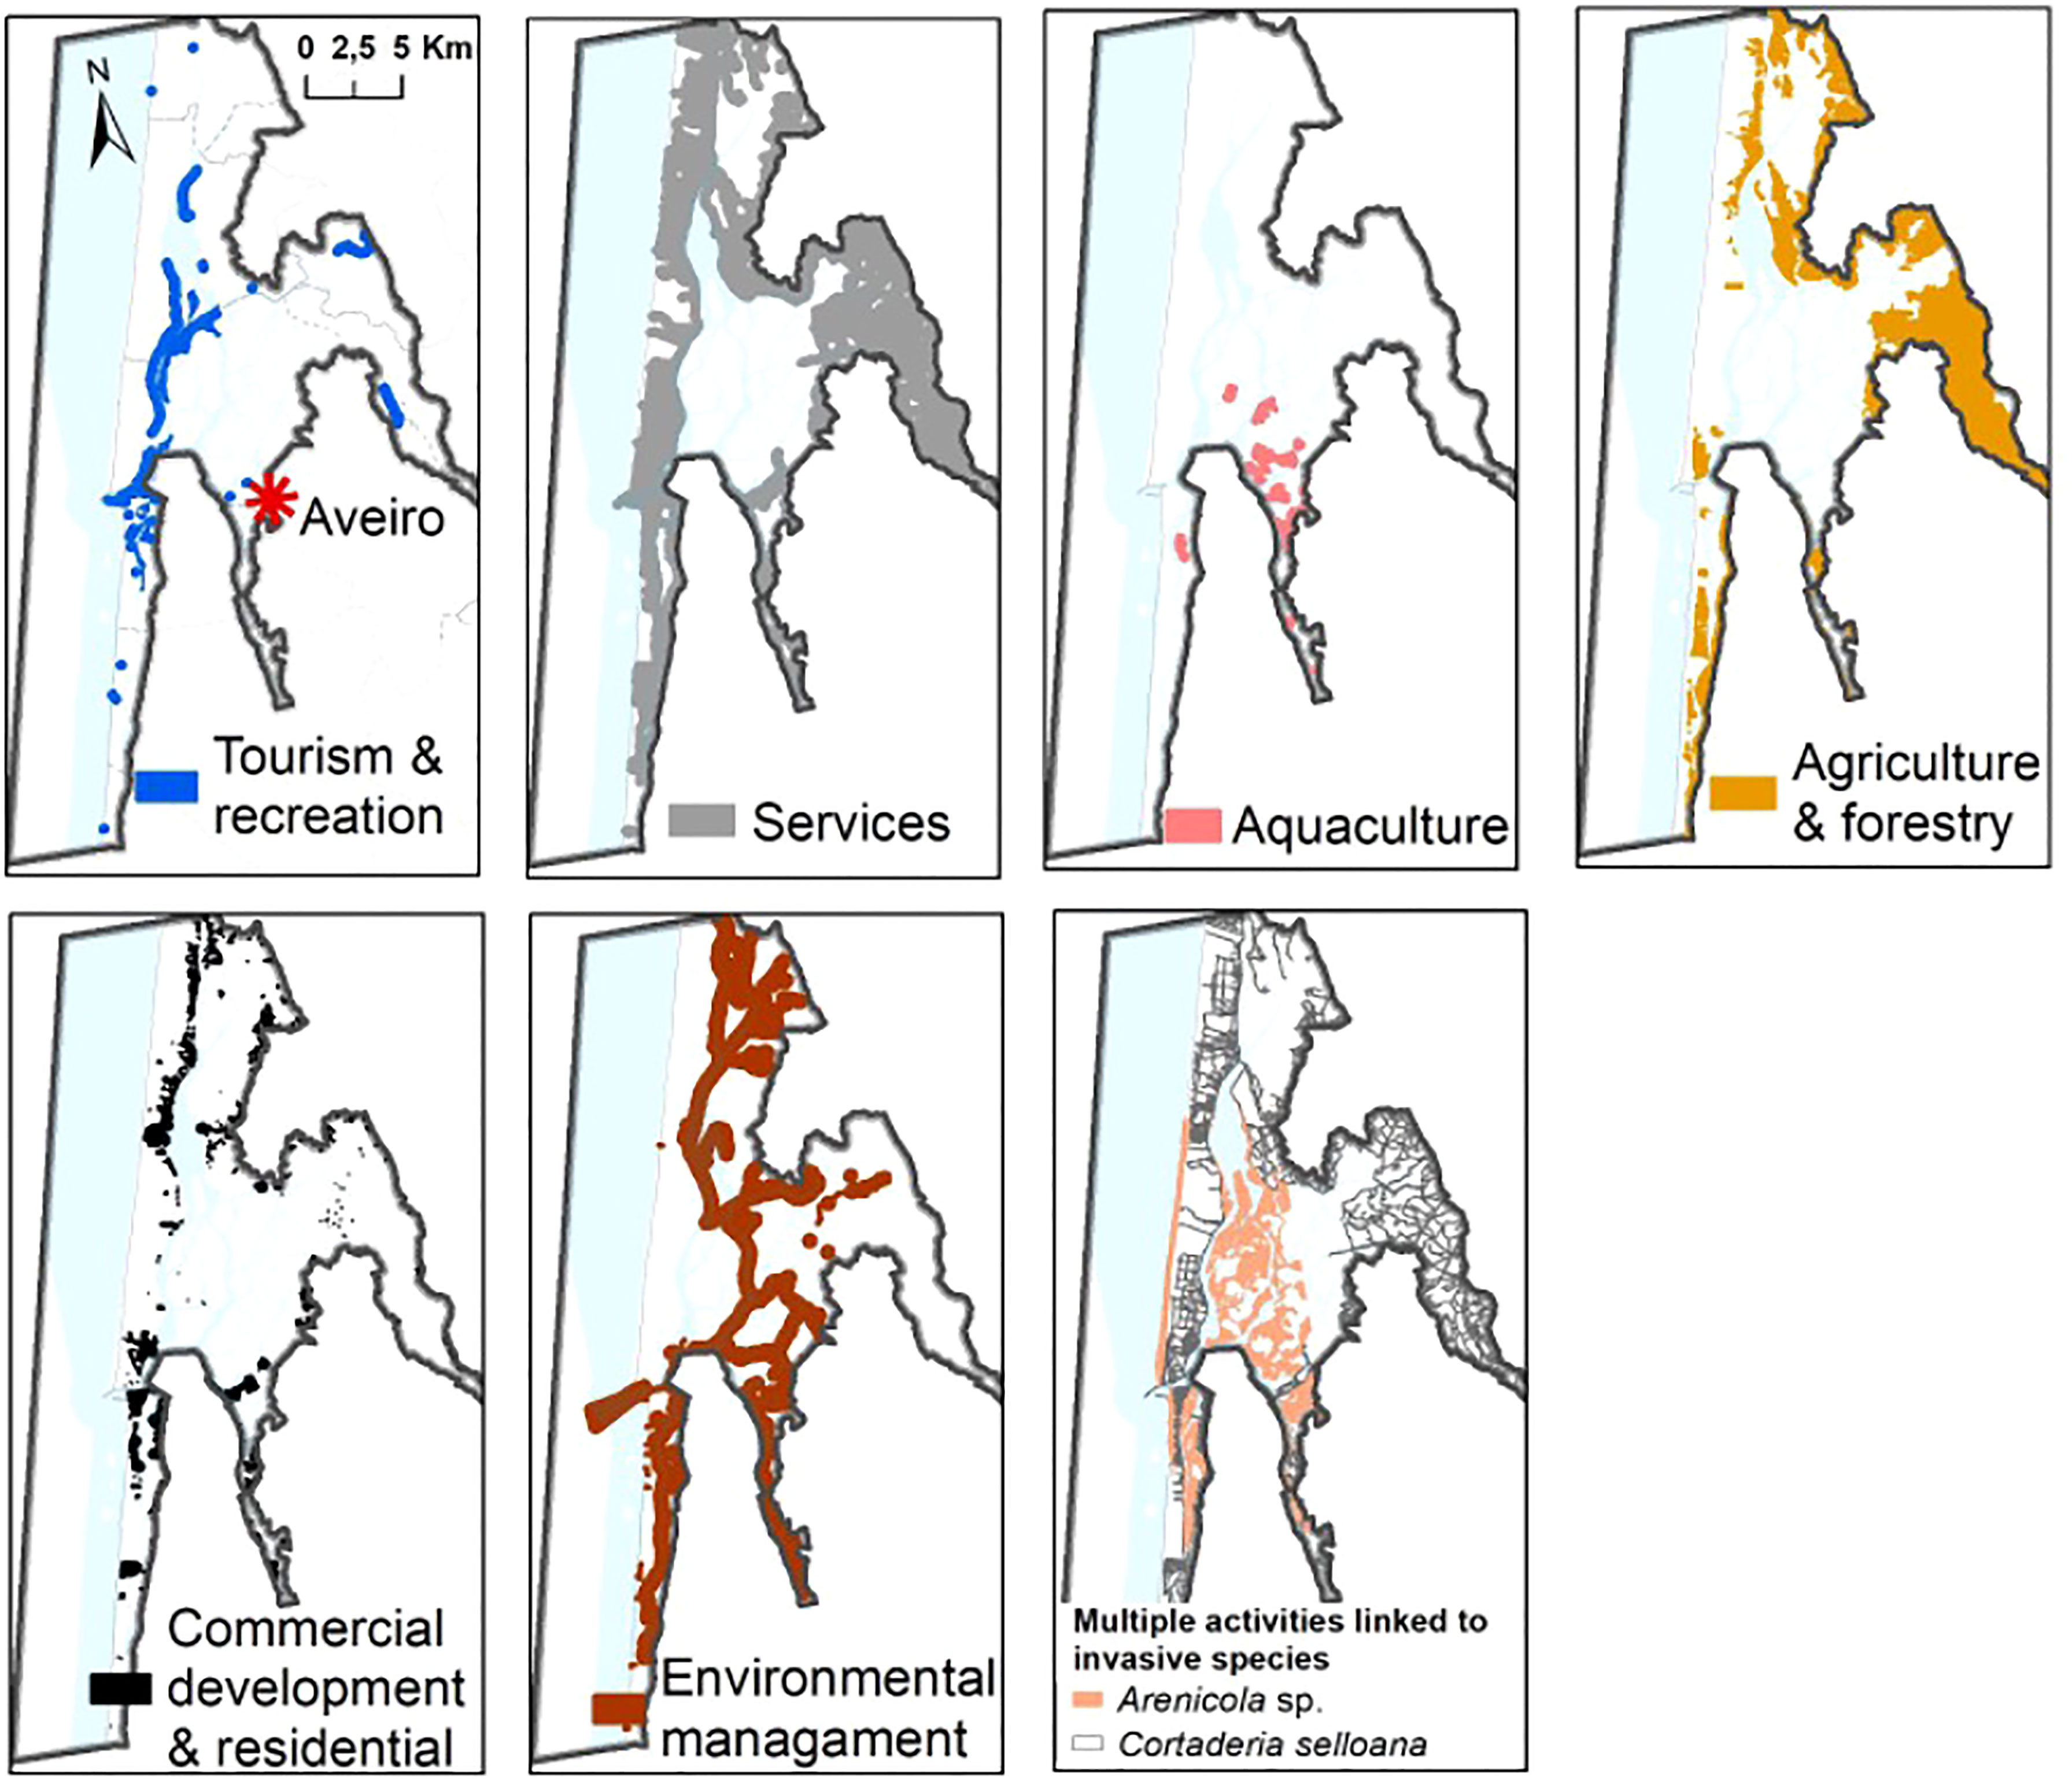
Figure 3 The spatial extent of consequences of the select human activities (from left to right): tourism and recreation, services, aquaculture, agriculture and forestry, commercial development and residential, environmental management. Multiple activities linked to invasive species, and affecting selected habitats are mapped.
The activity called unintended impacts from environmental management refers to the hydrological measures related with socio-economic and agriculture activities. These were dredging actions to maintain the navigability of the lagoon water bodies, considering both capital and maintenance dredging, extraction, and disposal of the substrate; and a flood control infrastructure to disable saltwater intrusion and sea level rise inundation into ‘Bocage’ agricultural areas, including a flood bank, sea walls, and tidal sluices. The flood bank is an embankment built in the 1990’s and its extension is expected by 2030. It was designed to prevent surface saltwater intrusion from Ria de Aveiro into agriculture fields. Supplementary Figure 1 showed where the environmental management activities take place, including dredging and flood control.
To add to the above-identified endogenous pressures, two well-documented invasive alien species affecting the aquatic transitional waters ecosystem and the ‘Bocage’ landscape were included as exogenous pressures. The first corresponds to two lugworm species (benthic macrofauna) grouped by the genus Arenicola (Arenicola marina and Arenicola defodiens) and one species of flora, the pampas grass (Cortaderia selloana). Once an alien species is established, the way it spreads may be facilitated by other activities, different from those responsible for the species’ introduction.
2.3 Habitat risk assessment
2.3.1 Terminology
The InVEST HRA tool utilizes an exposure-consequence framework to assess cumulative risk posed to habitats by the pressures produced by human activities. For clarity, in this assessment: ‘Risk’ was measured as ‘exposure’ (probability of an event happening, i.e., a habitat experiencing pressure from human activity) concerning its potential ‘consequences’ (or impact, i.e., the habitat-specific response to pressures), if the event was to occur. Habitats at greatest risk were those that were less able to cope with exposure to pressures produced by human activities.
2.3.2 Cumulative risk calculation
The habitat risk assessment InVEST HRA tool was applied to calculate habitat risk as a function of the likelihood of the exposure of each habitat to each pressure, and its consequence, which depended on the impact of a pressure for each habitat (Arkema et al., 2014; Sharp et al., 2018). To assess the risk, two geospatial layers were combined: EUNIS habitat distribution maps (Figure 1) and human activity and pressures produced by human activities (Figures 2, 3). Pressures were used as a proxy of stressors due to the lack of stressors’ data. Together with exposure (E) and consequence (C) scores for each habitat-pressure combination, these produced a cumulative risk map at 50 m spatial resolution using the InVEST version 3.8.0. 50 meters was determined through sensitivity testing to be the most appropriate spatial resolution based on the data quality and availability for Ria de Aveiro. The model computes the scores through a weighted average of exposure and consequence for each habitat-pressure interaction (Equation 1). Weighting is obtained by scoring the data quality and the importance given to each criterion. The formulas are given by:
where ei and ci are the scores for the respective exposure or consequence criterion i, di represents the data quality rating for criterion i, wi the importance weighting for the criterion, and n the number of exposure or consequence criteria valued for the habitat-pressure interaction. As the weights are used to divide the effects, this means that a factor with large importance should receive a small value for the weight and vice versa.
For quantifying exposure, we scored four criteria: (1) spatial and (2) temporal overlap between habitats and pressures, (3) intensity of pressure, and (4) management strategy effectiveness for reducing exposure. The model estimates the risk when there is a spatial overlap between habitats and pressures. Otherwise, the model assumes there is no risk, hence E = 0 and C = 0. For quantifying consequence, we included seven criteria. Three were sensitivity attributes: (1) change in area, (2) change in structure, and (3) frequency of disturbance; and four were resilience attributes: (1) natural mortality, (2) recovery time, (3) recruitment, and (4) connectivity. The resilience attributes are habitat (biotic) specific. The description and applied score of these eleven criteria for exposure and consequence habitat-pressureinteractions, are shown in Table 2. The maximum criteria score was of 3, hence all parameters ranged from 1 (lowest risk) to 3 (greatest risk). The scoring was done following data sources including field observations, literature review and expert opinion.

Table 2 Scoring and definitions for the exposure and consequence criteria.
The model also allows assigning weights to score according to data quality and importance of each criterion (Table 3). In this study, we used the same criteria weights (moderately important, 2) with some exceptions when we had data to validate it. For instance, for seagrass habitat, intensity and management effectiveness criteria of the pressure related to environmental trade-offs, seen as unintended impacts from dredging, was scored as 1 because it was cited as important criteria by stakeholders (Lillebø et al., 2019). The individual exposure and consequence criteria, along with scoring for the interaction ratings, data quality and attribute weights by field site are shown in Table 4. These scoring were done through expert judgement with working knowledge of the Ria de Aveiro and marine ecology to rate all possible interactions. The expert elicitation process was conducted in two stages, followed by a final round for revision and consistency check. The methodology followed a process based on iteration and feedback, in which specific doubts were addressed at all stages by the experts (see Teixeira et al., 2019 for more information about the expert elicitation procedure).
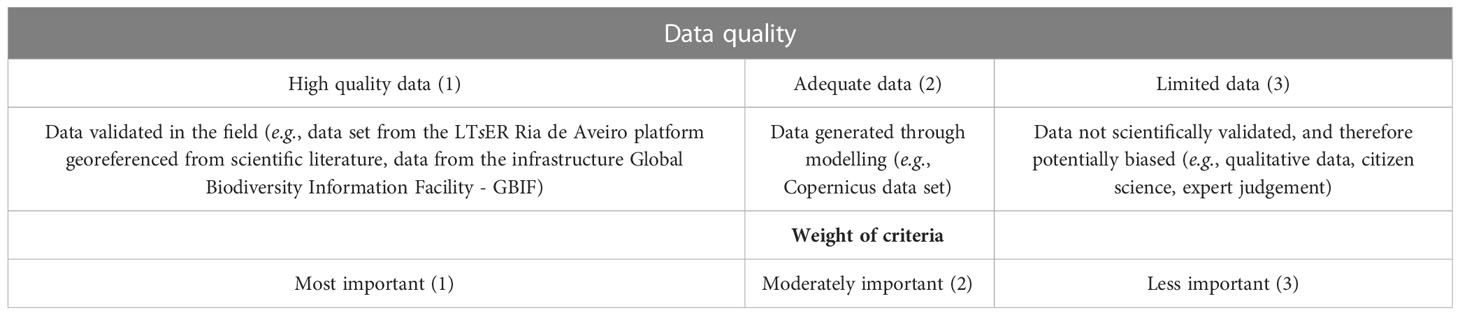
Table 3 Data quality and criteria weight scores. The data quality scores varied based on the source of information.
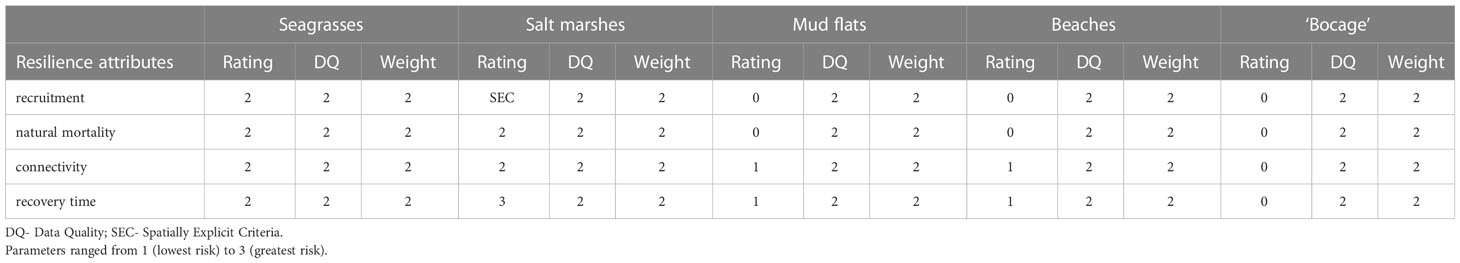
Table 4A Rating of consequence criteria (resilience attributes).
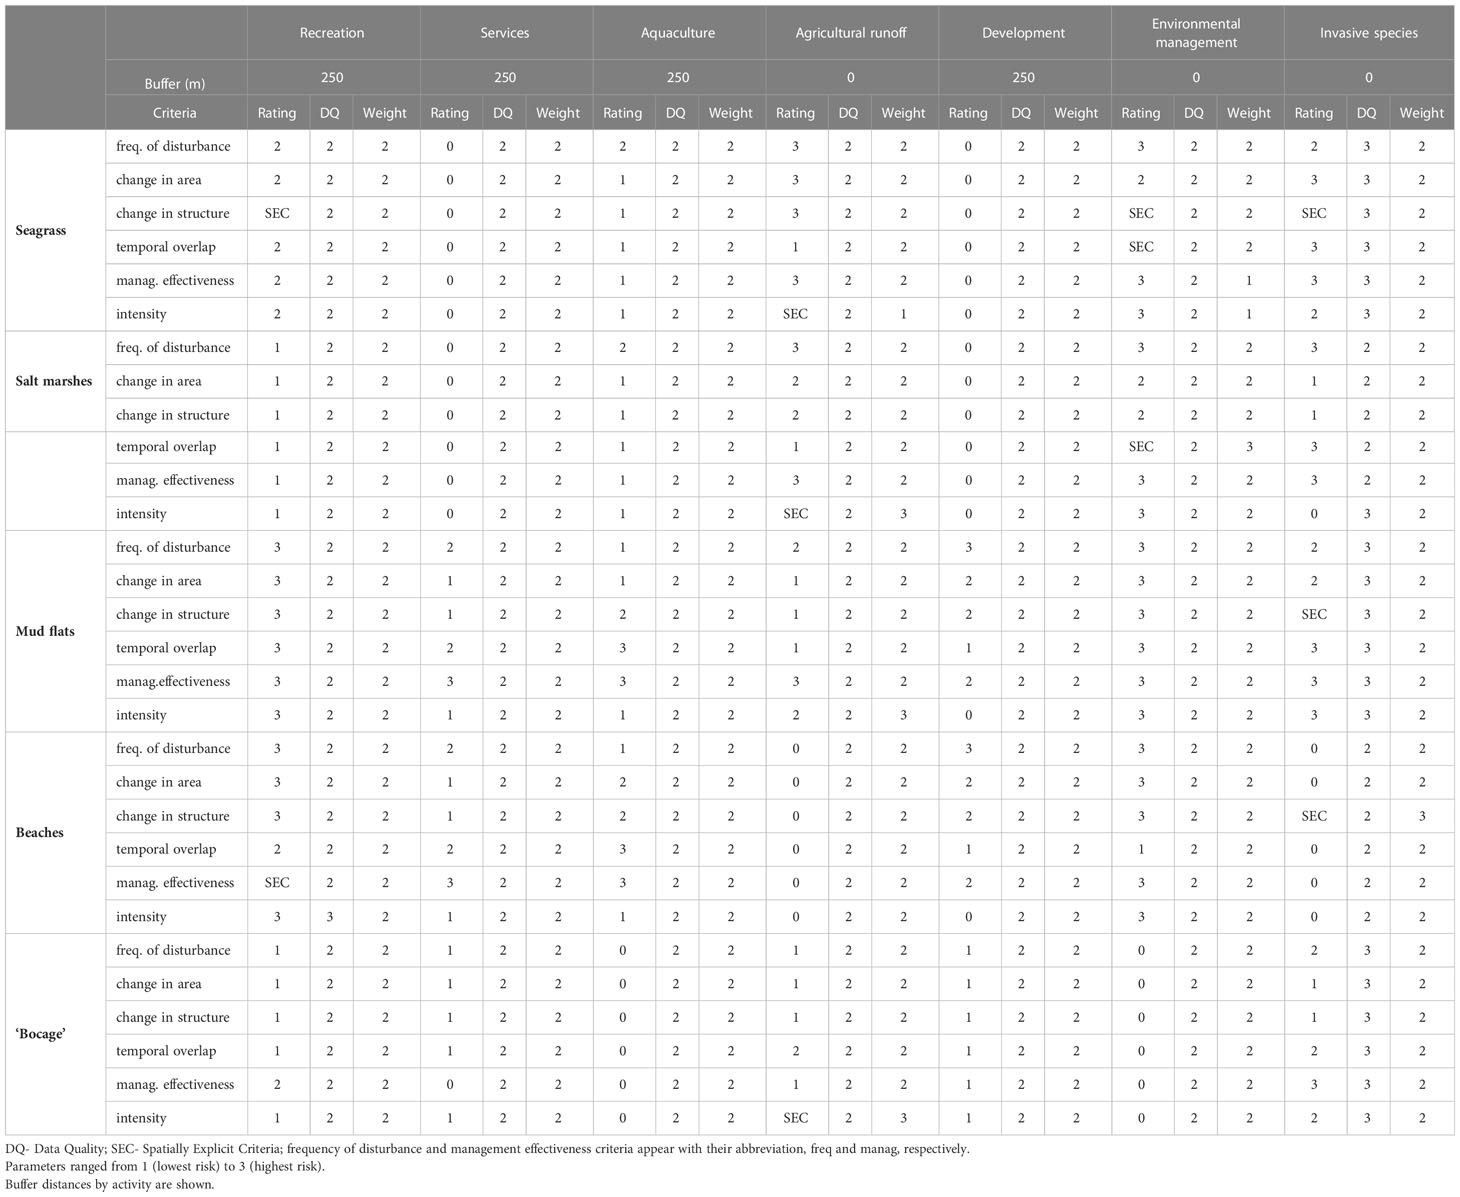
Table 4B Rating of exposure and consequence (sensitivity) criteria for the cumulative risk calculation given each habitat and human activity.
As an alternative to assigning a single rating to a criterion that is then applied to the whole study area, we used the spatially explicit criteria feature of the InVEST HRA tool. It allows to indicate spatial variation in the habitat-pressure scores as Geographic Information System layers when there is information on spatial variation in a human activity which could influence the intensity rating of this pressure. These spatially explicit criteria are vector or raster layers, where each vector or raster value may contain a separate rating for a particular area. For any criteria listed in the criteria scores, instead of entering a single number for the rating, a path to a Geographic Information System file may be entered instead, allowing the rating for that criterion to vary across space. This information of the pressures categories was produced by previous studies (see Lillebø et al., 2019 and Borgwardt et al., 2019) and served to characterize the spatial extent of different pressures such as physical change, chemical change, and biological disturbance. In this study, the direct effects of each human activity were translated into spatially explicit criteria layers of exposure (i.e., intensity, management effectiveness) and consequence attributes (i.e., change in structure, recruitment) to characterize the direct effects of these pressures and the impact on habitat. For example, the dredging activities to keep the navigability in the lagoon causes unintended impacts such as increased water velocity due to changes in the system bathymetry. These changes have a different spatial explicit impact in the interior and the fringe of the seagrass patches; therefore, the intensity rate may be higher in the fringe and lower in the interior.
Two common methods for measuring environmental risk based on expert judgement are Euclidean distance and multiplicative functions. Cumulative impact mapping studies tend to use a multiplicative approach (Halpern et al., 2008; Selkoe et al., 2009; Ban et al., 2010), whereas ecosystem risk assessments typically estimate risk as the Euclidean distance for each habitat-pressure combination in risk plots (Patrick et al., 2010; Hobday et al., 2011; Samhouri and Levin, 2012), which leads to a more precautionary scoring and higher risk (Sharp et al., 2018). Therefore, we selected Euclidean (straight-line) distance from the origin (minimum score) to the average of criteria scores for exposure and consequence, to estimate habitat risk (as in Arkema et al., 2014; Equation 2):
where Rij is the individual risk to habitat i caused by pressure j and E and C are the respective exposure and consequence scores. Regardless of the risk function selected, if a habitat and a pressure did not overlap, the tool assumed that E = 0, C = 0, and therefore R = 0 for the grid cell being evaluated. This is calculated per grid cell by summing all risk scores for each habitat.
Finally, the InVEST HRA tool incorporates a buffer approach that spatially estimates of zones of influence, namely, the distance over which the effects of the pressure spread beyond its actual footprint in the input pressure map. Thus, the model allows for the specification of a decay equation, which is how the zone of influence of a pressure will be applied to risk (it is applied before it enters the risk equation, Equation 2). For example, roads and their impact beyond a road’s physical location is represented as a buffer and then the decay function to account for different levels of exposure for this buffer. In this study, we applied a linear decay function because the spatial overlap of each pressure was assumed to be reduced linearly (degraded habitats over a larger distance) and not exponentially (degraded to nearby habitats) from the footprint of the pressure to the furthest extent of its zone of influence (Sharp et al., 2018).
2.4 Ecosystem-service potential: the supply side
The InVEST HRA tool, apart from assessing the cumulative risk posed to habitats by human activities, enabled the exploration of where these pressures might compromise biodiversity and ES. To obtain data on ES availability, we used the values reported by Lillebø et al. (2019). Coastal-marine services included the biotic and abiotic outputs from ecosystems following the Common International Classification of Ecosystem Services (CICES V5.1 in Haines-Young and Potschin, 2017) and were aggregated as a list of 10 ES types for stakeholders’ elicitation purposes. ES were prioritized by stakeholders’ elicitation. First, a questionnaire was prepared as an online Google form to be filled in by each participant anonymously to make pairwise comparisons of the ES to derive a ranking of criteria for the different stakeholder groups. The scaling method for ranking ES preferences was based on a Likert-type scale, using a five levels bidirectional ordinal scale, with an equivalent number of negative and positive statements: much less important (1/4); less important (1/2); equally important (1); more important (2); and much more important (4). Each participant should qualitatively rank the importance of each ES against the others (details on the stakeholders’ elicitation process in Martínez-López et al., 2019). ES values by stakeholders were published for the provisioning, regulation and maintenance, and cultural ES divisions (Supplementary Table 2).
2.5 Habitat-ES vulnerability
The vulnerability score for each cell in the grid is obtained by multiplying cumulative risk by availability for each cell in the grid:
where V is the vulnerability, R is the cumulative risk score measured by the HRA model (see Equation 2), and A the expert judgement score on availability. The vulnerability score implied that the highest vulnerability was obtained when a habitat with a high potential to deliver ES was subject to higher levels of risk. Thus, the higher the vulnerability score for a given grid cell, the greater the potential loss of ES in that area (Willaert et al., 2019). We calculated cumulative vulnerability and individual (V1 – V11) for each of the 10 ES groupings.
3 Results
3.1 Cumulative risk maps
The risk assessment classified the 50 m2 results for each habitat as either low, medium, or high based on the cumulative risk level (Figure 4). Habitat areas at the highest risk level (relative to their total area) were seagrasses (25.4%) and beaches and sand flats (25%), followed by mud flats (23%), ‘Bocage’ (17%) and salt marshes (7%). Four of the five habitats showed between 50-60% of their area at medium risk, whereas beaches and sand flats were only 32%. The habitats with the highest proportion of area in the lowest risk classification were salt marshes and beaches (both 43%). Regarding the seven landscape units, São Jacinto-Espinheiro WB2, Mira WB1, and the coastal WB7 experienced the highest habitat risk levels per unit area (Figures 4A–C). The exposure-consequence risk plots revealed a significant driver of risk to mud flats, seagrasses, and salt marshes (Figures 5B–D) from the environmental management pressures (S4), either existing or to be implemented by the year 2030. Interventions to maintain critical economic activities such as shipping and transport are likely to have unintended impacts to these habitats following dredging activities (increase in water velocity and in tidal prism in submerged periods that may experience further coastal squeeze, Martínez-López et al., 2019). Recreation activities were found to pose higher threats to beaches and sand flats and mudflats (Figures 5A, B) due to high intensity of use for water sports, engines of tourist boats, and fishing. The highest risk posed by the three invasive (alien) species was identified for seagrasses and mud flats, driven by high habitat suitability for the invasive (alien) lugworm Arenicola spp. With one exception, most of the pressures evaluated showed limited to no risk to the ‘Bocage’ habitat. The invasive plant species, Cortaderia selloana, showed higher level of exposure driven in part by the high overlap since it is in this habitat where this species is most present (Figure 5E and Table 4). Similarly, pressures from the services sector (i.e., related to ballast water discharge, runoff from roads and emissions) were found to be of concern in beach and mud flat habitats due to poor management of marine shipping and transportation activities (Figure 5A, B; Table 4). Agriculture pressures posed a substantial risk in salt marshes and seagrasses because of nutrient runoff in certain channels of the lagoon.
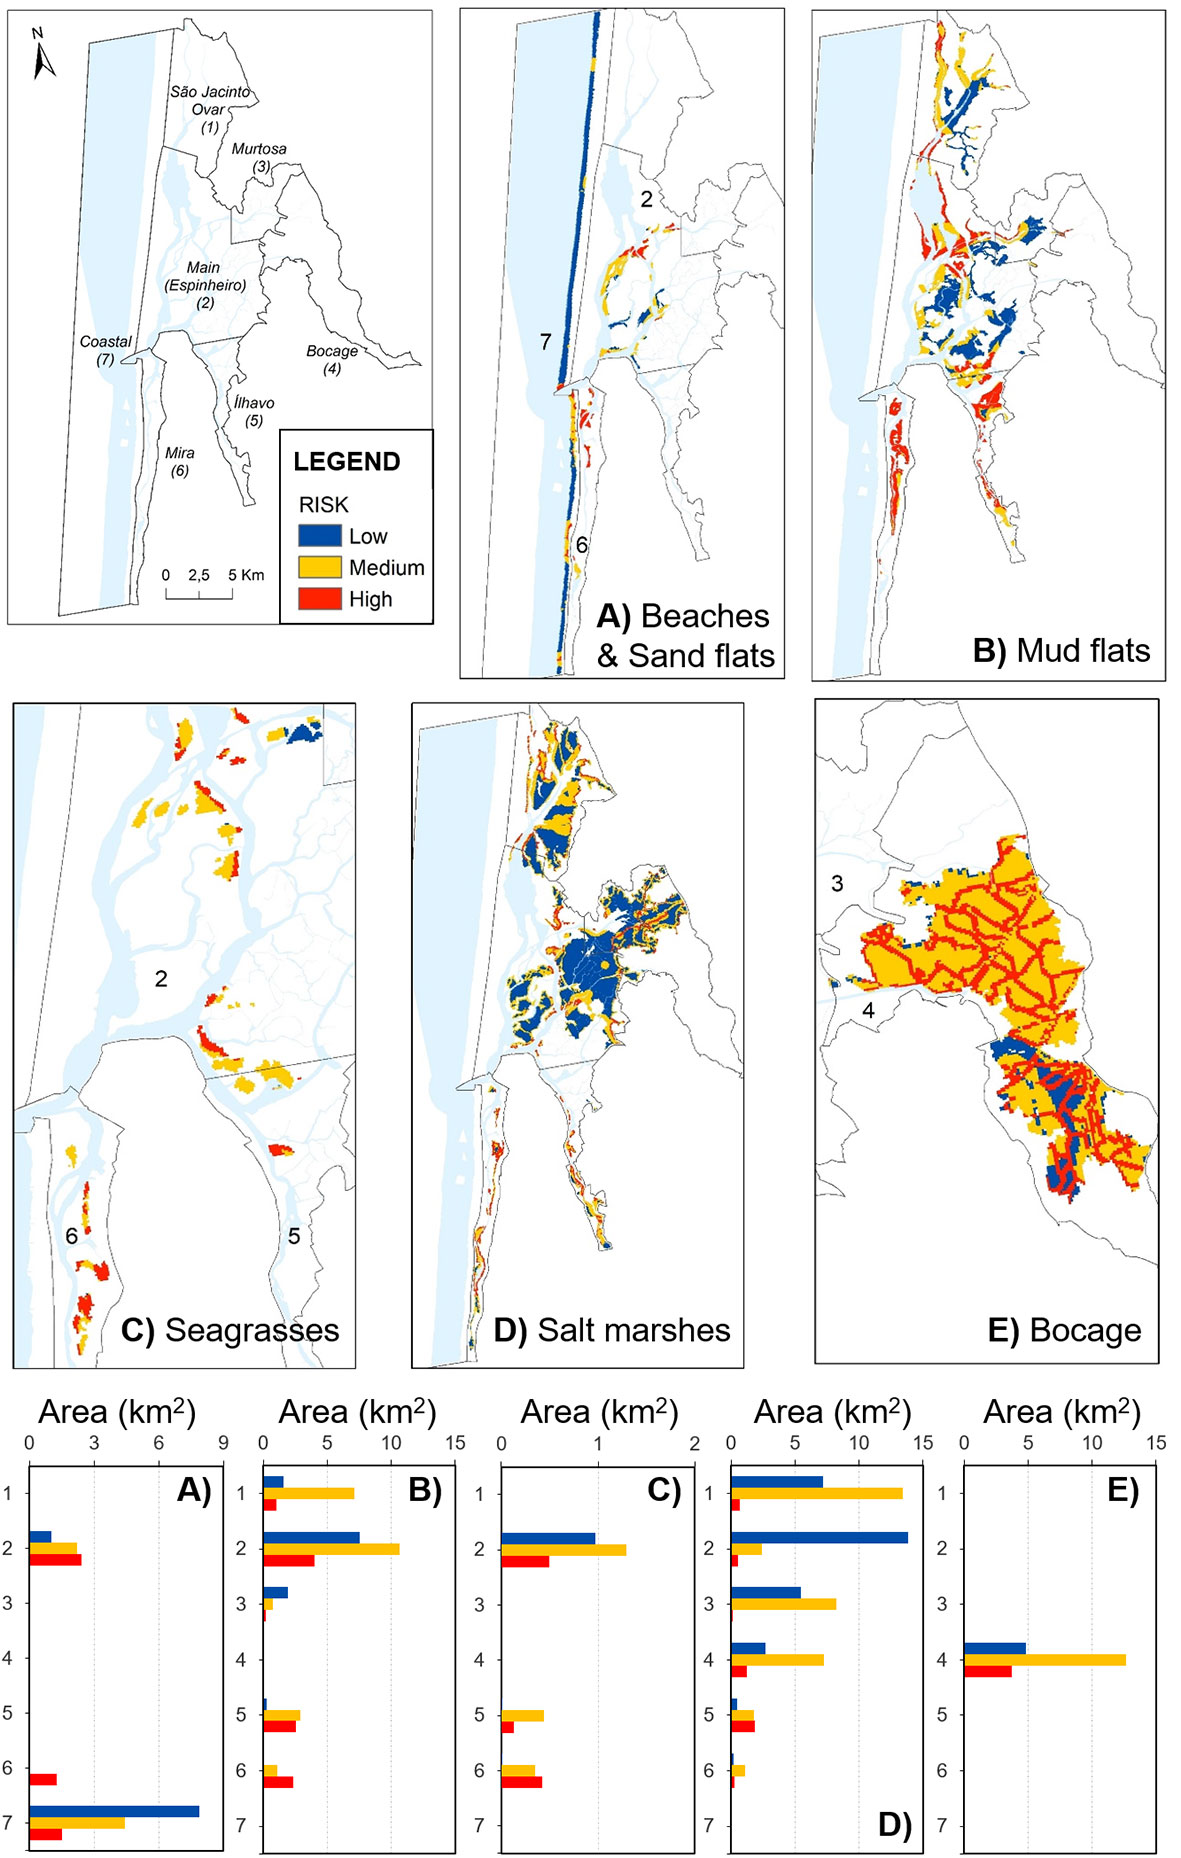
Figure 4 Spatially explicit habitat risk assessment outputs, classified as high, medium and low risk. Bar charts show total area (km2) of habitat in each risk category per landscape units. The habitats are (A) beaches and sand flats, (B) mud flats, (C) seagrasses, D) salt marshes, (E) 'Bocage'. The landscape units are the Y axis and their total area are (1) Ovar - WB5: 48.60 km2, (2) São Jacinto-Espinheiro - WB2: 95.98 km2, (3) Murtosa - WB4: 15.89 km2, (4) ‘Bocage’ - terrestrial: 45.14 km2, (5) Ílhavo - WB3: 17.06 km2, (6) Mira - WB1: 21.46 km2 and (7) Coastal - WB7: 235.97 km2.
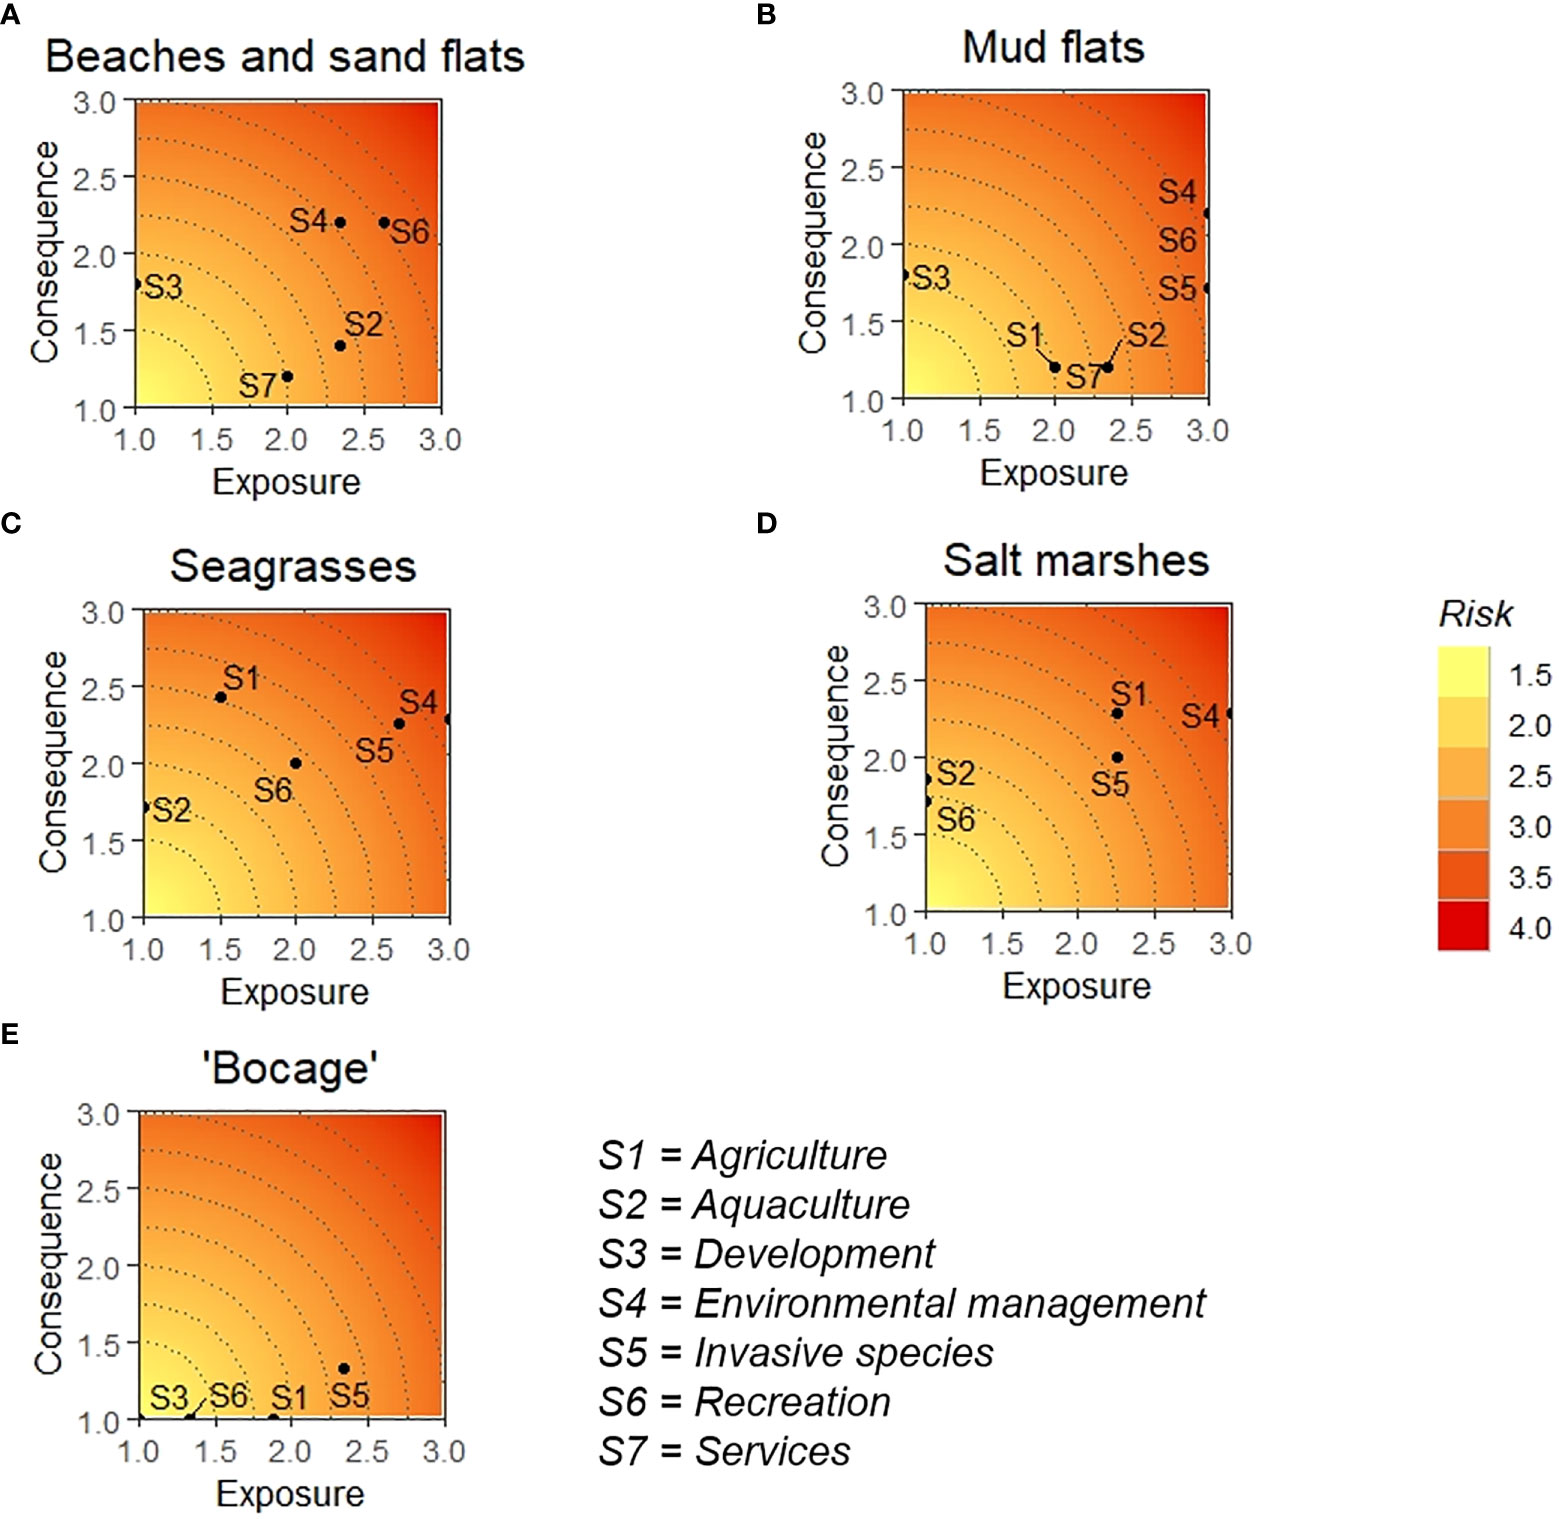
Figure 5 Risk plots showing maximum consequence and exposure scores by habitats (A beaches and sand flats, B mud flats, C seagrasses, D salt marshes, E 'Bocage') with coordinates representing pressures (S1: agriculture, S2: aquaculture, S3: development, S4: environmental management, S5: invasive species, S6: recreation, S7: services).
3.2 Vulnerability of ES supply
Provisioning, regulation and maintenance, and cultural services are depicted as maps in Figure 6. Results showed the highest potential for the regulation and maintenance category, while the supply of provisioning services was lower throughout the Ria. ‘Bocage’ was cited by stakeholders to supply fewer provisioning services but was highly valued for regulation and maintenance services. This high potential was also attributed to salt marsh and seagrass habitats. Beaches were also highly valued, especially for cultural services. Mudflats were the least valued habitat in terms of the full suite of potential ES in Ria de Aveiro.
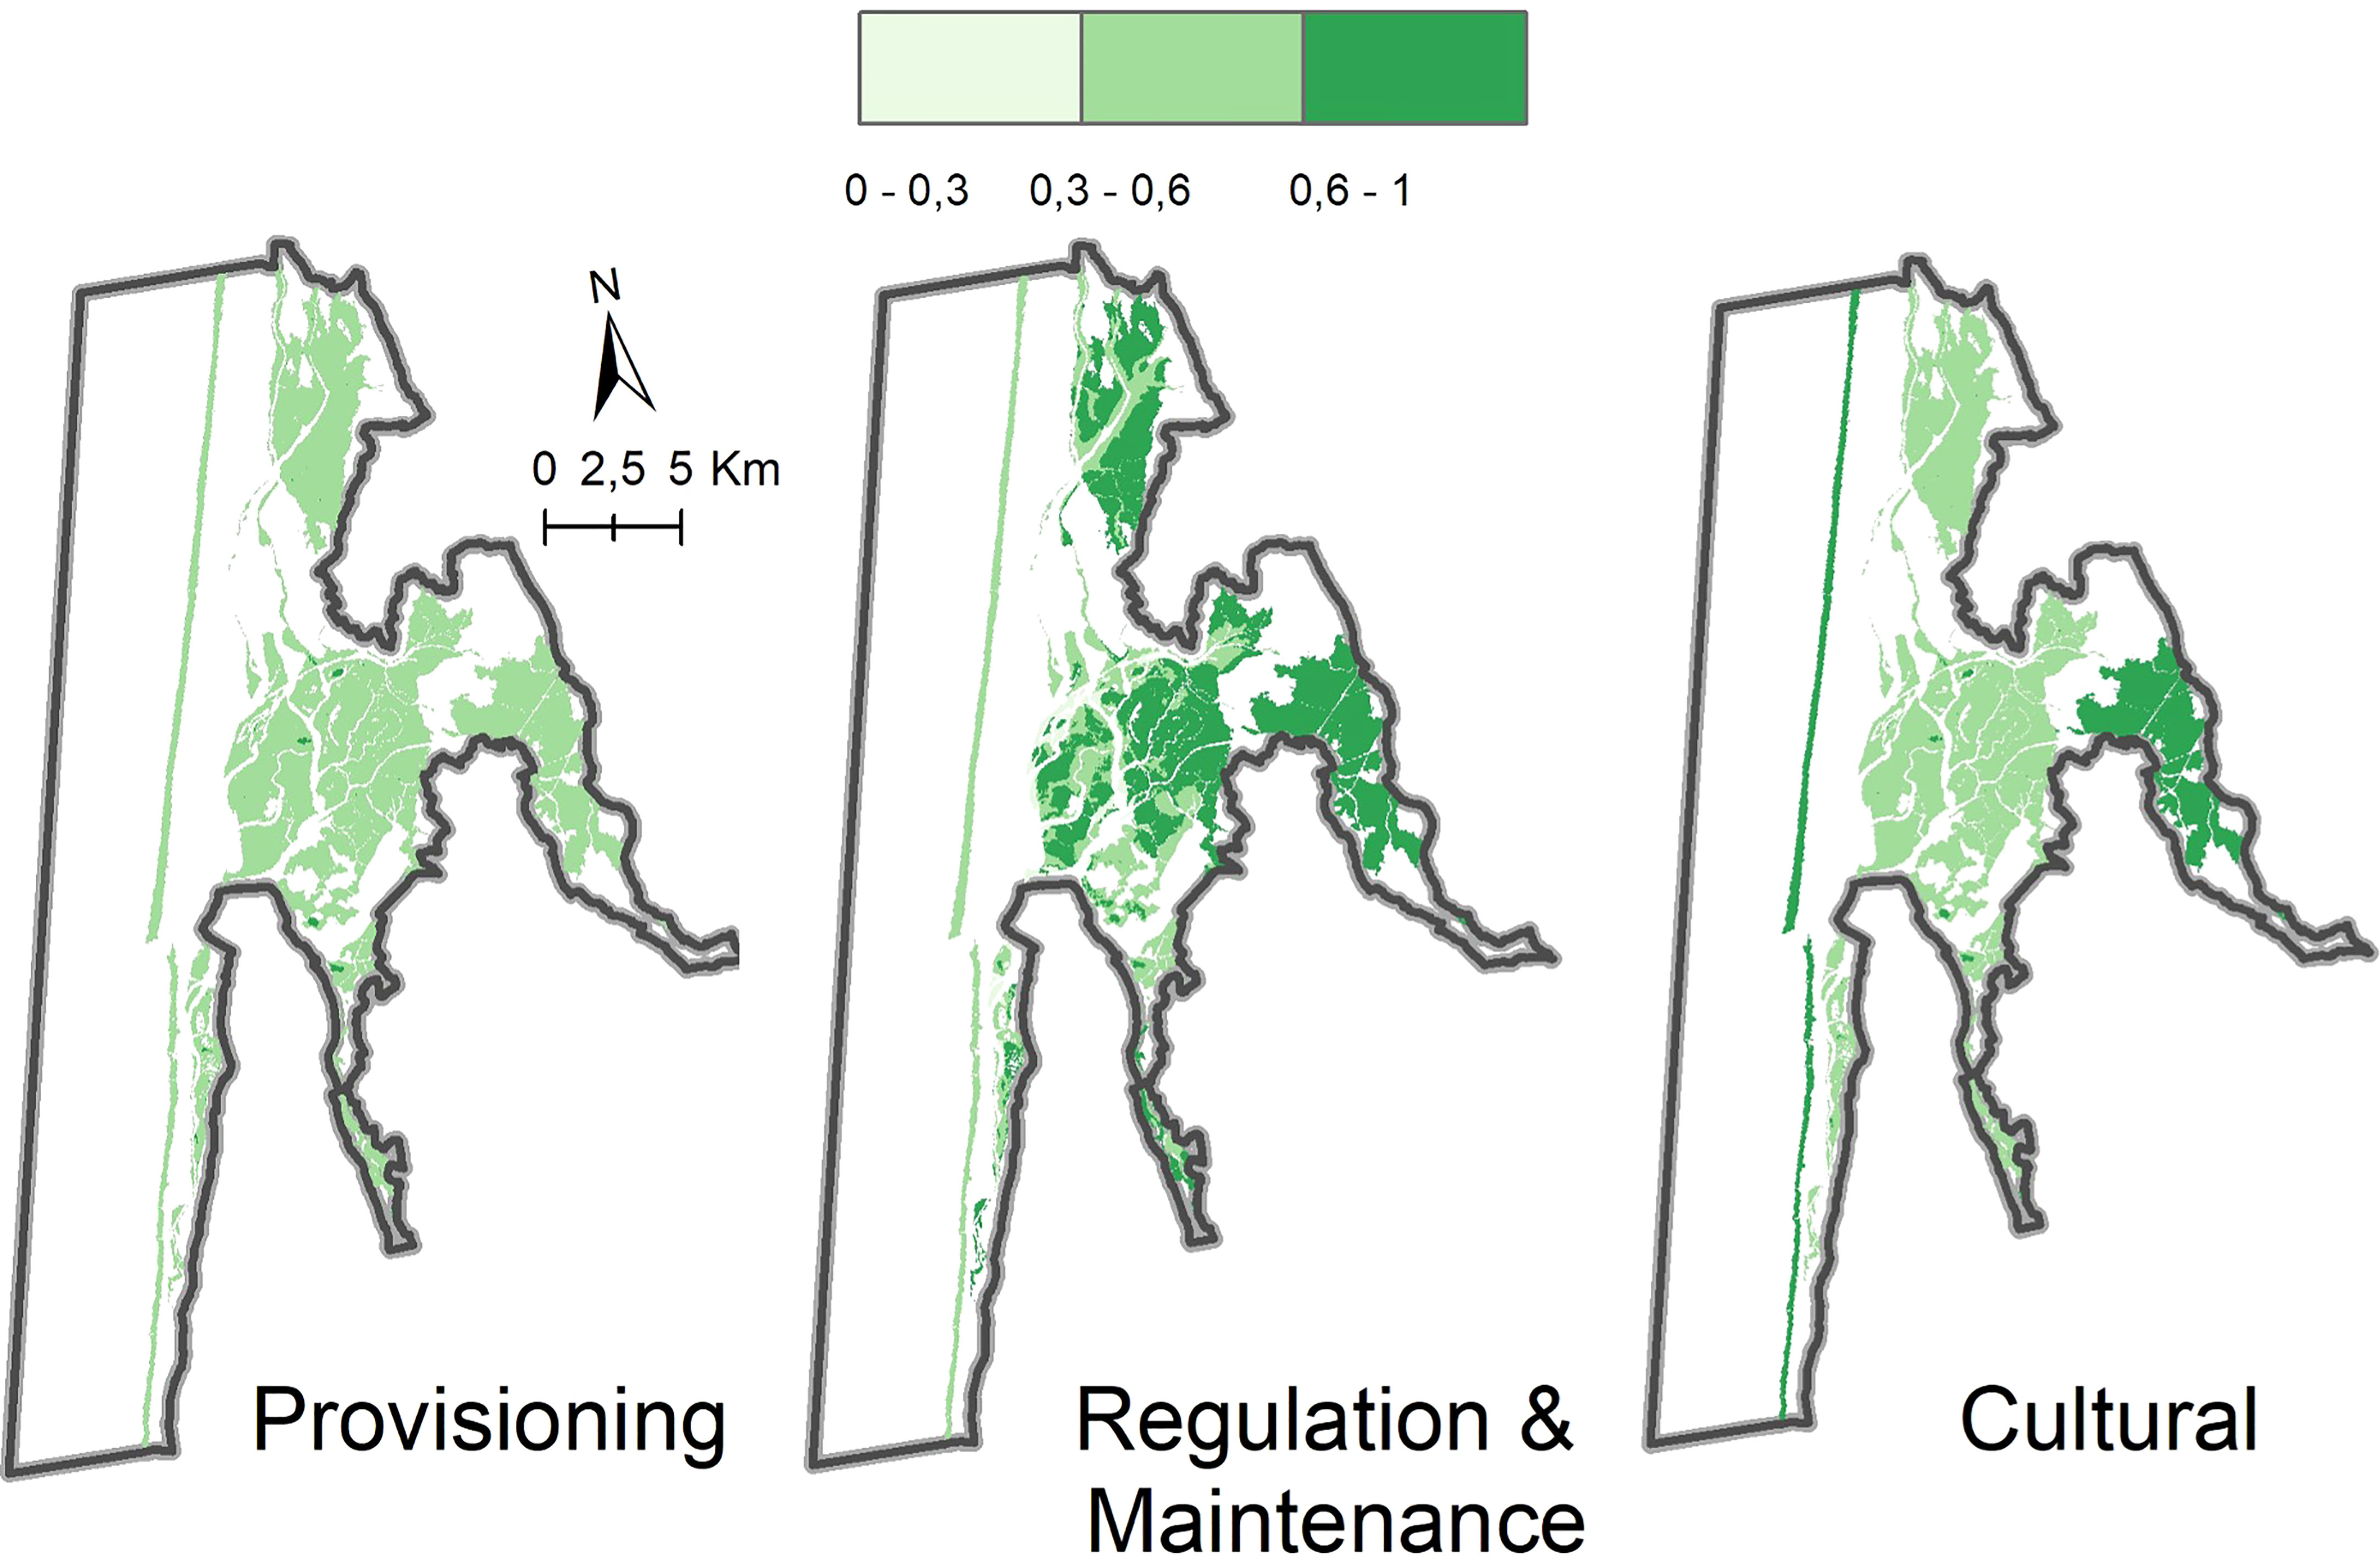
Figure 6 Ecosystem-service supply maps for the Ria de Aveiro. Values are the cumulative sum of the availability scores obtained from expert valuation on the identified habitats’ ecosystem services availability in three categories: provisioning, regulation and maintenance, and cultural. Scores were normalized from 0 to 1. See Supplementary Table 2 for further detail.
The vulnerability maps for the provisioning, regulation and maintenance, and cultural ES indicated where the stocks of these potential services are at greatest risk now and into the future. ES vulnerability hotspots across the three ES divisions were identified in the northern sections of the landscape (units 2, 5, and 6, corresponding to the São Jacinto-Espinheiro WB2, Ílhavo WB3, and Mira WB1 subareas; Figure 7). The supply of cultural ES was found to be most vulnerable in beach areas located south of the lagoon inlet. This was driven by risk from recreational activities (e.g., tourism boats, water sports) that, paradoxically, both threaten and support the diverse cultural values that beaches offer. These beach-going activities relate to physical and mental health benefits and aesthetic enjoyment. The ‘Bocage’ showed intermediate vulnerability for cultural services despite being a highly valued habitat in terms of ES availability. Its vulnerability was higher for regulating and cultural services than for provisioning. Mudflats were also found to be at the intermediate vulnerability level for the provisioning services, which are important for the regional food supply through harvesting activities such as bait digging and shellfish collecting. Regulation and maintenance services showed higher vulnerability scores in seagrass habitats than salt marshes, despite high potential in the latter for this service category.
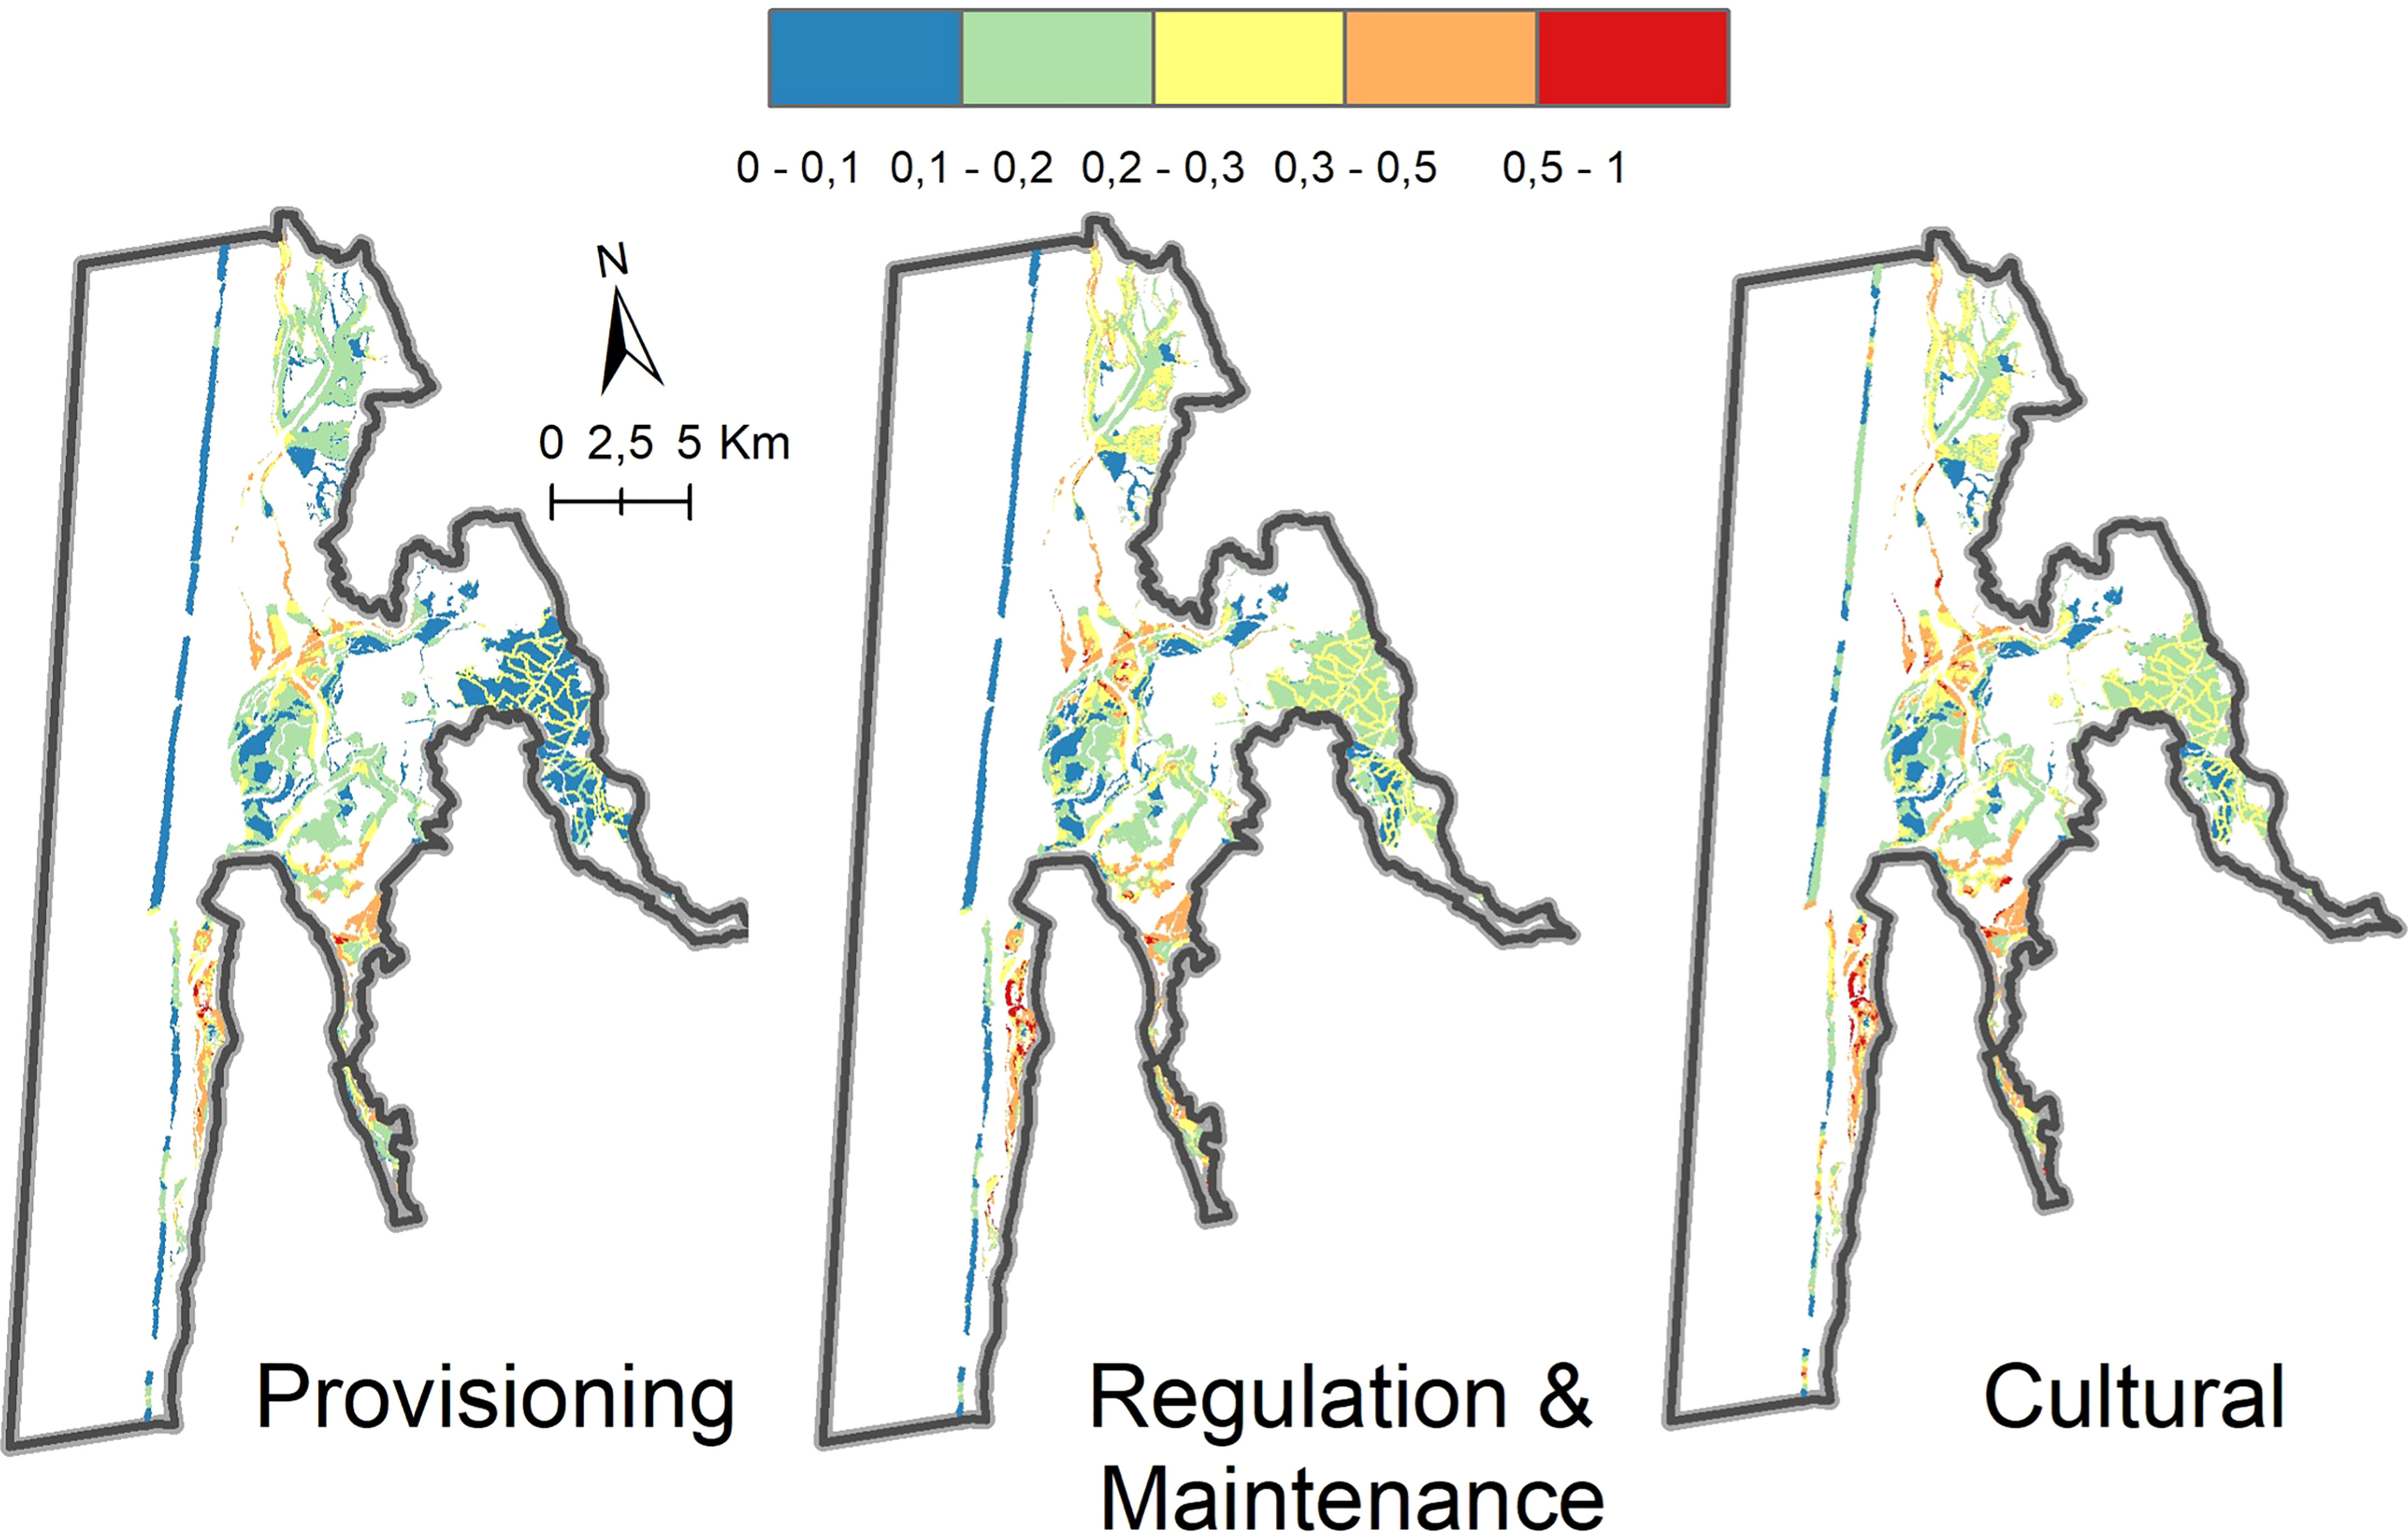
Figure 7 Ecosystem-service vulnerability in the Ria de Aveiro. Maps show the vulnerability scores obtained by multiplying cumulative risk by ecosystem services availability (normalized from 0 to 1). Each panel shows one of three ES categories.
4 Discussion
This research aimed to produce baseline information for EBM by evaluating a future development scenario in 2030. The approach combines a classical risk assessment framework with expert judgement about the relative availability of ES in a Natura 2000 monitoring site. To this end, habitats, human activities, pressures, and ES information provided by the stakeholders, government reports and existing research were combined to evaluate cumulative impacts spatiotemporally. This multi-step approach represents a novel application of the InVEST tool, as previous assessments were mainly framed around a single management cycle or policy objective.
4.1 Extensions of the InVEST HRA
Previous applications of the InVEST HRA leveraged diverse data sources and even used the tool in combination with other methodologies, e.g., ES and coastal zone management in Belize coast (Arkema et al., 2014); marine spatial planning in the Northeast and Mid-Atlantic Ocean regions in the United States (Wyatt et al., 2017); statistical analysis of ecology and conservation policies interactions in South Korea coastal area (Chung et al., 2015); InVEST HRA and coastal vulnerability models in Brazil (Elliff and Kikuchi, 2017); Marxan habitat prioritization software in California coastal area (Studwell et al., 2021); spatially explicit criteria based on marine biodiversity habitat suitability maps (Verutes et al., 2020) or habitat connectivity metrics in Iran inland (Ghehi et al., 2020). All these approaches confirm the diversity of options when applying the InVEST HRA tool. In this study, the InVEST HRA tool was applied to assess the risk that habitats involving coastal and terrestrial are due to the pressures produced by human activities, and to identify opportunities for EBM that can be applied to improve adaptative management. Yet, there are known limitations regarding the direct comparison of results because the risk outputs are relative ranks and use a unitless scoring system. This confirms the to’l’s baseline characterization, monitoring, and evaluation utility.
In Europe, Willaert et al. (2019) considered the EBM perspective and, like Cabral et al. (2015), by assessing the vulnerability of marine benthic habitats (EUNIS) and their potential ES to physical, chemical, and biological pressures identified by the Marine Strategy Framework Directive. Both studies translated these data into indices that characterize the vulnerability of these habitats when supplying ES in France and Portugal, respectively. Further, Caro et al. (2020) analysed the InVEST HRA and ES abundance data as a resilience descriptor in a Portuguese estuary. Our approach extended these European studies by applying the model at the local scale (the Ria de Aveiro Natura 2000 coastal zone comprises 330 km2) and producing high-resolution data (outputs at 50 m2 grid cell size) to inform EBM management cycles with a spatiotemporally explicit decision-support tool.
4.2 Setting the stage for EBM
Building on the initial ES vulnerability assessment in Ria de Aveiro, the methodology is meant to be replicated as new information becomes available. To showcase an approach to EBM in the region that can be guided by an open-source, spatially explicit risk assessment tool, we followed a stepwise approach to address the following questions: (1) Which human activities pose the greatest risk to habitats in the near term (2030)? (2) How might these pressures compromise the future delivery of ES in a Natura 2000 site? (3) What management options might minimise risks? Below we summarise the most salient findings during the three steps of our analytical approach.
Step 1. The human activities that pose significant pressures to the habitats of Ria de Aveiro by 2030 are primarily driven by environmental management objectives. These measures are in place to support economically essential activities such as the dredging of navigation channels and flood control infrastructure extension, as detailed in Lillebø et al. (2019) and Martínez-López et al. (2019). Despite these activities, they all comply with existing environmental policies and regulations, including monitoring program requirements for flora, fauna, and water quality. Agriculture activities also act as pressure due to nutrient runoff to the lagoon contributing to the nitrogen load, which is usually the limiting nutrient in brackish/marine aquatic environments This pressure is most notably in the upper reaches of the lagoon system. This finding aligns with Lopes et al. (2017), where low freshwater input into the lagoon and certain oceanic conditions can lead to exposure from non-point nitrogen sources with current land use and water management. On a unit-area basis, seagrass habitats were estimated to have some of the highest risk levels in the study area (Figure 4C). Caro et al. (2020) also identified seagrasses as habitat at high risk in the Mondego estuary anticipated impacts on ES, located ca. 50 km south of Ria de Aveiro. Both results align with the downward trend in seagrasses distribution globally (Turschwell et al., 2021). The highest cumulative habitat risks were revealed for three landscape units: the coastal one, the São Jacinto-Espinheiro, and Mira (bar charts in Figure 4C). In addition to direct human pressures, beaches and sand flats of the coastal zone are exposed to storm-induced erosion and, consequently, are at risk of collapse r’due to overtopping induced by storm waves (Duck and da Silva, 2012). The São Jacinto-Espinheiro water body is primarily exposed to ecohydrological effects of dredging the inlet that increase the tidal prism in the entire system, aggravated by the backwaters (Picado et al., 2010; Azevedo et al., 2013). In these conditions, the flood bank will inhibit the saltmarshes’ adaptation to changes in the hydrological regime, because they cannot shift landward, endangering them due to increasing submergence times (Martínez-López et al., 2019). Mira Channel is described as a subsystem: narrow and shallow as an estuary, where bait-digging activities and oyster production occur (Cunha et al., 2005). Invasive-alien species of lugworm (Arenicola marina) was first recorded in Ria de Aveiro in 2009 (Pires et al., 2015) and have driven seagrass fragmentation, degradation, and loss. The lugworm distribution (in our study, two lugworm species are grouped by the genus Arenicola) at Ria de Aveiro has been increasing since then and, therefore, restoration actions have been implemented to decrease the pressure due to bioturbation activity of Arenicola spp and restore fragmented seagrass meadows (Costa et al., 2022).
Step 2. The second step estimates where and to what extent the future delivery of ES in a Natura 2000 site may be compromised. The coastal-marine habitats that deliver ES in Ria de Aveiro should be in a good environmental status to continue supporting the flows of life- and livelihood-giving services. The EU recognizes the natural capital stocks of this region through a designation of Sites of Community Importance, which highlight the need to maintain and enhance ES in the area. According to our results, regulation and maintenance services were the most vulnerable service values, while provisioning services were the least vulnerable. This approach is based on quantifying ES to represent vulnerability, and recently, Peng et al. (2023) proposed an indicator-based framework to face the imbalance in the representation of social and ecological systems. Spatial planning tools, such as the HRA tool employed in Ria de Aveiro, can guide habitat protection and restoration efforts to areas that will safeguard the most vulnerable services. The cumulative risk maps show spatially the area of the habitats with the highest risk, which are informative to guide where protection is urgent. This form of EBM aligns with EU and UN policy targets that aim to prevent, halt, and reverse the degradation of ecosystems worldwide.
Step 3. The third step identifies management options that are likely to reduce risk. Initially, we searched for overlap between areas of high ES availability and the greatest threat to habitats that supply these services (vulnerability assessment, step 2). Then, we confirmed which activities drive risk to those habitats and locations (HRA, step 1). Based on our findings, efforts could be prioritized to mitigate the unintended impacts of ongoing environmental management. Unfortunately, many of these impacts result from indirect effects, meaning they are not localized to the activity footprint. For example, the flood bank extension by 2030 is expected to increase coastal squeeze. This flood control measure does not violate Portuguese or EU environmental regulations despite the unintended consequences.
Alternatively, other environmental management activities, such as the direct effects of dredging, present substantial risk to proximate seagrass beds (near maximum exposure score in some areas; Figure 5C, Table 4). Management of dredging has improved significantly through improved ability to predict the spatial extent, however, the susceptibility to environmental changes caused by dredging to seagrasses is not well understood (Erftemeijer and Lewis, 2006). Given the seagrass biotype’s importance to ES (regulating and cultural values; Supplementary Table 2), management interventions should aim to reduce seagrass risks from dredging and other human pressures. Ultimately, the unintended impacts from environmental management can be further monitored and analysed to confirm their status and update the findings of this vulnerability assessment over the near term.
4.3 Limitations and assumptions
All models have advantages and disadvantages. When applying the InVEST HRA tool, the following limitations should be considered. Caro et al. (2020) highlighted that the HRA misses detecting the potential increase in vulnerability that comes from impacts to ES that are highly demanded by beneficiaries and decreases in susceptibility of those habitats that safeguard more abundant supplies of natural capital. This is likely due to how the HRA assumes a priori additive effects of human pressures (Arkema et al., 2014). Therefore, a future option to consider synergistic or antagonistic interactions based on multiple pressures could improve ecosystem risk assessment (Studwell et al., 2021). Samhouri and Levin (2012) applied a classic risk-assessment framework to regional populations of indicator marine species. They found it helpful to validate the risk scores with alternative sources, such as extinction thresholds or measures of irreversible harm. Another potential HRA model limitation relates to data availability, quality, and uncertainty. Wyatt et al. (2017) raised concerns that the HRA outputs are conditioned on the choice of habitats, pressures, and the area of interest and that the approach is built upon a subjective system (i.e., derived from expert elicitation) for scoring the exposure and consequence criteria.
Our study overcame many of these limitations by leveraging the best available information and detailing all sources of information (see Supplementary Table 1). Similar to the challenges experience by Cabral et al. (2015), it was difficult to harmonize certain pressure data sets (e.g., sightings of invasive species) due to disparate information sources collected at different spatial and temporal scales. Chung et al. (2015) recommends the use of in-situ field data to improve the accuracy and reliability of spatial assessments and establish accurate statistical models. When time and resource constraints make this impossible, the HRA tool enables scoring of data quality (di) based on the source of information and the confidence in the data accuracy. Knowledge gaps can also be addressed through variable weights (wi) that impact the importance placed on a criterion through a weighted average. Our approach in Portugal leveraged diverse research methods to assemble spatially explicit information at the local scale and an interdisciplinary team with intimate socio-ecological knowledge of the region to characterize and account for data uncertainty.
While we did not analyse alternative management options in this study, habitat risk and ES vulnerability outputs provide a future roadmap for monitoring and evaluation as additional data are collected about the future 2030 scenario and beyond. With a solid foundation of expert knowledge and InVEST HRA inputs, this approach in Ria de Aveiro can be revisited over time to respond to changes in habitat-pressure interactions that reflect new knowledge and insights (Wyatt et al., 2017), as is typical with EBM management cycles. This framework offers a transparent and generalizable approach that can be applied in most places where human activities threaten biodiversity and ES.
5 Conclusions
We applied a spatially explicit risk assessment for coastal habitats due to pressures produced by human activities. It was combined with expert judgement on the importance of the habitats delivering ES to establish baseline knowledge for future risk management to vulnerable ES. The highest levels of risk were found in seagrasses, salt marshes and mudflat habitats due to the unintended consequences of existing and proposed environmental management measures (flood control and dredging) that pose high risk to the diverse ES they provide. Regulation and maintenance services were the most vulnerable services, while provisioning services were the least vulnerable. Over time, and as new information becomes available, this research sets the stage for additional assessments that identify changes in the risk estimates based on alternative scenarios for managing human activities and their direct effects on critical coastal-marine biotypes. The co-development of spatial explicit scenarios to characterize human pressures as drivers of change enables more accurate estimates of ES vulnerability that can be iteratively refined with robust data and socio-ecological knowledge. To this end, our demonstration in a Natura 2000 monitoring site is meant to guide future evaluation and transparency in support of EBM and its management cycles in Ria de Aveiro.
Data availability statement
The original contributions presented in the study are included in the article/Supplementary Material. Further inquiries can be directed to the corresponding author.
Author contributions
AG-O: Methodology, Software, Writing-Original draft preparation, Investigation, Visualization. GV: Methodology, Software, Writing-Original draft preparation, Formal analysis, Visualization. HT: Investigation, Writing- Reviewing and Editing, Resources. AS: Investigation, Writing- Reviewing and Editing, Resources. AL: Conceptualization, Methodology, Writing- Reviewing and Editing, Resources, Supervision, Funding acquisition. All authors contributed to the article and approved the submitted version.
Funding
AG-O was funded by the PORBIOTA project (POCI-01-0145-FEDER-022127) financed by the “Programa Operacional de Competitividade e Internacionalização’’ and “Programa Operacional Regional de Lisboa, FEDER”, and by the “Fundação para a Ciência e a Tecnologia, I.P. (FCT)” through national funds (PIDAC); A.I. Sousa was funded by national funds through the FCT-Foundation for Science and Technology,I.P., under the project CEECIND/00962/2017; and GV was partially funded by the SmartBioR project (Centro-01-0145-FEDER-000018) funded through national funds. Thanks are due to the BioPradaRia project (MAR-01.04.02-FEAMP-0020) funded by “Programa Operacional MAR2020”, EMFF – European Maritime and Fisheries Fund, European Union and Portugal 2020; and to the BESIDE project (Horizon 2020 Coordination and support actions (CSA); Grant agreement ID: 951389) funded by the European Commission. We acknowledge also financial support to CESAM by FCT/MCTES (UIDP/50017/2020+UIDB/50017/2020+ LA/P/0094/2020), through national funds.
Conflict of interest
The authors declare that the research was conducted in the absence of any commercial or financial relationships that could be construed as a potential conflict of interest.
Publisher’s note
All claims expressed in this article are solely those of the authors and do not necessarily represent those of their affiliated organizations, or those of the publisher, the editors and the reviewers. Any product that may be evaluated in this article, or claim that may be made by its manufacturer, is not guaranteed or endorsed by the publisher.
Supplementary material
The Supplementary Material for this article can be found online at: https://www.frontiersin.org/articles/10.3389/fmars.2023.1086135/full#supplementary-material
References
Arkema K. K., Verutes G. M., Bernhardt J. R., Clarke C., Rosado S., Canto M., et al. (2014). Assessing habitat risk from human activities to inform coastal and marine spatial planning: a demonstration in Belize. Environ. Res. Lett. 9 (11), 114016. doi: 10.1088/1748-9326/9/11/114016
Azevedo A., Sousa A. I., Lencart e Silva J. D., Dias J. M., Lillebø A. I. (2013). Application of the generic DPSIR framework to seagrass communities of ria de aveiro: a better understanding of this coastal lagoon. J. Coast. Res. 65 (10065), 19–24. doi: 10.2112/SI65-004.1
Ban N. C., Alidina H. M., Ardron J. A. (2010). Cumulative impact mapping: advances, relevance and limitations to marine management and conservation, using canada’s pacific waters as a case study. Mar. Policy 34, 876–886. doi: 10.1016/j.marpol.2010.01.010
Borgwardt F., Robinson L., Trauner D., Teixeira H., Nogueira A. J. A., Lillebø A. I., et al. (2019). Exploring variability in environmental impact risk from human activities across aquatic ecosystems. Sci. Total Environ. 652, 1396–1408. doi: 10.1016/j.scitotenv.2018.10.339
Cabral P., Levrel H., Schoenn J., Thiebaut E., Le Mao P., Mongruel R., et al. (2015). Marine habitats ecosystem service potential: a vulnerability approach in the normand-Breton (Saint malo) gulf, France. Ecosystem Serv. 16, 306–318. doi: 10.1016/j.ecoser.2014.09.007
Caro C., Marques J. C., Cunha P. P., Teixeira Z. (2020). Ecosystem services as a resilience descriptor in habitat risk assessment using the InVEST model. Ecol. Indic. 115, 106426. doi: 10.1016/j.ecolind.2020.106426
Cazenave A., Cozannet G. L. (2014). Sea Level rise and its coastal impacts. Earth’s Future 2 (2), 15–34. doi: 10.1002/2013EF000188
Chung M. G., Kang H., Choi S. U. (2015). Assessment of coastal ecosystem services for conservation strategies in south Korea. PloS One 10 (7). doi: 10.1371/journal.pone.0133856
Costa V., Flindt M. R., Lopes M., Coelho J. P., Costa A. F., Lillebø A. I., et al. (2022). Enhancing the resilience of Zostera noltei seagrass meadows against Arenicola spp. bio-invasion: a decision-making approach. J. Environ. Manage. 302, 113969. doi: 10.1016/j.jenvman.2021.113969
Cunha T., Hall A., Queiroga H. (2005). Estimation of the Diopatra neapolitana annual harvest resulting from digging activity in canal de Mira, ria de aveiro. Fish. Res. 76, 55–66. doi: 10.1016/j.fishres.2005.05.008
Delacámara G., O’Higgins T. G., Lago M., Langhans S. (2020). “Ecosystem-based management: moving from concept to practice,” in Ecosystem-based management, ecosystem services and aquatic biodiversity. Eds. O’Higgins T., Lago M., DeWitt T. (Berlin, Germany: Springer, Cham).
Dias J. M., Lopes J. F., Dekeyser I. (2000). Tidal propagation in ria de aveiro lagoon, Portugal. Phys. Chem. Earth (B) 25, 369–374. doi: 10.1016/S1464-1909(00)00028-9h
Duck R. W., da Silva J. F. (2012). Coastal lagoons and their evolution: a hydromorphological perspective. Estuarine Coast. Shelf Sci. 110, 2–14. doi: 10.1016/j.ecss.2012.03.007
EC (2006). Regulation (EC) n° 1893/2006 of the European parliament and of the council of 20 December 2006 establishing the statistical classification of economic activities NACE revision 2 and amending council regulation (EEC) no 3037/90 as well as certain EC regulations on specific statistical domains. Off. J. Eur. Union 49, L393/1. doi: 10.15468/ucf7eb
Elliff C. I., Kikuchi R. K. P. (2017). Ecosystem services provided by coral reefs in a southwestern Atlantic archipelago. Ocean Coast. Manage. 136 (Supplement C), 49–55. doi: 10.1016/j.ocecoaman.2016.11.021
Erftemeijer P. L., Lewis R. (2006). Environmental impacts of dredging on seagrasses: a review. Mar. pollut. Bull. 52 (12), 1553–1572. doi: 10.1016/j.marpolbul.2006.09.006
Ghehi N. K., MalekMohammadi B., Jafari H. (2020). Integrating habitat risk assessment and connectivity analysis in ranking habitat patches for conservation in protected areas. J. Nat. Conserv. 56, 125867. doi: 10.1016/j.jnc.2020.125867
Gómez S., Maynou F. (2021). Balancing ecology, economy and culture in fisheries policy: participatory research in the Western Mediterranean demersal fisheries management plan. J. Environ. Manage. 291, 112728. doi: 10.1016/j.jenvman.2021.112728
Haines-Young R., Potschin M. B. (2017) Common international classification of ecosystem services (CICES) V5.1 and guidance on the application of the revised structure. ([online] URL). Available at: www.cices.eu.
Halpern B. S., McLeod K. L., Rosenberg A. A., Crowder L. B. (2008). Managing for cumulative impacts in ecosystem-based management through ocean zoning. Ocean Coast. Manage. 51 (3), 203–211. doi: 10.1016/j.ocecoaman.2007.08.002
Hobday A. J., Smith A. D. M., Stobutzki I. C., Bulman C., Daley R., Dambacher J. M., et al. (2011). Ecological risk assessment for the effects of fishing. Fish. Res. 108, 372–384. doi: 10.1016/j.fishres.2011.01.013
Lago M., Boteler B., Rouillard J., Abhold K., Jähnig S. C., Iglesias-Campos A., et al. (2019). Introducing the H2020 AQUACROSS project: knowledge, assessment, and management for AQUAtic biodiversity and ecosystem services aCROSS EU policies. Sci. Total Environ. 652, 320–329. doi: 10.1016/j.scitotenv.2018.10.076
Lillebø A. I., Stålnacke P., Gooch G. D. (2015). Coastal lagoons in Europe: integrated water resource strategies. Eds. Lillebø A. I., Stålnacke P., Gooch G. D. (United Kingdom: IWA publishing; International Water Association (IWA), 254.
Lillebø A. I., Teixeira H., Martínez-López J., Genua-Olmedo A., Marhubi A., Delacámara G., et al. (2020). “Mitigating negative unintended impacts on biodiversity in the natura 2000 vouga estuary (Ria de aveiro, Portugal),” in Ecosystem-based management, ecosystem services and aquatic biodiversity. Eds. O’Higgins T., Lago M., DeWitt T. (Cham: Springer).
Lillebø A. I., Teixeira H., Morgado M., Martínez-López J., Marhubi A., Delacámara G., et al. (2019). Ecosystem-based management planning across aquatic realms at the ria de aveiro natura 2000 territory. Sci. Total Environ. 650, 1898–1912. doi: 10.1016/j.scitotenv.2018.09.317
Long R. D., Charles A., Stephenson R. L. (2015). Key principles of marine ecosystem-based management. Mar. Policy 57, 53–60. doi: 10.1016/j.marpol.2015.01.013
Lopes M. L., Marques B., Dias J. M., Soares A. M. V. M., Lillebø A. I. (2017). Challenges for the WFD second management cycle after the implementation of a regional multi-municipality sanitation system in a coastal lagoon (Ria de aveiro, Portugal). Sci. Total Environ. 586, 215–225. doi: 10.1016/j.scitotenv.2017.01.205
Martínez-López J., Teixeira H., Morgado M., Almagro M., Sousa A. I., Villa F., et al. (2019). Participatory coastal management through elicitation of ecosystem service preferences and modelling driven by “coastal squeeze”. Sci. Total Environ. 652, 1113–1128. doi: 10.1016/j.scitotenv.2018.10.309
McCook L. J., Ayling T., Cappo M., Choat J. H., Evans R. D., De Freitas D. M., et al. (2010). Adaptive management of the great barrier reef: a globally significant demonstration of the benefits of networks of marine reserves. Proc. Natl. Acad. Sci. 107 (43), 18278–18285. doi: 10.1073/pnas.0909335107
Neumann B., Vafeidis A. T., Zimmermann J., Nicholls R. J. (2015). Future coastal population growth and exposure to sea-level rise and coastal flooding-a global assessment. PloS One 10 (3), e0118571. doi: 10.1371/journal.pone.0118571
O’Higgins T., Nogueira A. J. A., Lillebø A. I. (2019). A simple spatial typology for assessment of complex coastal ecosystem services across multiple scales. Sci. Total Environ. 649, 1452–1466. doi: 10.1016/j.scitotenv.2018.08.420
Patrick W. S., Spencer P., Link J., Cope J., Field J., Kobayashi D., et al. (2010). Using productivity and susceptibility indices to assess the vulnerability of united states fish stocks to overfishing. Fish. Bull. 108 (3), 305–322.
Peng Y., Welden N., Renaud F. G. (2023). A framework for integrating ecosystem services indicators into vulnerability and risk assessments of deltaic social-ecological systems. J. Environ. Manage. 326, 116682. doi: 10.1016/j.jenvman.2022.116682
Picado A., Dias J. M., Fortunato A. B. (2010). Tidal changes in estuarine systems induced by local geomorphologic modifications. Continental Shelf Res. 30 (17), 1854–1864. doi: 10.1016/j.csr.2010.08.012
Pires A., Martins R., Magalhães L., Soares A. M. V. M., Figueira E., Quintino V., et al. (2015). Expansion of lugworms towards southern European habitats and their identification using combined ecological, morphological and genetic approaches. Mar. Ecol. Prog. Ser. 533, 177–190. doi: 10.3354/meps11315
Röckmann C., van Leeuwen J., Goldsborough D., Kraan M., Piet G. (2015). The interaction triangle as a tool for understanding stakeholder interactions in marine ecosystem based management. Mar. Policy 52, 155–162. doi: 10.1016/j.marpol.2014.10.019
Samhouri J. F., Levin P. S. (2012). Linking land-and sea-based activities to risk in coastal ecosystems. Biol. Conserv. 145, 118–129. doi: 10.1016/j.biocon.2011.10.021
Selkoe K. A., Halpern B. S., Ebert C. M., Franklin E. C., Selig E. R., Casey K. S., et al. (2009). A map of human impacts to a ‘pristine’ coral reef ecosystem, the papahānaumokuākea marine national monument. Coral Reefs 28 (3), 635–650. doi: 10.1007/s00338-009-0490-z
Sharp R., Tallis H. T., Ricketts T., Guerry A. D., Wood S. A., Chaplin-Kramer R., et al. (2018). InVEST 3.7.0.post17+hbeb7e1912b14 user’s guide. the natural capital project, Stanford university, university of Minnesota, the nature conservancy and world wildlife fund.
Sherman K. (2014). Adaptive management institutions at the regional level: the case of large marine ecosystems. Ocean Coast. Manage. 90, 38–49. doi: 10.1016/j.ocecoaman.2013.06.008
Sousa A. I., da Silva J. F., Azevedo A., Lillebø A. I. (2019a). Blue carbon stock in zostera noltei meadows at ria de aveiro coastal lagoon (Portugal) over a decade. Sci. Rep. 9, 14387. doi: 10.1038/s41598-019-50425-4
Sousa A. I., Figueiredo da Silva J., Lillebø A. I. (2019b). Zostera noltei Seagrass meadows spatial distribution at LTER site ria de aveiro lagoon in 2014. version 1.2. universidade de aveiro, departamento de biologia e centro de estudos do ambiente e do mar (CESAM). occurrence data set accessed via GBIF.
Sousa A. I., Santos D. B., Silva E. F. D., Sousa L. P., Cleary D. F., Soares A. M., et al. (2017). ‘Blue carbon’ and nutrient stocks of salt marshes at a temperate coastal lagoon (Ria de aveiro, Portugal). Sci. Rep. 7 (1), 1–11. doi: 10.1038/srep41225
Studwell A., Hines E., Nur N., Jahncke J. (2021). Using habitat risk assessment to assess disturbance from maritime activities to inform seabird conservation in a coastal marine ecosystem. Ocean Coast. Manage. 199, 105431. doi: 10.1016/j.ocecoaman.2020.105431
Teixeira H., Lillebø A. I., Culhane F., Robinson L., Trauner D., Borgwardt F., et al. (2019). Linking biodiversity to ecosystem services supply: patterns across aquatic ecosystems. Sci. Total Environ. 657, 517–534. doi: 10.1016/J.SCITOTENV.2018.11.440
Turschwell M. P., Connolly R. M., Dunic J. C., Sievers M., Buelow C. A., Pearson R. M., et al. (2021). Anthropogenic pressures and life history predict trajectories of seagrass meadow extent at a global scale. Proc. Natl. Acad. Sci. 118 (45). doi: 10.1073/pnas.2110802118
UNEP (2011) Taking steps toward marine and coastal ecosystem-based management - an introductory guide. UNEP regional seas reports and studies no. 189. Available at: https://osf.io/preprints/marxiv/akh93/download.
Verutes G. M., Johnson A. F., Caillat M., Ponnampalam L. S., Peter C., Vu L., et al. (2020). Using GIS and stakeholder involvement to innovate marine mammal bycatch risk assessment in data-limited fisheries. PloS One 15 (8), e0237835. doi: 10.1371/journal.pone.0237835
Webb J. A., Watts R. J., Allan C., Warner A. T. (2017). Principles for monitoring, evaluation, and adaptive management of environmental water regimes. Water Environ. pp, 599–623). doi: 10.1016/B978-0-12-803907-6.00025-5
Willaert T., Garcia-Alegre A. G., Queiroga H., Cunha e Sá M. A., Lillebø A. I. (2019). Measuring vulnerability of marine and coastal habitats’ potential to deliver ecosystem services. Front. Mar. Sci. 6. doi: 10.3389/fmars.2019.00199
Wyatt K. H., Griffin R., Guerry A. D., Ruckelshaus M., Fogarty M., Arkema K. K. (2017). Habitat risk assessment for regional ocean planning in the US northeast and mid-Atlantic. PloS One 12 (12). doi: 10.1371/journal.pone.0188776
Keywords: natural capital, habitat risk assessment, InVEST, ecosystem-based management, coastal planning
Citation: Genua-Olmedo A, Verutes GM, Teixeira H, Sousa AI and Lillebø AI (2023) A spatial explicit vulnerability assessment for a coastal socio-ecological Natura 2000 site. Front. Mar. Sci. 10:1086135. doi: 10.3389/fmars.2023.1086135
Received: 01 November 2022; Accepted: 06 April 2023;
Published: 27 April 2023.
Edited by:
Serena Moseman-Valtierra, University of Rhode Island, United StatesReviewed by:
Stuart James Kininmonth, The University of Queensland, AustraliaPeter M. J. Herman, Delft University of Technology, Netherlands
Copyright © 2023 Genua-Olmedo, Verutes, Teixeira, Sousa and Lillebø. This is an open-access article distributed under the terms of the Creative Commons Attribution License (CC BY). The use, distribution or reproduction in other forums is permitted, provided the original author(s) and the copyright owner(s) are credited and that the original publication in this journal is cited, in accordance with accepted academic practice. No use, distribution or reproduction is permitted which does not comply with these terms.
*Correspondence: Ana I. Lillebø, bGlsbGVib0B1YS5wdA==
†These authors have contributed equally to this work and share first authorship