 Brandon L. Southall
 Dominic Tollit
 Jennifer Amaral
 Christopher W. Clark4,5
 William T. Ellison
- 1Southall Environmental Associates, Inc., Aptos, CA, United States
- 2Institute of Marine Science, University of California, Santa Cruz, Santa Cruz, CA, United States
- 3Sea Mammal Research Unit Consulting, Vancouver, BC, Canada
- 4Marine Acoustics, Inc., Middletown, RI, United States
- 5K. Lisa Yang Center for Conservation Bioacoustics, Cornell Lab of Ornithology, Cornell University, Ithaca, NY, United States
Presented here is a broadly applicable, transparent, repeatable analytical framework for assessing relative risk of anthropogenic disturbances on marine vertebrates, with the emphasis on the sound generating aspects of the activity. The objectives are to provide managers and action-proponents tools with which to objectively evaluate drivers of potential biological risk, to identify data gaps that limit assessment, and to identify actionable measures to reduce risk. Current regulatory assessments of how human activities (particularly those that produce sound) influence the likelihood of marine mammal behavioral responses and potential injury, rely principally on generalized characterizations of exposure and effect using simple, threshold-based criteria. While this is relatively straightforward in regulatory applications, this approach fails to adequately address realistic site and seasonal scenarios, other potential stressors, and scalable outcome probabilities. The risk assessment presented here is primarily based on a common and broad understanding of the spatial-temporal-spectral intersections of animals and anthropogenic activities, and specific examples of its application to hypothetical offshore wind farms are given. The resulting species- and activity-specific framework parses risk into two discrete factors: a population’s innate ‘vulnerability’ (potential degree of susceptibility to disturbance) and an ‘exposure index’ (magnitude-duration severity resulting from exposure to an activity). The classic intersection of these factors and their multi-dimensional components provides a relativistic risk assessment process for realistic evaluation of specified activity contexts, sites, and schedules, convolved with species-specific seasonal presence, behavioral-ecological context, and natural history. This process is inherently scalable, allowing a relativistic means of assessing potential disturbance scenarios, tunable to animal distribution, region, context, and degrees of spatial-temporal-spectral resolution.
1 Introduction
The science of marine mammals and noise has substantially progressed in recent decades with the rapid expansion of research and monitoring in this field (see: Southall, 2017). This has resulted in clear and increasing documentation of both the context-dependency of an animal’s response (e.g., behavioral state, proximity, ecological context) in mediating exposure-response probability (Ellison et al., 2012; Pirotta et al., 2015; Ellison et al., 2018; Pirotta et al., 2022a; Southall et al., 2016; Erbe et al., 2018; Southall et al., 2019b; Erbe et al., 2022), and differences between taxa in auditory effects (Southall et al., 2019a) and behavioral responses (Southall et al., 2021a). Despite such progress, there have been limited developments in U.S. regulatory policy guidelines to track some of this complexity, and to move beyond the most simplistic threshold approaches in terms of auditory effects (NMFS, 2016). Approaches to ocean policies regarding management of human noise impacts on marine mammals have ranged from historically simplistic received level (RL) ‘threshold’ markers of behavioral or auditory impacts from both impulsive or continuous (non-impulsive) noise stressors (see Southall et al., 2007; Southall et al., 2019a; Southall, 2021; Southall et al., 2021a) to complex, statistically intensive population-level modeling approaches for discrete kinds of disturbance events (see: King et al., 2015; Pirotta et al., 2018; Booth et al., 2020; Pirotta et al., 2021) or multiple exposures (NAS, 2017). There is a need for a coherent assessment framework that addresses the inherent complexity of behavioral response to noise and provides managers and action-proponents tools with which to objectively evaluate and dissect the principal activities that drive potential biological risk, to identify data gaps limiting assessment, and to identify actionable measures to reduce risk. The objective of this paper is to present a broadly applicable, transparent, repeatable analytical tool for assessing relative risk of anthropogenic disturbances on marine species with the emphasis on the noise aspects of the activity.
Marine mammals include highly visible and iconic species of disproportionately greater attention in management, conservation, and litigation relative to most other marine taxa (e.g., Williams et al., 2014; Williams et al., 2015a; Erbe et al., 2018; Weilgart, 2019; Williams et al., 2020; Chou et al., 2021). Such attention often includes regulatory decisions and outcomes with major economic and/or national security implications (e.g., Gordon et al., 2003; Abate, 2010; Nowacek et al., 2015; Thomson and Binder, 2021). These factors illustrate the need for an effective, science-based, defensible means of managing impacts of human activities.
Adverse human impacts include a suite of possible outcomes. These include injury or mortality from direct harvesting, entanglement, vessel strike, or physiological disturbance (e.g., Knowlton et al., 2012; Rockwood et al., 2017; Carretta et al., 2020). They may also include habitat degradation, pollution, and myriad behavioral disturbances of variable severity. Substantial scientific and regulatory attention has focused on how intentional or incidental noise can negatively impact marine mammals (NRC, 2005; Williams et al., 2015a; Williams et al., 2015b; Southall, 2017; Southall et al., 2007; Southall et al., 2019a; Southall et al., 2021a; Erbe et al., 2022). The topic has drawn extensive national, regional, and international attention, resulting in legal and regulatory conflicts that have or are impacting every major ocean industry (e.g., Chou et al., 2021).
Early regulatory approaches in some jurisdictions used simplistic all-or-nothing thresholds for individual animals based on the predicted RL from a specified anthropogenic disturbance (Malme et al., 1984, HESS 1999). Such approaches, subsequently woven into U.S. regulatory decision-making, effectively treated noise like a single metric “speed limit” for predicting harm. This approach did not distinguish between taxa, species, individuals or biological context (e.g., foraging, migrating, mating) nor did it consider how animals perceive, respond to, or are disturbed or injured by sound exposure. Predicted impacts were then often integrated over the course of an activity to predict aggregate impacts, which were then evaluated with a binary assessment of potential ‘jeopardy’ to the population or species. Approaches generally considered that disturbance or injury would result from short-term (acute) exposures without consideration of long-term (chronic) impacts, including communication masking or habitat avoidance from a sustained activity.
Large-scale investments to measure impacts have yielded rapid advances in understanding how noise might disturb and/or harm marine mammals, while informing criteria to predict behavioral (Southall et al., 2021a), auditory (Southall et al., 2019a), and cumulative impacts (NAS, 2017). Broad-scale noise metrics targeted to maintain acceptable levels of environmental status have also been developed (EC, 2008), providing a unique perspective for managing human noise based on aggregate ambient noise levels from many sources. Energetic and demographic population-level models linking disturbance with metrics of species and ecological fitness have also opened new frontiers (NAS, 2017; Pirotta et al., 2018; Pirotta et al., 2021; Pirotta et al., 2022b; New et al., 2020). The energetic models predicting population trends, which assume the impacts of disturbance carry through to changes in fitness, survival, and ultimately population parameters, have yet to be systematically adopted into marine regulatory policy. This is, at least in part, because of what may be perceived as their general lack of transparency and ease of replicability given the inherent statistical complexities, as well as typically substantial limitations in empirical parameterization of key assumptions for most species and contexts of interest (but see recent substantial developments for key, data-rich species in Pirotta et al., 2018; Pirotta et al., 2021).
The relativistic, ecological risk assessment framework presented here was developed as a biologically based approach to provide regulatory decision-makers and industry planners an objective, transparent means of evaluating relative risk across species for specified scenarios of industrial activity. The framework evolved from a simpler and more subjective alternative approach to RL, threshold-based predictions of impacts, motivated by a proposed seismic survey off California (Wood et al., 2012). It was extended to considerations of multiple overlapping seismic surveys occurring dynamically in variable times and places in the Gulf of Mexico (Ellison et al., 2015; Southall et al., 2018; Southall et al., 2019b; Southall et al., 2021b) and then subsequently adapted and applied to the installation and operation of several stationary wind energy facilities off Massachusetts (Southall et al., 2021c).
The outcomes of the framework are intended to inform and target focused monitoring, mitigation, and impact assessment, potentially including subsequent population consequence modeling for strategic species and scenarios. The risk framework utilizes semi-quantitative approaches to evaluate both the inherent species-specific vulnerability based on population, natural history, and existing environmental stressors as well as the severity (magnitude) of potential impact. The exposure magnitude and duration of a noise-producing activity is related to population models of disturbance through a statistical framework and applied as a metric of exposure severity for acute exposures. A statistical framework relating exposure magnitude and duration to population models of disturbance was applied as a metric of exposure severity for acute exposures. For multiple (aggregate) human disturbances on broader spatial and temporal scales, a quantitative spatial-temporal-spectral ‘index’ for exposure severity was developed in which a higher risk index values indicate greater overlap in space, time, and the frequency of disturbing noise and hearing for each protected species.
Similar approaches integrating semi-quantitative risk assessment frameworks with expert elicitation have been increasingly applied in evaluating other potential impacts for a variety of contexts. For instance, expert elicitation has been applied in evaluating the relative safety of food in human and agricultural settings (European Food Safety Authority, 2014). Further, there has been a series of increasingly sophisticated structured risk assessments used in policy and management context that incorporating expert elicitation in evaluating vulnerability and impacts for a variety of marine fisheries contexts (e.g., Sethi, 2010; Morrison et al., 2015; Johnson and Welch, 2016) as well as evaluating risk associated with collision and displacement for seabirds associated with offshore wind energy development (Adams et al., 2017). Other examples of semi-quantitative risk assessment applications include evaluations of impacts on marine mammals from global warming (Albouy et al., 2020) and disease (Norman et al., 2022).
The novel approach to risk assessment synthesized here integrates species-specific population, life history, behavioral sensitivity, and spatio-temporal contextual aspects of potential disturbances into the assessment of response probability, species vulnerability at the population level, and impact severity. The overall goal is to provide resource managers from regulatory agencies and industry action proponents with an early-stage, sensible, objective, understandable, stepwise decision-making tool for evaluating relative risk to specified marine species from specified industrial activities. The approach applies a systematic, largely quantitative, transparent, repeatable, and simplistic method for evaluating potential biological risk to marine mammals from different operational scenarios based on common, broad assumptions across space, time, and different acoustic conditions.
2 Methods
The iteratively derived risk assessment framework is based on two discrete components, species-specific ‘vulnerability’ and species-specific and scenario-specific ‘severity’. The assessment of potential vulnerability includes a systematic appraisal of species-specific population, life history, auditory communication systems, and environmental factors. The assessment of severity includes population modeling methods for acute (short-term, project specific) exposure events (e.g., a seismic airgun survey or pile driving installation period, but not single shots or single pile strikes) and a spatial-temporal-spectral algorithm for estimating a disturbance magnitude metric (referred to as “exposure index”) from aggregate events (long-term, multiple years and/or multiple projects). Each assessment is conducted discretely for specified species, area, and exposure period. This yields a vulnerability risk rating and a severity risk rating for each species and exposure scenario, which are then convolved to assess the overall relativistic risk rating for each scenario.
Given the inherent and varying degrees of uncertainty for many sources of requisite input data in the underlying steps of the assessment process, several different means of characterizing and accounting for uncertainty are applied. In the most extreme cases where critical data are entirely absent (e.g., species-specific spatial-temporal distribution), vulnerability or severity factor scores may not be possible to quantify or adequately assess, even with expert judgment. In such instances, while some factor scores can be judged and included, an overall risk assessment score cannot be determined; a situation that identifies a knowledge gap and could lead to recommendations for research. In some cases, with high levels of uncertainty or lack of information (e.g., population trends), vulnerability risk assessment factors may be explicitly assigned higher factor scores as a means of highlighting the higher risk as a result of the uncertainty. Finally, a subjective overall three-step consideration of confidence in scores is provided for each vulnerability assessment scenario; some degree of expert elicitation is required to determine this.
2.1 Quantifying species-specific vulnerability
A total species-specific vulnerability score is determined for each scenario based on four contextual factors: species population factor (3.1.1.); species habitat use and compensatory abilities factor (3.1.2.); potential masking factor (3.1.3.); and other environmental stressors factor (3.1.4.). Total factor scores resulting from a structured assessment of a factor’s sub-elements are aggregated to determine an overall vulnerability risk rating score for each species-area-time disturbance scenario (3.1.5.). The maximum total species-specific vulnerability score is 30, with a five-point vulnerability rating determined as a proportion of this maximum score (as described in 3.1.5.).
2.1.1 Species population factor
Population parameters are a critical consideration in evaluating the potential vulnerability of a species to disturbance (e.g., Kraus et al., 2016; Nowacek and Southall, 2016) and are not explicitly considered in the RL, threshold-based framework. The Species Population risk factor (Table 1) incorporates relatively well-defined quantitative criteria (e.g., conservation status, population trend, and overall population size) such as those applied in U.S. regulatory policy for some jurisdictions. International conservation status lists (e.g., IUCN) can provide this information for other jurisdictions. A limitation of the species population factor assessment can be the lack of current or sufficiently precise population or stock assessments at a regional level. This limitation and resultant uncertainty have been taken into consideration by weighting the score. The inclusion of a population size element was deemed appropriate beyond simply protected or endangered status, as not all endangered or listed marine mammal species necessarily have low populations (e.g., sperm whales (Physeter macrocephalus), Steller sea lions (Eumetopias jubatus). The species population factor includes three discrete elements of a regional population and has a maximum score of seven.
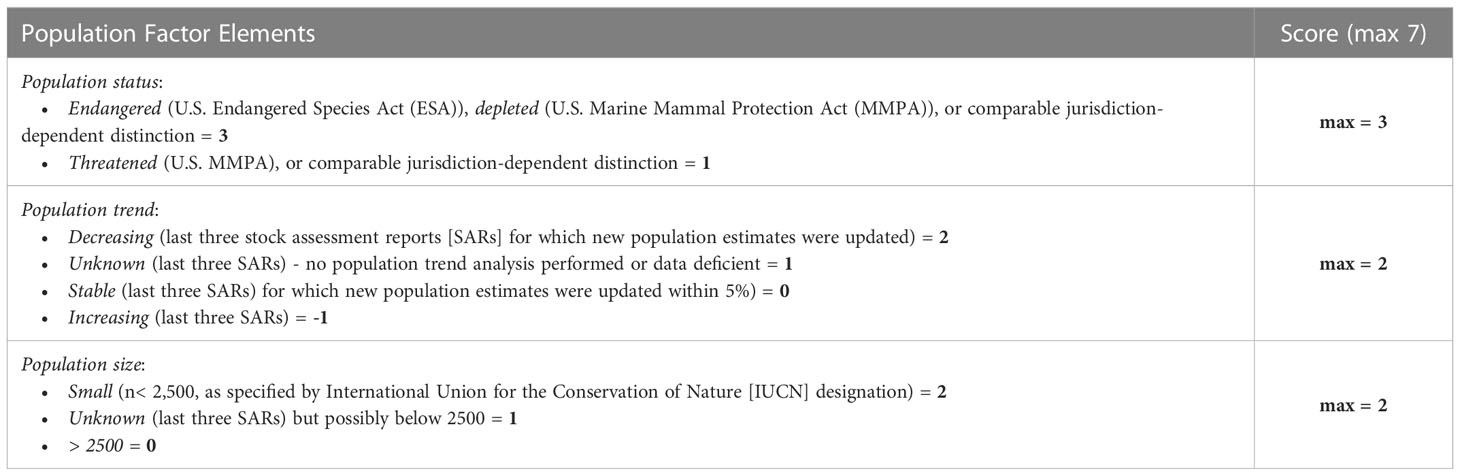
Table 1 Species population factor scoring criteria.
2.1.2 Species habitat use and compensatory abilities factor
An essential component of risk assessment is identification of whether individuals will be exposed to a risk. This requires information on the proportion of the population exposed, for how long, and during what activity (i.e., feeding, migrating, and breeding) (Costa et al., 2016). This information is highly pertinent to the extent to which a species might be able to compensate for or offset the effect of the exposure. The species habitat use and compensatory abilities factor (Table 2) quantifies the species-specific, biological importance of an area in which potential disturbance will occur. The location of potential disturbance is considered on a zone-by-zone basis, which allows the risk framework to stay general and not conflict with detailed environmental assessments for specific activities. This factor considers how a species uses the zone in which the disturbance will occur and if the disturbance will overlap in time with key behaviors (i.e., breeding, migration, feeding). Within the Gulf of Mexico region, Southall et al. (2021b) defined nine zones, whereas Southall et al. (2021c) derived seven ecological zones for mid- and northern U.S. east coast regions. Relatively higher potential vulnerability is assessed for areas where a species has high site fidelity (e.g., Forney et al., 2017), or where there is a higher spatial overlap between anthropogenic, sound-generating activities and seasonally important biological activities (e.g., mating, rearing of offspring, foraging, migrating). Assessments in the Gulf of Mexico, where many species lack strong seasonal patterns, were conducted annually. Assessments off the U.S. east coast, where many species have distinct seasonal occurrences and behavioral context patterns, were calculated monthly. The species habitat use and compensatory abilities factor includes two discrete elements, the more heavily weighted being related to spatio-temporal habitat use and another that is specific to temporal overlap with key biological activities. This factor also has a maximum total score of seven.
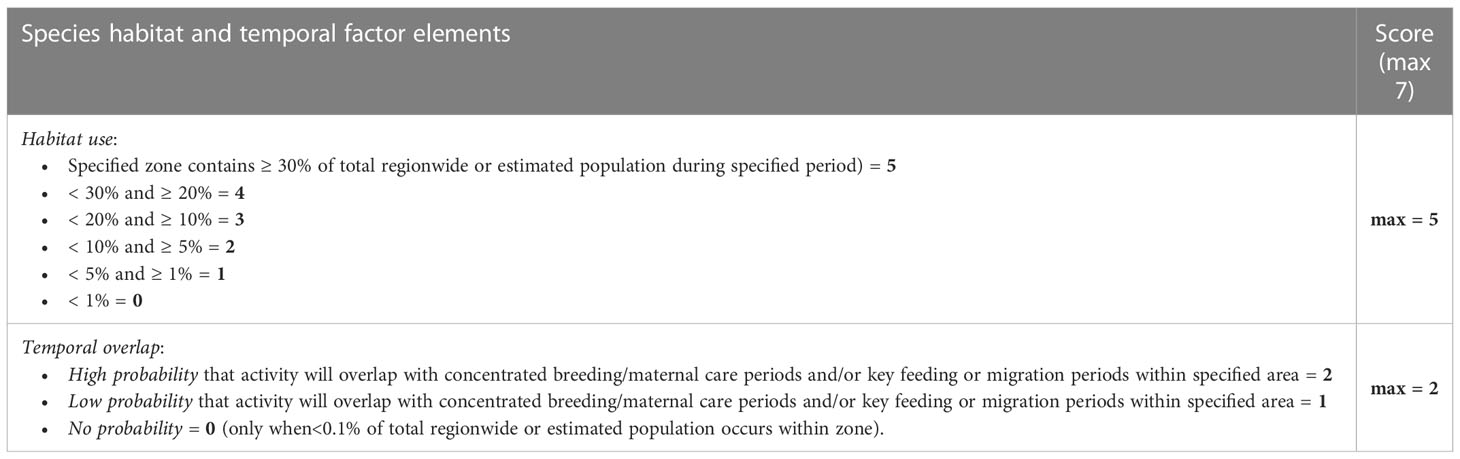
Table 2 Species habitat use and compensatory abilities factor scoring criteria.
2.1.3 Potential masking factor
The potential masking factor considers the potential for disruption of acoustically mediated behaviors such as communication, and spatial orientation and navigation. Masking potential depends on the location and nature of a potentially disruptive activity; the sound field generated by the activity; the existing ambient noise in the area; and the spectral overlap between the aggregate noise field and the hearing, behavior, and acoustic ecology of the species (see Southall, 2018). To determine the potential of an activity to acoustically mask biological important behaviors of a species, the baseline ambient noise conditions in the area must be considered. Ideally the conditions are determined using ambient noise measurements collected over multiple seasons within the area being considered (as in Southall et al., 2021c). The potential masking factor is considered on the vulnerability side of the framework as a separate type of stressor rather than subsumed in the exposure severity calculation, which is intended to address potential behavioral response and thus a proxy for higher-order auditory effects (e.g., hearing loss).
The potential masking factor is calculated using derived frequency-weighted values (‘M-weighted’ filters; Southall et al., 2007) based on the species. This is done as a precautionary approach given the broader nature of these filters for lower-level exposures where masking may occur relative to narrower filters derived specifically for auditory damage from very high-intensity sound exposure (Southall et al., 2019a). ‘Signal’-to-noise ratios (herein defined as ambient noise-to-noise ratio (ANNR) values) are calculated using an iterative series of calculations for LF (< 1 kHz), MF (1-10 kHz), and high frequency (HF; > 10 kHz) frequency bands within specified zones and time periods:
1. Aggregate (full bandwidth) noise spectra for each source are generated over specified resolution throughout the zone and period for each M-weighted condition.
2. The M-weighted, aggregate ambient noise (not including defined activity sources) spectrum is determined over defined sub-areas throughout the zone (e.g., for Southall et al., 2021c see Estabrook et al., 2022). This is a baseline, existing ambient noise condition that is based on empirical measurements (where available) or typical median noise conditions.
3. Relative spectrum level differences are determined between these two M-weighted, aggregate noise spectrum levels, which are then converted into ambient noise-to-noise ratio (ANNR) values for each respective band.
For each species of interest, the masking factor score for each relevant communication and spatial orientation frequency band is calculated based on frequency-band-specific criteria (Table 3). Communication bands are presumed as the LF band (< 1 kHz) for baleen whales and pinnipeds, the MF band (1-10 kHz) for odontocetes, and the HF band (> 10 kHz) for odontocetes (echolocation and conspecific signals for high frequency specialists; e.g., harbor porpoises). Given the assumption that passive listening can facilitate spatial orientation and navigation for any species that can detect and use the relatively low frequency signals that propagate and convey information on environmental factors over appreciable distances, weighted ANNR values are determined for LF and MF bands for all species. The potential masking factor includes three discrete elements related to communication and spatial orientation and navigation, which are added together and has a maximum score of nine. This higher maximum score reflects the critical importance of acoustic communication as well as the use of passive listening for other biological and environmental sounds in spatial orientation and navigation.
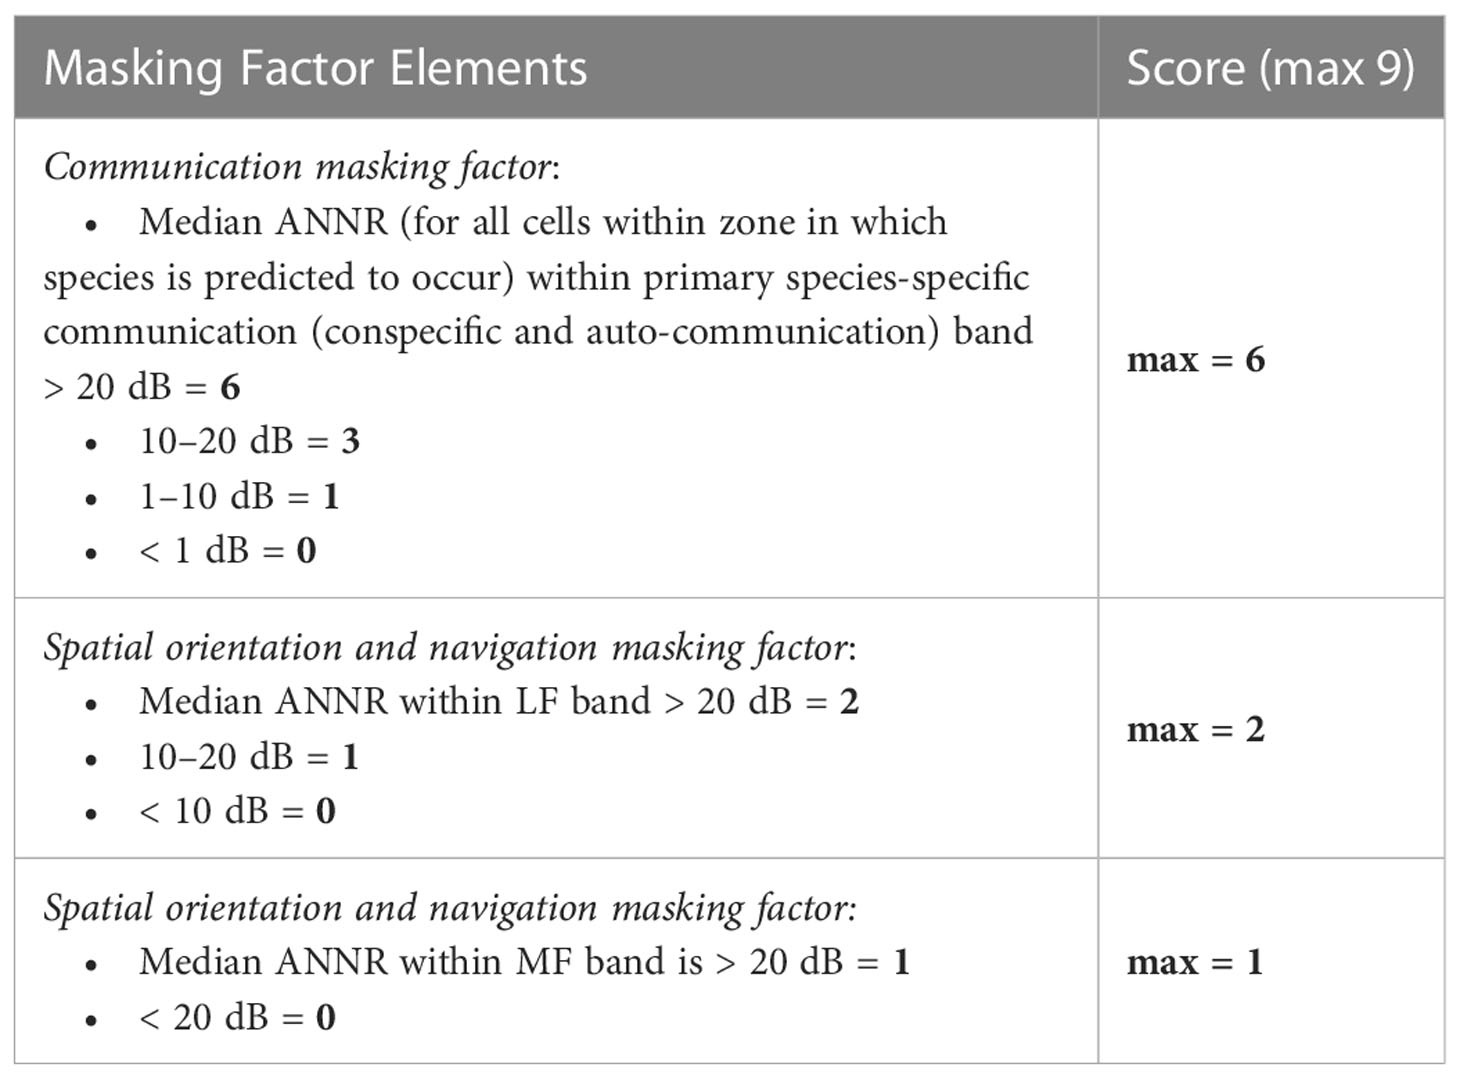
Table 3 Potential masking factor scoring criteria. Each individual factor score is combined.
2.1.4 Other environmental stressors factor
The other environmental stressors factor considers other environmental and/or human stressors already impacting species prior to the specified potential disturbance. This has been a key element of the framework since Ellison et al. (2016), although quantitative distinctions and reference points (e.g., potential biological removal; see Wade, 1998), and uncertainty within species-specific mortality estimates) have been subsequently added. Sub-factors consider the relative levels of all types of ongoing human activity, which considers existing current and likely future uses and is distinguished from masking associated with the specific disturbance being assessed. Another sub-factor evaluates the existence and severity of biological (non-anthropogenic) risk factors such as disease, climate change or nutritional stress (Table 4). The other environmental stressors factor is applied on an annual basis given the nature of the associated stressors and typical reporting of data for each. The other environmental stressors factor includes a maximum possible score of seven.
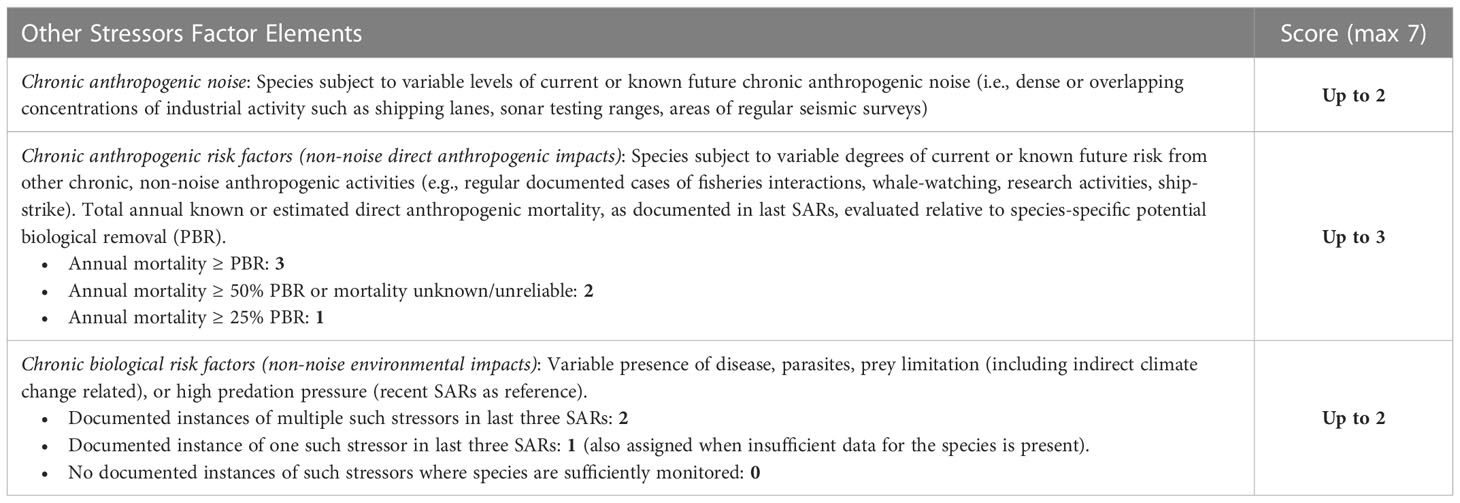
Table 4 Other environmental stressors factor scoring criteria.
2.1.5 Total vulnerability score rating method
A vulnerability score is the percentage of the aggregate of the four factor scores relative to the maximum possible score (30). Vulnerability scores are assigned a relative risk probability and a vulnerability rating using quintiles (Table 5). It is important to note that these ratings are intended to represent relativistic values for distinct species, time periods, and areas considered within the same context. Consequently, relative terms (e.g., lowest, highest) are used rather than absolute terms that might become misused to compare risks between very different combinations of species, time, area, and context, which is not the intention here.
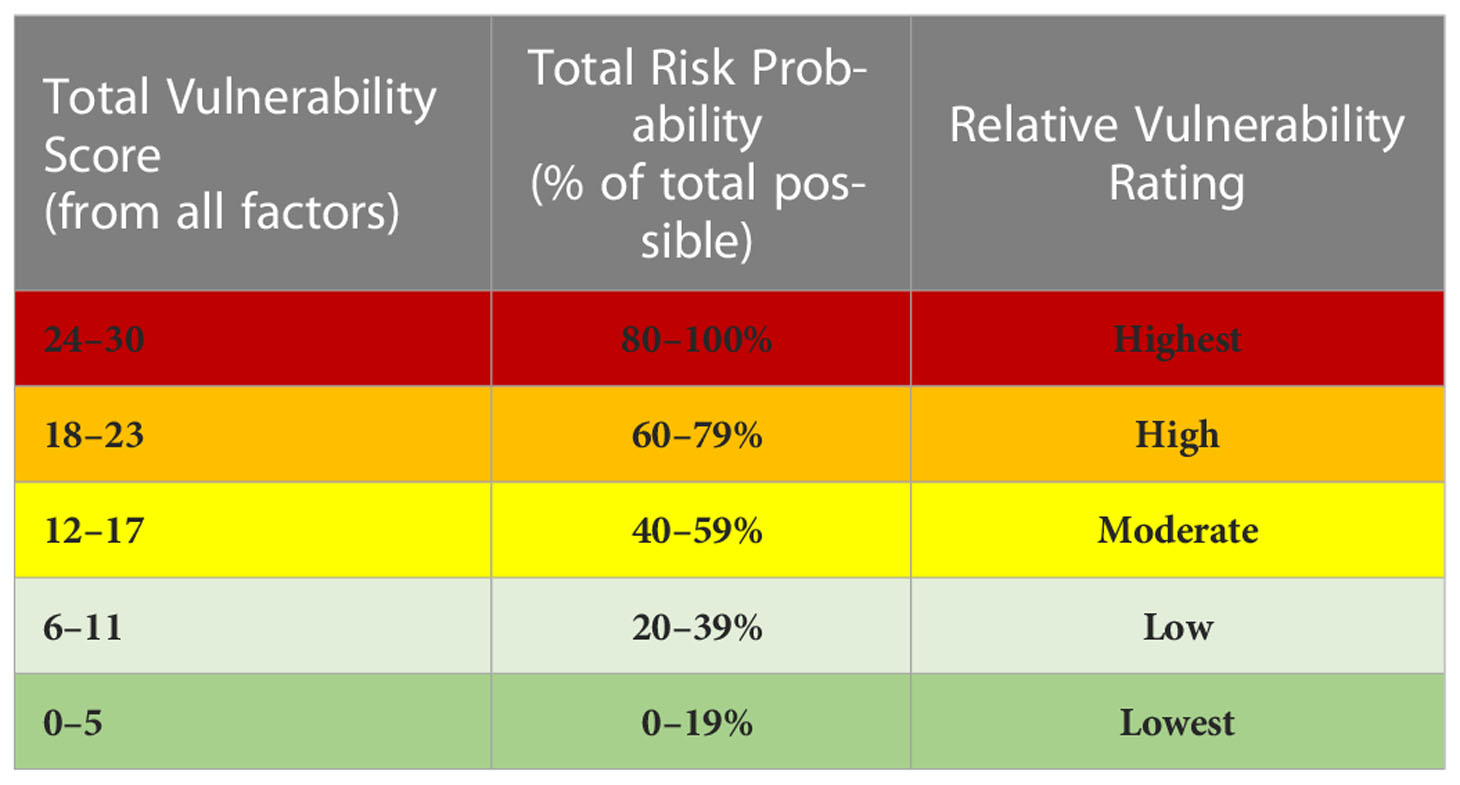
Table 5 Normalized species-, time-, area- context-specific vulnerability score, and associated risk probability and relative vulnerability rating.
2.2 Quantifying exposure severity
Throughout the advancement of these risk assessment methods, separate approaches for quantifying the potential magnitude of severity have been developed for discrete, project specific, disturbance events (acute approach) and multiple overlapping events (aggregate approach) (see: Southall et al., 2018). We focus here on the aggregate approach most fully developed in Southall et al. (2021c), while recognizing that this approach can also be applied to discrete events. A detailed description of the earlier acute approach method for exposure risk assessment is provided in the associated Supplementary Materials.
Aggregate exposure risk assessment: “Exposure Index”
Ellison et al. (2015) built upon and conceptually integrated general principles and aspects of the acute exposure assessment framework to develop new approaches for application to broader scales (larger than single activity) and multiple overlapping activities. The assessment method presented here was developed in Southall et al. (2019c) and enhanced by Southall et al. (2021b; 2021c). It uses an algorithmic approach to calculate the spatial-temporal-spectral quantitative intersection of potential disturbance and marine species distribution and hearing capabilities, yielding a non-dimensional “exposure index” for each disturbance scenario across all species considered. The intent is to provide systematic, quantitative methods that enable the relative evaluation of potential aggregate effects across various specified operational scenarios. The spatial-temporal-spectral basis of the exposure index renders it both modular and inherently scalable. The output is a straightforward, relativistic index and risk rating process by which to assess variable scenarios in which a single or multiple potential disturbances might occur (e.g., periods of time, areas, types of sound generating activities.)
Unlike the acute risk assessment where specific “takes” are estimated for defined impacts (injury = MMPA level A; behavioral disturbance = MMPA level B), the aggregate risk assessment framework makes no such distinction. Rather, the probability of these and other adverse effects of disturbance are presumed to co-occur spatially, temporally, and spectrally. As such, the exposure index serves as a relative proxy across species and contexts for all forms of potential acoustic harassment. It is designed to broadly identify the conditions under which the overall severity of disturbance is relatively lower or higher based on the overlaps between the spatial, temporal, and spectral features of sound fields from aggregate activities and the species-specific attributes of exposed animals. The exposure index metric can thus be quantified as the relative exposure severity and a proxy for the presumed impact as a proportion of the local population within either a defined geographic ‘zone’ or an entire defined ‘region’. The exposure index has the following characteristics:
● Spatial resolution for calculations is modular. Recent applications (Southall et al., 2021c) applied 10 x 10 km grid cells for all species other than species of particular interest (e.g., North Atlantic right whales) where finer (5 x 5 km) grid resolution was provided by Roberts et al. (2020).
● Temporal windowing is also modular in that exposure index values can be calculated at variable (monthly, seasonal, annual) resolution.
● The exposure index is calculated for individual elements of compound operations (e.g., piles driven in an offshore wind farm) or of multiple overlapping operations (e.g., multiple seismic surveys) and combined to determine an aggregate risk.
● Exposure index calculations are determined in a relativistic sense in terms of the percentage of the populations affected of the total number for that species within specified geographic zones and regions (not necessarily the entire population).
● The exposure index is comprised of an activity index and a spectral index. These indices characterize the temporal and spatial extent of potential disturbance in relation to species-specific distribution and acoustic communication.
Below we introduce the concepts behind the activity and spectral indices. The equations provided are examples that have been specifically tuned to assess the installation and operation of offshore wind farms off the U.S. east coast. The spatial-temporal-spectral concept of this framework is applicable to any sound generating activity (i.e., seismic surveys, offshore wind, vessel operations), but the specific equations require tuning based on the values of the parameters associated with the activity (e.g., duration, source movement).
2.2.1 Activity index
The activity index (AI) quantifies the spatial and temporal extent of a sound generating activity into a single metric. AI is calculated by using species-specific limits associated with the presumed onset of behavioral responses to a specified sound at specified geographic ranges. It is calculated for each specified period during which an operational activity, and thus potential disturbance, is assumed to occur. AI (Eqn 1) is composed of two discrete terms, AIspatial and AItemporal, that quantify the spatial and temporal activity.
The spatial activity index (AIspatial) component (units: km2) is derived from the spatial area within which the RL from a known activity is thought or known to be high enough to elicit a species-specific behavioral response 50% of the time (i.e., 50% response probability). It is calculated for each active source type (e.g., turbine in a wind farm; seismic airgun array) for each defined temporal period. The 50% response probability and associated impact area differ based on the species being considered since different species react at different RLs (see Southall et al., 2007; Southall et al., 2021a). In this analysis, a 50% response probability of 120 dB (root mean square; RMS) is used for harbor porpoise and beaked whales and 160 dB (RMS) for all other species and behavioral contexts. When evaluating turbine construction or operation at an offshore wind farm, the spatial activity index (Eqn 2) is calculated for each source component individually for each specified period, where r is the range (km) to the 50% response probability RL isopleth, which can be adjusted based on species or taxa-specific empirical data related to source-specific response probability.:
This term is determined separately for each discrete condition (based on direct measurements of identical or similar operations and/or acoustic propagation modeling evaluation). Nt is a daily unitless metric of activity defined for different activities (e.g., offshore wind turbine installation, operation). When evaluating potential risk to a marine mammal due to vessel activity in an area, the spatial index term represents the area around a vessel within which the 50% response probability occurs. It is calculated for the vessel activity occurring within a defined area and period (Eqn 3), where r is the max range to estimated behavioral response (km); Sv is the average speed of a vessel (km/hr) within the defined area; and Tv is the average length of time of a vessel trip (hours).
The temporal activity index (AItemporal) represents the percentage of days within a specific time period that disturbance will occur. It is calculated for each type of activity for each period within which the activity occurs. In the case of evaluating turbine and vessel activity at an offshore wind farm, similar equations are used for turbine and vessel activity and a monthly resolution was used to assess both activity types. To quantify turbine installation and operation, the temporal index (Eqn 4) is defined where Ntd is the total number of days when turbines are being installed or operating in a month, and Nd is the total number of days in the month being evaluated.
To quantify the temporal extent of vessel operations, the temporal index (Eqn 5) is defined where Nv is the number of vessel trips occurring in an individual wind farm in a month and Nd is the total number of days in the month being evaluated.
2.2.2 Spectral index
The Spectral Index (SI) is dependent on the hearing capability of a marine mammal of interest given its species abundance in the operational area for a given period. It serves to quantify the spectral difference between the unweighted spectrum of the sound source under assessment and the M-weighted functional hearing group for the species of interest (Southall et al., 2007). The M-weighting was selected as a deliberately wider frequency range than subsequent narrower auditory filters (Southall et al., 2019a) given that the predominant consideration for nearly all contexts relate to behavioral response. SI (Eqn 6) is calculated where Eweighted is the amount of acoustic energy in a spectrum weighted by the M-weighting, Eunweighted is the amount of acoustic energy in the unweighted spectrum, and Nanimals buffered WF is the total species abundance within a buffered region around the area of activity (i.e. buffer the lease area when evaluating offshore wind farms), within the range that encompasses contextual behavioral reactions from animals.
2.2.3 Exposure index calculation and risk rating
The exposure index (EI; Eqn 7) is calculated separately for each wind farm, month, and species. Calculating separately for each active source allows for evaluation of operations that are in different phases (i.e., one wind farm could be in construction and the other could be in operation) and their noise conditions are different.
The exposure index from all sources is summed to yield an aggregate exposure index (EIaggregate; Eqn 8) for each defined period.
The total number of animals within a broader zone or region, whichever is of interest, is then used (Ntotal animals) to determine an aggregate, normalized exposure index (Eqn 9).
EIaggregate, normalized is a non-dimensional value that is related as the percentage of the species within a zone or region during which activities occur for a specified period. Given that EIaggregate, normalized is normalized by total animals, it can be compared across species provided the same geographic area (zone or region) was used to determine the Ntotal animals term. EIaggregate, normalized is calculated for each noise source unit independently such that the index of source will inform the user as to which source is of higher relative impact to the species under consideration. When calculating the EI for compound source conditions with multiple discrete activities (e.g., vessel activity and operational turbine noise in a wind farm), the activity yielding the highest EI is used as the representative EI for the overall operation.
Once species-specific EI values for a period and geographic area of interest are calculated, several processes are required to determine a risk assessment rating. Zone-wide representations of EI results are calculated from the most representative scenarios to serve as references for comparing relative species-specific exposure risk within and between different scenarios. Quintile values at the 20th, 40th, 60th, and 80th percentile indices of this distribution are determined, yielding five equally distributed proportions of the total EI values (Table 6). These values serve as a means of quantitatively assessing relative risk based on the distribution of EI results for representative scenarios across all species of interest. It is important to note that this process is entirely dependent upon the selection of species, the geographic area considered, and the context of the base distribution used to determine these percentile breakpoints. This process is emphasized to be a transparent, consistent tool used to evaluate relative risk in defined scenarios for assessing species and scenario differences and/or in contingency and scenario planning rather than an absolute quantification of risk or severity of impact.
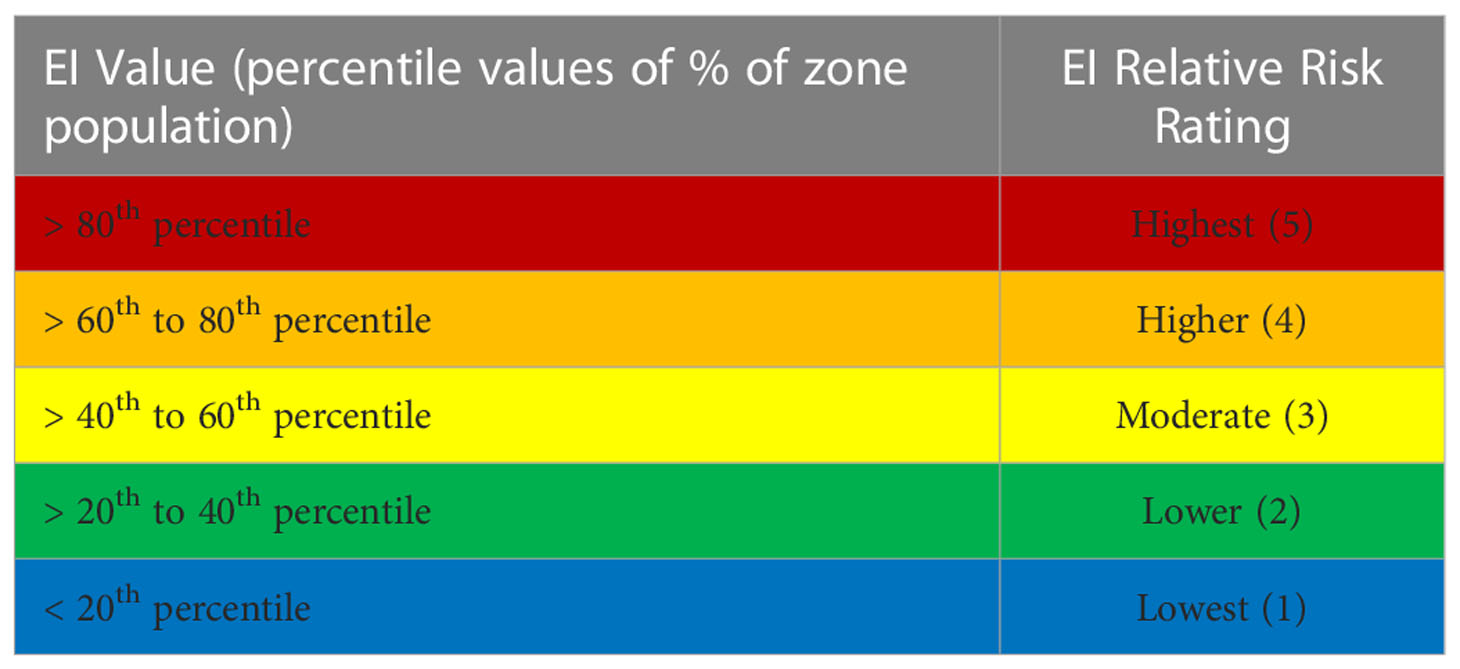
Table 6 Exposure Index (EI) value percentile breakpoints and corresponding risk ratings.
2.3 Integrated, species-specific risk assessment rating
The final step in the risk assessment process for a specified scenario is to integrate the vulnerability and EI ratings. This involves merging the species-specific vulnerability rating (Table 5) and EI risk rating (Table 6) into a 5x5 matrix in which resultant risk in evaluated on a five-step relative scale from lowest (blue) to highest (red) (Figure 1). This matrix yields a species-specific relative risk assessment for defined scenarios of industrial activities for the zones, region, and time periods specified.
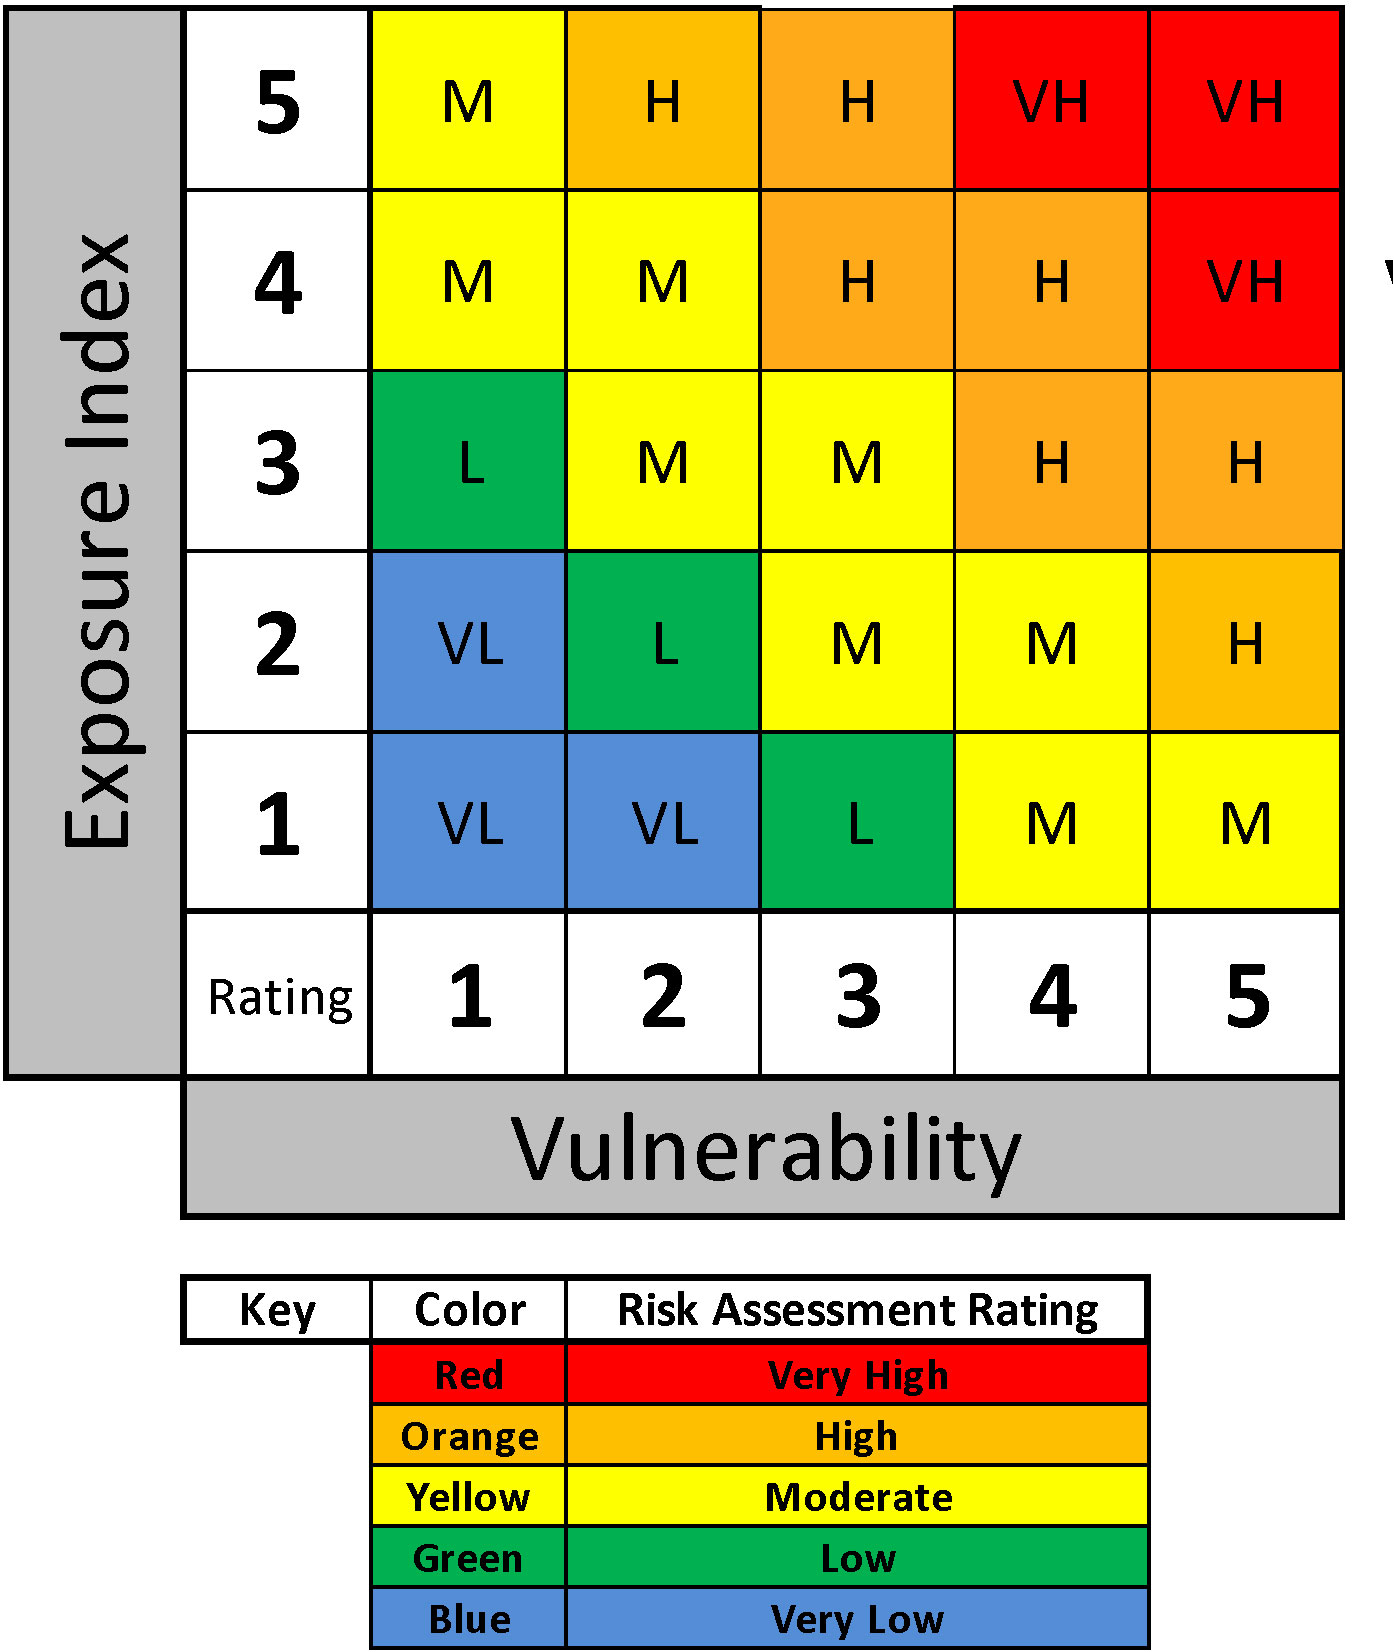
Figure 1 Example of a risk assessment rating matrix based on species-specific and scenario-specific vulnerability and exposure index rating scores.
3 Modeled results for wind farms and seismic survey examples
During the evolution of our approach, various disturbance scenarios have been evaluated in extensive detail, including modeled and actual seismic airgun surveys off California (Wood et al., 2012) and in the Gulf of Mexico (Ellison et al., 2018; Southall et al., 2019a; Southall et al., 2021b), as well as modeled offshore wind energy facility installation and operation (Southall et al., 2021c). The focus here is on the development, adaptation, and utility of the risk assessment paradigm within the context of marine policy applications. Results presented are illustrative examples of the assessment process and outcomes based on several different scenarios rather than a comprehensive assessment of an individual scenario across all contexts and species. Examples are given to demonstrate how results within and across scenarios could be evaluated in making informed and strategic management decisions. These strategic management decisions are considered a primary mitigation tool. For example, avoiding a particularly sensitive time period or area, reducing the overall time period of disturbance by allowing night-time or co-occurring activities, or adopting enhanced operational mitigation measures for species that are identified as highest risk.
3.1 Vulnerability risk assessment
Species-specific vulnerability to disturbance is evaluated relative to factors that are both fixed at the time of the analysis (e.g., population status/trend, anthropogenic stressors other than the disturbance being considered) and important aspects of natural history and behavior (e.g., seasonal distribution and behavior, auditory masking in the context of seasonal differences of ambient noise). The degree of seasonal variance in biological systems can determine the selection of temporal periods for vulnerability assessments. For many of the Gulf of Mexico species considered for risk assessment from seismic survey operations, there is relatively little seasonality so an annual vulnerability assessment was considered appropriate (Southall et al., 2019a; Southall et al., 2021a), so an annual vulnerability assessment was considered appropriate. In contrast, many of the marine mammals considered in risk assessment from offshore wind farm construction and operations on the U.S. east coast (Southall et al., 2021c) have highly seasonal occurrence and behavioral patterns, so vulnerability was assessed on a monthly basis. Example results of vulnerability assessments for different species in each context (Table 7) illustrate how different factors drive the relativistic nature of the risk assessment across species and contexts.
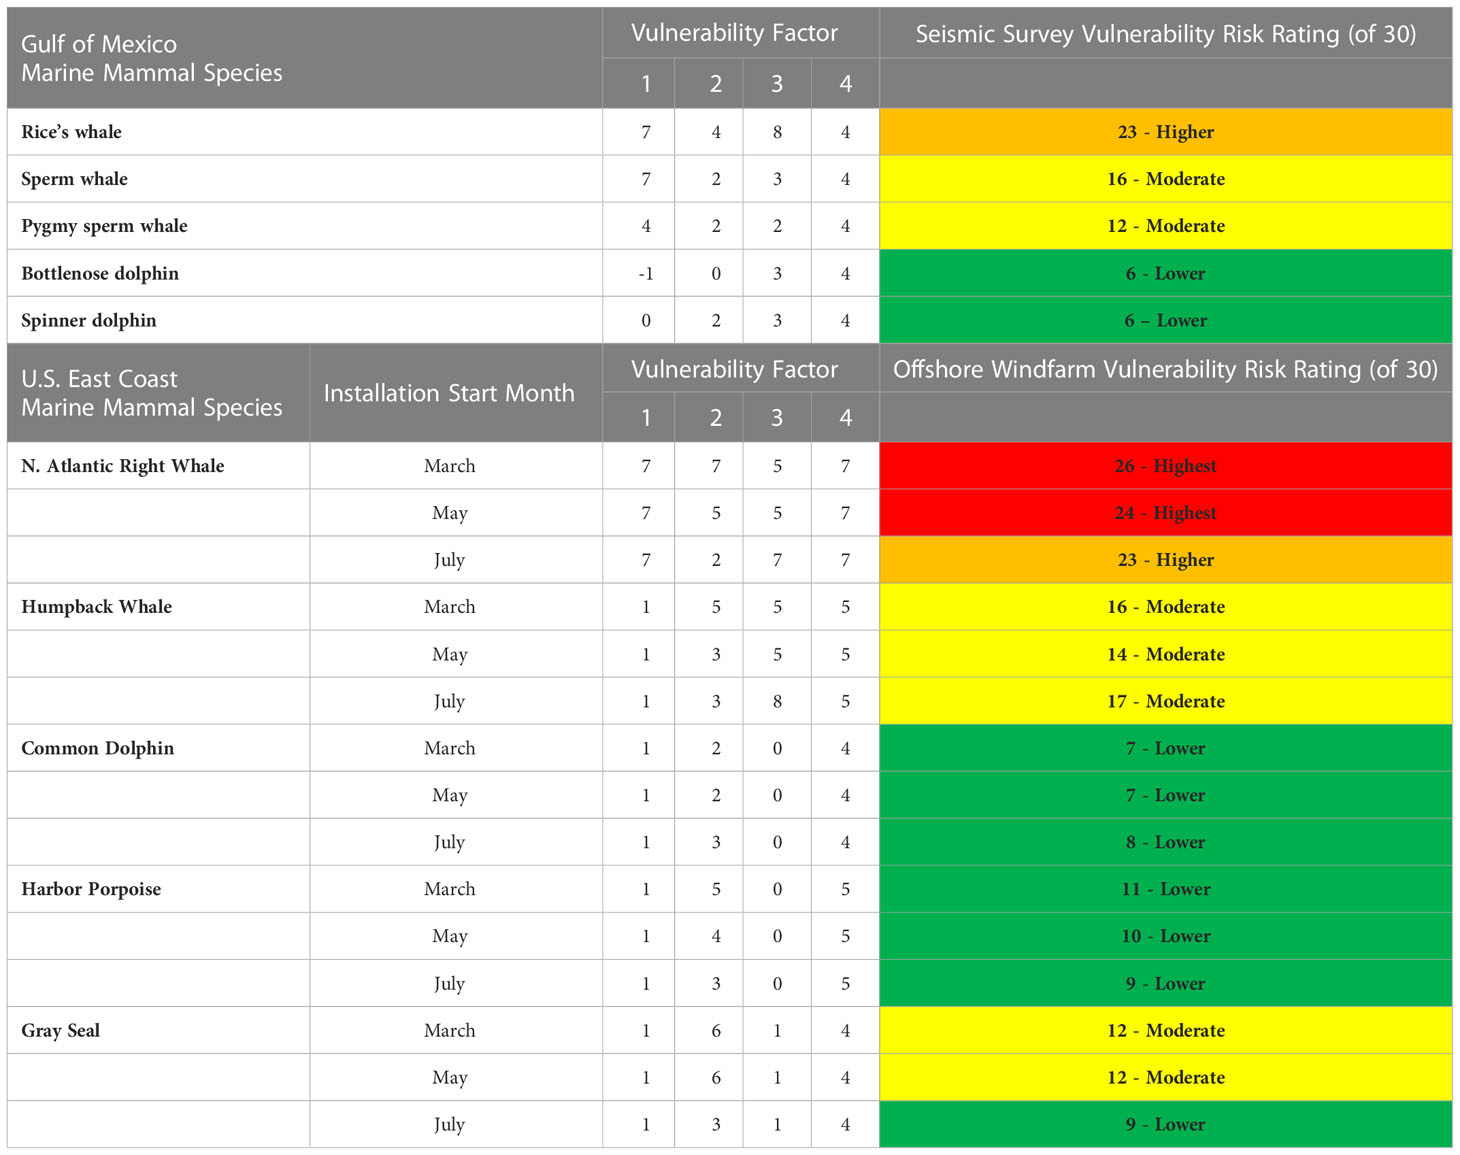
Table 7 Vulnerability factor scores and risk assessment ratings for selected Gulf of Mexico and east coast marine mammal species evaluated relative to potential impacts of seismic surveys and offshore windfarm installation, respectively.
3.2 Exposure severity risk assessments
An example of exposure severity results is provided for five marine mammal species (selected for their management relevance and taxonomic representation of local taxa; see Southall et al., 2021c) evaluated with the risk assessment paradigm for selected offshore wind energy facility installation scenarios in locations within actual wind energy lease areas off the U.S. east coast. These scenarios include the installation of a single windfarm of 120 piles starting in three different months (March, May, or July) with a single pile driven per day for four months. Monthly EI scores and their corresponding risk ratings (relativistic within this specific application as they are based on quintile values for EI scores across all species and contexts) in which operations were presumed to occur are given (Table 8).
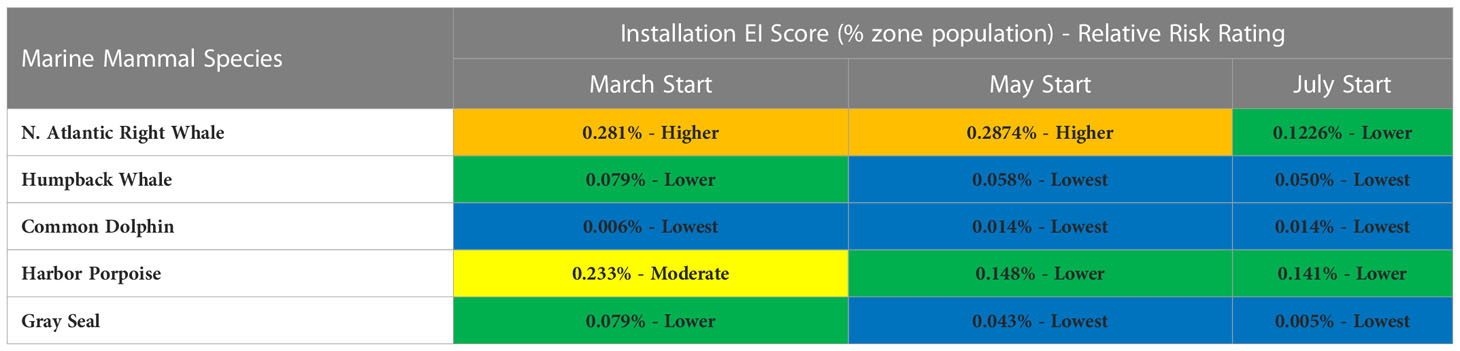
Table 8 EI scores and associated relative risk ratings for selected marine mammal species off the U.S. east coast evaluated for hypothetical offshore wind energy facility installation scenarios (single windfarm).
An additional utility of the EI calculation process is that it provides the means by which to comparatively evaluate risk over different temporal periods associated with variable scenarios. (e.g., individual months as in Table 8 or aggregated over multiple months during which potential disturbance could occur). For instance, Southall et al. (2021c) evaluated scenarios in which a single monopile per day would be driven in the installation of a single windfarm, which is the more typically expected scenario involving daytime-only piling operations. As noted in the above example, at one pile per day, this would nominally require four months of installation for 120 piles. However, scenarios were considered where nighttime piling would be allowed, meaning two piles per day could be driven and the overall disturbance would occur over two months. This more concentrated piling scenario resulted in higher EI scores within the 2-month piling period relative to the 4-month piling period scenario. However, aggregate EI scores (the overall integrated predicted disturbance) were actually lower in some scenarios for conditions involving two piles per day versus one pile per day despite the monthly differences, simply because the disturbance occurs for half the total overall time during months when densities are relatively low. Example results showing aggregate EI values for two baleen whale species evaluated in the 2-month and 4-month piling scenarios are given below (Figure 2). This aggregate difference, represented as negative difference scores, is not observed in all periods, but rather only in the later (1 July) start date scenario. These results suggest that for some whale species with high seasonal variability of occurrence, concentrating installation into periods with lowest occurrence can result in a tangible (10-15%) reduction in aggregate risk to those species.
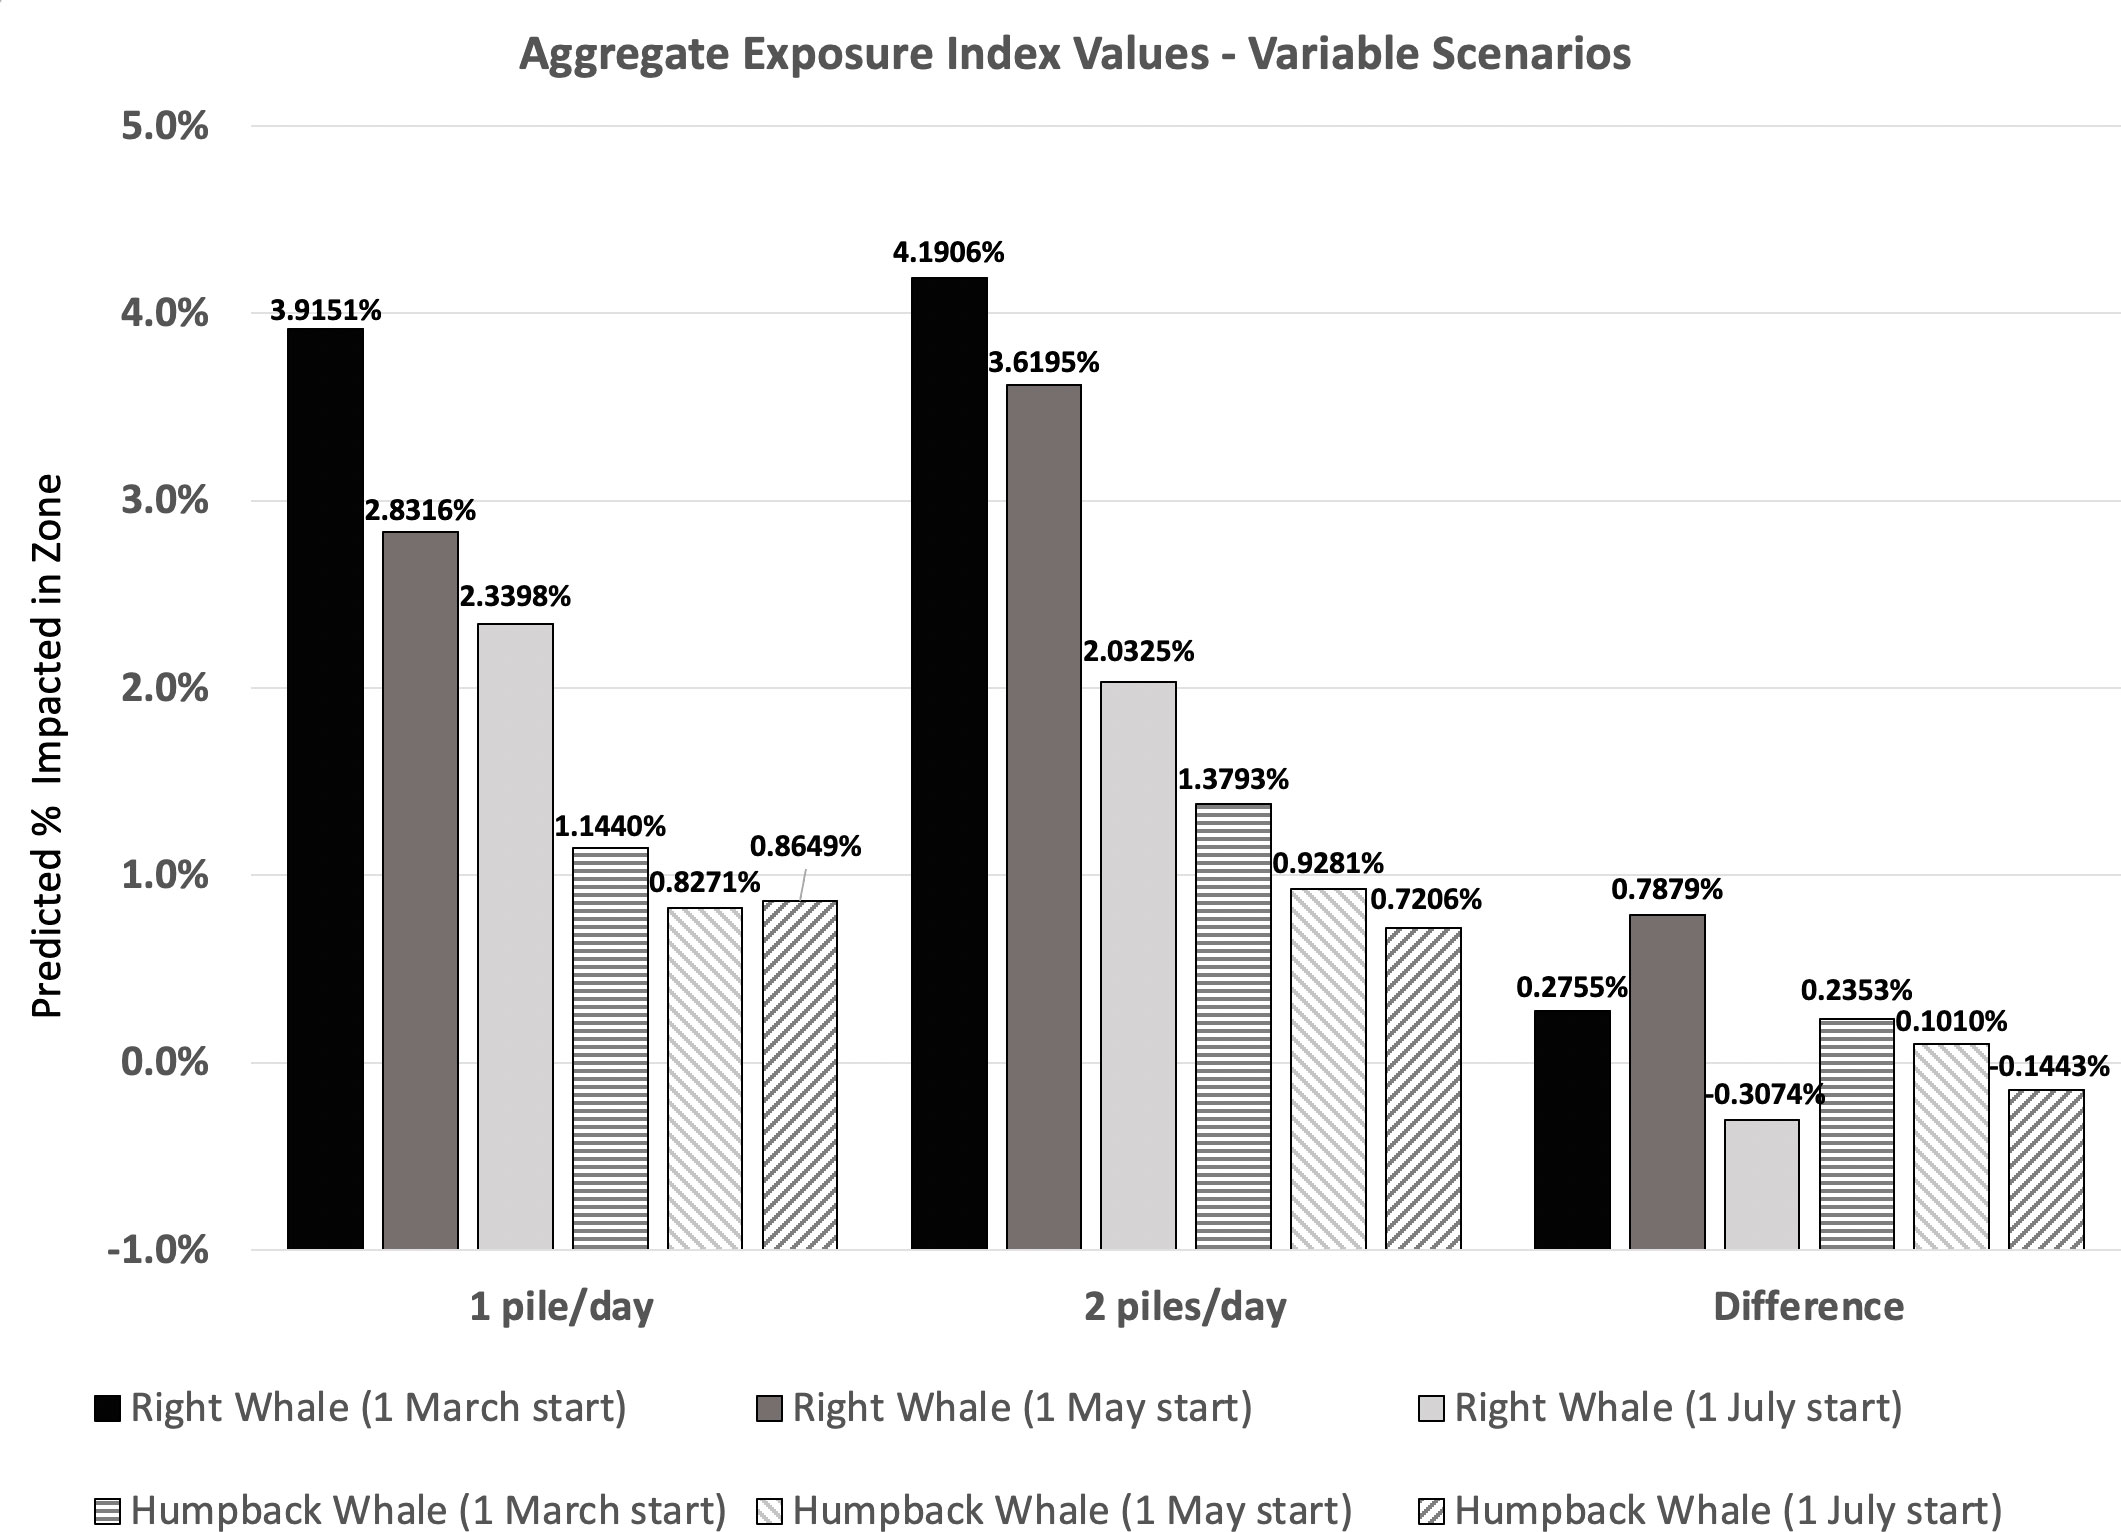
Figure 2 Aggregate EI values for two baleen whale species evaluated relative to potential impacts from pile driving either 1 pile/day or 2 piles/day for a 120 turbine offshore wind farm.
These risk framework results highlight key data needs given the required assumptions for the timescale of baleen whale disturbance effects post-piling. We conservatively assume disturbance of a second piling event in a day is identical to the first, although, in reality, the two disturbance events could spatially overlap. If effective disturbance wanes during sustained operations, the relative differences between extended, intermittent disturbance and concentrated, sustained disturbance be more pronounced.
3.3 Integrated risk assessments
Risk assessment results for potential disturbance in different offshore windfarm installation scenarios for selected key U.S. east coast species (Southall et al., 2021c) are shown for four different temporal scenarios (Table 9). These scenarios include the installation of a single windfarm starting in three different months of the year (March, May, July) and lasting for a comparable period and the installation of two windfarms in wind lease areas (~60 km from one another) with differential degrees of temporal overlap. Where two wind farms were presumed to be installed in the same year, three different temporal scenarios were considered:
(1) Sequential Installation = two separate installation periods, two months (July-Aug) at first site followed by two months (Sept-Oct) at second site;
(2) Partial overlap = installation at one site in Aug-Sept and Sept-Oct at the second site, such that both sights are active in Sept;
(3) Total overlap = installation of both site in Aug-Sept.
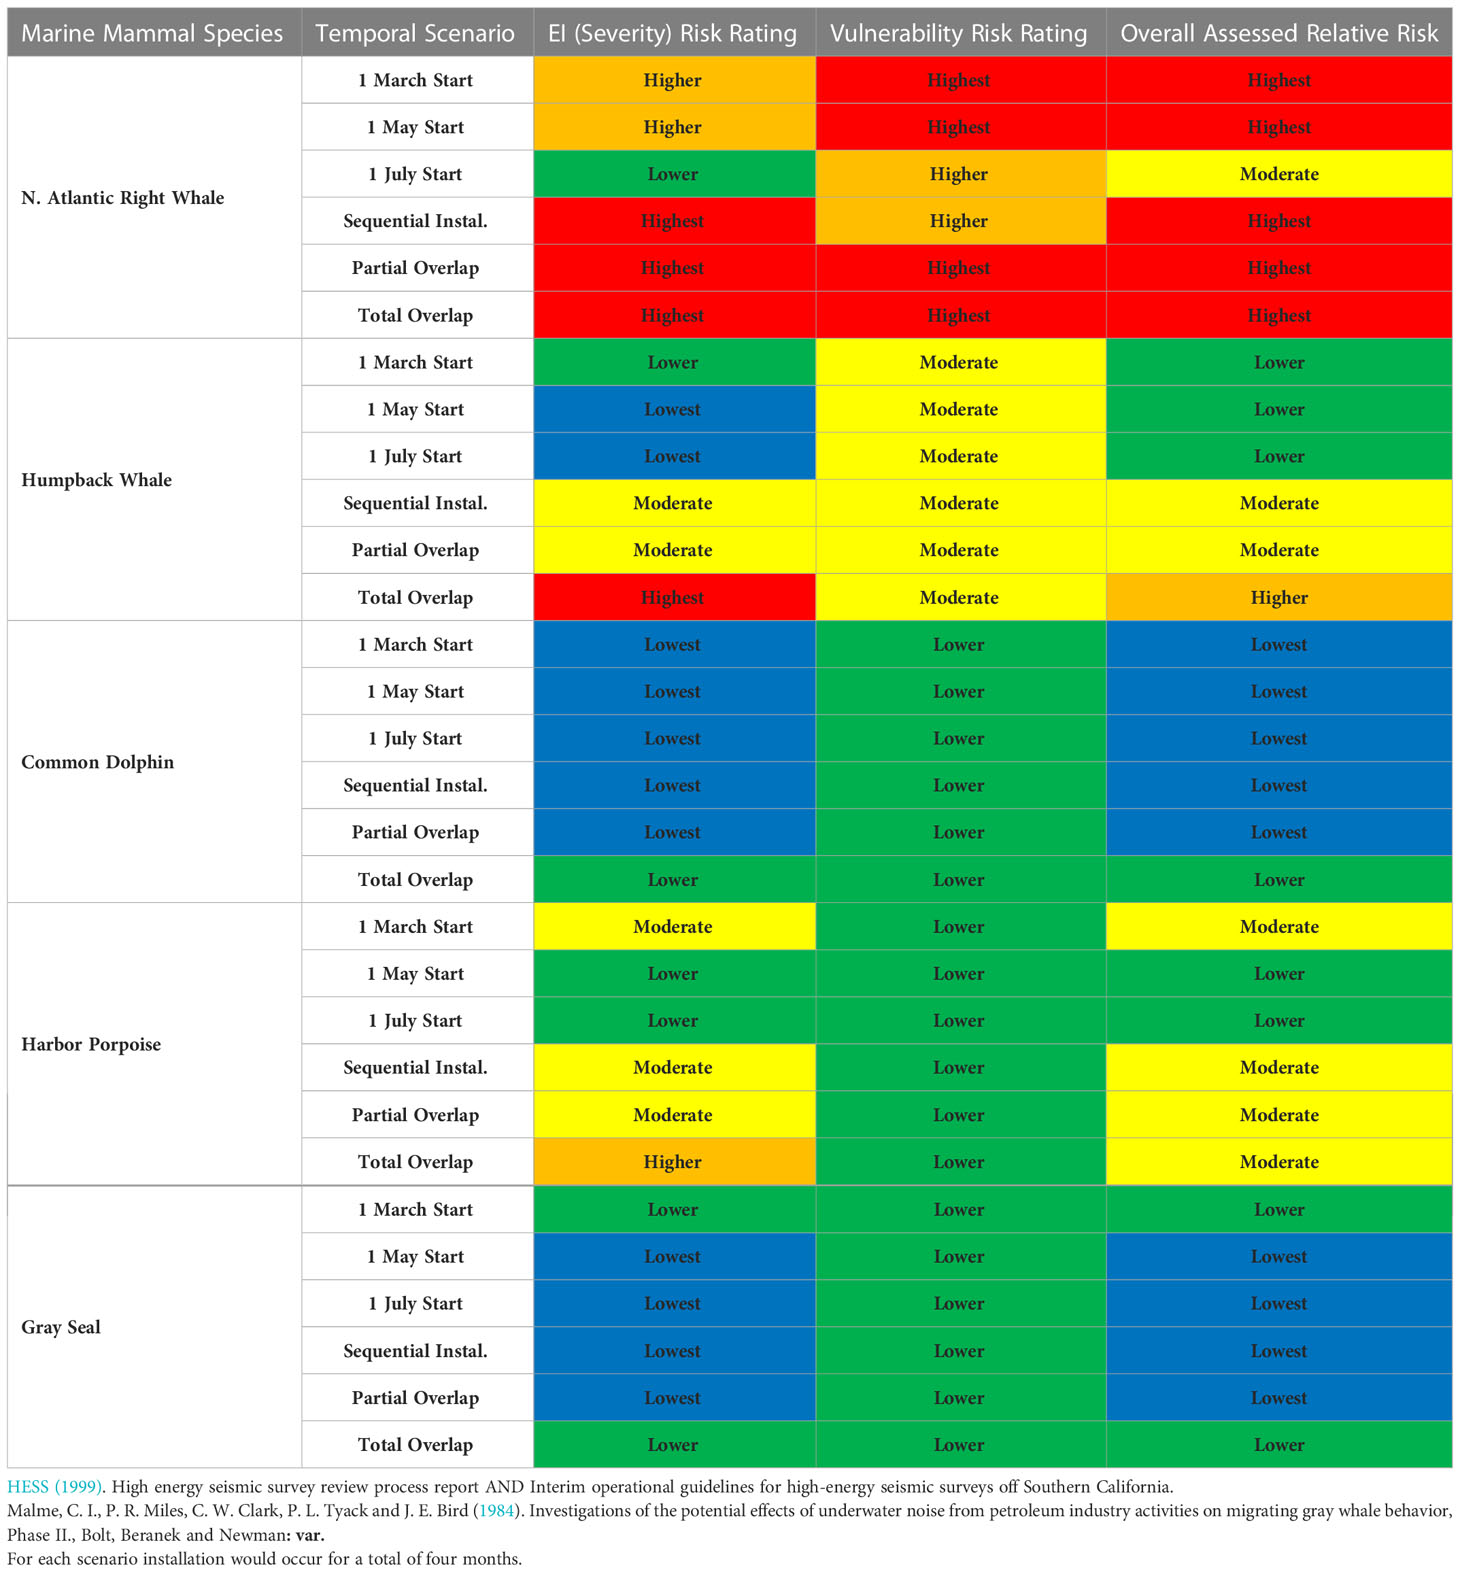
Table 9 Assessed relative risk derived from vulnerability and severity ratings for selected marine mammal species off the U.S. east coast from installation of one or two offshore wind farms in different scenarios for start month (March, May, July) for a single installation location or for variable temporal overlap (sequential, partial, total) of two installations.
Additional examples of integrated risk assessment results for selected key species from the Gulf of Mexico exposed to seismic surveys from Southall et al. (2021b) are given in Supplementary Materials.
4 Discussion and conclusions
We present a transparent, objective, and simple means of assessing relative overall relative evaluated risk to marine mammals from human disturbance in defined scenarios. It is intended as an early-stage strategic assessment tool for identifying key species, locations, time periods, and disturbance scenarios that identify key areas of uncertainty and inform the implementation of marine policies and effective management. The methodology is based principally on a spatially and temporally explicit framework for integrating general biological vulnerability with the potential exposure to industrial activity. It allows a practical means of considering the optimal timing of an activity at a specific location, identifying locations of high risk to particular species, or assessing cumulative risk of multiple activities over time. Notably, the derived risk assessment framework was designed to be inherently modular and scalable, allowing it to be tuned to key questions, areas, or degrees of spatial and/or temporal resolution and even adapted to non-acoustic impacts (e.g., vessel-strike, entanglement). The precision of the results may be limited in resolution based on the type and confidence of the underlying input data, this scalability was intended to provide a means of evaluating relative risk for multiple species over defined areas and time periods. This tool is intended to allow managers to evaluate multiple kinds of development or operational scenarios using common assumptions and evaluate the relative pros and cons of different scenarios across many different species that may co-occur in order to make strategic choices based on management priorities and requirements. The risk framework is not intended to replicate or supersede current regulatory guidelines for auditory injury or behavioral impacts, or modeling approaches to evaluate long-term assessments of population consequences of disturbance. Rather, it is intended as a complementary, practical, early-stage approach that can provide relative assessments of specific scenarios compared to more complex and intensively data-dependent, model-based evaluations.
The risk assessment approach specifically recognizes the critical factors regarding the regional and seasonal species population cohorts and their natural history, hearing, and behavior; and integrates the potential vulnerability posed by these factors with the temporal, spectral and contextual exposure introduced by coincident anthropogenic activities. By scoring and convolving the relative level of species vulnerability factor and severity factor (quantified as an exposure index), a relative risk or overall impact assessment can be constructed and evaluated in a classic X-Y trade space paradigm. Managers can evaluate relative risk with a standardized approach and common assumption, using this ‘trade-space’ approach to evaluate various operational scenarios related to proposed industrial activity. For instance, relative risk in different scenarios may be assessed by varying the assumptions of disturbance contexts (e.g., start times, temporal overlap, operational parameters including nighttime operations). Such an approach will allow managers and action proponents a way of more objectively implementing and comparing adaptive strategies to reduce risk across species that may have very different management priorities. This process also enables comparative evaluation of critical data needs and thus investment to support future assessments and effective mitigation.
In developing the modeled results (Section 3) for both seismic survey and wind farm installation scenarios, several key insights emerged in terms of the application and generalizability of the risk assessment framework. The spatially static nature of disturbance associated with wind farm construction relative to mobile sources considered previously (seismic surveys) required different considerations and assumptions, including the relative potential disturbance zones around individual turbines during installation. We also evaluated the relative impacts of mitigation measures (e.g., bubble curtains) that reduce the acoustic footprint of impact pile driving and used smaller potential disturbance zones in calculating EI values for unmitigated versus mitigated conditions. Thus, the modular nature of our assessment framework allows for relatively easy comparative testing of different disturbance radii values and mitigation assumptions. This motivates empirical evaluation of ways to test and improve mitigation methods. Data limitations in the underlying quality and nature of animal distribution data as well as data and analyses conducted (or missing) from the NMFS SARs imposed higher levels of uncertainty that required more precautionary conclusions. Additional distinctions were made throughout the evolution of the framework, specifically in the vulnerability scoring where data were deficient.
Several revealing insights evolved from the application of the risk assessment framework to offshore windfarms for different species. The relative density and abundance of species within the focal zone for a specified time period are the primary drivers of the exposure index scores and influence the habitat use factor in the vulnerability assessment. Scenarios considering the installation of piles during different seasonal time periods yielded several important insights regarding potential risk. Most notably, for species with more temporally ephemeral distributions in areas where operations were presumed to occur, the highest predicted risk values logically occurred when installation overlapped with relatively higher species occurrence. Considering these patterns across species, certain periods (installation in late summer and early fall off Massachusetts) were clearly associated with lower risk for multiple focal species, including critically endangered North Atlantic right whales. This assessment provides a clear management strategy that might have initially been presumed for one or a few species but can now be extended to a suite of species. Logical associated mitigation measures to reduce potential risk of disturbance may be to employ seasonal mitigation measures. For seasonally occurring species, this can be accomplished by conducting the activity during times of year when key species are at their lowest rates of occurrence. For resident species, however, this may be more challenging given they may have little ability to move to alternative habitats (Forney et al., 2017). The framework enables the assessment of which are at greater relative risk for different periods and a relativistic comparison of the efficacy of certain mitigation approaches, such as targeting a window of activity to avoid a certain important species. Where approaches are selected to minimize risk to selected species, they may result in increased risk for other species although in a transparent manner that would identify mitigation approaches tailored to those other species.
Similar messages emerged relative to the potential concentration of installation periods. While it may not be possible or common for multiple monopiles to be installed on the same day, this would likely require low-visibility and/or nighttime piling. The mitigation and monitoring requirements for such operations notwithstanding, we evaluated potential risk differences between driving a single versus two piles a day and differences between variable amounts of temporal overlap for multiple windfarm installations. While additional consideration of other mitigation and practicality considerations are required, the risk assessment conducted for the contexts considered here clearly suggests that there could be conservation benefits (i.e., lower risk) by strategically concentrating potential disturbance activities into shorter periods, particularly during seasons when key species are relatively scarce (see Figure 2).
We acknowledge that there are limitations to the overall approach presented here. Firstly, it is only as applicable and reliable as the underlying data. The fundamental spatial, temporal. and spectral nature of the underlying model, intersecting these features with potential disturbance, requires as much detailed information on the spatial and temporal distribution and density of protected species, characteristics of their sound production and reception characteristics, and the behavioral ecological context as possible. Such data are continuously increasing and improving but remain limited in many areas and are also rapidly changing due to changes in ocean climate. Additional details on operational aspects of offshore wind energy facilities (e.g., service vessel types and modes of operations) are needed in subsequent analyses, as are potential ecological and physical interactions with offshore facilities. It should also be clearly noted that, given the ‘tuning’ required for application in different contexts, this framework is intended to provide relative risk assessment within the scenario, area, and species considered rather than an absolute assessment of impact that could be compared to a dissimilar context or species group. Finally, we acknowledge that subjective aspects of the framework remain. Substantial progress was made for instance in the quantitative methods for the calculation of the auditory masking factor from earlier iterations of the framework. Yet key aspects of the vulnerability rating (e.g., species habitat factor) still do and likely will continue to require expert-elicitation and assessment, including the possible assignment of scores where uncertainty is high.
In summary, the framework offers a structured, straightforward means of assessing relative risk due to anthropogenic sound generating activities for many possible scenarios. It provides resource managers an objective decision-making tool to strategically assess relative biological risk and overall negative impact at a regional marine species population level. It is intended to provide a systematic method by which to evaluate relative risks from different operational scenarios using common, broad assumptions across space, time, and differing levels of received sounds. Further developments and adaptations of this risk assessment paradigm are needed to advance its applicability and generalizability. Further quantitative metrics for additional aspects of species-specific vulnerability are needed, including more explicit metrics for temporal aspects of habitat use and more consistent measures of other environmental stressors. Further clarification is also needed on the extent to which species vulnerability might change over time when considering scoring criteria for other stressors (e.g., future noise effects, changes in habitat utilization, food chain disruption, potential beneficial aspects (e.g., reef effects)). Another substantial opportunity to improve the process relates to the integration of dynamic environmental covariates (e.g., concentrating oceanographic conditions, prey layers) that could result in more heterogeneous distribution of key species than may be reflected in density databases. This could allow scenario testing of dynamic variables using ecosystem model forecasts. Further efforts to quantify uncertainty in key parameters could include developing quantitative means of assessing certainty/quality of underlying density data within areas of operations in order to put potential error bounds on exposure index calculations (i.e., risk) and to derive uncertainty around exposure index point estimates. Finally, refined methods to partition risk rating breakpoints could be evaluated, to possibly move beyond discrete risk categories (lowest, lower, moderate, high, and higher) so as to develop risk as a continuous variable. Recent and future policy changes are driving intensive offshore wind developments, while conventional energy developments continue. We believe this early-stage, multi-species relativistic risk assessment framework can play a useful role in strategic ocean planning needed by resource managers and industry action proponents.
Data availability statement
The original contributions presented in the study are included in the article/Supplementary Material. Further inquiries can be directed to the corresponding author.
Author contributions
BS: Conceptualization, Methodology, Formal Analysis, Investigation, Writing – original draft, Writing – Review and Editing, Visualization, Supervision, Project Administration, Funding Acquisition. DT: Conceptualization, Methodology, Formal Analysis, Investigation, Writing – Review and Editing, Visualization. JA: Conceptualization, Methodology, Formal Analysis, Investigation, Writing – Review and Editing, Visualization. CC: Conceptualization, Methodology, Formal Analysis, Investigation, Writing – Review and Editing. WE: Conceptualization, Methodology, Formal Analysis, Investigation, Writing – Review and Editing, Supervision. All authors contributed to the article and approved the submitted version.
Funding
The development of this article was supported under award 140M0120C0007 by the Bureau of Ocean Energy Management (BOEM). The funder was not involved in the study design, collection, analysis, interpretation of data, the writing of this article or the decision to submit it for publication.
Acknowledgments
We acknowledge the support provided by a number of colleagues who substantially contributed to this effort, including Stan Laback, Jill Lewandosky, Erica Staaterman, Louis Brzuzy, Koen Bröker, Cynthia Pyc, David Mann, Adam Frankel, Kathy Vigness-Rapossa, Jason Wood, Dmitri Ponirakis, Jolie Harrison, Ben Laws, and Shane Guan.
Conflict of interest
Author BS was and is employed by Southall Environmental Associates, Inc. Author DT was and is employed by Sea Mammal Research Unit, Consulting. Authors JA, CC, and WE were and are employed by Marine Acoustics, Inc.
The remaining authors declare that the research was conducted in the absence of any commercial or financial relationships that could be construed as a potential conflict of interest.
Publisher’s note
All claims expressed in this article are solely those of the authors and do not necessarily represent those of their affiliated organizations, or those of the publisher, the editors and the reviewers. Any product that may be evaluated in this article, or claim that may be made by its manufacturer, is not guaranteed or endorsed by the publisher.
Supplementary material
The Supplementary Material for this article can be found online at: https://www.frontiersin.org/articles/10.3389/fmars.2023.1090132/full#supplementary-material
References
Abate R. S. (2010). NEPA, national security, and ocean noise: the past, present, and future of regulating the impact of navy sonar on marine mammals. J. Int. Wildlife Law Policy 13 (4), 326–356. doi: 10.1080/13880292.2010.524588
Adams J., Kelsey E. C., Felis J. J., Pereksta D. M. (2017). Collision and displacement vulnerability among marine birds of the California current system associated with offshore wind energy infrastructure (Reston, VA: U.S. Geological Survey), 116. doi: 10.3133/ofr20161154
Albouy C., Delattre V., Donati G., Frölicher T. L., Albouy-Boyer S., Rufino M., et al. (2020). Global vulnerability of marine mammals to global warming. Sci. Rep. 10 (1), 1–12. doi: 10.1038/s41598-019-57280-3
Booth C. G., Sinclair R. R., Harwood J. (2020). Methods for monitoring for the population consequences of disturbance in marine mammals: a review. Front. Mar. Sci. 7, 115. doi: 10.3389/fmars.2020.00115
Carretta J. V., Delean B., Helker V., Muto M. M., Greenman J., Wilkinson K., et al. (2020). Sources of human-related injury and mortality for U.S. pacific West coast marine mammal stock assessment-2018. NOAA Tech. Memorandum 631, 147. doi: 10.25923/j73c-6q78
Chou E., Southall B. L., Robards M., Rosenbaum H. C. (2021). International policy, recommendations, actions and mitigation efforts of anthropogenic underwater noise. Ocean Coast. Manage. 202, 105427. doi: 10.1016/j.ocecoaman.2020.105427
Costa D. P., Schwarz L., Robinson P., Schick R. S., Morris P. A., Condit R., et al (2016). A bioenergetics approach to understanding the population consequences of disturbance: elephant seals as a model system. In The effects of noise on aquatic life II (pp. 161–169). Springer New York.
Ellison W. T., Clark C. W., Mann D. A., Southall B., Tollit D. J. (2015). “A risk assessment framework to assess the biological significance of noise exposure on marine mammals,” in 21st Biennial Conference on the Biology of Marine Mammals, San Francisco, CA, USA, 13-18 December.
Ellison W. T., Racca R., Clark C. W., Streever B., Frankel A. S., Fleishman E., et al. (2016). Modeling the aggregated exposure and responses of bowhead whales balaena mysticetus to multiple sources of anthropogenic underwater sound. Endangered Species Res. 30, 95–108. doi: 10.3354/esr00727
Ellison W. T., Southall B. L., Clark C. W., Frankel A. F. (2012). A new context-based approach to assess marine mammal behavioral responses to anthropogenic sounds. Conserv. Biol. 26, 21–28. doi: 10.1111/j.1523-1739.2011.01803.x
Ellison W. T., Southall B. L., Frankel A. S., Vigness-Raposa K., Clark. C. (2018). An acoustic scene perspective on spatial, temporal, and spectral aspects of marine mammal behavioral response to noise. Aquat. Mammals 44, 239–243. doi: 10.1578/AM.44.3.2019.239
Erbe C., Dent M. L., Gannon W. L., McCauley R. D., Römer H., Southall B. L., et al. (2022). “The effects of noise on animals,” in Exploring animal behavior through sound, vol. 1 . Eds. Erbe C., Thomas J. A., 459–506. doi: 10.1007/978-3-030-97540-1_13
Erbe C., Dunlop R., Dolman S. (2018). “Effects of noise on marine mammals,” in Effects of anthropogenic noise on animals (New York, NY: Springer), 277–309.
Estabrook B. J., Tielens J. T., Rahaman A., Ponirakis D. W., Clark C. W., Rice A. N. (2022). Dynamic spatiotemporal acoustic occurrence of north Atlantic right whales in the offshore Rhode island and Massachusetts wind energy areas. Endangered Species Res. 49, 115–133. doi: 10.3354/esr01206
European Commission (EC) (2008). Marine strategy framework directive (MSFD) 2008/56/EC, descriptor 11, energy including underwater noise.
European Food Safety Authority (2014). Guidance on expert knowledge elicitation in food and feed safety risk assessment. EFSA J. 12 (6), 3734. doi: 10.2903/j.efsa.2014.3734
Forney K. A., Southall B. L., Slooten E., Dawson S., Read A. J., Baird R. W., et al. (2017). Nowhere to go: noise impact assessments for marine mammal populations with high site fidelity. Endangered species Res. 32, 391–413. doi: 10.3354/esr00820
Gordon J., Gillespie D., Potter J., Frantzis A., Simmonds M. P., Swift R., et al. (2003). A review of the effects of seismic surveys on marine mammals. Mar. Technol. Soc. J. 37 (4), 16–34. doi: 10.4031/002533203787536998
High Energy Seismic Survey (HESS) (1999). High energy seismic survey review process and interim operational guidelines for marine survey offshore southern california. camarillo, California: High energy seismic survey team for California state lands commission and U.S Vol. 39 (Reston, VA: Mineral Management Service).
Johnson J. E., Welch D. J. (2016). Climate change implications for Torres strait fisheries: assessing vulnerability to inform adaptation. Climatic Change 135 (3), 611–624. doi: 10.1007/s10584-015-1583-z
King S. L., Schick R. S., Donovan C., Booth C. G., Burgman M., Thomas L., et al. (2015). An interim framework for assessing the population consequences of disturbance. Methods Ecol. Evol. 6 (10), 1150–1158. doi: 10.1111/2041-210X.12411
Knowlton A. R., Hamilton P. K., Marx M. K., Pettis H. M., Kraus S. D. (2012). Monitoring north Atlantic right whale eubalaena glacialis entanglement rates: A 30 year retrospective. Mar. Ecol. Prog. Ser. 466, 293–302. doi: 10.3354/meps09923
Kraus S. D., Kenney R. D., Mayo C. A., McLellan W. A., Moore M. J., Nowacek D. P. (2016). Recent scientific publications cast doubt on north Atlantic right whale future. Front. Mar. Sci. 3, 137. doi: 10.3389/fmars.2016.00137
Malme C. I., Miles P. R., Clark C. W., Tyack P. L., Bird J. E. (1984). Investigations of the potential effects of underwater noise from petroleum industry activities on migrating gray whale behavior, phase II., bolt, beranek and Newman: var.
Morrison W. E., Nelson M. W., Howard J. F., Teeters E. J., Hare J. A., Griffis R. B., et al. (2015). Methodology for assessing the vulnerability of marine fish and shellfish species to a changing climate. U.S. Department of Commerce - NOAA. NOAA Technical Memorandum NMFS-OSF-3, 48p. doi: 10.7289/V54X55TC
National Academies of Sciences and Medicine (NAS) (2017). “Approaches to understanding the cumulative effects of stressors on marine mammals,” (Washington DC: The National Academies Press).
National Marine Fisheries Service (NMFS) (2016). Technical guidance for assessing the effects of anthropogenic sound on marine mammal hearing: Underwater acoustic thresholds for onset of permanent and temporary threshold shifts (Silver Spring, MD: US Department of Commerce, NOAA), 178.
National Research Council (NRC) (2005). “Marine mammal populations and ocean noise: Determining when noise causes biologically significant events,” (Washington, DC: The National Academies Press).
New L., Lusseau D., Harcourt R. (2020). Dolphins and boats: when is a disturbance, disturbing?. Frontiers in Marine Science 7, 353.
Norman S., Huggins J. L., Lambourn D. M., Rhodes L. D., Garner M. M., Bolton J., et al. (2022). Risk factor determination and qualitative risk assessment of mucormycosis in harbor porpoise, an emergent fungal disease in salish Sea marine mammals. Front. Mar. Sci. 1420. doi: 10.3389/fmars.2022.962857
Nowacek D. P., Clark C. W., Mann D., Miller P. J., Rosenbaum H. C., Golden J. S., et al. (2015). Marine seismic surveys and ocean noise: time for coordinated and prudent planning. Front. Ecol. Environ. 13 (7), 378–386. doi: 10.1890/130286
Nowacek D. P., Southall B. L. (2016). “Effective planning strategies for managing environmental risk associated with geophysical and other imaging surveys,” in International union for the conservation of nature (IUCN)(Gland, Switzerland: International Union for the Conservation of Nature (IUCN)), 42.
Pirotta E., Booth C., Cade D. E., Calambokidis J., Costa D. P., Fahlbusch J. A., et al. (2021). Context-dependent variability in the predicted daily energetic costs of disturbance in blue whales. Conserv. Physiol., coaa137. doi: 10.1093/conphys/coaa137
Pirotta E., Booth C. G., Calambokidis J., Costa D. P., Fahlbusch J. A., Friedlaender A. S., et al. (2022b). From individual responses to population effects: Integrating a decade of multidisciplinary research on blue whales and sonar. Anim. Conserv., 1367–9430. doi: 10.1111/acv.12785
Pirotta E., Booth C. G., Costa D. P., Fleishman E., Kraus S. D., Lusseau D., et al. (2018). Understanding the population consequences of disturbance. Ecol. Evol. 8 (19), 9934–9946. doi: 10.1002/ece3.4458
Pirotta E., Merchant N. D., Thompson P. M., Barton T. R., Lusseau D. (2015). Quantifying the effect of boat disturbance on bottlenose dolphin foraging activity. Biol. Conserv. 181, 82–89. doi: 10.1016/j.biocon.2014.11.003
Pirotta E., Thomas L., Costa D. P., Hall A. J., Harris C. M., Harwood J., et al. (2022a). Understanding the combined effects of multiple stressors: A new perspective on a longstanding challenge. Sci. Total Environ., 153322. doi: 10.1016/j.scitotenv.2022.153322
Roberts J. J., Schick R. S., Halpin P. N. (2020). “Final project report: Marine species density data gap assessments and update for the AFTT study area 2018-2020 (Option year 3),” in Document version 1.4. report prepared for naval facilities engineering command, Atlantic (Durham, NC: Duke University Marine Geospatial Ecology Lab).
Rockwood R. C., Calambokidis J., Jahncke J. (2017). High mortality of blue, humpback and fin whales from modeling of vessel collisions on the US West coast suggests population impacts and insufficient protection. PloS One 12 (8), e0183052. doi: 10.1371/journal.pone.0183052
Sethi S. A. (2010). Risk management for fisheries. Fish Fisheries 11 (4), 341–365. doi: 10.1111/j.1467-2979.2010.00363.x
Southall B. L. (2017). “Noise,” in Encyclopedia of marine mammals, 3rd Edition. Eds. Würsig B., Thiewesson H. (New York: Academic Press), 699–707.
Southall B. L. (2021). Evolutions in marine mammal noise exposure criteria. Acoustics Today 17 (2), 52–60. doi: 10.1121/AT.2021.17.2.52
Southall B. L., Amaral J., Clark C. W., Ellison W., Joy R., Tollit D., et al. (2018). “A risk assessment framework to evaluate the potential relative effects of noise on marine mammals,” in 6th conference on the effects of sound on marine mammal(Den Haag, Netherlands), 10–14.
Southall B. L., Bowles A. E., Ellison W. T., Finneran J. J., Gentry R. L., Greene C. R. Jr., et al. (2007). Marine mammal noise exposure criteria: initial scientific recommendations. Aquat. Mammals 33, 411–521. doi: 10.1578/AM.33.4.2007.411
Southall B. L., DeRuiter S. L., Friedlaender A., Stimpert A. K., Goldbogen J. A., Hazen E., et al. (2019b). Behavioral responses of individual blue whales (Balaenoptera musculus) to mid-frequency military sonar. J. Exp. Biol. 222, jeb190637. doi: 10.1242/jeb.190637
Southall B., Ellison W., Clark C., Tollit D. (2019c). Aggregate (chronic) noise exposure risk assessment report (task 5, part 1) (Aptos (CA: US Department of the Interior, Bureau of Ocean Energy Management), . 66.
Southall B., Ellison W., Clark C., Tollit D., Amaral J. (2021b). “Marine mammal risk assessment for gulf of Mexico G&G activities,” (Sterling (VA: US Department of the Interior, Bureau of Ocean Energy Management), 99.
Southall B., Ellison W., Clark C., Tollit D., Amaral J. (2021c). Marine mammal risk assessment for new England offshore windfarm construction and operational scenarios (Sterling (VA: US Department of the Interior, Bureau of Ocean Energy Management), 94.
Southall B. L., Finneran J. J., Reichmuth C., Nachtigall P. E., Ketten D. R., Bowles A. E., et al. (2019a). Marine mammal noise exposure criteria: Updated scientific recommendations for residual hearing effects. Aquat. Mammals 45, 125–232. doi: 10.1578/AM.45.2.2019.125
Southall B. L., Nowacek D. P., Bowles A. E., Senigaglia V., Bejder L., Tyack P. L. (2021a). Marine mammal noise exposure criteria: Assessing the severity of marine mammal behavioral responses to human noise. Aquat. Mammals 47 (5), 421–464. doi: 10.1578/AM.47.5.2021.421
Thomson M. D. J., Binder C. M. (2021). Recalibrating the department of national defence approach to active sonar impact management. Mar. pollut. Bull. 173, 113044. doi: 10.1016/j.marpolbul.2021.113044
Wade P. R. (1998). Calculating limits to the allowable human-caused mortality of cetaceans and pinnipeds. Mar. Mammal Sci. 14, 1–37. doi: 10.1111/j.1748-7692.1998.tb00688.x
Weilgart L. (2019). “Keeping the noise down: Approaches to the mitigation and regulation of human-caused ocean noise,” in The future of ocean governance and capacity development (Brill Nijhoff), 298–302.
Williams R., Ashe E., Blight L., Jasny M., Nowlan L. (2014). Marine mammals and ocean noise: future directions and information needs with respect to science, policy and law in Canada. Mar. pollut. Bull. 86 (1-2), 29–38. doi: 10.1016/j.marpolbul.2014.05.056
Williams R., Cholewiak D., Clark C. W., Erbe C., George J. C. C., Lacy R. C., et al. (2020). Chronic ocean noise and cetacean population models. J. Cetacean Res. Manage. 21, 85–94. doi: 10.47536/jcrm.v21i1.202
Williams R., Erbe C., Ashe E., Clark C. W. (2015b). Quiet(er) marine protected areas. Mar. pollut. Bull. 100(1), 154–161. doi: 10.1016/j.marpolbul.2015.09.012
Williams R., Wright A. J., Ashe E., Blight L. K., Bruintjes R., Canessa R., et al. (2015a). Impacts of anthropogenic noise on marine life: Publication patterns, new discoveries, and future directions in research and management. Ocean Coast. Manage. 115, 17–24. doi: 10.1016/j.ocecoaman.2015.05.021
Keywords: marine mammals, noise, conservation, risk assessment, management, disturbance
Citation: Southall BL, Tollit D, Amaral J, Clark CW and Ellison WT (2023) Managing human activity and marine mammals: A biologically based, relativistic risk assessment framework. Front. Mar. Sci. 10:1090132. doi: 10.3389/fmars.2023.1090132
Received: 04 November 2022; Accepted: 03 February 2023;
Published: 27 February 2023.
Edited by:
Xiaomei Xu, Xiamen University, ChinaReviewed by:
Daniela Silvia Pace, Sapienza University of Rome, ItalyElena Bianca Papale, Department of Earth System Sciences and Technologies for the Environment (CNR), Italy
Copyright © 2023 Southall, Tollit, Amaral, Clark and Ellison. This is an open-access article distributed under the terms of the Creative Commons Attribution License (CC BY). The use, distribution or reproduction in other forums is permitted, provided the original author(s) and the copyright owner(s) are credited and that the original publication in this journal is cited, in accordance with accepted academic practice. No use, distribution or reproduction is permitted which does not comply with these terms.
*Correspondence: Brandon L. Southall, QnJhbmRvbi5Tb3V0aGFsbEBzZWEtaW5jLm5ldA==