 Masoumeh Hashempour
 Morteza Kolahdoozan
- Department of Civil and Environmental Engineering, Amirkabir University of Technology, Tehran, Iran
Climate changes and sediment discharge within the oceans trigger many problems, such as coastline erosion and coral reef extinction hazards. Therefore, it is crucial to control wave hydrodynamics in the desired manner to protect marine environments. To prevent the promotion of sedimentation, nature has its response. The tubular sponge is a marvelous animal. It has a perforated body and sucks nutrition and water from these perforations; then, it pumps the undigested materials out from the top outlet. In the current study, an apparatus inspired by natural tubular sponges (synthetic sponges) was designed. The computational fluid dynamics derived from the Reynolds-averaged Navier-Stokes equations and image processing technique (surfaceLIC) was deployed to study how the synthetic sponge affects the wave hydrodynamics. The results revealed that the suction of the body and outflow shielding phenomenon of one sponge reduces the wave transmission by up to ≈7%. In addition, the swing motion of the jet by wave train and effluent cloud generation causes the shear on the sponge. Therefore, the momentum exchange enhances through the water column (≈46% increase of turbulent kinetic energy). It is similar to the swing behavior of flexible vegetation. Furthermore, the surfaceLIC result revealed that the effluent cloud shape changes to a pear shape, symmetric, stretched (transition), and asymmetric by increasing the pumping discharge to 600 L/h. Observing the chute–jet phenomenon by surfaceLIC also proved the diffraction and creation of a low-velocity zone in the shadow region, which is proof of a breaking wave due to the sponge’s suction/pumping and perforated body. Consequently, it can be concluded that a synthetic sponge can act as both rigid and flexible vegetation. The synthetic sponge is anticipated to mitigate sedimentation by creating unique vortices, circulating flow, and its body shape.
1 Introduction
Coral reefs cover a 250,000-km2 area of oceans (Woodroffe and Webster, 2014). They mainly exist in shallow waters and near the coasts (Liu et al., 2021). About 850 million people live near to 100 km of coral reefs’ residence. This leads to an evitable human interaction and an alive ecosystem (Burke et al., 2011). People need coral reefs for fishing, hunting pearls, and excavating oil or petroleum components (Edinger et al., 2007). Based on the study by Burke et al. (2011), by the 2030s, more than 90% of the world’s reefs will be threatened by local human activities, i.e., coastal development (coastal engineering, landfilling, runoff from coastal construction, sewage discharge, and impacts from unsustainable tourism, etc.). Human activities enter and accumulate high amounts of pollutants and sediments through marine environments. When the sediment volume entering the ocean is high, the wave energy is insufficient to remove it. In addition, if long waves exist, coastal erosion will be promoted.
In Iran, Bushehr is an important commercial city near the Persian Gulf in the southwest of the country. The Assaluyeh and Kangaan areas in Bushehr Province have large amounts of oil and gas under exploitation (Supplementary Figure S1). The Assaluyeh–Kangaan coastline accommodates coral colonies damaged by civil operations (Dibajnia et al., 2012). In addition, the sedimentation/erosion phenomena provide many challenges in this zone. At Siraf located in Bushehr Province, coastline erosion is “at risk”. Global change and consequently the sea level rise and human activities influence the coastline erosion of Siraf Port (Khakzad et al., 2015; Pourkerman et al., 2018). In Bushehr Port, sedimentation through the access channels provides many problems for navigation. In this regard, a deposition rate of 300,000–900,000 m3/year was reported (Samsami et al., 2022). Thus, Bushehr needs more attention to prevent critical sedimentation/erosion and also to save the coral reefs against harmful damage. Accordingly, it is necessary to find a way to enhance the momentum transfer when an increase in pollutant/sediment accumulation occurs. To prevent coastal erosion, a similar device should be recommended.
Researchers developed numerical models to understand the flow hydrodynamics around various corals. It is believed that Pocillopora is more robust and denser than Montipora capitata coral. M. capitata also increases the velocity fluctuations and enhances the momentum transport through the water column (Hossain and Staples, 2020). The momentum exchange also varies with the surface/volume ratio and surface roughness. Increasing the surface/volume ratio positively affects the momentum exchange (Chindapol et al., 2013). The researchers also confirmed that the corals (e.g., Lophelia pertusa) change the von-Karman vortex street shape and consequently affect the flow characteristics. The corals’ physical shape and robustness directly influence the shedding pattern of von-Karman vortex street (Bartzke et al., 2021). Thus, the flow pattern downstream the corals is similar to the flow dynamics downstream a rigid cylinder (Chen et al., 2012; Kumar and Singh, 2020; Muddada et al., 2021; Sukarnoor et al., 2022). Nevertheless, they reduce the water velocity and consequently decrease the particle carrying capacity (Bartzke et al., 2021). Therefore, pollutant accumulation and sedimentation downstream the corals are inevitable.
Marine tubular sponges are marvelous. They are the oldest coral reef elements (Hill and Hill, 2009). They have a perforated body (ostia) that sucks the flow and nutrition and pumps the undigested food and pollutants into the water column via the upper mouth (osculum) (Kensleyt and Heard, 1991; Pawlik, 2011). The suction/pumping mechanism circulates the flow and cleans their residence (Pineda et al., 2017). This function is the key to the enigma of how sponges are preserved against harsh conditions.
Limited studies have focused on understanding the flow hydrodynamics around sponges. Falcucci et al. (2021) proved that the surface ridges of glass sponges suppress turbulence and significantly reduce drag. In this regard, the glass sponge preserves against flow conditions and enhances the vortical edifices. A study also showed that it is possible to simulate the pumping flow by considering the positive displacement for the collars of choanocytes. These units provide enough pressure to generate the pumping flow (Asadzadeh et al., 2019). However, a powerful modeling software may make modeling suction/pumping more effortless.
Simulating the flow around tubular sponges was not pursued in the current study. A simple perforated cylinder with a suction/pumping mechanism was designed to find a practical option to manage wave hydrodynamics, sedimentation/pollutant accumulation, and coastal erosions. The physical shape and the suction/pumping mechanism of the proposed design were inspired by natural tubular sponges. This idea is anticipated to be practical for enhancing momentum transfer in marine environments. In addition, due to its specific function and physical characteristics, it can be useful for reducing wave energy.
The Reynolds-averaged Navier-Stokes (RANS) numerical modeling was intended to help understand how changing the suction/pumping phenomenon influences wave hydrodynamics. Moreover, surfaceLIC, as an image processing technique, was utilized to discover the vortical patterns around the synthetic sponge. The details of the synthetic sponge and numerical scenarios will be discussed.
2 Species morphology and synthetic sponge
Aplysina fistularis is a hollow and perforated tubular sponge. The outer cluster diameter reaches 84 cm (Rickborn, 2010). Its body pores are in the micron range and often cannot be detected by the eyes (Machałowski et al., 2022). As explained, the flow is absorbed by the body pores (ostia) and pumped from the upper mouth (osculum) (Reiswig, 1975; Goldstein et al., 2019). The suction or pumping discharge depends on various parameters. Previous research proved that the suction/pumping discharge of the sponges is related to the time, water turbidity, volume of the sponge, water temperature, etc. (Strehlow et al., 2016; Morganti et al., 2019). The current study has focused on inspiring the physical shape and suction/pumping function of tubular sponges. The synthetic sponge has larger body pores which are regularly dispersed on the cylinder face. It also has a constant and stronger suction/pumping discharge in comparison with natural tubular sponges (Figure 1).
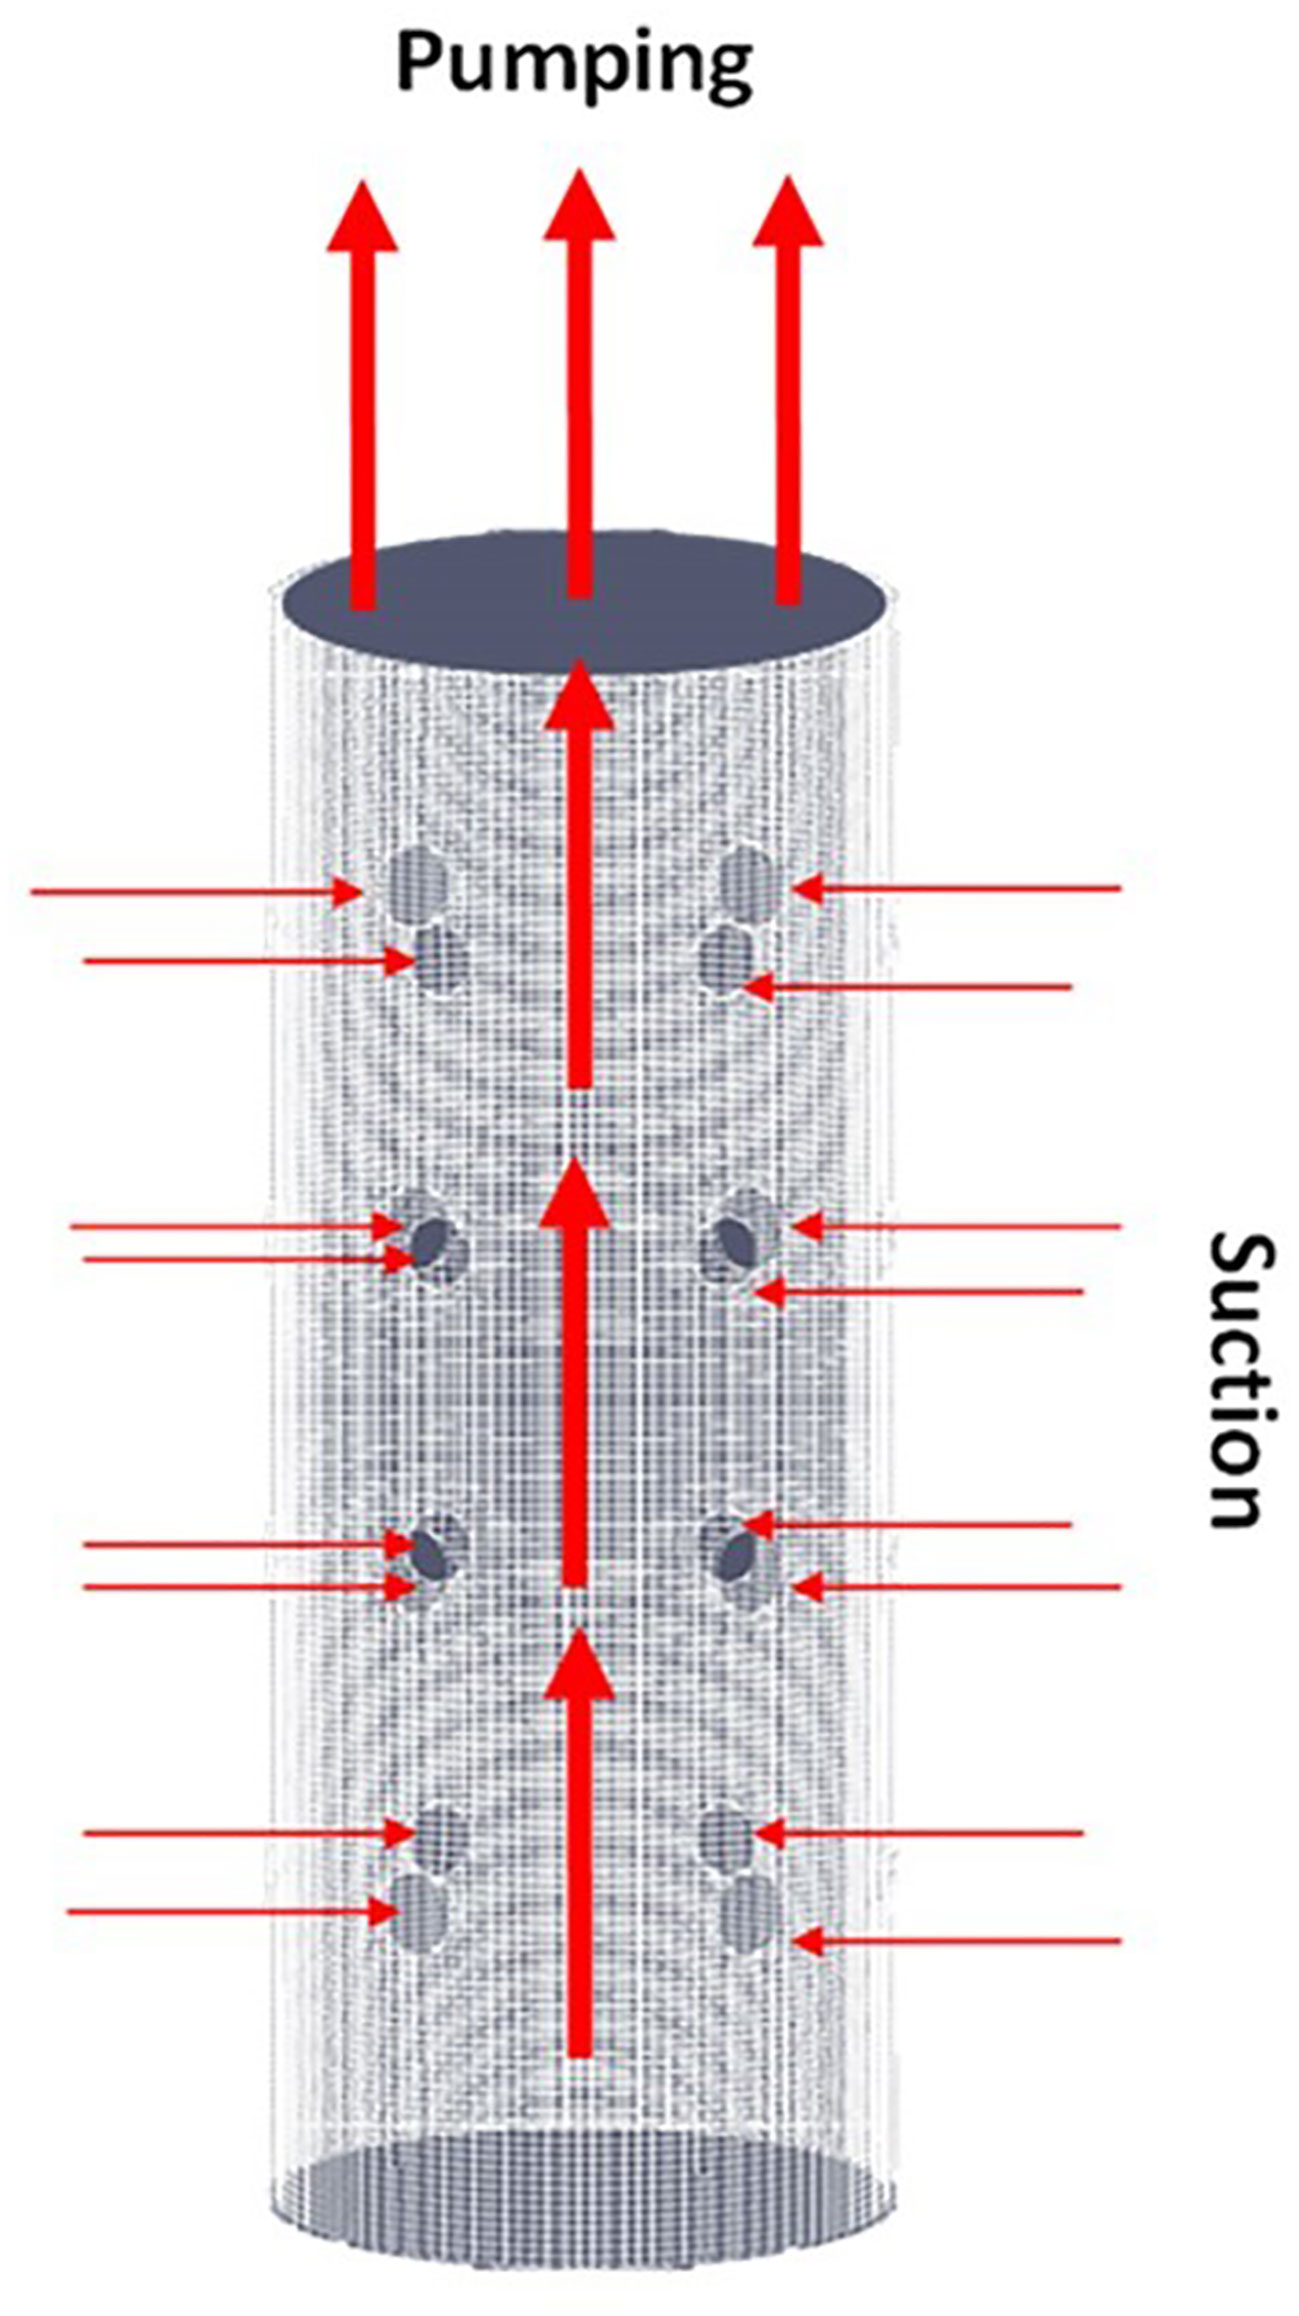
Figure 1 The inspired tubular sponge.
3 Computational methods and details
3.1 Governing equations and numerical solutions
To model the effects of the synthetic sponge on regular wave hydrodynamics, OpenFOAM® V.1812 was utilized. This computational fluid dynamics (CFD) package uses the finite volume method to model the problems (Meng and Zhang, 2016). In addition, the interFoam solver, which uses RANS equations and the volume of fluid (VOF) approach, was considered. Navier–Stokes solvers are reliable for wave–structure interactions (Elhanafi, 2016). The main equations (i.e., continuity and momentum equations) are as follows (Li et al., 2019):
where u is the fluid velocity, is gravitational acceleration, and is pressure. and are the viscous and turbulent stresses, respectively. and represent the surface tension and mixture density. The VOF will also be calculated from the following advection equation:
In Equation 3, acts as an index to show the water–air interface. Accordingly:
x, y, and z are the directions, and t represents time. For coupling pressure–velocity, the PIMPLE algorithm was used. The two-equation of K-omega shear stress transport was used to conquer the closure of Navier–Stokes. The details of this method can be found in the OpenFOAM manual (OpenFOAM Manual, 2022).
3.2 Model validation
3.2.1 Details of the experimental setup
To validate the numerical model, an experimental program was performed. In this regard, a synthetic sponge was designed with two perforated concentric cylinders (h = 20 cm) connected by elastic pipes. The cylinders were made with a galvanized plate to ensure a smooth surface. This can help to eliminate the effects of the wall roughness of the synthetic sponge on wave hydrodynamics. In addition, a conical flow transition was prepared to disperse the outflow jet through the water column. A submersible pump (with 300 L/h discharge) was used to simulate the suction/pumping mechanism. A fluorescent color test was also carried out to ensure the correct suction/pumping action. The body and pore diameters (D and P) of 10 and 0.8 cm, respectively, were considered. In total, 24 pores at 0.8 cm in diameter were regularly dispersed on the cylinder surface. It is also important to note that a power source was provided as the synthetic sponge’s electricity source. This is an ideal design of a synthetic sponge to facilitate the procedure of setting up a device in the laboratory. Nevertheless, the synthetic sponge’s height and body diameter were inspired by a natural sponge. Figure 2 illustrates the details of the synthetic sponge.
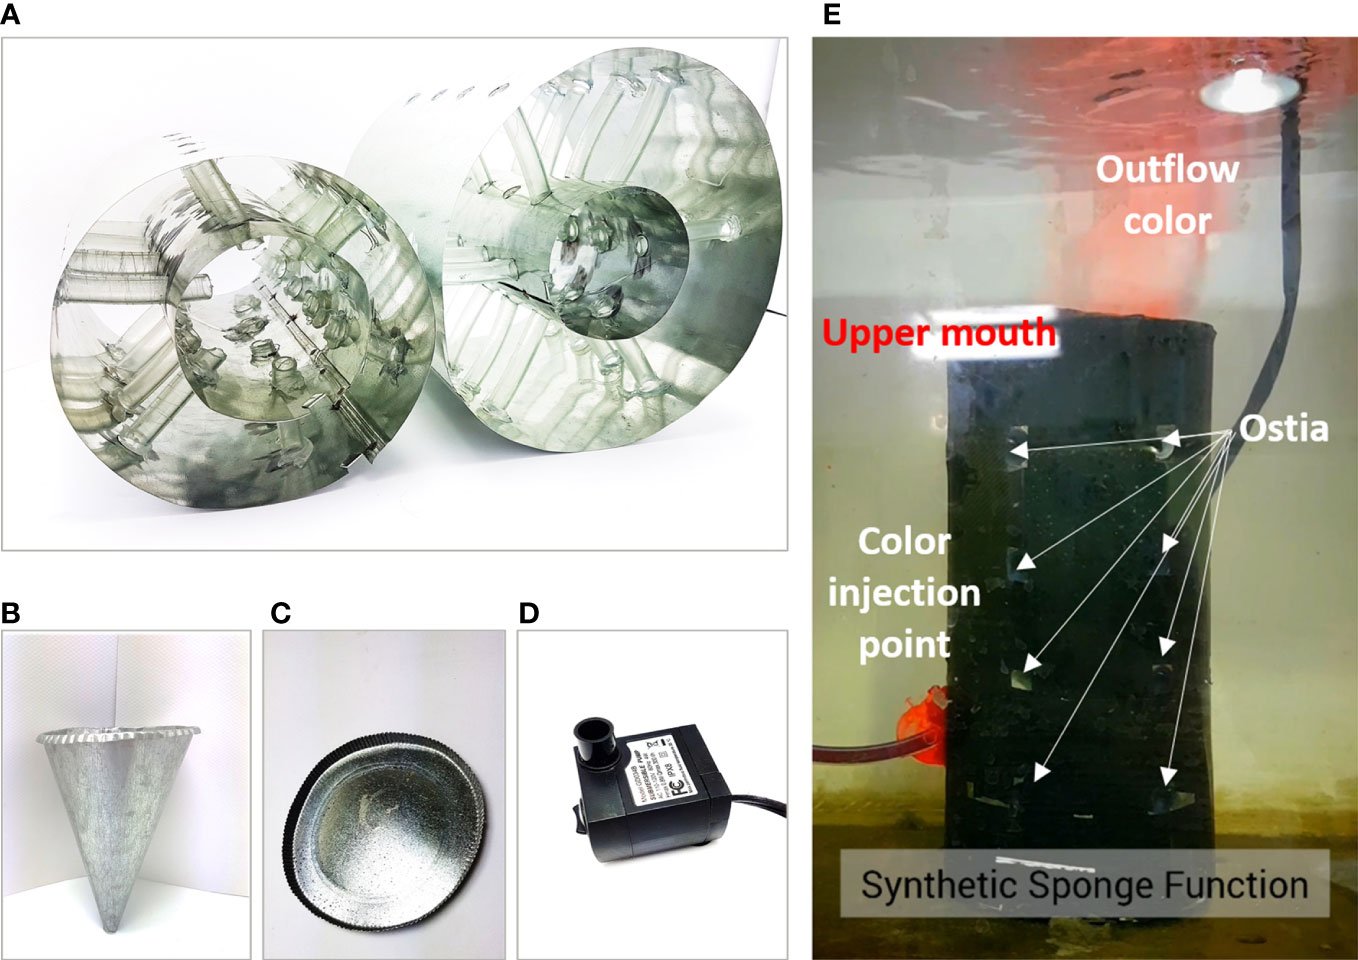
Figure 2 Various parts of the synthetic sponge device: (A) perforated cylinders, (B) conical flow transition, (C) bottom cover, (D) submersible pump, and (E) fluorescent color test.
It is essential to point out that since the synthetic sponge is inspired by tubular sponge functions and is not a physical model of a natural phenomenon, dynamic similarity was not carried out in this research study.
To generate a regular wave, a rectangular Plexiglas flume with a dimension of 12 × 0.3 × 0.4 m (length × width × height) was used. The wave height (H) and period (T) in the laboratory were scaled based on the significant wave in Bushehr Port in Iran. Bushehr’s significant wave height and period are within 0.3–2.96 m and 1.82–7.96 s, respectively. Thus, scaling wave height and period were based on Froude’s scaling low (White, 2009):
where Hm and Hp are the model and prototype wave height, respectively. Tm and Tp represent the model and prototype wave period, respectively. Moreover, α also denotes the scale factor. According to Berends (2021), the typical scale factor ranges from 1:30 to 1:100, which depends on the experimental flume, wave characteristics, and available resources. In the current study, by considering 1:30 as the scale factor, the wave height and period were achieved at 0.09 m and 1.3 s, respectively. It was regular, non-breaking, and generated by a flap-type wave maker.
The water depth was also 0.3 m. Three ultrasonic sensors (UC500) with 1-mm precision were placed at the top of the flume in three stations. These three sensors measured the water elevations. The first one was placed upstream of the sponge location with a wavelength distance (Figure 3). The second was placed at the sponge location, and the third was located downstream of the model at one wavelength distance. Based on previous research, considering one wavelength distance is necessary (Mansard and Funke, 1980). The velocity was measured by using an acoustic Doppler velocimeter (ADV), made by NORTEK (Vectrino Plus), in the three stations. The sampling rate was also 25 Hz (Bian et al., 2018). The recording time for each point was 60.0 s to ensure that the turbulence statistics became steady (Neumeier, 2007). The convergence was evaluated by the RMS of the mean longitudinal velocity. One example can be found in Supplementary Figure S2. To ensure high accuracy, ADV data were filtered based on a signal-to-noise ratio greater than 17 dB, and the mean correlation was greater than 70. Data sampling was carried out at five different depths in each station. The elevations were 6, 9, 12, 15, and 18 cm from the bed. It is worth pointing out that since the measurement is repeatable, the water elevation and velocity recording were done at different times to prevent equipment interference.
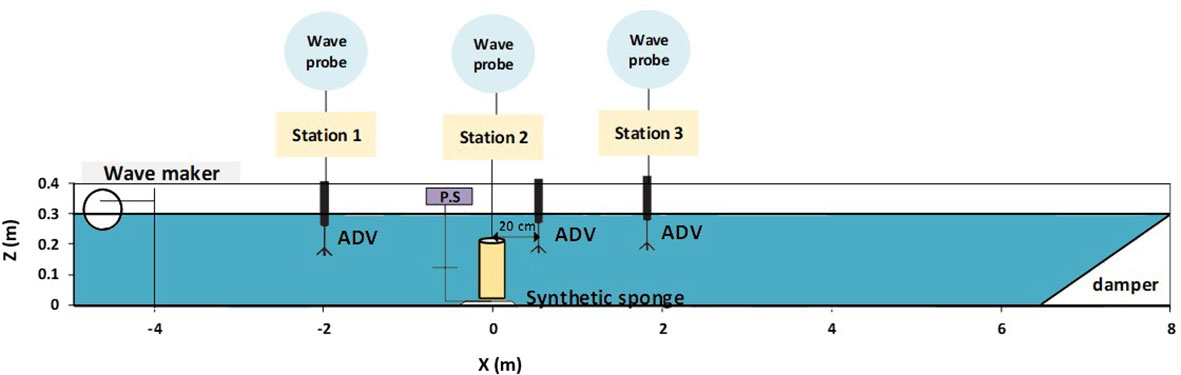
Figure 3 Schematic view of the experimental flume, ultrasonic sensors and acoustic Doppler velocimeter locations, wave maker, and sponge location.
3.2.2 Details of numerical modeling and validation
In this study, the channel has a 6 × 0.3 × 0.4-m (length × width × height) dimension (a 3D model was considered). The mesh dimensions were 15 × 6 × 1 mm in the x, y, and z directions, and these were chosen based on sensitivity analysis to ensure the independence of the results from the mesh sizes. The sponge was located 3.15 m from the inlet. Figure 4 displays the details of the modeling geometry.
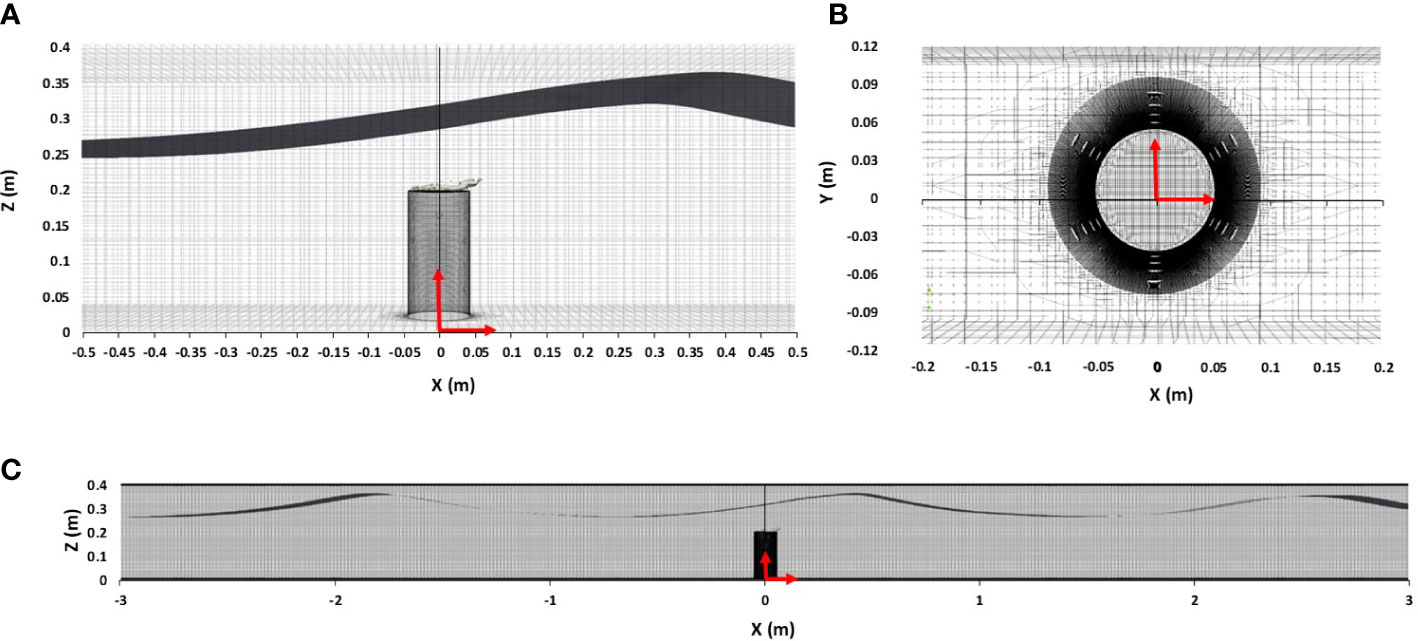
Figure 4 Geometry and mesh configuration of the simulation environment for numerical modeling (A). (B) Top view and (C) side view.
The sponge was designed by CATIA V5R21 software, and its meshes were generated by SnappyHexMesh. The sponge mesh was a hybrid of structure and unstructured forms. The outflow, as well as around the pores, had non-uniform, three-step refinements.
The body face had a uniform two-step refinement. The Courant number and total run time were 0.6 and 20 s, respectively. The velocity boundary conditions are also shown in Table 1. The modeled sponge was rigid to reduce the computational cost, and the suction/pumping function was applied as boundary conditions (Table 1). The comparison of measured and computed water elevation is presented in Figure 5.
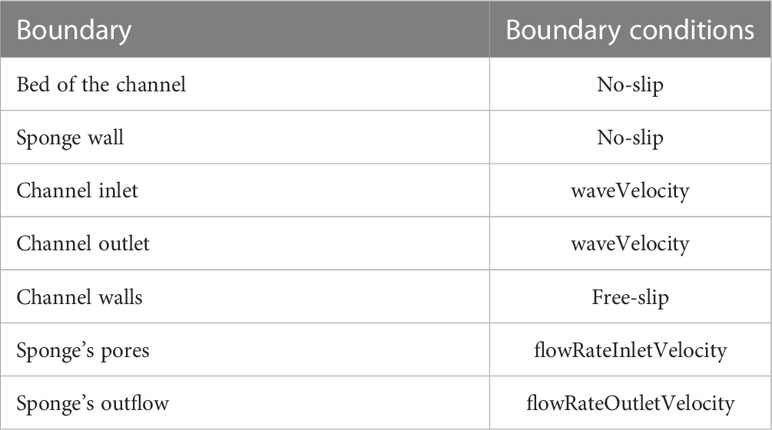
Table 1 Velocity boundary conditions.
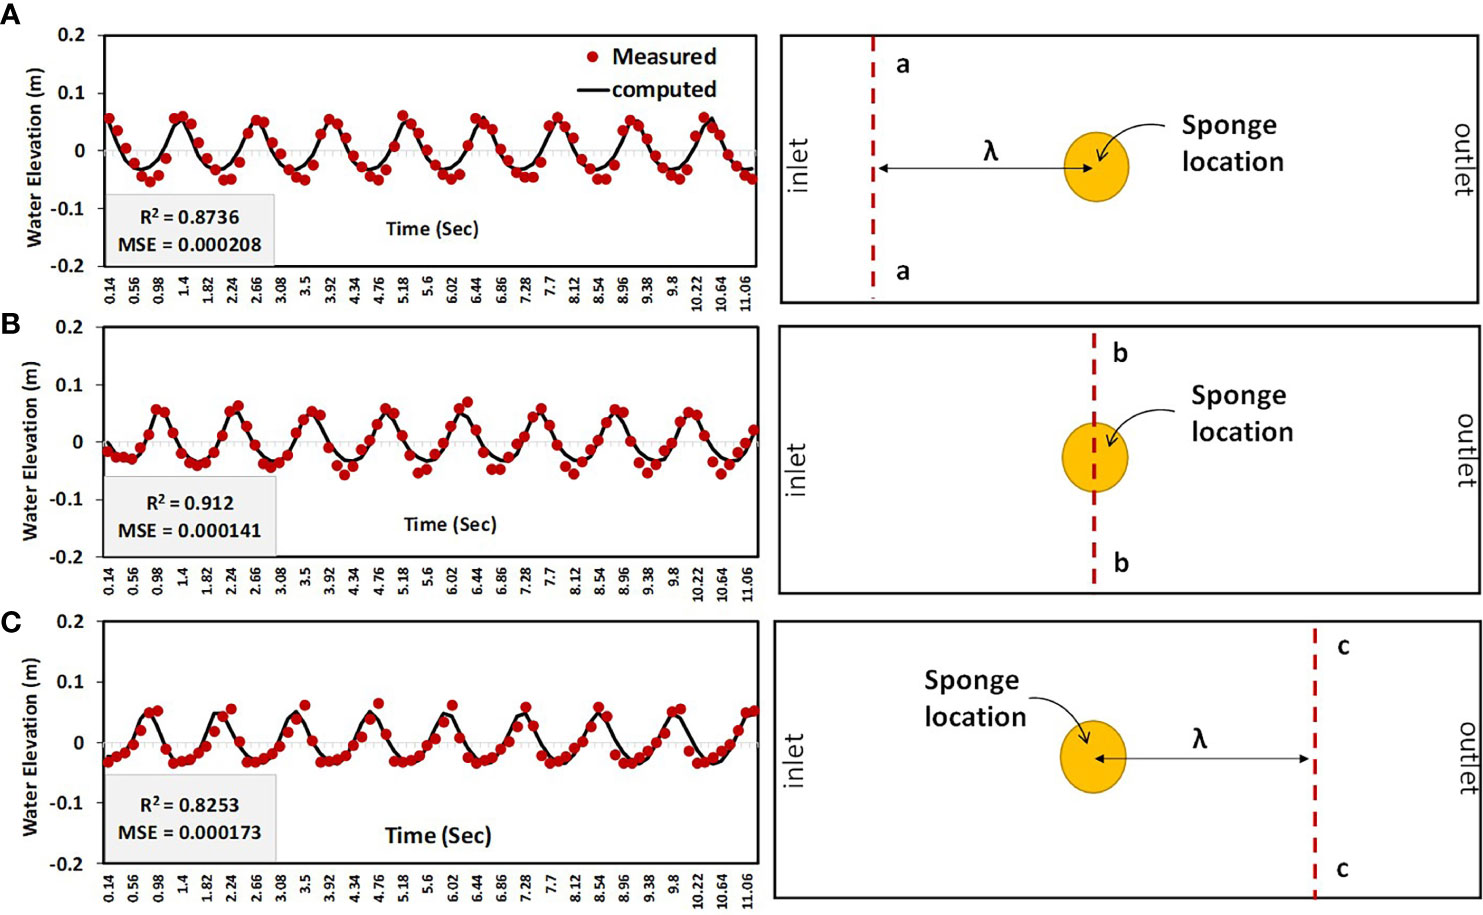
Figure 5 Comparison of measured and computed water elevation in (A) upstream station (a–a axis), (B) sponge station (b–b axis), and (C) downstream station (c–c axis).
The water elevation data were obtained from one wavelength distance from the sponge and in the sponge location. Figure 5 shows that the numerical model has an acceptable accuracy by a regression factor of over 0.82 and = 0.000173. A comparison of the magnitude of mean velocity in numerical modeling and experimental measurements was also attempted.
The ADV data was transformed from fluctuation velocity to time-averaged data in this regard. Three ADV stations were considered (Figure 3). In each station, five points through the water column were chosen as was done in the experimental program. A comparison of measured and computed velocities is presented in Figure 6. The validation results are over R2 = 0.8202 and = 0.94.
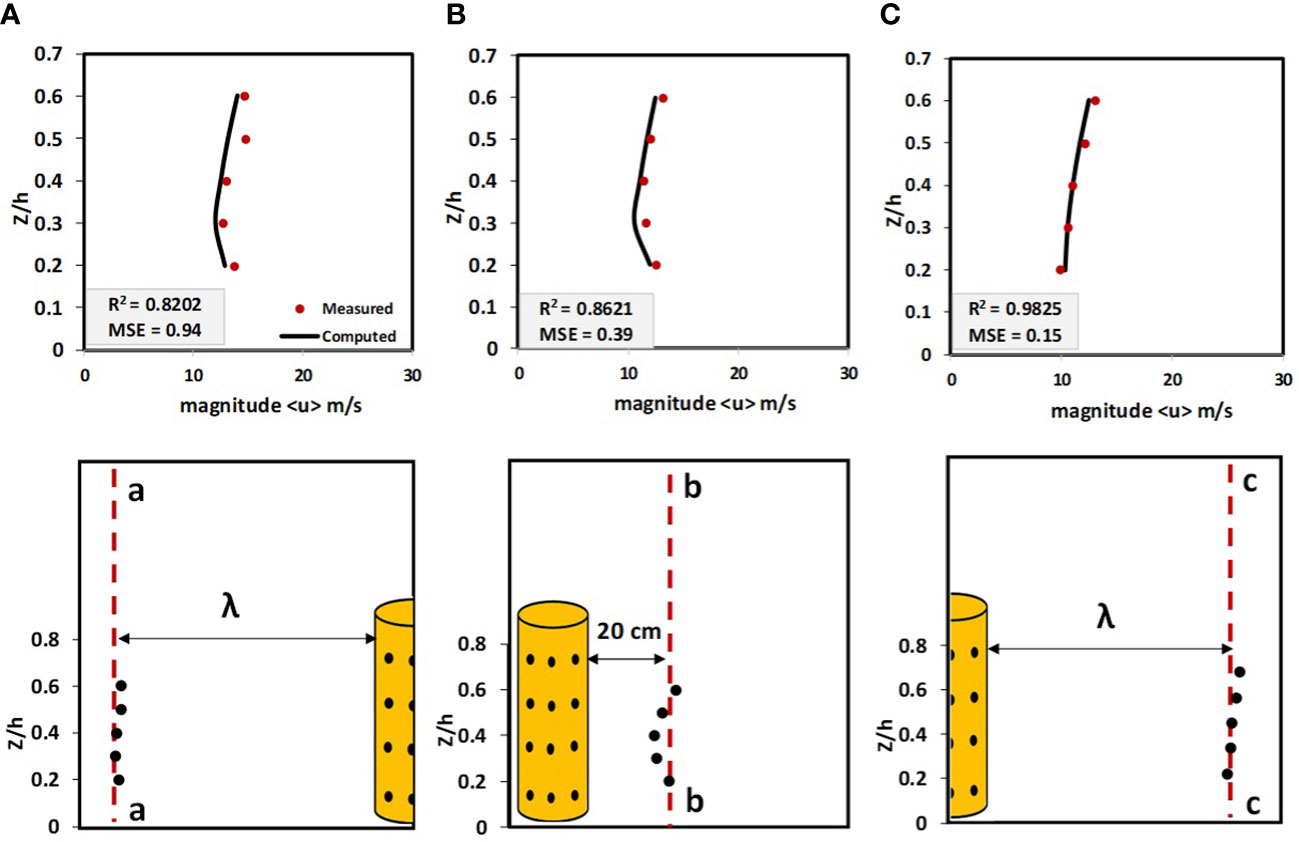
Figure 6 Comparison of measured and computed velocities in (A) upstream station (a–a axis), (B) sponge station (b–b axis), and (C) downstream station (c–c axis).
4 Model setup
Several scenarios were introduced to evaluate the effects of synthetic sponges’ suction/pumping discharge on regular wave hydrodynamics. In all scenarios, the physical shape of the sponge was constant. The sponge height (h), body (D), and pore diameter (P) measurements were equal to 20, 10, and 0.8 cm, respectively. In addition, 24 pores were dispersed regularly around the cylinder perimeter (the cumulative area of pores/lateral area of the cylinder was 0.0192). The wave also has the same conditions as the validation section. It should be pointed out that the scenarios were chosen based on the authors’ experience in how changing the suction/pumping discharge can affect the flow hydrodynamics. Moreover, the proposed ranges can be possible for setting up the device in the laboratory. Table 2 displays the details of the scenarios.
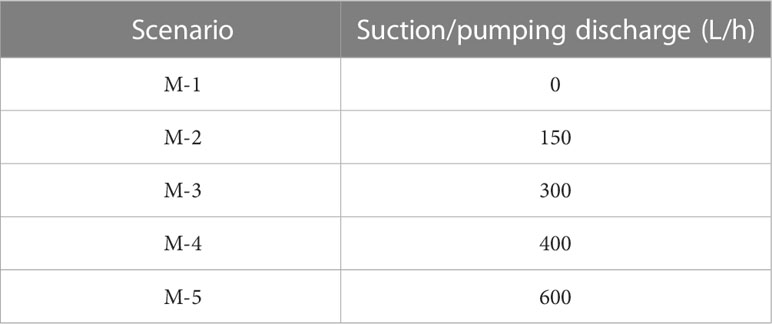
Table 2 Details of the scenarios.
5 Results and discussion
5.1 Transmission coefficient
Vegetations act as a barrier and dissipate wave energy, thus reducing the wave height (Dalrymple Robert et al., 1984; Van Veelen et al., 2020). The wave transmission coefficient () is introduced as the height of the transmitted wave () to the incident wave () (Dalrymple Robert et al., 1984):
In the current study, two stations were considered for computing the wave transmission coefficient. Station no. 1 was at X/D = 1, and station no. 2 was at X/D = 19.6 (Figure 7). From herein, X, Y, and Z represent the coordinates along the x, y, and z directions, respectively. The values for station numbers 1 and 2 for scenario M-1 were 0.92906 and 0.82946, respectively.
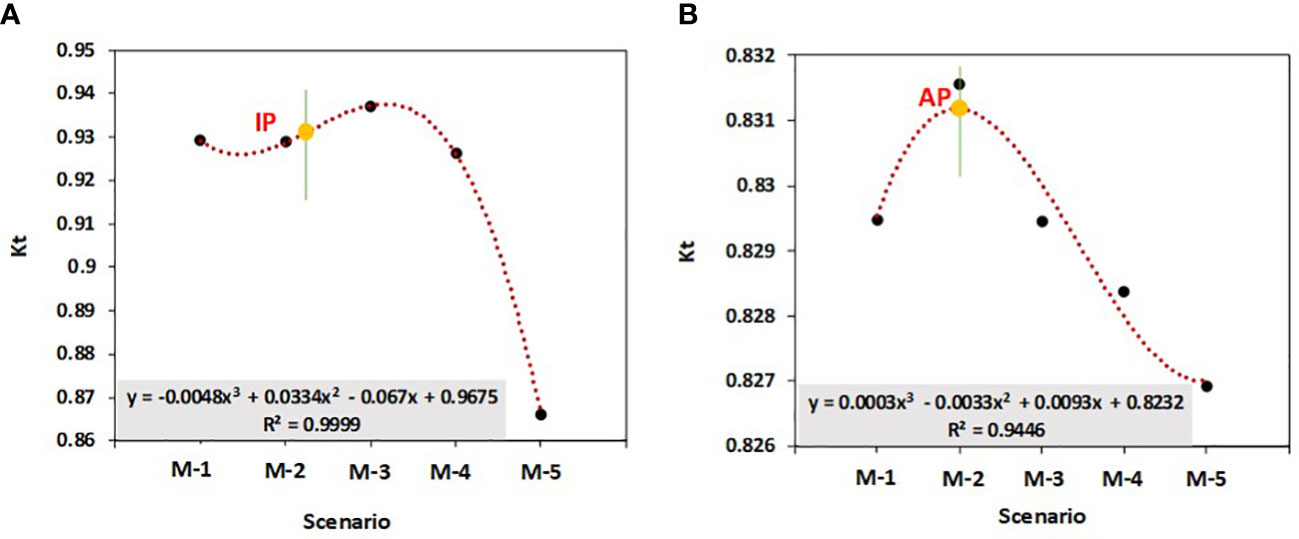
Figure 7 Wave transmission coefficient for different scenarios (IP stands for inflection point and AP also stands for apex point): (A) Station no. 1 and (B) station no. 2.
Transmission, reflection, and dissipation occur when a wave faces an obstacle. Forming the perforation area distribution around the cylinder can increase wave dissipation and reduce wave reflection (Chandrasekaran and Madhavi, 2016). However, in the current study, it was observed that the suction/pumping mechanism also influences the value (Figure 7).
The suction mainly causes the increase in wave dissipation and influences the wave height near the sponge location (herein station no.1), but pumping flow has a shielding effect on both stations. In this phenomenon, the front jet causes a reduction in the bending of the shielded jets in the channel (Xu et al., 2020). When a jet presents in front of a wave train, the shielding effect causes the reduction of wave velocity and height in the downstream. Therefore, the shielding phenomenon causes the reduction of the wave transmission coefficient. Figures 7A, B show a negative trend by increasing the suction/pumping discharge from 300 to 600 L/h. When the pumping discharge is low, the velocity differences between the wave and the jet are not prominent. Thus, the jet bends in the lower water elevation, and the wave crosses over it. However, increasing the pumping discharge causes the jet to bend at higher water elevations. This produces an extra wave-face area, which causes wave transmission reduction. At the moment, the increase in suction discharge causes more wave dissipation, so it can be observed that is proportional to a negative steep slope trend by increasing the suction/pumping discharge. The maximum reduction in the first station was for M-5 (with ≈7% more reduction than the M-1 scenario). In station no. 2, the difference between M-5 and M-1 drops to 0.31%, so the impacts of suction/pumping downstream become slight, the same as the vegetation patch effects (Koftis et al., 2013).
The results of a statistical analysis showed that a third-order polynomial could be fitted on at X/D = 1 for perforated cylinders with various suction/pumping discharges (Figure 7A). In station no. 1, an inflection point appears between scenarios M-2 and M-3. This point is proof of the behavior change. It is worth pointing out that the third-order polynomial fitting function and inflection point situation were evaluated by additional numerical scenarios. Nevertheless, herein only five selected scenarios were presented. In the M-2 scenario, the pumping phenomenon is not strong enough to cause shielding. In this regard, suction is the predominant phenomenon and causes wave dissipation. However, increasing the suction/pumping discharge to over 200 L/h causes the predomination of the outflow jet role. In this condition, for suction/pumping discharge = 300 L/h, the jet was dispersed by wave train and changed the flow hydrodynamics as proven by Nardin et al. (2013). A negative slope was achieved for suction/pumping discharge >300 L/h. This shows that the shielding effect emerges for scenarios M-4 and M-5.
In station no. 2 (Figure 7B), an apex point (AP) was found at suction/pumping discharge = 150 L/h. In this station, the suction has no significant influence on wave hydrodynamics. Thus, this apex is due to the effect of a weak outflow jet that enters the water column and enhances the wave transmission compared with the M-1 scenario. After this point, a negative slope (proof of shielding) appears like before.
The rigid vegetation is a coastal protection system (Van Veelen et al., 2020). The synthetic sponge also can have the same ability. The suction-and-pumping mechanism reduces wave transmission. Dissipation/reflection of the body, flow suction, and the shielding phenomenon of the outflow jet are important mechanisms to reduce the wave transmission coefficient. However, more numerical and experimental studies are needed so as to reach a level of certainty to employ it as a coastal protection system. Previous studies confirmed that rigid vegetation has a superior wave attenuation ability compared with flexible vegetation (Van Veelen et al., 2020). The rigid vegetation patch has a higher drag coefficient; thus, the damping of waves in their zone increases (Van Veelen et al., 2020). The rigid vegetation with the dense patch blocks the water, decreases the momentum transfer, and promotes sedimentation (Västilä and Järvelä, 2018). Nevertheless, the synthetic sponge has the potential to dampen wave height and can enhance sediment transport by changing the position of sediment particles from the near-bed to the higher water elevations.
5.2 The magnitude of the time-averaged longitudinal velocity and turbulent kinetic energy
Coral reefs have a complex structure and highly rough surface, which cause pollutants or sediment to accumulate (Chen et al., 2012). The presence of coral colonies dissipates the wave energy and reduces the momentum (food) transfer through them (Pujol et al., 2012). The natural sponges with a suction/pumping mechanism provide flow circulation. Thus, it is anticipated that the synthetic sponge facilitates the flow movements among coral colonies. However, whether they increase the mean flow velocity or chaos is unclear. In this regard, the mean magnitude of the velocity () and the turbulent kinetic energy, also known as TKE (), are evaluated. Figure 8 illustrates the details.
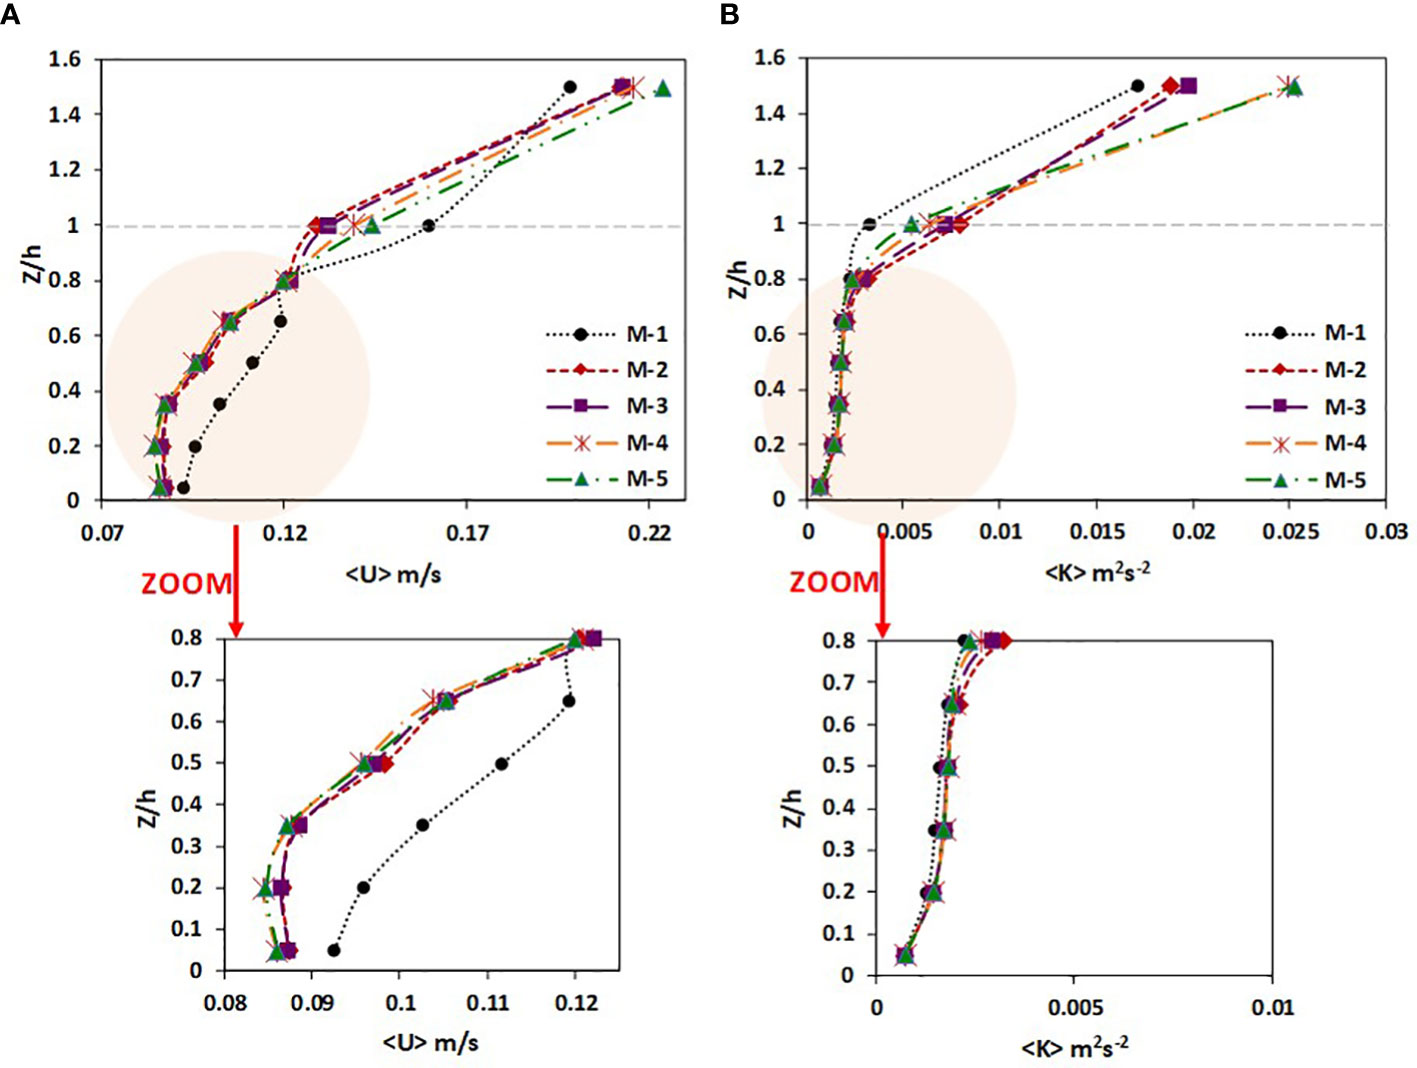
Figure 8 Comparison of mean velocity and turbulent kinetic energy for different scenarios: (A) and (B) at X/D = 1.
The wave-induced currents cause the ascending trend of toward the wave crest for all scenarios. However, few deviations were detected (Figure 8A). At Z/h ≤ 0.8, the effects of suction are predominant. In this regard, increasing the suction discharge to 600 L/h reduces the mean velocity through the water column (zoom of Figures 8A, 9A), so it is evident that the presence of a synthetic sponge with no suction/pumping discharge causes a ≈5%–13% increase in compared with the M-2 scenario (M-2 has the highest mean velocity compared with the other sponge scenarios).
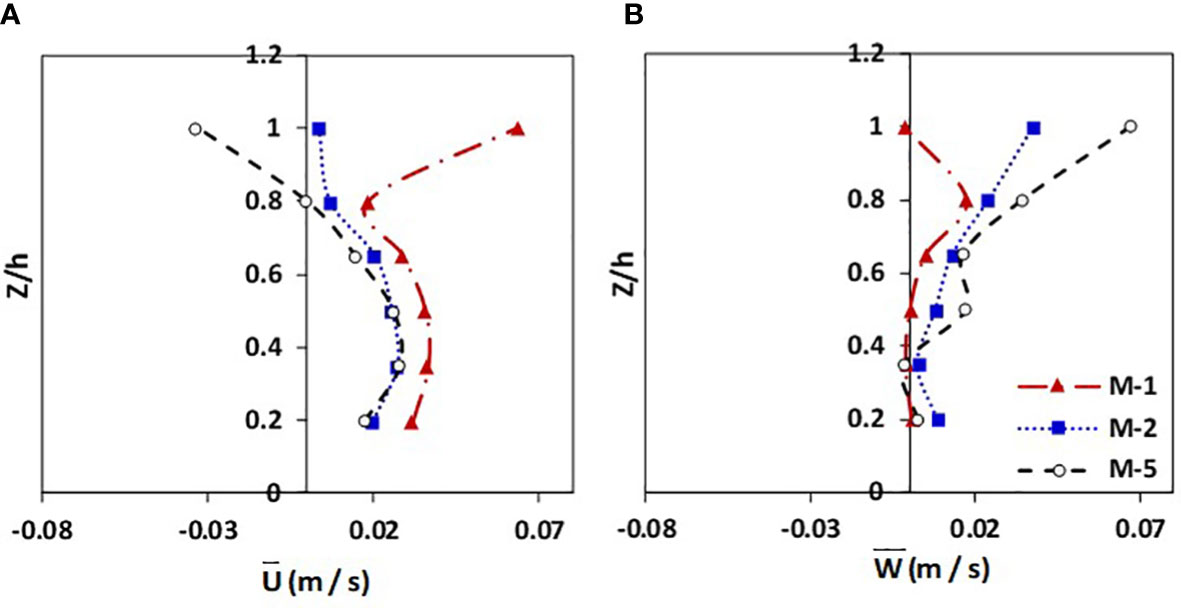
Figure 9 Mean velocity for M-1, M-2, and M-5 (A) and (B) at 0.2 ≤ Z/h ≤ 1 and X/D = 1.
Conversely, the vertical velocity component () enhances through the water column and where a sponge with constant suction/pumping discharge exists (Figure 9B). Downstream the synthetic sponge with no suction/pumping discharge (M-1 scenario), the downward flow occurs by the rear flow bending. However, when the sponge pumps the flow to the water column, the rear flow enters the jet and effluent cloud, so the downward flow becomes weak, and the probability of particle suspension increases (when the water contains suspended materials).
Near the free surface, the jet and wave interact. As a result, the jet will be dispersed laterally and widened along the Y-axis (Nardin et al., 2013). Thus, the horizontal component of velocity in sponge scenarios improves. In this regard, the differences between of various scenarios are not remarkable, and the M-5 scenario provides the highest mean velocity ( = 0.22 m/s). The results also do not provide valuable information about the re-circulations as Van Veelen et al. (2020) had reported (Van Veelen et al., 2020). Since the data are achieved by RANS modeling and have time-averaged essence, it is necessary to pursue image processing techniques.
Another critical parameter is the turbulent kinetic energy (). This parameter shows how the coral zone can be prone to sedimentation/pollutant accumulation (Yang et al., 2022). Previous studies claimed that turbulent kinetic energy is generated and dissipated by interacting waves and vegetation (Wang et al., 2020). The shear layer develops, and increases at the top of the canopy (Chen et al., 2013). Nevertheless, at the upstream and downstream of the patch, it reduces. Figure 8B shows the for each scenario at X/D = 1. At 0.2 ≤ Z/h ≤ 0.7, there are ≈7%–16% differences for between M-1 and M-2 to M-5 scenarios. At higher water elevations, the outflow jet is advocated and diffused downstream, the shear layer develops, and enhances by increasing the pumping discharge. The M-4 and M-5 scenarios show a ≈46% increase of compared with the M-1 at the free surface. Pujol et al. (2012) declared that the TKE profile in the vegetation zone has three parts (Pujol et al., 2012). The first one is above the canopy and has the greatest value compared with the other parts. The second one is inside the canopy but still is near the canopy edge. This part is called the transition zone. The TKE of the transition zone is higher than the no-vegetation condition. The third part is also inside the canopy and near the bed. The TKE in this zone is lower than the no-vegetation condition (called the dampening effect).
Three zones can also be observed in the current study. The first zone is at Z/h > 1. In this region, the pumping amplifies the TKE value due to the generation of a counter-rotating vortex pair (CRVP) and effluent cloud production. The Kelvin–Helmholtz instability also turns into one part of the CRVP. This type of vorticity can be detected by experimental and large eddy simulation and cannot be observed by RANS numerical models (Taherian and Mohammadian, 2021).
The transition zone appears in the second zone at 0.8 ≤ Z/h ≤ 1. As can be observed in Figure 8B, the suction/pumping mechanism starts to change the TKE value. In the third zone (Z/h< 0.8), the increase in suction reduces the TKE.
Overall, it can be determined that the synthetic sponge resembles flexible vegetation. In both of them, the upper zone has the highest TKE. However, the flexibility and swiping left and right of vegetations by orbital velocity increase the TKE. Nevertheless, the orbital velocity changes the outflow jet direction of the synthetic sponge in one period. In this condition, CRVP is the main reason for the TKE increase at Z/h > 1. It is also expected that varying the sponge height shifts or eliminates the zones as the penetration of the outflow jet in the water column changes. The origin of this prospect is the effects of various height/diameter ratios of rigid-finite height cylinders on the hydrodynamics of the downstream wakes (Palau-Salvador et al., 2009).
5.3 SurfaceLIC at Y/D = 0 and -8 ≤ X/D ≤ 8
Surface line integral convolution (SurfaceLIC) is an image processing technique. It visualizes vector fields by the combination of noises and streaking production. However, additional image optimization is necessary to achieve the high accuracy of re-circulation zones (Cabral and Leedom, 1993). The current study used both LIC and color to enhance the contrast. Anti-aliasing was performed to prevent pixelation. A uniform noise texture was applied on flow sections to better visualize the streaks of velocity vectors. The noise texture and grain size were 128 and 2, respectively. Based on the numerical time record, a wave period was captured in a time step of 1/10T, and flow hydrodynamics was visualized in special times of one wave period. Figure 10 shows the surfaceLIC of the velocity magnitude at Y/D = 0 and -8 ≤ X/D ≤ 8 in two times of 3T/10 and 4T/10.
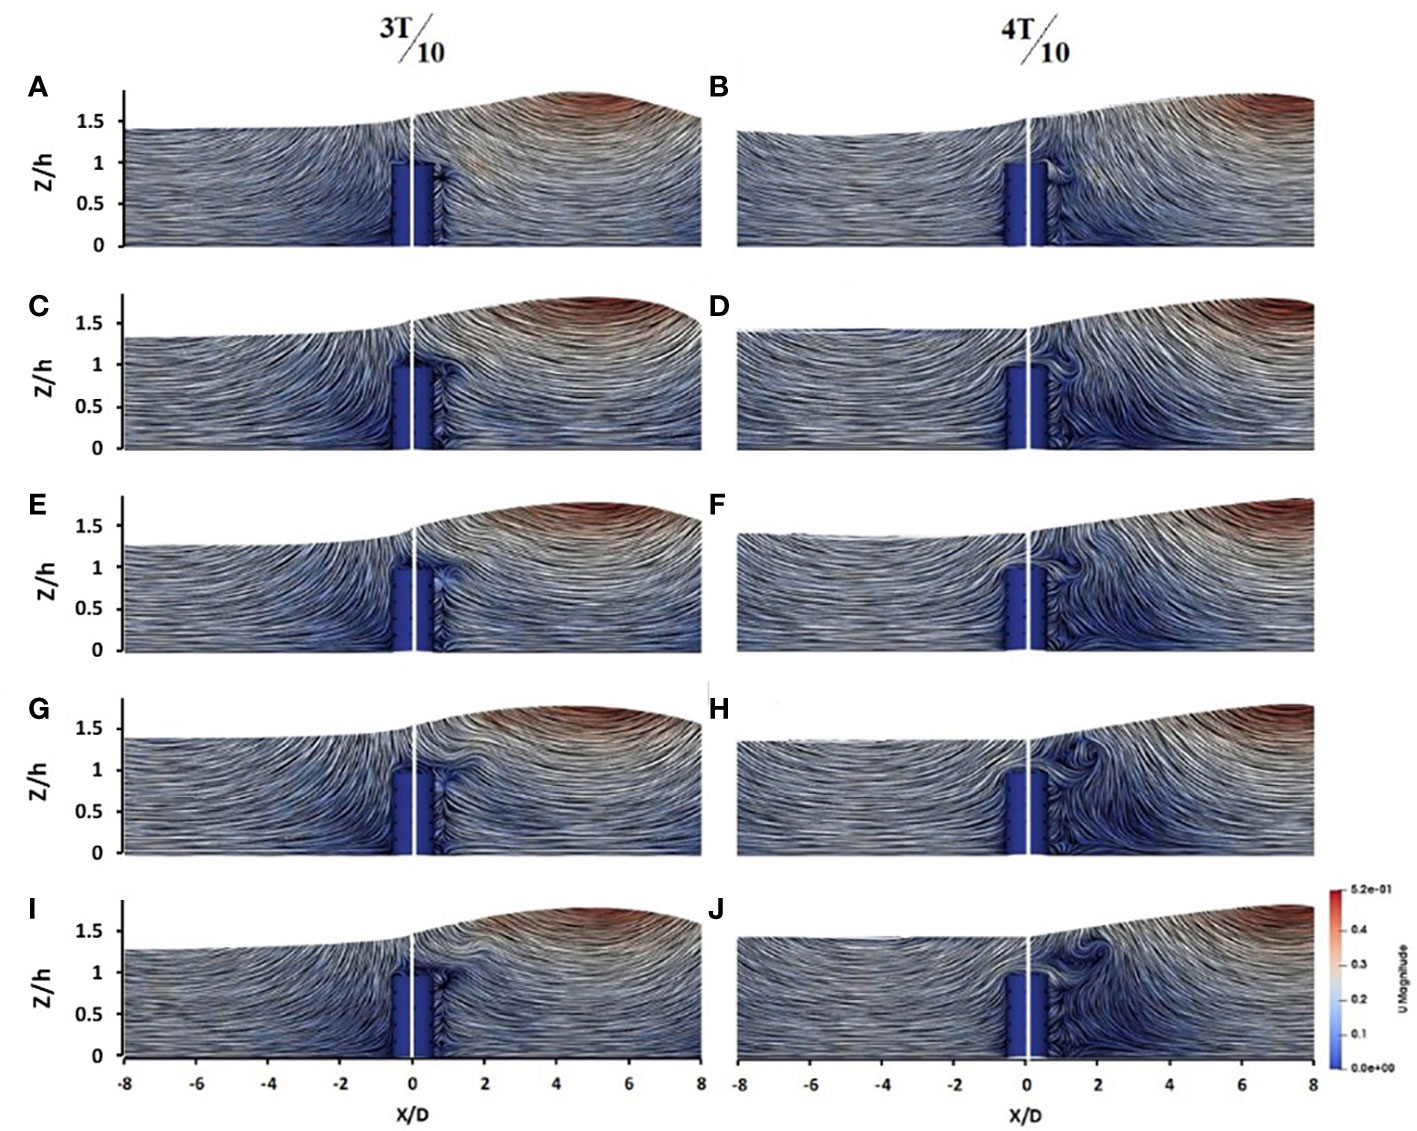
Figure 10 SurfaceLIC of velocity magnitude at Y/D = 0 and -8 ≤ X/D ≤ 8 for (A, B) M-1, (C, D) M-2, (E, F) M-3, (G, H) M-4, and (I, J) M-5.
Downstream of the perforated cylinder with no suction/pumping discharge (M-1 scenarios), on 3T/10, a stagnation line appears at X/D = 0.75 (Figure 10A). By wave progressing (at 4T/10), the stagnation line vanishes downstream the perforated cylinder in the M-1 scenario (Figure 10B), and a dipole re-circulation zone (with core coordinates of X/D ≈ 0.6, Z/h ≈ 0.8) appears. This phenomenon was also observed when a rigid, finite-height cylinder faced the current flow (Palau-Salvador et al., 2009). Nevertheless, in the present condition, the re-circulation zone shrinks close to the cylinder.
By exposing a synthetic sponge with constant suction/pumping discharge to the wave, the outflow jet advected to the wave crest and caused an increase in the wave velocity. Based on Sharp (1986), the outflow jet does not disperse through the water column unless the shallow water condition is present (Sharp, 1986).
In 4T/10, a particular circulation occurs on top of the sponges. They emerge through wave–jet interactions (effluent clouds) (Xu et al., 2016). This phenomenon is essential for sedimentation/suspension since it confirms the vertical momentum (Figure 9B). The core of effluent clouds was at X/D ≈ 0.8, Z/h ≈ 1 in the M-2 scenario (Figure 10D). Increasing the suction/pumping discharge to 600 L/h (M-5 scenario) shifted the core of re-circulation to X/D ≈ 2, Z/h ≈ 1.3.
The CRVP is part of the effluent cloud through the channel. It is worth pointing out that it has no constant shape. The pumping flow affects the CRVP shape in cross-sections. Figure 11 illustrates the CRVP at the cross-section of the channel.
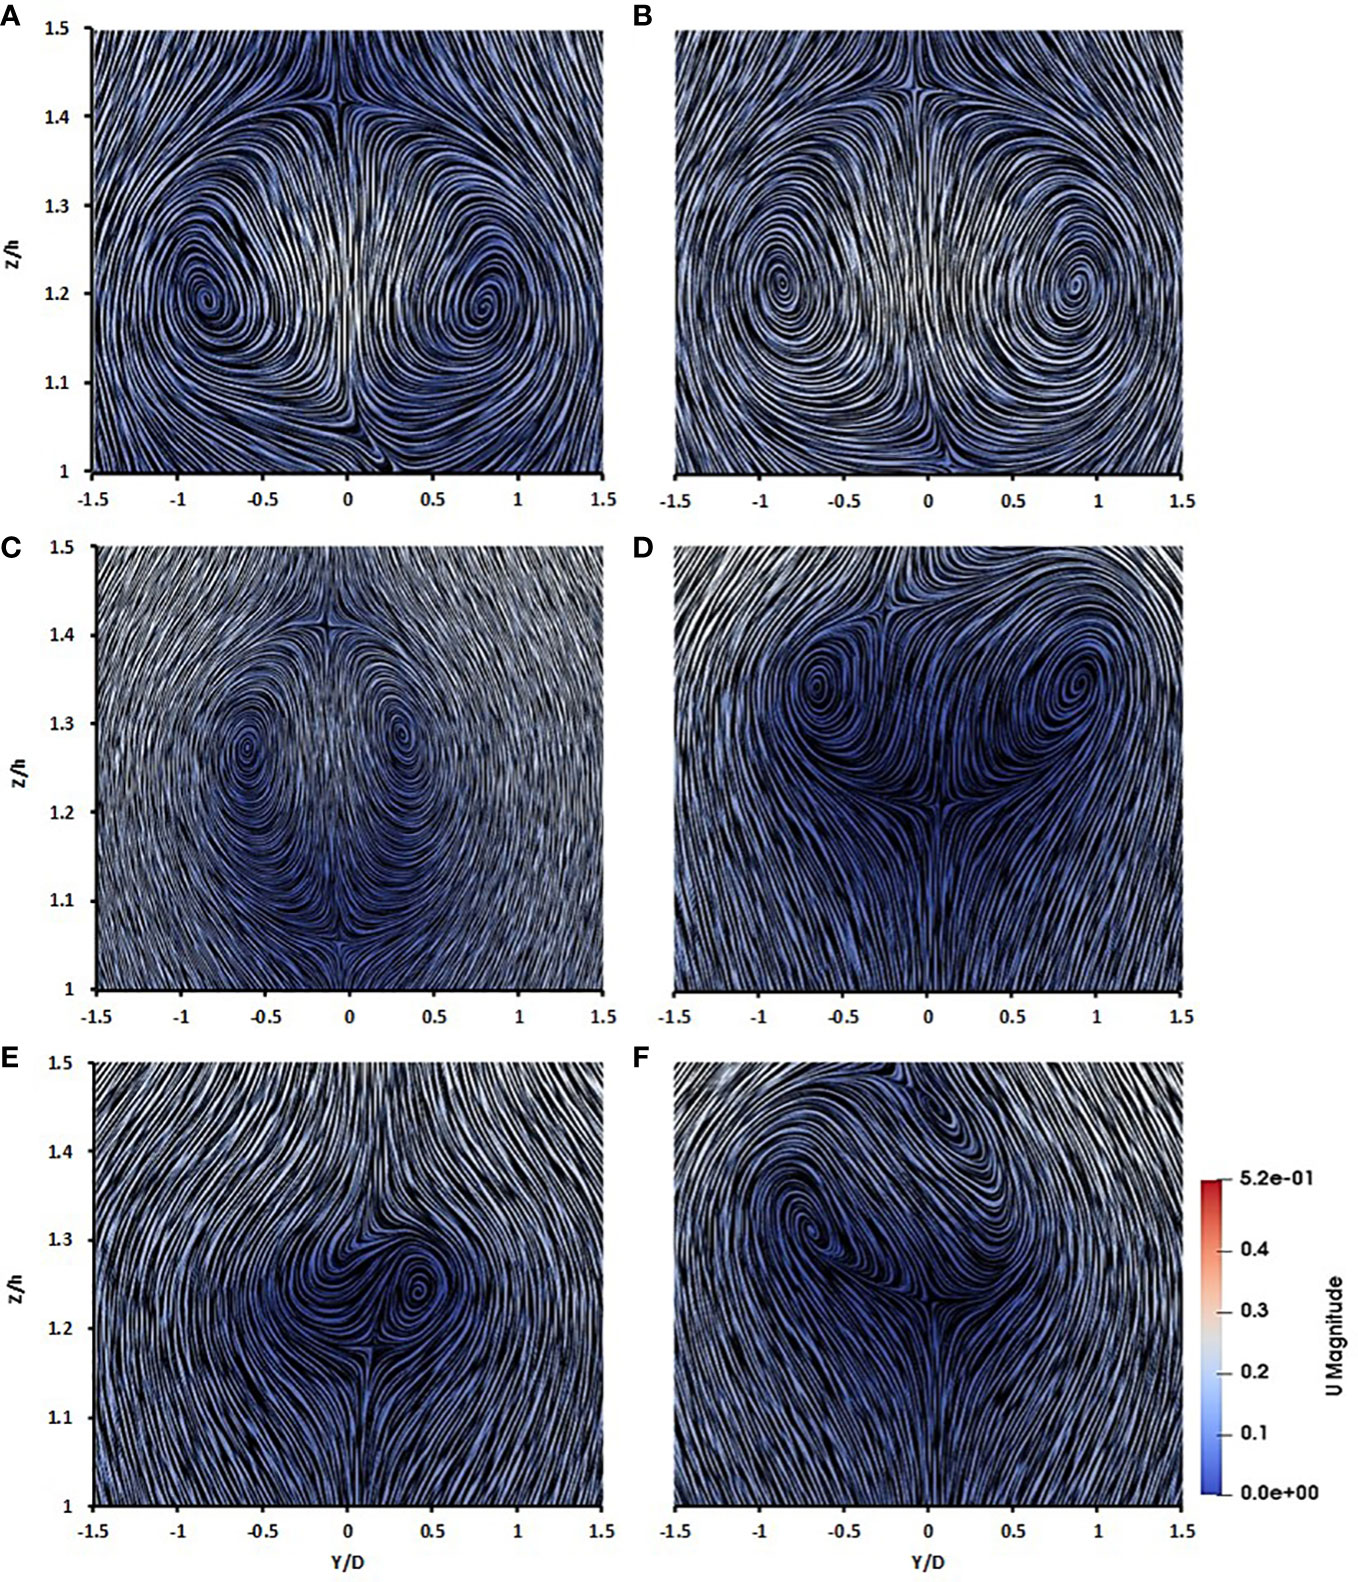
Figure 11 SurfaceLIC of counter-rotating vortex pair for sponge with various pumping discharges of (A) 150, (B) 300, (C) 400, (D) 600, (E) 900, and (F) 1,200 (L/h).
It is clear that the effluent clouds caused the formation of an inverted pear shape in scenario M-2, where the outflow discharge is 150 L/h (Figure 11A). However, increasing the outflow discharge to 300 L/h makes the CRVP shape round and nearly symmetric, like the CRVP of a jet in the case of current (Figure 11B). In scenario M-4, the CRVP gets stretched and unstable. However, it is nearly symmetric (Figure 11C). In scenario M-5, the right circle of the CRVP is an open spiral larger than the left one (asymmetric CRVP). This is due to the high turbulent flow downstream the cylinder and the bifurcation of outflow through the effluent clouds.
In comparison to what Xu et al. (2016) pointed out, it can be observed that the jet discharge can influence the CRVP shape and the interaction of wave and jet. The CRVP under effluent cloud effects can be categorized in a pear shape, symmetric, stretched (transition), and asymmetric. It is anticipated that, for pumping over 600 L/h, the effluent cloud hardly become detected by RANS modeling. Figures 11E, F prove the effects of the pumping discharge of 900 and 1,200 L/h on CRVP.
5.4 SurfaceLIC at X/D = 0 and -1.5 ≤ Y/D ≤ 1.5
The surfaceLIC was also used for investigating the wave hydrodynamics at the cross-sectional plane (X/D = 0 and -1.5 ≤ Y/D ≤ 1.5). For each scenario, four pictures from one wave period were selected (i.e., T/10, 5T/10, 6T/10, and T). As can be observed with wave traveling, the vorticity patterns change.
Among the main complex issues are the re-circulation and flow hydrodynamics on the free end of the cylinder (Javadi et al., 2018). In scenario M-1, the top re-circulation bubbles generate adjacent to the central axis when the crest or trough of the wave reaches the structure location (Supplementary Figures S3B, D) (Cravero et al., 2021). This is due to the attachments of the separated shear layers at the top of the cylinder (Sumner, 2013). On 5T/10, the tip vortices appear precisely attached to the cylinder edges (Supplementary Figure S3B) and develop on 6T/10 (Supplementary Figure S3C). The tip vortices appear due to the entry of the rear flow from the cylinder to the free end and its separation at the cylinder edges (Palau-Salvador et al., 2009). It is clear that, whenever the crest or trough reaches the cylinder station, the tip vortex vanishes due to the orbital velocity of the wave. However, the re-circulation bubble on the free end can emerge in almost all time steps. In addition, small and unstable vortices appear attached to the cylinder body (Supplementary Figure S3B).
When a synthetic sponge with constant suction/pumping discharge was considered (scenarios M-2 to M-5), the top bubble of the sponge vanished by the outflow pumping. Due to the outflow jet, the tip vortices become larger instead. Moreover, the small vortices attached to the sponge’s perforated body become larger than in the M-1 scenario due to the suction of flow from body perforation and energy cascade. The energy transfers from large to small vortices and vice versa. In this regard, different scales of vortices emerge when the wave passes from the sponge location.
In scenarios M-4 and M-5, when the suction/pumping discharge is over 400 L/h, the significant tip vortex appears on 5T/10 (Supplementary Figures S3N, R). Furthermore, on 6T/10, the large vortices fill the water column. In scenario M-5, the “six-vortices type” was detected, which was discovered by Zhang et al. (2017). The six-vortices type is a transition state between dipole and quadrupole. It comprises two tip vortices, two base vortices-farwake, and two counter-rotating vortex pairs. Similar to the results of Zhang et al. (2017), the size of the counter-rotating vortices is more diminutive than the base vortices-farwake (Zhang et al., 2017). However, the asymmetric shape of the vortices can be observed due to the wave transition condition compared with the current environment. The horseshoe (necklace) vortex, which emerged near the sponge junction and bed, has coordinates of Y/D ≈ -1.4, Z/h ≈ 0.2 and Y/D ≈ 0.8, Z/h ≈ 0.2. The combination of tip vortex and horseshoe vortex causes a large trailing vortex downstream and generates a turbulent environment.
Generally, the suction/pumping mechanism transforms the dipole, six-vortices type, and quadrupole to each other, and it does not only depend on the shape of the structure and its mean drag coefficient. It also can be concluded that the synthetic sponges produce vortical structures through the width of the channel and cause lateral momentum transfer. In this regard, at the sponges’ top and laterals, the TKE enhances.
5.5 SurfaceLIC at Z/h = 0.2 and -8 ≤ X/D ≤ 8
The surfaceLIC was deployed for detecting the wave hydrodynamics at Z/h = 0.2 and -8 ≤ X/D ≤ 8 on four selected intervals (i.e., 3T/10, 5T/10, 7T/10, and 8T/10). Figures 12A–J, 13A–J show the wave hydrodynamics in selected time intervals. These intervals were selected because of their unique flow hydrodynamics appearance. Near the bed, the shedding is significant, and the vortex bubbles are large. In upper elevations from the bed, the free surface’s suppressing effect prevents vortices’ penetration through the water column (Palau-Salvador et al., 2009). In this regard, Z/h = 0.2 was selected for the surfaceLIC analysis.
Upstream of the cylinder in scenario M-1, when the zero-crossing point of the wave reaches the structure location, the diffraction effect starts, and two re-circulation bubbles emerge downstream of the cylinder (Figure 12A). The straight wavefront forms and bending of wave streamline downstream at the shadow zone were not detected (Figure 12B). The re-circulation bubble vanished via a suctioning mechanism when the synthetic sponge with constant suction/pumping discharge was deployed. Furthermore, slight diffraction and flow bending downstream of the cylinder occur (Figures 12C, E, G, I). Increasing the suction/pumping discharge to over 400 L/h (i.e., scenarios M-4 and M-5) causes increased bending of the wavefront further downstream of the sponge. In this regard, the semi-circular wavefront was detected on 5T/10 (Figures 12H, J). By changing the velocity via the pumping flow, a “chute–jet” emerges downstream. This was also reported when a breaking wave–cylinder interaction existed (Kamath et al., 2016). Supplementary Figure S4 advocates detecting the chute–jet phenomenon at Z/h = 0.2 and on 9T/10. The results confirmed that, in scenario M-1, the semi-circular front wave and diffraction occur downstream. However, chute–jet was not detected (Supplementary Figure S4A). Downstream of the synthetic sponges, the chute–jet is detected. For sponges with suction/pumping discharge less than 600 L/h, widening of the chute–jet occurs (Supplementary Figures S4B–D), but for scenario M-5, the chute–jet is narrow (Supplementary Figure S4E). The emergence of various chute–jets downstream of the synthetic sponges can be due to the location of the wave breakpoint. Chute–jets are only found where the breaking wave is incident to a cylinder. Therefore, the suction and pumping mechanism can break the wave by changing the velocity and affecting the breaking point location. Accordingly, where the breaking point is before the cylinder, the cute–jet becomes wide (Supplementary Figures S4B–D). The energy reduction was about 18%–21% downstream. The chute is narrow where it is exactly on the cylinder (Supplementary Figure S4E). Thus, the energy reduces in the sponge location to ≈17%.
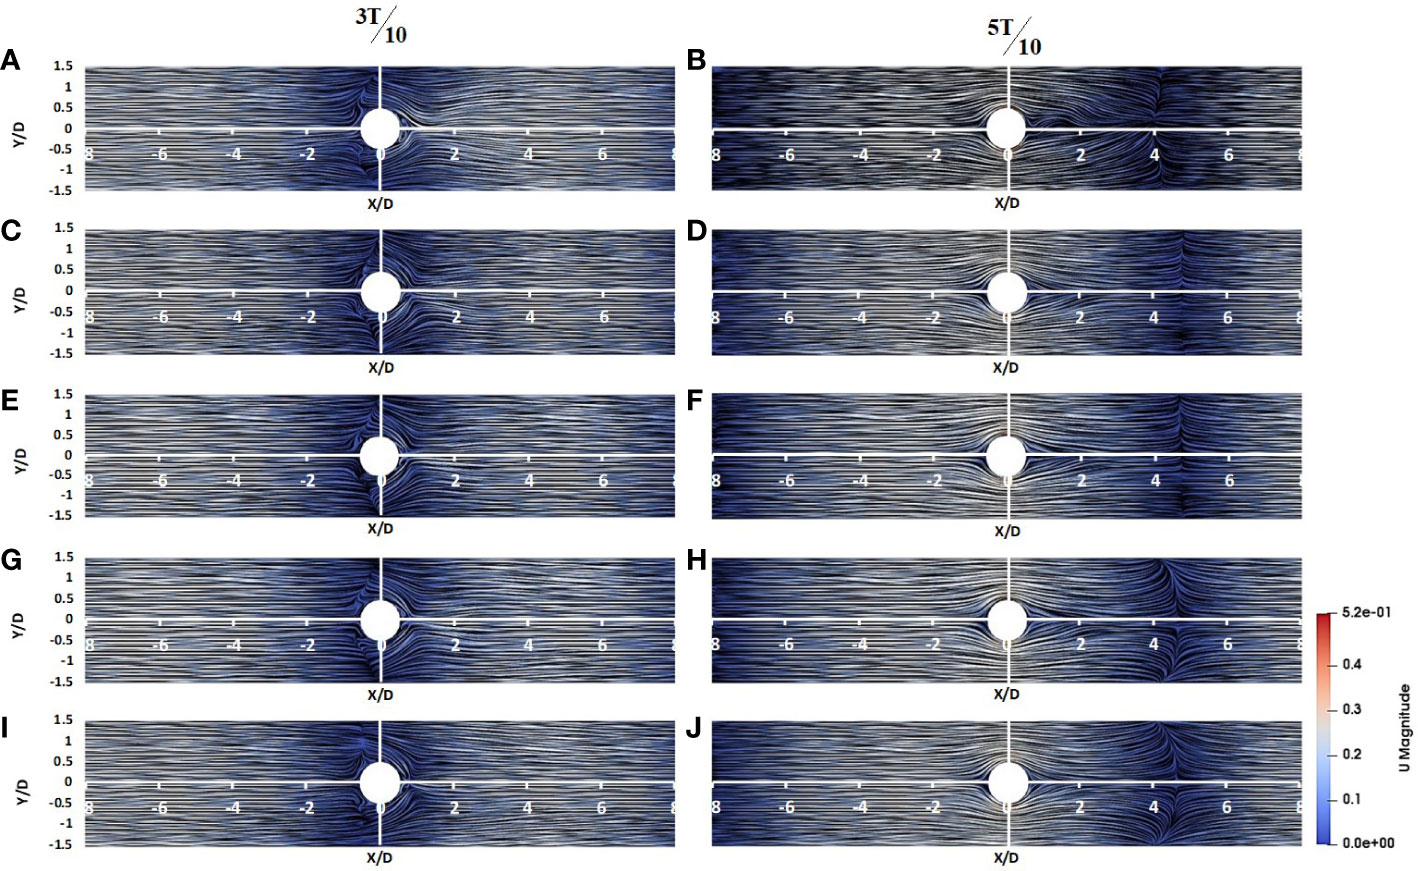
Figure 12 SurfaceLIC of velocity magnitude for 3T/10 and 5T/10 at Z/h = 0.2 and -8 ≤ X/D ≤ 8 for (A, B) M-1, (C, D) M-2, (E, F) M-3, (G, H) M-4, and (I, J) M-5.
On 8T/10, the typical-asymmetric von-Karman vortex street was detected downstream the synthetic sponge with no suction/pumping discharge (Figure 13B). The shedding vortex street was not observed. Since the cylinder height-to-diameter ratio is 2, the transient flow condition prevents the boundary layer development (Wang and Lam, 2019). The synthetic sponges’ suction also prevents the streamlines’ separation downstream. Consequently, von-Karman vortex street was not detected in scenarios M-2 to M-5. Hence, the synthetic sponge cannot affect the momentum transfer by vortex shedding in wave-induced currents. The momentum increase is advocated for the outflow jet, which causes the effluent cloud jet in the water column. Nevertheless, it is anticipated that, in the current environments with a developing boundary shear layer and by increasing the Re number downstream of the sponge, shedding occurs, and momentum transfer improves through laterals.
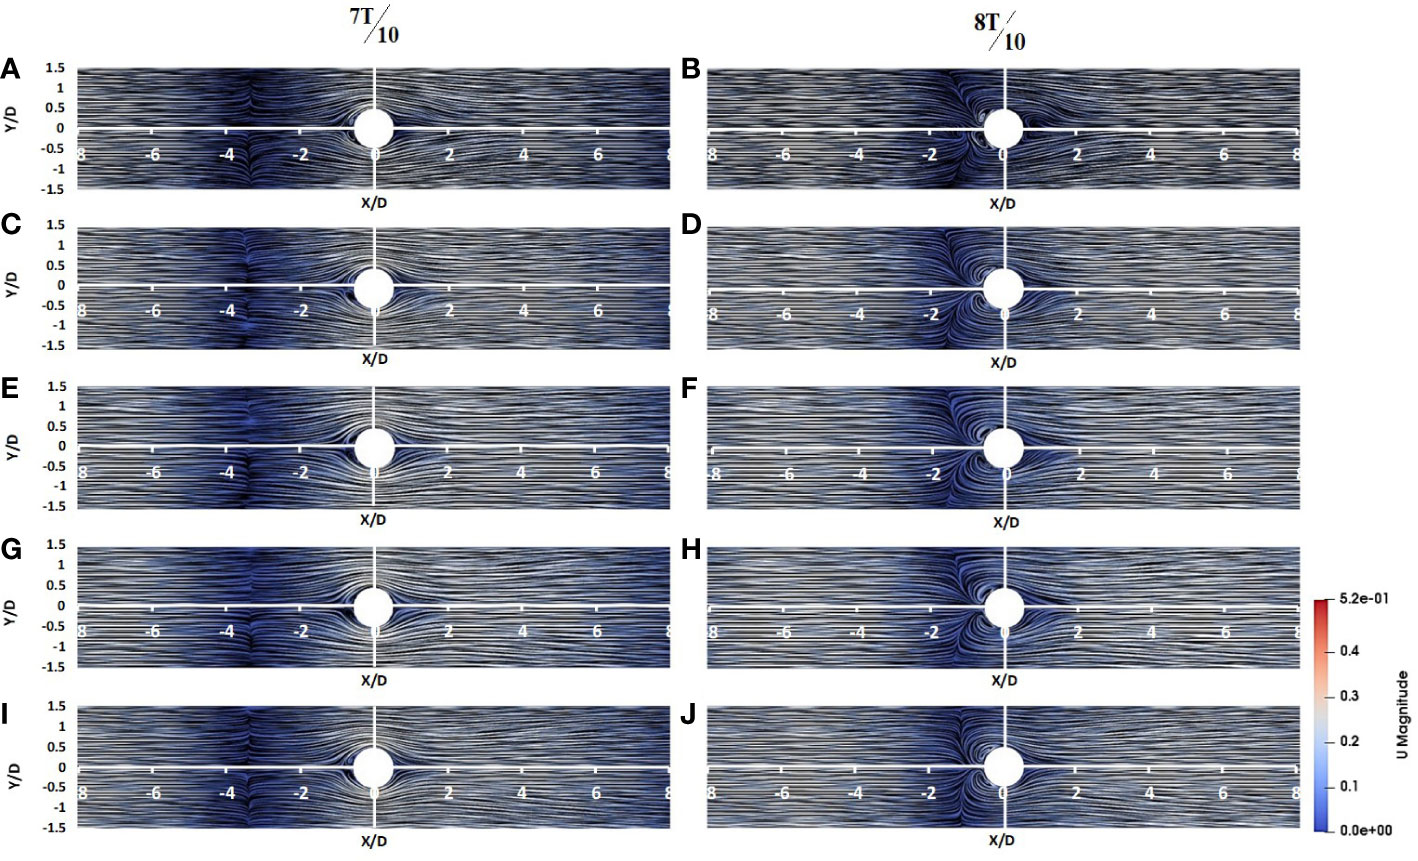
Figure 13 SurfaceLIC of velocity magnitude for 7T/10 and 8T/10 at Z/h = 0.2 and -8 ≤ X/D ≤ 8 for (A, B) M-1, (C, D) M-2, (E, F) M-3, (G, H) M-4, and (I, J) M-5.
6 Conclusion
The current study introduced a synthetic sponge based on the natural tubular sponge’s physical shape and living mechanism. In this regard, the effects of suction/pumping function on regular wave hydrodynamics were investigated. The results obtained through this study can be summarized as follows:
● The results confirmed that, with the shielding effect of the pumping mechanism and the specific physical shape of the synthetic sponge, they have a superior ability to reduce the wave transmission coefficient. In addition, they have higher TKE near the free surface, just the same as flexible vegetation. However, the swing motion of the outflow jet and the generation of CRVP is the reason for increasing the shear stress on top of the synthetic sponges.
● The surfaceLIC also provides worthy information about how the sponge shape and mechanism influence the wave breaks, run-up, vortices configuration, and diffraction phenomena. As was observed, the increase of the pumping discharge to 600 L/h transforms the quadrupole into a six-vortices type in the cross-section. Therefore, not only the vertical but also the lateral momentum transfer occurs in the sponge location.
● With the chute–jet phenomenon, the diffraction and creation of a low-velocity zone in the shadow regions show the breaking wave due to the sponge’s suction/pumping and perforation body. The results also confirmed that, by increasing the suction/pumping discharge, the breaking point would be shifted from downstream the structure to the close distance, and the chute–jet changes its shape from wide to narrow, so using just one sponge can reduce wave energy (about ≈17–21%).
● Based on what numerical modeling proved, the synthetic sponge uses the positive characteristics of both rigid and flexible vegetation. Its body and outflow jet act as a barrier and damp the wave height. In addition, the outflow swings by wave train. This enhances the vertical momentum exchange in the water column. This ability is similar to the flexible vegetation, which swings by wave and adds chaos through the water column. Consequently, momentum exchange enhances by the advection/diffusion of the sponge’s outflow jet.
This research program was focused on inspiring natural sponges to make a simple and great device to control wave hydrodynamics. Nevertheless, the lack of investigation of the synthetic sponge’s physical shape on the regular wave is felt. This will also be performed and reported in the near future.
Data availability statement
The raw data supporting the conclusions of this article will be made available by the authors without undue reservation.
Author contributions
MH: methodology, software, validation, and writing—original draft. MK: supervision, conceptualization, and writing—review and editing. All authors contributed to the article and approved the submitted version.
Funding
This work was supported by the Iran National Science Foundation: INSF (grant number 99018691).
Conflict of interest
The authors declare that the research was conducted in the absence of any commercial or financial relationships that could be construed as a potential conflict of interest.
Publisher’s note
All claims expressed in this article are solely those of the authors and do not necessarily represent those of their affiliated organizations, or those of the publisher, the editors and the reviewers. Any product that may be evaluated in this article, or claim that may be made by its manufacturer, is not guaranteed or endorsed by the publisher.
Supplementary material
The Supplementary Material for this article can be found online at: https://www.frontiersin.org/articles/10.3389/fmars.2023.1091540/full#supplementary-material
References
Asadzadeh S. S., Larsen P. S., Riisgård H. U., Walther J. H. (2019). Hydrodynamics of the leucon sponge pump. J. R. Soc Interface. 16, 20180630. doi: 10.1098/rsif.2018.0630
Bartzke G., Siemann L., Büssing R., Nardone P., Koll K., Hebbeln D., et al. (2021). Investigating the prevailing hydrodynamics around a cold-water coral colony using a physical and a numerical approach. Front. Mar. Sci. 8. doi: 10.3389/fmars.2021.663304
Berends E. E. (2021). Scaling effects and validation of the ocean grazer experimental wave tank using CFD (Netherlands: University of Groningen). Master Thesis.
Bian C., Liu Z., Huang Y., Zhao L., Jiang W. (2018). On estimating turbulent reynolds stress in wavy aquatic environment. J. Geophys. Res.: Oceans. 123, 3060–3071. doi: 10.1002/2017JC013230
Burke L., Reytar R., Spalding M., Perry A. (2011). Reefs at risk revisited (Washington. DC: World Resiurces Institute).
Cabral B., Leedom L. C. (1993). “Imaging vector fields using line integral convolution,” in Proceedings of the 20th annual conference on Computer graphics and interactive techniques, Anaheim.
Chandrasekaran S., Madhavi N. (2016). Numerical study on geometrical configurations of perforated cylindrical structures under regular waves. J. Perform. Constr. Facil. 30, 04014185. doi: 10.1061/(ASCE)CF.1943-5509.0000687
Chen Z., Jiang C., Nepf H. (2013). Flow adjustment at the leading edge of a submerged aquatic canopy. Water Resour. Res. 49, 5537–5551. doi: 10.1002/wrcr.20403
Chen Z., Ortiz A., Zong L., Nepf H. (2012). The wake structure behind a porous obstruction and its implications for deposition near a finite patch of emergent vegetation. Water Resour. Res. 48. doi: 10.1029/2012WR012224
Chindapol N., Kaandorp J. A., Cronemberger C., Mass T., Genin A. (2013). Modelling growth and form of the scleractinian coral pocillopora verrucosa and the influence of hydrodynamics. PloS Comput. Biol. 9, e1002849. doi: 10.1371/journal.pcbi.1002849
Cravero C., Marogna N., Marsano D. (2021). A numerical study of correlation between recirculation length and shedding frequency in vortex shedding phenomena. WSEAS Trans. Fluid Mech. 16, 49–62. doi: 10.37394/232013.2021.16.6
Dalrymple Robert A., Kirby James T., Hwang Paul A. (1984). Wave diffraction due to areas of energy dissipation. J. Waterw. Port Coast. Ocean Eng. 110, 67–79. doi: 10.1061/(ASCE)0733-950X(1984)110:1(67)
Dibajnia M., Soltanpour M., Vafai F., Shoushtari S., Kebriaee A. (2012). A shoreline management plan for Iranian coastlines. Ocean Coast. Manag 63, 1–15. doi: 10.1016/j.ocecoaman.2012.02.012
Edinger E. N., Burr G. S., Pandolfi J. M., Ortiz J. C. (2007). Age accuracy and resolution of quaternary corals used as proxies for sea level. Sci. Lett. 253, 37–49. doi: 10.1016/j.epsl.2006.10.014
Elhanafi A. (2016). Prediction of regular wave loads on a fixed offshore oscillating water column-wave energy converter using CFD. J. Ocean Eng. Sci. 1, 268–283. doi: 10.1016/j.joes.2016.08.001
Falcucci G., Amati G., Fanelli P., Krastev V. K., Polverino G., Porfiri M., et al. (2021). Extreme flow simulations reveal skeletal adaptations of deep-sea sponges. Nature 595, 537–541. doi: 10.1038/s41586-021-03658-1
Goldstein J., Riisgård H. U., Larsen P. S. (2019). Exhalant jet speed of single-osculum explants of the demosponge halichondria panicea and basic properties of the sponge-pump. J. Exp. Mar. Biol. Ecol. 511, 82–90. doi: 10.1016/j.jembe.2018.11.009
Hill M. S., Hill A. L. (2009). “Porifera (Sponges),” in Encyclopedia of inland waters. Ed. Likens G. E. (Oxford: Academic Press), 423–432.
Hossain M. M., Staples A. E. (2020). Effects of coral colony morphology on turbulent flow dynamics. PloS One 15, e0225676. doi: 10.1371/journal.pone.0225676
Javadi K., Kiani F., Tahaye Abadi M. (2018). Utilising flags to reduce drag around a short finite circular cylinder. J. Turbul. 19, 229–251. doi: 10.1080/14685248.2017.1414225
Kamath A., Alagan Chella M., Bihs H., Arntsen Ø.A. (2016). Breaking wave interaction with a vertical cylinder and the effect of breaker location. Ocean Eng. 128, 105–115. doi: 10.1016/j.oceaneng.2016.10.025
Kensleyt B., Heard R. (1991). Studies on the Crustacea of the Turks and Caicos islands, British West indies i. four new marine isopod crustaceans from the vicinity of pine cay. Gulf Res. Rep. 8. doi: 10.18785/grr.0803.03
Khakzad S., Trakadas A., harpster M., Wittig N. (2015). Maritime aspects of medieval siraf, Iran: a pilot project for the investigation of coastal and underwater archaeological remains. Int. J. Naut. Archaeol 44, 1–19. doi: 10.1111/1095-9270.12085
Koftis T., Prinos P., Stratigaki V. (2013). Wave damping over artificial posidonia oceanica meadow: a large-scale experimental study. Coast. Eng. 73, 71–83. doi: 10.1016/j.coastaleng.2012.10.007
Kumar P., Singh S. K. (2020). Flow past a bluff body subjected to lower subcritical reynolds number. J. Ocean Eng. Sci. 5, 173–179. doi: 10.1016/j.joes.2019.10.002
Li Z., Deng G., Queutey P., Bouscasse B., Ducrozet G., Gentaz L., et al. (2019). Comparison of wave modeling methods in CFD solvers for ocean engineering applications. Ocean Eng. 188. doi: 10.1016/j.oceaneng.2019.106237
Liu Y., Li S., Liao Z., Liu K. (2021). Physical and numerical modeling of random wave transformation and overtopping on reef topography. Ocean Eng. 220, 108390. doi: 10.1016/j.oceaneng.2020.108390
Machałowski T., Idaszek J., Chlanda A., Heljak M., Piasecki A., Święszkowski W., et al. (2022). Naturally prefabricated 3D chitinous skeletal scaffold of marine demosponge origin, biomineralized ex vivo as a functional biomaterial. Carbohydr. Polym. 275, 118750. doi: 10.1016/j.carbpol.2021.118750
Mansard E. P. D., Funke E. R. (1980). The measurement of incident and reflected spectra using a least squares method. Coast. Eng. 154-172. doi: 10.1061/9780872622647.008
Meng Q., Zhang C. (2016). A third-order KdV solution for internal solitary waves and its application in the numerical wave tank. J. Ocean Eng. Sci. 1, 93–108. doi: 10.1016/j.joes.2016.03.002
Morganti T. M., Ribes M., Yahel G., Coma R. (2019). Size is the major determinant of pumping rates in marine sponges. Front. Physiol. 10. doi: 10.3389/fphys.2019.01474
Muddada S., Hariharan K., Sanapala V. S., Patnaik B. S. V. (2021). Circular cylinder wakes and their control under the influence of oscillatory flows: a numerical study. J. Ocean Eng. Sci. 6, 389–399. doi: 10.1016/j.joes.2021.04.002
Nardin W., Mariotti G., Edmonds D., Guercio R., Fagherazzi S. (2013). Growth of river mouth bars in sheltered bays in the presence of frontal waves. J. Geophys. Res.: Earth Surf. 118. doi: 10.1002/jgrf.20057
Neumeier U. (2007). Velocity and turbulence variations at the edge of saltmarshes. Cont. Shelf Res. 27, 1046–1059. doi: 10.1016/j.csr.2005.07.009
Palau-Salvador G., Stoesser T., Fröhlich J., Kappler M., Rodi W. (2009). Large Eddy simulations and experiments of flow around finite-height cylinders. Flow Turbul. Combust. 84, 239. doi: 10.1007/s10494-009-9232-0
Pawlik J. (2011) Aplysina fistularis. Available at: http://www.spongeguide.org/imageinfo.php?img=2144.
Pineda M.-C., Strehlow B., Sternel M., Duckworth A., Haan J. D., Jones R., et al. (2017). Effects of sediment smothering on the sponge holobiont with implications for dredging management. Sci. Rep. 7, 5156. doi: 10.1038/s41598-017-05243-x
Pourkerman M., Marriner N., Morhange C., Djamali M., Amjadi S., Lahijani H., et al. (2018). Tracking shoreline erosion of “at risk” coastal archaeology: the example of ancient siraf (Iran, Persian gulf). Appl. Geogr. 101, 45–55. doi: 10.1016/j.apgeog.2018.10.008
Pujol D., Colomer J., Serra T., Casamitjana X. (2012). Effect of submerged aquatic vegetation on turbulence induced by an oscillating grid. Estuar. Coast. Shelf Sci. 114, 23–30. doi: 10.1016/j.ecss.2011.08.020
Reiswig H. (1975). The aquiferous systems of three desmospongidae. J. Morphol. 145, 493–502. doi: 10.1002/jmor.1051450407
Rickborn A. J. (2010). The spatial ecology of a coral reef sponge, aplysina fistularis (Boston, Massachusetts: MA, Boston University).
Samsami F., Haghshenas S., Soltanpour M. (2022). Physical and rheological characteristics of sediment for nautical depth assessment in bushehr port and its access channel. Water 14, 4116. doi: 10.3390/w14244116
Sharp J. (1986). TECHNICAL NOTE. THE EFFECT OF WAVES ON BUOYANT JETS. Proc. Inst. Civ. Eng. 81, 471–475. doi: 10.1680/iicep.1986.552
Strehlow B., Jorgensen D., Webster N., Pineda M. C., Duckworth A. (2016). Using a thermistor flowmeter with attached video camera for monitoring sponge excurrent speed and oscular behaviour. PeerJ 4. doi: 10.7717/peerj.2761
Sukarnoor N. I. M., Quen L. K., Abu A., Siang K. H., Kuwano N., Desa S. M. (2022). An investigation of the dynamic behaviour of two rigid cylinders in a tandem arrangement under vortex-induced vibration. J. Ocean Eng. Sci. doi: 10.1016/j.joes.2022.05.035
Sumner D. (2013). Flow above the free end of a surface-mounted finite-height circular cylinder: a review. J. Fluids Struct. 43, 41–63. doi: 10.1016/j.jfluidstructs.2013.08.007
Taherian M., Mohammadian A. (2021). Buoyant jets in cross-flows: review, developments, and applications. J. Mar. Sci. Eng. 9, 61. doi: 10.3390/jmse9010061
Van Veelen T. J., Fairchild T. P., Reeve D. E., Karunarathna H. (2020). Experimental study on vegetation flexibility as control parameter for wave damping and velocity structure. Coast. Eng. 157, 103648. doi: 10.1016/j.coastaleng.2020.103648
Västilä K., Järvelä J. (2018). Characterizing natural riparian vegetation for modeling of flow and suspended sediment transport. J. Soils Sediments 18, 3114–3130. doi: 10.1007/s11368-017-1776-3
Wang F., Lam K. (2019). “Symmetric and antisymmetric characterization of turbulent flow past a square cylinder of low aspect ratio,” in 4th Thermal and Fluids Engineering Conference, Las Vegas, NV, USA.
Wang Y., Yin Z., Liu Y. (2020). Numerical investigation of solitary wave attenuation and resistance induced by rigid vegetation based on a 3-d RANS model. Adv. Water Resour. 146, 103755. doi: 10.1016/j.advwatres.2020.103755
Weller H., Greenshields C., Jasak H. (2022) OpenFOAM manual. Available at: https://www.openfoam.com/documentation/.
Woodroffe C. D., Webster J. M. (2014). Coral reefs and sea-level change. Mar. Geol. 352, 248–267. doi: 10.1016/j.margeo.2013.12.006
Xu Z., Chen Y., Tao J., Pan Y., Sowa D. M. A., Li C.-W. (2016). Three-dimensional flow structure of a non-buoyant jet in a wave-current coexisting environment. Ocean Eng. 116, 42–54. doi: 10.1016/j.oceaneng.2016.02.022
Xu Z., Zhang Y., Chen Y. (2020). Study on flow structure of tandem multiple jets under the effect of regular waves. Ocean Eng. 217, 107993. doi: 10.1016/j.oceaneng.2020.107993
Yang Z., Guo M., Li D. (2022). Theoretical model of suspended sediment transport capacity in submerged vegetation flow. J. Hydrol. 609, 127761. doi: 10.1016/j.jhydrol.2022.127761
Keywords: sponge, OpenFOAM, regular wave, hydrodynamics, RANS modeling, coral reefs, coastal erosion
Citation: Hashempour M and Kolahdoozan M (2023) Inspiration of marine sponges to design a structure for managing the coastal hydrodynamics and protection: numerical study. Front. Mar. Sci. 10:1091540. doi: 10.3389/fmars.2023.1091540
Received: 23 November 2022; Accepted: 02 May 2023;
Published: 26 May 2023.
Edited by:
Wei-Bo Chen, National Science and Technology Center for Disaster Reduction(NCDR), TaiwanCopyright © 2023 Hashempour and Kolahdoozan. This is an open-access article distributed under the terms of the Creative Commons Attribution License (CC BY). The use, distribution or reproduction in other forums is permitted, provided the original author(s) and the copyright owner(s) are credited and that the original publication in this journal is cited, in accordance with accepted academic practice. No use, distribution or reproduction is permitted which does not comply with these terms.
*Correspondence: Morteza Kolahdoozan, bWtsaGR6YW5AYXV0LmFjLmly