 Tabitha R. R. Pearman1,2,3*
 Katleen Robert4
 Alexander Callaway5,6
 Rob A. Hall7
 Furu Mienis8
 Claudio Lo Iacono9
 Veerle A. I. Huvenne1
- 1Ocean BioGeosciences, National Oceanography Centre (NOC), Southampton, United Kingdom
- 2Ocean and Earth Science, University of Southampton, Southampton, United Kingdom
- 3South Atlantic Environmental Research Institute (SAERI), Stanley, Falkland Islands
- 4School of Ocean Technology, Memorial University, Newfoundland, NL, Canada
- 5Habitat Mapping and Human, Activities Team, Marine Ecology Group Centre for Environment, Fisheries and Aquaculture Science (Cefas), Lowestoft, United Kingdom
- 6Fisheries and Aquatic Ecosystems Branch, Environment and Marine Sciences Division, Agri-Food and Biosciences Institute (AFBI), Belfast, United Kingdom
- 7School of Environmental Sciences, University of East Anglia, Norwich, United Kingdom
- 8Department of Ocean Systems, The Royal Netherlands Institute for Sea Research (NIOZ), Texel, Netherlands
- 9Marine Sciences Institute, CSIC, Barcelona, Spain
Vertical walls of submarine canyons represent features of high conservation value that can provide natural areas of protection for vulnerable marine ecosystems under increasing anthropogenic pressure from deep-sea trawling. Wall assemblages are spatially heterogeneous, attributed to the high environmental heterogeneity over short spatial scales that is a typical feature of canyons. Effective management and conservation of these assemblages requires a deeper understanding of the processes that affect faunal distribution patterns. Canyons are recognised as sites of intensified hydrodynamic regimes, with focused internal tides enhancing near-bed currents, turbulent mixing and nepheloid layer production, which influence faunal distribution patterns. Faunal patterns also respond to broad-scale hydrodynamics and gradients in water mass properties (e.g. temperature, salinity, dissolved oxygen concentration). Oscillating internal tidal currents can advect such gradients, both vertically and horizontally along a canyon's walls. Here we take an interdisciplinary approach using biological, hydrodynamic and bathymetry-derived datasets to undertake a high-resolution analysis of a subset of wall assemblages within Whittard Canyon, North-East Atlantic. We investigate if, and to what extent, patterns in diversity and epibenthic assemblages on deep-sea canyon walls can be explained by spatial and temporal variability induced by internal tides. Vertical displacement of water mass properties by the internal tide was calculated from autonomous ocean glider and shipboard CTD observations. Spatial patterns in faunal assemblage structure were determined by cluster analysis and non-metric Multi-Dimensional Scaling plots. Canonical Redundancy Analysis and Generalised Linear Models were then used to explore relationships between faunal diversity and assemblage structure and a variety of environmental variables. Our results support the hypothesis that internal tides influence spatial heterogeneity in wall faunal diversity and assemblages by generating both spatial and temporal gradients in hydrodynamic properties and consequently likely food supply.
1 Introduction
Submarine canyons are complex geomorphological features that incise continental margins to form pathways between the shelf and deep sea. (Huvenne and Davies, 2014; Amaro et al., 2016). The movement of water masses, sediments and organic matter over varying temporal scales through the canyon generates environmental gradients of physico-chemical properties that occur both horizontally, i.e. along or across the canyon axis, and vertically (Obelcz et al., 2014; Fernandez-Arcaya et al., 2017; Hall et al., 2017; Ismail et al., 2018). As a result, environmental conditions can vary over short spatial scales, such that different branches within a single canyon, or even opposing walls of the same branch may have different seafloor characteristics, and experience different hydrodynamic and sedimentary regimes (McClain and Barry, 2010; Aslam et al., 2018; Bargain et al., 2018; Ismail et al., 2018; Pearman et al., 2020). The high spatial and temporal heterogeneity in environmental conditions often results in enhanced regional and local productivity, biodiversity, and faunal abundance (De Leo et al., 2010; Vetter et al., 2010; De Leo et al., 2014).
Submarine canyons are listed by the FAO (2009) as topographic features that may support vulnerable marine ecosystems (VMEs). Vertical walls situated within submarine canyons are features of high conservation value, providing natural areas of protection for VMEs under increasing anthropogenic pressure from deep-sea trawling (Huvenne et al., 2011; Johnson et al., 2013). Vertical walls support a range of faunal assemblages (which make up VMEs) that exhibit high diversity (Robert et al., 2015; Robert et al., 2017; Pearman et al., 2020). Examples are walls supporting dense aggregations of reef forming scleractinian corals, Lophelia pertusa (recently synonymised to Desmophyllum pertusum (Addamo et al., 2016)) (Huvenne et al., 2011; Brooke and Ross, 2014; Fabri et al., 2014) and Madrepora oculata (Fabri et al., 2014), the stony coral Desmophyllum dianthus, the octocorals Paragorgia arborea and Duva florida (Brooke et al., 2017), the deep-sea oyster, Neopycnodonte zibrowii (Van Rooij et al., 2010; Fabri et al., 2014), and the fire clam, Acesta excavata (Johnson et al., 2013). On the other hand, other sections of vertical walls can be devoid of life (Robert et al., 2015; Pearman et al., 2020). Consequently, vertical walls contribute to a canyon’s habitat diversity in various ways.
Desmophyllum pertusum reefs and coral gardens are listed as ‘threatened or declining’ under Annex V of the Oslo-Paris convention agreement (OSPAR, 2008), under Annex 1 of the Habitats Directive (92/43/EEC, 1992) and as VMEs (FAO, 2008), requiring protection. Effective spatial management and conservation of vertical wall assemblages requires a deeper understanding of the processes that generate the observed faunal distribution patterns (Huvenne and Davies, 2014). However, despite the likely importance of vertical walls in supporting and protecting diversity hotspots and protected habitats, few ecological studies of wall fauna have been conducted (Robert et al., 2017; Robert et al., 2020) and our understanding of the processes that generate spatial patterns along them is limited.
Our limited understanding is, in part, attributed to the challenge of sampling deep-sea vertical walls and measuring the local environmental characteristics. As a result, vertical walls stayed largely unsampled prior to recent advancements in remote technologies (e.g. Remotely Operated Vehicles (ROVs)) (Huvenne and Davies, 2014). Additionally, the limitations in the resolution of ship-borne bathymetry prevents accurate delineation of vertical walls (Huvenne et al., 2011; Robert et al., 2017). Consequently, despite their likely importance, vertical walls remain under-represented and under-sampled environments of canyons, limiting our knowledge of canyon ecology. This is further confounded by the predominance of canyon studies which only model the probability of epibenthic species presence-absence (Robert et al., 2015; Bargain et al., 2018; Lo Iacono et al., 2018) or univariate faunal responses that condense faunal information into a single diversity index (Robert et al., 2015; Ismail et al., 2018), rather than representing wider, multivariate species assemblage data.
In general, the responses of canyon fauna are regulated by a complex interplay of multiple factors acting at different scales. Environmental factors (water mass properties, seafloor characteristics and food supply) are most likely to explain species patterns at broader spatial scales (McClain and Barry, 2010; Robert et al., 2015; Ismail et al., 2018) while biotic processes (e.g. competition) more often act at finer spatial scales (Robert et al., 2020). Stochastic events (disturbance) act at multiple scales (Pierdomenico et al., 2016). The interaction of these processes across different spatial and temporal scales makes identifying key factors that drive faunal patterns within heterogeneous canyon landscapes challenging.
Canyons are recognised as sites of intensified hydrodynamics, including energetic internal waves and internal tides (Liu et al., 2010; Hall et al., 2017). Internal (baroclinic) waves occur when there is a perturbation to the interface between layers of the water column with different temperatures, salinities, and thus densities. The perturbation is restored by local buoyancy, forming oscillations (waves) that propagate along the interface. In a continuously stratified water column, such as the open ocean, the waves propagate vertically as well as horizontally. Internal waves generated by tidal motions, and thus oscillating at tidal frequencies (e.g. semidiurnal), are termed internal tides (Wunsch, 1975). In canyons, internal tides are generated when surface (barotropic) tidal currents flow across steep canyon topography (Allen and Durrieu De Madron, 2009; Vlasenko et al., 2016; Hall et al., 2017). Internal wave–topographic interactions (e.g. generation, reflection and breaking) are determined by multiple factors, including wave frequency, buoyancy frequency (i.e. stratification) and latitude. These determine the slope of internal wave propagation (swave) which can be compared to the local bathymetric slope (sbathy) to predict wave behaviour. Canyon walls are typically steep compared to the slope of semidiurnal internal tides (α = sbathy/swave >1), a state known as supercritical, so these internal waves approaching a wall are reflected back into deep water and towards the canyon floor. Conversely, the floors of canyons often have a gentler slope than semidiurnal internal tides (α<1), a state known as subcritical, so these internal waves approaching from offshore are reflected up the canyon towards its head. These processes combine to focus internal tide energy towards the canyon boundaries (its walls and floor), intensifying near-bed tidal currents (Hall and Carter, 2011; Hall et al., 2014). Where the local bathymetric slope is equal or near-equal to the internal wave slope (α ≃ 1), the wave is trapped near the boundary, often leading to breaking – similar to surface waves breaking on a beach – which increases the turbulent mixing of heat, salt, nutrients, and particulate matter between the layers of the water column.
Internal tides are increasingly advocated as key environmental factors influencing species patterns in the deep sea (Huvenne et al., 2011; Johnson et al., 2013; Van Haren et al., 2017; Davison et al., 2019; Pearman et al., 2020). For example, research focussing on scleractinian cold-water coral (CWC) assemblages has highlighted the importance of local hydrodynamics (including internal tides) in supplying nutrients and food to sustain CWC populations and preventing sedimentation on the hard substratum that the corals colonise (Frederiksen and Westerberg, 1992; Thiem et al., 2006; Davies et al., 2009; Mienis et al., 2009; White and Dorschel, 2010). Through interactions with sloping topography, internal tides occurring within canyons may enhance near-bed currents and turbulent mixing, forming efficient food supply mechanisms to benthic communities (Johnson et al., 2013). For example, the aggregation of organic matter by internal tide driven resuspension and mixing is postulated to play an important role in supporting high densities of M. oculata on the southern wall of Cap de Creus Canyon (Orejas et al., 2009).Internal tides also influence the resuspension and advection of suspended material in nepheloid layers (White et al., 2005; Liu et al., 2010; Puig et al., 2014; Wilson et al., 2015), where enhanced amounts of suspended matter (including particulate organic matter) are observed, representing an important food source for deep-sea fauna (Demopoulos et al., 2017). Internal tide modulation of nepheloid layers can result in replenishment of food to the benthos over the tidal cycle (Davies et al., 2009) and has been linked to spatial distributions of antipatharians and gorgonians in canyons of the Bay of Biscay (Van Den Beld et al., 2017).
The vertical displacement of the water column strata, associated with internal tides, also results in temporal variability of water mass properties (including temperature, salinity, dissolved oxygen concentration) along the canyon walls. Fauna respond to such changes in water mass properties and hydrodynamics (Levin et al., 2001; Howell et al., 2002; Dullo et al., 2008; Fabri et al., 2017). In addition, spatial and temporal hydrodynamic variability has been linked to species richness and assemblage patterns on the Hebrides Terrace Seamount (Henry et al., 2014). Hydrodynamic variability of internal tides generates environmental heterogeneity in near-bed sheer stress and nutrient and sediment fluxes (Frederiksen and Westerberg, 1992), which are proposed to influence CWC coral mound formation in the North-East Atlantic (White and Dorschel, 2010). On the other hand, modelling indicates internal tide hydrodynamic variability is an important factor influencing larval dispersal on the Rosemary Bank Seamount (Stashchuk and Vlasenko, 2021). However, to date no studies investigating faunal responses to internal tide induced environmental heterogeneity have been conducted in submarine canyons.
Here for the first time we investigate if spatial and temporal gradients in hydrodynamic properties, induced by the internal tide, can explain variation in spatial patterns of faunal diversity and assemblage composition on deep-sea canyon walls. We utilise biological, hydrodynamic and bathymetry-derived datasets in an integrated approach to undertake a high-resolution analysis of wall assemblages within Whittard Canyon, North-East Atlantic. We ask the following questions: (1) Does epibenthic megafaunal assemblage composition change across hydrodynamic and substratum gradients on vertical walls and (2) which environmental variables exert the strongest influence on epibenthic megafaunal diversity and assemblage structure?
2 Materials and methods
2.1 Study area
Whittard Canyon extends over >200 km and incises the shelf break of the passive Celtic Margin, south-west of the British Isles in the Northern Bay of Biscay, starting at a depth of ~200 m (Figure 1). It is a dendritic canyon system comprised of four main tributaries, the Western, Western Middle, Eastern Middle and Eastern branches that coalesce at 3700 – 3800 m water depth. The Whittard Channel continues to a depth of ~4500 m, where it joins the Celtic Fan that leads onto the Porcupine Abyssal Plain (Hunter et al., 2013; Amaro et al., 2016). This study focusses on the Eastern branch of Whittard Canyon (Figure 1).
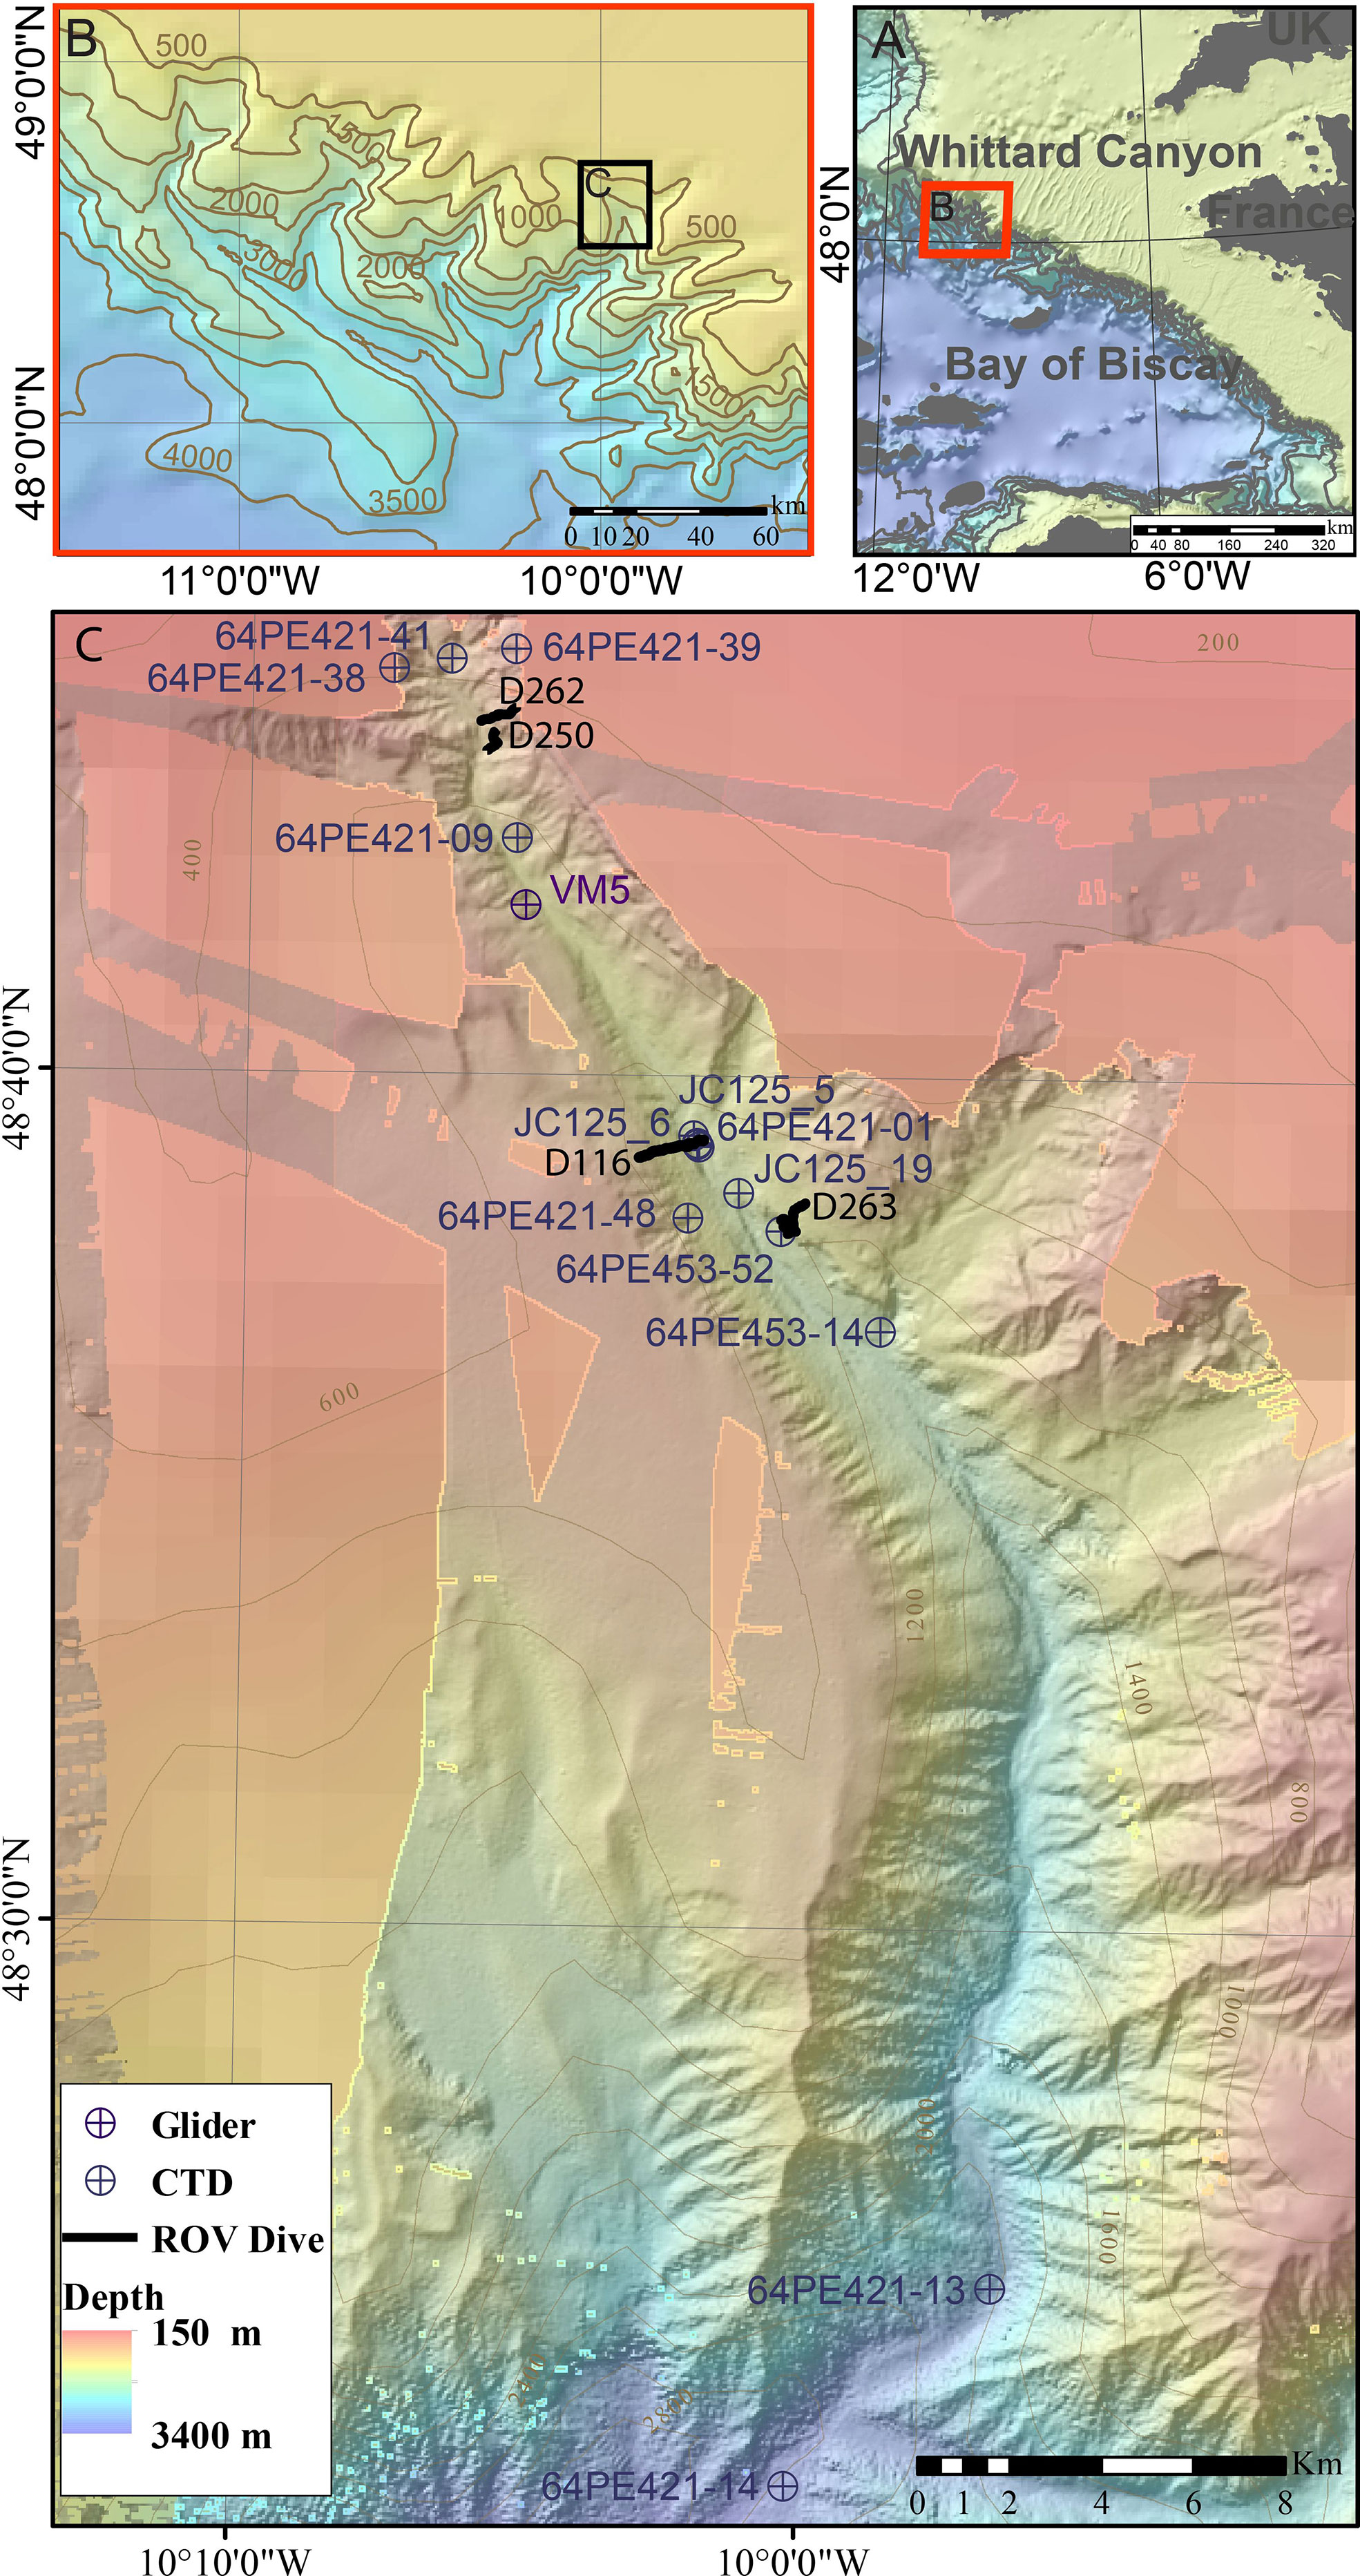
Figure 1 Location map of (A) Whittard Canyon and (B) the Eastern branch of Whittard Canyon (C) data acquired from the Eastern branch during the J036, JC125, 64PE421 and 64PE435 cruises. Background bathymetry from JC125 and GEBCO compilation group (2019).
Several water masses occur in the region, defined by absolute salinity (SA) and conservative temperature (Θ). These include: Eastern North Atlantic Water (ENAW) (~100 – 600 m, SA = 35.8 – 36.3 g kg -1, Θ = 12.2 – 14.8°C), the Mediterranean Outflow Water (MOW) (800 – 1200 m, SA = 36.35 – 36.65 g kg -1, Θ = 9.5 – 10.5°C) and the Northeast Atlantic Deep Water (NEADW) (1500 – 3000 m, SA = 35.11 – 35.13 g kg -1, Θ = 2.6 – 3.0°C) (Pollard et al., 1996; Van Aken, 2000). The influence of the ENAW and MOW water mass decreases up-canyon as depth decreases and mixing increases toward the head of the branch (Hall et al., 2017).
Intensified near-bed currents and internal tides have been documented from Whittard Canyon (Reid and Hamilton, 1990; Hall et al., 2017; Aslam et al., 2018) and attributed to generating spatial heterogeneity in environmental conditions (Wilson et al., 2015; Hall et al., 2017; Aslam et al., 2018; Pearman et al., 2020). Semidiurnal internal tides with amplitudes up to 80 m have been observed, with implications of 1°C temperature fluctuations and dissolved oxygen concentration changes of 12 μmol kg-1 along certain sections of the canyon’s walls (Hall et al., 2017). Additionally, dissipation of the observed energetic internal tide is expected to drive enhanced turbulent mixing, which is associated with increased concentrations of resuspended particulate organic matter (POM) and nepheloid layer formation within the canyon (Wilson et al., 2015; Hall et al., 2017; Aslam et al., 2018; Haalboom et al., 2021). Resuspension by intensified near-bed currents (including internal tides) and local slope failures within the canyon source fine grained material (Reid and Hamilton, 1990; Amaro et al., 2015; Amaro et al., 2016; Hall et al., 2017) which is transported down-canyon via turbidity currents and mud-rich sediment gravity flows (Cunningham et al., 2005; Amaro et al., 2016; Carter et al., 2018). There is also evidence that internal tides may act to transport material up-canyon (Wilson et al., 2015; Lo Iacono et al., 2020).
Whittard Canyon is characterised by complex geomorphology and variable substrata that differ along the canyon axis and between branches (Stewart et al., 2014; Robert et al., 2015; Amaro et al., 2016; Ismail et al., 2018). The distribution of substrata is linked to the canyon geomorphology: increasingly finer-grained sedimentary substrata are associated with flat terrain whilst hard substrata are mostly associated with steep slopes (Stewart et al., 2014; Ismail et al., 2018). The hard substrata constitute bedrock outcrops and escarpments (vertical walls) as well as boulders and smaller fractions of hard rock originating from slope failures (Carter et al., 2018). Due to the remobilisation and deposition of sediment in the canyon, hard substratum is often coated in a sediment veneer of varying thickness.
2.2 Data acquisition
Data used in this study were acquired during a number of cruises (Table 1) and derived from global and regional ocean models.
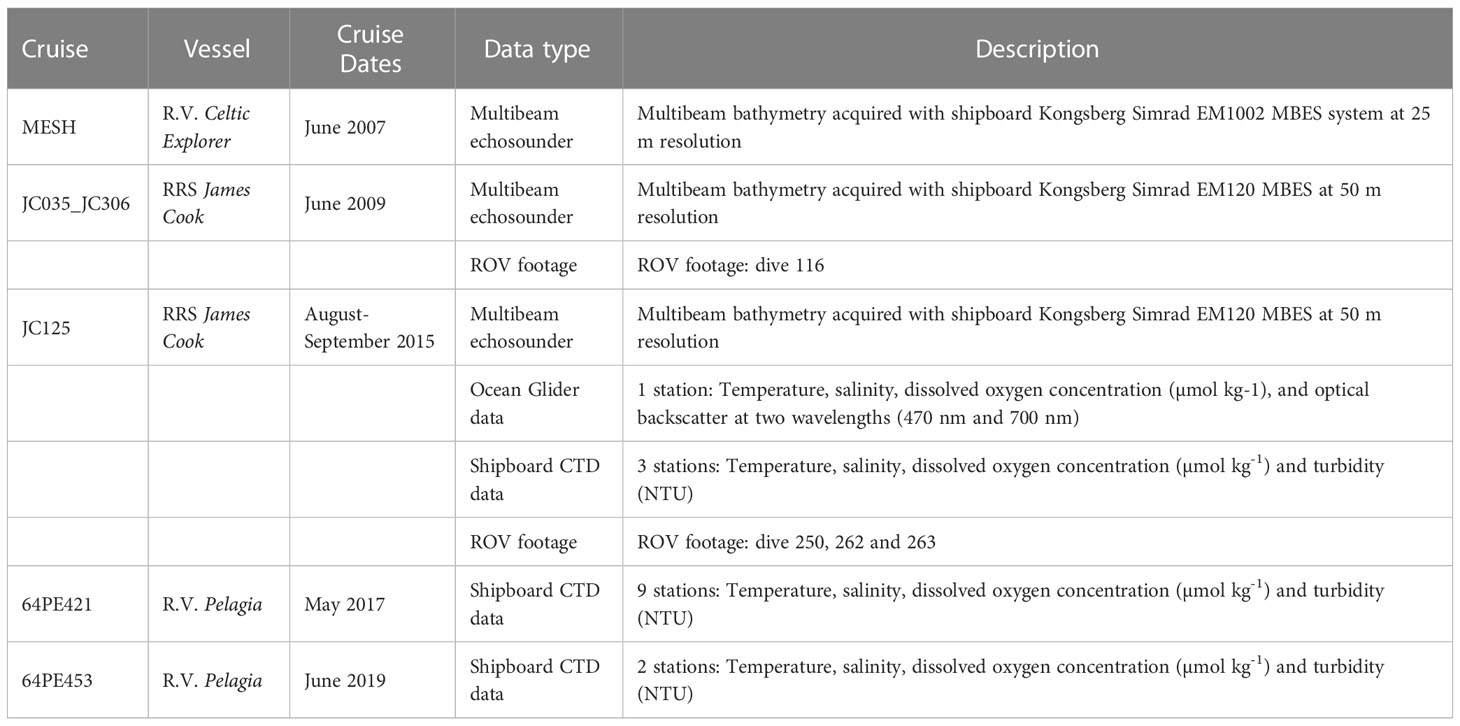
Table 1 Details of data used in this study, acquired from different cruises within Whittard Canyon.
2.2.1 Acoustic data acquisition and processing, and extraction of terrain derivatives
Multibeam echosounder (MBES) data were acquired during the MESH, JC035 and JC125 cruises (Table 1) (Davies et al., 2008; Masson, 2009; Huvenne et al., 2016). Bathymetry data were processed utilising CARIS HIPS & SIPS v.8 and combined utilising the mosaic to new raster tool in ArcGIS 10.4.1(RRID: SCR_011081), to produce a new grid at a resolution of 50 m (WGS1984, UTM Zone 29N). The terrain derivatives slope, aspect and rugosity were derived from the bathymetry data using the ArcGIS extension Benthic Terrain Modeler v. 3.0 (Walbridge et al., 2018) with a neighbourhood of 3 x 3 pixels. Rugosity is the ratio of the surface area to the planar area (Wilson et al., 2007). Slope is a measure of change in elevation over distance. Aspect (subsequently converted to eastness and northness) measures the compass orientation of the direction of maximum slope. The terrain derivatives were chosen as they have previously been shown to be informative explanatory variables of canyon fauna distribution within Whittard Canyon (Robert et al., 2015; Price et al., 2019; Pearman et al., 2020). Bathymetric slope criticality to the dominant semidiurnal internal tide (α) was calculated from INFOMAR bathymetry (INFOMAR, http://www.infomar.ie ) gridded at 200 m and potential density derived from a ship-based CTD cast during JC125 interpolated to 50 m resolution by kriging using the Spatial Analyst toolbox in ArcGIS (Supplementary materials 1.1). The environmental variables were exported as rasters at 50 m resolution (Supplementary Materials Figure 1).
2.2.2 Model-derived hydrodynamic variables
Tidal current variables were extracted from a 500 m horizontal resolution regional hydrodynamic model (a modified version of the Princeton Ocean Model) used to simulate the semidiurnal internal tide in Whittard Canyon (see Aslam et al. (2018) for further details). Three variables were extracted: barotopic current speed, near-bottom baroclinic current speed, and near-bottom total (barotropic plus baroclinic) current speed. In each case, the variable is the root mean squared (r.m.s.) speed over a single semidiurnal tidal cycle. To match the resolution of the terrain derivatives, tidal current speeds were horizontally interpolated into rasters with 50 m resolution (Supplementary Figure 1). Interpolation was undertaken by kriging using the Spatial Analyst toolbox in ArcGIS, and based upon spatial variograms calculated in Golden Software Surfer V 8. To account for discrepancies in bathymetric depth over small topographic features between the hydrodynamic model grid and the 50 m MBES bathymetry, modelled current speed values were extracted from the vertical level nearest to that of the MBES bathymetry.
2.2.3 Observed hydrodynamic variables
Hydrographic data along the Eastern canyon branch were collected using an autonomous ocean glider and shipboard CTD surveys (Figure 1). The glider data were acquired with an iRobot 1KA Seaglider operating in virtual mooring mode around station VM5 (Figure 1) for 43 hours, during which it completed 22 full-depth dive cycles (see in Hall et al. (2017) for further details). During each dive two profiles of temperature, salinity and dissolved oxygen concentration (µmol kg-1), were measured. Temperature and salinity were sampled every 5 seconds; oxygen concentration was sampled every 5 seconds in the upper 200 m and every 30 seconds between 200 m and 1000 m (or the seabed). All the glider data were quality controlled and averaged (median value) in 5 m depth bins before further analysis. The CTD data were acquired with a Seabird Electronics Sea-Bird SBE 911plus at 14 stations within the Eastern branch (Figure 1). Profiles of temperature, salinity and dissolved oxygen concentration were sampled at 24 Hz and averaged in 1 m depth bins. Accurate oxygen concentration measurement with a CTD is difficult and data was not calibrated by Winklers. However, the observed variability, which is the focus of this study, is accurate. Conservative temperature (°C), absolute salinity (g kg-1), and potential density (kg m-3), were calculated from the glider and CTD data using the Gibbs Sea Water Oceanographic Toolbox in Matlab (McDougall and Barker, 2011) (RRID: SCR_001622).
The CTD data were used to assess spatial and temporal variability within the dataset and confirm consistency between stations in close proximity but occupied at different times. As all ROV dives went below the seasonal thermocline, consistency at these depths allowed multiple CTD casts in close proximity to an ROV dive (Figure 1) to be averaged and linearly extrapolated to the maximum depth of the dive (Supplementary Figures 2 and 3). The averaged and extrapolated profiles were then used to derive environmental variables at the ROV dive sites for the multivariate analysis.
2.2.3.1 Semidiurnal vertical isopycnal displacement and water mass property variability
Both the glider and CTD data were used to calculate vertical isopycnal displacement caused by the semidiurnal internal tide. At sites toward the canyon head, above 900 m depth, glider data from VM5 were used; at mid-canyon sites, below 900 m CTD data from stations JC125_05, JC125_06 and JC125_19, deployed on the 16/08/2016, 20/8/2015 and 6/9/2015, were used. Density anomaly, ρ'(z, t) = ρ(z, t) – (z), where ρ is measured potential density and is time-average potential density, is calculated first, followed by vertical isopycnal displacement, ξ(z, t) =-ρ'(∂/∂z)-1. An M2 (the dominant semidiurnal tidal constituent, with a period of 12.42 hours) harmonic analysis was applied to vertical isopycnal displacement on each depth level using t-tide (Pawlowicz et al., 2002) to yield M2 amplitudes for vertical isopycnal displacement (). To justify the use of vertical isopycnal displacement derived from different datasets, consistency between the density profiles was confirmed (Supplementary Figures 2, 3).
The glider and CTD data were also used to infer the temporal variability of water mass properties due to vertical advection by the semidiurnal internal tide. At each location and on each depth level that harmonic analysis was applied, the resulting M2 vertical isopycnal displacement amplitude was compared to time-average profiles of water mass properties (conservative temperature, absolute salinity, potential density, and dissolved oxygen concentration). The range of water mass properties within the vertical envelope defined by isopycnal displacement was considered the range of properties that would be experienced by an organism at that depth due to vertical advection.
2.2.4 Seafloor imagery
2.2.4.1 Imagery data acquisition
Video data were acquired during the JC036 and JC125 cruises (Table 1), using the remotely operated vehicle (ROV) Isis. During JC036 Isis was equipped with a standard definition video camera (Pegasus, Insite Tritech Inc. with SeaArc2 400 W, Deep sea Power&- Light illumination) and stills camera (Scorpio, Insite Tritech Inc., 2048 x 1536 pixels). For the JC125 cruise, the ROV Isis was equipped with a dual high definition stills and video camera (Scorpio, Insite Tritech Inc., 1920 x 1080 pixels). Positional data were derived from the ROV’s ultra-short baseline navigation system (Sonardyne USBL). A total of four dives encompassing vertical walls were completed in the Eastern branch to depths of 1420 m (Figure 1 and Table 2) (Robert et al., 2015). Epibenthic morphospecies (visually distinct taxa) >10 mm were annotated from the video, using a laser scale with parallel beams positioned 10 cm apart to estimate organism size. Those sections where the seabed was out of view for extended periods, prohibiting annotations, were noted by time and excluded from subsequent analysis.
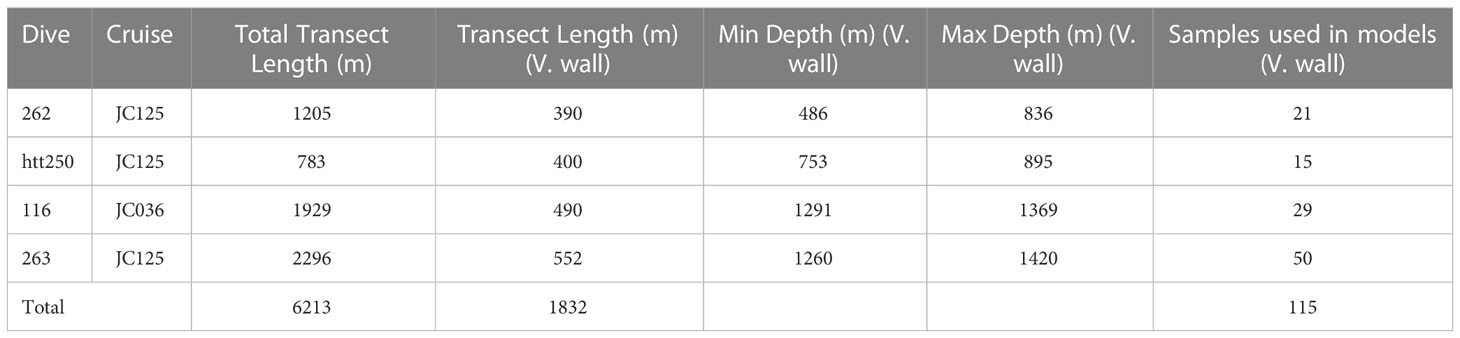
Table 2 Characteristics of ROV dives in Whittard Canyon analysed in the study: Cruise number, total transect length (m), transect length (m) coincident with vertical walls, maximum and minimum water depth (m) coincident with vertical walls and number of samples extracted from each dive that represent vertical walls.
Composition of substrata was visually assessed and assigned a class based on the CATAMI classification (Althaus et al., 2015) (Table 3). Additionally, occurrences of coral reef and dead coral reef framework were annotated (example images are provided in Supplementary Figure 4). Due to the patchy distribution of substrata, substratum type was coded based upon the dominant substratum type followed by the subordinate, for example hard substratum with coral rubble was coded as H_CR. Vertical walls were identified visually from video data, and defined as topography oriented at an angle >50° to horizontal, and of a height >3 m.
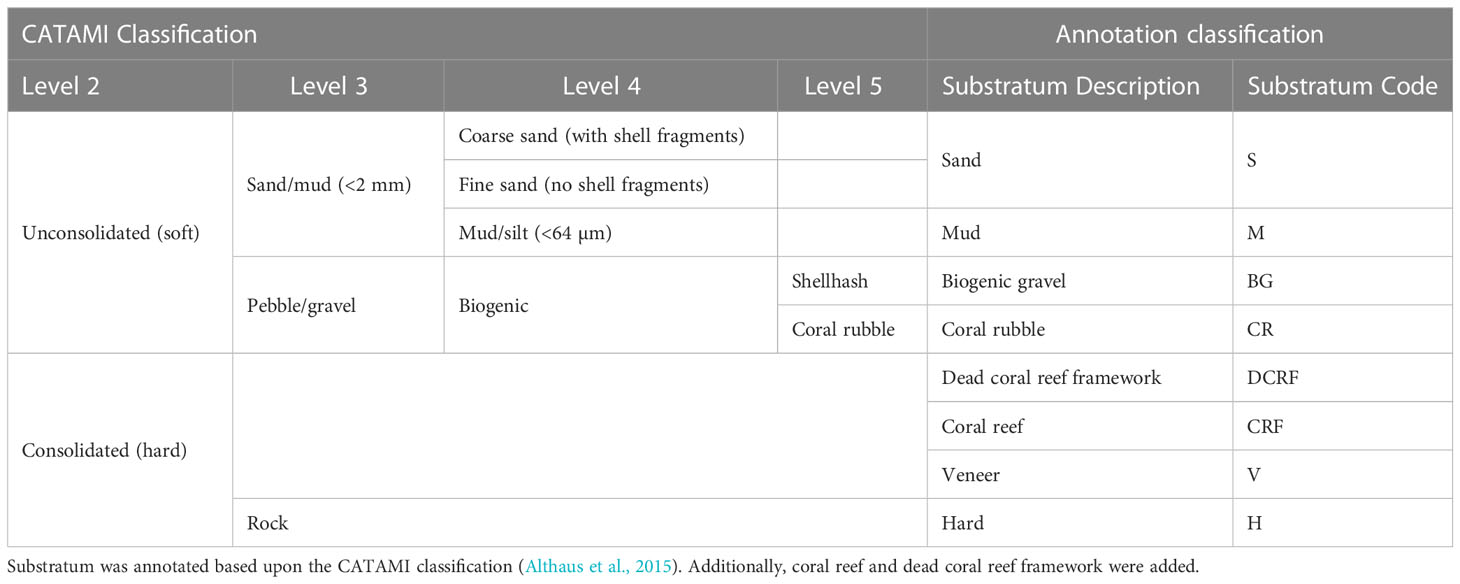
Table 3 Substratum classification used in annotation of image data.
2.2.4.2 Imagery data analysis
Annotations from the JC036 (previously annotated by Robert et al. (2015)) and JC125 cruises were combined into a single data matrix and nomenclature standardised. Transects were subdivided into 10 m length sections and the morphospecies records within each section consolidated. Species richness and Simpson’s reciprocal index (1/D) (Simpson, 1949) were calculated for each 10 m section sample. A 10 m sample length was chosen after data exploration revealed that distinct bands of fauna usually occurred in linear events <50 m so that 10 m sample units would enable structure in assemblages on walls to be identified (Borcard et al., 2011).
2.2.5 ROV derived depth
ROV derived depth was calculated to provide a higher resolution dataset than available from shipborne bathymetry (Robert et al., 2017). For approximately horizontal terrain, depth values for the seabed were derived by combing the ROV’s altitude and depth records to obtain a seabed depth value (m). The ROV attitude data were cross-referenced with annotations to identify sections of vertical wall and for these sections ROV depth alone was used in the calculation. A smoothing average with a temporal window size of 3 seconds was applied to the new depth variable.
2.3 Statistical analyses
Univariate and multivariate analysis techniques were used to identify spatial patterns in faunal diversity and assemblages on canyon walls. Highly mobile taxa such as fish that can be ‘double counted’ were removed prior to analysis. Samples with <2 taxa present were also excluded from multivariate analysis. Environmental data coincident with the midpoint co-ordinate of each fauna sample were extracted from the rasters and combined with CTD data extracted from depth profiles coincident with the depth of the sample. Samples D263_108 and D263_109 were removed as CTD data did not extend to the water depths of these samples. Data exploration was undertaken following the protocol described in Zuur et al. (2010).
Generalised Linear Models (GLMs) were used to explore the relationships between diversity (species richness and 1/D) and the environmental variables. Species richness and 1/D were assessed using GLMs with link functions based on an exponential relationship between the response variable and the environmental predictor variables (Zuur et al., 2014b). A Poisson distribution was assumed for species richness and a Gamma distribution was assumed for 1/D, based upon the distribution of the response variable, together with a log link function. Environmental variables were selected by forward selection under parsimony after Pearson’s correlation and Variance Inflation Factor (VIF) scores were used to remove highly correlated variables (absolute correlation coefficients >0.7) (Zuur et al., 2014b). Model assumptions were verified by plotting residuals versus fitted values, versus each covariate in the model and each covariate not in the model. Residuals were assessed for spatial dependency via variograms (Zuur et al., 2014a). To further account for inherent spatial autocorrelation in the data, the residual autocovariate (RAC) was calculated for the optimal model. The RAC represents the similarity between the residual from the optimal model at a location compared with those of neighbouring locations. This method can account for spatial autocorrelation without compromising model performance (Crase et al., 2012).
Multivariate species data were assessed with non-metric Multi-Dimensional Scaling (nMDS) and hierarchal cluster analysis with group-averaged linkage, using a Hellinger dissimilarity matrix derived from the Hellinger transformed data matrix. Data were Hellinger transformed to enable the use of linear ordination methods (Legendre and Gallagher, 2001; Legendre and Legendre, 2012). The optimal number of interpretable clusters was determined with fusion level and mean silhouette widths (Legendre and Legendre, 2012). Characteristic morphospecies contributing to similarity among clusters were identified using the Similarity Percentage analysis (SIMPER) routine (Clarke, 1993).
Canonical Redundancy Analysis (RDA) was used to explore relationships between the multivariate species data and the different environmental variables. RDA combines the outputs of multiple regression with ordination (Legendre and Legendre, 2012). Prior to RDA, environmental data were standardised (i.e. transformed to zero mean, and unit variance). Forward selection was then carried out on the environmental variables to obtain the most parsimonious model and Pearson’s correlation together with VIF scores were used to exclude environmental variables that showed strong collinearity with others present within the model (absolute correlation coefficients >0.7) (Borcard et al., 2011).
Spatial correlation in the multivariate species data was assessed by incorporating sample coordinates into the RDA of species data and by means of a Mantel correlogram on the detrended species data. Variance partitioning was then performed to assess how much of the variance explained in the species data by the environmental variables was spatially structured. Variance partitioning was performed using the environmental variables from the parsimonious model and sample coordinates, after forward selection (Legendre and Legendre, 2012).
During model selection for GLM and RDA, high collinearity was observed between certain environmental variables and depth. Depth per se does not influence fauna, but in canyons depth is correlated with measured and unmeasured environmental factors (e.g. current speed and water mass properties) that have been shown to influence faunal patterns (Robert et al., 2015; Pearman et al., 2020). Consequently, depth was retained in analysis, for ease of interpretation though in later sections we also discuss potential effects of correlated environmental factors.
All statistical analyses were conducted using the open source software R (R_CORE_TEAM, 2014), packages “Packfor” “vegan”, “cluster”, “ape”, “ade4”, “gclus”, “AEM”, “spdep” and “MASS”.
3 Results
3.1 Spatial and temporal gradients in canyon oceanography
Glider and CTD measurements showed several water masses in the Eastern branch of Whittard Canyon (Figure 2 and Supplementary Figure 6). The ENAW (σ range: 27.1 – 2 7.25 kg m−3) occurs below the seasonally warmed surface waters to approximately 600 m water depth (Figure 2). The influence of the MOW (σ range 27.5 – 27.6 kg m−3), seen as a salinity maximum, can be observed from measurements taken further down the canyon axis, between 800 – 1200 m water depth, but is absent from those towards the canyon head (Figure 2). Similarly, large gradients in dissolved oxygen concentration that are observed from measurements taken further down the canyon axis are absent from those toward the canyon head (Supplementary Figure 6).
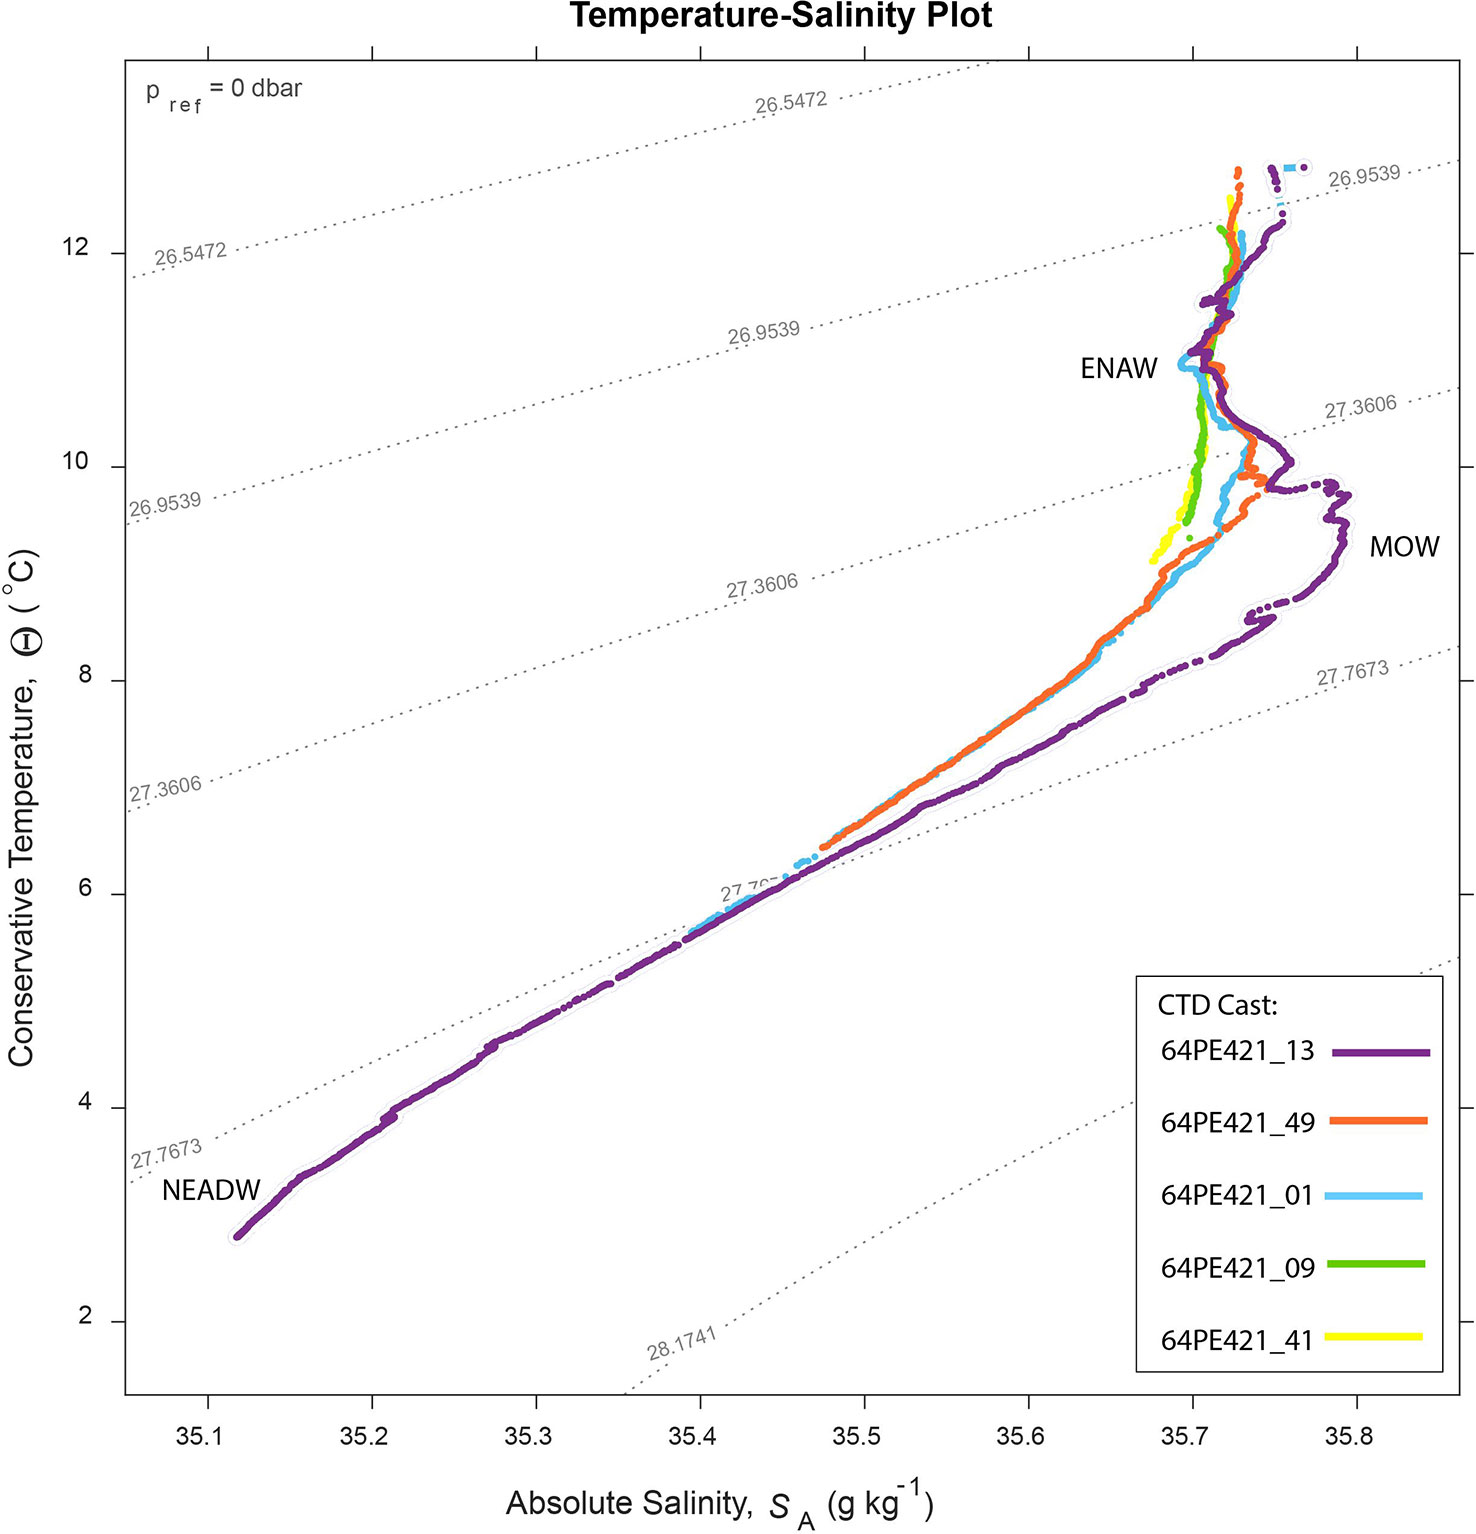
Figure 2 Temperature – salinity plot for 5 CTD casts along the canyon branch axis, collected during the 64PE21 cruise. See Supplementary Materials Figure 5 for CTD locations. The influence of the MOW decreases toward the head of the canyon.
Vertical isopycnal displacement derived from the glider (Hall et al., 2017) and CTD data showed variability along the Eastern branch and with depth. The highest displacement amplitude from the glider data (VM5, upper canyon) was 53 m at 617 m water depth (Figure 3), resulting in tidal temperature variations of 0.53°C, salinity variations of 0.004 g kg-1, potential density variations of 0.09 kg m-3 and dissolved oxygen variations of 9.2 μmol kg-1. The highest amplitude calculated from the CTD data (mid canyon) was 140 m at 942 m water depth (Figure 3), resulting in tidal temperature variations of 1.55°C, salinity variations of 0.1 g kg-1, potential density variations of 0.16 kg m-3 and dissolved oxygen variations of 5.8 μmol kg-1.
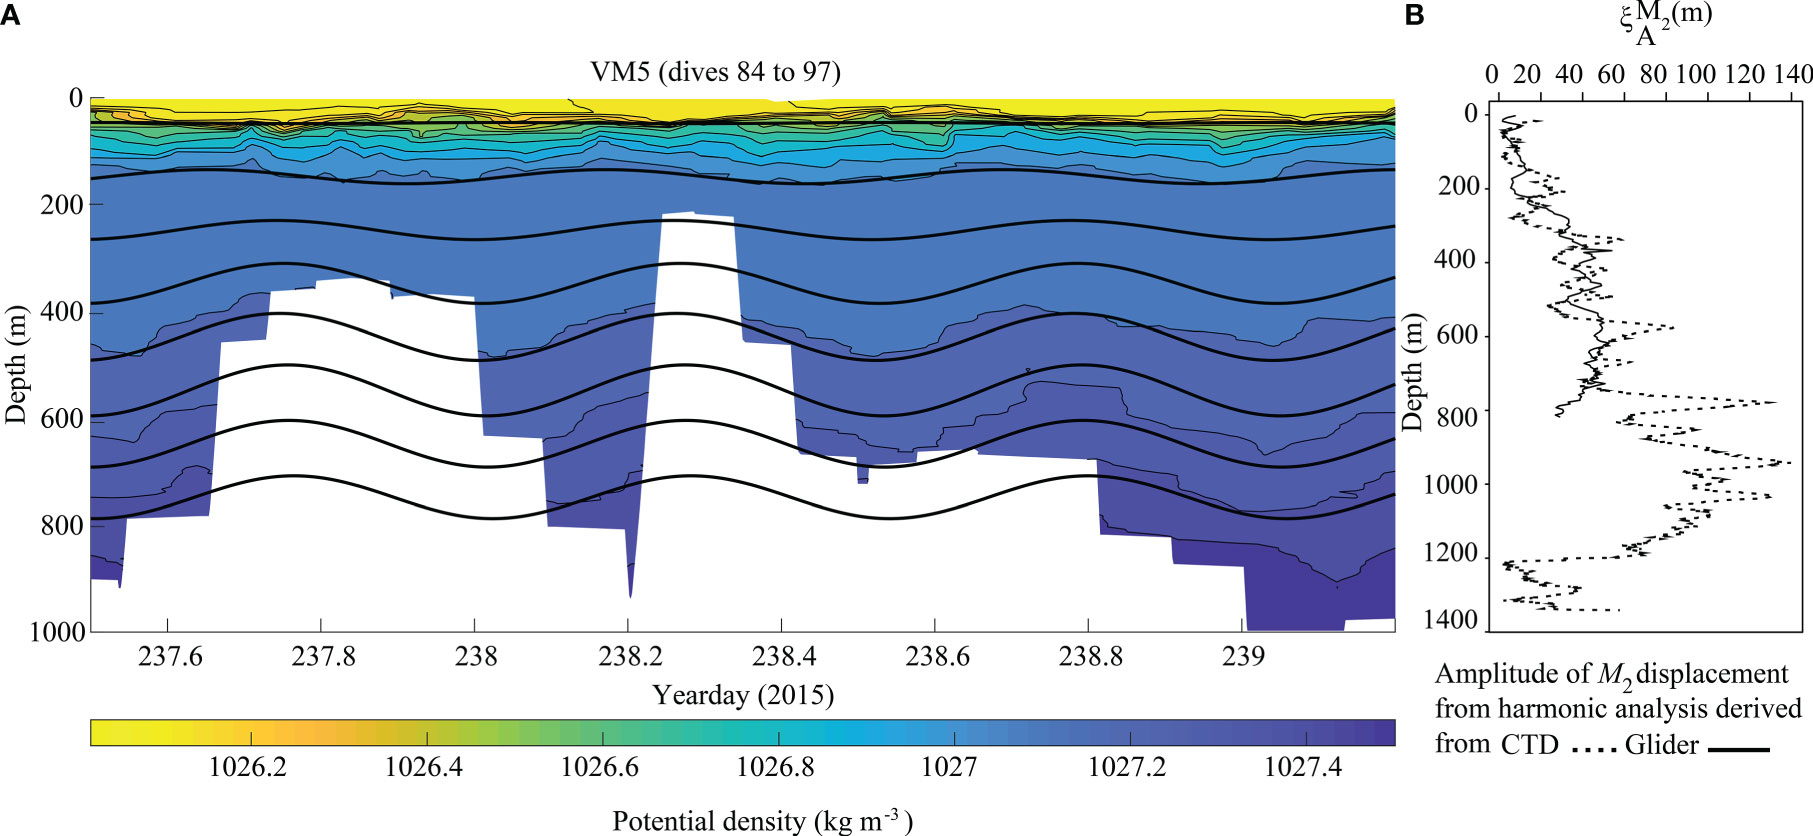
Figure 3 Time series of potential density overlaid with M2 harmonically filtered vertical isopycnal displacement every 100 m calculated from (A) VM5. When operating in virtual mooring mode the glider stayed within 2.5 km of the station, but this imperfect geolocation over the steep canyon bathymetry resulted in a range of dive depths (white background). (B) Amplitude of M2 displacement from the harmonic analysis derived from CTD (dashed lines) and glider data (Solid lines).
3.2 Spatial patterns of faunal diversity and assemblage composition on deep-sea canyon walls
A total of 14701 individuals assigned to 150 morphospecies were annotated. Most morphospecies were rare, whilst others were abundant in specific locations and occurred at low density across the rest of the samples. The most abundant morphospecies was Brachiopoda sp. 1 (4440). The most common morphospecies recorded across dives was Caryophylliidae sp. 1 (in 69.2% of total samples). Highest species richness (29/10 m transect) and 1/D (10.87) was observed from dive 262 on hard substratum vertical wall with coral rubble.
Walls toward the head of the canyon (dives 262 and 250) were steep and comprised of an alternation of geological strata resistant to erosion, and friable, less competent sedimentary units of varying thickness with occasional ledges, all of which was covered in a mud veneer of varying thickness. The bivalves Neopycnodonte sp. 1 and Acesta excavata, stony corals Madrepora oculata and Caryophylliidae sp. 1 and crinoids were observed to aggregate beneath ledges (Figure 4). On other sections of wall, the black coral Antipathidae sp. 1 or the basket star Brisingidae sp.1 reached relatively high abundances (Figure 4) and Cerianthidae sp. 1 occurred where soft sediment accumulated (Figure 4). The walls toward the canyon head were supercritical to the M2 tide and although the area is exposed to relatively weaker currents 0.17 – 0.23 m s-1 (Supplementary Figure 1) it experienced similar short-term temporal variability of water mass properties to that of walls sampled in the mid canyon (dives 116 and 263), despite the water temperature being up to 5°C warmer.
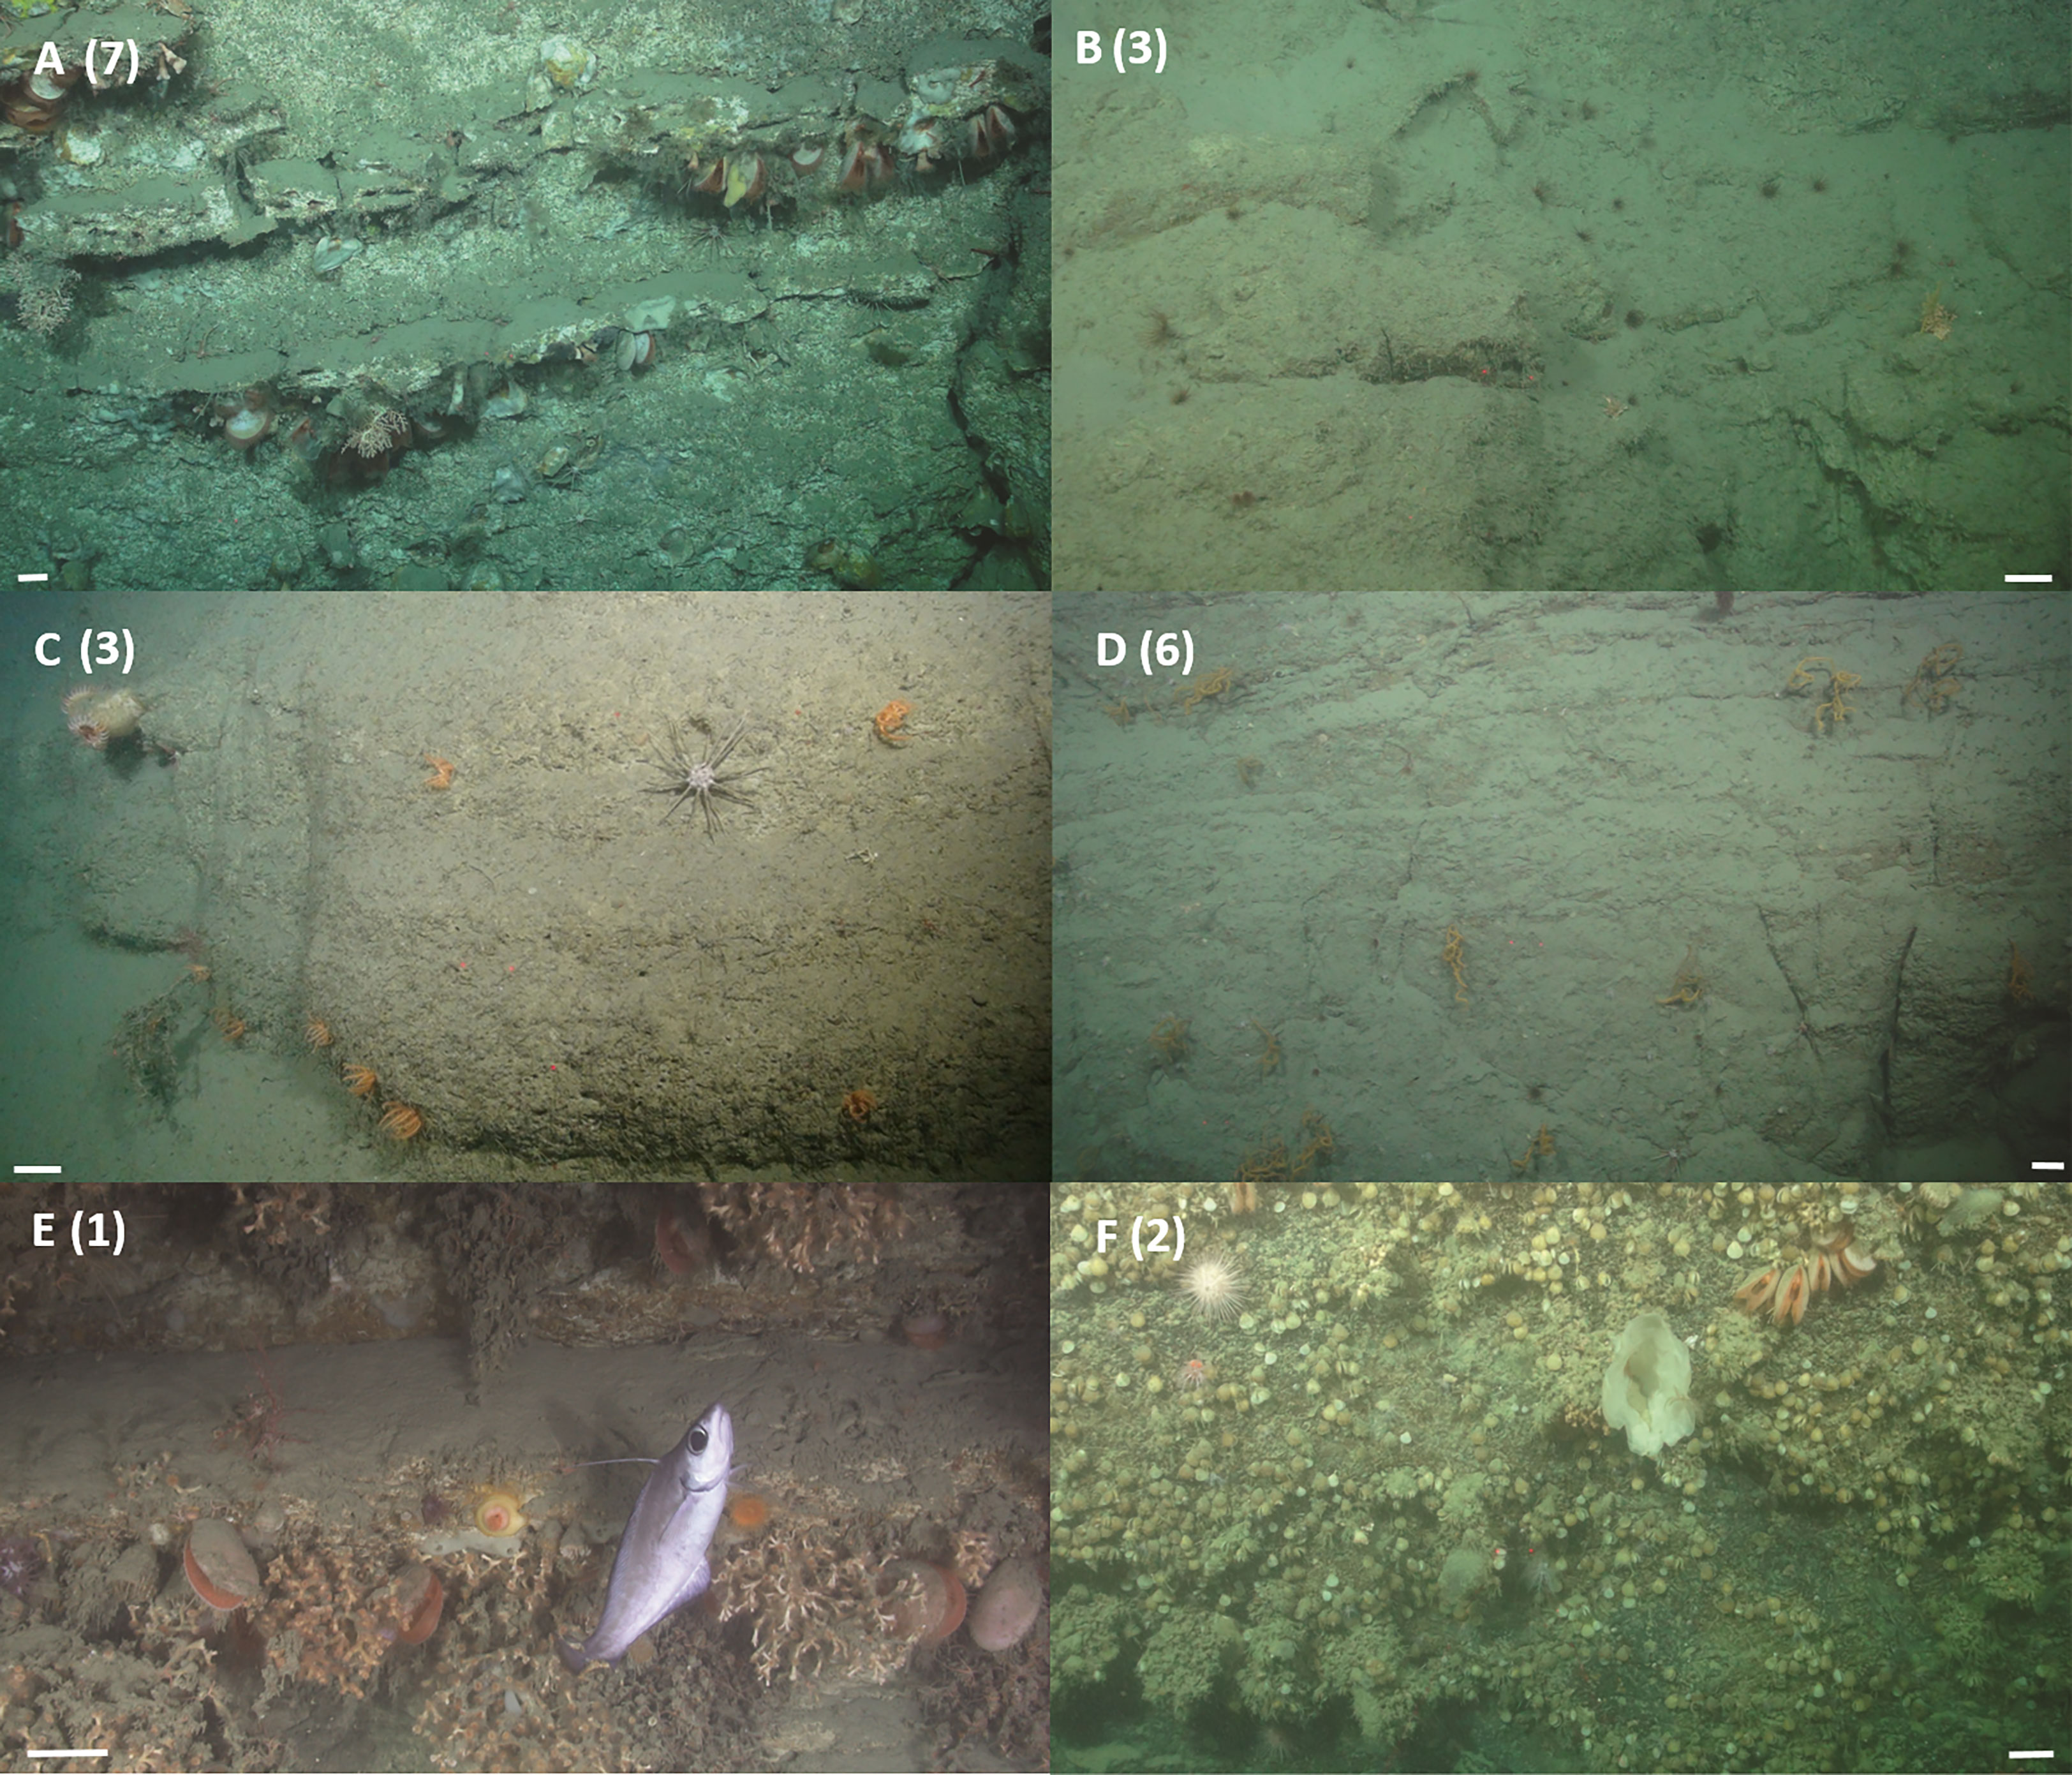
Figure 4 Example images of vertical wall assemblages observed from ROV video data. (A) The deep water oyster Neopycnodonte sp. 1 and the deep water bivalve Acesta excavata, the stony corals Madrepora oculata and Caryophylliidae sp. 1, the squat lobster Munididae sp. 1, the urchin Cidaris cidaris and crinoids, were observed aggregating beneath ledges, image taken during dive 262 at 637 m. (B) The anemone Cerianthidae sp. 1 occurs wherever there is sufficient soft sediment, image taken during dive 250 at 849 m. (C) The urchin C. cidaris and the seastar Brisingidae sp. 1, the anemone Phelliactis sp. 1, image taken during dive 262 at 826 m. (D) The black coral Antipathidae sp. 1, the urchin C. cidaris, the anemone Cerianthidae sp. 1, image taken during dive 262 at 733 m. (E) The stony coral Desmophyllum pertusum, the deep water bivalve A. excavata, the coral morphospecies Anthozoa sp. 1, the anemones morphospecies Actinaria sp. 2 and Actinernus michaelsarsi, and the fish Lepidion eques, image taken during dive 116 at 1362 m. (F) Brachiopoda sp. 1, sponge morphospecies chalice sponge, the deep water bivalve A. excavata, the holothurian Psolus squamatus, the stony coral Caryophylliidae sp. 1 and the urchin Echinus sp. 1, image taken during dive 263 at 1344 m. Scale bars = 10 cm. Numbers denote cluster membership after cluster analysis.
Dense aggregations of D. pertusum framework were observed between 1301 and 1369 m water depth (dive 116) from walls comprised of alternations of strong and weak, thinly bedded sedimentary units that resulted in a ‘stepped’ relief (Figure 4) and that were covered in a mud veneer of varying thickness. The walls were supercritical to the M2 tide in a region exposed to high current speeds of 0.42 – 0.46 m s-1.
Brachiopods, large erect sponges and arborescent gorgonians were observed between 1261 – 1406 m water depth (dive 263) from walls that comprised brown rocky strata resistant to erosion and covered in a mud veneer of varying thickness (Figure 4). The walls were critical to the M2 tide and experienced currents of 0.27 – 0.29 m s-1.
3.3 Statistical analysis results
High collinearity was present within the environmental dataset. Density, temperature, salinity and current speed were highly correlated with depth, as on occasion were values for the M2 amplitude and associated ranges in density, temperature and salinity. As a result, only M2 amplitude, depth, criticality and substratum type were retained for the final RDA and depth, slope and substratum type retained in the final GLM model.
3.3.1 Species diversity
The GLM analysis of the vertical wall dataset identified slope, depth and substratum as significant variables explaining 39% deviance in species richness across the dives and 43% deviance in 1/D across dives. Species richness showed a weak positive relationship with slope and a weak negative relationship with depth and increasing soft sediment, biogenic gravel and coral reef framework. On the other hand, 1/D showed a weak negative relationship with slope and a weak positive relationship with depth, increasing soft sediment (Table 4).
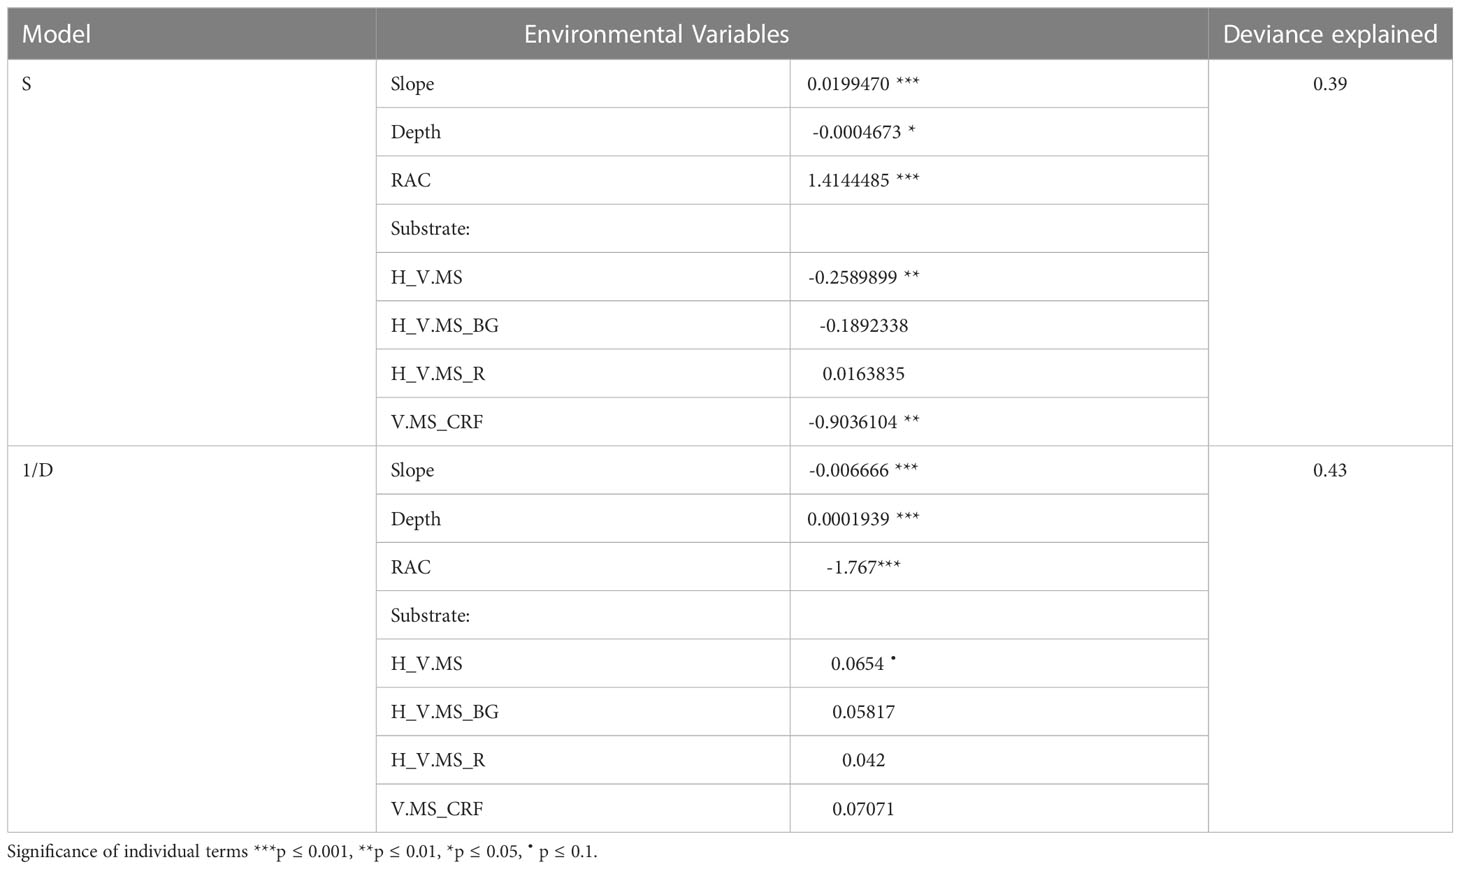
Table 4 Results from Generalised Linear Model for species richness and the selected environmental variables.
3.3.2 Canyon wall assemblages
Hierarchical clustering identified nine clusters (Figure 5, Table 5 and Supplementary Figure 7) that separated into three regions of the nMDS plot (Figure 5). From review of clustering (Figure 5) and SIMPER results (Table 5 and Supplementary Table 1) it is likely that clusters 1, 2 and 3 represent the three main assemblages with the remaining clusters representing transitionary components.
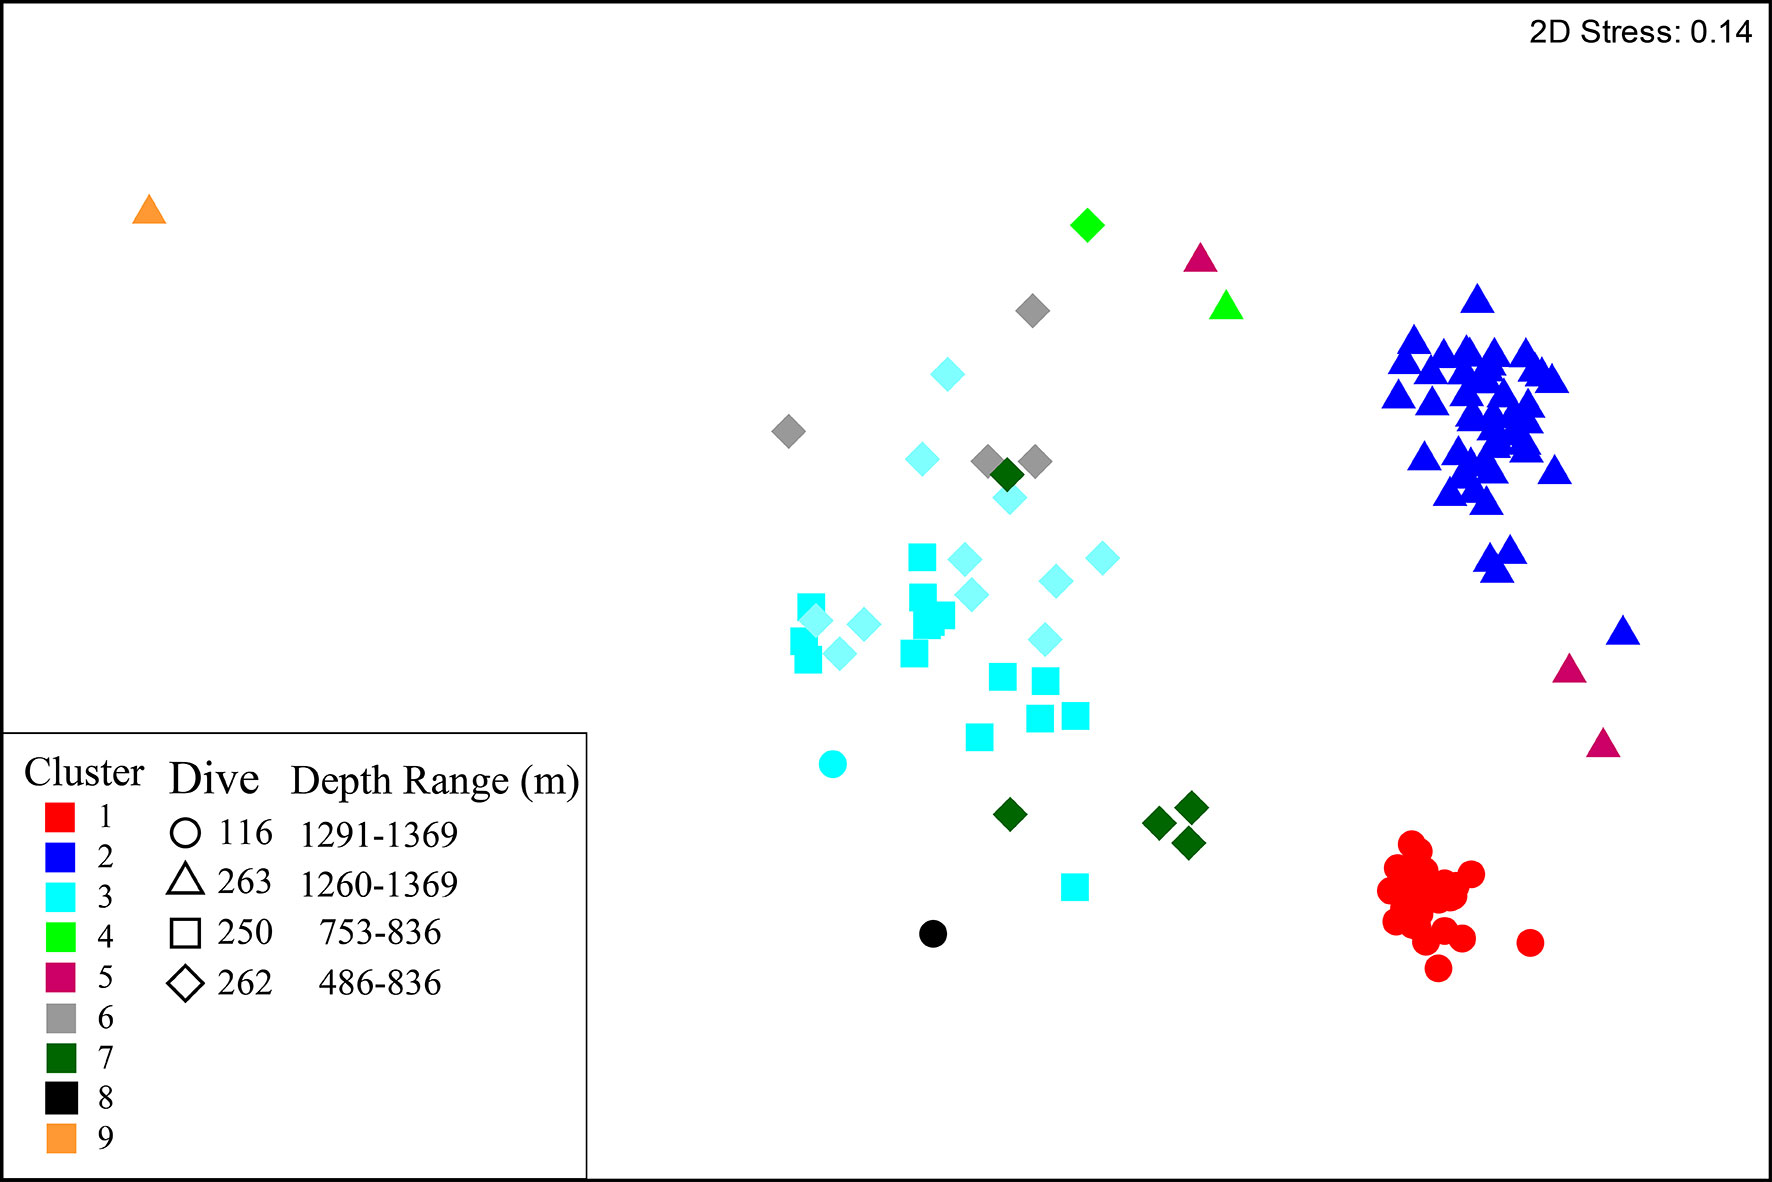
Figure 5 nMDS plot of multivariate Hellinger transformed species data. Samples are coloured to represent the nine clusters identified by hierarchal clustering analysis. Shapes denote the dive from which samples were collected.
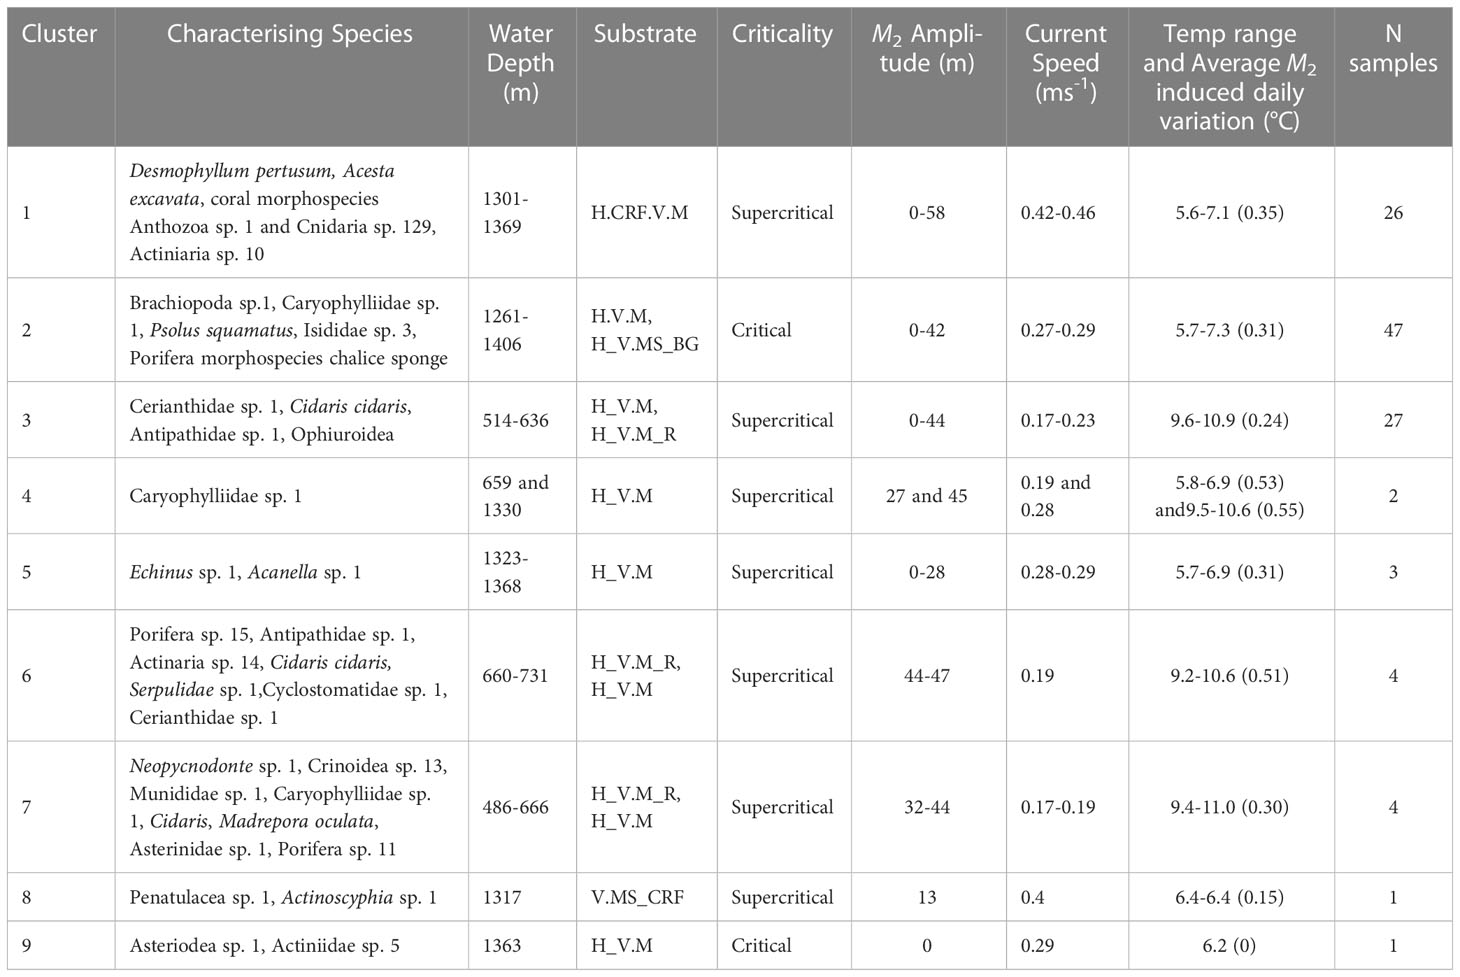
Table 5 Clusters identified from multivariate hierarchal clustering analysis with associated environmental parameters, number of samples represented by each cluster and SIMPER results identifying the morphospecies that characterise the clusters (70% accumulative contribution cut off).
Cluster 1 represents the D. pertusum assemblage observed from dive 116, cluster 2 (and transitionary cluster 5) represents the Brachiopoda sp. 1 assemblage observed from dive 263 and cluster 3 (and transitionary clusters 4, 6 and 7) represents the general mixed assemblage comprised of Cerianthidae sp.1, Cidaris cidaris and Antipathidae sp. 1 observed from dives 262 and 250 (Figures 4, 5 and Table 5). Clusters 8 and 9 were only represented by a single sample, limiting conclusions that can be drawn and so are omitted from further discussion (Figure 4 and Table 5).
Walls toward the head of the canyon (between 500 - 900 m) support a wider variety of assemblages with some observed across both dive 250 and dive 262 (Figures 5-7). In contrast, lower down the canyon at approximately 1350 m, different single assemblage types dominated opposite canyon walls (dives 116 and 263) (Figures 5-7).
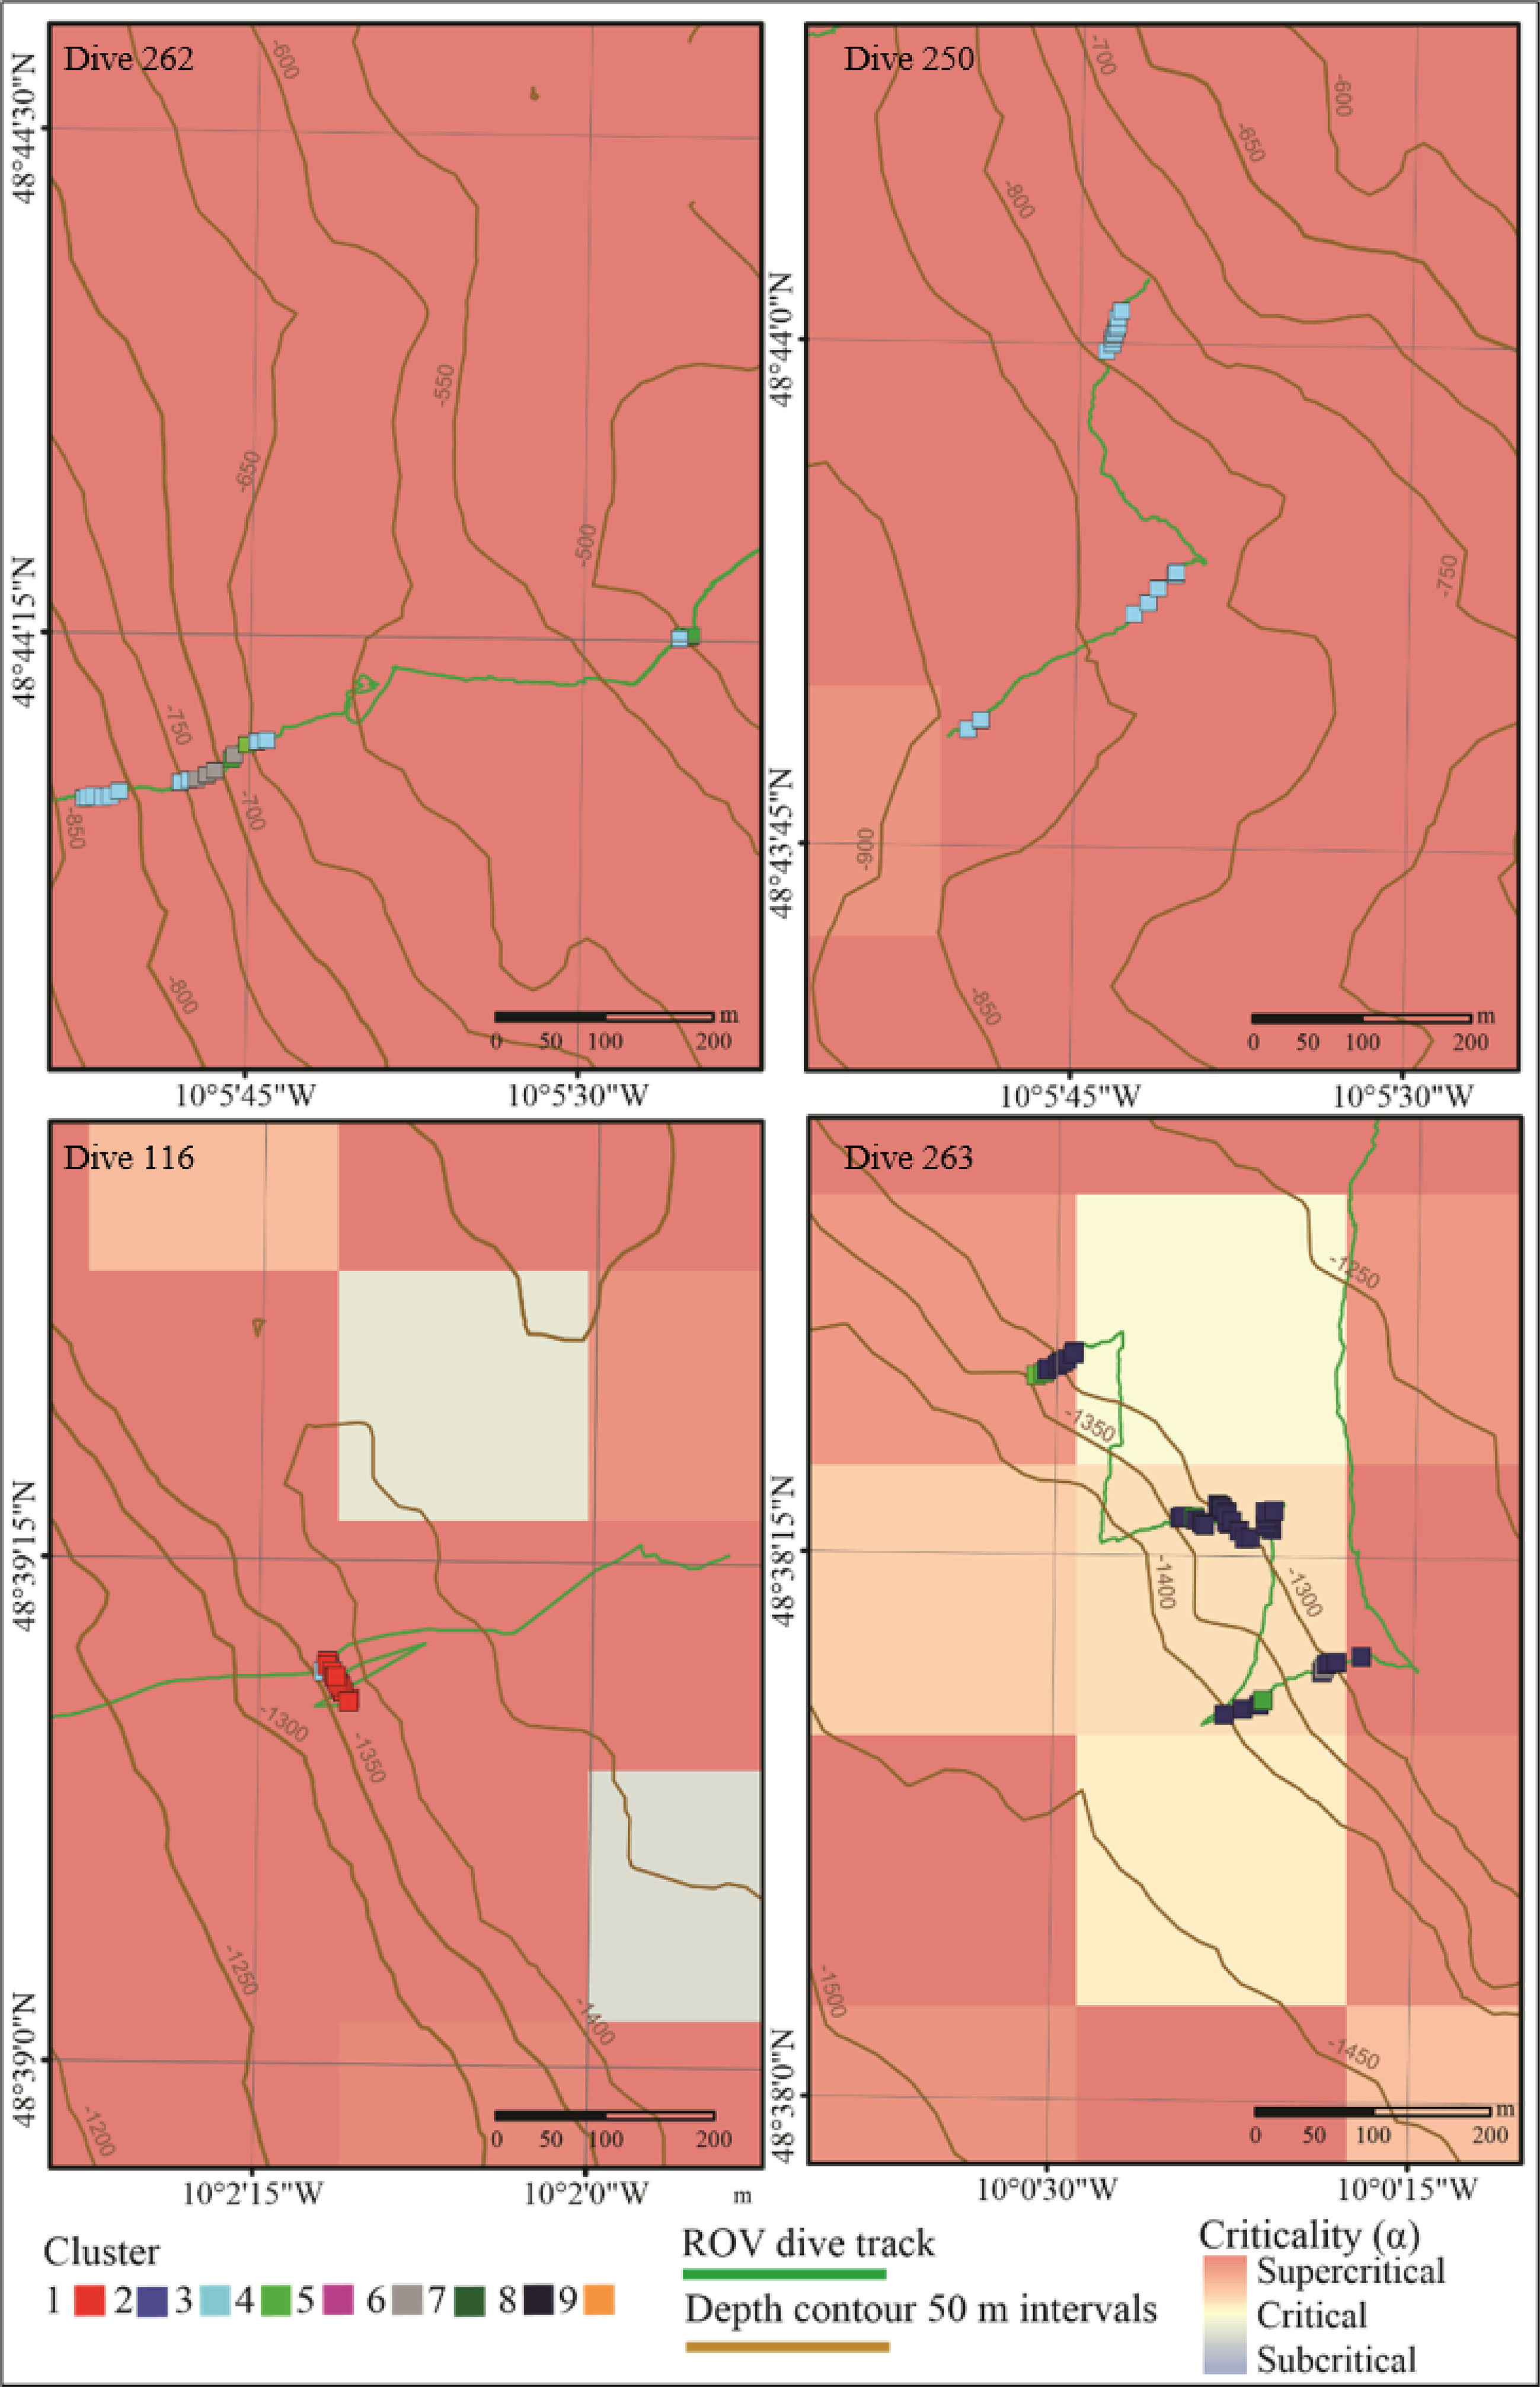
Figure 6 Spatial plot of sites (samples) from vertical walls across all dives plotted over bathymetric criticality to the M2 tide. Samples are coloured to represent the nine clusters identified by hierarchal clustering analysis.
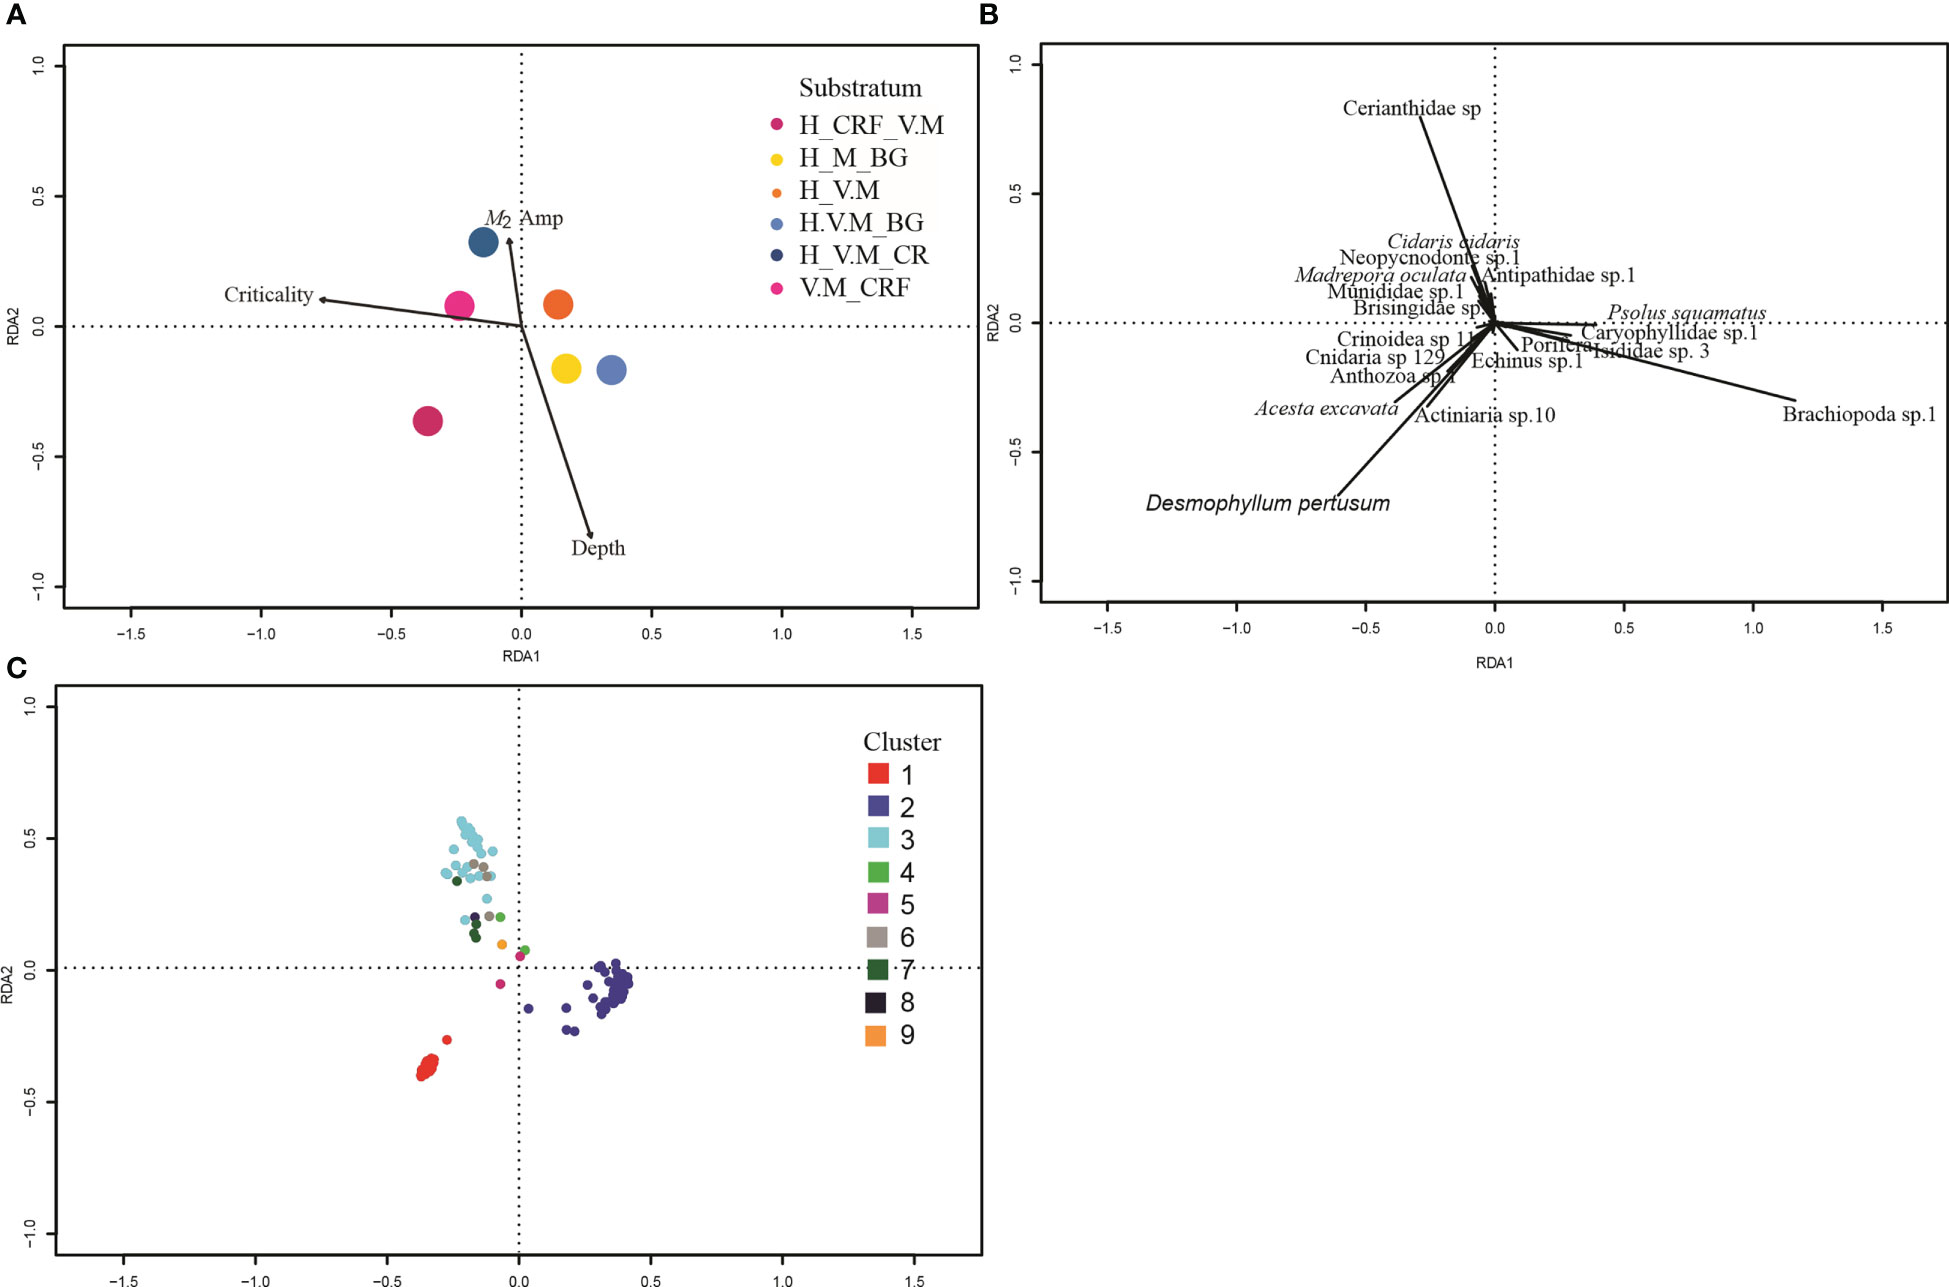
Figure 7 Canonical Redundancy Analysis of Hellinger transformed species data and selected environmental variables. For clarity, the triplot is displayed in three separate plots. (A) Environmental variables. The vector arrowheads represent high, the origin averages, and the tail (when extended through the origin) low values of the selected continuous environmental variables, centroids of categorical variables substratum shown as points colour coded by substratum type. (B) Species data with only species with strongest effect labelled. (C) Sites coloured by cluster following cluster analysis. Sites close to one another tend to have similar faunal structure than those further apart. Substratum codes: BG, Biogenic gravel; CR, Coral rubble; CRF, Coral reef framework; S, Sand; M, Mud; H, Hard; V, Veneer.
The RDA analysis demonstrated assemblage-environment relationships, showing that species aggregations are driven by depth, M2 amplitude, criticality of the slope and substratum type (Adjusted R2 48%) (Figure 7 and Table 6). The first axis of the RDA plot represents a gradient from reef to non-reef substrata and from supercritical to critical conditions, and the second axis represents a gradient in depth and M2 amplitude (Figure 7).
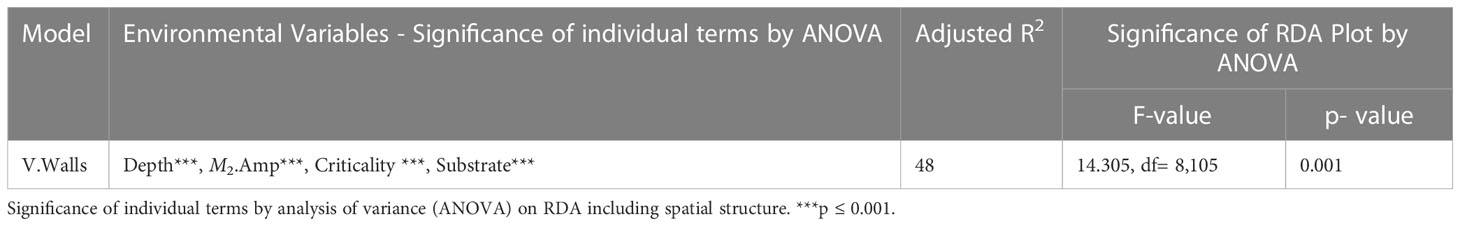
Table 6 Results from Canonical Redundancy Analysis of Hellinger transformed species data and selected environmental variables.
The vectors representing species scores (Figure 7) separate into three subgroups. The upper left quadrant, characterized by the predominance of the anemone Cerianthidae sp. 1, the urchin C. cidaris, the deep water oyster Neopycnodonte sp. 1, the black coral Antipathidae sp. 1, the squat lobster Munididae sp. 1, the basket star Brisingidae sp. 1 and the stony coral M. oculata; within which there was further differentiation depending on the relative abundance of Cerianthidae sp. 1, Antipathidae sp. 1, Neopycnodonte sp. 1 and Brisingidae sp. 1. The lower right quadrant was represented by a predominance of Brachiopoda sp. 1, the stony coral Caryophylliidae sp. 1, Isididae sp. 3, the holothurian Psolus squamatus, the chalice sponge and the urchin Echinus sp. 1. The lower left quadrant was characterised by the predominance of the stony coral D. pertusum, the deep water bivalve A. excavata, the anemone morphospecies Actiniaria sp. 10, two coral morphospecies (Anthozoa sp. 1 and Cnidaria sp. 129) and Crinoidea sp. 11.
The clustering and nMDS plots showed a similar trend by identifying nine clusters that separated into three regions of the nMDS plots (Figures 5, 7) comprised of the same characterising morphospecies as those in the RDA plot (Table 5). Cluster 1 relates to the lower left quadrant; cluster 2 relates to the lower right quadrant and cluster 3 relates to the upper left quadrant, with cluster 6 representing the increasingly Antipathidae sp. 1 dominated assemblage to the central upper left quadrant and cluster 4 representing the Neopycnodonte sp. 1 dominated assemblage.
Results of the spatial analysis show that fauna samples are spatially structured showing both a general trend at a broad scale and then greater similarity at distances <200 m and dissimilarity at distances >450 m that represents the difference between dives (Supplementary Figure 9). Variance partitioning shows 45.3% of variance explained in species data by environmental variables is also spatially structured in relation to the sample coordinates (Figure 8). Together these results suggest spatial patterns in species are driven by environmental variables, which themselves are spatially organised and so exhibit a degree of induced spatial dependence.
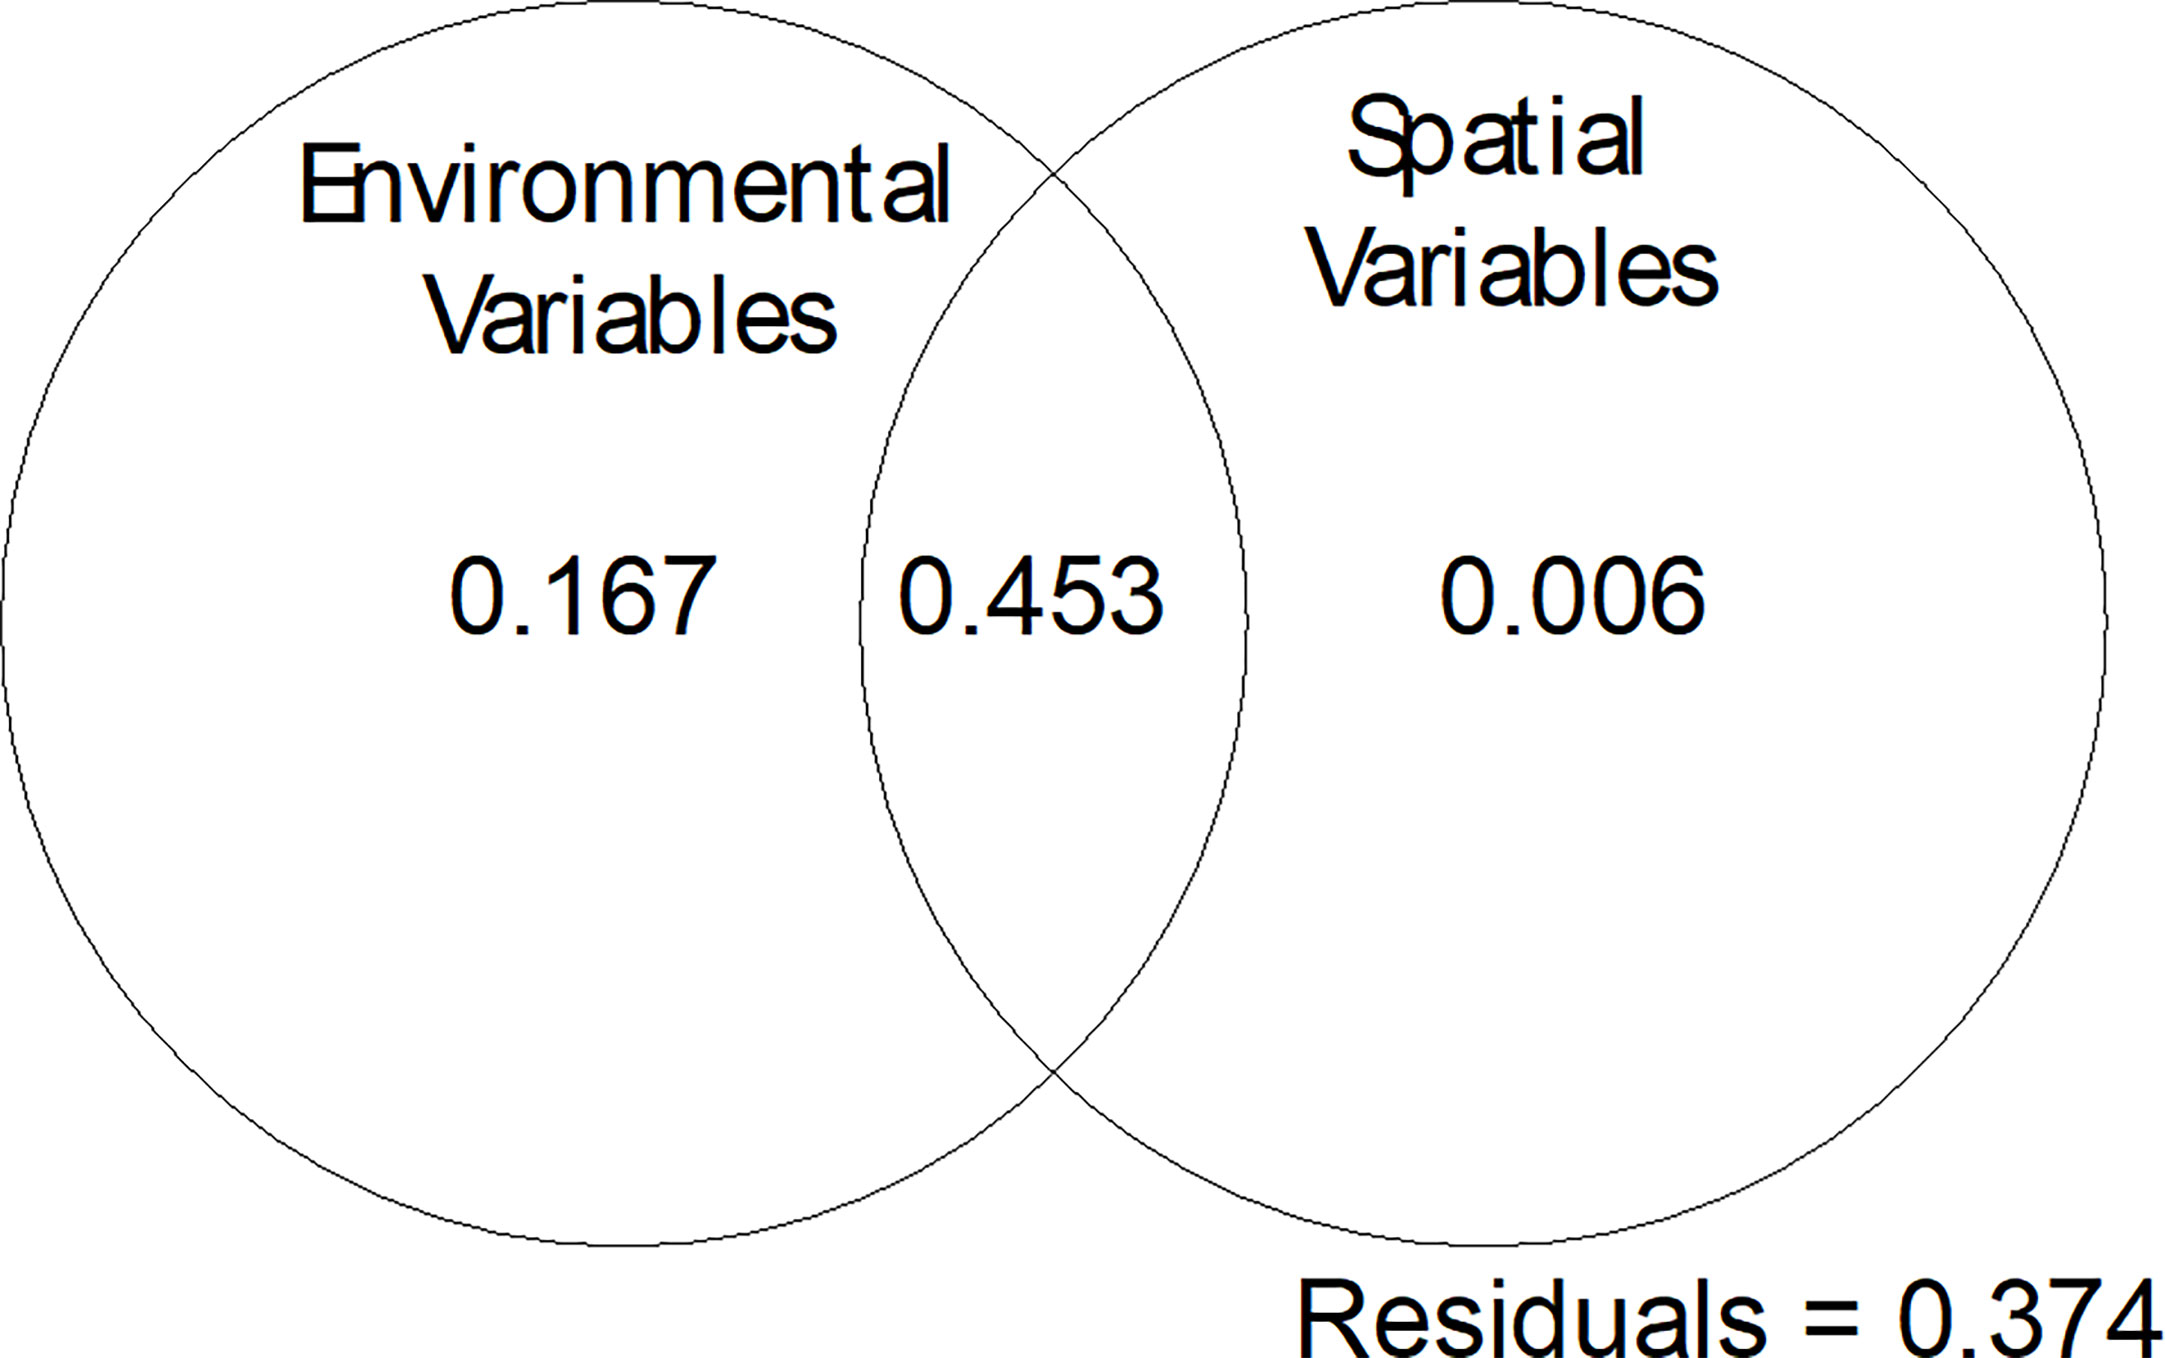
Figure 8 Variation partitioning plot for the Hellinger transformed species data, the selected environmental variables (depth, substratum, bathymetric criticality to the M2 tide and amplitude of the M2 tide) and spatial variables (sample coordinates).
4 Discussion
A number of studies have examined environmental drivers of faunal patterns in submarine canyons (Robert et al., 2015; Sigler et al., 2015; Pierdomenico et al., 2016; Domke et al., 2017; Bianchelli and Danovaro, 2019; Pierdomenico et al., 2019; Pearman et al., 2020) but until now, no study of canyon wall assemblages integrating both spatial and temporal oceanographic variability induced by the internal tide has been conducted. Using a multi-disciplinary approach, we have been able to further quantify spatial patterns in environmental variables and wall faunal assemblages in canyon settings.
Canyons are highly heterogeneous environments and the influence of spatial patterns in the environmental variables, coupled with the sample design of locations at two very different depths, makes it difficult to pull apart the role of environment vs the role of location (as illustrated by the strong significance of the RAC in the GLM and the overlap in variance partitioning in the RDA). Still, the nMDS and RDA results illustrate that faunal assemblages are not simply determined by ROV dive or sampling location since several assemblage clusters were observed from multiple dives (Figures 5, 7 and Table 5). Furthermore, the RDA analyses identified depth, slope, substratum and proxies of internal tide dynamics as important factors driving faunal patterns on canyon walls (Figure 7 and Table 6). The GLMs for species richness and 1/D also identified slope, depth and substrate characteristics as influencing faunal diversity, but not any of the proxies of internal tide dynamics (Table 4). Diversity metrics condense multivariate information (faunal composition and/or abundance) into a single measure that is not representative of species composition. In our data, areas of high diversity (species richness and 1/D) supported different faunal compositions, demonstrating that the sole use of diversity metrics to represent faunal variability may miss key aspects of species – environment relationships in canyons and so limit our understanding of processes driving faunal distributions. As such these results indicate that other environmental factors (in this case proxies of internal tide dynamics), in addition to those traditionally highlighted by studies modelling diversity (i.e. depth, slope and substrate) (Robert et al., 2014; Ismail et al., 2018), are likely acting to determine assemblage composition in canyons. Additional sampling of other vertical walls in this part of Whittard Canyon would certainly help to obtain a clearer insight into the role of the environmental conditions in influencing faunal distributions.
Our spatial analysis revealed that the environmental variables investigated were spatially organised in relation to depth which was identified as an important factor influencing faunal patterns (Figure 8 and Tables 4, 6). Within Whittard Canyon we found several oceanographic gradients (temperature, salinity and dissolved oxygen) that were correlated with depth and varied in intensity along the canyon (Figures 2, 3 and Supplementary Figures 2, 3, 6). Broad- scale environmental gradients of physico-chemical properties act to determine faunal patterns (Levin et al., 2001; Kenchington et al., 2014; Mcclain and Lundsten, 2015; Robert et al., 2015; Du Preez et al., 2016; Ismail et al., 2018) and are likely driving the difference in assemblages observed between walls of the upper and mid canyon (Figure 7 and Table 5). However, the observation from our study of different assemblages from similar depth ranges (Figures 5, 7, and Table 5) suggests that other processes, such as internal tides and substratum are working in concert at smaller spatial scales to drive spatial patterns in species assemblages on canyon walls.
Canyons are sites of intensified hydrodynamics including internal tides, which our study has shown generate spatial and temporal heterogeneity in water properties (temperature, salinity, density and dissolved oxygen concentration) (Figure 3) and near-bed current speeds (Supplementary Figure 1). In Whittard Canyon, short term temporal variability induced by the vertical isopycnal displacement of the M2 internal tide (represented by the variable M2 amplitude) was found to be a significant factor driving faunal assemblages on canyon walls (Figure 7 and Table 6). Short-term variability in temperature, salinity and oxygen also drove differences in faunal assemblages on the Hebrides Terrace Seamount (Henry et al., 2014). Short-term internal tide induced variability in water properties may influence faunal distributions via species physiological constraints that limit their bathymetric distributions (Hutchins, 1947; Rowe and Menzies, 1969; Tietjen, 1971; Menzies and George, 1972; Van Den Hoek, 1982; Jeffree and Jeffree, 1994; Southward et al., 1995). The comparatively low variance explained by the vertical isopycnal displacement of the M2 internal tide in our study may reflect the restricted environmental range that was sampled. For example, despite local amplitudes of up to 140 m calculated for the M2 tide resulting in maximum tidal temperature variations of 1.55°C, these areas of high temporal variability did not coincide with data collected from vertical walls. Consequently, the temporal variability in oceanographic variables experienced by wall fauna was relatively consistent between dives, even if the absolute values differed (Table 5).
The M2 vertical isopycnal elevation amplitudes diagnosed here may also reflect spatial and temporal variation in internal tide kinetic energy and associated turbulent mixing (Van Haren et al., 2022). In Whittard Canyon, peaks in turbulent kinetic energy dissipation have been linked with resuspension of material, nepheloid formation and sediment movement (Van Haren et al., 2022) that indirectly influences fauna by resuspending and concentrating POM (Dell’anno et al., 2013; Demopoulos et al., 2017; Pearman et al., 2020). Additionally, internal tide kinetic energy influences fauna directly by elevating near-bed current speeds and associated physical stress (Weinbauer and Velimirov, 1996; Johnson et al., 2013; Orejas et al., 2016) and variation in internal tide kinetic energy has been correlated with fish larvae richness, abundance and assemblage composition in the Midrift Archipelago Region of the Tiburon Basin, Gulf of California (Ruvalcaba-Aroche 2019). Future observational campaigns, including moored Acoustic Doppler Current Profilers (ADCPs) and microstructure profiler surveys, will allow full diagnosis on internal tide energetics and associated turbulent mixing rates to quantitatively assess their influence on canyon fauna.
Internal tide–topographic interactions (indicated by bathymetric slope criticality to the dominant semidiurnal internal tide) are also linked to spatial heterogeneity in turbulent mixing (Wilson et al., 2015; Hall et al., 2017; Van Haren et al., 2017; Aslam et al., 2018) and near-bed current speeds both of which are linked to resuspension of POM (Thomsen and Gust, 2000; Wilson et al., 2015; Hall et al., 2017; Aslam et al., 2018). Deep-sea fauna predominantly rely upon the consumption of surface derived POM and internal tides interacting with supercritical slopes have been shown to form efficient food supply mechanisms capable of delivering high quality POM from surface waters to benthic assemblages at depth (Johnson et al., 2013; Mohn et al., 2014). Conversely, internal tides interacting with critical slopes may result in wave breaking and resuspension, and the mobilisation of older material from the seafloor that is often degraded and reworked material of lower quality POM. In Whittard Canyon, slope criticality was found to be a significant factor driving faunal assemblages on canyon walls, and it was mainly linked to assemblages that correlated with coral reef substrata (Figure 7 and Table 5). Dives 116 and 263, conducted at similar depths, differed in slope criticality and assemblages observed (Figure 6). On dive 263, brachiopods, large sponges and arborescent gorgonians were observed on walls where the slope was near critical (Table 5 and Figures 4, 6 and 7). In contrast, on dive 116, an assemblage characterised by D. pertusum was observed at similar depth, from a wall that was supercritical (Table 5 and Figures 4, 6 and 7). Isotopic analysis shows that D. pertusum has a broad trophic niche (Mueller et al., 2014; Demopoulos et al., 2017) having been known to feed on POM, zooplankton (Duineveld et al., 2007; Duineveld et al., 2012), bacteria and dissolved organic matter (Mueller et al., 2014) with a preference for high quality POM. On the other hand, isotopic signatures indicative of lower quality POM have been documented from brachiopods (Valls, 2017). Could the different spatial distributions of these assemblages be driven by the trophic niches of the characterising taxa that are able to capitalize on heterogeneity in POM influenced by the internal tide interacting with complex topography? Variability in the quality and amount of food supply is known to influence canyon faunal distributions (De Leo et al., 2010; McClain and Barry, 2010; Cunha et al., 2011; Chauvet et al., 2018). Furthermore, hydrodynamic and geomorphological processes have previously been proposed as factors influencing the supply and resuspension of particulate organic carbon to canyon environments and thus driving trophic structure, faunal assemblage composition and diversity (Dell’anno et al., 2013; Demopoulos et al., 2017). However, to confirm the role of the internal tide in generating spatial heterogeneity in food availability to which fauna respond, further trophic analysis of nepheloid layers in proximity to faunal assemblages in relation to internal tide dynamics would be required.
Near-bed current speed is also an important factor influencing food supply (Thomsen and Gust, 2000). Although R.M.S near-bottom baroclinic, barotropic and total current speed was removed from statistical analysis (due to collinearity with depth), data exploration showed that assemblages were distributed along a gradient of baroclinic (internal) current speed (Supplementary Figure 8). Separation of species along a gradient of current speed could reflect feeding and morphological adaptations. Species vary in their feeding strategies and efficiency under different hydrodynamic regimes (Järnegren and Altin, 2006; Van Oevelen et al., 2016). Species may exploit exposed areas to increase food encounter rates (Davies et al., 2009; Howell et al., 2011; Rengstorf et al., 2013; Mohn et al., 2014; Van Oevelen et al., 2016; Bargain et al., 2018), or conversely avoid areas with high current speeds that may exceed food capture rates, damage feeding apparatus (Johnson et al., 2013; Orejas et al., 2016) or topple large arborescent species (Weinbauera and Velimirov, 1996). Current speed is a primary driver of coral distributions (De Clippele et al., 2018) and in our study the D. pertusum assemblage occurred in an area exposed to the highest speeds, which is consistent with published observations (Davies et al., 2009; Rengstorf et al., 2013; Mohn et al., 2014) including those from vertical walls (Brooke and Ross, 2014). On the other hand, larger gorgonians and sponges were observed in areas exposed to lower current speeds. Intensified currents are also linked to resuspension and increased turbidity, which both brachiopods and D. pertusum are noted to tolerate (James et al., 1992; Brooke et al., 2009) and may enable them to exploit these conditions. Corals also benefit from strong currents that reduce sediment settlement on corals, which in turn reduces cost expenditure associated with cleaning polyps (Brooke et al., 2009; Larsson and Purser, 2011).
The ability to exploit substrata may also influence faunal distributions in canyons. Canyon walls not only vary in their slope criticality but in their geological formation and fine scale structural complexity provided by ledges and organisms themselves. CWC species including arborescent gorgonians and scleractinians are considered ecosystem engineers capable of forming complex structures, which act to promote increased species richness by providing substratum for settlement, refuge, modification of local sedimentation and subsequent food availability (Buhl-Mortensen et al., 2010; Guihen et al., 2013), resulting in increased fine-scale environmental heterogeneity (Buhl-Mortensen et al., 2010) and diversity of associated species (Frederiksen and Westerberg, 1992; Henry and Roberts, 2007; Lessard-Pilon et al., 2010). In our study, species richness was highest where coral substrata co-occurred with mud on vertical walls with ‘step-wise’ substrata, whereby accumulations of mud supported additional soft sediment species, further increasing diversity (Figure 4E). The overall negative relationship between species richness and coral reef framework modelled by the GLM as opposed to the positive relationship between coral reef framework and 1/D likely represents the increased evenness among species on vertical walls that are dominated by D. pertusum and A. excavata. Desmophylum pertusum reefs will promote species richness to a point after which D. pertusum dominates, so that fewer species occur but those that do are relatively evenly represented resulting in increased 1/D (Henry and Roberts, 2007). Small-scale geomorphological features, such as ledges also appear to influence faunal distributions on walls (Figures 4A, E). In our study, certain species were observed aggregating in association with ledges (Figures 4A, E). Similar observations have been made from other vertical wall environments where the increased fine-scale structural complexity provided by ledges is proposed to contribute to fine-scale environmental heterogeneity and so promote niche differentiation (Robert et al., 2020). The fragile nature of the ledges has also been proposed as a limiting factor on maximum colony size of corals observed (Brooke et al., 2017; Robert et al., 2020). This postulation could explain the occurrence of the D. pertusum assemblage on the wall with wider stronger ‘steps’, observed from dive 116 (Figure 4E) that are capable of supporting greater weight and higher coral densities, compared to the thinner ledges observed elsewhere (Figure 4A). However, the existence of different communities associated with ledges in ours (dive 262, 250 and 116) and other studies of Whittard Canyon (Johnson et al., 2013; Robert et al., 2020), suggests that these features act to influence species patterns at fine spatial scales whilst other factors beyond substratum availability (e.g. depth, food supply and internal tide dynamics) influence assemblage patterns across walls at the canyon scale.
The findings of our research can be applied to other settings where internal tides interact with complex topography to generate spatial-temporal gradients in environmental conditions (i.e. seamounts, coral mounds and ridges) (Frederiksen and Westerberg, 1992; White and Dorschel, 2010). The importance of internal tides in inducing temporal variability in water properties and/or influencing food availability to sustain benthic assemblages in otherwise hostile conditions (i.e. oxygen minimum zones) have been reported from steep shelf (Hanz et al., 2019) and seamount environments (Van Haren et al., 2017). Internal tides are also considered important phenomena influencing cold-water coral mound development (White and Dorschel, 2010). However, few studies have explicitly incorporated the influence of internal tides (Van Haren et al., 2017). In light of our findings research in other complex settings should endeavour to incorporate internal tide data into their analysis.
5 Conclusion
Our results show that faunal patterns on vertical walls in submarine canyons are driven by broad-scale environmental gradients that co-vary with depth, but also has highlighted the role of the internal tide in generating environmental heterogeneity at a finer scale (via vertical isopycnal displacement of the M2 internal tide and associated short term temporal variability in water mass properties, topography tide interactions and current speed) and how this might influence faunal distributions within the context of the larger depth related environmental gradients. As sites of intensified hydrodynamics, where internal tides generate spatial-temporal gradients in environmental variables, incorporating internal tide data is necessary to fully understand the processes that influence faunal patterns in canyons (including vertical walls).
We demonstrate that multivariate analysis of species data provides greater sensitivity than univariate indices, providing further insight into how the environmental factors interact at different scales to generate variability in environmental conditions that control species abundances and ultimately which species become characteristic of assemblages. Specifically, we highlight the likely link between internal tides and their associated vertical displacement in generating both spatial and temporal gradients in water mass properties that in turn influence faunal patterns on canyon walls.
Data availability statement
The raw data supporting the conclusions of this article will be made available by the authors, without undue reservation.
Author contributions
Conceptualization of paper, TP and VH, Methodology: CTD data provision FM, image annotation TP and KR, oceanographic data processing and analysis TP and RH, statistical analysis TP, Writing- original draft preparation TP, writing, reviewing and editing TP, AC, KR, RH, FM and VH. All authors contributed to the article and approved the submitted version.
Funding
This work was based on data collected from various expeditions. JC125 was funded by the ERC CODEMAP project (Starting Grant no 258482) and the NERC MAREMAP programme, the JC035_JC036 expedition was funded by the NERC core programme OCEANS2025, the EU FP7 IP HERMIONE; the 64PE421, 64PE453 and 64PE437 expeditions were funded by the NICO initiative by NWO and NIOZ and the NWO-VIDI, grant agreement 016.161.360 and MESH Joint copyright© 2007 Defra, JNCC, Marine Institute, BGS, UoP data were recorded during a collaborative survey (MESH Cruise 01-07-01) involving the Joint Nature Conservation Committee, the Marine Institute, the British Geological Survey and the University of Plymouth. The Department of the Environment, Fisheries and Rural Affairs (Defra) Natural Environmental Group Science Division (CRO361) made a significant financial contribution to this work. The MESH work contributed to the MESH project (www.searchmesh.net) that received European Regional Development Funding through the INTERREG III B Community Initiative (www.nweurope.org). TP was a PhD student in the NERC-funded SPITFIRE Doctoral Training Programme (Grant number NE/L002531/1) and received further funding from the National Oceanography Centre and the CASE partner CEFAS. VH was funded by the ERC Starting Grant project CODEMAP (Grant No 258482), by the NERC National Capability programme CLASS (Grant No NE/R015953/1), and the EU H2020 research and innovation programme project iAtlantic (grant agreement No 818123). During the final preparation stages of this manuscript she enjoyed a Fellowship from the Hanse-Wissenschaftskolleg Institute for Advanced Study. FM is supported by the innovational research scheme NWO-VIDI, grant agreement 016.161.360
Acknowledgments
The authors would like to thank the Captains, crews, and scientific parties of the various expeditions. Authors are particularly grateful to the Isis ROV team for the collection of groundtruthing data in the challenging submarine canyon terrain. We would also like to thank Tim Le Bas and Catherine Wardell for help with the bathymetry data processing, Dr. Brett Hosking for code to extract values from CTD casts and Michael Faggetter for his support with Matlab. We also thank the reviewers for their supportive reviews.
Conflict of interest
The authors declare that the research was conducted in the absence of any commercial or financial relationships that could be construed as a potential conflict of interest.
Publisher’s note
All claims expressed in this article are solely those of the authors and do not necessarily represent those of their affiliated organizations, or those of the publisher, the editors and the reviewers. Any product that may be evaluated in this article, or claim that may be made by its manufacturer, is not guaranteed or endorsed by the publisher.
Supplementary material
The Supplementary Material for this article can be found online at: https://www.frontiersin.org/articles/10.3389/fmars.2023.1091855/full#supplementary-material
References
92/43/EEC (1992). Council directive 92/43/EEC of 21 may 1992 on the conservation of natural habitats and of wild fauna and flora.
Addamo A. M., Vertino A., Stolarski J., Garcia-Jimenez R., Taviani M., Machordom A. (2016). Merging scleractinian genera: The overwhelming genetic similarity between solitary Desmophyllum and colonial Lophelia. BMC Evol. Biol. 16, 108. doi: 10.1186/s12862-016-0654-8
Allen S. E., Durrieu De Madron X. (2009). A review of the role of submarine canyons in deep-ocean exchange with the shelf. Ocean Sci. 5, 607–620. doi: 10.5194/os-5-607-2009
Althaus F., Hill N., Ferrari R., Edwards L., Przeslawski R., Schonberg C. H., et al. (2015). A standardised vocabulary for identifying benthic biota and substrata from underwater imagery: The CATAMI classification scheme. PloS One 10, e0141039. doi: 10.1371/journal.pone.0141039
Amaro T., Huvenne V. A. I., Allcock A. L., Aslam T., Davies J. S., Danovaro R., et al. (2016). The whittard canyon – a case study of submarine canyon processes. Prog. Oceanography 146, 38–57. doi: 10.1016/j.pocean.2016.06.003
Amaro T., Stigter H., Lavaleye M., Duineveld G. (2015). Organic matter enrichment in the whittard channel; its origin and possible effects on benthic megafauna. Deep-Sea Res. Part I: Oceanographic Res. Papers 102, 90–100. doi: 10.1016/j.dsr.2015.04.014
Aslam T., Hall R., Dyea S. (2018). Internal tides in a dendritic submarine canyon. Prog. Oceanography 169, 20–32. doi: 10.1016/j.pocean.2017.10.005
Bargain A., Foglini F., Pairaud I., Bonaldo D., Carniel S., Angeletti L., et al. (2018). Predictive habitat modelling in two Mediterranean canyons including hydrodynamic variables. Process Oceanography 169, 151–168. doi: 10.1016/j.pocean.2018.02.015
Bianchelli S., Danovaro R. (2019). Meiofaunal biodiversity in submarine canyons of the Mediterranean Sea: A meta-analysis. Prog. Oceanography 170, 69–80. doi: 10.1016/j.pocean.2018.10.018
Borcard D., Gillet F., Legendre P. (2011). Numerical ecology with r (New York: Springer-Verlag), 1–306.
Brooke S., Holmes M. W., Young C. M. (2009). Sediment tolerance of two different morphotypes of the deep-sea coral Lophelia pertusa from the gulf of Mexico. Mar. Ecol. Prog. Ser. 390, 137–144. doi: 10.3354/meps08191
Brooke S., Ross S. W. (2014). “First observations of the cold-water coral,” in Lophelia pertusa in mid-Atlantic canyons of the USA. Deep-Sea Research II. 104, 245–251. doi: 10.1016/j.dsr2.2013.06.011
Brooke S. D., Watts M. W., Heil A. D., Rhode M., Mienis F., Duineveldd G. C. A., et al. (2017). “Distributions and habitat associations of deep-water corals in Norfolk and Baltimore canyons,” in Mid-Atlantic bight, vol. 137. (USA: Deep-Sea Research II), 131–147.
Buhl-Mortensen L., Vanreusel A., Gooday A. J., Levin L. A., Priede I. G., Buhl-Mortensen P., et al. (2010). Biological structures as a source of habitat heterogeneity and biodiversity on the deep ocean margins. Mar. Ecol. 31, 21–50. doi: 10.1111/j.1439-0485.2010.00359.x
Carter G., Huvenne V., Jennifer G., Lo Iacono C., Marsh L., Ougier-Simonine A., et al. (2018). Ongoing evolution of submarine canyon rockwalls; examples from the whittard canyon, celtic margin (NE Atlantic). Prog. Oceanography 169, 79–88. doi: 10.1016/j.pocean.2018.02.001
Chauvet P., Metaxas A., Hay A., Matabos M. (2018). Annual and seasonal dynamics of deep-sea megafaunal epibenthic communities in barkley canyon (British Columbia, canada): A response to climatology, surface productivity and benthic boundary layer variation. Prog. Oceanography. 169, 89–105. doi: 10.1016/j.pocean.2018.04.002
Clarke (1993). Non parametrc multivariate analysis of change. Aust. J. Ecol. 18, 117–143. doi: 10.1111/j.1442-9993.1993.tb00438.x
Crase B., Liedloff A. C., Wintle B. A. (2012). A new method for dealing with residual spatial autocorrelation in species distribution models. Ecography 35, 879–888. doi: 10.1111/j.1600-0587.2011.07138.x
Cunha M. R., Paterson G. L. J., Amaro T., Blackbird S., De Stigter H. C., Ferreira C., et al. (2011). Biodiversity of macrofaunal assemblages from three Portuguese submarine canyons (NE Atlantic). Deep Sea Res. Part II: Topical Stud. Oceanography 58, 2433–2447. doi: 10.1016/j.dsr2.2011.04.007
Cunningham M. J., Hodgson S., Masson D. G., Parson L. M. (2005). An evaluation of along- and down-slope sediment transport processes between goban spur and brenot spur on the celtic margin of the bay of Biscay. Sedimentary Geol. 179, 99–116. doi: 10.1016/j.sedgeo.2005.04.014
Davies A. J., Duineveld G. C. A., Lavaleye M. S. S., Bergman M. J. N., Van Haren H., Roberts J. M. (2009). Downwelling and deep-water currents as food supply mechanisms to the cold-water coral lophelia pertusa (Scleractinia) at the mingulay reef complex. Limnol. Oceanography 54, 620–629. doi: 10.4319/lo.2009.54.2.0620
Davies J., Guinan J., Howell K., Stewart H., Verling E. (2008). MESH south west approaches canyons survey: Final report. MESH Cruise.
Davison J. J., Van Haren H., Hosegood P., Piechaud N., Howell K. L. (2019). The distribution of deep-sea sponge aggregations (Porifera) in relation to oceanographic processes in the faroe-Shetland channel. Deep Sea Res. Part I: Oceanographic Res. Papers 146, 55–61. doi: 10.1016/j.dsr.2019.03.005
De Clippele L. H., Huvenne V. A. I., Orejas C., Lundälv T., Fox A., Hennige S. J., et al. (2018). The effect of local hydrodynamics on the spatial extent and morphology of cold-water coral habitats at tisler Reef,Norway. Coral Reefs 37, 253–266. doi: 10.1007/s00338-017-1653-y
De Leo F. C., Smith C. R., Rowden A. A., Bowden D. A., Clark M. R. (2010). Submarine canyons: Hotspots of benthic biomass and productivity in the deep sea. Proc. R. Soc. B.: Biol. Sci. 277, 2783–2792. doi: 10.1098/rspb.2010.0462
De Leo F. C., Vetter E. W., Smith C. R., Rowden A. A., Mcgranaghan M. (2014). Spatial scale-dependent habitat heterogeneity influences submarine canyon macrofaunal abundance and diversity off the main and Northwest Hawaiian islands. Deep Sea Res. Part II: Topical Stud. Oceanography 104, 267–290. doi: 10.1016/j.dsr2.2013.06.015
Dell’anno A., Pusceddu A., Corinaldesi C., Canals M., Heussner S., Thomsen L., et al. (2013). Trophic state of benthic deep-sea ecosystems from two different continental margins off Iberia. Biogeosciences 10, 2945–2957. doi: 10.5194/bg-10-2945-2013
Demopoulos A. W. J., Mcclain-Counts J., Ross S. W., Brooke S., Mienis F. (2017). Food-web dynamics and isotopic niches in deep-sea communities residing in a submarine canyon and on the adjacent open slopes. Mar. Ecol. Prog. Ser. 578, 19–33. doi: 10.3354/meps12231
Domke L., Lacharité M., Metaxas A., Matabos M. (2017). Influence of an oxygen minimum zone and macroalgal enrichment on benthic megafaunal community composition in a NE pacific submarine canyon. Mar. Ecol. 38, e12481. doi: 10.1111/maec.12481
Duineveld G. C. A., Jeffreys R. M., Lavaleye M. S. S., Davies A. J., Bergman M. J. N., Watmough T., et al. (2012). Spatial and tidal variation in food supply to shallow cold-water coral reefs of the mingulay reef complex (Outer Hebrides, Scotland). Mar. Ecol. Prog. Ser. 444, 97–115. doi: 10.3354/meps09430
Duineveld G. C. A., Lavaleye M. S. S., Bergman M. J. N., De Stigter H., Mienis F. (2007). Trophic structure of a cold-water coral mound community (Rockall bank, NE Atlantic) in relation to the near-bottom particle supply and current regime. Bull. Mar. Sci. 81, 449–467.
Dullo W., Flögel S., Rüggeberg A. (2008). Cold-water coral growth in relation to the hydrography of the celtic and Nordic European continental margin. Mar. Ecol. Prog. Ser. 371, 165–176. doi: 10.3354/meps07623
Du Preez C., Curtiz J., Clarke M. (2016). The structure and distribution of benthic communities on a shallow seamount (Cobb seamount, northeast pacific ocean). PloS One 11, e0165513. doi: 10.1371/journal.pone.0165513
Fabri M. C., Bargain A., Pairaud I., Pedel L., Taupier-Letage I. (2017). Cold-water coral ecosystems in cassidaigne canyon: An assessment of their environmental living conditions. Deep Sea Res. Part II: Topical Stud. Oceanography 137, 436–453. doi: 10.1016/j.dsr2.2016.06.006
Fabri M. C., Pedel L., Beuck L., Galgani F., Hebbeln D., Freiwald A. (2014). Megafauna of vulnerable marine ecosystems in French mediterranean submarine canyons: Spatial distribution and anthropogenic impacts. Deep Sea Res. Part II: Topical Stud. Oceanography 104, 184–207. doi: 10.1016/j.dsr2.2013.06.016
FAO (2008). Report of the expert consultation on international guidelines for the management of deep-Sea fisheries in the high seas (Bangkok: FAO Fisheries Report No. 855), 11–14.
FAO (2009). Management of deep-Sea fisheries in the high seas (Rome: Food and Agriculture Organization of the United Nations).
Fernandez-Arcaya U., Ramirez-Llodra E., Aguzzi J., Allcock A. L., Davies J. S., Dissanayake A., et al. (2017). Ecological role of submarine canyons and need for canyon conservation: A review. Front. Mar. Sci. 4. doi: 10.3389/fmars.2017.00005
Frederiksen J., Westerberg (1992). The distribution of the scleractinian coral lophelia pertusa around the faroe islands and the relation to internal tidal mixing. Sarsia North Atlantic Mar. Sci. 77, 157–171.
Guihen D., White M., Lundalv T. (2013). Boundary layer flow dynamics at a cold-water coral reef. J. Sea Res. 78, 36–44. doi: 10.1016/j.seares.2012.12.007
Haalboom S., de Stigter H., Duineveld G., Van Haren H., Reichart G., Mienis F. (2021). Suspended particulate matter in a submarine canyon (Whittard Canyon,Bay of Biscay, NE Atlantic ocean): Assessment of commonly used instruments to record turbidity. Mar. Geol. 434, 106439. doi: 10.1016/j.margeo.2021.106439
Hall R. A., Alford M. H., Carter G. S., Gregg M. C., Lien R.-C., Wain D. J., et al. (2014). Transition from partly standing to progressive internal tides in Monterey submarine canyon. Deep Sea Res. Part II: Topical Stud. Oceanography 104, 164–173. doi: 10.1016/j.dsr2.2013.05.039
Hall R. A., Aslam T., Huvenne V. A. I. (2017). Partly standing internal tides in a dendritic submarine canyon observed by an ocean glider. Deep Sea Res. Part I: Oceanographic Res. Papers 126, 73–84. doi: 10.1016/j.dsr.2017.05.015
Hall R. A., Carter G. (2011). Internal tides in Monterey Submarine Canyon. Journal of Physical Oceanography 41, 186–20.
Hanz U., Wienberg C., Hebbeln D., Duienveld G., Lavaleye M., Juva K., et al. (2019). Environmental factors influencing benthic communities in the oxygen minimum zones on the Angolan and Namibian margins. Biogeosciences 16, 4337–4356. doi: 10.5194/bg-16-4337-2019
Henry L.-A., Roberts J. M. (2007). Biodiversity and ecological composition of macrobenthos on cold-water coral mounds and adjacent off-mound habitat in the bathyal porcupine seabight, NE Atlantic. Deep Sea Res. Part I: Oceanographic Res. Papers 54, 654–672. doi: 10.1016/j.dsr.2007.01.005
Henry L. A., Vad J., Roberts J. M. (2014). Environmental variability and biodiversity of megabenthos on the Hebrides terrace seamount (Northeast Atlantic). Sci. Rep. 4, 5589. doi: 10.1038/srep05589
Howell K., Billett D. S. M., Tyler P. (2002). Depth-related distribution and abundance of seastars (Echinodermata: Asteroidea) in the porcupine seabight and porcupine abyssal plain, N.E. Atlantic. Deep-Sea Res. I 49, 1901–1920. doi: 10.1016/S0967-0637(02)00090-0
Howell K. L., Holt R., Endrino I. P., Stewart H. (2011). When the species is also a habitat: Comparing the predictively modelled distributions of Lophelia pertusa and the reef habitat it forms. Biol. Conserv. 144, 2656–2665. doi: 10.1016/j.biocon.2011.07.025
Hunter W. R., Jamieson A., Huvenne V. A. I., Witte U. (2013). Sediment community responses to marine vs. terrigenous organic matter in a submarine canyon. Biogeosciences 10, 67–80. doi: 10.5194/bg-10-67-2013
Hutchins L. W. (1947). The bases for temperature zonation in geographical distribution. Ecol. Soc. America 17, 325–335. doi: 10.2307/1948663
Huvenne V. A. I., Davies J. S. (2014). Towards a new and integrated approach to submarine canyon research. Deep Sea Res. Part II: Topical Stud. Oceanography 104, 1–5. doi: 10.1016/j.dsr2.2013.09.012
Huvenne V., Tyler P. D. M., Fisher D., Hauton C., Huhnerbach V., Le Bas T., et al. (2011). A picture on the wall: Innovative mapping reveals cold-water coral refuge in submarine canyon. PloS One 6, e28755. doi: 10.1371/journal.pone.0028755
Huvenne V., Wynn R., Gales J. (2016). RRS James cook cruise 124-125-126 09 Aug-12 sep 2016. CODEMAP2015: Habitat mapping and ROV vibrocorer trials around whittard canyon and haig fras. Natl. Oceanography Centre Cruise Rep. 36.
Ismail K., Huvenne V., Robert K. (2018). Quantifying spatial heterogeneity in submarine canyons. Prog. Oceanography 169, 181–198. doi: 10.1016/j.pocean.2018.03.006
James M. A., Ansell A. D., Collins M. J., Curry G. B., Peck L. S., Rhodes M. C. (1992). Biology of living brachiopods. Adv. Mar. Biol. 28, 175–387. doi: 10.1016/S0065-2881(08)60040-1
Järnegren J., Altin D. (2006). Filtration and respiration of the deep living bivalve Acesta excavata (J.C. fabriciu) (Bivalvia; limidae). J. Exp. Mar. Biol. Ecol. 334, 122–129. doi: 10.1016/j.jembe.2006.01.014
Jeffree E. P., Jeffree C. E. (1994). Temperature and the biogeographical distributions of species. Funct. Ecol. 8, 640–650. doi: 10.2307/2389927
Johnson M. P., White M., Wilson A., Wurzberg L., Schwabe E., Folch H., et al. (2013). A vertical wall dominated by Acesta excavata and Neopycnodonte zibrowii, part of an undersampled group of deep-sea habitats. PloS One 8, e79917. doi: 10.1371/journal.pone.0079917
Kenchington E. L., Cogswell A. T., Macisaac K. G., Beazley L., Law B. A., Kenchington T. J. (2014). Limited depth zonation among bathyal epibenthic megafauna of the gully submarine canyon, northwest Atlantic. Deep Sea Res. Part II: Topical Stud. Oceanography 104, 67–82. doi: 10.1016/j.dsr2.2013.08.016
Larsson A. I., Purser A. (2011). Sedimentation on the cold-water coral Lophelia pertusa: Cleaning efficiency from natural sediments and drill cuttings. Mar. pollut. Bulliton 62, 1159–1168. doi: 10.1016/j.marpolbul.2011.03.041
Legendre P., Gallagher E. (2001). Ecologically meaningful transformations for ordination of species data. Oecologia 129, 271–280. doi: 10.1007/s004420100716
Lessard-Pilon S. A., Podowski E. L., Cordes E. E., Fisher C. R. (2010). Megafauna community composition associated with Lophelia pertusa colonies in the gulf of Mexico. Deep Sea Res. Part II: Topical Stud. Oceanography 57, 1882–1890. doi: 10.1016/j.dsr2.2010.05.013
Levin L. A., Jetter R., Rex M., Goodday R., Smith C., Pineda J., et al. (2001). Enviornemntal influences on regional deep-sea species diversity. Annu. Rev. Ecol. Evol. Syst. 32, 51–93. doi: 10.1146/annurev.ecolsys.32.081501.114002
Liu J. T., Wang Y. H., Lee I. H., Hsu R. T. (2010). Quantifying tidal signatures of the benthic nepheloid layer in gaoping submarine canyon in southern Taiwan. Mar. Geol. 271, 119–130. doi: 10.1016/j.margeo.2010.01.016
Lo Iacono C., Guillén J., Guerrero Q., Durán R., Wardell C., Hall R. A., et al. (2020). Bidirectional bedform fields at the head of a submarine canyon (NE Atlantic). Earth Planetary Sci. Lett. 542, 116321. doi: 10.1016/j.epsl.2020.116321
Lo Iacono C., Robert K., González-Villanueva R., Gori A., Gili J.-M., Orejas C. (2018). Predicting cold-water coral distribution in the cap de creus canyon (NW mediterranean): Implications for marine conservation planning. Prog. Oceanography 169, 169–180. doi: 10.1016/j.pocean.2018.02.012
Masson D. G. (2009). RRS James cook cruise 36, 19 jul-28 jul 2009. the geobiology of whittard submarine canyon. Natl. Oceanography Centre Southampton Cruise Rep. 41.
Mcclain C., Barry J. (2010). Habitat heterogeneity, disturbance, and productivity work in concert to regulate biodiversity in deep submarine canyons. Ecology 91, 964–976. doi: 10.1890/09-0087.1
Mcdougall T. J., Barker P. M. (2011). Getting started with TEOS-10 and the Gibbs seawater (GSW) oceanographic toolbox. SCOR/IAPSO WG127 28.
Menzies R., George R. (1972). Hydrostatic pressure–temperature effects on deep-sea colonisation. Proc. R. Soc. Edinburgh Section B. Biol. 73, 195–202. doi: 10.1017/S0080455X00002253
Mienis F., De Stigter H. C., De Haas H., Van Weering T. C. E. (2009). Near-bed particle deposition and resuspension in a cold-water coral mound area at the southwest rockall trough margin, NE Atlantic. Deep Sea Res. Part I: Oceanographic Res. Papers 56, 1026–1038. doi: 10.1016/j.dsr.2009.01.006
Mohn C., Rengstorf A., White M., Duineveld G., Mienis F., Soetaert K., et al. (2014). Linking benthic hydrodynamics and cold-water coral occurrences: A high-resolution model study at three cold-water coral provinces in the NE Atlantic. Prog. Oceanography 122, 92–101. doi: 10.1016/j.pocean.2013.12.003
Mueller C. E., Larsson A. I., Veuger B., Middleburg J. J., Van Oevelen D. (2014). Opportunistic feeding on various organic food sources by the cold-water coral Lophelia pertusa. Biogeosciences 11, 123–133. doi: 10.5194/bg-11-123-2014
Obelcz J., Brothers D., Chaytor J., Brink U., Ross S., Brooke S. (2014). Geomorphic characterization of four shelf-sourced submarine canyons along the U.S. mid-Atlantic continental margin. Deep-Sea Res. II 104, 106–119. doi: 10.1016/j.dsr2.2013.09.013
Orejas C., Gori A., Lo Iacono C., Puig G. J., Dale M. R. T. (2009). Cold-water corals in the cap de creus canyon northwestern Mediterranean: Spatial distribution, density and anthropogenic impact. Mar. Ecol. Prog. Seres 397, 37–51. doi: 10.3354/meps08314
Orejas C., Gori A., Rad-Menéndez C., Last K. S., Davies A. J., Beveridge C. M., et al. (2016). The effect of flow speed and food size on the capture efficiency and feeding behaviour of the cold-water coral Lophelia pertusa. J. Exp. Mar. Biol. Ecol. 481, 34–40. doi: 10.1016/j.jembe.2016.04.002
Pawlowicz R., Beardsley B., Lentz R. (2002). Classical tidal harmonic analysis including error estimates in MATLAB using T TIDE. Computers and Geosciences 28, 929–937. doi: 10.1016/S0098-3004(02)00013-4
Pearman T. R. R., Robert K., Callaway A., Hall R., Lo Iacono C., Huvenne V. A. I. (2020). Improving the predictive capability of benthic species distribution models by incorporating oceanographic data – towards holistic ecological modelling of a submarine canyon. Prog. Oceanography 184, 102338. doi: 10.1016/j.pocean.2020.102338
Pierdomenico M., Cardone F., Carluccio A., Casalbore D., Chiocci F., Maiorano P., et al. (2019). Megafauna distribution along active submarine canyons of the central Mediterranean: Relationships with environmental variables. Prog. Oceanography 171, 49–69. doi: 10.1016/j.pocean.2018.12.015
Pierdomenico M., Martorelli E., Dominguez-Carrió C., Gili J. M., Chiocci F. L. (2016). Seafloor characterization and benthic megafaunal distribution of an active submarine canyon and surrounding sectors: The case of gioia canyon (Southern tyrrhenian Sea). J. Mar. Syst. 157, 101–117. doi: 10.1016/j.jmarsys.2016.01.005
Pollard R. T., Griffrrhs M. J., Cunningham S. A., Read J. F., Irez F. F., Rlos A. F. (1996). Vivaldi 1991 - a study of the formation, circulation and ventilation of Eastern north Atlantic central water. Prog. Oceanography 37, 167–172. doi: 10.1016/S0079-6611(96)00008-0
Price D. M., Robert K., Callaway A., Lo Lacono C., Hall R. A., Huvenne V. A. I. (2019). Using 3D photogrammetry from ROV video to quantify cold-water coral reef structural complexity and investigate its influence on biodiversity and community assemblage. Coral Reefs. 38, 1007–1021. doi: 10.1007/s00338-019-01827-3
Puig P., Palanques A., Martín J. (2014). Contemporary sediment-transport processes in submarine canyons. Annu. Rev. Mar. Sci. 6, 53–77. doi: 10.1146/annurev-marine-010213-135037
R_CORE_TEAM (2014). R: A language and environment for statistical computing (Vienna, Austria: R Foundation for Statistical Computing).
Reid G., Hamilton D. (1990). A reconnaissance survey of the whittard Sea fan, southwestern approaches, British isles. Mar. Geol. 92, 69–86. doi: 10.1016/0025-3227(90)90027-H
Rengstorf A. M., Yesson C., Brown C., Grehan A. J., Crame A. (2013). High-resolution habitat suitability modelling can improve conservation of vulnerable marine ecosystems in the deep sea. J. Biogeography 40, 1702–1714. doi: 10.1111/jbi.12123
Robert K., Huvenne V. A. I., Georgiopoulou A., Jones D. O. B., Marsh L., Carter G. D. O., et al. (2017). New approaches to high-resolution mapping of marine vertical structures. Sci. Rep. 7, 9005. doi: 10.1038/s41598-017-09382-z
Robert K., Jones D., Georgiopoulou A., Huvenne V. (2020). Cold-water coral assemblages on vertical walls from the northeast Atlantic. Biodiversity Res. 26, 1–15. doi: 10.1111/ddi.13011
Robert K., Jones D. O.B., Huvenne V. A.I. (2014). Megafaunal distribution and biodiversity in a heterogeneous landscape: The iceberg-scoured Rockall Bank, NE Atlantic. Marine Ecology Progress Series 501, 67–88.
Robert K., Jones D. O. B., Tyler P. A., Van Rooij D., Huvenne V. A. I. (2015). Finding the hotspots within a biodiversity hotspot: Fine-scale biological predictions within a submarine canyon using high-resolution acoustic mapping techniques. Mar. Ecol. 36, 1256–1276. doi: 10.1111/maec.12228
Rowe G., Menzies R. J. (1969). Zonation of large benthic invertebrates in the deep-sea off the carolinas. Deep Sea Res. Oceanographic Abstracts 16, 531–532. doi: 10.1016/0011-7471(69)90041-2
Ruvalcaba-Aroche E. D., Filonov A., Sánchez-Velasco L., Ladah L. B., Cruz-Hernández J. (2019). Internal tidal waves in Tiburon Basin (Gulf of California, Mexico) modulate fish larvae aggregations. Continental Shelf Research 178, 41–50.
Sigler M. F., Rooper C. N., Hoff G. R., Stone R. P., Mcconnaughey R. A., Wilderbuer T. K. (2015). Faunal features of submarine canyons on the eastern Bering Sea slope. Mar. Ecol. Prog. Ser. 526, 21–40. doi: 10.3354/meps11201
Southward A. J., Hawkins S. J., Burrows M. T. (1995). Seventy years' observations of changes in distribution and abundance of zooplankton and intertidal organisms in the Western English chaennel in relation to rising sea temperature. J. Thermal Biol. 20, 127–155. doi: 10.1016/0306-4565(94)00043-I
Stashchuk N., Vlasenko V. (2021). Internal wave dynamics over isolated seamount and its influence on coral larvae dispersion. Front. Mar. Sci. 8, 735358. doi: 10.3389/fmars.2021.735358
Stewart H. A., Davies J. S., Guinan J., Howell K. L. (2014). The dangeard and explorer canyons, south Western approaches UK: Geology, sedimentology and newly discovered cold-water coral mini-mounds. Deep Sea Res. Part II: Topical Stud. Oceanography 104, 230–244. doi: 10.1016/j.dsr2.2013.08.018
Thiem Ø., Ravagnan E., Fosså J. H., Berntsen J. (2006). Food supply mechanisms for cold-water corals along a continental shelf edge. J. Mar. Syst. 60, 207–219. doi: 10.1016/j.jmarsys.2005.12.004
Thomsen L., Gust G. (2000). Sediment erosion thresholds and characteristics of resuspended aggregates on the western European continental margin. Deep Sea Res. Part I: Oceanographic Res. Papers 47, 1881–1897. doi: 10.1016/S0967-0637(00)00003-0
Tietjen J. H. (1971). Ecology and distribution of deep-sea meiobenthos off north Carolina. Deep Sea Res. Oceanographic Abstracts 18, 941–944. doi: 10.1016/0011-7471(71)90001-5
Valls M. (2017). Trophic ecology in marine ecosystems from the balearis Sea (Western Mediterranean). PHD Thesis, 1–198.
Van Aken H. (2000). The hydrography of the mid-latitude northeast Atlantic ocean II: The intermediate water masses. Deep-Sea Res. Part I: Oceanographic Res. Papers. 47, 789–824. doi: 10.1016/S0967-0637(99)00112-0
Van Den Beld I. M. J., Bourillet J.-F., Arnaud-Haond S., De Chambure L., Davies J. S., Guillaumont B., et al. (2017). Cold-water coral habitats in submarine canyons of the bay of Biscay. Front. Mar. Sci. 4. doi: 10.3389/fmars.2017.00118
Van Den Hoek C. (1982). The distribution of benthic marine algae in relation to the temperature regulation of their life histories. Biol. J. Linn. Soc. 18, 81–144. doi: 10.1111/j.1095-8312.1982.tb02035.x
Van Haren H., Hanz U., De Stigter H., Mienis F., Duineveld G. (2017). Internal wave turbulence at a biologically rich mid-Atlantic seamount. PloS One 12, e0189720. doi: 10.1371/journal.pone.0189720
Van Haren H., Mienis F., Duineveld G. (2022). Contrasting internal tide turbulence in a tributary of the whittard canyon. Contiental Shelf Res. 236, 104679. doi: 10.1016/j.csr.2022.104679
Van Oevelen D., Mueller C. E., Lundälv T., Middelburg J. J. (2016). Food selectivity and processing by the cold-water coral lophelia pertusa. Biogeosciences 13, 5789–5798. doi: 10.5194/bg-13-5789-2016
Van Rooij D., De Mol L., Le Guilloux E., Wisshak M., Huvenne V. A. I., Moeremans R., et al. (2010). Environmental setting of deep-water oysters in the bay of Biscay. Deep-Sea Res. I 57, 1561–1572. doi: 10.1016/j.dsr.2010.09.002
Vetter E. W., Smith C. R., De Leo F. C. (2010). Hawaiian Hotspots: Enhanced megafaunal abundance and diversity in submarine canyons on the oceanic islands of Hawaii. Mar. Ecol. 31, 183–199. doi: 10.1111/j.1439-0485.2009.00351.x
Vlasenko V., Stashchuk N., Inall M. E., Porter M., Aleynik D. (2016). Focusing of baroclinic tidal energy in a canyon. J. Geophysical Res.: Oceans 121, 2824–2840. doi: 10.1002/2015JC011314
Walbridge S., Slocum N., Pobuda M., Wright D. (2018). Unified geomorphological analysis workflows with benthic terrain modeler. Geosci. (Switzerland) 8, 94. doi: 10.3390/geosciences8030094
Weinbauera M., Velimirov B. (1996). Population dynamics and overgrowth of the Sea fan eunicella cavolini (Coelenterata: Octocorallia). Estuarine Coast. Shelf Sci. 42, 583–595. doi: 10.1006/ecss.1996.0038
White M., Dorschel B. (2010). The importance of the permanent thermocline to the cold water coral carbonate mound distribution in the NE Atlantic. Earth Planetary Sci. Lett. 296, 395–402. doi: 10.1016/j.epsl.2010.05.025
White M., Mohn C., De Stigter H., Mottram G. (2005). Deep-water coral development as a function of hydrodynamics and surface productivity around the submarine banks of the rockall trough, NE Atlantic. Cold-Water Corals Ecosyst, 503–514. doi: 10.1007/3-540-27673-4_25
Wilson M. F. J., O’connell B., Brown C., Guinan J. C., Grehan A. J. (2007). Multiscale terrain analysis of multibeam bathymetry data for habitat mapping on the continental slope. Mar. Geodesy. 30, 3–35. doi: 10.1080/01490410701295962
Wilson A. M., Raine R., Mohn C., White M. (2015). Nepheloid layer distribution in the whittard canyon, NE Atlantic margin. Mar. Geol. 367, 130–142. doi: 10.1016/j.margeo.2015.06.002
Zuur A., Ieno N., Elphick C. (2010). A protocol for data exploration to avoid common statistical problems. Methods Ecol. Evol. 1, 3–14. doi: 10.1111/j.2041-210X.2009.00001.x
Zuur A., Ieno E., Walker N., Saveliev A., Smith G. (2014a). Mixed effects models and extensions in ecology with r (New York: Springer-Verlag).
Keywords: cold-water coral, deep-sea, submarine canyon, hydrodynamics, internal tides
Citation: Pearman TRR, Robert K, Callaway A, Hall RA, Mienis F, Lo Iacono C and Huvenne VAI (2023) Spatial and temporal environmental heterogeneity induced by internal tides influences faunal patterns on vertical walls within a submarine canyon. Front. Mar. Sci. 10:1091855. doi: 10.3389/fmars.2023.1091855
Received: 07 November 2022; Accepted: 27 February 2023;
Published: 29 March 2023.
Edited by:
Chiara Romano, University of Gastronomic Sciences, ItalyCopyright © 2023 Pearman, Robert, Callaway, Hall, Mienis, Lo Iacono and Huvenne. This is an open-access article distributed under the terms of the Creative Commons Attribution License (CC BY). The use, distribution or reproduction in other forums is permitted, provided the original author(s) and the copyright owner(s) are credited and that the original publication in this journal is cited, in accordance with accepted academic practice. No use, distribution or reproduction is permitted which does not comply with these terms.
*Correspondence: Tabitha R. R. Pearman, VGFiaXRoYS5QZWFybWFuQG5vYy5hYy51aw==