 Regina Therese M. Bacalso
 Giovanni Romagnoni
 Matthias Wolff
- 1Fachbereich 2 (FB2) Biology and Chemistry, University of Bremen, Bremen, Germany
- 2Department of Integrated Modelling, Leibniz Centre for Tropical Marine Research Leibniz-Center for Tropical Marine Research (ZMT), Bremen, Germany
- 3Coastal Resource Center-University of Rhode Island (CRC-URI), Fish Right Program, University of Rhode Island – Philippines Branch Office, Makati City, Metro Manila, Philippines
The Visayan Sea is one of the major traditional fishing grounds in the Philippines and is likewise considered as a top contributor to the country’s overall fisheries production. However, fisheries surveys conducted over the past couple of decades have documented changes in the abundance and composition of catches and stocks toward an increasing dominance of invertebrates and low trophic levels fish families. Assessments of the commercially-important pelagic and demersal stocks were used to estimate population parameters that already exceed the sustainable reference limits. These traditional assessments point exclusively to fishing as the likely cause of the observed status and trends, but they fail to incorporate the potential influence of trophic interactions and variable environmental conditions despite a nationally-legislated mandate to apply an ecosystem approach to assessing and managing the country’s fisheries. Thus, an ecosystem model (Ecopath with Ecosim) of the Visayan Sea was constructed to investigate the role and extent of the fishery, trophic interactions, and changing environmental conditions as drivers of stock abundance and ecosystem dynamics. The results suggest that fishing and its corresponding trophic effects are the major drivers of invertebrate and fish biomass and catches in the Visayan Sea over the past two decades, while the environmental trends provide explanations for patterns that cannot be explained by fishing alone. Incorporating sea surface temperature variations and primary productivity anomalies produced the best-fitting models for most of the observed biomass and catch trends. The catches of the small pelagics (i.e., sardines and mackerels) were likewise found to be particularly affected by rainfall, while the biomass and catch of the small demersal fishes also show a sensitivity to chlorophyll-a concentrations. The primary productivity anomalies further showed a significant correlation with the Pacific Decadal Oscillation (PDO), which suggests that bottom-up trophic controls in the system may be affected by long-term regional climatic changes. These findings validate the applicability and necessity of the ecosystem modeling approach in assessing exploited marine ecosystems to complement the analyses from typically single-species population assessments, especially in the face of increasing environmental variability and projected climate change scenarios.
1 Introduction
Worldwide, a growing number of actual case studies have demonstrated the complex interplay of fishing and environmental effects on natural systems by applying the ecosystem modeling approach (e.g., Taylor et al., 2008; Wolff et al., 2012; Hoover et al., 2013; Hernvann et al., 2020; Wang et al., 2021). These studies have shown that on one hand, fishing activities can compromise a system’s resilience to climate variabilities depending on the levels of fishing intensity (Planque et al., 2010). On the other hand, climate variabilities can also affect the overall system productivity that result in widespread biological and economic implications to fisheries (Suh and Pomeroy, 2020; Macusi et al., 2021).
Marine ecosystem modeling is not a particularly new approach to ecosystems from the Philippines. In fact, several Ecopath models were already constructed in the early 1990s for the characterization and network analysis of coral reefs, bays, gulfs, and culture systems (Guarin, 1991; Alino et al., 1993; Reyes, 1993; Bundy and Pauly, 2001). The approach has likewise been applied to compare the productivity and food web dynamics of four major Philippine fishing grounds (Lachica-Aliño et al., 2009a). We can also find analytical studies on the ecosystem impacts of fishing using the ecosystem modeling approach (Armada and Bacalso, 2004; Geronimo and Aliño, 2009), and a few were designed specifically to address fisheries management issues (Bundy, 2004; Lachica-Aliño et al., 2009b; Bacalso and Wolff, 2014). Later, ecosystem models were applied to explore the ecological as well as economic impacts of theoretical fishing effort reallocation scenarios (Bacalso et al., 2016), and eventually modeling workshops were used as platforms to promote consensus among different stakeholder groups on the appropriate fishing effort allocation in a defined fisheries area (Armada et al., 2018). Finally, ecosystem models were constructed specifically to investigate system resilience in the face of natural (e.g., typhoons) and anthropogenic disturbance other than fishing (e.g., pollution and sedimentation) (Aliño and Dantis, 1999; Tan et al., 2018).
However, ecosystem models in the Philippines have not yet been applied for an explicit analysis and quantification of the combined effects of fisheries and environment despite the mandate defined in the amended Philippine Fisheries Code to adopt an ecosystem approach to managing the country’s fisheries. A main hindrance to applying this kind of analytical approach in the Philippine fisheries context is the absence of substantial time-series biomass reference data in most Philippine fishing grounds, and likewise, the deficiencies in corresponding standardized fishing effort and environmental drivers over time. Fortunately, the Visayan Sea is an exception to this. Here, several exploratory trawl surveys and fisheries assessments have been conducted in the 1940s and 1950s. Moreover, regular and fairly comprehensive monitoring of fisheries landings have been conducted over the past two decades. Thus, the Visayan Sea is an ideal model area to apply the ecosystem-based approach in assessing the status of the fishery and the drivers of observed changes over time.
Trawl surveys have shown that the demersal standing stock in the Visayan Sea has declined from 6.03 metric tons per square kilometer (mt/km2) in 1948 to less than half during the 2000s up to the present (Ampoyos-Arinque, 2018). These surveys also documented changes in relative abundance of the species composition, specifically a shifting/increasing dominance of fish families of lower trophic levels (e.g., Pomacentridae, Mullidae and Leiognathidae) in the more recent years. At the same time, the small pelagics (sardines, island mackerels, scads) and squids have featured regularly in the top 10 groups that comprise the catch of the later trawl surveys in terms of weight. Further, single-species assessments have identified several indicators of growth and recruitment that suggest overfishing of several species analyzed in the Visayan Sea. For example, estimates of exploitation rates and of the relative yield per recruit, respectively, have already exceeded sustainable reference points (Guanco et al., 2009). For the sardine species, population estimates of the fishing mortality to natural mortality ratio (F/M) and the percentage composition of juvenile sizes in the catch have likewise exceeded the limit reference points (Lanzuela et al., 2018). All these findings point exclusively to fishing as the likely cause of the observed status and historical trends. However, a recent study (Bacalso et al., 2023) has shown the significant influence of local environmental conditions on the catch per unit of effort (CPUEs) of the major small pelagic, small demersal fish, and invertebrate fishery species in the Visayan Sea. These parameters include sea surface temperature (SST), chlorophyll-a (as a proxy measure of net primary productivity), rainfall, and wind magnitude.
Thus, the objective of the present study is to apply an ecosystem modeling approach to 1) investigate the role and extent of fisheries as a driver of population abundance and ecosystem dynamics in the Visayan Sea and 2) quantify the effects of local environmental changes in the past two decades and check if they somehow relate to the observed changes in the catches. Moreover, the present study aims to gain insights into the effects of trophic interactions and trophic control mechanisms (Christensen and Walters, 2004) that govern the dynamic changes in the Visayan Sea ecosystem over time. Through this study, we ultimately aim to demonstrate the applicability of ecosystem-based assessments in the Philippine fisheries context, and provide a reference model to guide subsequent modeling approaches for other Philippine fishing grounds, and furthermore, for other tropical fisheries areas.
2 Materials and methods
2.1 Study area and model description
The Visayan Sea is located in the central Philippine archipelago (11.4328° N, 123.5280° E) with a total surface area of approximately 12,521.8 km2 and 16,728.5 km2 if municipal waters outside the Visayan Sea domain are included, respectively (Figure 1). For the purpose of this study, the Visayan Sea baseline Ecopath model includes the delineated commercial water area and municipal waters (both domain and non-domain) of all 33 coastal municipalities and cities that surround the Visayan Sea. Due to a lack of information on the spatial distributional patterns of fishing effort, fisheries activities are hereby initially assumed to occur throughout the entire extent of the delineated model area.
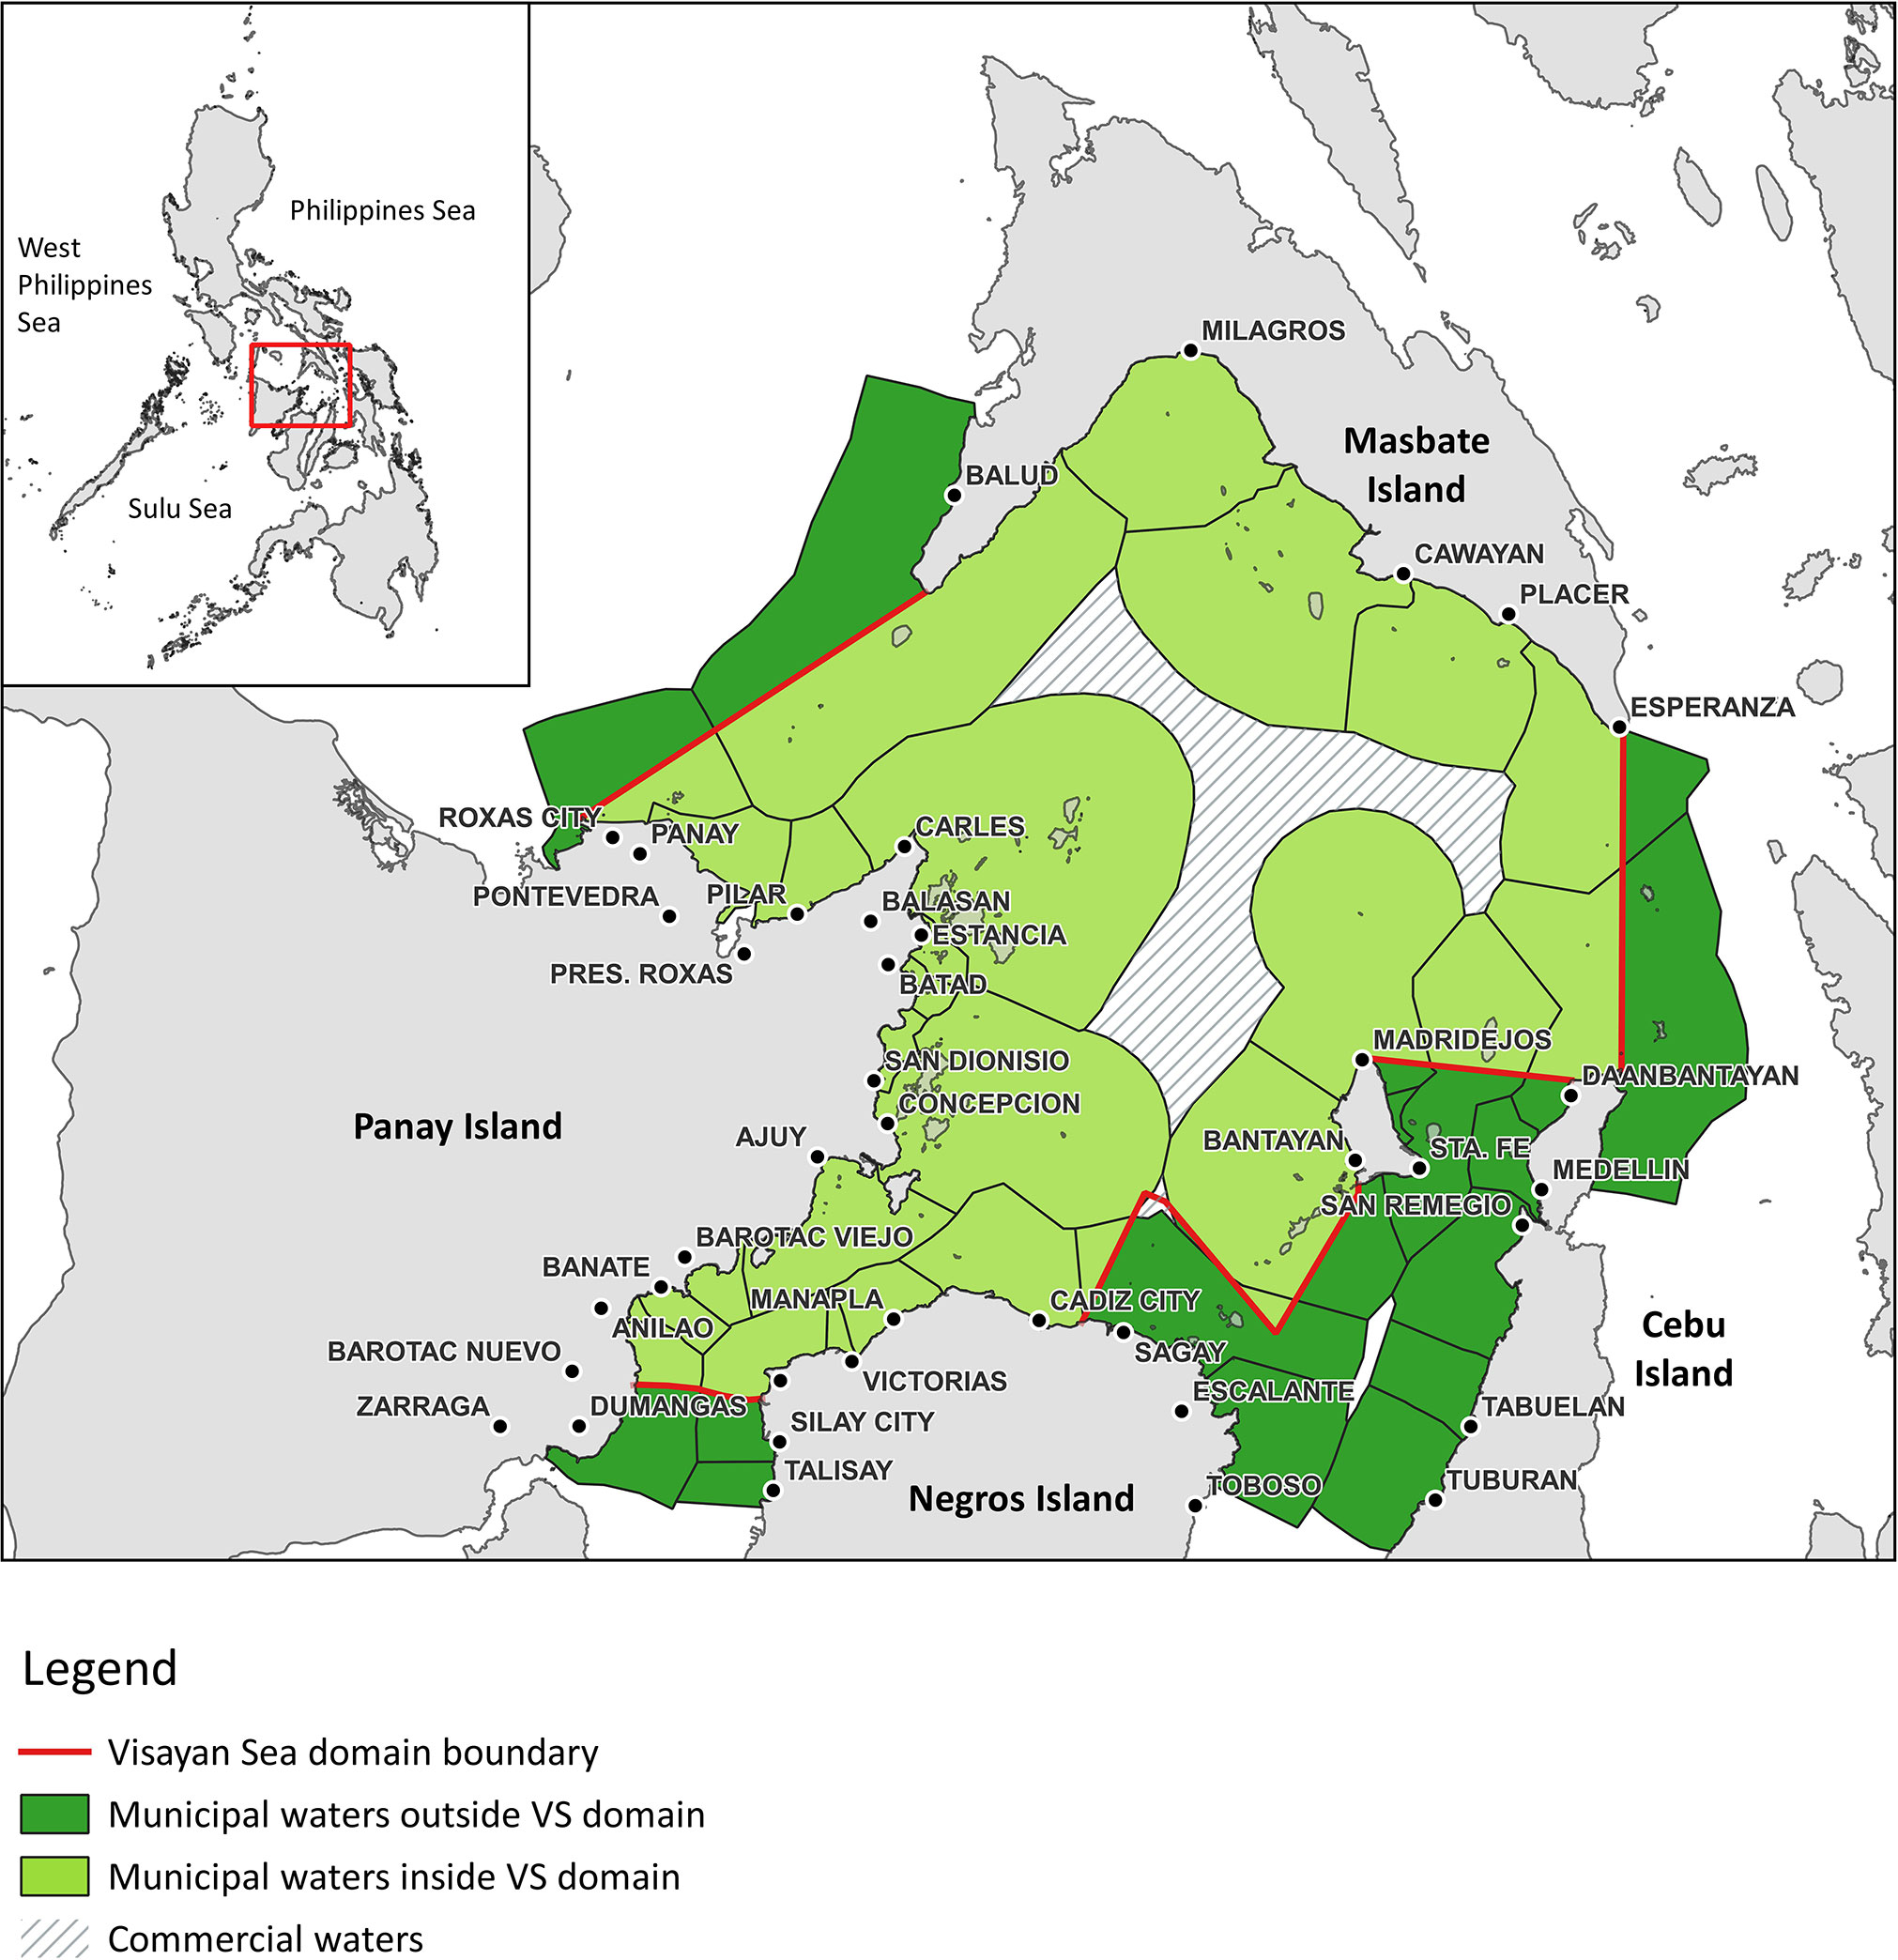
Figure 1 Map showing the location and the delineated model area of the Visayan Sea in the central Philippines.
Due to its central location and physical oceanographic attributes, the Visayan Sea has long been one of the country’s major fishing grounds that caters to both the commercial and municipal fisheries sectors (as classified under the Philippine Fisheries Code of 1998). Historically, the commercial fishing sector in the Visayan Sea primarily includes the purse seine, ring net, bag nets, Danish seines, and trawling operations that involve the use of vessels with a capacity > 3 gross tonnage (G.T.). On the other hand, the municipal sector includes the artisanal fisheries and fishing operations using vessels with a capacity< 3 G.T. In the mid-1990s, the Visayan Sea was already the highest contributor to the country’s overall commercial fisheries landings (at 120 thousand metric tons/year) and ranked the 3rd highest contributor to the country’s municipal fisheries sector (at 89 thousand metric tons/year) (DA-BFAR, 2000).
Surveys conducted by the National Stock Assessment Program (NSAP) between 1998 and 2002 identified a total of 96 families of aquatic fauna (90 vertebrates and 6 invertebrates) in the fisheries landings from the Visayan Sea (Guanco et al., 2009). These can be classified further into 149 genera (138 vertebrates and 11 invertebrates) and 282 species (264 vertebrates and 18 invertebrates). Fisheries monitoring data from the NSAP in the past decade show that the sardines (Clupeidae) and mackerels (Scombridae) comprise 50% of the total small pelagic fish landings, while goatfishes (Mullidae) and monocle breams (Nemipteridae) comprise about 70% of the soft-bottom demersal fish landings. At the same time, the landings of invertebrates such as tropical squids (Loliginidae) and of blue swimming crabs (Portunidae) have likewise grown steadily from 4% to 12% of the total landings.
2.2 Model compartments (Ecogroups)
For this model, a total of 33 groups were identified, including 30 consumers, two primary producers and one detritus group (Table 1). The groupings were initially based on the documented fish and invertebrate species in the Visayan Sea (Armada, 2004; Guanco et al., 2009; Del Norte-Campos et al., 2019) and further defined based on major taxonomic grouping (i.e., fish, invertebrate), ecological function (i.e., primary producer, consumer), and similarities in food types and feeding behavior (i.e., predator/hunter, grazer/herbivore, omnivore, piscivore, planktivore) classifications in Fishbase (Froese and Pauly, 2020). In addition, they were further classified based on a general knowledge of their habitat associations (i.e., pelagic, soft-bottom/demersal, reef-associated) in the Visayan Sea as informed by the fisheries landings surveys (Mesa, 2019), fisheries-independent trawl surveys (Ampoyos-Arinque, 2018), and coral reef monitoring surveys (Campos et al., 2020c; Campos et al., 2020a; Campos et al., 2020d; Campos et al., 2020b). Further, fish and invertebrate taxa of known major fishery importance (e.g., small pelagics, demersal fish, rabbitfish, marine crabs, and squids) comprise distinct functional groups. In addition, pelagic predator fishes (primarily Scomberomorous species) were split into juvenile and adult stanzas to incorporate ontogenetic shifts in diets and other life history parameters. The three small pelagic fish groups, namely the sardines, mackerels, and scads, were likewise split into juvenile and adult stanzas in anticipation of future explorations of the potential impacts of existing fisheries policies1, which may have differential impacts on the juvenile and adult stages.
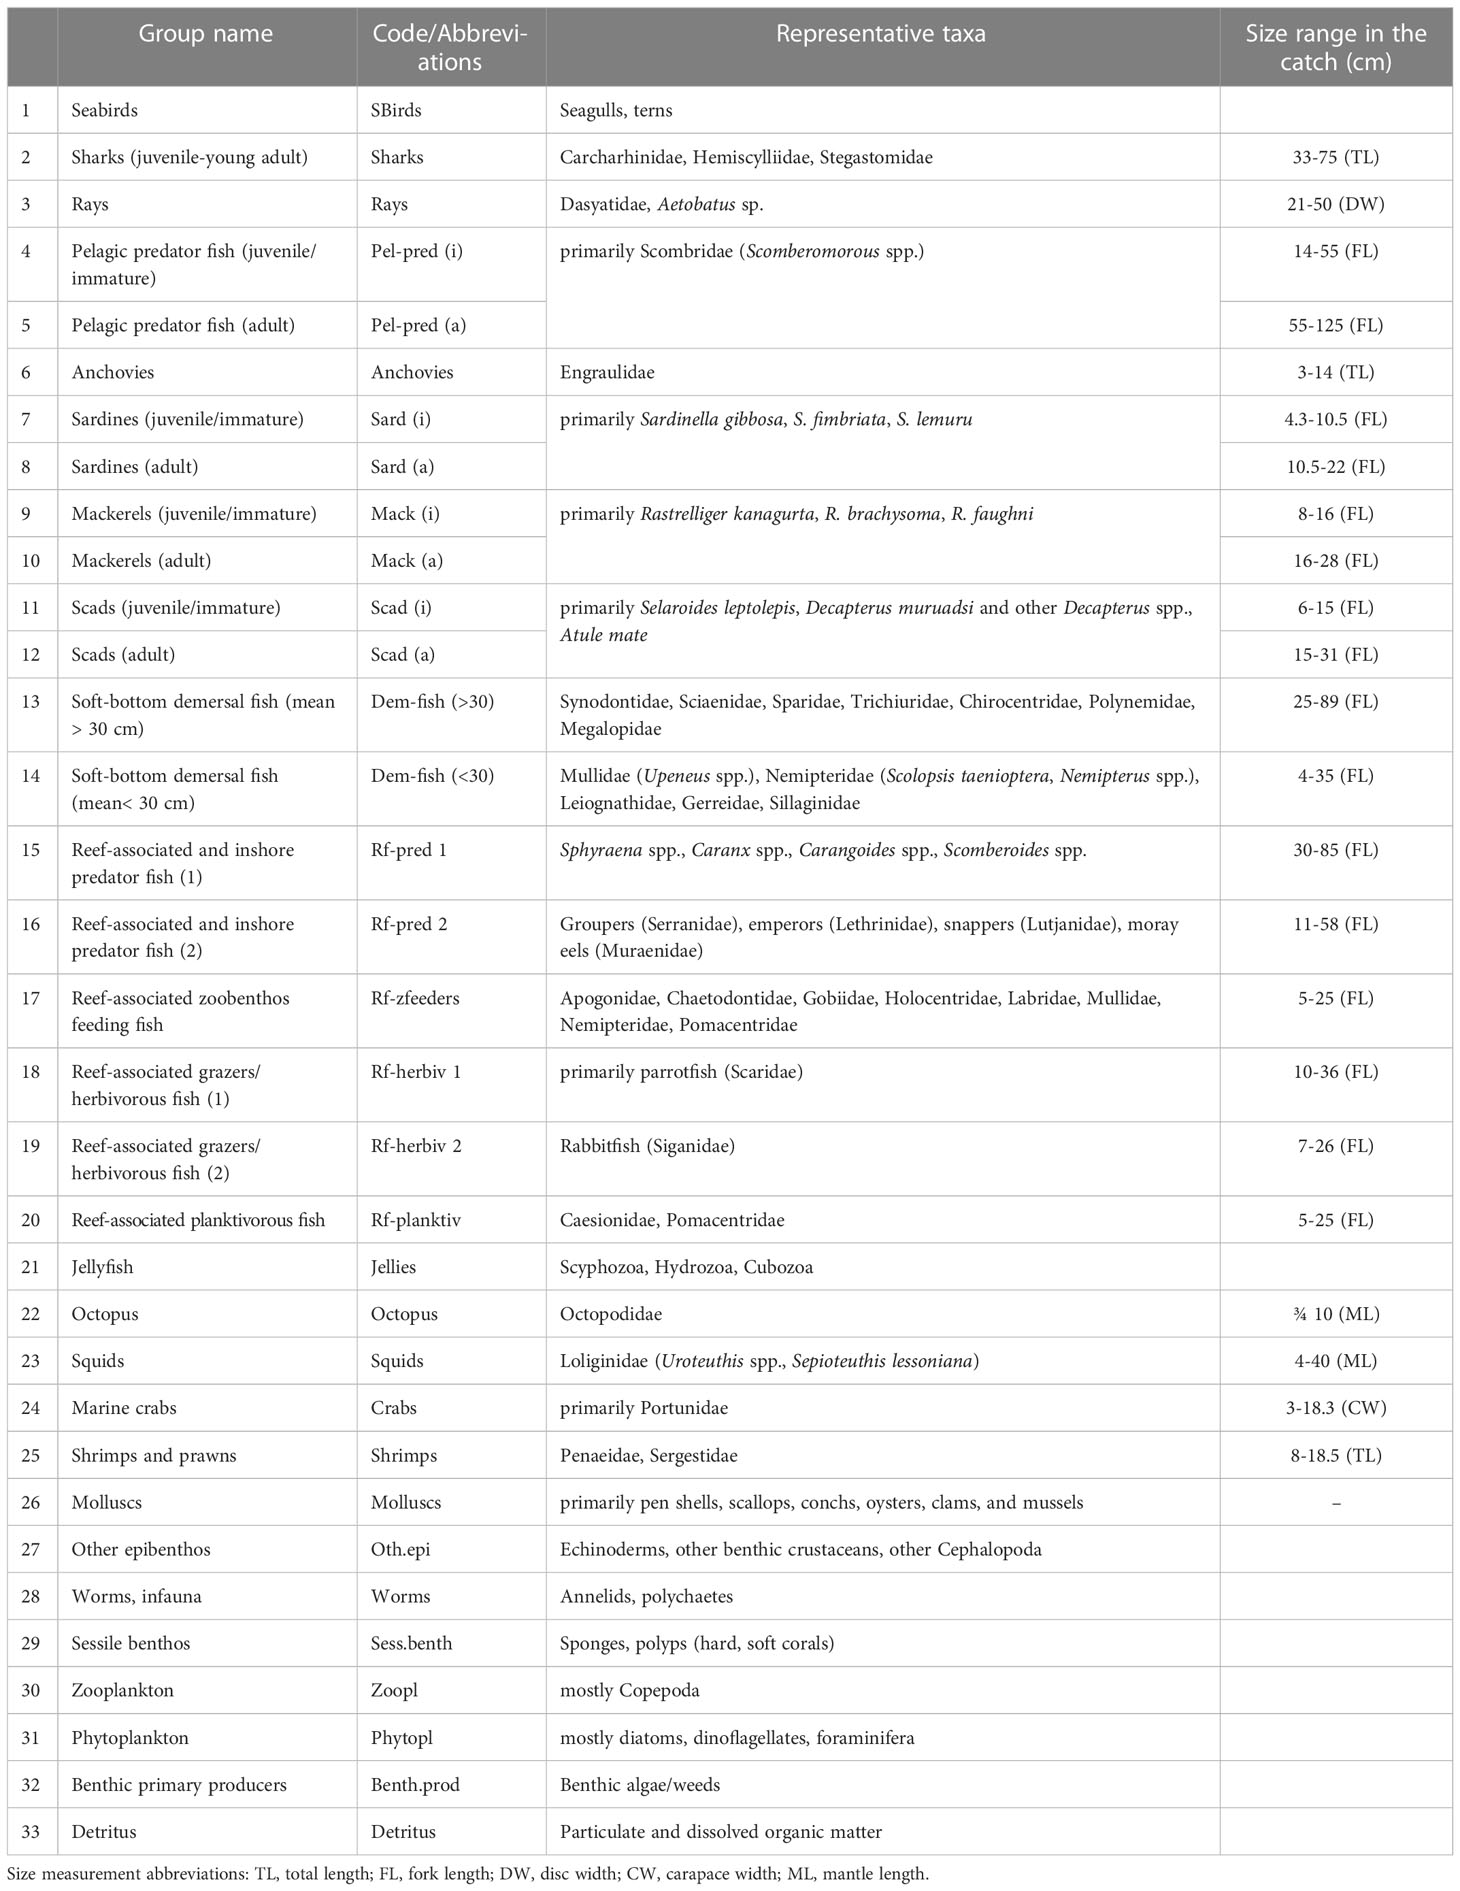
Table 1 Functional groups and representative taxa of the Visayan Sea baseline model (1996-97).
2.3 Fishing gear groups (Ecofleets)
The types and numbers of fishing gears and operations in the Visayan Sea are described in Armada (2004) and updated in Bacalso (2019). They include several variations of commercial and municipal fishing gears and operations such as gillnets, hook and lines, jigs, pots and traps, seines and dragnets, spears, impounding nets, falling nets, lift nets, surrounding nets, and even unconventional fishing methods such as blast fishing. For this model, they are classified into 34 gear groupings or “Ecofleets” according to basic gear type, function, target species, and/or relevance to existing national fisheries policies and local regulations (e.g., use of fine mesh nets, active gears, and destructive gears) (Table 2). In terms of number of units, the municipal fishing operations clearly outnumber the commercial operations. Owing to their higher catching efficiencies, however, the commercial operations contributed 56% of the estimated total catch from the Visayan Sea in 1996-1997.
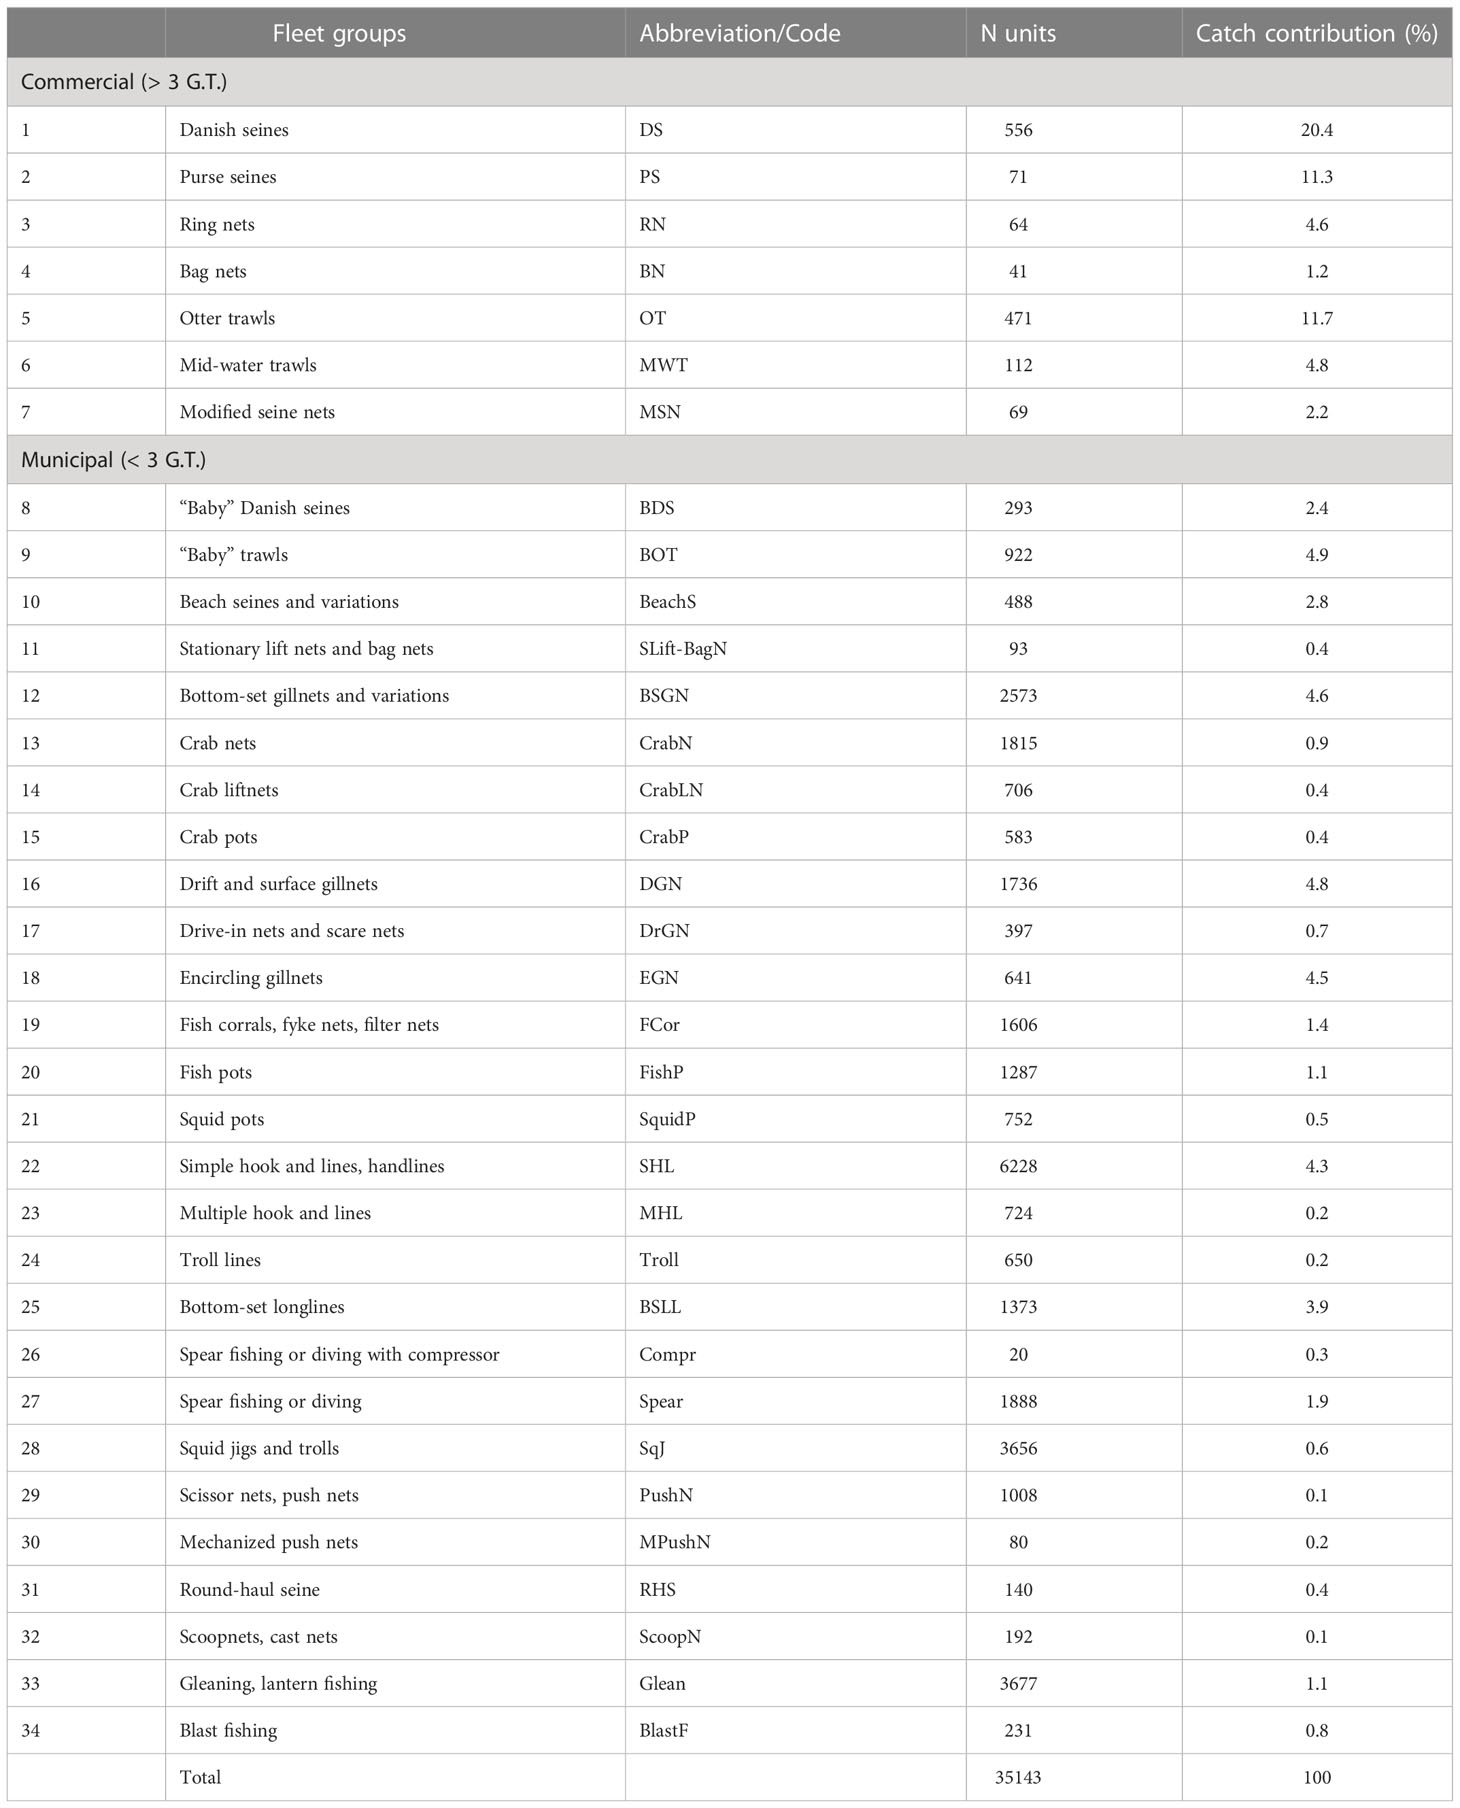
Table 2 Fishing gear types grouped by Ecofleet in the Visayan Sea baseline Ecopath model (1996-1997).
2.4 ECOPATH: Mass balance modeling of the Visayan Sea
A mass-balanced trophic model of the Visayan Sea was constructed using the Ecopath with Ecosim software (www.Ecopath.org) to describe the energy pathways and ecological dynamics therein. Mass-balanced system models (Christensen and Walters, 2004) assume that flows of biomass (or energy) balance around trophically-interacting ecological compartments within a defined time period. In this case, the baseline model of the Visayan Sea represents average values of fisheries and biological information from a comprehensive year-long fisheries assessment study conducted in the years 1996-1997 (Armada, 2004).
The parametrization of the model is based on trophic groups production and consumption, which can be expressed formally as two master equations (Christensen et al., 2005; Christensen et al., 2008):
where (P/B)i is the production/biomass ratio of i which is equal to the coefficient of total mortality (Z) under steady state conditions; Bi is the biomass of prey group i; Yi is the fishing mortality of group i; Bj is the biomass of predator j; (Q/B)j is the consumption/biomass ratio of predator j; DCjiis the fraction of prey i in the diet of predator j; Eiis the net migration rate of group i; BAi is the biomass accumulation of group i; EEi is the ecotrophic efficiency or proportion of production that goes to predation, catches or exports out of the system; and (1-EEi) is the other mortality (not caused by either predation or fishing).
For the second master equation:
Qi is the consumption, Pi is the production, Ri is the respiration, and Ui is the unassimilated food of group i. For each functional group in the model, biomass (t/km2), production/biomass ratio (/year), consumption/biomass ratio (/year), diet composition (%) and contribution to the fisheries catches (t/km2/yr1) are required inputs. Information used to construct the Visayan Sea baseline Ecopath model were sourced primarily from the 1996-1997 Fisheries Assessment Survey report (Armada, 2004) and succeeding local fisheries surveys and assessments conducted by the NSAP (Guanco et al., 2009; Mesa, 2019). Data “pedigree” scores were assigned via the built-in model Pedigree function to classify the confidence of data inputs based on their sources (i.e., site based/high precision sampling, limited/incomplete sampling, indirect/approximation methods, general knowledge, and from other models of similar systems) (see Supplement Table S1).
Results from the BFAR-led exploratory trawl surveys from 2003 and from earlier exploratory trawl and marine fisheries surveys in the Visayan Sea (Warfel and Manacop, 1950; Rasalan, 1957; Aprieto and Villoso, 1979) were used as basic reference for initial inputs of demersal fish biomass. Initial inputs of the pelagic fish group biomasses were either estimated indirectly using the relationship B = Y/F where F is the fishing mortality rate (/year) and Y refers to the estimated fisheries landings (t/km2/year) or is left to be estimated by Ecopath (for example, the biomass of the juvenile stanzas and most invertebrate groups). On the other hand, biomass inputs of the reef-associated species were sourced from the reef-based fish visual census surveys in the Visayan Sea, which report a range of reef fish biomass estimates from 1.2 – 26.7 t/km2 (Campos, 2018). The reef habitats cover less than 10% of the delineated area for the model. However, the proportion of habitat area occupied by reef and reef-associated functional groups was assigned a relative value of 0.2 to account for movements between reef and non-reef habitats. The other benthic, soft-bottom demersal and pelagic functional groups were assumed to occur over the entire model area. Phytoplankton biomass was estimated indirectly from satellite-based chlorophyll a data (source: NOAA/NCEP Global Forecast System (GFS) Atmospheric Models) and using conversion factors in Opitz (1996). Biomass of the detritus compartment was likewise estimated empirically sensu Pauly et al. (1993b).
Production/biomass ratios for groups exploited by fisheries were weighted averages relative to harvest weight of the instantaneous rate of total mortality (Z) estimates from published and unpublished stock assessments of fish and invertebrate stocks in the Visayan Sea (Guanco, 1991; Armada, 2004; Guanco et al., 2009; Romero, 2009; Tajolosa, 2011), as well as, biological parameter estimates of the same representative fish species from other Philippine fishing grounds around the same time period (Cinco and Silvestre, 1994; Armada et al., 2003). Total mortality of fish groups not covered in fisheries assessments were initially assumed equal to the instantaneous rate of natural mortality (M) (Pauly, 1980; Djabali et al., 1993). The consumption/biomass ratios for fish groups were estimated using an empirical formula on predicting food consumption rates (Pauly et al., 1990; Palomares and Pauly, 1998). Initial inputs of Q/B for the invertebrate groups were either sourced from the literature (Pauly et al., 1993a) or left to be estimated by the model. The initial Biomass, P/B, and Q/B inputs were then adjusted accordingly during model balancing and parametrization. Diet inputs for the demersal fish groups were sourced from a quantitative diet composition study in the Visayan Sea (Mequila and Campos, 2007). For the rest of the consumer groups, published diets of the same species from similar systems (i.e., shallow bay fishery systems) in the Philippines and elsewhere in the tropics were consulted. The complete diet composition matrix is provided in the Supplementary Material (Table S2).
The expanded baseline fisheries inventory data and gear CPUEs (kg per unit of operation) were used to estimate the total fishing effort and the total catch (t/km2) of the exploited groups by the different Ecofleets (Supplement Table S3). The total estimated catches were then apportioned to the different functional groups based on reported species and percentage composition in the catch (Armada, 2004; Guanco et al., 2009).
2.4.1 Balancing the model and model heuristics
In balancing the Ecopath models, the following basic rules and guidelines were followed (Christensen et al., 2005; Heymans et al., 2016):
1. The Ecotrophic Efficiency (EE) values of the functional groups are less than 1. Ecotrophic efficiency is a measure of the proportion of production that is utilized by the next trophic level (direct predation) or fishing. It is therefore expected that prey groups and/or highly fished groups will have EE values closer to 1;
2. The Production/Consumption (P/Q) ratios of most consumer groups fall between 0.1 and 0.3. This ratio is also known as the Gross food conversion efficiency (GE), which is generally 3-10 times higher than the production of most groups;
3. The production to respiration ratio (P/R) and respiration to assimilation ratio (P/A) should not exceed 1; and
4. The estimated mortality rates and F/Z ratios are realistic and representative of the fisheries exploitation in the area.
Prior to model balancing, the unbalanced model was subjected to a pre-balancing diagnostic analysis (Link, 2010), specifically to check the model parameters’ adherence to general ecological and fisheries rules or principles. As a rule, the biomass groupings of functional groups should range 5-7 orders of magnitude when arranged by trophic level and that the slope (on a log scale) declines by 5-10% when all taxa are arranged by trophic levels. Similarly, the production and consumption processes of the functional groups should also exhibit a general decline on the order of 2-4 or less magnitude with increasing trophic level. After balancing, the model was once again subjected to the same diagnostic analysis to check if there was any improvement (Supplement Figures S1–S4).
2.4.2 Trophic interaction and system analysis
A flow diagram was constructed with the final balanced model. This diagram shows the trophic interactions and energy flows from one group to another (Christensen et al., 2005). The groups are visualized as circles with sizes representing their relative biomass proportions in the model, and are arranged hierarchically by their fractional trophic levels along the y-axis. Additionally, model outputs of network indices that are used as measures of ecosystem development and maturity (Odum, 1969; Christensen, 1995) were compared with those from Ecopath models of Philippine fishing grounds that represent time periods within 5 years of the Visayan Sea baseline model, namely San Miguel Bay (1992-1994) (Bundy and Pauly, 2001), San Pedro (1994-1995) (Campos, 2003) and Sapian Bay (2001-2002) (Armada and Bacalso, 2004). This was done to examine if network indices can reveal any similarities between these distinct fishing grounds, in particular, the system-level effects of fisheries activities.
2.5 ECOSIM: Time-series fitting simulations
Ecosim was used to simulate changes in biomass and catch over time with fishing effort of the different Ecofleets and several environmental parameters as drivers. Based on the initial parameters of the Ecopath master equation (Equation 1), a series of coupled differential equations are used to express the biomass dynamics in Ecosim:
where dBi/dt is the biomass variation of group i through time; gi is the net growth efficiency (equivalent to the P/Q ratio); Ii is the immigration rate; Mi is the natural mortality rate; Fi is the fishing mortality rate; and ei is the emigration rate. The calculation of the consumption rates Q and the vulnerable and non-vulnerable components of the prey biomass B are based upon the “foraging arena” concept, which describes the foraging time of an animal as a tradeoff between feeding and predation risk (Ahrens et al., 2012).
In Ecosim, trophic control mechanisms between the model’s functional groups are defined by the vulnerability term v (Christensen et al., 2005; Christensen et al., 2008), which can be set between 1 and ∞. A low v setting (i.e., close to 1) indicates a bottom-up control whereby an increase in the predator biomass does not result in a substantial increase on the prey’s predation mortality. In contrast, a high v setting (e.g., 100) indicates a top-down control whereby an increase in predator biomass results in a substantial increase in the predation mortality of the prey. A high v likewise indicates that the predator biomass is far below its carrying capacity (Guénette et al., 2008). The default v is 2, which indicates neither a top-down nor bottom-up control (or a mixed control setting).
2.5.1 ECOSIM fitting procedure, hypotheses, and model selection
To identify the main drivers of the Visayan Sea ecosystem, the baseline model was “fit” to biomass and catch time-series using the Stepwise Fitting Procedure (Scott et al., 2016), which is an automated fitting routine in Ecosim that allows the testing of multiple models with different settings applied, including vulnerability setting adjustments, primary productivity anomalies, and fishing effort drivers. To find the best fit model, we adopted a similar procedure described by Mackinson et al. (2009), which was used subsequently by other model fitting-to-time-series work (e.g., Alexander et al., 2014; Alms and Wolff, 2020). Hereby, the following 12 alternative hypotheses and their corresponding scenarios were tested and compared:
H1 Baseline
No fishing effort or environmental drivers were used. Default vulnerability settings (v=2) were adopted assuming a mixed bottom-up and top-down control for model compartments.
H2 Baseline + adjusted v’s
No fishing effort or environmental drivers were used. Trophic control mechanisms alone explain the historical variabilities in catch and abundance. The most sensitive predator and predatory-prey interactions were identified based on the resulting changes of the prey biomass under top-down control settings (high v’s, e.g., 10), and conversely, on the resulting changes of the consumer biomass under bottom-up control settings (i.e., v< 2).
H3 Baseline + pp anomaly search
In addition to the above listed (H1), a search for temporal patterns in annual relative primary productivity (pp) was conducted to account for bottom-up control mechanisms in the system and to detect historical productivity regime shifts (Christensen et al., 2008).
H4 Baseline + adjusted v’s + pp anomaly search
In addition to the above listed (H2), a search for temporal patterns in annual relative primary productivity (pp) was conducted to account for bottom-up control mechanisms in the system and detect historical productivity regime shifts (Christensen et al., 2008).
H5 Fishing
Fishing alone explains the historical variabilities in catch and abundance. Fishing effort time-series is applied as a driver of the model. Default vulnerability settings (v=2) were adopted assuming a mixed bottom-up and top-down control for model compartments.
H6 Fishing + adjusted v’s
Fishing effort time-series is applied as a driver of the model. In addition, the most sensitive predator and predatory-prey interactions were tested to account for the significant bottom-up or top-down trophic interactions.
H7 Fishing + pp anomaly search
In addition to the above listed (H5), a search for primary productivity (pp) anomalies was conducted to account for bottom-up control mechanisms in the system.
H8 Fishing + adjusted v’s + pp anomaly search
In addition to the above listed (H6), a search for primary productivity (pp) anomalies was conducted to account for bottom-up control mechanisms in the system.
H9 to H12 Fishing + adjusted v’s + pp anomaly search + environment
In addition to the above listed (H8), environmental parameters (SST, chlorophyll a, rainfall, and wind magnitude) were used to explain the variabilities and trends in catch and abundance. Specifically, the environmental variables were applied as forcing function to the consumer search rates in Ecosim (Christensen et al., 2008).
Model selection was performed based on two primary criteria: (1) the goodness-of-fit (model sum of squares, SS) of the model-generated trends with the observed time-series data and (2) the Akaike information criterion corrected for small samples (AICc) (Burnham and Anderson, 2002). Both are outputs of the Stepwise Fitting Procedure. The best fit model is the model that minimizes both criteria. All models with an AICc difference of< 2 to the lowest AICc value were compared. Ultimately, the model that reduced the SS the most, used the least number of parameter estimates, and was able to best explain the observed variabilities in historical catch and abundance data through visual comparison (i.e., based on user judgement) was favored.
2.5.2 Fisheries and environmental time series used
In the case of the Visayan Sea, biomass estimates of soft-bottom demersal fishes from the exploratory trawl surveys generated only 4 data points (2003, 2007, 2013 and 2017) (Ampoyos-Arinque, 2018), and were therefore too few for a 20-year time-series. As an alternative, we used the trends in species CPUEs (effort standardized by vessel G.T.) of the 3 small pelagic groups (sardines, mackerels, and scads), small demersal fishes (< 30 cm), marine crabs, and squids to approximate the trends in these groups’ biomasses. Additionally, the groups’ catch time series from the fish catch monitoring reports (Mesa, 2019) were also used. Thus, 12 reference time-series were used.
Time series information on the fishing effort (calculated per gear type as the number of fishing units x fishing days over a 1-year period) was used as a forcing function to drive the model over a period of 20 years (1998 to 2018) (Figures 2B, C). Time-series of mean annual sea surface temperature (SST), chlorophyll a (chl-a), rainfall and wind magnitude (Figure 2A) were used as additional drivers to account for possible influence of the environment on the different model compartments based on a preliminary exploratory analysis of local environmental variables and regional climate indices that may have an influence on the species abundance in the Visayan Sea (Supplement Figure S5) (see also Bacalso et al., 2023). All local environmental parameter values were extracted for the delineated Visayan Sea model area from NOAA-ERDDAP (https://coastwatch.pfeg.noaa.gov/erddap/griddap/), an online electronic repository of spatio-temporal oceanographic data (Simons, 2020).
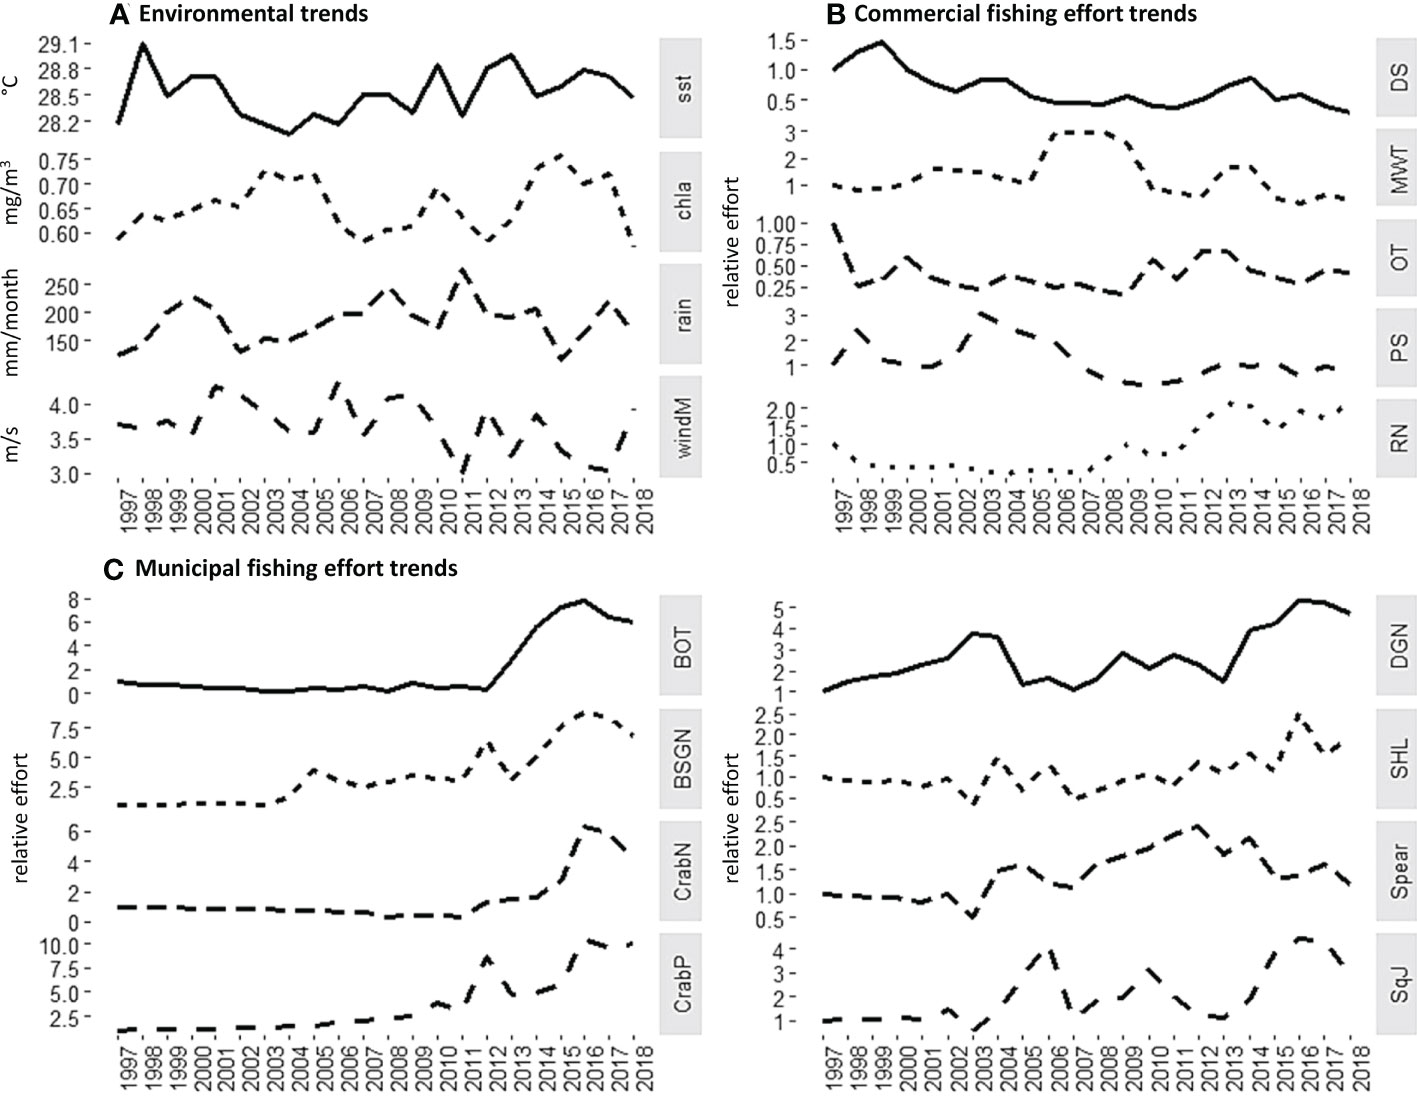
Figure 2 Environment (A) and fishing effort (B - commercial, C - municipal) trends in the Visayan Sea over two decades. (Refer to Table 2 for the complete names of the abbreviated Ecofleets).
3 Results
3.1 The Visayan Sea ECOPATH model
The basic input and output parameters of the balanced Visayan Sea baseline Ecopath model are presented in Table 3. Model PRE- and POST-BAL diagnostics (see Supplement Figures S1–S4) for the Biomass, P/B, and Q/B input and output parameters improved (regression fitting, R2), while the P/Q estimates were likewise constrained under 0.3 after model balancing and parametrization. Overall, the final Visayan Sea baseline model adhere to the basic rules and principles in system ecology. The EE values for most invertebrate groups, the small pelagics (particularly the juvenile stanzas), and the small demersal fishes are high (close to 1) indicating that these groups are highly utilized in the system as prey for the different consumers, as targets of the fishery, or both. The model estimated F/Z (exploitation ratios) for the small pelagic groups (0.5-0.67) and small demersal fishes (0.51) are also within the ranges reported in single-species assessments from the Visayan Sea and similarly highly exploited Philippine fishing grounds (Ingles and Pauly, 1984).
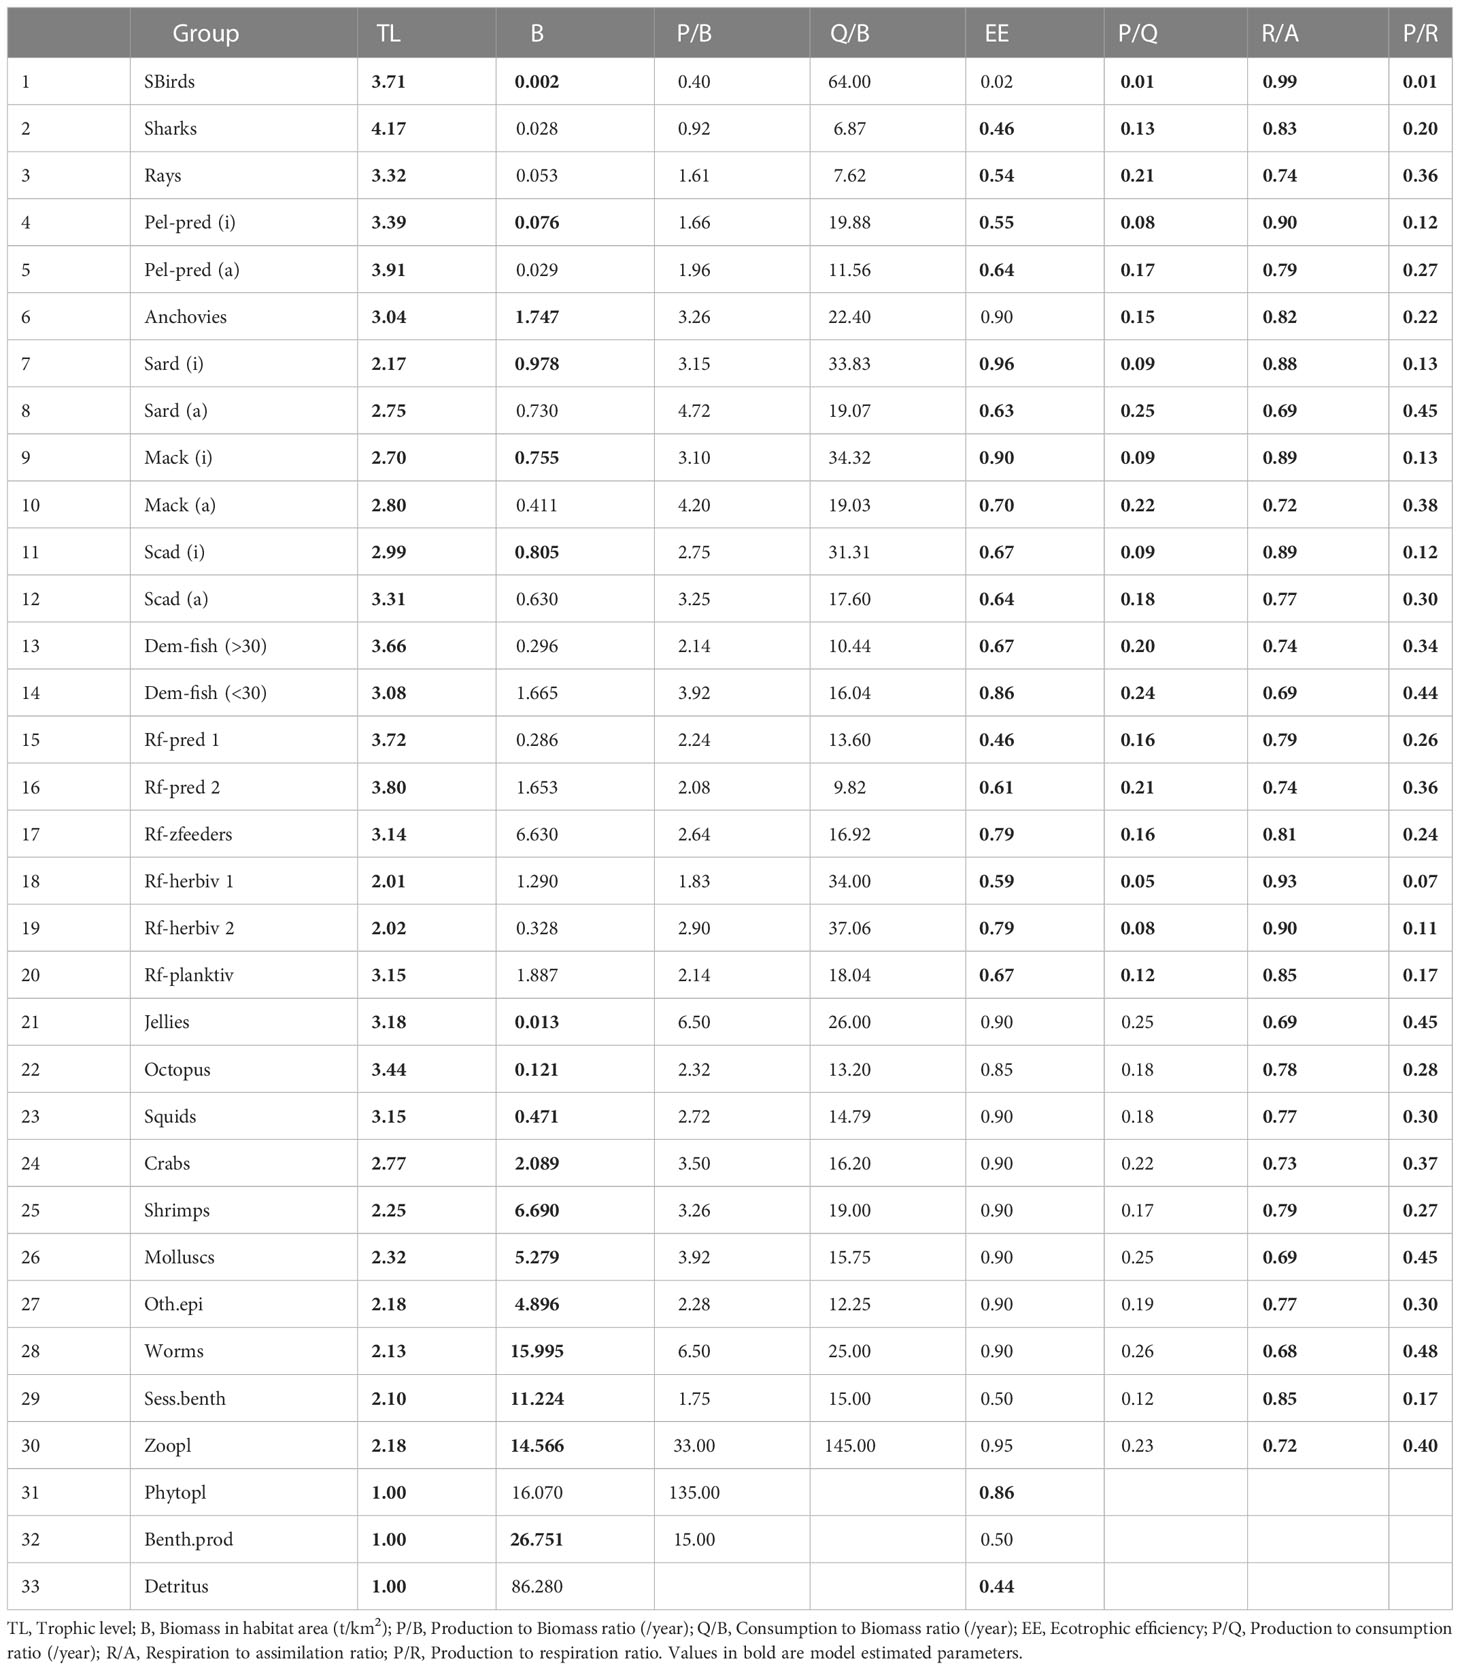
Table 3 Basic input and output parameters of the Visayan Sea baseline Ecopath model (1996-1997).
The flow diagram (Figure 3) visualizes the trophic relationships and relative biomass proportions of the different groups in the model. The energy from TL 1 is first utilized by several planktivores, herbivores, and detritivores before reaching the higher order consumers. In terms of energy utilization, there seems to be no clear delineation between the pelagic and demersal groups since demersal prey (such as shrimps and other benthic invertebrates) are also preyed upon by pelagic consumers. At the same time, zooplankton and pelagic prey fish groups (e.g., anchovies and small pelagic fish, especially the juvenile stanzas) are also consumed by squids and the demersal predators. The shallow nature of the Visayan Sea is seen as the main physical characteristic that facilitates this interaction.
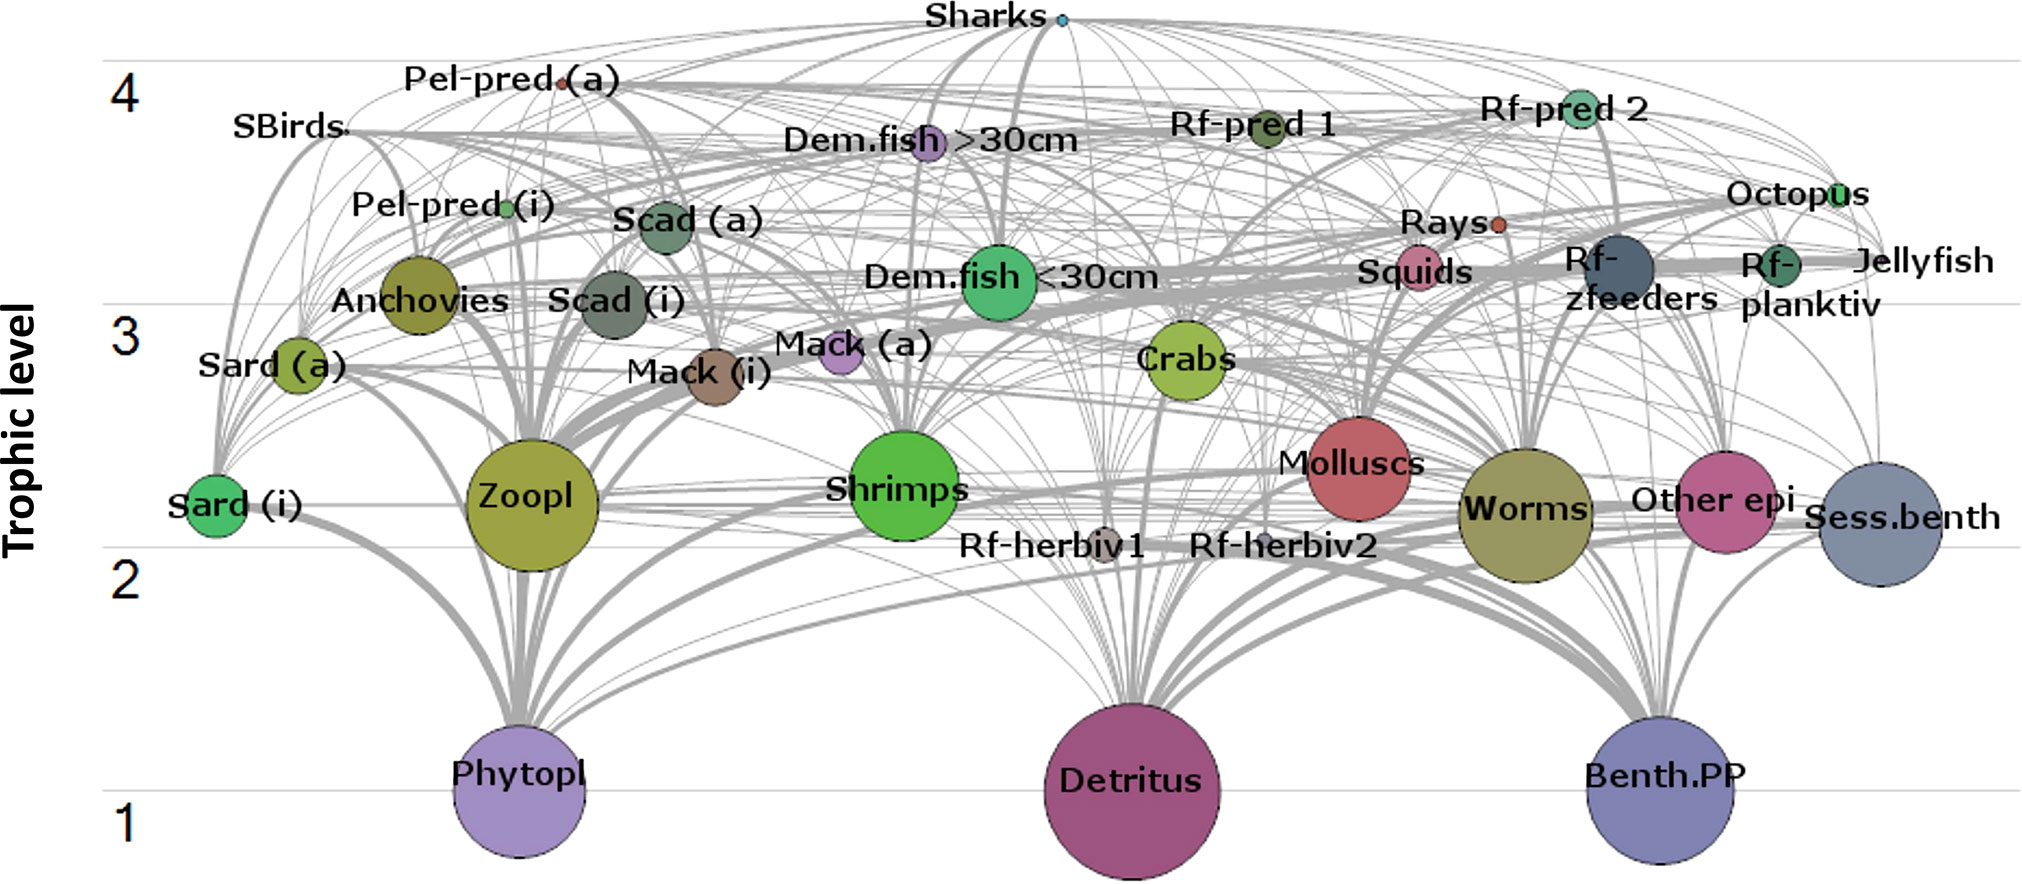
Figure 3 Flow diagram of the Visayan Sea ecosystem (1996-97).
Selected outputs from the system summary statistics of the Visayan Sea baseline Ecopath model are shown in Table 4. System size in terms of total system throughput (TST) is in the mid-range compared to the throughput of the 3 other published trophic models of Philippine fishing grounds that represent system states within 5 years from the Visayan Sea baseline model. The Visayan Sea has the highest total catch (t/km2/yr) followed closely by San Miguel Bay (Bundy and Pauly, 2001). The mean trophic level of the fishery (TLC) is computed as the weighted average TL of harvested groups, and it likewise serves as an index of fishing impact (Christensen et al., 2005; Pauly et al., 1998). The TLC for the Visayan Sea is very similar to the reported TLC of San Miguel Bay and Sapian Bay (Bacalso and Armada, 2004), which could indicate similarities in the overall composition of the catches. Meanwhile, the gross efficiency of the catch is computed as the sum of all realized fisheries catches relative to the total primary production (catch/net p.p.), and it tends to be higher in systems targeting low trophic level resources (Christensen et al., 2005). The value for the Visayan Sea comes second to San Miguel Bay, followed by Sapian Bay, and finally, San Pedro Bay. Based on these two indices alone – TLC and catch/net p.p. – we can say that the Visayan Sea, San Miguel Bay and Sapian Bay were similar in terms of fisheries exploitation during the 1990s. This finding likewise validates the contention that San Pedro Bay was not as heavily exploited as the other traditional fishing grounds in the country during that time (Campos, 2003).
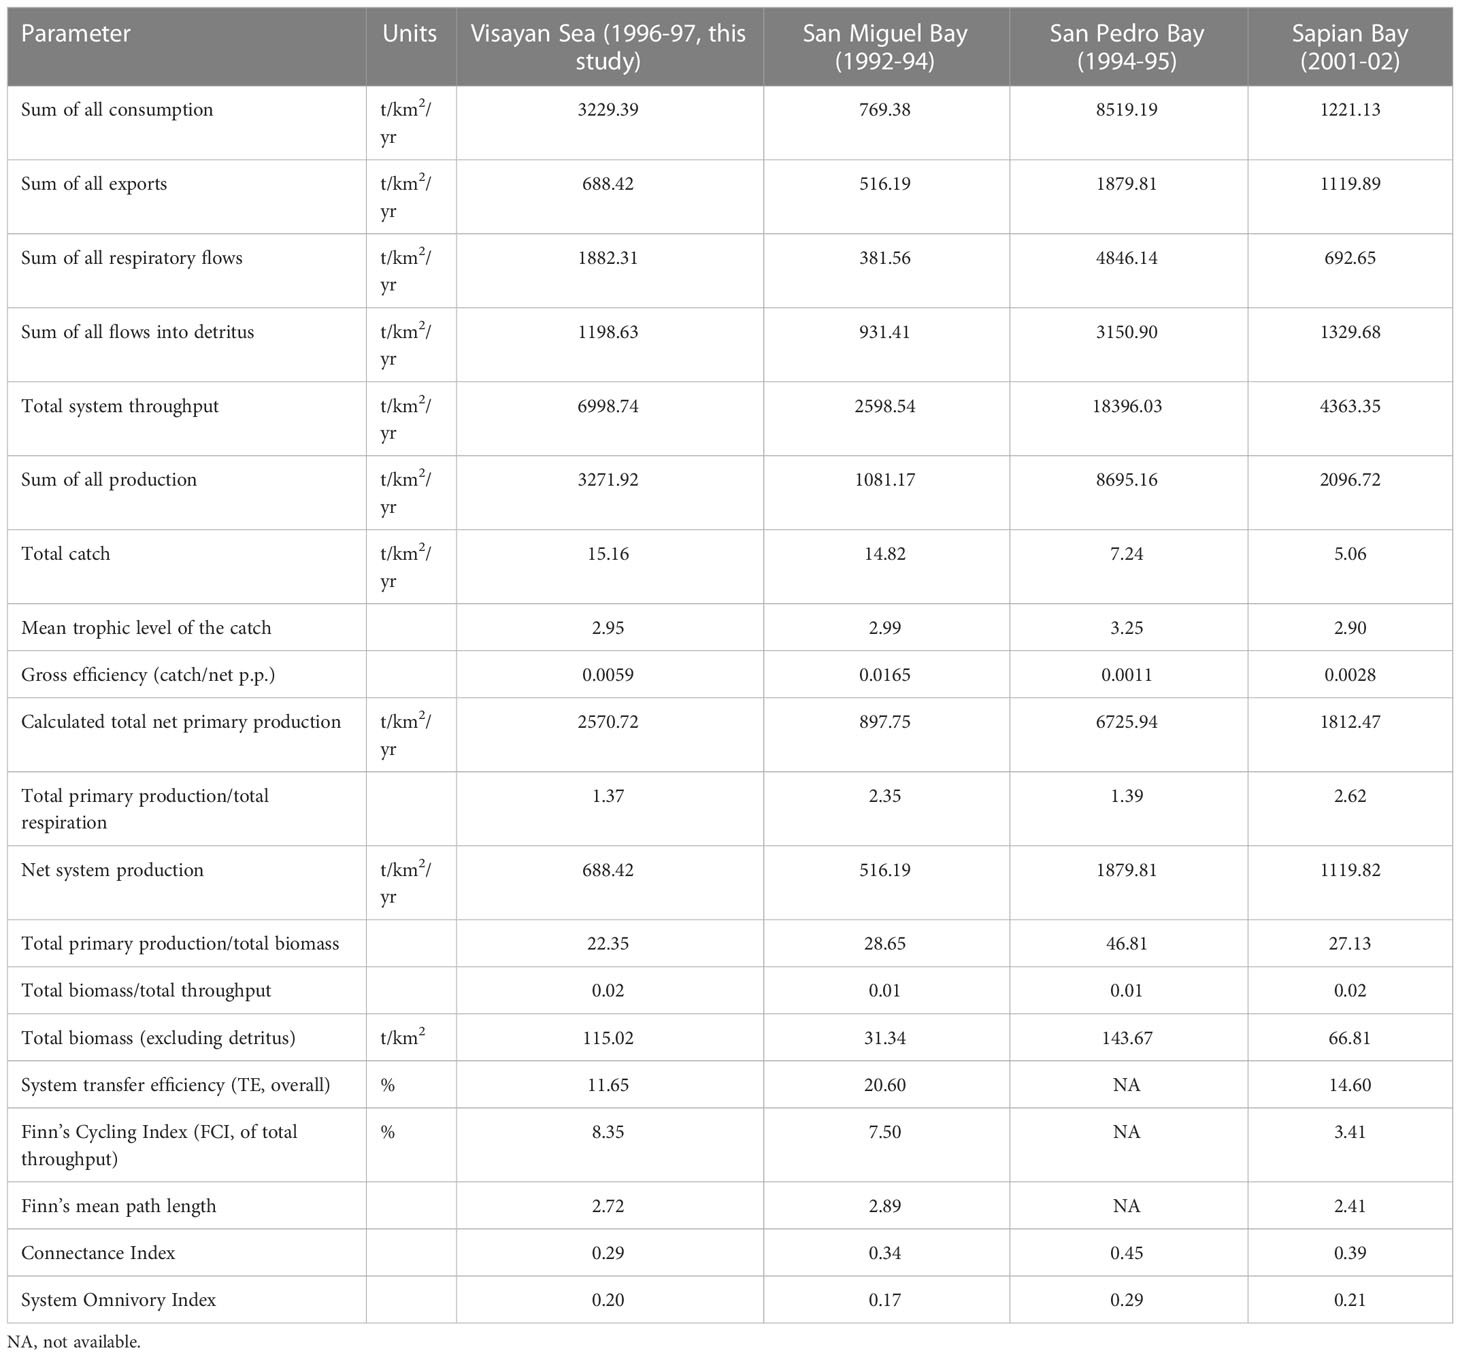
Table 4 System summary statistics of the Visayan Sea baseline Ecopath model and Ecopath models from the Philippines that represent time periods +/- 5 years from the Visayan Sea model.
The total primary production/total biomass ratio (PP/B) is an indicator of system maturity (Christensen et al., 2005). The ratio is expected to decline as biomass accumulates over time or as a system matures. The PP/B ratio for the Visayan Sea is closest to San Miguel Bay and Sapian Bay, which could again indicate their similarities in terms of the types and rates of fisheries extraction. The total biomass/total throughput ratio (B/T) is another indicator of system maturity (Christensen, 1995) and increases as a system matures. The values of all 4 fishing grounds hereby compared are similar with each other. Lastly, the Finn’s Cycling Index (FCI) represents the fraction of an ecosystem’s throughput that is recycled. It is an indicator of a system’s ability to maintain structure and integrity (Ulanowicz, 1984). The Visayan Sea has the highest FCI compared to the other models, which indicates the Visayan Sea’s higher resilience toward disturbance compared to the other systems.
3.2 ECOSIM model fitting and simulations
The computed sum of squares and AICc of all the models that were generated under different hypotheses are shown in Figure 4. The application of fishing effort time-series alone (H5) results in the largest disagreement between the historical catch and biomass with the model simulations. As likewise shown in Figures 5, 6, even the best-fitting model under this scenario usually either underestimates or overestimates the catch and biomass of several groups. It further predicted a collapse of the biomass of mackerels and scads in the last years of the simulation (Figures 5B, C) when the fishing effort of the commercial ring nets and most municipal fishing gears were at their peak (Figure 2). It also predicted a corresponding crash in these groups’ catches (Figures 6B, C) as well as in the catch of squids (Figure 6E).
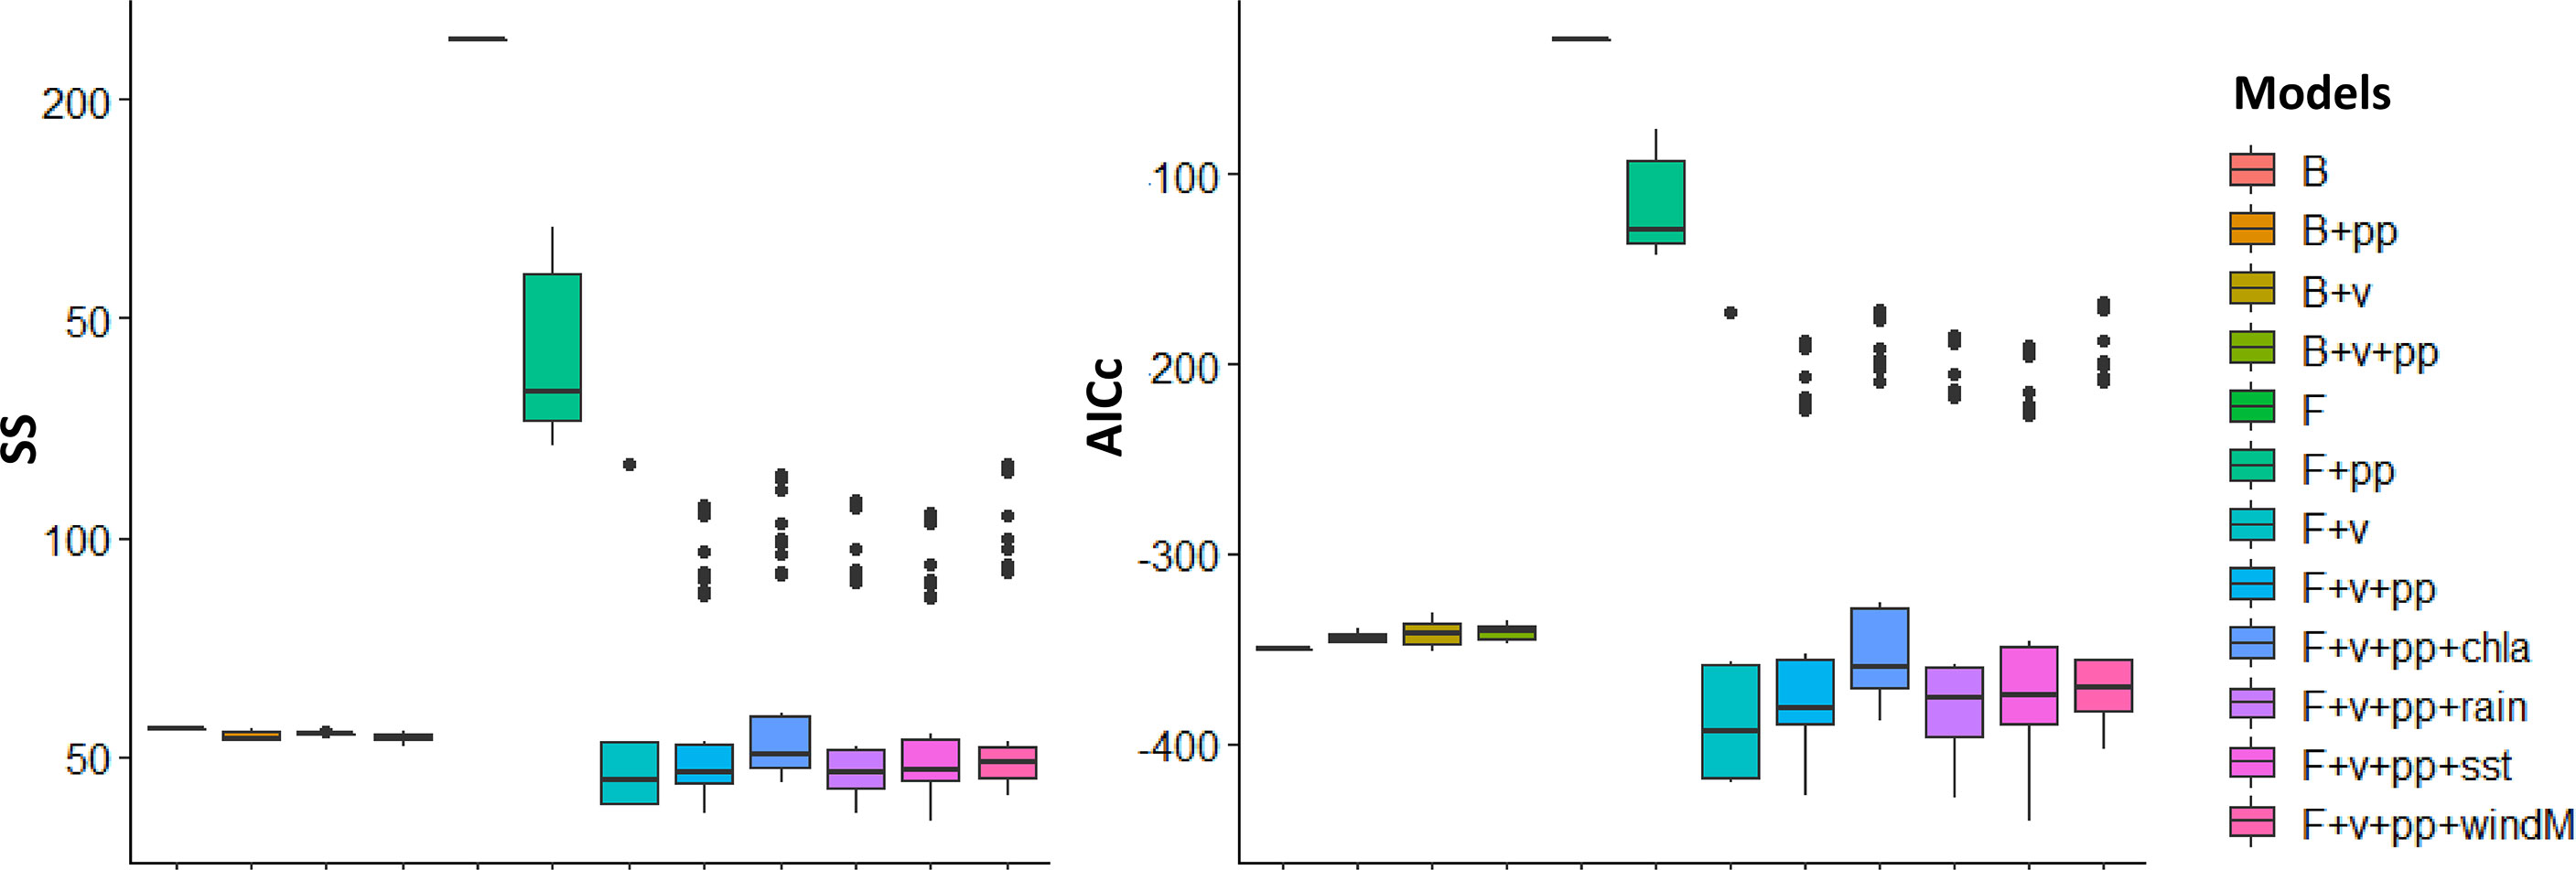
Figure 4 Boxplots of the sum of squares (SS) and AICc of all 402 models that were generated using a combination of environmental forcing functions (chla, chlorophyll a; rain, rainfall; sst, sea surface temperature; windM, wind magnitude), adjusted vulnerability settings (v), and the modeled primary productivity (pp) anomalies with fishing effort drivers (F) and without (B).

Figure 5 Visualized fits of model-predicted biomass trends to historical observations (black dots) under different hypothesis of fishing (F) and environmental drivers (sst, chla, rain, windM), trophic controls (v), and primary productivity anomalies (pp).
Figure 6 Visualized fits of model-predicted catch trends to historical observations (black dots) under different hypothesis of fishing (F) and environmental drivers (sst, chla, rain, windM), trophic controls (v), and primary productivity anomalies (pp).
On the other hand, the models with both fishing effort time-series drivers and vulnerability setting adjustments (H7 to H12) outperformed the rest by producing lower values of model SS and AICc overall (Figure 4). The best-fitting model was produced when time-series of sea surface temperature (sst) was added as a forcing function to the consumer search rates along with a search for primary productivity anomalies (H11) (Figure 4). This resulted in the largest decrease of model SS and AICc from the baseline scenario (Table 5). This model also achieved the best fit for the biomass of mackerels (Figure 5B) and the biomass and catch of crabs (Figures 5F, 6F). The best fit for the catches of sardines and mackerels were achieved when time-series of rainfall was applied along with a search for primary productivity anomalies (Figures 6A, B). However, no model was able to reduce the SS for the sardine biomass below the baseline scenario. In other words, neither fishing nor any of the environmental drivers was able to better explain statistically the historical biomass trend of the sardines, which appear to be stable over time (Figure 5A). All alternative models significantly improved the fits for the small demersal fish biomass. However, the best fit was achieved when time-series of chlorophyll-a was applied as a forcing function along with a search for primary productivity anomalies (Figure 5D). Similarly, best fits for the catch of this group (Figure 6D) were obtained when chlorophyll-a was applied as forcing function. For the scads, no model was able to reduce the biomass and catch sum of squares below the baseline scenario. Nonetheless, better fits were obtained visually with the observed catches when fishing effort drivers, vulnerability setting adjustments and PP anomaly search were applied (Figure 6C). All the alternative models with fishing effort drivers, vulnerability adjustments, PP anomaly search, and environmental forcing functions improved the fits to the historical squids biomass. However, fishing effort as the sole driver resulted in a model with the largest % reduction in SS (Table 5). On the other hand, no alternative model was able to reduce the catch SS for this group compared to the baseline scenario. Visually, however, better fits were obtained when time-series of SST was applied as a forcing function (Figure 6E).
Table 5 Best fitting models from each scenario and the percentage difference (% Δ) of individual SS from the reference time series of catch (C) and biomass (B), model SS, and model AICc from the baseline scenario where no fishing and environmental drivers were applied.
Overall, the results show that majority of the groups are highly sensitive to the effects of variable fishing effort, but trophic interactions play an important role in modulating these effects. The adjusted vulnerability settings from the best-fitting model show the most principal trophic control mechanisms in the Visayan Sea (Table 6). The adult stanza of the sardines, the juvenile stanza of the mackerels, the adult stanza of the scads, and the squids are shown to be bottom-up controlled by their prey. On the other hand, the adult mackerels, the juvenile stanza of the scads, and the reef-associated predator group 1 (jacks and barracudas) exert a top-down control on their prey.
Table 6 Adjusted vulnerability settings from the best-fitting model. B (v< 2) indicates bottom-up control. T (v > 2) indicates top-down control.
Local environmental variabilities also influence the biomass and catch of the different groups, with several groups being more sensitive to a particular parameter than the others. Interestingly, the influence of primary productivity anomalies is not exclusive to the plankton-feeding small pelagic groups as shown by its contributions to improving the individual fits to biomass and catch time-series of several groups. The primary productivity anomalies from the best-fitting model overall were shown to be positively correlated with the Pacific Decadal Oscillation (PDO) and negatively correlated with the Southern Oscillation Index (SOI) (Figure 7), indicating a possible bottom-up influence of large-scale and longer-term climatic variabilities in the Visayan Sea ecosystem. Among the local environmental parameters, only rainfall showed a weak but nonetheless significant negative correlation with the primary productivity anomalies (Figure 7). Subsequently, rainfall is negatively correlated and positively correlated with PDO and SOI, respectively.
Figure 7 Significant correlations found between the model-generated primary productivity anomalies (pp_anom) with local environmental parameters and regional climate indices. Significance levels: p < 0.05 (*), p < 0.01 (**), p < 0.001 (***).
4 Discussion
4.1 Insights from the dynamic modeling of fisheries and environment
Applying the ecosystem modeling approach allowed us to assess the status of the Visayan Sea as a whole in relation to the influence of both fisheries and environmental parameters on the system’s trophic interactions. From the model outputs of ecosystem network indices, we were able to identify system-level expressions of biomass extraction by the fishery (e.g., trophic level of the catch and G.E. of the fishery) and make inferences on the Visayan Sea’s status and development (Odum, 1969; Christensen, 1995). Importantly, these indices allowed us to compare the status of the Visayan Sea with other Philippine fishing grounds, and showed that despite their differences in geographic location and size, systems with similar fisheries extraction patterns produce closely similar indices. As shown by Heymans et al. (2014), marine ecosystems of the same type generally share similarities in system and network indices, but may either vary or correspond with each other with changing fishing intensity. This approach is very useful as it provides the opportunity to compare not only discrete ecosystems (Del Solar et al., 2022), but also the state of the same ecosystem across time with changes in fishing exploitation patterns (Neira et al., 2004) and under different climate regimes (Taylor et al., 2008).
Our results and those from the other Ecopath models of Philippine fishing grounds compared herewith confirm the considerably high impact of fishing activities even from two decades ago. They likewise reflect similar network indices and mortality rates reported in other highly exploited fishing grounds elsewhere in tropical Asia (e.g., Liew and Chan, 1987; Christensen, 1998; Chen et al., 2015). Going further back in time to the earliest exploratory trawl surveys in the Visayan Sea (Aprieto and Villoso, 1979), the demersal standing stock was estimated at around three times this baseline model’s estimate. In addition, what was considered as “trash fish” in the catch composition then (e.g., Apogonidae, Centriscidae, Centropomidae, and Pomacentridae) (Ordonez, 1985) feature more prominently in the catch composition of the trawl surveys from the last decade (Ampoyos-Arinque, 2018). Based on these findings, we can infer that the Visayan Sea ecosystem has undergone changes long before the first comprehensive fisheries assessment was conducted in the area (late 1990s). While we cannot determine the specific cause of these past changes, they have often been attributed almost exclusively to overfishing, as is the case with several other Philippine fishing grounds that have shown stock and catch declines over the past decades (Green et al., 2003; Barut et al., 2004; Anticamara and Go, 2016).
Lately, however, there is a growing recognition of the effects of climate and environmental variability on stock abundance in the Philippines (Damatac and Santos, 2016; Geronimo, 2018) and on the fisheries in general (Gopal and Anbumozhi, 2019; Suh and Pomeroy, 2020; Macusi et al., 2021). In a recent study, inter- and intra-annual environmental variabilities were shown to have significant influence on the species and gear CPUEs in the Visayan Sea (Bacalso et al., 2023). Through the ecosystem modeling approach, the present study was able to demonstrate the discrete and combined effects of fishing and the environment on the catches and biomass of the important fisheries groups in the Visayan Sea. The model fitting to time series under different hypotheses has shown that fishing effort trends in the Visayan Sea cause the largest deviation from the baseline model scenario (Figure 4), which suggests that indeed, the fishery has considerable influence on the historical catch and biomass. However, unrealistic trends were predicted with fishing effort as the sole driver of the system, such as scenarios of biomass and catch collapse in the later years when the effort of most fishing gears were at their peak. The consideration of trophic interactions significantly improved the overall model fits, while the addition of environmental parameter time series resulted in further refinements to the fits for several of the groups’ catch and biomass (Figures 5, 6).
Consistent with the results shown in Bacalso et al. (2023), the present study showed the significant influence of SST and primary productivity as the parameters that produced the best-fitting model overall. Likewise, the present study confirmed the important and seemingly favorable influence of SST on marine crabs in the Visayan Sea, particularly the blue swimming crabs whose species CPUEs show concurrence with the SST trend (Bacalso et al., 2023) due to a combination of biological and behavioral responses to increasing temperatures (De Lestang et al., 2003a; De Lestang et al., 2003b; Johnston et al., 2021). In the present study, this increase also appears to coincide with an increase in the effort of crab fishing gears and in the overall fishing effort, particularly from the municipal fisheries sector from 2012 onwards (Figure 2). However, the catch of marine crabs appears to have already reached a peak in 2015 followed by progressively decreasing catches in the succeeding years (Figure 6F) despite the high fishing effort. This is an indication that the CPUE increase on the marine crabs was not sustainable in the long term. In contrast to the increasing overall trend of the municipal fishing effort, the effort of most commercial fishing gears showed steady declines since the passing of the Philippine Fisheries Code2 in 1998 that set regulations and area limitations on the commercial fisheries activities. Further, a moratorium3 on the issuance of commercial fishing vessel and gear licenses was decreed in 2014, which was followed by tighter penalties for fisheries violations in the amended Fisheries Code4 in 2015. In addition, a country-wide ban on Danish seine operations5 was declared in 2013, which apparently resulted in further declines in their fishing effort. Coinciding with the increasing SST trend and the generally contrasting effort trends of the two fisheries sectors are the declining trends in the catch and biomass of mackerels, small demersal fishes and squids. Despite the absence of long-term biomass time-series for the predator groups, the model likewise predicted similar declining trends for these groups within the 20-year simulation period. The considerably high (> 100) adjusted vulnerability setting for one of the predator groups in the system – the jacks and barracudas – indicate that their initial biomass was already far below the carrying capacity, and that subsequent changes are expected to result in corresponding changes in the mortality rate of their prey (Guénette et al., 2008). In this case, the declining predator biomass resulted in a corresponding decrease in predation mortality of the different prey groups. Thus, the crabs’ biomass and catch trends in the Visayan Sea manifest a combination of biological and behavioral responses to the changing environmental conditions, the increasing fishing effort aimed at blue swimming crabs, and a trophic response to not only reduced predation, but also reduced competition in the system as well.
Chlorophyll a and primary productivity were shown to improve the fits not only of the plankton-feeding small pelagic fish, but also of the demersal fish and invertebrate groups. This reiterates our earlier contention that, in terms of energy utilization within the Visayan Sea, there is a lack of a clear-cut delineation between the pelagic and demersal groups. Such a scenario echoes the benthic-pelagic coupling mechanism (Ricci et al., 2022) wherein benthopelagic groups act as important couplers of energy (or biomass) in the system. In the shallow Visayan Sea, zooplankton, invertebrate groups (such as squids and shrimps), and even the juvenile stanzas of the pelagic fish groups facilitate both the upward (i.e., from the benthic producers to the pelagic consumers) and the downward flow of energy (i.e., from the pelagic producers to the benthic or demersal consumers) as they feed and are similarly preyed upon by consumers across the entire water column.
The model estimated primary productivity anomalies were found to be correlated with two regional climatic indices, the Pacific Decadal Oscillation (PDO) and the Southern Oscillation Index (SOI). However, a stronger correlation was shown with the former, which is consistent with the findings in Bacalso et al. (2023). As an index of SST variations in the northern Pacific Ocean, positive PDO anomalies were shown to cause irregular monsoon wind patterns and regional SST measures in the western North Pacific (Wu, 2013; Yang et al., 2018), which have implications on the duration, frequency, and timing of the monsoon rains and typhoon landfall. As a non-upwelling system, chlorophyll concentrations in the Visayan Sea are attributed largely to land-based nutrient run-off (Cordero-Bailey et al., 2004), which affects the primary productivity levels that support the production of small pelagics in the area. However, rainfall levels that are above the seasonal averages, particularly during the rainy northeast monsoon, were found to have negative effects (Bacalso et al., 2023) due possibly to reduced salinity (Sunye and Servain, 2002) and increased eutrophication and anoxia (Holmes et al., 2021). These processes explain the chief influence of rainfall on the small pelagics in the Visayan Sea model simulations, which describe a different mechanism for seasonal primary productivity compared to wind-driven upwelling systems in the Philippines (Cordero-Bailey et al., 2004) and elsewhere (Cury and Roy, 1989; Sartimbul et al., 2010; Teixeira et al., 2016). Wind and the timing and amount of rainfall were likewise found to be crucial factors that affect the recruitment success of different fish and invertebrates in the Visayan Sea (Bacalso et al., 2023). Thus, although the contribution of the other 3 environmental parameters to the improvement of the overall model fit is lower than that of the SST, their contributions to refining and explaining the individual group fits of catch and biomass are not irrelevant. As shown in the visualized sardine catch trend, a major and a minor peak occurred in 2003 and 2014, respectively (Figure 6A). Similar patterns were displayed by the catch trends of mackerels (Figure 6B), small demersal fish (Figure 6D) and squids (Figure 6E). At the same time, Figure 2A shows that these were the same years when low SSTs coincided with high chlorophyll-a levels and moderate rainfall. Patterns of water mass movements in the Philippine archipelago correspond with environmental patterns associated with the monsoons, and were found to influence the distribution, abundance, and the species richness of zooplankton across different geographic regions (Noblezada and Campos, 2012). This finding is particularly relevant in the Visayan Sea ecosystem where zooplankton acts as a link for the flow of primary production to the pelagic and demersal consumers alike.
The only group for which no model was able to adequately explain the historical observations in catch and biomass were the scads. The adjusted vulnerability settings also imply contrasting trophic controls on the juvenile and adult stanzas. We suspect that there might be a need to further analyze the species and size composition of this group in the model. At present, it is composed of both small scad species (e.g., Selaroides leptolepis with a mean length of around 13 cm in the catch) and larger scads (e.g., Decapterus species with a mean length 26 cm in the catch). Segregating them into two groups with distinct inputs of vital rates, diets and catches may produce better results. On the other hand, the biomass of sardines appeared to be stable over time. Unlike the sardine catch trend, it showed no apparent visual correspondence with the environmental parameter trends (Figure 2A) nor with any of the effort trends of fishing gears targeting the sardines, such as purse seines (PS), mid-water trawls (MWT) and drift gillnets (DGN) (Figures 2B, C). This contrasts with the results in (Bacalso et al., 2023) where the sardine CPUE displayed a fluctuating and overall declining trend. In that study, however, only the Sardinella gibbosa species was represented, while several sardine species are represented in the present study. Over the years, the contributions of the different sardine species to the overall catch showed shifting dominance from S. gibbosa during the earlier years of assessment to S. fimbriata and S. lemuru in more recent years (Mesa, 2019). This may explain the apparent “stability” of the sardine biomass in the model. However, this may warrant further investigation as the different sardine species may have different population resilience to fishing and environmental disturbance. In other Philippine fishing grounds, the dominant sardine species captured also show earlier signs of over-exploitation, such as decreasing catch volumes with increasing fishing effort while the catch and population status of the less-exploited sardine species are sustained (Olano et al., 2009; Ramos et al., 2009). Unfortunately, local studies on the causes of sardine species population fluctuations other than fishing are lacking. Even with their temperate species counterparts, historical collapses and recovery that can be explained by alternating optimal and sub-optimal environmental conditions are explored in relation to other small pelagics, such as anchovies (Lecomte et al., 2004; Bonanno et al., 2016). This outcome thus underscores an important challenge in modeling complex and multi-species ecological systems, specifically in making decisions concerning the tradeoffs between achieving a certain level of realism and model parsimony (Coelho et al., 2019). Nevertheless, we believe that our results provide convincing evidence for the feasibility, applicability, and necessity of the ecosystem modeling approach to assessing the status of the Visayan Sea and the variable influence of fishing and environmental drivers.
4.2 Limitations, outlook, and management implications
The present study was able to show that fishing and its corresponding trophic effects are the major drivers of biomass and catch in the Visayan Sea over the past two decades, while the environmental drivers provide explanations for patterns that cannot be explained by fishing alone. Thus, we strongly recommend the use of ecosystem modeling in the assessment of exploited marine ecosystems to complement the analyses from typically single-species population assessments in the Philippines, in order to appropriately respond to the nationally-legislated and internationally-recommended application of the ecosystem approach to managing the country’s fisheries. As per convention, harvest controls are established for stocks relative to a set of biological reference points. Broad regulations in fisheries are also to be imposed when stocks are deemed overfished within a certain fishing ground based, for example, on the computed maximum sustainable yield (MSY). At present, none of the fisheries reference points in the country are derived from the basis of environmental effects and trophic interactions. Furthermore, none of them can be considered as an adequate indicator of fisheries at the ecosystem level. However, the recent delineation and designation of the Philippine fishing grounds as Fisheries Management Areas (FMAs) presents an opportunity to endorse the adoption of more holistic and system-level operational indices in Philippine fisheries assessments.
While the application of ecosystem modeling presents a promising solution to address this gap, it likewise warrants the enhancement of the capabilities of local fisheries analysts in this regard. Further, a systematic monitoring of relevant local environmental parameters needs to be established and tailored to complement the fisheries monitoring and assessments specific to the country. In addition to the 4 environmental parameters analyzed in this study, salinity, dissolved oxygen, and bottom temperature, which together are also considered as water quality indicators, may be important to consider in future analyses given that they are shown to also have significant effects on fish stock abundance and assemblage (Zhang et al., 2009; Duque et al., 2020; Chiarini et al., 2022).
A model that can reasonably replicate observed historical trends provides a powerful platform to forecast potential future effects of fisheries policies and management measures (Rose and Cowan, 2003; Coro et al., 2016; Capotondi et al., 2019). Of parallel relevance are the future scenarios of climatic change predicted by the Intergovernmental Panel on Climate Change (IPCC). In the Philippines, the average temperatures are expected to rise by as much as 0.9°C to 1.9°C (under RCP 4.5) and 1.2°C to 2.3°C (under RCP8.5) by the mid-21st century (PAGASA, 2018). The same report describes increasing trends in annual and seasonal rainfall in many parts of the country, while longer seasons of lower-than-average rainfall are predicted in others. Further, declines in chlorophyll-a and primary production (by 0.5% to 11.8% of present-day mean values) are predicted following the projected increases in sea surface temperature and the shallowing of the mixed layer depth around the Philippines (Geronimo, 2018). Thus, the Visayan Sea stocks are expected to be negatively affected under these climate change projections, and the predicted economic impacts are likewise severe (Suh and Pomeroy, 2020). However, our results have demonstrated the modulating effects of trophic interactions to system disturbance over time. It would therefore be interesting to explore how the stocks in the Visayan Sea are predicted to respond to the various climate change scenarios using the ecosystem modeling approach, and moreover, be able to provide alternative insights to the future exploitation patterns and management scenarios for the Visayan Sea stocks (such as spatio-temporal effort regulations and other harvest controls).
Data availability statement
The original contributions presented in the study are included in the article/Supplementary Material. Further inquiries can be directed to the corresponding author.
Author contributions
RB conceptualized and designed the study, processed the environmental and fisheries data, built the ecosystem model, ran the simulations, performed the main analyses and wrote the original draft of the manuscript. GR and MW provided technical supervision in the ecosystem modeling and simulations, contributed to the analysis of the model and simulation outputs, and contributed to the review and editing of the manuscript. All authors contributed to the article and approved the submitted version.
Funding
This work is part of a Ph.D. made possible by the Katholische Akademische Ausländerdienst (KAAD) Scholarship Program 1. Costs for the conduct of supplementary research and fisheries data consolidation in the Philippines were supported in part by the United States Agency for International Development (USAID) - Fish Right Program in the Philippines under Cooperative Agreement (72049218CA00004).
Acknowledgments
We are particularly grateful to Prof. Nygiel Armada for sharing the fisheries data and results from the Visayan Sea survey and assessment conducted in 1996-1997, which were vital in constructing the baseline Ecopath model. We also thank the NSAP from Regions 5, 6 and 7 who, in collaboration with the Fish Right Program, provided the relevant fisheries information to establish the historical trends used in the analysis.
Conflict of interest
The authors declare that the research was conducted in the absence of any commercial or financial relationships that could be construed as a potential conflict of interest.
Publisher’s note
All claims expressed in this article are solely those of the authors and do not necessarily represent those of their affiliated organizations, or those of the publisher, the editors and the reviewers. Any product that may be evaluated in this article, or claim that may be made by its manufacturer, is not guaranteed or endorsed by the publisher.
Supplementary material
The Supplementary Material for this article can be found online at: https://www.frontiersin.org/articles/10.3389/fmars.2023.1099400/full#supplementary-material
Footnotes
- ^ Visayan Sea closed season for small pelagics (Fisheries Administrative Order Number 167)
- ^ Republic Act 8550
- ^ Bureau of Fisheries and Aquatic Resources Administrative (BFAR) Circular No. 253, s.2014
- ^ Republic Act 10654
- ^ Fisheries Administrative Order No. 246, s.2013
References
Ahrens R. N. M., Walters C. J., Christensen V. (2012). Foraging arena theory. Fish. Fish. 13, 41–59. doi: 10.1111/j.1467-2979.2011.00432.x
Alexander K. A., Heymans J. J., Magill S., Tomczak M. T., Holmes S. J., Wilding T. A. (2014). Investigating the recent decline in gadoid stocks in the west of Scotland shelf ecosystem using a foodweb model. ICES J. Mar. Sci. 72, 436–449. doi: 10.1093/icesjms/fsu149
Aliño P. M., Dantis A. L. (1999). “Lessons from the biodiversity studies of reefs: going beyond quantities and qualities of marine life,” in Symposium on marine biodiversity in the visayas and Mindanao. Ed. Campos W. (Iloilo, Philippines: University of the Philippines in the Visayas), 166.
Alino P., Mcmanus L., Mcmanus J., Nanola C., Fortes G., Trono G. C., et al. (1993). “Initial parameter estimations of a coral reef flat ecosystem in bolinao, pangasinan, northwestern Philippines,” in ICLRAM conf. proc, vol. 26 . Eds. Christensen V., Pauly D. (Makati, Metro Manila: International Center for Living Aquatic Resources Management (ICLARM)), 252–258.
Alms V., Wolff M. (2020). Identification of drivers of change of the gulf of nicoya ecosystem (Costa Rica). Front. Mar. Sci. 7. doi: 10.3389/fmars.2020.00707
Ampoyos-Arinque R. (2018). “Visayan Sea trawl survey trends,” in 1st Visayan Sea Scientific Conference, Iloilo City, Philippines. 20–21 Bureau of Fisheries and Aquatic Resources (DA-BFAR).
Anticamara J. A., Go K. T. B. (2016). Spatio-temporal declines in Philippine fisheries and its implications to coastal municipal fishers' catch and income. Front. Mar. Sci. 3. doi: 10.3389/fmars.2016.00021
Aprieto V. L., Villoso E. (1979). Catch composition and relative abundance of trawl-caught fishes in the visayan Sea. Fish. Res. J. Philipp. 4, 9–18.
Armada N. B. (2004). Assessment and management of small pelagic fisheries in the visayan sea. research report submitted to the deutsche gesellschaft für technische zusammenarbeit GmbH (GTZ) (Visayas, Miagao, Iloilo, Philippines: Institute of Marine Fisheries and Oceanology, College of Fisheries, University of the Philippines).
Armada N. B., Bacalso R. T. M. (2004). A preliminary trophic model of a shallow bay ecosystem: Sapian bay, Philippines. UPV J. Natural Sci. 9, 184–204.
Armada N. B., Bacalso R. T. M., Rosales R. M. P., Lazarte A. T. (2018). Right-sizing as a strategy for allocating fishing effort in a defined marine ecosystem: A Philippines case study. Ocean Coast. Manage. 165, 167–184. doi: 10.1016/j.ocecoaman.2018.08.018
Armada N., Cruz R., Cordero C. (2003). Trawl survey in sapian bay, Philippines. UPV J. Natural Sci. 8, 29–45.
Bacalso R. T. M. (2019). Fisheries baseline assessment in the visayan sea. results from the fisheries inventory survey, (2018) ( Makati, Philippines: USAID and BFAR Fish Right Program).
Bacalso R. T. M., Romagnoni G., Mesa S., Wolff M. (2023). Annual and seasonal environmental drivers of species- and gear-specific catch rates in the visayan Sea, Philippines. Regional Stud. Mar. Sci. 57, 102734. doi: 10.1016/j.rsma.2022.102734
Bacalso R. T. M., Wolff M. (2014). Trophic flow structure of the danajon ecosystem (Central Philippines) and impacts of illegal and destructive fishing practices. J. Mar. Syst. 139, 103–118. doi: 10.1016/j.jmarsys.2014.05.014
Bacalso R. T. M., Wolff M., Rosales R. M., Armada N. B. (2016). Effort reallocation of illegal fishing operations: A profitable scenario for the municipal fisheries of danajon bank, central Philippines. Ecol. Model. 331, 5–16. doi: 10.1016/j.ecolmodel.2016.01.015
Barut N. C., Santos M. D., Garces L. R. (2004). “Overview of Philippine marine fisheries,” in Turbulent seas: the status of Philippine marine fisheries (Cebu City, Philippines: Coastal Resource Management Project of the Department of Environmental and Natural Resources). DA-BFAR (DEPARTMENT OF AGRICULTURE-BUREAU OF FISHERIES AND AQUATIC RESOURCES.
Bonanno A., Barra M., Basilone G., Genovese S., Rumolo P., Goncharov S., et al. (2016). Environmental processes driving anchovy and sardine distribution in a highly variable environment: the role of the coastal structure and riverine input. Fish. Oceanography 25, 471–490. doi: 10.1111/fog.12166
Bundy A. (2004). The ecological effects of fishing and implications for coastal management in San Miguel bay, the Philippines. Coast. Manage. 32, 25–38. doi: 10.1080/08920750490247472
Bundy A., Pauly D. (2001). Selective harvesting by small-scale fisheries: ecosystem analysis of San Miguel bay, Philippines. Fish. Res. 53, 263–281. doi: 10.1016/S0165-7836(00)00295-2
Burnham K., Anderson D. (2002). Model selection and multimodel inference. a practical information-theoretic approach (Springer-Verlag: New York).
Campos W. L. (2003). “An ecosystem model of San Pedro bay, leyte, Philippines: Initial parameter estimates,” in. Silvestre G., Garces L., Stobutzki I., Ahmed M., Valmonte-Santos R. A., Luna C., Lachica-Aliño L., Munro P., Christensen V., Pauly D. (Eds.) Assessment, management and future directions for coastal fisheries in Asian countries (Bangladesh: WorldFish Center), 353–364.
Campos W. L. (2018). “The visayan Sea ecological system,” in 1st Visayan Sea Scientific Conference, Iloilo City, Philippines Bureau of Fisheries and Aquatic Resources (DA-BFAR).
Campos W. L., Felix L. R., Malingin M. A. C. L., Pepino M. M. C., Piloton R. D. R. (2020a). “Assessment of marine protected areas in the visayan Sea: Masbate,” in Implementation of the visayan Sea MPA project (Miag-ao, Iloilo: Ocean Bio and Marine Bio Labs, Division of Biological Sciences, College of Arts and Sciences, University of the Philippines Visayas).
Campos W. L., Felix L. R., Malingin M. A. C. L., Pepino M. M. C., Piloton R. D. R. (2020b). “Assessment of marine protected areas in the visayan Sea: Northern cebu,” in Implementation of the visayan Sea MPA project (Miag-ao, Iloilo: Ocean Bio and Marine Bio Labs, Division of Biological Sciences, College of Arts and Sciences, University of the Philippines Visayas).
Campos W. L., Felix L. R., Malingin M. A. C. L., Pepino M. M. C., Piloton R. D. R. (2020c). “Assessment of marine protected areas in the visayan Sea: Northern iloilo,” in Implementation of the visayan Sea MPA project (Miag-ao, Iloilo: OceaenBio and Marine Bio Labs, Division of Biological Sciences, College of Arts and Sciences, University of the Philippines Visayas).
Campos W. L., Felix L. R., Malingin M. A. C. L., Pepino M. M. C., Piloton R. D. R. (2020d). “Assessment of marine protected areas in the visayan Sea: Northern negros,” in Implementation of the visayan Sea MPA project (Miag-ao, Iloilo: Ocean Bio and Marine Bio Labs, Division of Biological Sciences, College of Arts and Sciences, University of the Philippines Visayas).
Capotondi A., Jacox M., Bowler C., Kavanaugh M., Lehodey P., Barrie D., et al. (2019). Observational needs supporting marine ecosystems modeling and forecasting: From the global ocean to regional and coastal systems. Front. Mar. Sci. 6. doi: 10.3389/fmars.2019.00623
Chen Z., Xu S., Qiu Y. (2015). Using a food-web model to assess the trophic structure and energy flows in daya bay, China. Continental Shelf Res. 111, 316–326. doi: 10.1016/j.csr.2015.08.013
Chiarini M., Guicciardi S., Angelini S., Tuck I. D., Grilli F., Penna P., et al. (2022). Accounting for environmental and fishery management factors when standardizing CPUE data from a scientific survey: A case study for nephrops norvegicus in the pomo pits area (Central Adriatic Sea). PLos One 17, e0270703. doi: 10.1371/journal.pone.0270703
Christensen V. (1995). Ecosystem maturity — towards quantification. Ecol. Model. 77, 3–32. doi: 10.1016/0304-3800(93)E0073-C
Christensen V. (1998). Fishery-induced changes in a marine ecosystem: insight from models of the gulf of Thailand. J. Fish. Biol. 53, 128–142. doi: 10.1111/j.1095-8649.1998.tb01023.x
Christensen V., Walters C. J. (2004). Ecopath with ecosim: methods, capabilities and limitations. Ecol. Model. 172, 109–139. doi: 10.1016/j.ecolmodel.2003.09.003
Christensen V., Walters C. J., Pauly D. (2005). Ecopath with ecosim: a user’s guide (Vancouver: Fisheries Centre, University of British Columbia).
Christensen V., Walters C. J., Pauly D., Forrest R. (2008). Ecopath with ecosim version6 user guide (November 2008 ed. ed: Lenfest Ocean Futures Project).
Cinco E., Silvestre G. (1994). “Population parameters and exploitation ratios of fishes caught in San Miguel bay, Philippines,” in Multidisciplinary assessment of the fisheries in San Miguel bay, Philippine, (1992–1993). ICLARM technical report 47. Eds. Silvestre G., Luna C., Padilla J. (Makati, Philippines: International Center for Living Aquatic Resources Management).
Coelho M. T. P., Diniz-Filho J. A., Rangel T. F. (2019). A parsimonious view of the parsimony principle in ecology and evolution. Ecography 42, 968–976. doi: 10.1111/ecog.04228
Cordero-Bailey K., Villanoy C., David L., Silvano K. (2004). “Estimating integrated phytoplankton biomass in the seas around the Philippines,” in 11th workshop of OMISAR (WOM-11) on the application and networking of satellite data, vol. 100. (Sanya, Hainan: P.R. China). ASIA-PACIFIC ECONOMIC COOPERATION MARINE RESOURCE CONSERVATION WORKING GROUP.
Coro G., Large S., Magliozzi C., Pagano P. (2016). Analysing and forecasting fisheries time series: purse seine in Indian ocean as a case study. ICES J. Mar. Sci. 73, 2552–2571. doi: 10.1093/icesjms/fsw131
Cury P., Roy C. (1989). Optimal environmental window and pelagic fish recruitment success in upwelling areas. Can. J. Fish. Aquat. Sci. 46, 670–680. doi: 10.1139/f89-086
DA-BFAR (2000). Philippine Fisheries profile for year 2000 (Quezon City, Philippines: Bureau of Fisheries and Aqutaic Resources).
Damatac A. I., Santos M. (2016). Possible effects of El niño on some Philippine marine fisheries resources. Philippine J. Sci. 145, 283–295.
De Lestang S., Hall N., Potter I. C. (2003a). Changes in density, age composition, and growth rate of portunus pelagicus in a Large embayment in which fishing pressures and environmental conditions have been altered. J. Crustacean Biol. 23, 908–919. doi: 10.1651/C-2376
De Lestang S., Hall N. G., Potter I. C. (2003b). Reproductive biology of the blue swimmer crab (Portunus pelagicus, decapoda: Portunidae) in five bodies of water on the west coast of Australia. Fishery Bull. 4, 745–757.
Del Norte-Campos A. G. C., Burgos L. A., Villarta K. A. (2019). A ranked inventory of commercially-important mollusks of panay, West central Philippines as a guide to prioritize research. The Philippine Journal of Fisheries 26 (2), 114–131. doi: 10.31398/tpjf/26.2.2019-0004
Del Solar A., Romagnoni G., Kluger L. C., Céspedes C. M. S., Wolff M. (2022). Comparative food web analysis of two Peruvian bay systems along a latitudinal gradient: Resource use and the environmental envelope. Front. Mar. Sci. 9.
Djabali F., Mehailia A., Koudil M., Brahmi B. (1993). Empirical equations for the estimation of natural mortality in Mediterranean teleosts. NAGA 16 (1), 35–37.
Duque G., Gamboa-García D. E., Molina A., Cogua P. (2020). Effect of water quality variation on fish assemblages in an anthropogenically impacted tropical estuary, Colombian pacific. Environ. Sci. pollut. Res. 27, 25740–25753. doi: 10.1007/s11356-020-08971-2
Froese R., Pauly D. (2020) FishBase.World wide web electronic publication. Available at: www.fishbase.org (Accessed 2021).
Geronimo R. C. (2018). Projected climate change impacts on Philippine marine fish distributions (Quezon City, Philippines: Department of Agriculture - Bureau of Fisheries and Aquatic Resources).
Geronimo R. C., Aliño P. M. (2009). “Capturing significant coral reef ecosystem and fishery changes in bolinao, Philippines, (1997–2008) using ecopath with ecosim,”. Eds. Palomares M. L. D., Morissette L., Cisneros-Montemayor A., Varkey D., Coll M., Piroddi C. (Vancouver, B.C., Canada: Fisheries Centre, University of British Columbia) 17 (3), 27–28. Ecopath 25 Years Conference.
Gopal T., Anbumozhi V. (2019). Effects of disasters and climate change on fisheries sectors and implications for ASEAN food security. Towards Resilient ASEAN Disasters Climate Change Food Security: Supporting ASEAN Resilience 1, 161–188.
Green S. J., White A. T., Flores J. O., Carreon M. E. I., Sia A. E. (2003). Philippine Fisheries in crisis: A framework for management (Cebu City Philippines: Coastal Resources Management Project, Department of Environment and Natural Resources).
Guanco M. R. (1991). Growth and mortality of Indian mackerel rastrelliger kanagurta (Scombridae) in the visayas Sea, central Philippines. Fishbyte 9, 13–15.
Guanco M. R., Mesa S. V., Belga P. B., Nunal D. R. M. (2009). “Assessment of the commercial fisheries of Western and central visayan Sea,” in DA-BFAR and NFRDI technical paper series (Quezon City, Philippines: Bureau of Fisheries and Aquatic Resources, National Fisheries Research and Development Institute).
Guarin F. (1991). A model of the trophic structure of the soft-bottom community in lingayen gulf, Philippines: an application of the ECOPATH II software and modelling approach (Quezon City, Philippines: University of the Philippines).
Guénette S., Christensen V., Pauly D. (2008). Trophic modelling of the Peruvian upwelling ecosystem: Towards reconciliation of multiple datasets. Prog. Oceanography 79, 326–335. doi: 10.1016/j.pocean.2008.10.005
Hernvann P.-Y., Gascuel D., Grüss A., Druon J.-N., Kopp D., Perez I., et al. (2020). The celtic Sea through time and space: Ecosystem modeling to unravel fishing and climate change impacts on food-web structure and dynamics. Front. Mar. Sci. 7. doi: 10.3389/fmars.2020.578717
Heymans J. J., Coll M., Libralato S., Morissette L., Christensen V. (2014). Global patterns in ecological indicators of marine food webs: A modelling approach. PLos One 9, e95845. doi: 10.1371/journal.pone.0095845
Heymans J. J., Coll M., Link J. S., Mackinson S., Steenbeek J., Walters C., et al. (2016). Best practice in ecopath with ecosim food-web models for ecosystem-based management. Ecol. Model. 331, 173–184. doi: 10.1016/j.ecolmodel.2015.12.007
Holmes E. E., Br S., Nimit K., Maity S., Checkley D. M. Jr., Wells M. L., et al. (2021). Improving landings forecasts using environmental covariates: A case study on the Indian oil sardine (Sardinella longiceps). Fish. Oceanography 30, 623–642. doi: 10.1111/fog.12541
Hoover C., Pitcher T., Christensen V. (2013). Effects of hunting, fishing and climate change on the Hudson bay marine ecosystem: I. re-creating past changes 1970–2009. Ecol. Model. 264, 130–142. doi: 10.1016/j.ecolmodel.2013.02.005
Ingles J., Pauly D. (1984). An atlas of the growth, mortality and recruitment of Philippines fishes (Manila, Philippines: International Center for Living Aquatic Resources Management).
Johnston D., Yeoh D., Harris D. (2021). Environmental drivers of commercial blue swimmer crab (Portunus armatus) catch rates in Western Australian fisheries. Fish. Res. 235, 105827. doi: 10.1016/j.fishres.2020.105827
Lachica-Aliño L., David L. T., Wolff M. (2009a). “Trophic flow structure of four overfished coastal ecosystems around the Philippines,”. Eds. Palomares M. L. D., Morissette L., Cisneros-Montemayor A., Varkey D., Coll M., Piroddi C. Ecopath 25 Years Conference Proceedings: Extended Abstracts. Fisheries Centre Research Reports (Vancouver, B.C., Canada: Fisheries Centre, University of British Columbia) 17 (3), 74–75.
Lachica-Aliño L., David L. T., Wolff M., Aliño P. M., Rañola M. C. G. (2009b). Distributional patterns, habitat overlap and trophic interactions of species caught by trawling in the ragay gulf, Philippines. Philipp. Agric. Scientist 92, 46–65.
Lanzuela N. S. B., Mesa S., Abrenica B. (2018). “Visayan Sea sardines reference points and harvest control rules,” in 1st visayan Sea scientific conference, vol. 2018 Iloilo City, Philippines: Bureau of Fisheries and Aquatic Resources (DA-BFAR).
Lecomte F., Grant W. S., Dodson J. J., Rodriguez-Sanchez R., Bowen B. W. (2004). Living with uncertainty: genetic imprints of climate shifts in East pacific anchovy (Engraulis mordax) and sardine (Sardinops sagax). Mol. Ecol. 13, 2169–2182. doi: 10.1111/j.1365-294X.2004.02229.x
Liew H. C., Chan E. H. (1987). ECOPATH model of a tropical shallow-water community in Malaysia (Universiti Pertanian Malaysia: Fisheries and Marine Science Centre).
Link J. S. (2010). Adding rigor to ecological network models by evaluating a set of pre-balance diagnostics: A plea for PREBAL. Ecol. Model. 221, 1580–1591. doi: 10.1016/j.ecolmodel.2010.03.012
Mackinson S., Daskalov G., Heymans J. J., Neira S., Arancibia H., Zetina-Rejón M., et al. (2009). Which forcing factors fit? using ecosystem models to investigate the relative influence of fishing and changes in primary productivity on the dynamics of marine ecosystems. Ecol. Model. 220, 2972–2987. doi: 10.1016/j.ecolmodel.2008.10.021
Macusi E. D., Camaso K. L., Barboza A., Macusi E. S. (2021). Perceived vulnerability and climate change impacts on small-scale fisheries in davao gulf, Philippines. Front. Mar. Sci. 8. doi: 10.3389/fmars.2021.597385
Mequila A., Campos W. (2007). Feeding relationships of dominant fish species in the visayan Sea. Sci. Diliman 19, 35–46.
Mesa S. V. (2019). FMA 11 and visayan Sea (sub-FMA). visayan Sea data consolidation workshop (Iloilo City, Philippines: Bureau of Fisheries and Aquatic Resources).
Neira S., Arancibia H., Cubillos L. (2004). Comparative analysis of trophic structure of commercial fishery species off central Chile in 1992 and 1998. Ecol. Model. 172, 233–248. doi: 10.1016/j.ecolmodel.2003.09.009
Noblezada M. M. P., Campos W. L. (2012). Chaetognath assemblages along the pacific coast and adjacent inland waters of the Philippines: relative importance of oceanographic and biological factors. ICES J. Mar. Sci. 69, 410–420. doi: 10.1093/icesjms/fsr209
Odum E. P. (1969). The strategy of ecosystem development. Science 164, 262–270. doi: 10.1126/science.164.3877.262
Olano V. L., Vergara M. B., Gonzales F. L. (2009). Assessment of the fisheries of sorsogon bay (Region 5), Quezon City, Philippines: Bureau of Fisheries and Aquatic Resources and the National Fisheries Development Institute 12 (4), 33.
Ordonez J. A. (1985). A study of the trash fish caught by ottere trawl in the visayan Sea. Philippine J. Fish. 18, 1–75.
PAGASA (2018). Observed climate trends and projected climate change in the Philippines. Eds. Hilario F. D., Juanillo E.L., Deguzman R. G. (Quezon City, Philippines: Philippine Atmospheric, Geophysical and Astronomical Services Administration).
Palomares M. L. D., Pauly D. (1998). Predicting food consumption of fish populations as functions of mortality, food type, morphometrics, temperature and salinity. Mar. Freshw. Res. 49, 447–453. doi: 10.1071/MF98015
Pauly D. (1980). On the interrelationships between natural mortality, growth parameters, and mean environmental temperature in 175 fish stocks. ICES J. Mar. Sci. 39, 175–192. doi: 10.1093/icesjms/39.2.175
Pauly D., Christensen V., Sambilay V. (1990). Some features of fish food consumption estimates used by ecosystem modellers. ICES Counc. Meet. 17 (9).
Pauly D., Sambilay S. Jr., Opitz S. (1993). “Estimates of relative food consumption by fish and invertebrate populations required for modelling the bolinao reef ecosystem, Philippines,” in Trophic models of aquatic ecosystems, vol. 26, 236–251. Eds. Christensen V., Pauly D. ICLARM Conference Proceedings.
Pauly D., Soriano-Bark M. L., Palomares M. L. D. (1993b). “Improved construction, parametrization and interpretation of steady-state ecosystem models” in Eds. Christensen V., Pauly D. Trophic models of aquatic ecosystems, Manila, Philippines: International Center for Living Aquatic Resources Management (ICLARM) 26, 1–13.
Pauly D., Christensen V. V, Dalsgaard J., Froese R., Torres F. Jr (1998). Fishing down marine food webs. Science (New York, N.Y.), 279 (5352), 860–863. doi: 10.1126/science.279.5352.860
Planque B., Fromentin J.-M., Cury P., Drinkwater K. F., Jennings S., Perry R. I., et al. (2010). How does fishing alter marine populations and ecosystems sensitivity to climate? J. Mar. Syst. 79, 403–417. doi: 10.1016/j.jmarsys.2008.12.018
Ramos M. H., Candelario M. B., Mendoza E. M., Lavapie-Gonzales F. (2009). The Honda bay fisheries: An assessment in BFAR NFRDI technical paper series, Quezon City, Philippines: Bureau of Fisheries and Aquatic Resources and the National Fisheries Research and Development Institute 12 (2), 45.
Reyes M. R. D. (1993). Fishpen culture and its impact on the ecosystem of laguna de bay, Philippines in Eds. Christensen V., Pauly D. ICLARM Conf. Proc. Makati, Metro Manila, Philippines: International Center for Living Aquatic Resources Management (ICLARM) 26, 74–84.
Ricci P., Carlucci R., Capezzuto F., Carluccio A., Cipriano G., D’onghia G., et al. (2022). Contribution of intermediate and high trophic level species to benthic-pelagic coupling: Insights from modelling analysis. Front. Mar. Sci. 9. doi: 10.3389/fmars.2022.887464
Romero F. G. (2009). Population structure of the blue crabs, portunus pelagicus (L.) in the visayan Sea: Implications to fisheries management (Ph.D.) (University of the Philippines, Diliman, Quezon City, Philippines).
Rose K. A., Cowan J. H. (2003). Data, models, and decisions in U.S. marine fisheries management: Lessons for ecologists. Annu. Rev. Ecology Evolution Systematics 34, 127–151. doi: 10.1146/annurev.ecolsys.34.011802.132423
Sartimbul A., Nakata H., Rohadi E., Yusuf B., Kadarisman H. P. (2010). Variations in chlorophyll-a concentration and the impact on sardinella lemuru catches in Bali strait, Indonesia. Prog. Oceanography 87, 168–174. doi: 10.1016/j.pocean.2010.09.002
Scott E., Serpetti N., Steenbeek J., Heymans J. J. (2016). A stepwise fitting procedure for automated fitting of ecopath with ecosim models. SoftwareX 5, 25–30. doi: 10.1016/j.softx.2016.02.002
Simons R. A. (2020). Available at: https://coastwatch.pfeg.noaa.gov/erddap (Accessed Dec. 8 2020). ERDDAP [Online]. Monterey, CA: NOAA/NMFS/SWFSC/ERD.
Suh D., Pomeroy R. (2020). Projected economic impact of climate change on marine capture fisheries in the Philippines. Front. Mar. Sci. 7. doi: 10.3389/fmars.2020.00232
Sunye P., Servain J. (2002). Effects of seasonal variations in meteorology and oceanography on the Brazilian sardine fishery. Fish. Oceanography 7, 89–100. doi: 10.1046/j.1365-2419.1998.00055.x
Tajolosa M. A. (2011). Population and reproductive biology of the Indian squid photololigo duvaucelii d’Orbigny 1895 (Cephalopoda: Loliginidae) in the visayan Sea, Philippines (University of the Philippines: Visayas, Miag-ao, Iloilo, Philippines).
Tan B. C., Anticamara J., Villanueva M. C. (2018). Modeling of degraded reefs in leyte gulf, Philippines in the face of climate change and human-induced disturbances. Climate Disaster Dev. J. 3 (1), 1–12. doi: 10.18783/cddj.v003.i01.a01
Taylor M. H., Wolff M., Mendo J., Yamashiro C. (2008). Changes in trophic flow structure of independence bay (Peru) over an ENSO cycle. Prog. Oceanography 79, 336–351. doi: 10.1016/j.pocean.2008.10.006
Teixeira C. M., Gamito R., Leitão F., Murta A. G., Cabral H. N., Erzini K., et al. (2016). Environmental influence on commercial fishery landings of small pelagic fish in Portugal. Regional Environ. Change 16, 709–716. doi: 10.1007/s10113-015-0786-1
Ulanowicz R. E. (1984). “Community measures of marine food networks and their possible applications,” in Flows of energy and materials in marine ecosystems: Theory and practice. Ed. Fasham M. J. R. (Boston, MA: Springer US).
Wang S. C., Liu X., Liu Y., Wang H. (2021). Disentangling effects of multiple stressors on matter flow in a lake food web. Ecol. Evol. 11, 9652–9664. doi: 10.1002/ece3.7789
Warfel H. E., Manacop P. R. (1950). Otter trawl explorations in Philippine waters. Research Report 25 (Washington D.C: U.S. Fish and Wildlife Service).
Wolff M., Ruiz D. J., Taylor M. (2012). El Niño induced changes to the Bolivar channel ecosystem (Galapagos): comparing model simulations with historical biomass time series. Mar. Ecol. Prog. Ser. 448, 7–22. doi: 10.3354/meps09542
Wu C. R. (2013). Interannual modulation of the pacific decadal oscillation (PDO) on the low-latitude western north pacific. Prog. Oceanography 110, 49–58. doi: 10.1016/j.pocean.2012.12.001
Yang L., Chen S., Wang C., Wang D., Wang X. (2018). Potential impact of the pacific decadal oscillation and sea surface temperature in the tropical Indian ocean-Western pacific on the variability of typhoon landfall on the China coast. Climate Dynamics 51, 2695–2705. doi: 10.1007/s00382-017-4037-7
Keywords: ecosystem modeling, Ecopath with Ecosim (EwE), fishing impact, trophic interactions, environmental drivers, Visayan Sea
Citation: Bacalso RTM, Romagnoni G and Wolff M (2023) Identifying drivers of change during the recent two decades in the Visayan Sea using a trophic modeling approach. Front. Mar. Sci. 10:1099400. doi: 10.3389/fmars.2023.1099400
Received: 15 November 2022; Accepted: 10 January 2023;
Published: 26 January 2023.
Edited by:
Chiara Piroddi, Joint Research Centre, ItalyReviewed by:
Jorge Paramo, University of Magdalena, ColombiaIrene Martins, University of Porto, Portugal
Copyright © 2023 Bacalso, Romagnoni and Wolff. This is an open-access article distributed under the terms of the Creative Commons Attribution License (CC BY). The use, distribution or reproduction in other forums is permitted, provided the original author(s) and the copyright owner(s) are credited and that the original publication in this journal is cited, in accordance with accepted academic practice. No use, distribution or reproduction is permitted which does not comply with these terms.
*Correspondence: Regina Therese M. Bacalso, cmJhY2Fsc29AdW5pLWJyZW1lbi5kZQ==; cmVnaW5hLmJhY2Fsc29AZ21haWwuY29t