 Yujun Yi1,2*
 Fanxuan Zhao
- 1State Key Laboratory of Water Environmental Simulation, School of Environment, Beijing Normal University, Beijing, China
- 2Ministry of Education Key Laboratory of Water and Sediment Science, School of Environment, Beijing Normal University, Beijing, China
Introduction: Sediment and nutrients flow into estuary with runoff, and then influence the estuary ecosystem. Much work has been done for investigating the response of water quality and species group (eg. phytoplankton or zooplankton) to the runoff from upstream, while few research has been taken to evaluate the response of the whole ecosystem.
Methods: Food webs of different seasons and regions were established based on stable isotope analysis and Bayesian mixing model. The influences of upstream runoff and sediment transport on the estuarine food webs were analyzed.
Results: Food web in estuary had highly spatial-temporal variability. The stable isotope values of organisms were higher on the northern shore than that on the southern shore. The area with high-turbidity freshwater inflow nurtured more terrestrial- organic- matter (TOM) relying species. And the contribution of TOM to food web was higher in flood season than that in non-flood season. The trophic levels of major consumers in the non-flood season were generally higher than that in the flood season. Significant differences in the average TP of species between two shores appeared during the non-flood season (P < 0.05). Expect for the C value, all of the topological indexes of food webs on the northern shore were higher than those on the southern shore, and they were higher in the flood period.
Discussion: The input and diffusion of sediment and nutrients carried by runoff led to the changes in the dietary structure of estuarine organisms and the decrease in trophic levels of major consumers. At the same time, flow pulse with high sediment also aggravated the spatial differences of the structure of food webs. The higher contribution of TOM to consumers increased the link density of food web on the southern shore, making it a more robust system. However, the high diversity of food sources and aquatic species made the food web more complex on the northern shore.
1 Introduction
The energy flow within a food web signifies the trophic structure of the community, the population dynamics and the nutrient cycling in the ecosystem (Yen et al., 2016). Due to the unique geographic location and dynamic characteristics of estuarine ecosystems, organic matter and organisms are highly mobile. So the energy flow in the food web of estuarine ecosystems exhibits complex spatial and temporal characteristics (Abrantes et al., 2013; Poiesz et al., 2020). Identifying the relative importance of different basal food sources and the main energy flow pathways are the prerequisites for predicting the response of estuarine ecosystems to external disturbances, and also significant for maintaining the biodiversity, stability and function of estuarine ecosystems (Thieltges et al., 2008; Pinkerton and Bradford-Grieve, 2014; Hui and Williams, 2020).
Temporal and spatial variations of the energy flow patterns are existed in the estuarine food web (Arcagni et al., 2015). In terms of space, different environmental conditions, such as water turbidity and the concentration of dissolved organic/inorganic nutrients, dominated the changes in the basal food sources supporting the food web (Roach, 2013). High suspended sediment concentration significantly limits the primary production by modifying light penetration and scattering, shifting the basal food sources towards terrestrial material (Lunt and Smee, 2020). In terms of time, changes in flow regime such as magnitude of discharge, seasonal subside of terrestrial material can affect the proportion of available autochthonous/allochthonous resources for consumers (Olin et al., 2013). Higher freshwater inflow will enhance the influence of continental organic matter on estuarine food webs (Marshall et al., 2021). Hydrological regulation contributed to temporal and spatial variations of estuarine food webs simultaneously. It affected the natural flow and thermal patterns of rivers as well as the diffusion path and sediment transport (Olden and Naiman, 2010), which lead to changes in the river physical mechanisms, estuarine ecological environment, and the terrestrial organic matter (TOM) availability (Wang et al., 2010). It changed the basal food sources available in time (Hladyz et al., 2012), ultimately exacerbating/mitigating spatial differences in trophic interactions and the energy flow of the estuarine food web. Therefore, it further affected the overall structure and function of the estuarine ecosystem (Abrantes et al., 2014). In artificially controlled rivers, some researches have been taken to evaluate the influence of longitudinal connectivity changing along river on the food web structure and function (Abrantes and Sheaves, 2010; Ru et al., 2019), while the spatial heterogeneity of the estuary region was less concerned (Garcia et al., 2017). Although previous researchers have made progress on the horizontal spatial differences in trophic structure characteristics of communities based on stable isotopes (Liu et al., 2020), the understanding of energy flow pattern of estuarine food webs is still limited. Incorporating the effects of hydrological and environmental conditions into estuarine food webs to quantify the energy transmission mechanisms is important to help further understanding how the spatial and temporal changes of food sources and trophic structure affect the ecosystem functions.
One of the main methods to reveal the structure and function of food webs is stable isotopic analysis (Middelburg, 2014). In calculating the trophic level and food source contributions, compared to traditional stomach content analysis methods, stable isotopic analysis methods are not limited by time and space, and can reflect information about organisms’ food absorption and long-term metabolism (Young et al., 2018). Consumers’ carbon isotopes which exhibit significant differences among primary producers with different photosynthetic pathways, are often used to determine the relative contribution of each basal food source to consumers (West et al., 2006; Layman et al., 2012). And nitrogen stable isotopes which are stepwise enrichment with trophic transfers, are powerful tool for determining the relative trophic position of species in the food web and the length of the food chain (Jennings and van der Molen, 2015).
The Yellow River Estuary (YRE), a typical weak tide estuary, the environment is highly influenced by the runoff from upstream Yellow River (YR). Due to the water-sediment regulation scheme, the YR carries a large quantity of water and sediment discharge into Bohai Sea during the flood season (Hou et al., 2020). The diffusion of water and sediment caused environmental disturbances in YRE (Liu et al., 2020), which might change the amount and distribution of organic matter and aquatic life. This study aimed to explore (1) whether YR downstream flow and sediment pulse would influence the estuarine ecosystem, (2) by what factors would runoff affect the YRE ecosystem, (3) how did structure and energy flow of food webs in YRE respond to different runoff and sediment processes.
2 Materials and methods
2.1 Study area
The Yellow River, which flows into the Bohai Sea, is the second largest river in China, with a length of more than 5,400 kilometers and a drainage area of 745,000 square kilometers (Figure 1). The average annual runoff of Lijin Station (the nearest hydrologic station to the mouth of Yellow River Estuary) is 28.86 billion m³, carrying 638 million tons of sediment into the Bohai sea. Among that, runoff and sediment discharge from May to October accounts for more than 80% and 95% of the year, respectively. The interaction between the ocean and the land in the YRE is obvious, the ecological environment factors change on a gradient, and the vegetations are distributed in patches (Jiang et al., 2013; Xie et al., 2020). The dominant species in the supratidal zone are Phragmites australis, Suaeda heteropteran, Tamarix chinensis and other halophytes, which are regarded as the main land source, representing the TOM in the YR. Spartina alterniflora dominates the intertidal zone, and the main producers of the subtidal zone are microphytobenthos (MPB), phytoplankton and other macroalgae (Xie et al., 2020). The clear community structure of producers makes the identification and sampling of food sources more feasible.
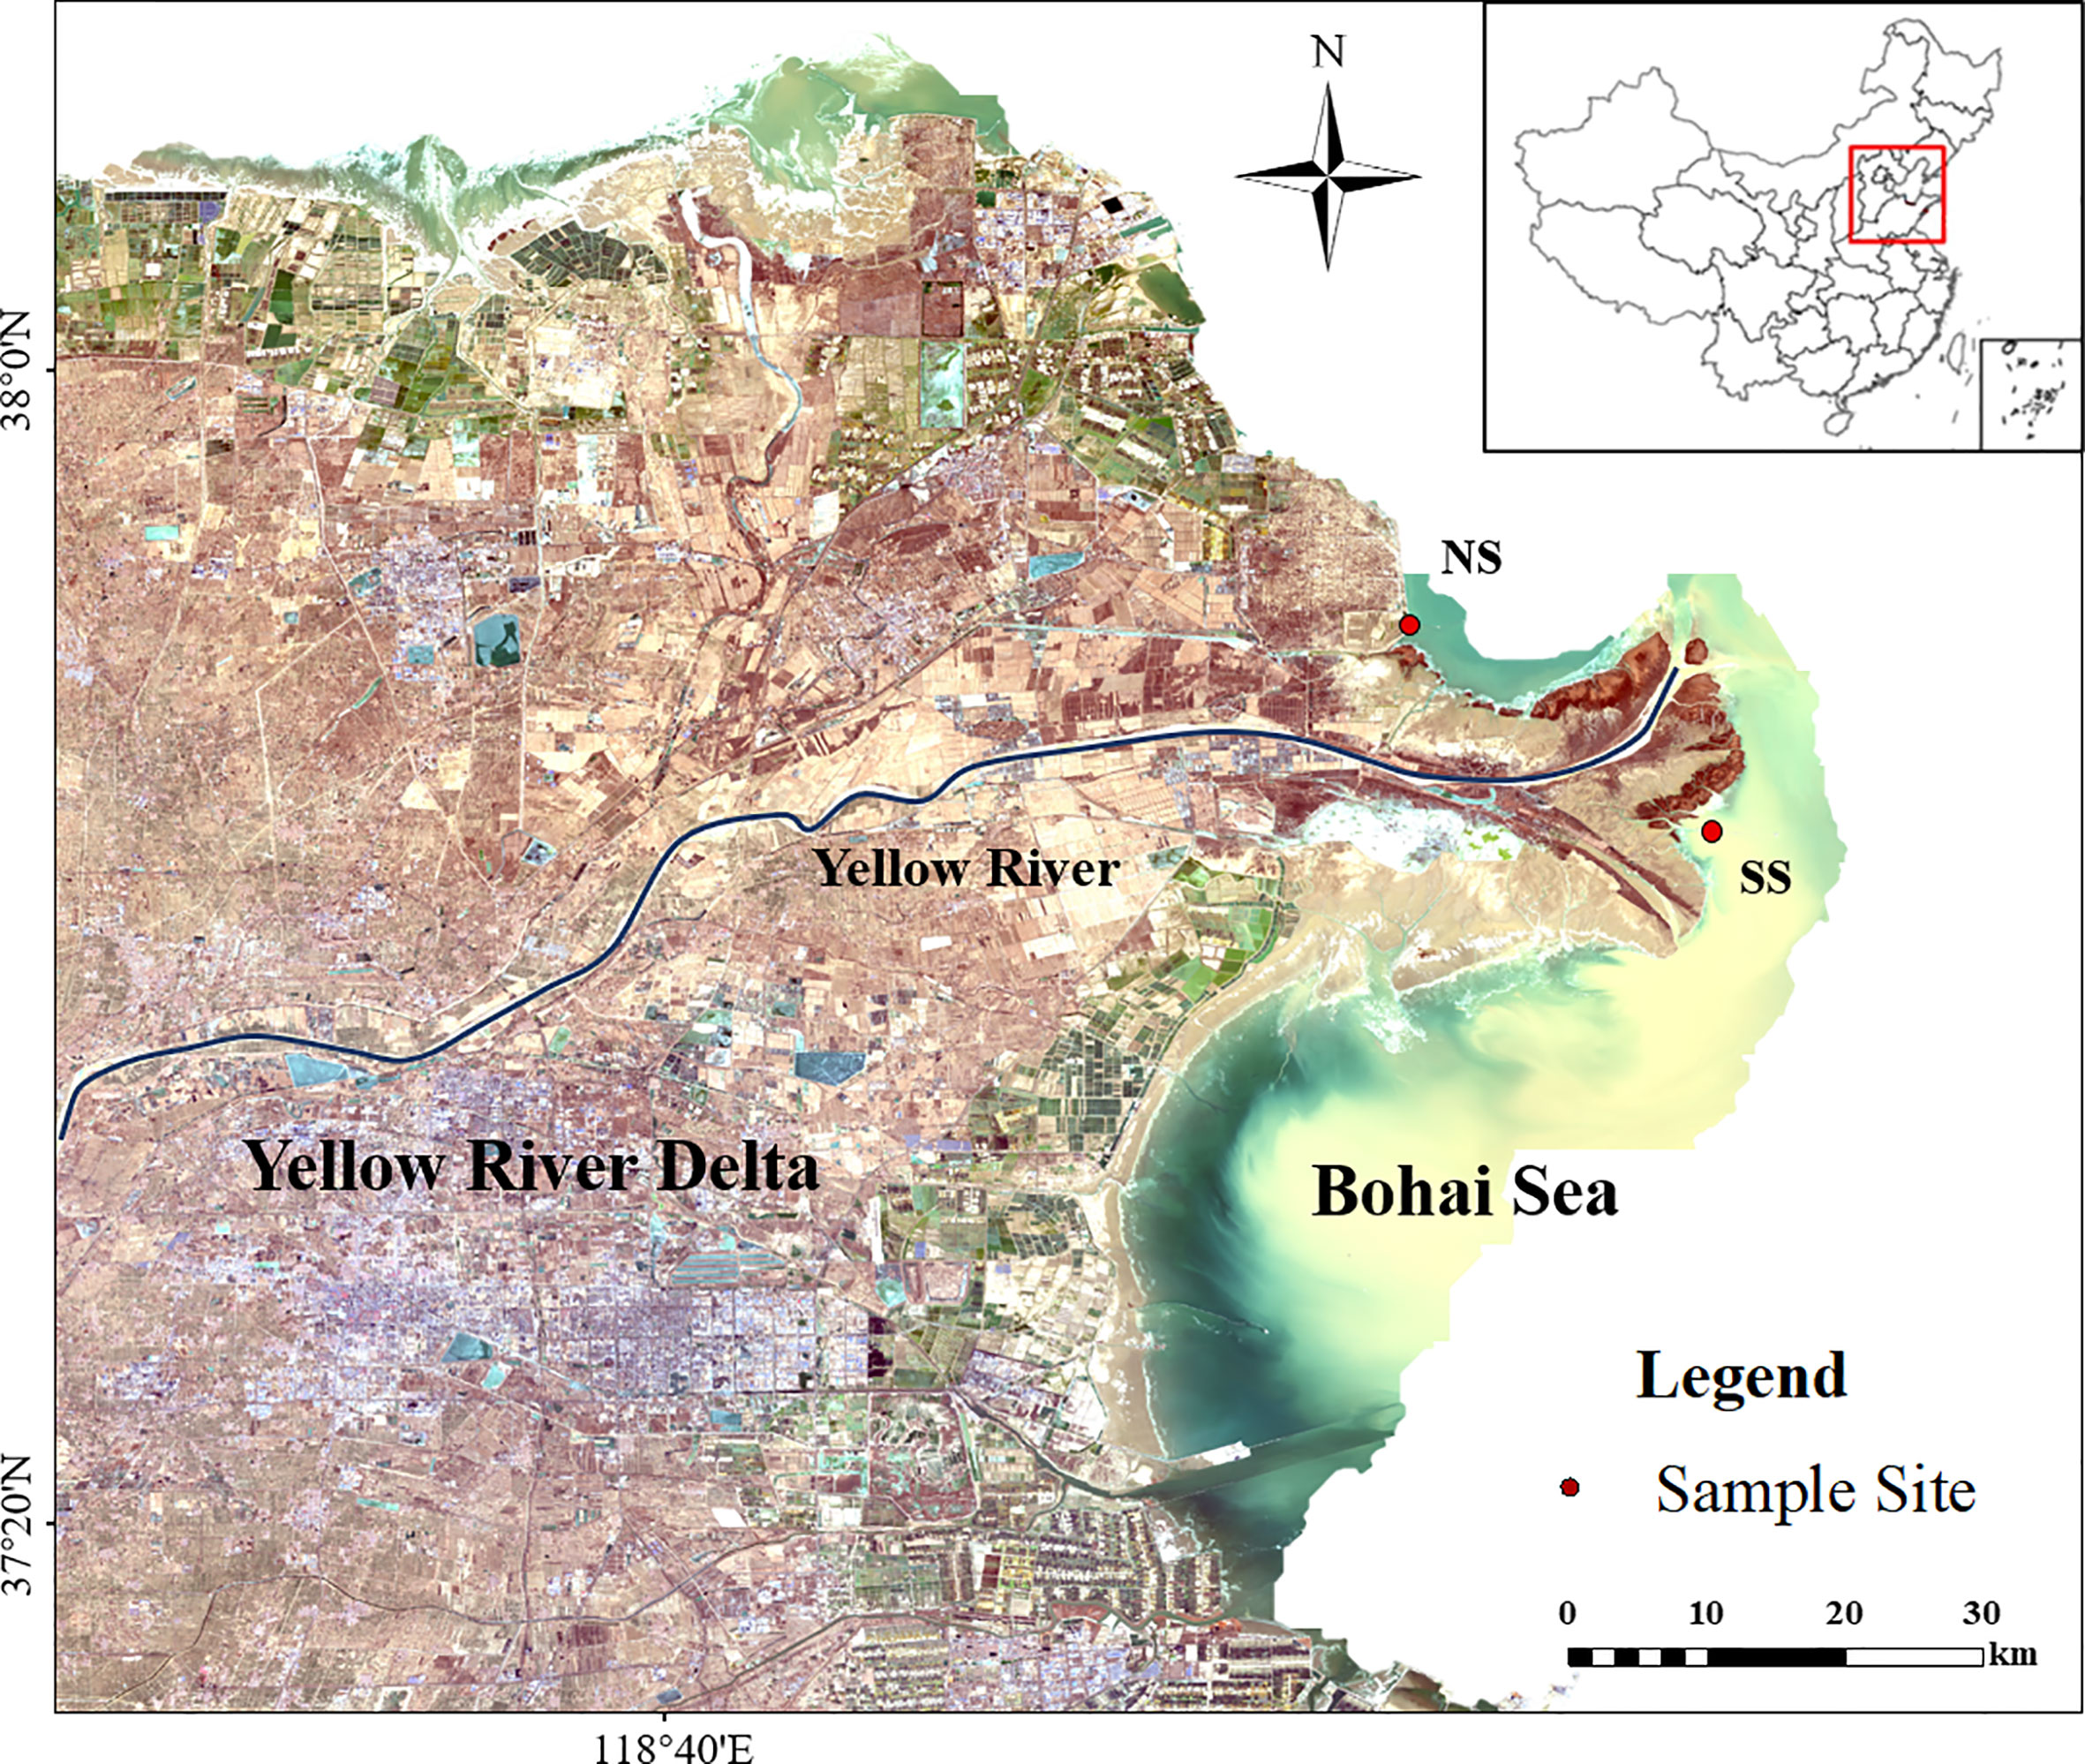
Figure 1 Location of the study area and sampling sites. (NS) Northern shore; (SS)Southern shore. The distribution of suspended sediment in seawater (in bottle green) around YRE is shown in yellow.
According to the uneven annual distribution of water and sediment fluxes, the hydrological period in the YRE can be divided into flood season (From May to October) and non-flood season (From November to April) (Figure A1). Due to the influence of the spread of freshwater and the differing topography, environmental conditions showed differences between the northern and southern shores (Table A1). The variations in flow regimes and environmental characteristics contributed to the difference of energy flow dynamics in the food web at YRE (Maceda-Veiga et al., 2018; Liu et al., 2020; Marshall et al., 2021).
2.2 Sample collection and data analysis
Representative sampling areas with obvious environmental heterogeneity were set up on both the southern and northern shores of the YRE, and the sampling was repeated for three times at each sampling area. Because of the distinct hydrological characteristics in flood and non-flood seasons, the sampling was conducted in October 2018 and April 2019 in the YRE nature reserve. The main primary producers from subtidal zone, intertidal zone and land as well as major aquatic consumers in YRE were collected. Since it takes sufficient time for tissues of consumers to reflect the isotopic signatures of food sources (Phillips et al., 2014), consumers must live under each condition for two to three months before sampling (Tieszen et al., 1983; Thomas et al., 1997; McIntyre and Flecker, 2006). Therefore, the samples collected in October corresponded to the flood season, and samples in April reflected the food source contribution in non-flood season (Figure A1).
Sampling was strictly carried out in accordance with GB17378.3-2007 marine monitoring specifications. At each sampling point, water quality indicators were measured using ISI-550A water quality detector. Surface sediment samples including microphytobenthos community were collected by a clam grab bucket, sieved wet on a 500-μm mesh screen, then freeze-dried. Phytoplankton were trawled vertically from the bottom to the surface using No.25 plankton nets with 0.064-mm aperture, and zooplankton were collected using a No.13 plankton net with 0.112-mm. Benthic organisms were collected by 0.5mm-diameter benthic bottom trawls and to collect the fish, shrimp and crabs of were collected by a 3-meter-long single bottom boat trawl. (Parameters of the trawl: the circumference and width of the trawl mouth is 30.6m and 8m, and the mesh size is 20mm). Fourteen fish species were collected, including dominant and important species Synechogobius hasta, Engraulis japonicus and Sillago sihama. The macroinvertebrate community were represented by three dominant species, namely Oratosquilla oratoria, Portunus trituberculatus and Fenneropenaeus chinensis, and three general species: Eriocheir sinensis, Mactra veneriformis and Meretrix meretrix. In laboratory, entire individuals of low trophic level organisms (e.g. phytoplankton and benthic macroalgae) were evenly divided into two parts. One half was acidified with 1 mol/L HCl to remove the inorganic carbon for δ13C analysis, and the other half was prepared for δ15N analysis. High trophic level organisms (e.g. fish) were analyzed by dorsal muscle tissues, which defatted in a solution of methanol, chloroform, and water (2:1:0.8) to avoid isotopically lighter fatty tissues (Bligh and Dyer, 1959). These samples were dried to constant weight in oven at 60-80 degrees Celsius for 48-72 hours, ground in a mortar, passed through a 0.178mm-diameter sieve, and stored in dry tin foil. Detailed sampling and sample preparation methods have been described in Liu et al. (2020). The samples were first burned at high temperature in an EA-HT elemental analyzer to generate CO2 or N2, and the 13C/12C and 15N/14N ratios were detected using a DELTA V Advantage isotope ratio mass spectrometer (Thermo Fisher Scientific, Inc., Bremen, Germany) and compared with international standards (Vienna Pee Dee Belemnite or Atm-N2) to calculate the stable isotope ratio of the sample (Liu et al., 2020). Formulas for stable isotope ratio estimation are shown as Eq. A1 and Eq. A2 in Appendices. The stable isotope values of each species are shown in Table A2.
2.3 Trophic level estimation and mixing model calculation
The consumer’s trophic position (TP) was calculated as follows (Hussey et al., 2014):
where δ15NTP is the consumer’s nitrogen stable isotope value, δ15Nlim is the saturating isotope limit as TP increases, and δ15Nbase is the isotope value for a known baseline consumer in the food web. In this study, zooplankton was chosen as the known baseline consumer. k is the rate at which δ15NTP approaches δ15Nlim per TP step, and TPbase is the TP of the baseline organism, which is set to 2 in this study (Post, 2002; Hussey et al., 2014). β0 = 5.92[4.55, 7.33], β1 = −0.27[−0.41, −0.14],which are the 95% highest posterior median (HPM) uncertainty intervals (Reum et al., 2015; Qu et al., 2019). A paired two-sample t test was used to analyze the differences in TP of the same fish species in different hydrological periods and sampling areas, with P< 0.05 as the significance level. The above statistical analysis was performed in SPSS Statistics 24.0.
Prior to the analysis of the contribution of the basal food sources, according to previous study on the similarity of the isotopic values (Qu et al., 2019), P. australis, S. heteropteran and T. chinensis were formed a priori combinations of sources representing terrestrial sources, so the number of sources was small enough to provide a unique solution. While ranges of feasible contributions for each individual source can often be quite broad, contributions from functionally related groups of sources can be summed a posteriori, producing a range of solutions for the aggregate source that may be considerably narrower (Phillips et al., 2005; Moore and Semmens, 2008).
In this study, a script version of Bayesian mixing model, MixSIAR, run on the R language platform (version 3.6.3) (R Development Core Team, 2013), was used to calculate the relative contribution of each basal food source for the diets of the consumers in different hydrological periods and regions (Stock et al., 2018). This model takes into account in the uncertainty of source values, categorical and continuous covariates, as well as prior information (Semmens et al., 2009). In this study, basal food sources were classified into 5 types: phytoplankton, macroalgae, MPB, S. alterniflora and TOM. During the mixing model calculations, we assumed trophic enrichment of 0.5 ± 1.54‰ and 3.15 ± 1.31‰ for δ13C and δ15N, respectively (Kiljunen et al., 2020). The distribution of the food sources contributions to consumer diets were generated by the Markov chain Monte Carlo (MCMC) method (Semmens et al., 2009). To construct the full energy flow food webs for the different hydrological periods and regions, not only the contribution ratio of basal food sources, the relative contribution ratio of potential food sources for each consumer was also calculated. The analysis of the food sources contributions required to first define the potential food sources of each consumer. The benthic macroinvertebrates were divided into two categories according to functional feeding groups (Ru et al., 2019). The first category was collector-scrapers, which included oligochaetes and snails, such as Corbiculidae and Naticidae, and larvae of the orders Ephemeroptera, Trichoptera, and Diptera. The second category included predator-shredders, including shrimps and crabs (Liu and Wang, 2008). According to the results from MixSIAR model, if the average contribution of basal food sources to one consumer was ≥ 20%, or the average contribution of potential food sources to one consumer was ≥ 10%, there were effective links between food sources and this consumer (Blanchette et al., 2014). Based on the effective links, the food web was constructed in each period at each sample site.
Five indicators were used to describe the structural characteristics of the food web: the number of nodes (S), which is the number of elements in the food web, indicating the species diversity; the links (L), which indicates the number of effective links in the food web; the maximum links (Max. L), which is the maximum number of possible links in the food web, indicating the complexity; the link density (D), which is the number of links/the number of species; and the connectance (C), which is the number of effective links/the maximum number of possible links, representing the connectivity (Pimm et al., 1991).
3 Results
3.1 Carbon and nitrogen stable isotope in different species
In general, the signatures of the carbon stable isotopes between different food sources were significantly different, and these signatures had a consistent gradual increase from land to ocean. For the isotope ratios of the basal food sources, the δ13C value was low in TOM (-24.30 to -23.00‰), MPB (-23.95 to -21.63‰) and phytoplankton (-23.60 to -20.05‰), and high in S. alterniflora (-15.72 to -14.66‰) and macroalgae (-14.26 to -10.74‰) (Figure 2 and Table A2.). The δ13C value of omnivorous fish (-22.76 to -10.27‰) were relatively higher, while that of filter-feeding fish were the lowest (-25.27 to -16.40‰). In flood season, the average δ13C value of consumers on the southern shore was significantly lower than that of the northern shore (ANOVA, F = 8.948, p = 0.007, n = 25), while there were no significant differences during non-flood season (ANOVA, F = 0.056, p = 0.816, n = 22).
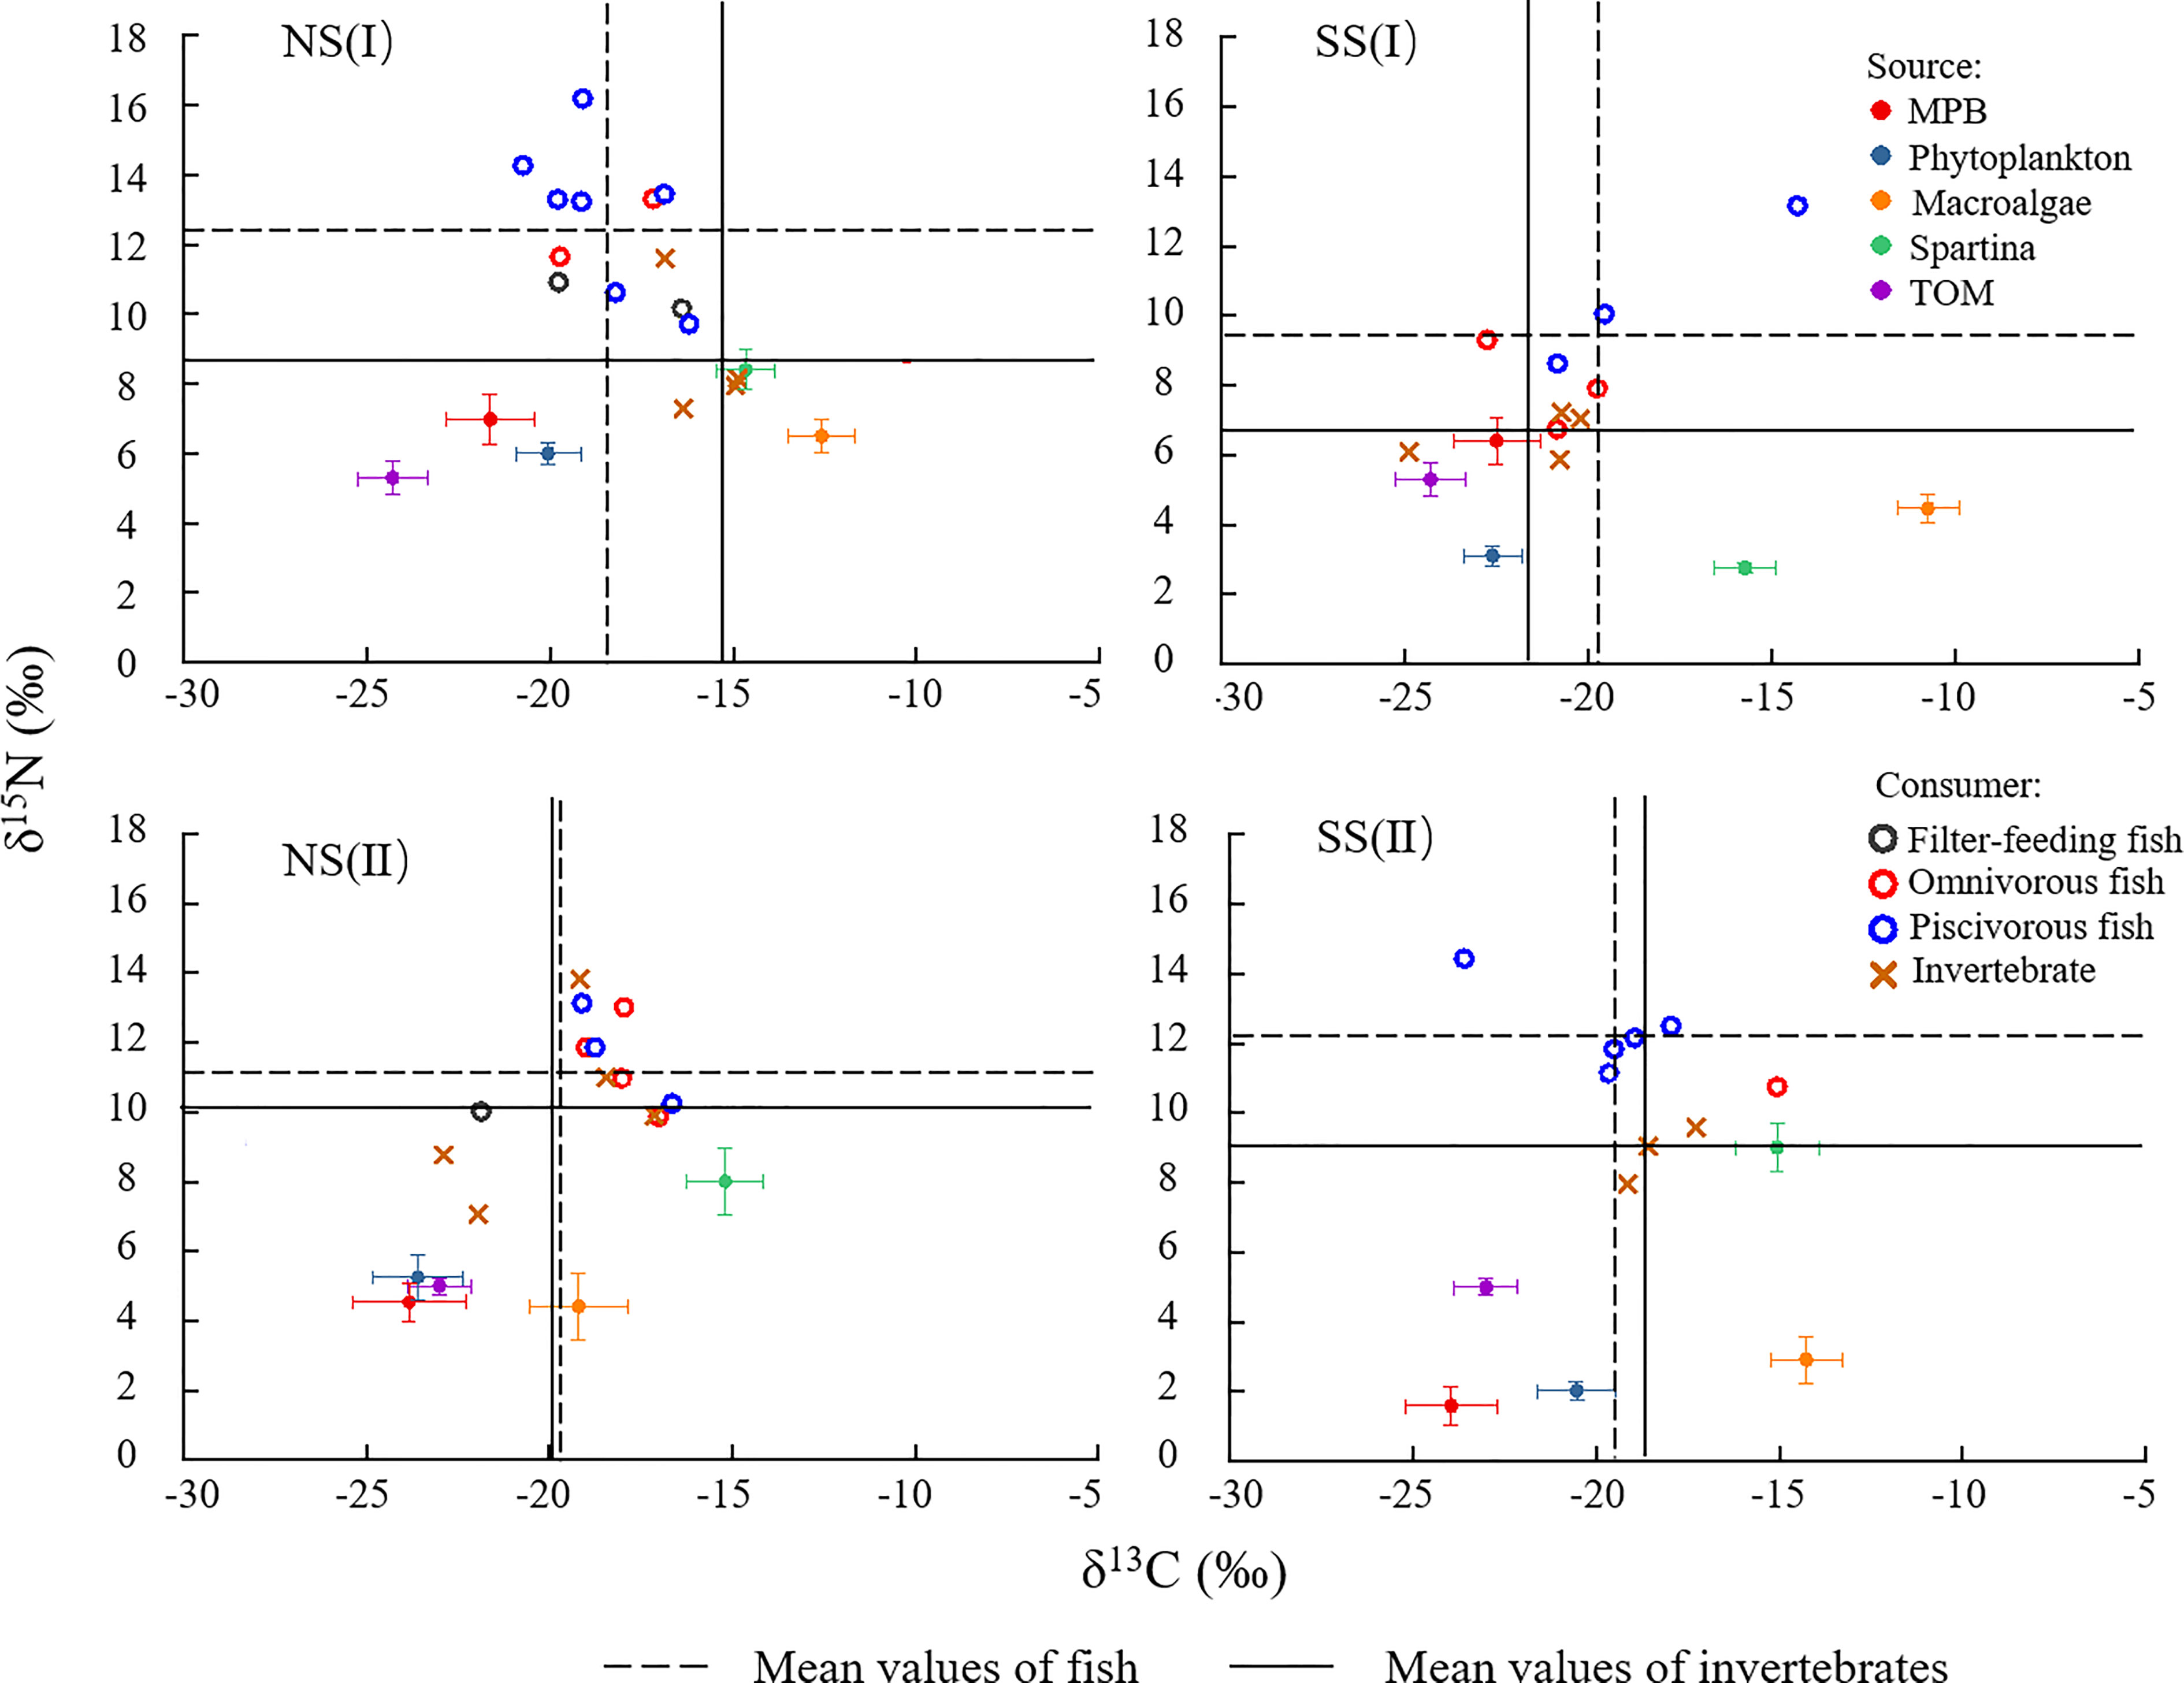
Figure 2 δ13C and δ15N stable isotope values of primary sources and consumers (MPB, microphytobenthos; TOM, terrestrial organic matter) in different regions and season. (I) Flood season (II) Non-flood season; (NS) Northern shore; (SS) Southern shore.
For the isotope ratios related to the trophic fractionation, δ15N of the basal food sources were generally low, among which S. alterniflora had relatively high values (2.76 to 9.01‰), while those of phytoplankton were the lowest (2.03 to 6.00‰). Among the major consumers, δ15N of fish were generally higher, and those of piscivorous fish (8.63 to 16.19‰) were the highest, followed by omnivorous fish (7.91 to 13.31‰). In non-flood season, the average δ15N of consumers on the southern shore was slightly higher than that on the northern shore (ANOVA, F = 0.036, p = 0.816, n = 22). In flood season, the δ15N of fish and invertebrate on the southern shore significantly decreased (ANOVA, F = 10.825, p = 0.003, n = 25), lower than those on the northern shore.
3.2 Food source contribution to major consumers
When calculating the contribution of the basal food source to the major consumers, fish were classified into three functional feeding groups, including filter-feeding, omnivorous and piscivorous group, and all the invertebrates were collected as one group. The fish were divided into three feeding groups: filter-feeding, omnivorous and piscivorous fish (Shan et al., 2013). The food habits of each consumer and the corresponding potential food sources are shown in Table A3 and the contributions of the different food sources are shown in Table A4. It not only showed differences between fish and invertebrates, but also varied in different regions and hydrological periods.
In flood season, the main food sources of major consumers varied widely in different regions. S. alterniflora (18.9% to 31.1%) and MPB (7.3% to 51.9%) were the important food source to most species on the northern shore, while TOM (19.1% to 63.3%) contributed more on the southern shore (Figures 3-6, Table A4). Food sources for filter-feeding and omnivorous fish showed obviously spatial variations (Figures 3, 4), while that for piscivorous fish had not shown significant differences between two shores (Figure 5). For fish, the contribution of TOM to filter-feeding, omnivorous and piscivorous fish decreased in turn, while MPB exhibited an opposite trend. For invertebrates, the contribution of macroalgae and TOM was higher than fish, while S. alterniflora contributed less as a food source (Figure 6).
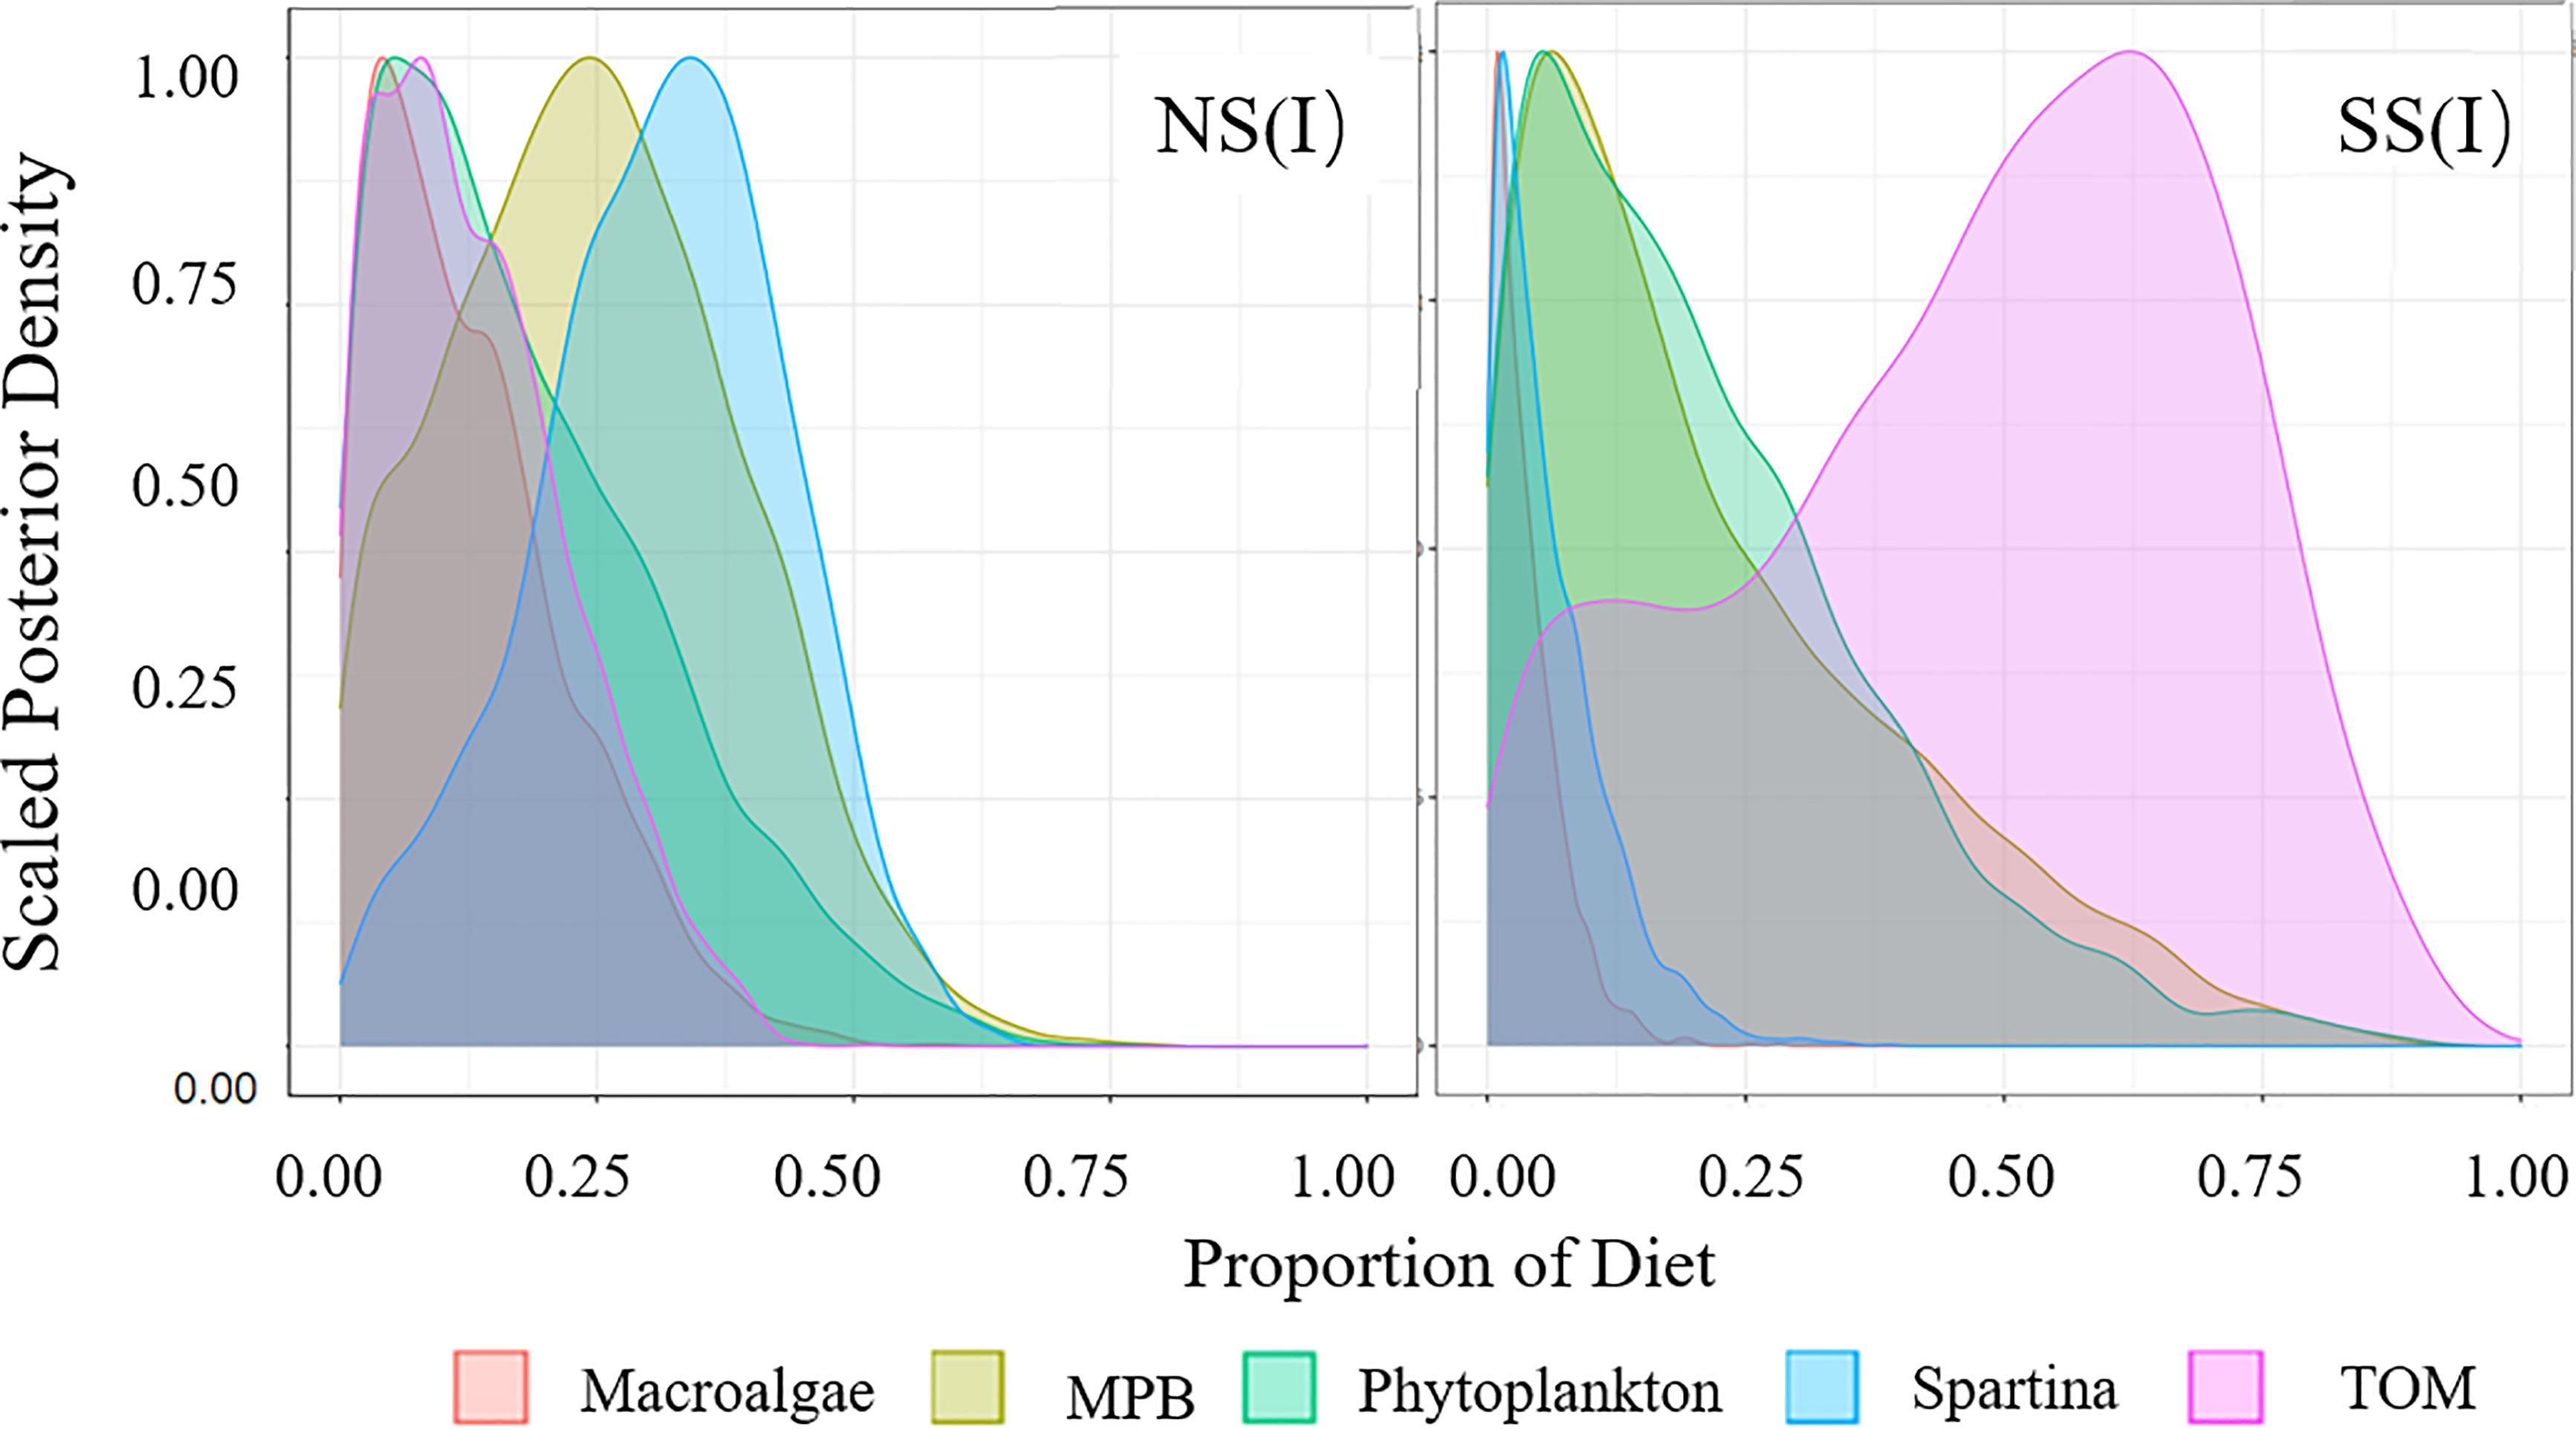
Figure 3 Diet proportion of filter-feeding fish. (I) Flood season; (II) Non-flood season; (NS) Northern shore; (SS) Southern shore.
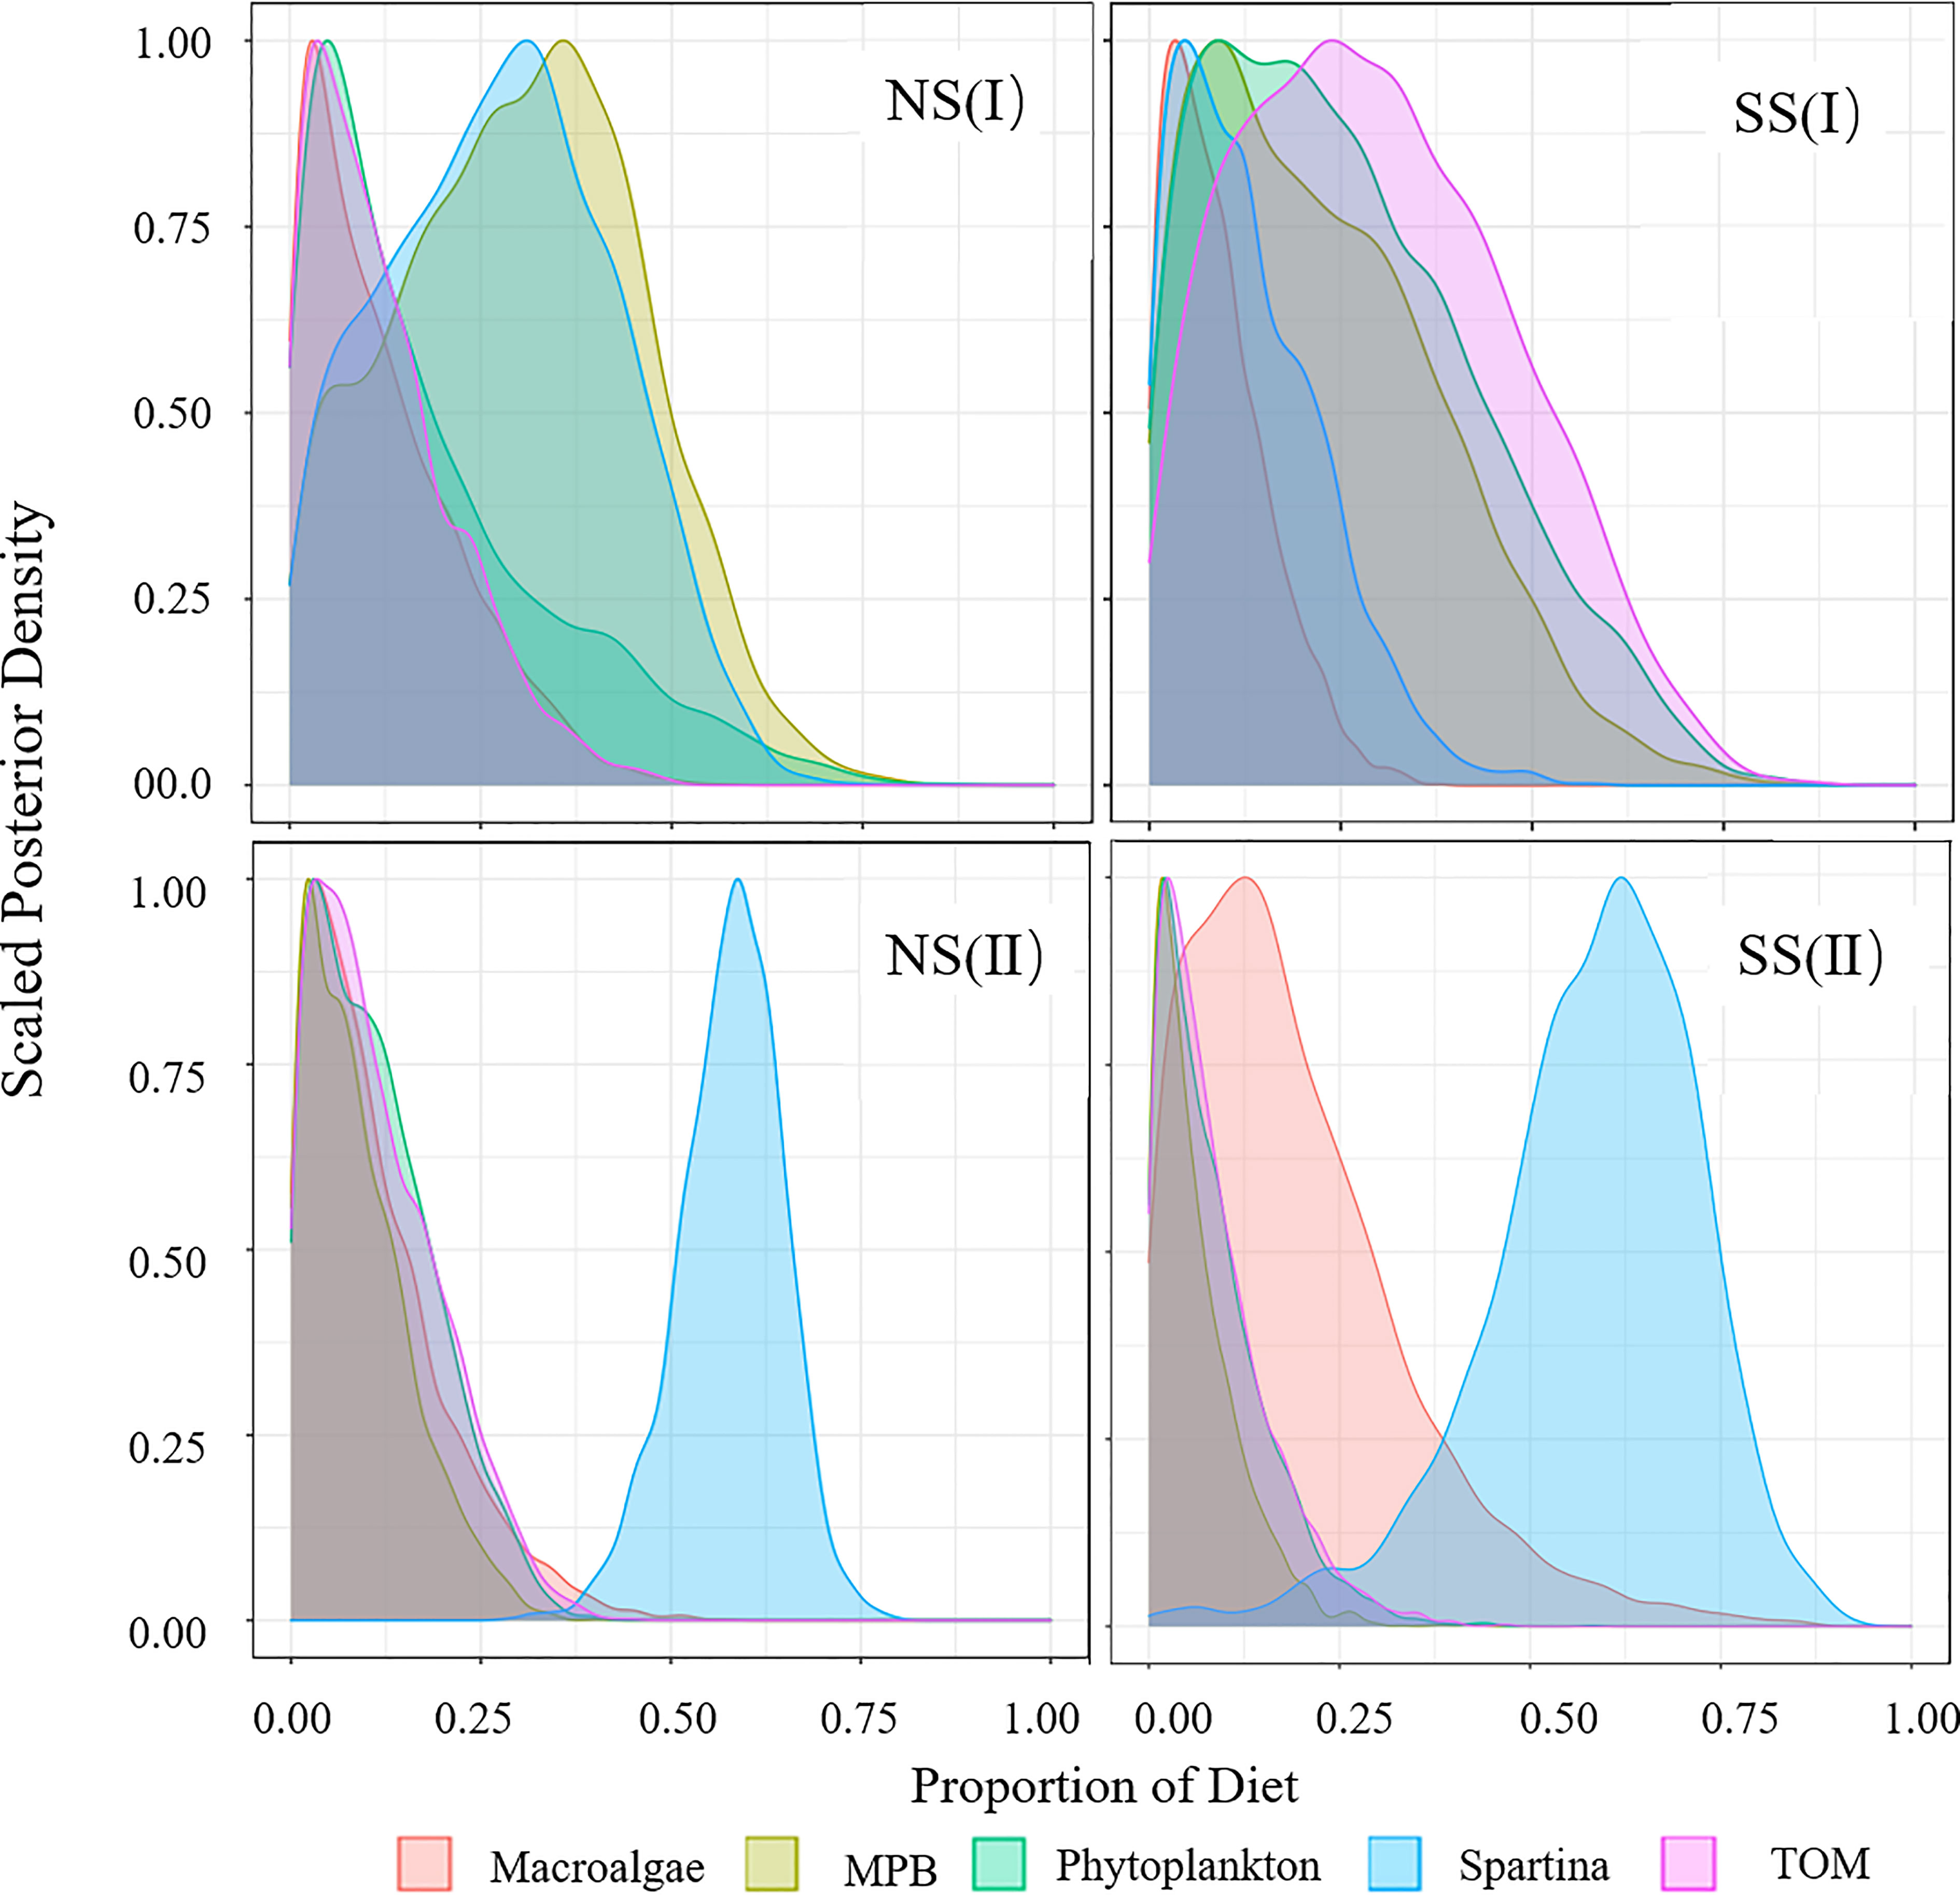
Figure 4 Diet Proportion of omnivorous fish. (I) Flood season; (II) Non-flood season; (NS) Northern shore; (SS) Southern shore.
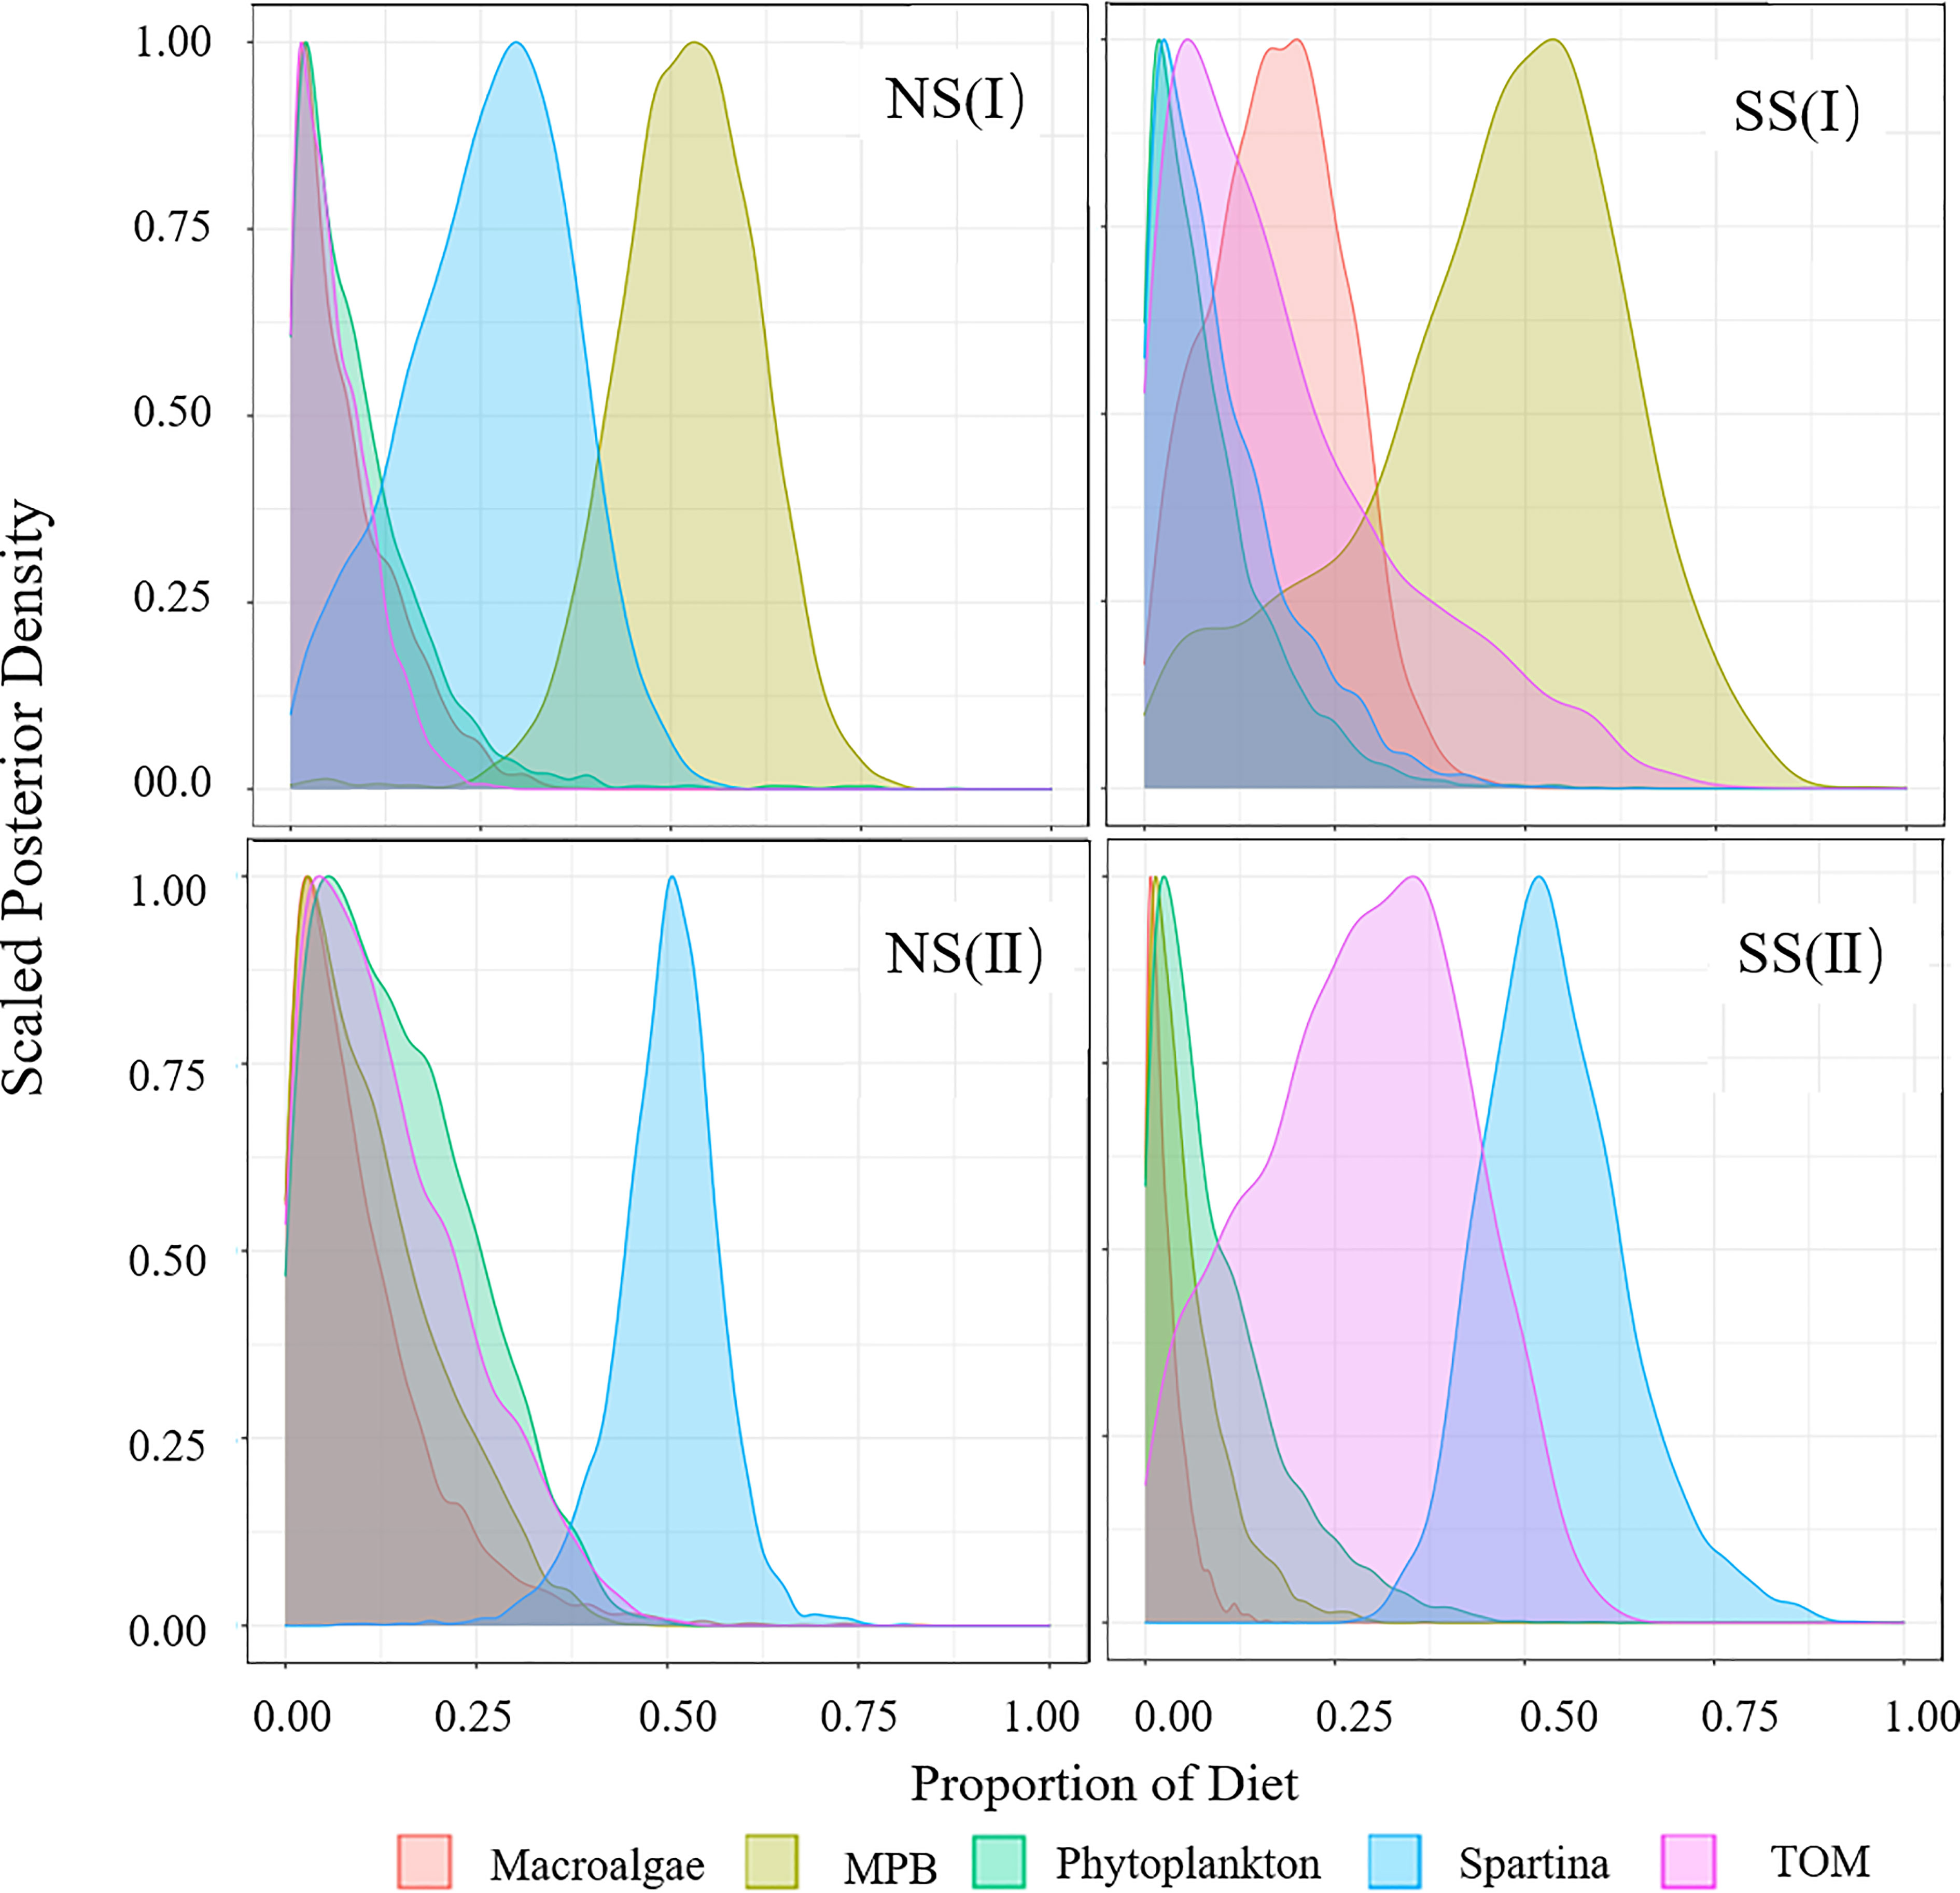
Figure 5 Diet Proportion of piscivorous fish. (I) Flood season; (II) Non-flood season; (NS) Northern shore; (SS) Southern shore.
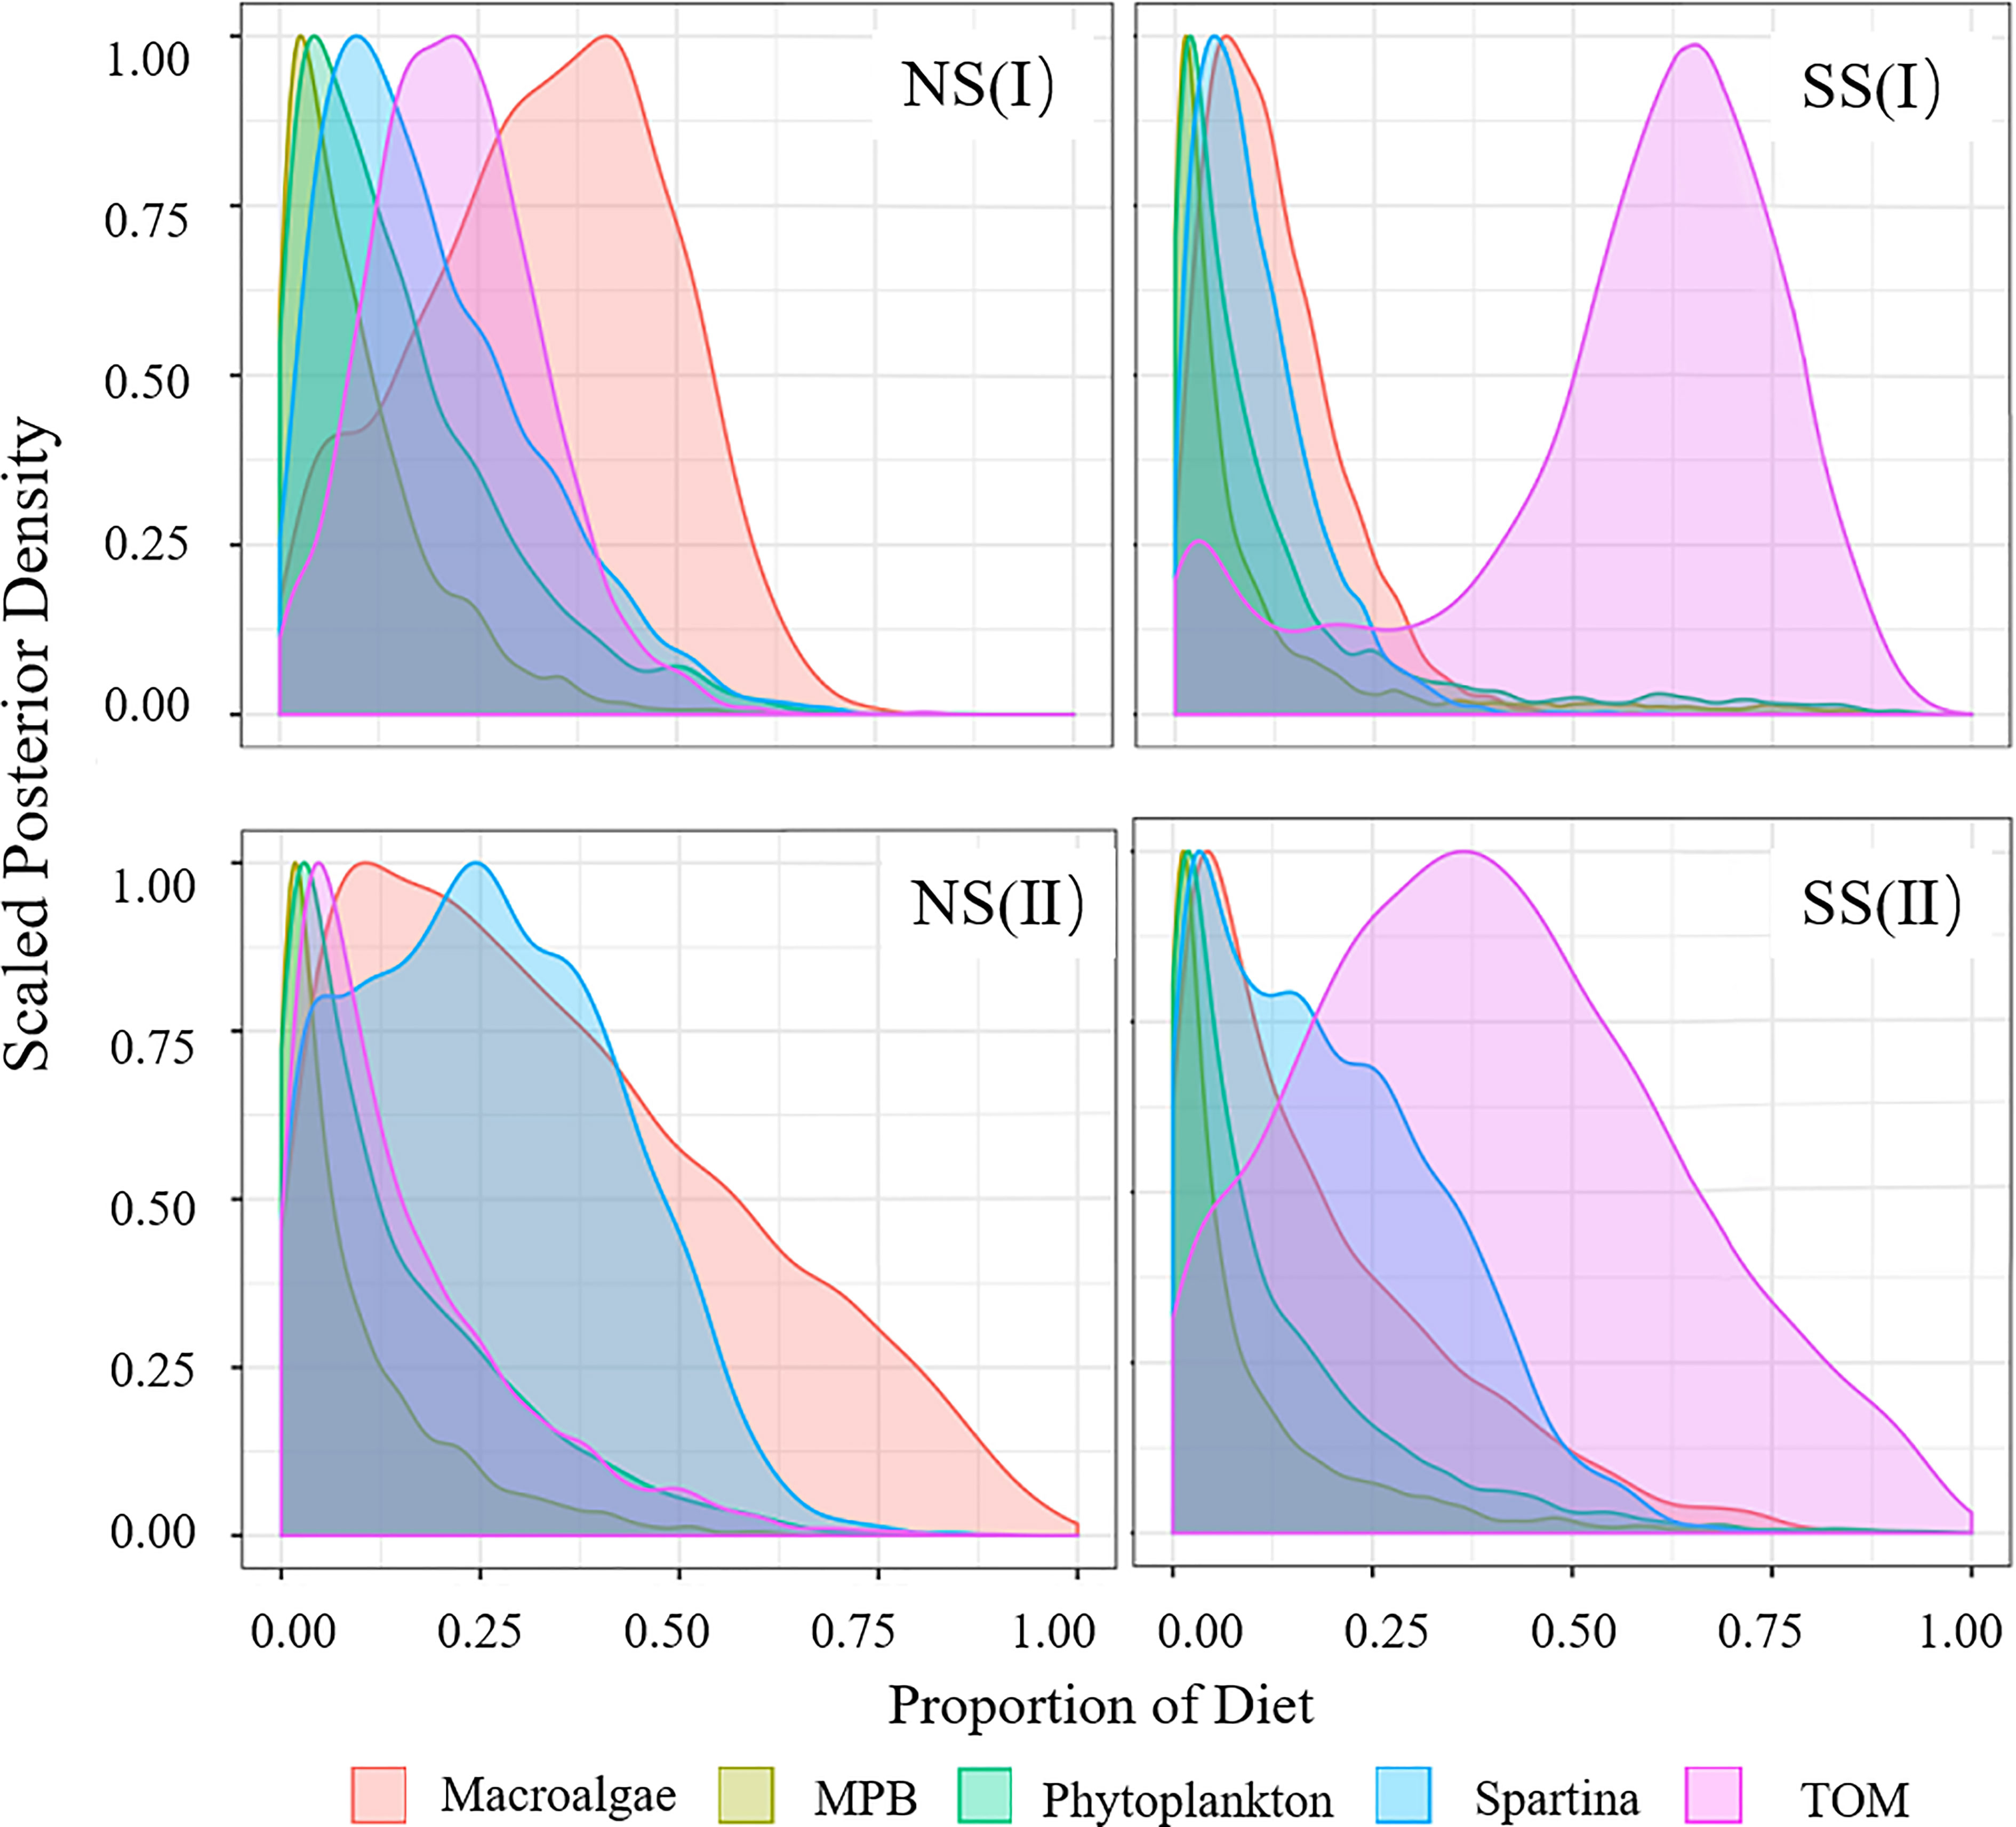
Figure 6 Diet Proportion of invertebrates. (I) Flood season; (II) Non-flood season; (NS) Northern shore; (SS) Southern shore.
In the non-flood season, fish were more dependent on S. alterniflora (20.7% to 58.0%) than flood season, while the assimilation of MPB (5.5% to 11.4%) were lower. The invertebrates were more dependent on the input of TOM (42.2%) on southern shore, while macroalgae (32.4%) and S. alterniflora (28.9%) were main food sources on the northern shore (Figure 6).
3.3 Trophic positions of dominant species
TPs of the dominant species varied in different hydrological periods and sampling areas (Table 1). The trophic levels of major consumers in the non-flood season were generally higher than that in the flood season (Table 1; Figure 7). Significant differences in the average TP of species between two shores appeared during the non-flood season (P< 0.05) (Table A5).
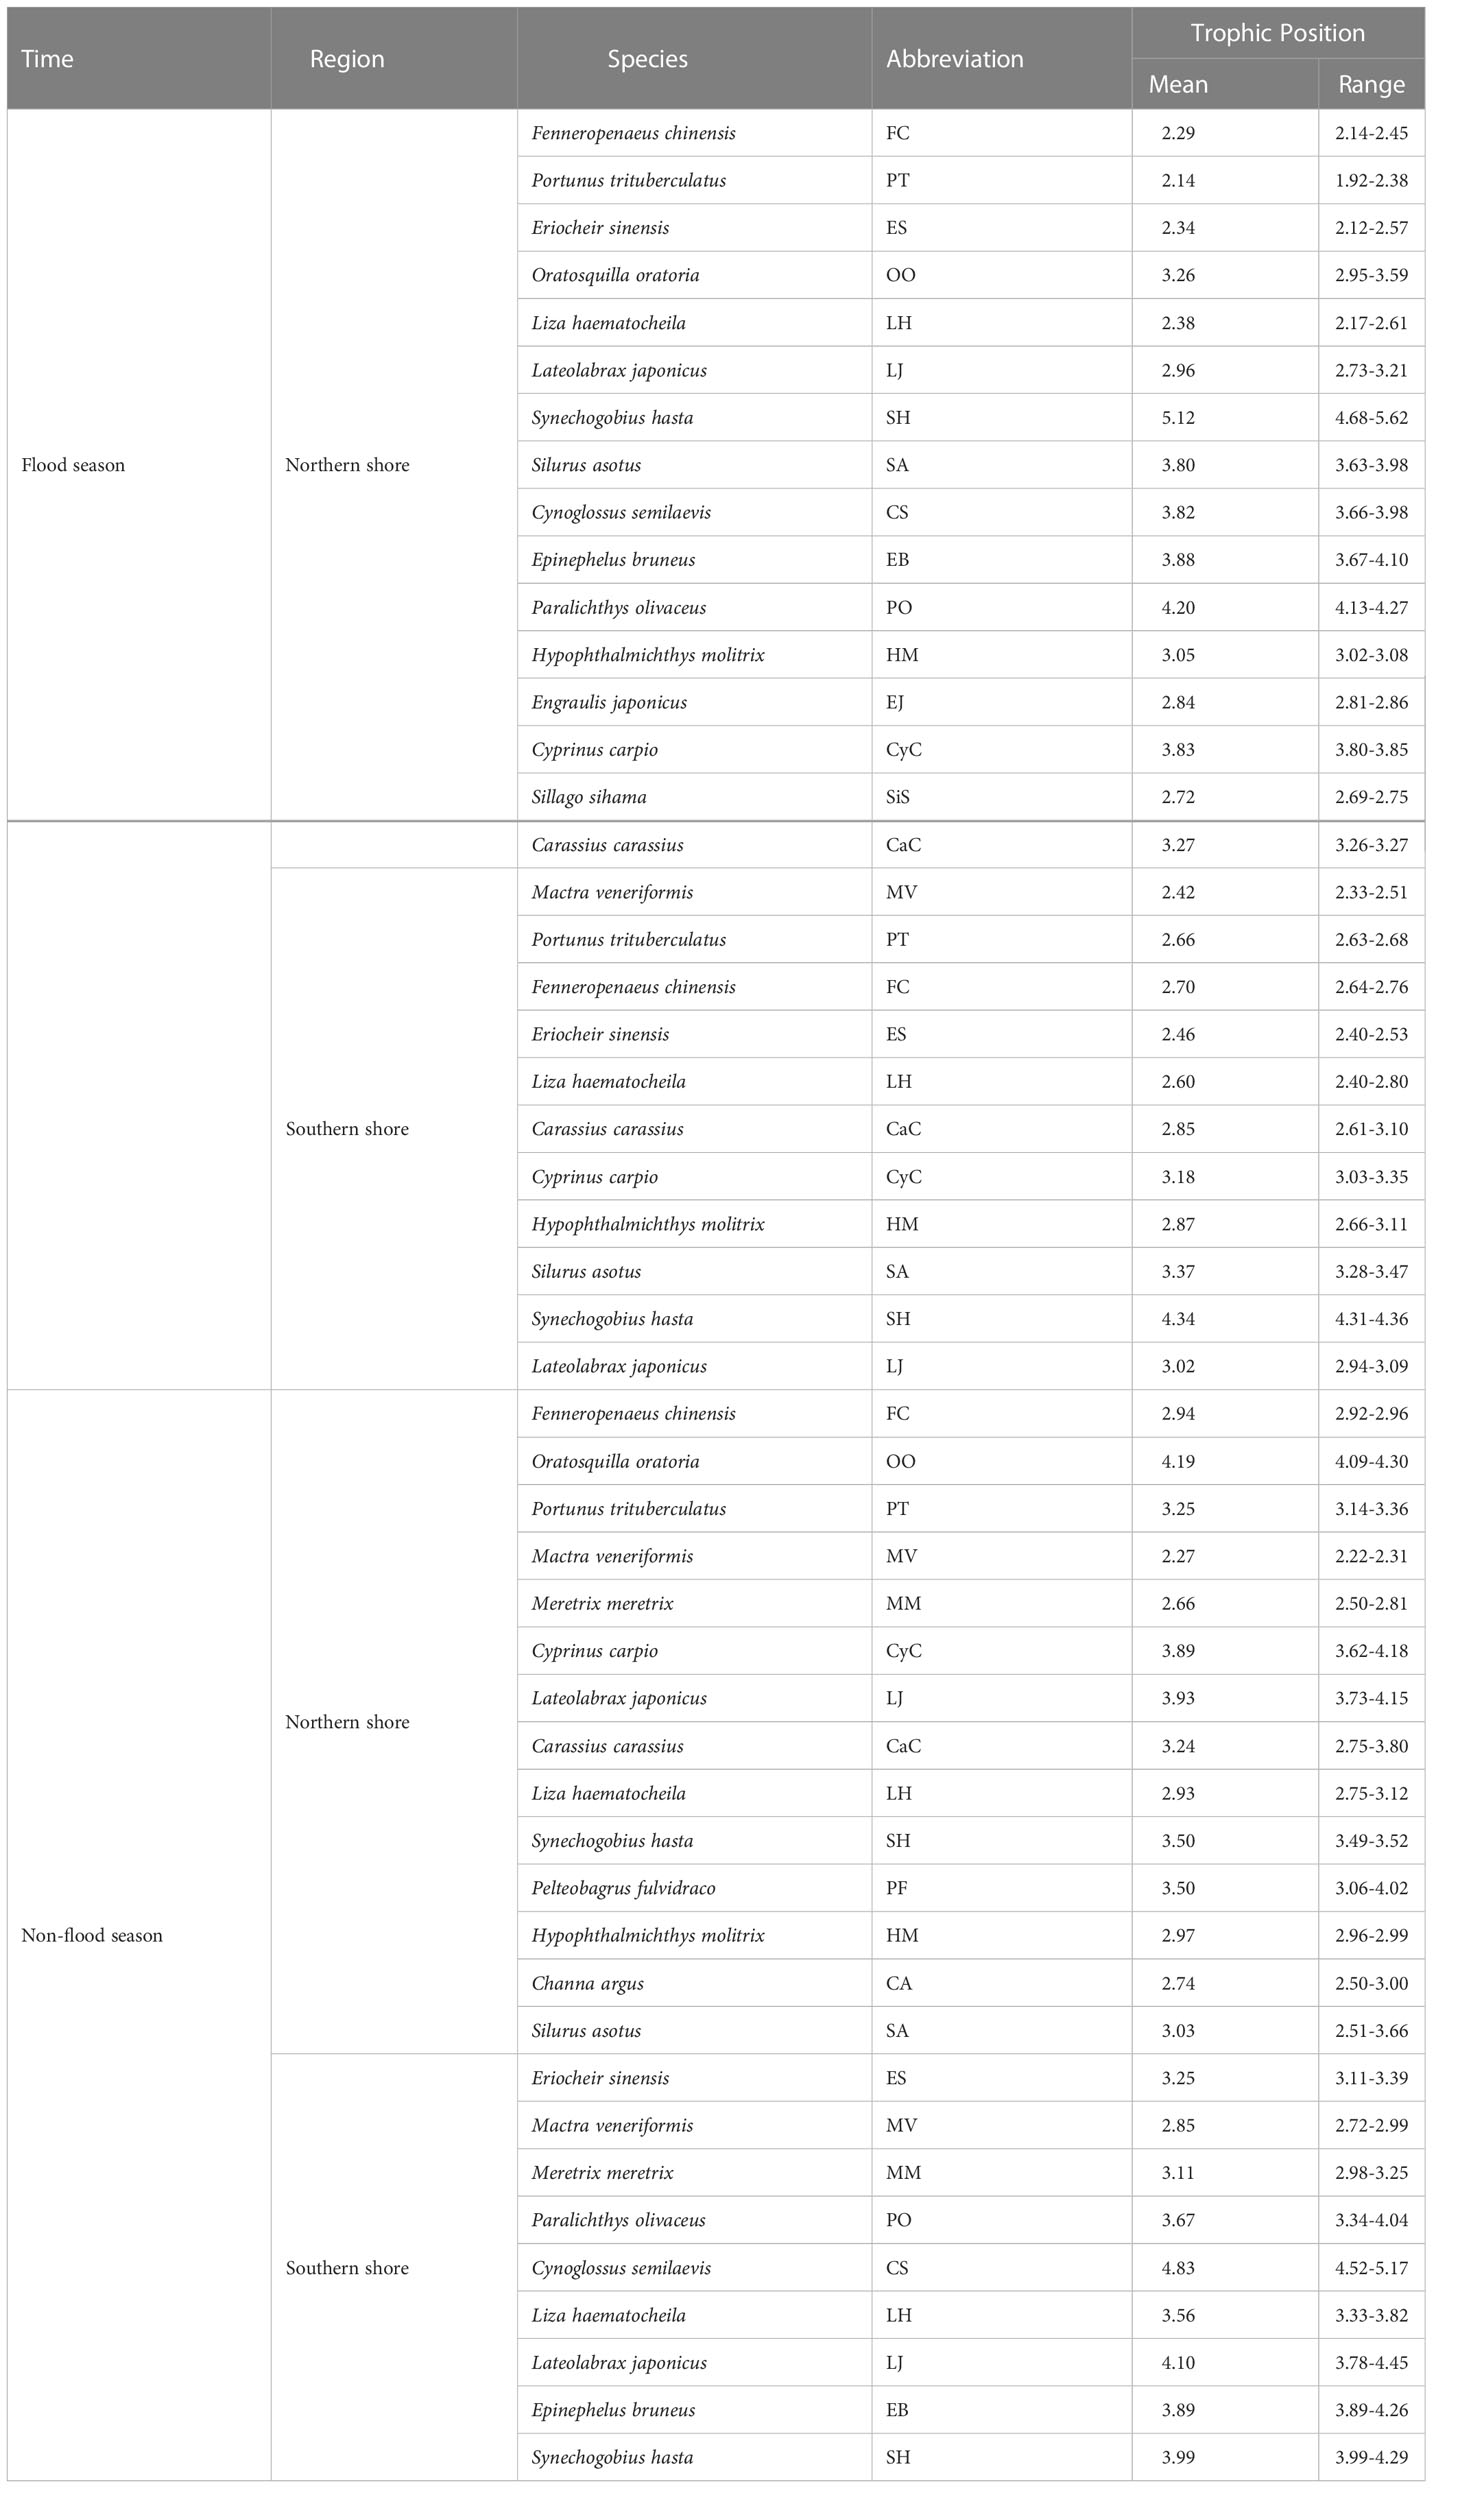
Table 1 Trophic positions of dominant species.
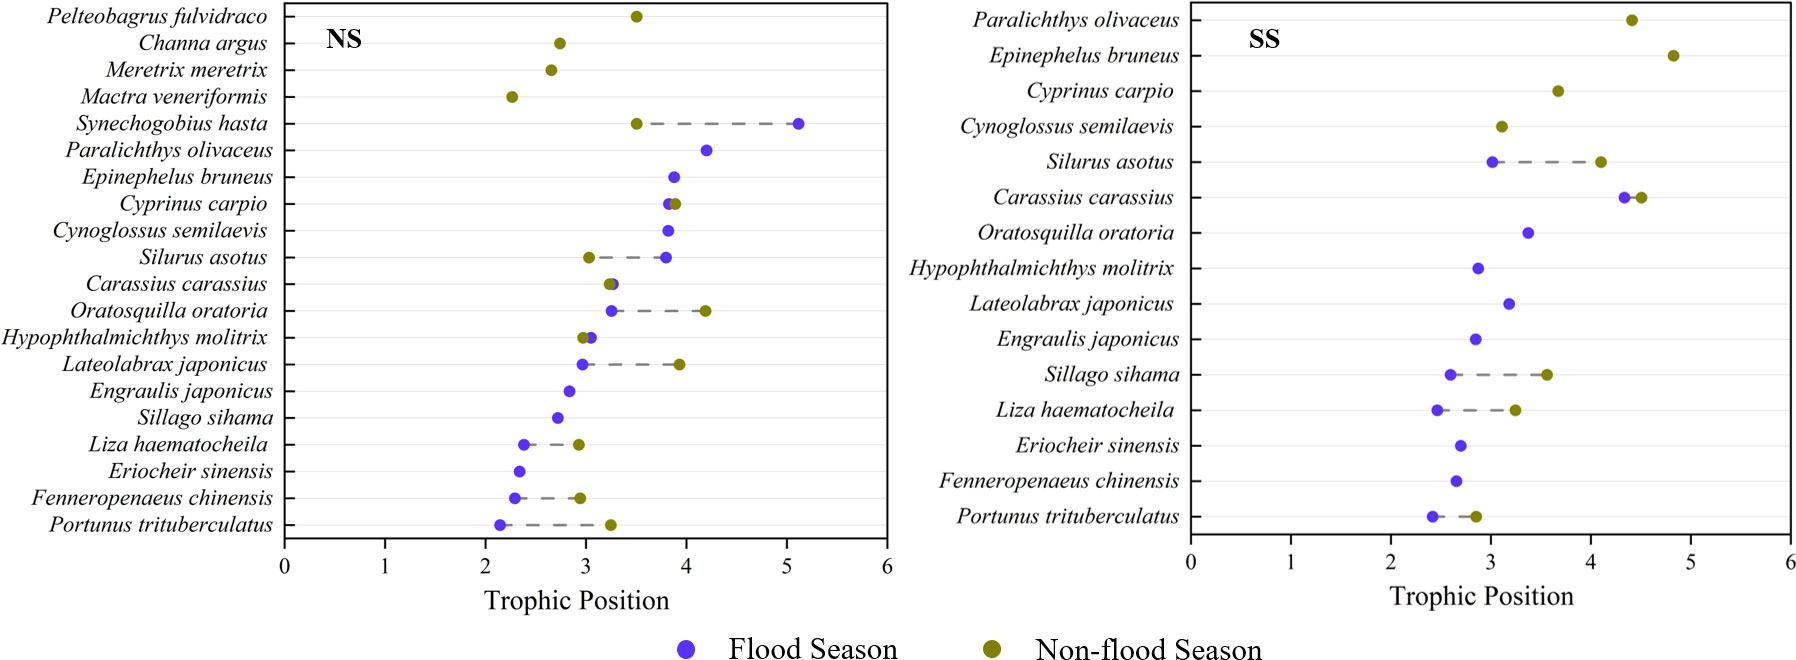
Figure 7 Comparison of trophic positions of fish species at different sampling sites during different hydrological season: (I) Flood season; (II) Non-flood season; (NS) Northern shore; (SS) Southern shore.
Spatial changes in trophic levels varied among fish and invertebrates. For invertebrates, their TPs on the southern shore (3.06 to 3.07) were generally higher than those on the northern shore (2.51 to 2.56) (Table 2). For fish, the trophic levels gradually increased from filter-feeding fish (2.87 to 2.97) to piscivorous fish (3.30 to 4.10) (Table 2). On the northern shore, the average TP of fish in non-flood season was lower than that of flood season (ΔTP = 0.18), especially for the piscivorous fish (ΔTP = 0.48). On the southern shore, all function groups in fish assembles showed obvious increase in trophic levels from flood season to non-flood season, especially for omnivorous fish (ΔTP = 0.69).
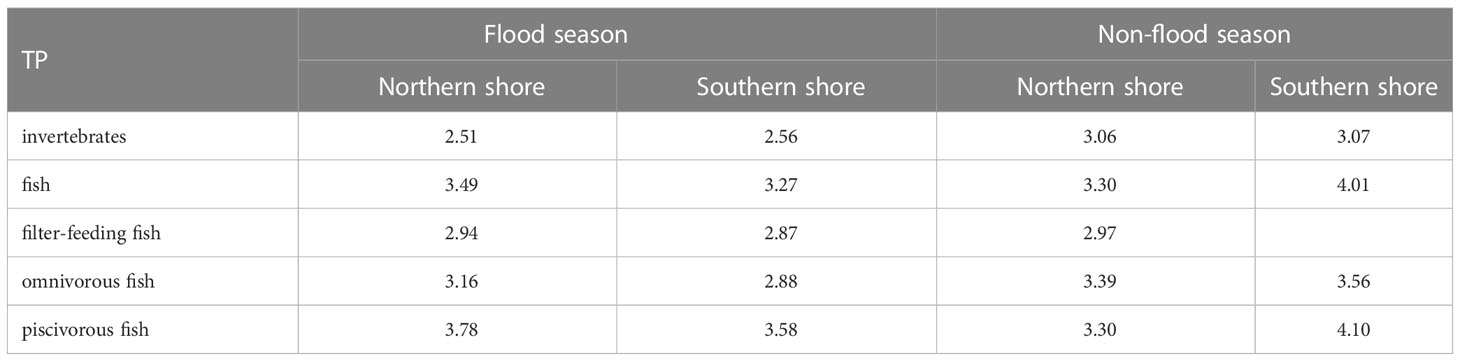
Table 2 Mean trophic positions of functional feeding groups.
3.4 Food web of different regions/periods
Based on the analysis results of potential food sources of each consumer, and the relative contributions of which in YRE, the structure of the food web energy flow in different hydrological periods and sampling areas were established. The values of the number of nodes (S), the links (L), the maximum links (Max. L), the link density (D), and the connectance (C) varied from 14 to 23, 16 to 35, 91 to 253, 1.14 to 1.59, and 0.14to 0.20, respectively. Expect for the C value, all of these topological indexes of food webs on the northern shore were higher than those on the southern shore, and they were higher in the flood season (Figures 8, 9; Table 3)
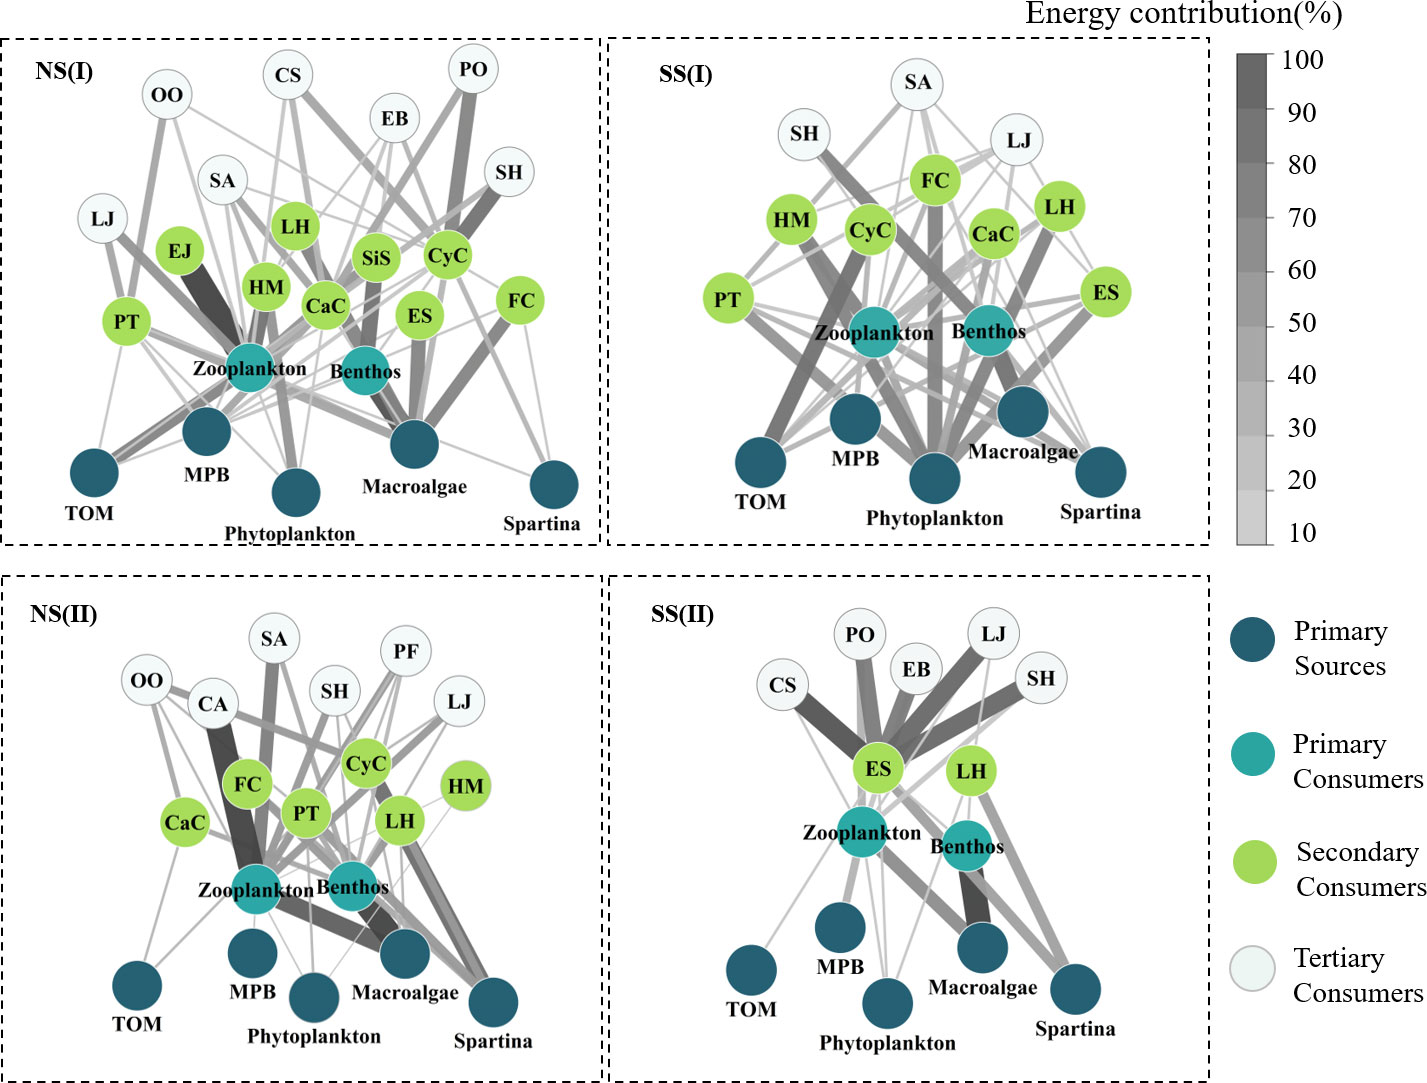
Figure 8 Energy flow of food webs for each sampling site during the flood and non-flood seasons. Arrow thickness represented the probability of the food source contributed to an upper consumer. (I)Flood season; (II)Non-flood season; (NS)Northern shore; (SS)Southern shore (abbreviation in Table 1).
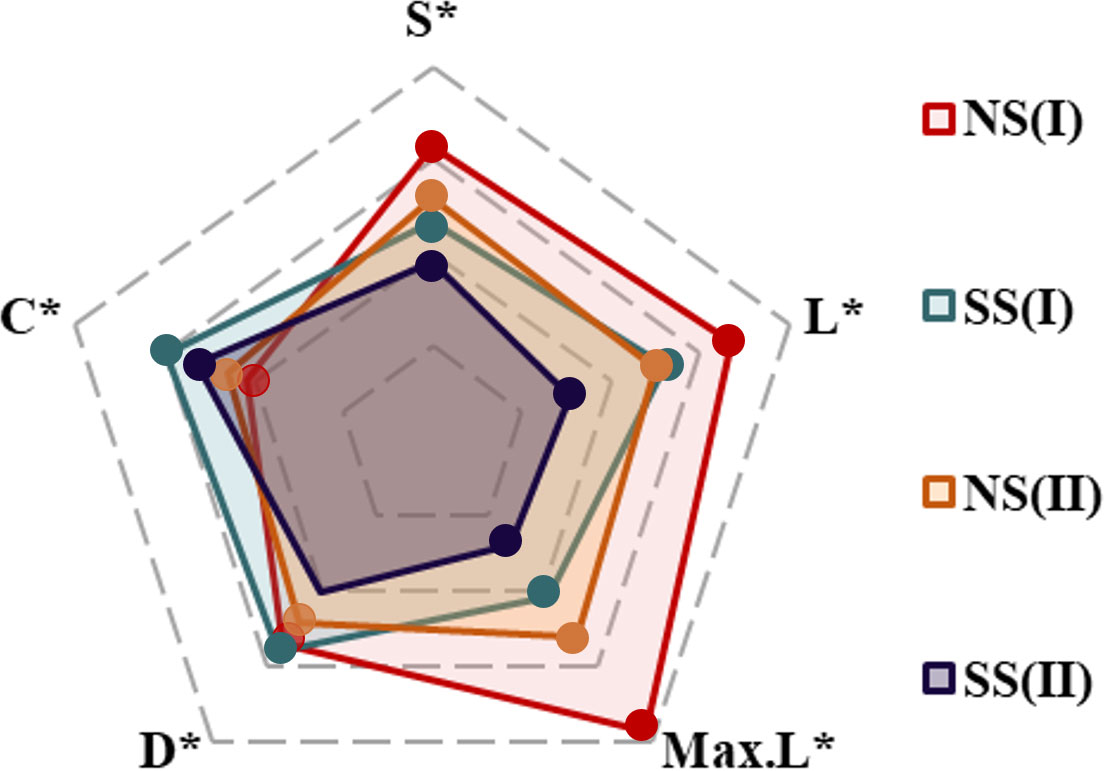
Figure 9 Five topological indexes of food webs in different regions/periods: (I)Flood season; (II)Non-flood season; (NS)Northern shore; (SS)Southern shore (S*, L*, Max.L*, D* and C* represented the vector normalization value of S, L, Max.L, D and C, respectively).
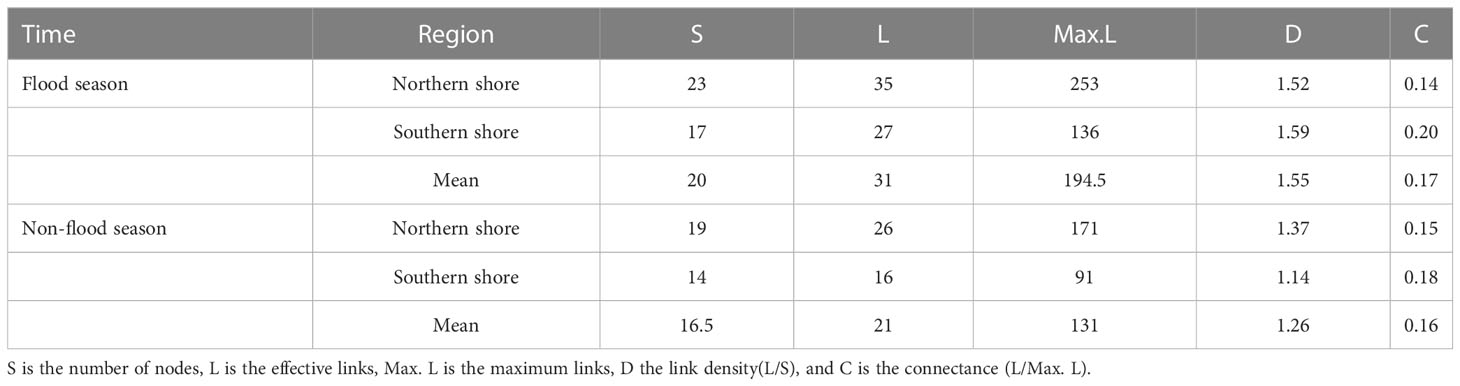
Table 3 Metrics of the food web structure of different sampling sites during different hydrological periods.
4 Discussion
4.1 Influence of upstream input on basal food sources in YRE
Yellow river estuary ecosystem, affected by both runoff and ocean tides, relied on the combination of terrestrial, intertidal and subtidal (autochthonous producers) basal food sources (Qu et al., 2019). Stable isotope ratios of carbon (δ13C) and nitrogen (δ15N), which indicated an increase from land to sea (Figure 2), not only provided information on the bionomic and scenopoetic axes of the ecological niche (Newsome et al., 2007), but also clarified the division of food sources (Cucherousset and Villéger, 2015). In this study, the spatio-temporal variations in the carbon stable isotope values of the food web components could be related to the changes in hydrological environment induced by the artificial flood peak. Consequently, the relative contributions of basal food sources to consumers varied along with time and space (Figures 3-6).
In non-flood season, consumers were more dependent on intertidal carbon sources than terrestrial and subtidal sources (Figures 3-6). S. alterniflora with C4 characteristics inhabited in a unique position of intertidal zone with higher flooding frequency than the other terrestrial vegetation with C3 characteristics located in the higher tide zone. For this reason, suspended debris from S. alterniflora was considered to be the main external food source in the intertidal zone, and other C3 vegetation became the terrestrial source imported from rivers (Yu et al., 2009; Cui et al., 2011). Compared with autochthonous producers (such as MPB and phytoplankton), S. alterniflora with a long growth cycle and high reproductive capacity, have strong competitive ability and relatively easily become a more stable food source (Meng et al., 2020). Moreover, S. alterniflora contributed more to the diet of fishes than invertebrates. It might provide the fish better feeding opportunities and greater shelter for predation (Feng et al., 2015).
In flood season, the dominant basal food source shifted from S. alterniflora to autochthonous production sources and terrestrial organic matter carried with runoff from upstream. Autochthonous producers contributed more to consumers in response to greater nutrient inputs during high-flow pulse. High nutrients concentration (especially silicate) and low salinity provided viable habitat to microphytobenthos, promoting autochthonous productivity (Park et al., 2014). As a marine primary producer, MPB, rather than phytoplankton and macroalgae, had become the main autochthonous basal food source fueling the food web, contributing 10 ~ 40% more than the non-flood season (Table A4), which was consistent with previous research (Qu et al., 2019). That would be because that phytoplankton was very sensitive to environmental change, such as changes in turbidity, heavy metals, water temperature, and salinity (Zhou et al., 2008; Liu et al., 2012). In contrast, MPB hardly affected by light limitation and had higher productivity in high turbidity environment (Montani et al., 2003). By forming stable biofilms on the surface of macroalgae and sediment, MPB served as a more stable food source for estuary consumers (Middelburg et al., 2000; Hart and Lovvorn, 2003). Due to the increased turbid water outflow into the estuary, the higher incorporation of terrestrial-derived materials occurred. Consequently, the contribution of TOM improved significantly during the high-flow episode (Figures 3, 4 and 6; Table A4), which was inconsistent with the observation in the low turbidity estuary (Kundu et al., 2021). The contribution of TOM to invertebrate, filter-feeding, omnivorous and piscivorous fish decreased in turn, indicating that low-trophic-level consumers more tended to assimilate the allochthonous food (Figures 3-6). Terrestrial-derived materials were insufficient to percolate through the top level of food web in a short period (Garcia et al., 2019), and piscivorous fish might indirectly assimilated TOM by preying on secondary consumers.
In addition, the rapid increase in discharge and suspended sediment concentration exacerbated the spatial differences in the basal food sources supporting the food webs. TOM dominated the basal food sources to the consumers on the southern shore (Figures 3, 4 and 6), while MPB had considerable contribution to food web on the northern shore (Figures 3-5). Most of the suspended sediment diffused to southward associated with intensive mixing by river and currents, providing sufficient terrestrial food source to the southern shore, while only a small part of sediment expanded to the northern shore (Wang et al., 2014). However, the northern shore was mainly affected by dilute water with large amounts of nutrients diffusing in the northwest direction, inducing high primary production in subtidal zone.
4.2 Consumers trophic levels response to food sources variation
The shift in diet of consumers would induce the changes in trophic levels, ultimately affecting the trophic structure of food web. In flood season, seasonal pulse of autochthonous primary production and large amount of terrestrial-derived material transported by river greatly enriched the abundance and diversity of basal food sources in estuary. At the same time, environmental disturbances including surged flow and concentrated sediment, fish would not overeat and exterminate intermediate predators (Power et al., 1995; McHugh et al., 2010). (Table 2 and Figure 7). These factors accounted for the decline in the average trophic level of major consumers in the flood season.
In addition, the input of flow with high sediment would have impacts on feeding behaviors of consumers, aggravating the spatial variations in food web structure. Large amounts of sediment were transported to the southern shore for a short period of time, inducing the gap of turbidity between the two shores expanding to more than 50NTU (Table A1). The turbid water environment on the southern shore would severely limit the predation efficiency of the visual-hunting fish, whereas invertebrates that forage primarily through chemoreception were relatively less affected (Lunt and Smee, 2020; Szczepanek et al., 2021). Fish reduced their foraging on nekton species with high escape probability, relying more on plankton with slow-moving speed and terrestrial-derived detritus (Hecht and van der Lingen, 2015). Therefore, in flood season, the trophic positions of fish were much lower on southern shore, while that of invertebrate showed an opposite trend (Table 2).
The comparison of the trophic positions of the same species among different periods and regions indicated that TPs of some fish did not show significant change or changes to the trend (Table A5, Figure 7), indicating other energy pathways in the food web. The slight fluctuation of TPs, related to the changes in flow regimes and environmental conditions, had changed the feeding composition of fish to a certain extent, but did not cause extremely significant changes in the types of food consumed by the fish. These trends indicated that the food webs of stable ecosystems have complex structures and diverse food sources, and thus the trophic level does not easily produce large fluctuations.
4.3 Response of food web energy flow structure to environmental conditions
Individual species TP and overall food web structure provided powerful means for understanding effects of environmental disturbance to ecosystem. Based on the relative contribution rate of prey-predation relationship, the energy flow structure of the food web was constructed. Topological indicators of food webs varied with the changes in regional environmental characteristics and hydrological period, since the changes in dietary structure and trophic levels of consumers (Figure 9). Among five topological indices, the value of S and Max. L were relatively higher in the northern shore food web, while value of C performed differently. It indicated that the structure of food web on the northern shore was highly complex (Table 3). The complexity of the food web was positively related to the availability of food sources (Liew et al., 2018), implying that diet of consumers on the northern shore was more selective. Furthermore, the human activities and fishing had less impact on the northern shore than the southern shore, leading the former had higher species diversity (Liu et al., 2020). Corresponded with previous studies, robustness was linked strongly with connectance, which indicated negative relationship with species diversity in topological food webs (Yen et al., 2016). Therefore, the food web structure on the southern shore was more robust (Table 3). The upstream hydrological regulation contributed to the high input of TOM on the southern shore (Xu et al., 2013), increasing of links density among species. Despite of the low species abundance, the connectivity of food web was relatively higher. In the flood season, the spatial variations of topological food webs were exacerbated by the inflow and diffusion of freshwater and sediment. On the northern shore, the number of nodes(S), effective links(L) and links per unit of species abundance (D) were higher than that in non-flood season (Table 3, Figure 9). Affected by diluted water spreading and artificial freshwater fish enhancement and releasing, nekton communities had tendency of accumulations in estuary, increasing the diversity of fish species (Sun et al., 2014). At the same time, the number of energy pathways among species increased, and the contribution of various food sources tended to be homogenized, which made the structure of food web more complex. High interspecific competition intensity in the system with high species richness would lead to the decrease of species density and hence the system robustness (Kaneryd et al., 2012). Thus, food web on the southern shore with high connectance might be more robust, despite of the relatively lower species richness. Furthermore, shorter food chains and higher proportion of omnivorous species would also enhance the robustness of food web (Yen et al., 2016).
This finding further implied that hydrological regulation changed the flow regime and water turbidity conditions, leading to the changes in food source contribution and trophic levels of major species. This series of variations ultimately affected the energy flow and the structure of the entire food web (Power et al., 1995; Cross et al., 2013; Ru et al., 2019). Further studies will carry out fatty acid biomarkers analysis, which will provide detailed tracking of carbon substrates in food webs not available to stable isotopes. Biomass and production of organisms have not been taken into account in this study, which can also enhance the further understanding of spatio-temporal variations of dynamic trophic structure.
5 Conclusion
The influence of runoff on the estuarine ecosystem was quantified via stable isotope analysis and energy flow of the aquatic food web. The trophic structure and energy flow processes of the aquatic food web of a typical weak tide estuary, the Yellow River Estuary (YRE), was identified. The main causes effecting the food web of the YRE were analyzed. Different flow regime led to the spatio-temporal variations of the stable isotopic characteristics of aquatic life. The southern shore was highly affected by the high-flow events, resulting in a decrease in the stable isotope values of organisms. And the spatial variation of topological food webs was exacerbated by the inflow and diffusion of freshwater and sediment during the flood season. Due to the high turbid environment on the southern shore, fish reduced their foraging on nekton species with high escape probability relying more on TOM, leading to lower trophic levels. The higher contribution of TOM to consumers increased the link density of food web on the southern shore, making it a more robust system. The high diversity of food sources and aquatic species made the food web more complex on the northern shore.
Data availability statement
The original contributions presented in the study are included in the article/Supplementary Material. Further inquiries can be directed to the corresponding author.
Author contributions
QL and JS conducted the sampling work. QL and FZ analysed the samples and data. YY, FZ, QL and JS wrote the manuscript. All authors contributed to the article and approved the submitted version.
Funding
This study was supported by the National Natural Science Foundation of China (52025092, U2243236), and the National Key Research and Development Program of China (2022YFC3202002).
Conflict of interest
The authors declare that the research was conducted in the absence of any commercial or financial relationships that could be construed as a potential conflict of interest.
Publisher’s note
All claims expressed in this article are solely those of the authors and do not necessarily represent those of their affiliated organizations, or those of the publisher, the editors and the reviewers. Any product that may be evaluated in this article, or claim that may be made by its manufacturer, is not guaranteed or endorsed by the publisher.
Supplementary material
The Supplementary Material for this article can be found online at: https://www.frontiersin.org/articles/10.3389/fmars.2023.1103502/full#supplementary-material
References
Abrantes K. G., Barnett A., Bouillon S. (2014). Stable isotope-based community metrics as a tool to identify patterns in food web structure in east a frican estuaries. Funct. Ecol. 28 (1), 270–282. doi: 10.1111/1365-2435.12155
Abrantes K. G., Barnett A., Marwick T. R., Bouillon S. (2013). Importance of terrestrial subsidies for estuarine food webs in contrasting East African catchments. Ecosphere 4 (1), 1–33. doi: 10.1890/ES12-00322.1
Abrantes K. G., Sheaves M. (2010). Importance of freshwater flow in terrestrial–aquatic energetic connectivity in intermittently connected estuaries of tropical Australia. Mar. Biol. 157 (9), 2071–2086. doi: 10.1007/s00227-010-1475-8
Arcagni M., Rizzo A., Campbell L. M., Arribére M. A., Juncos R., Reissig M., et al. (2015). Stable isotope analysis of trophic structure, energy flow and spatial variability in a large ultraoligotrophic lake in Northwest Patagonia. J. Great Lakes Res. 41 (3), 916–925. doi: 10.1016/j.jglr.2015.05.008
Blanchette M. L., Davis A. M., Jardine T. D., Pearson R. G. (2014). Omnivory and opportunism characterize food webs in a large dry-tropics river system. Freshw. Sci. 33 (1), 142–158. doi: 10.1086/674632
Bligh E. G., Dyer W. J. (1959). A rapid method of total lipid extraction and purification. Can. J. Biochem. Phys. 37, 911–917. doi: 10.1139/059-099
Cross W. F., Baxter C. V., Rosi-Marshall E. J., Hall R. O. Jr., Kennedy T. A., Donner K. C., et al. (2013). Food-web dynamics in a large river discontinuum. Ecol. Monogr. 83 (3), 311–337. doi: 10.1890/12-1727.1
Cucherousset J., Villéger S. (2015). Quantifying the multiple facets of isotopic diversity: new metrics for stable isotope ecology. Ecol. Indic. 56, 152–160. doi: 10.1016/j.ecolind.2015.03.032
Cui B. S., He Q., An Y. (2011). Spartina alterniflora invasions and effects on crab communities in a western pacific estuary. Ecol. Eng. 37 (11), 1920–1924. doi: 10.1016/j.ecoleng.2011.06.021
Feng J., Huang Q., Qi F., Guo J., Lin G. (2015). Utilization of exotic spartina alterniflora by fish community in the mangrove ecosystem of zhangjiang estuary: evidence from stable isotope analyses. Biol. Invasions 17 (7), 2113–2121. doi: 10.1007/s10530-015-0864-9
Garcia A. M., Oliveira M. C. L. M., Odebrecht C., Colling J. L. A., Vieira J. P., Rodrigues F. L., et al. (2019). Allochthonous versus autochthonous organic matter sustaining macroconsumers in a subtropical sandy beach revealed by stable isotopes. Mar. Biol. Res. 15 (3), 241–258. doi: 10.1080/17451000.2019.1627559
Garcia A. M., Winemiller K., Hoeinghaus D., Claudino M., Bastos R., Correa F., et al. (2017). Hydrologic pulsing promotes spatial connectivity and food web subsidies in a subtropical coastal ecosystem. Mar. Ecol. Prog. Ser. 567, 17–28. doi: 10.3354/meps12060
Hart E. A., Lovvorn J. R. (2003). Algal vs. macrophyte inputs to food webs of inland saline wetlands. Ecology 84 (12), 3317–3326. doi: 10.1890/02-0629
Hecht T., van der Lingen C. D. (2015). Turbidity-induced changes in feeding strategies of fish in estuaries. South Afr. J. Zool. 27 (3), 95–107.
Hladyz S., Nielsen D. L., Suter P. J., Krull E. S. (2012). Temporal variations in organic carbon utilization by consumers in a lowland river. River Res. Appl. 28 (5), 513–528. doi: 10.1002/rra.1467
Hou C., Song J., Yan J., Wang K., Li C., Yi Y. (2020). Growth indicator response of zostera japonica under different salinity and turbidity stresses in the yellow river estuary, China. Mar. Geol. 424, 106169. doi: 10.1016/j.margeo.2020.106169
Hui T. Y., Williams G. A. (2020). Spatio-temporal variation of sediment properties reveals missing trophic links for deposit-feeding crabs in sandy shore food webs. Mar. Ecol. Prog. Ser. 654, 79–92. doi: 10.3354/meps13497
Hussey N. E., MacNeil M. A., McMeans B. C., Olin J. A., Dudley S. F., Cliff G., et al. (2014). Rescaling the trophic structure of marine food webs. Ecol. Lett. 17 (2), 239–250. doi: 10.1111/ele.12226
Jennings S., van der Molen J. (2015). Trophic levels of marine consumers from nitrogen stable isotope analysis: estimation and uncertainty. ICES J. Mar. Sci. 72 (8), 2289–2300. doi: 10.1093/icesjms/fsv120
Jiang D., Fu X., Wang K. (2013). Vegetation dynamics and their response to freshwater inflow and climate variables in the yellow river delta, China. Quaternary Int. 304, 75–84. doi: 10.1016/j.quaint.2012.10.059
Kaneryd L., Borrvall C., Berg S., Curtsdotter A., Eklof A., Hauzy C., et al. (2012). Species-rich ecosystems are vulnerable to cascading extinctions in an increasingly variable world. Ecol. Evol. 2 (4), 858–874. doi: 10.1002/ece3.218
Kiljunen M., Peltonen H., Lehtiniemi M., Uusitalo L., Sinisalo T., Norkko J., et al. (2020). Benthic-pelagic coupling and trophic relationships in northern Baltic Sea food webs. Limnol Oceanogr 65 (8), 1706–1722.
Kundu G. K., Kim C., Kim D., Bibi R., Kim H., Kang C. (2021). Phytoplankton fuel fish food webs in a low-turbidity temperate coastal embayment: A stable isotope approach. Front. Mar. Sci. 8, 751551. doi: 10.3389/fmars.2021.751551
Layman C. A., Araujo M. S., Boucek R., Hammerschlag-Peyer C. M., Harrison E., Jud Z. R., et al. (2012). Applying stable isotopes to examine food-web structure: an overview of analytical tools. Biol. Rev. 87 (3), 545–562. doi: 10.1111/j.1469-185X.2011.00208.x
Liew J. H., Jardine T. D., Lim R. B. H., Kwik J. T. B., Tan H. H., Kho Z. Y. (2018). Bottom-up influences on tropical freshwater food web structure support the “environmental filtering” hypothesis. Limnol. Oceanogr. 63 (5), 1877–1890. doi: 10.1002/lno.10813
Liu X., Wang H. (2008). Food web of benthic macroinvertebrates in a large Yangtze River-connected lake: The role of flood disturbance. Fundamental and Applied Limnology / Archiv für Hydrobiologie 171, 297–309
Liu S. M., Li L. W., Zhang G. L., Liu Z., Yu Z., Ren J. L. (2012). Impacts of human activities on nutrient transports in the huanghe (Yellow river) estuary. J. Hydrology 430, 103–110. doi: 10.1016/j.jhydrol.2012.02.005
Liu Q., Yi Y. J., Hou C. Y., Wu X. F., Song J. (2020). Response of trophic structure and isotopic niches of the food web to flow regime in the yellow river estuary. Mar. Geol. 430, 106329. doi: 10.1016/j.margeo.2020.106329
Lunt J., Smee D. L. (2020). Turbidity alters estuarine biodiversity and species composition. ICES J. Mar. Sci. 77 (1), 379–387. doi: 10.1093/icesjms/fsz214
Maceda-Veiga A., Mac Nally R., de Sostoa A. (2018). Environmental correlates of food-chain length, mean trophic level and trophic level variance in invaded riverine fish assemblages. Sci. total Environ. 644, 420–429. doi: 10.1016/j.scitotenv.2018.06.304
Marshall D. A., La Peyre M. K., Palmer T. A., Guillou G., Sterba-Boatwright B. D., Pollack J. B., et al. (2021). Freshwater inflow and responses from estuaries across a climatic gradient: An assessment of northwestern gulf of Mexico estuaries based on stable isotopes. Limnol. Oceanogr. 66 (9), 3568–3581. doi: 10.1002/lno.11899
McHugh P. A., McIntosh A. R., Jellyman P. G. (2010). Dual influences of ecosystem size and disturbance on food chain length in streams. Ecol. Lett. 13 (7), 881–890. doi: 10.1111/j.1461-0248.2010.01484.x
McIntyre P. B., Flecker A. S. (2006). Rapid turnover of tissue nitrogen of primary consumers in tropical freshwaters. Oecologia 148, 12–21. doi: 10.1007/s00442-005-0354-3
Meng W., Feagin R. A., Innocenti R. A., Hu B., He M., Li H. (2020). Invasion and ecological effects of exotic smooth cordgrass Spartina alterniflora in China. Ecol. Eng. 143:105670. doi: 10.1016/j.ecoleng.2019.105670
Middelburg J. (2014). Stable isotopes dissect aquatic food webs from the top to the bottom. Biogeosciences 11 (8), 2357. doi: 10.5194/bg-11-2357-2014
Middelburg J. J., Barranguet C., Boschker H. T., Herman P. M., Moens T., Heip C. H. (2000). The fate of intertidal microphytobenthos carbon: An in situ 13C-labeling study. Limnol. Oceanogr. 45 (6), 1224–1234. doi: 10.4319/lo.2000.45.6.1224
Montani S., Magni P., Abe N. (2003). Seasonal and interannual patterns of intertidal microphytobenthos in combination with laboratory and areal production estimates. Mar. Ecol. Prog. Ser. 249, 79–91. doi: 10.3354/meps249079
Moore J. W., Semmens B. X. (2008). Incorporating uncertainty and prior information into stable isotope mixing models. Ecol. Lett. 11 (5), 470–480. doi: 10.1111/j.1461-0248.2008.01163.x
Newsome S. D., Martinez del Rio C., Bearhop S., Phillips D. L. (2007). A niche for isotopic ecology. Front. Ecol. Environ. 5 (8), 429–436. doi: 10.1890/1540-9295(2007)5[429:ANFIE]2.0.CO;2
Olden J. D., Naiman R. J. (2010). Incorporating thermal regimes into environmental flows assessments: modifying dam operations to restore freshwater ecosystem integrity. Freshw. Biol. 55 (1), 86–107. doi: 10.1111/j.1365-2427.2009.02179.x
Olin J. A., Hussey N. E., Rush S. A., Poulakis G. R., Simpfendorfer C. A., Heupel M. R., et al. (2013). Seasonal variability in stable isotopes of estuarine consumers under different freshwater flow regimes. Mar. Ecol. Prog. Ser. 487, 55–69. doi: 10.3354/meps10402
Park J., Kwon B. O., Kim M., Hong S., Ryu J., Song S. J., et al. (2014). Microphytobenthos of Korean tidal flats: A review and analysis on floral distribution and tidal dynamics. Ocean Coast. Manage. 102, 471–482. doi: 10.1016/j.ocecoaman.2014.07.007
Phillips D. L., Inger R., Bearhop S., Jackson A. L., Moore J. W., Parnell A. C., et al. (2014). Best practices for use of stable isotope mixing models in food-web studies. Can. J. Zool. 92 (10), 823–835. doi: 10.1139/cjz-2014-0127
Phillips D. L., Newsome S. D., Gregg J. W. (2005). Combining sources in stable isotope mixing models: alternative methods. Oecologia 144 (4), 520–527. doi: 10.1007/s00442-004-1816-8
Pimm S. L., Lawton J. H., Cohen J. E. (1991). Food web patterns and their consequences. Nature 350 (6320), 669–674. doi: 10.1038/350669a0
Pinkerton M. H., Bradford-Grieve J. M. (2014). Characterizing foodweb structure to identify potential ecosystem effects of fishing in the Ross Sea, Antarctica. ICES J. Mar. Sci. 71 (7), 1542–1553. doi: 10.1093/icesjms/fst230
Poiesz S. S., Witte J. I., van der Veer H. W. (2020). Only a few key prey species fuel a temperate coastal fish food web. Mar. Ecol. Prog. Ser. 653, 153–166. doi: 10.3354/meps13472
Post D. M. (2002). Using stable isotopes to estimate trophic position: models, methods, and assumptions. Ecology 83 (3), 703–718. doi: 10.1890/0012-9658(2002)083[0703:USITET]2.0.CO;2
Power M. E., Sun A., Parker G., Dietrich W. E., Wootton J.T. (1995). HYDRAULIC FOOD-CHAIN MODELS. Bioscience 45 (3), 159–167.
Qu P., Zhang Z., Pang M., Li Z., Zhao L., Zhou X., et al. (2019). Stable isotope analysis of food sources sustaining the subtidal food web of the yellow river estuary. Ecol. Indic. 101, 303–312. doi: 10.1016/j.ecolind.2019.01.021
R Development Core Team (2013). A language and environment for statistical computing (Vienna, Austria: R Foundation for Statistical Computing).
Reum J. C., Jennings S., Hunsicker M. E. (2015). Implications of scaled δ15N fractionation for community predator–prey body mass ratio estimates in size-structured food webs. J. Anim. Ecol. 84 (6), 1618–1627. doi: 10.1111/1365-2656.12405
Roach K. A. (2013). Environmental factors affecting incorporation of terrestrial material into large river food webs. Freshw. Sci. 32 (1), 283–298. doi: 10.1899/12-063.1
Ru H., Li Y., Sheng Q., Zhong L., Ni Z. (2019). River damming affects energy flow and food web structure: A case study from a subtropical large river. Hydrobiologia. 847(3), 679–695. doi: 10.1007/s10750-019-04130-y
Semmens B. X., Ward E. J., Moore J. W., Darimont C. T. (2009). Quantifying inter-and intra-population niche variability using hierarchical Bayesian stable isotope mixing models. PloS One 4 (7), e6187. doi: 10.1371/journal.pone.0006187
Shan X., Sun P., Jin X., Li X., Dai F. (2013). Long-term changes in fish assemblage structure in the yellow river estuary ecosystem, China. Mar. Coast. Fisheries 5 (1), 65–78. doi: 10.1080/19425120.2013.768571
Stock B. C., Jackson A. L., Ward E. J., Parnell A. C., Phillips D. L., Semmens B. X. (2018). Analyzing mixing systems using a new generation of Bayesian tracer mixing models. PeerJ 6, e5096. doi: 10.7717/peerj.5096
Sun P. F., Shan X. J., Wu Q., Chen Y. L., Jin X. S. (2014). Seasonal variations in fish community structure in the laizhou bay and the yellow river estuary. Acta Ecologica Sin. 34 (2), 367–376. (in Chinese with English abstract)
Szczepanek M., Silberberger M. J., Koziorowska-Makuch K., Nobili E., Kędra M. (2021). The response of coastal macrobenthic food-web structure to seasonal and regional variability in organic matter properties. Ecol. Indic. 132, 108326. doi: 10.1016/j.ecolind.2021.108326
Thieltges D. W., De Montaudouin X., Fredensborg B., Jensen K. T., Koprivnikar J., Poulin R. (2008). Production of marine trematode cercariae: A potentially overlooked path of energy flow in benthic systems. Mar. Ecol. Prog. Ser. 372, 147–155. doi: 10.3354/meps07703
Thomas K. F., Robin M. R., Langdon B. Q., Joseph P. M. (1997). Turnover of carbon and nitrogen during growth of larval krill, euphausia superba Dana: a stable isotope approach. Journal of Experimental Marine Biology and Ecology 212, 2, 259–275. doi: 10.1016/S0022-0981(96)02740-2
Tieszen L. L., Boutton T. W., Tesdahl K. G., Slade N. A. (1983). Fractionation and turnover. of stable carbon isotopes in animal tissues: implications for δ 13 c analysis of diet. Oecologia 57 (1-2), 32–37. doi: 10.1007/BF00379558
Wang H., Bi N., Saito Y., Wang Y., Sun X., Zhang J., et al. (2010). Recent changes in sediment delivery by the huanghe (Yellow river) to the sea: causes and environmental implications in its estuary. J. Hydrology 391 (3-4), 302–313. doi: 10.1016/j.jhydrol.2010.07.030
Wang H. J., Wang A. M., Bi N. H., Zeng X. M., Xiao H. H. (2014). Seasonal distribution of suspended sediment in the bohai Sea, China. Continental Shelf Res. 90, 17–32. doi: 10.1016/j.csr.2014.03.006
West J. B., Bowen G. J., Cerling T. E., Ehleringer J. R. (2006). Stable isotopes as one of nature's ecological recorders. Trends Ecol. Evol. 21 (7), 408–414. doi: 10.1016/j.tree.2006.04.002
Xie H., Yi Y., Hou C., Yang Z. (2020). In situ experiment on groundwater control of the ecological zonation of salt marsh macrophytes in an estuarine area. J. Hydrology. 585, 124844. doi: 10.1016/j.jhydrol.2020.124844
Xu B., Burnett W., Dimova N., Diao S., Mi T., Jiang X., et al. (2013). Hydrodynamics in the yellow river estuary via radium isotopes: Ecological perspectives. Continental Shelf Res. 66, 19–28. doi: 10.1016/j.csr.2013.06.018
Yen J. D., Cabral R. B., Cantor M., Hatton I., Kortsch S., Patricio J., et al. (2016). Linking structure and function in food webs: maximization of different ecological functions generates distinct food web structures. J. Anim. Ecol. 85 (2), 537–547. doi: 10.1111/1365-2656.12484
Young T., Pincin J., Neubauer P., Ortega-García S., Jensen O. P. (2018). Investigating diet patterns of highly mobile marine predators using stomach contents, stable isotope, and fatty acid analyses. ICES J. Mar. Sci. 75 (5), 1583–1590. doi: 10.1093/icesjms/fsy025
Yu X., Tian J., Li J., Sun J. (2009). Distribution area and expanding speed of alien invasive species spartina spp. yellow river delta. Mar. Environ. Sci. 28, 684–709. (in Chinese with English abstract)
Keywords: food web, stable isotope, energy flow, flow regime, estuarine ecology
Citation: Yi Y, Zhao F, Liu Q and Song J (2023) Runoff from upstream changes the structure and energy flow of food web in estuary. Front. Mar. Sci. 10:1103502. doi: 10.3389/fmars.2023.1103502
Received: 20 November 2022; Accepted: 14 February 2023;
Published: 29 March 2023.
Edited by:
Ya Ping Wang, East China Normal University, ChinaReviewed by:
Xiaoxiao Li, Guangdong University of Technology, ChinaYoh Yamashita, Kyoto University, Japan
Hyun Je Park, Gangneung–Wonju National University, Republic of Korea
Copyright © 2023 Yi, Zhao, Liu and Song. This is an open-access article distributed under the terms of the Creative Commons Attribution License (CC BY). The use, distribution or reproduction in other forums is permitted, provided the original author(s) and the copyright owner(s) are credited and that the original publication in this journal is cited, in accordance with accepted academic practice. No use, distribution or reproduction is permitted which does not comply with these terms.
*Correspondence: Yujun Yi, eWl5dWp1bkBibnUuZWR1LmNu