 Craig Stevens
 Natalie Robinson
 Gabby O’Connor3
- 1National Institute of Water and Atmospheric Research, Wellington, New Zealand
- 2Department of Physics, University of Auckland, Auckland, New Zealand
- 3Faculty of Creative Arts, University of Auckland, Auckland, New Zealand
The oceanic connection between ice shelf cavities and sea ice influences sea ice development and persistence. One unique feature in regions near ice shelves is the potential for sea ice growth due to crystal accretion on its underside. Here we present observations of ocean boundary-layer processes and ice crystal behaviour in an Ice Shelf Water outflow region from the Ross/McMurdo Ice Shelves. From a fast ice field camp during the Spring of 2015, we captured the kinematics of free-floating relatively large (in some cases 10s of mm in scale) ice crystals that were advecting and then settling upwards in a depositional layer on the sea ice underside (SIPL, sub-ice platelet layer). Simultaneously, we measured the background oceanic temperature, salinity, currents and turbulence structure. At the camp location the total water depth was 536 m, with the uppermost 50 m of the water column being in-situ super-cooled. Tidal flow speeds had an amplitude of around 0.1 m s-1 with dissipation rates in the under-ice boundary layer measured to be up to ε=10-6 W kg-1. Acoustic sampling (200 kHz) identified backscatter from large, individually identifiable suspended crystals associated with crystal sizes larger than normally described as frazil. Measurement of crystals in the SIPL found dimensions of the range 5-200 mm with an average of 93-101 mm depending on the year. The existence and settlement of crystals has implications for understanding SIPL evolution, the structure of sea ice, as well as the fate of Ice Shelf Water.
1 Introduction
Sea ice nearby to Antarctic ice shelves can be affected by cold ice shelf water exiting the shelf cavity (Langhorne et al., 2015). Here we describe observations of suspended ice crystals behaviour in the ocean turbulent boundary-layer beneath fast ice near a large Antarctic ice shelf cavity. The existence and persistence of these crystals influences regional variability in Antarctic Sea ice (Langhorne et al., 2015) makes climate prediction more challenging (Ludescher et al., 2019) and impeding communication of key issues to stakeholders and decision-makers (Christensen and Nilsson, 2017). With anthropogenically-induced warming oceans penetrating farther south, increased ice shelf basal melting is expected (Rignot et al., 2013; Kusahara, 2020). Relatively warm ocean water penetrates the interior of ice shelf cavities and induces melting on the ice underside. A potential driver contributing to sea ice variability is the feed-back effect of meltwater exiting major ice shelf cavities and influencing sea ice development (e.g. Holland et al., 2007; Langhorne et al., 2015). The meltwater exiting the cavity is typically very cold as it comprises water formed within the cavity at depth so that the local freezing point temperature is depressed due to the higher pressure. If this reduction in pressure is sufficient, the liquid water can become colder that its freezing point temperature and is described as being supercooled. This meltwater mixes with the ambient ocean, resulting in a fresher, cold seawater plume that seeks out the fastest upward flow path on the shelf underside subject to the Coriolis force and basal slope (MacAyeal, 1985; Jenkins and Bombosch, 1995; Smedsrud and Jenkins, 2004; Stevens et al., 2020). These plumes will develop depending on the balance of (1) inflow properties, (2) re-freezing either of the sea ice underside or in the formation of suspended crystals removing their thermal deficit, and (3) mixing with warmer waters (Robinson et al., 2014; Hughes et al., 2014; Cheng et al. 2019). If the plume persists sufficiently to reach the ice shelf edge it flows out beneath the neighbouring sea ice margin (Fer et al., 2012; Langhorne et al., 2015). At this point the basal slope driver of flow ceases and the persistence of the supercool plume is controlled by initial buoyancy, growth of new ice, topography and mixing (Hughes et al., 2014) which are all changing relatively rapidly. This plume of supercool water influences sea ice growth by both enhancing upper ocean stratification and absorbing heat (Robinson et al., 2014; McPhee et al., 2016). Whether or not there is an associated phase change is critical and so the presence of ice crystals within the upper water column has a number of implications from thermal budgets, convection and ecological habitat (Hoppmann et al., 2020). Cheng et al. (2019) explicitly call for more observational data of the ice ocean interaction “these findings highlight the need for further observations in McMurdo Sound, particularly focused near the ISW outflow region in the western sound, where the supercooled ISW plume and SIPL are prominent, and more general observations that help to constrain the frazil size spectrum within the sea-ice–ocean boundary layer”.
There is ample documentation of large crystals located on the sea ice underside, as well as evidence that in some settings this ice formation occurs as small buoyant crystals in the water column (e.g. Hoppmann et al., 2015; Hoppmann et al., 2020; Frazer et al., 2020). If these crystals grow slowly, remaining sufficiently small that viscosity dominates buoyancy so that rise rates are very slow, then they are mainly passively advected. Cheng et al. (2019) model how the crystal concentration influences the SIPL growth rate. Typically, this is the scale (<1 mm) at which crystals are thought to exist. However, if they grow sufficiently large whilst suspended, then buoyancy-driven thin disk mechanics must dominate their trajectory (Jordan et al., 2015). This means large, suspended crystals should not remain in suspension for very long as they should rapidly settle out. Here we refer to the large, mature crystals at depth as suspended crystals to distinguish them from crystals already integrated and growing in the SIPL.
The extent of an ice shelf water (ISW) plume has been modelled using schemes that develop and transport crystals, again with a focus on mm-scale crystals (e.g. Jenkins and Bombosch, 1995; Holland et al., 2007; Hughes et al., 2014), or if not, then in a “bed-load” and so essentially a part of the ice-ocean interface (Robinson et al., 2014). Despite the challenges in making measurements in this environment, one correlation that emerges is that the regional distribution of greater SIPL thickness correlates with the presence of supercooled seawater (Langhorne et al., 2015; Brett et al., 2020). By following the ice shelf water plume as it evolves in space and time, it is possible to look at ice growth and thermal relief (e.g. Smedsrud and Jenkins, 2004; Hughes et al., 2014).
A recent review by Hewitt (2020) identifies issues like crystal growth, the role of sediments and the limited availability of observations as being key issues for the advancement of understanding at the ice shelf scale. At the larger regional to global scale the challenges lie more with sea ice production and water mass formation as coupled models seek to combine the ocean, atmosphere and ice structure (e.g. Roach et al., 2018; Moorman et al., 2020). Uniformly these studies identify the need for more observations both at the process, and monitoring, scales.
A decade-long sequence of sea ice camps in the McMurdo Sound region (Leonard et al., 2006, Robinson et al., 2020) have observed conditions influenced both by the open ocean and the waters beneath the McMurdo Ice Shelf, a small ice shelf that sits between the Ross Ice Shelf (the largest ice shelf on the planet by area) and McMurdo Sound. The observations have revealed that these platelets form a coherent layer on the underside of sea ice (a sub-ice platelet layer, SIPL Wongpan et al., 2015) – into which they are eventually incorporated (Smith et al., 2001; Langhorne et al., 2015). Such observations have been made elsewhere (Hunkeler et al., 2015; Hoppmann et al., 2020). However, the McMurdo shelf includes a region called “the Dirty Ice” because of the substantial rock debris visible on the shelf surface and has been described as “perhaps the strangest ice shelf in the world” (Debenham, 1965; Atkins and Dunbar, 2009). This material is partly marine in origin, as sediment entrained into the growing marine SIPL on the shelf-underside finds its way to the surface via the ongoing combination of topside surface ablation and underside ice accretion (Campbell and Claridge, 2003). This, in itself, is evidence of supercool oceanic conditions.
Hoppmann et al. (2020) review our present understanding of Antarctic platelet ice and makes it clear the topic is still in a discovery phase – partly due to the challenges of making comprehensive observations. At the same time, modelling approaches have needed to advance – creating a tension in that not all the relevant processes and scales are known. Geophysical boundary-layers are well understood and it is known that ice crystals on the sea ice underside influences interfacial momentum transfer, sea ice composition and strength as well as ecological habitat throughout localised parts of Antarctic coastal waters. These outcomes will be influenced differently depending on if the crystals grow in suspension and then settle, versus primarily grown once settled. Here we definitively identify and quantify the dynamics of large ice crystals observed freely floating in the upper ocean, and the turbulence within which they move, in the context of background hydrographic conditions. This enables us to consider three key questions associated with the presence of these crystals. (1) Is there evidence of large, suspended crystals? While they are known to exist on the ice underside there is little prior published evidence confirming their presence in the water column itself. This observation is novel and provides a guide for future model development. (2) Is there a relationship between crystal behaviour and the turbulent under-ice boundary-layer structure? In particular, it is useful to assess the role turbulence plays in suspending the crystals. (3) Finally, are there large-scale implications of such finescale mechanics that contextualise the wider effect the observed conditions could have?
2 Methods
2.1 Location and camp
The “K131 sea ice camp” (Antarctica New Zealand logistics event designation, Stevens et al., 2018) was deployed on 2.3 m thick sea ice from 21 October-4 November 2015 at a location in Southern McMurdo Sound (77° 51.913’ S 166° 00.053’ E) over an ocean depth of 536 m (Figure 1). At the time of sampling the edge of the fast ice was ~20 km to the north. The camp location was selected based on surveys of platelet deposition thickness (1.8 m) whereby there would be sufficient platelets to be measurable (Langhorne et al., 2015), while avoiding too many platelets (i.e. SIPL too deep to easily penetrate a conductivity temperature depth - CTD - profiler through) and also avoiding the substantial tidal currents encountered further towards Haskell Strait (Figure 1; Stevens et al., 2009; Mahoney et al., 2011). The K131 camp consisted of modified shipping containers with cut-out floors allowing access to the ice and ocean below (Figure 2). A hot-water cutter was used to melt through and remove the sea ice in blocks. It was notable that upon removal of the blocks, the water which filled the hole appeared milky but that this gradually dissipated over the subsequent days. After 12 days of operations and many seal occupations of the holes, the hole water was fully flushed and very clear. We speculate that this trend in water transparency was because the water in the hole was initially from the melting of the sea ice and upwards drainage from the SIPL and contained sufficient levels of sediment to be visible but that over time this was replaced with clear ocean water. With regard to the regional sampling context, the present data were collected south of where the later Frazer et al. (2020) acoustic sampling took place. Furthermore, the analysis of under ice boundary roughness data synthesis described in Robinson et al. (2017) include some data from the same field camp as here, but with instruments focused on the ice underside.
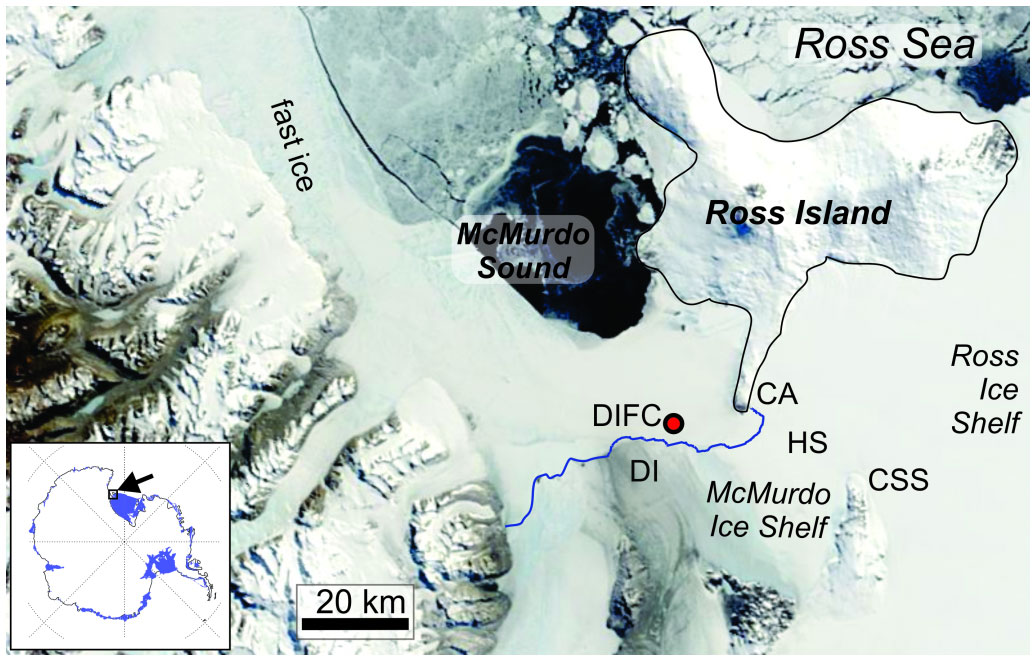
Figure 1 Location details including McMurdo Sound as an exit point for the Ross Ice Shelf cavity (showing DIFC=Dirty Ice Field Camp, HS=Haskell Strait, CSS=Cape Spencer-Smith, CA=Cape Armitage). The inset shows Antarctica and ice shelf margin shown in blue with McMurdo Sound sub-region identified. The Modis imagery is from 10 November 2015 day 314 showing the dark smudge of the “dirty ice” (DI).
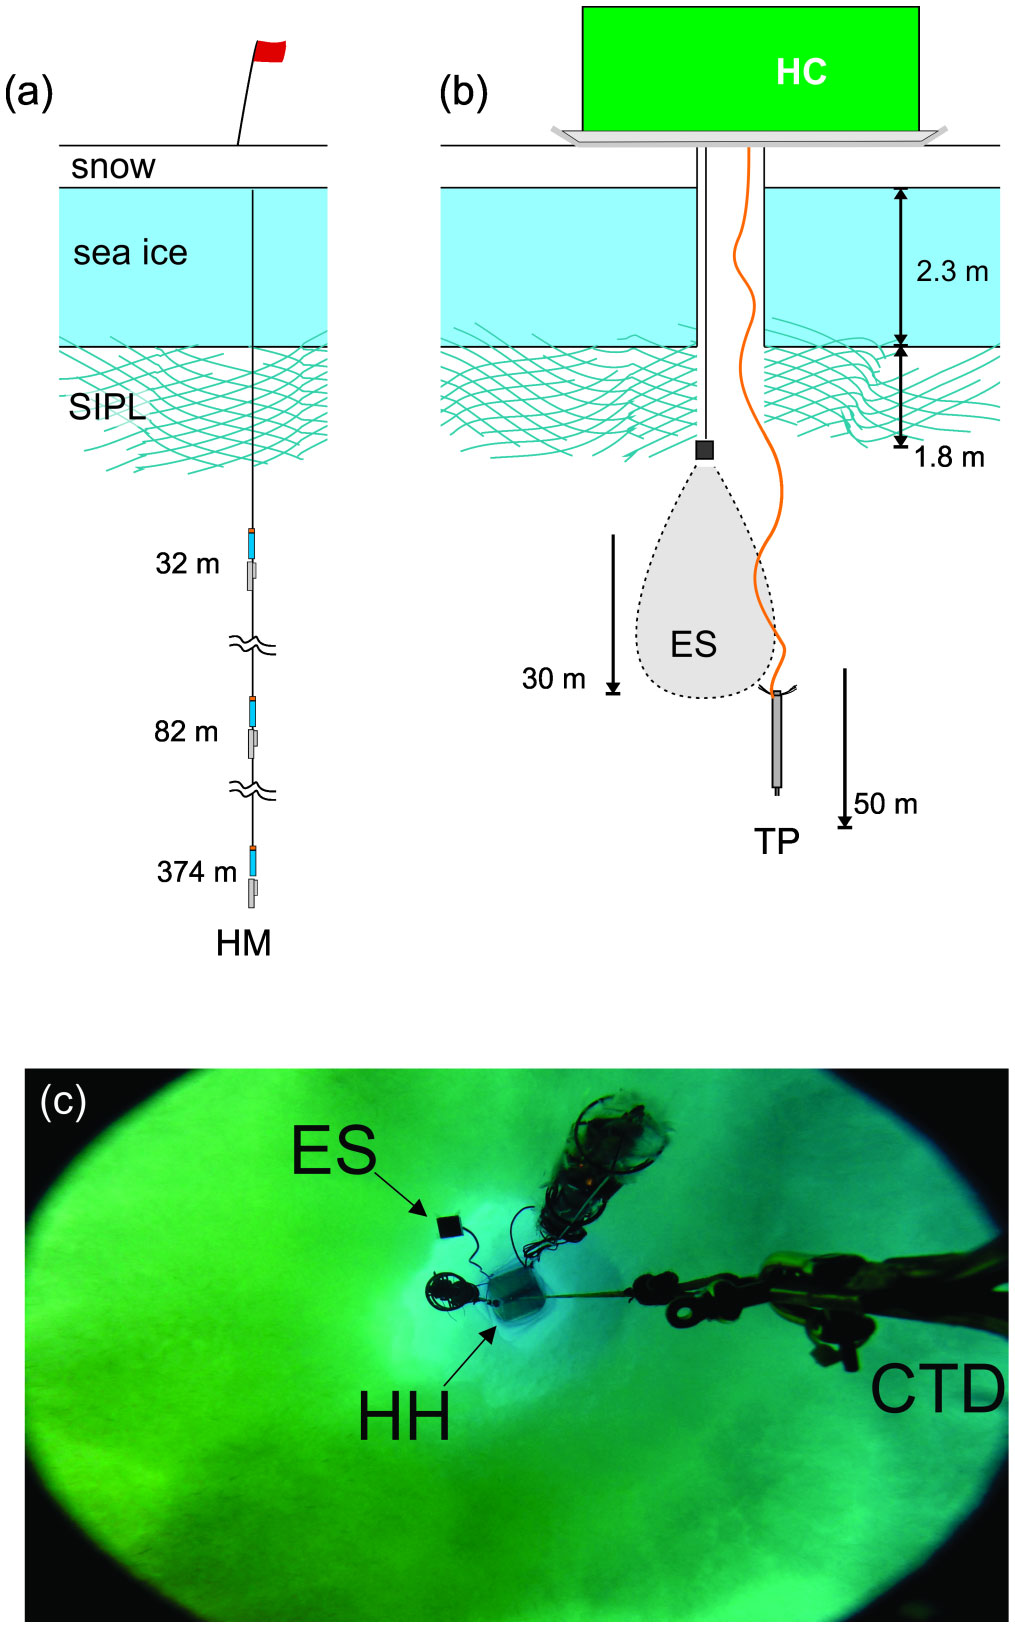
Figure 2 Camp setup showing (A) mooring and (B) hydro container (HC) with echo sounder (ES) and turbulence profiler (TP). (C) Upwards looking view from camera mounted on CTD frame showing the hydrohole (HH). The sensors other than echo sounder are not discussed here but include a supercoolometer and a Nobska MAVS.
2.2 Sub-Ice platelet layer
Upon removal of the 1 m x 1 m x 2.3 m blocks of sea ice, the SIPL would remain intact beneath the ice hole, giving an indication of the cohesive strength of the layer. Sampling activity would then penetrate through this SIPL by first lowering a weight to create a hole. For present purposes we consider them to be ends of a spectrum of the same physical crystal evolutionary process (Hoppmann et al., 2020). Crystals were extracted from the SIPL by reaching down with a porous scoop. They would be recovered either as individuals or in clumps. In many instances once extracted the clumps would collapse with very little encouragement indicating only weak interlocking crystal growth. This in part indicates the role of buoyancy aiding maintenance of the SIPL but also suggests that the SIPL is not always a tightly interlocked matrix of crystals (c.f. Robinson et al., 2014). The dimensions of each crystal were then quantified by manual measurement (done immediately to avoid significant melting or growth). It is possible that these represent a distinctly different set of sizes to the suspended crystals, but large crystals were clearly observed rising in video. It is likely however that this approach is biased towards larger crystals (> 5 mm diameter). Crystal size data from a nearby camp from the following year (77.8183°S 165.4059°E, November 2016 – see Robinson et al., 2020) are also included.
2.3 Sampling instruments
Video (GoPro) provide qualitatively very useful, video/visual observations and forms a key piece of evidence in this study. A number of video sampling periods were recorded with a lowered camera suspended several metres beneath the SIPL underside (Supplementary Videos 1, 2).
Extracting quantitative information from video is challenging because of light variability, lens distortion and reflection/viewing angle effects. Penrose et al. (1994) and Leonard et al., (2006) describe how acoustics provide a more consistent picture of crystal behaviour. We placed a downward-looking Simrad EK60 200 kHz echo sounder at the base of the SIPL recording acoustic backscatter at 1 Hz with 4 cm vertical resolution over a sampling cone that is 7 degrees across, so that at a depth of 25 m the cone is 3 m wide. The beam-width is not particularly critical so long as it is wide-enough that scatterers register for sufficient duration to be identifiable (as opposed to random backscatter from scan to scan). Useful backscatter was consistently detected as deep as 30 m. With horizontal flows of around 0.05 m s-1 this means that a reflector would stay in the beam for a maximum of nearly two minutes at 25 m with a 30-degree cone. Any crystal rise (or fall) is seen as an oblique trace in the backscatter timeseries field, so that each streak in the echogram corresponds to a single crystal. The angled trajectories relate to the crystal rise speed and are unconnected to the tidal advection. Horizontal flow controls the persistence of individual reflectors as it is responsible for moving crystals in and out of the acoustic beam.
Vertical structure of water column temperature and salinity were recorded using a SBE19+ CTD profiler that was calibrated pre- and post-experiment resulting in an accuracy of ~5 mK with signal noise less than 1 mK. Care was taken to avoid ice growth on the CTD sensors, and also to thermally equilibrate prior to profiling (Robinson et al., 2020). The example used here is a down-cast from an instrument that was held for one hour at 200 m prior to bringing up into the hole very briefly and then profiling downwards.
In addition to the CTD profiler, a Rockland VMP 250 microstructure profiler was deployed to quantify turbulent mixing by capturing fine and microstructure scale variability. This loose-tethered profiler falls at ~0.65 m s-1, recording velocity shear and temperature at the microscale and fine-scale temperature and conductivity along with some other properties. The microscale velocity shear data enables estimates of energy dissipation rate ε to be calculated (Wolk et al., 2002) and profilers have previously been successfully deployed beneath Antarctic fast ice (Robertson et al., 1995; Stevens et al., 2009; Fer et al., 2012). Eighty-one microstructure profiles were recorded over a three-day period (1-3 Nov. 2015).
In order to provide a temporal context, three pairs of current meters (Aanderra RCM 11) and conductivity-temperature-pressure sensors (Seabird Electronics SBE 37), both sampling at two-minute intervals, were deployed on a suspended mooring located at 77° 51.903’ S 166° 00.351’ E, 200 m north east of the main sampling location. The instrument pairs were deployed at 32, 82 and 374 m beneath the surface in order to gain appreciation of the near-surface and deeper flow. In addition, ten SBE 56 temperature loggers sampling at 1 Hz were deployed at 5, 10, 15, 20, 43, 53, 141, 199, 257, 315 m. All the upper instruments were affected by icing issues (Robinson et al., 2020) to varying extents and only used in specific instances here.
3 Results
3.1 Background water column conditions
Water column temperature structure showed that the ocean temperatures were mostly above the pressure-dependent freezing level (Figure 3) other than the upper ~50 m. This upper part of the water column was always in situ supercooled and sometimes with a clear change in structure at the depth of transition to non-supercooled. The example presented here was recorded on DOY 300 as the tides moved into spring conditions and shows the upper layer temperature/salinity (Sp=34.65 psu, θ0=-1.94°C or for TEOS-10, SA=34.82 g Kg-1, Θ0=-1.94°C) indicates Ice Shelf Water conditions. The potential temperature comes close to freezing again at 80 m but beneath this, even though temperatures remained below the surface freezing point θ0=-1.91°C, the water was not in situ supercooled. The relatively homogeneous upper layer salinity (34.65 psu) gives way to a quasi-linear increase below 100 m.
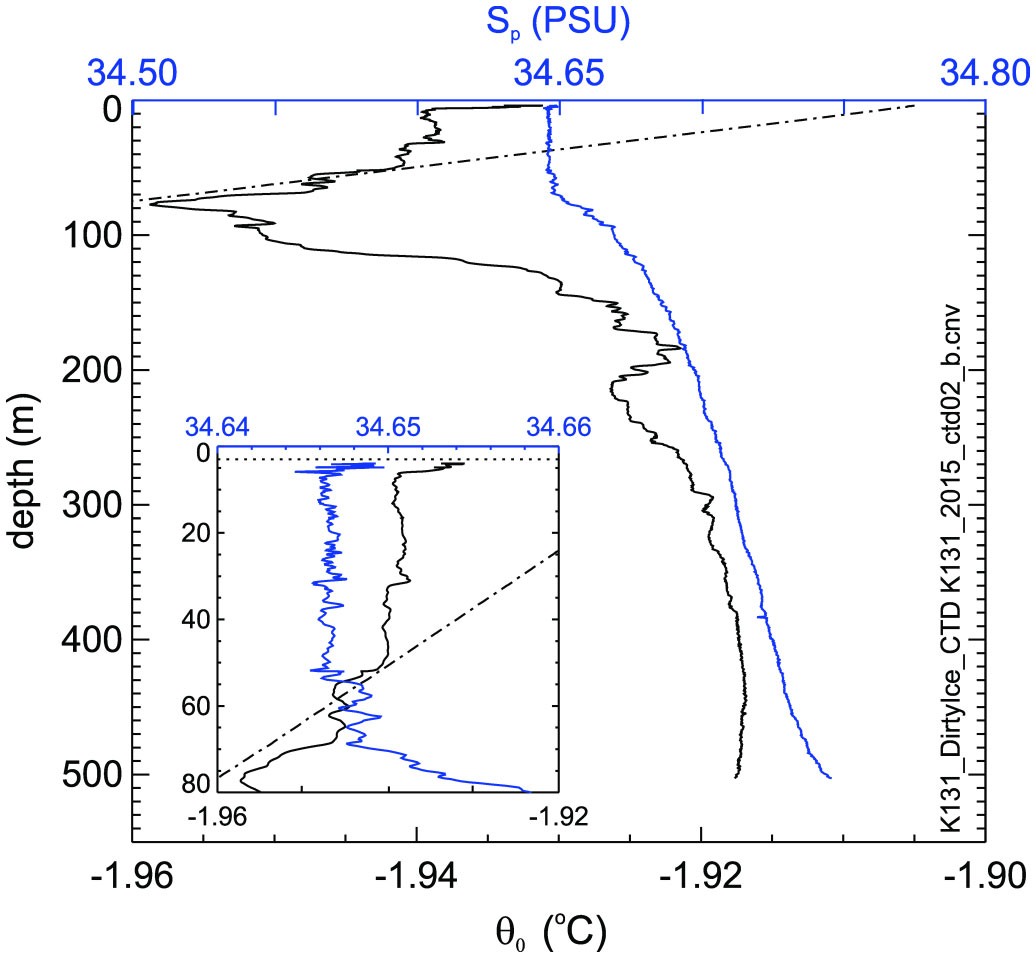
Figure 3 Example vertical profiles of temperature and salinity from the CTD, along with the in situ freezing temperature. The inset shows an expanded view of the upper 80 m. This profile was from 0100 UTC on the 27th of October 2015 (DOY 300). The dashed line shows the freezing point potential temperature referenced to surface pressure.
The deepest current meter provided the best quality current speed results (Figures 4A, B). The upper current meter operated for a few days at the beginning (but stopped due to an electronic fault) and was sufficient to show that the upper speeds were between 50 and 100% faster than the deep flows, at least in the conditions at the time. This is possibly the result of the buoyantly forced ice shelf water plume consistently observed in the regionwhich, due to buoyancy, preferentially flows on the ice underside towards the northwest (Robinson et al., 2014; Hughes et al., 2014). The observations commenced near the end of spring tides followed by neap tide around DOY 297-299 (24-26 October, see top trace in Figure 4) and then the following spring tides peaked around DOY 304.5 (31 November). The tidal speeds are clearly apparent with an amplitude of 0.1 m s-1. However, they are not the only advective process, as a period of flow near the start of the experiment showed speeds in excess of 0.1 m s-1 and consistently moving towards the north (i.e. away from the ice shelf). Temperature and salinity were consistent over the period but still responding to the tide at times.
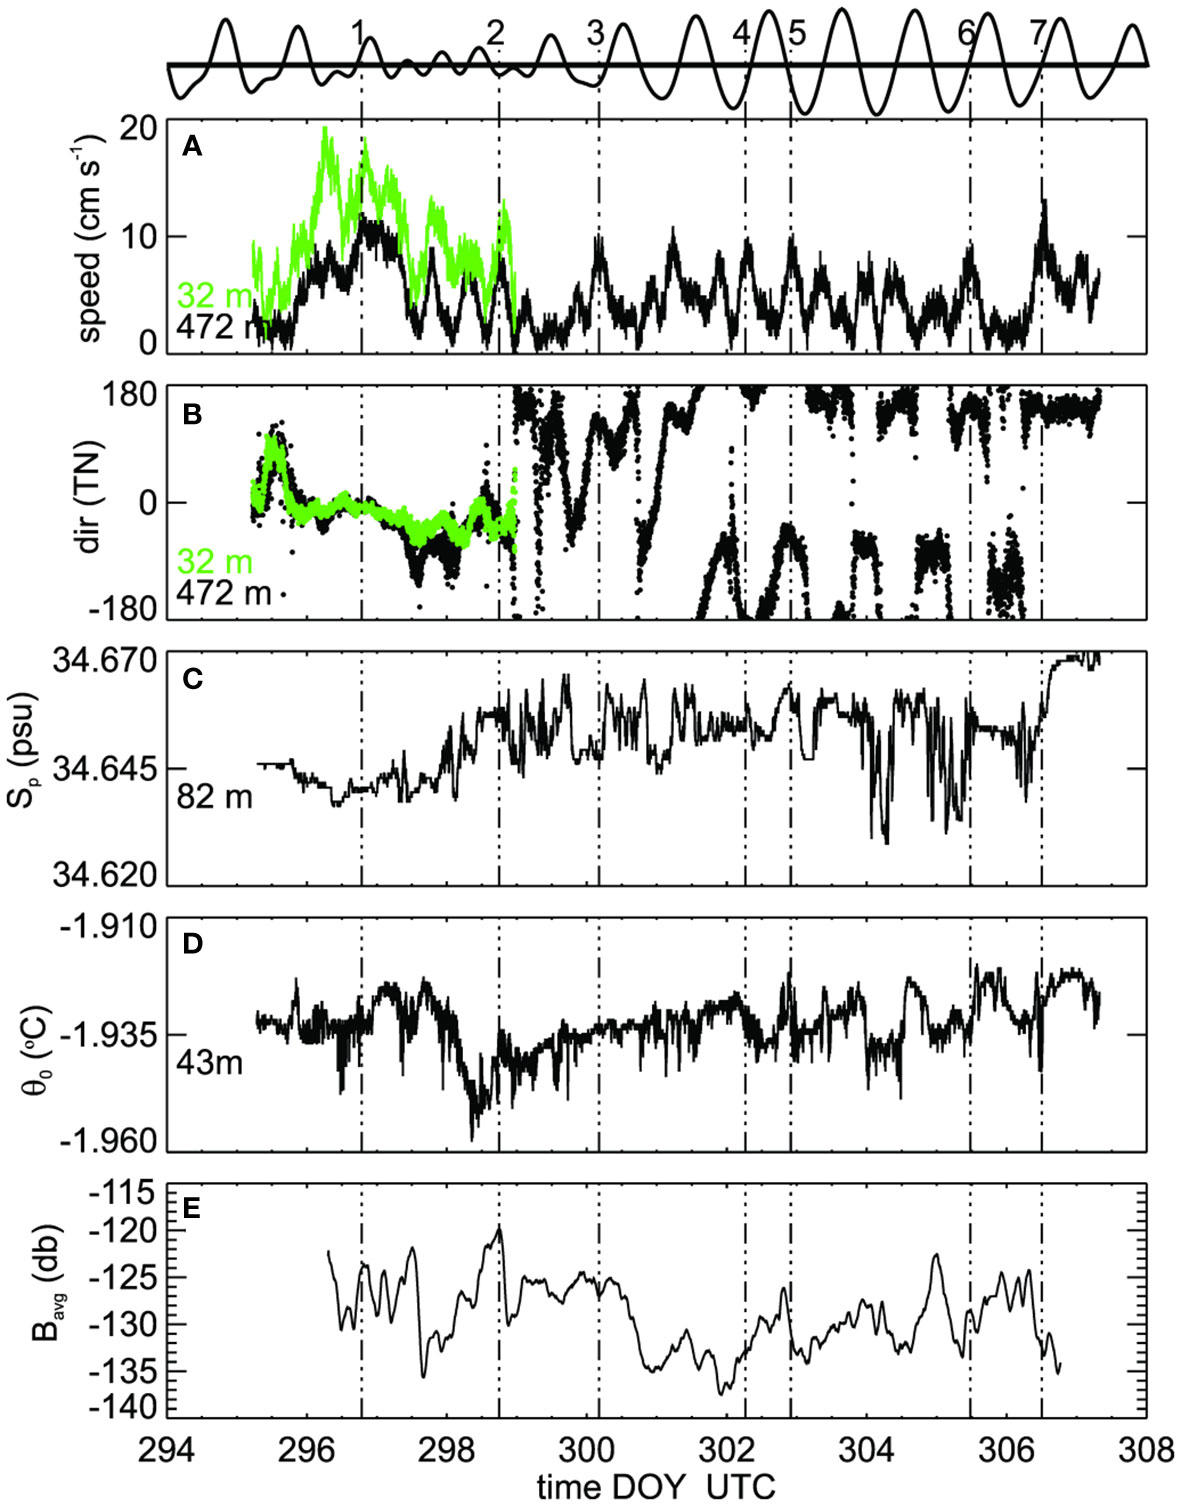
Figure 4 Moored instrument data showing timeseries of (A) current meter speed at 472 m, (B) flow direction (towards) at 472 m, (C) salinity at 82 m, (D) potential temperature at 43 m and (E) vertically-averaged acoustic backscatter. Panels (A, B) include a short segment from the upper current meter (32 m) prior to ice-up. Selected peaks in speed are highlighted in all panels using vertical dashed lines and the modelled tidal height (http://tbone.biol.sc.edu/tide) is traced above the top panel where the peaks are labelled.
3.2 Ice crystals and backscatter
The majority of the measured crystal dimensions at the base of the SIPL ranged from 5 mm through to 200 mm (Figure 5). The average plan-view dimension in 2015 was 93 mm (with a slightly larger 101 mm equivalent measured the following year). Thicknesses were 2-10 mm, with the thicker ones clearly multi-layered (thickness was not measured in the subsequent data set). There appeared to be two types of behaviour from visual video observations (see Supplementary Videos 1, 2; Figure 6). The first was seen at around 10 m depth where platelet crystals were being advected horizontally but with some randomness to direction and not always with an obvious upwards component. The second type was seen in imagery from just beneath the ice (~ 1 m) which showed a more ordered region of suspended crystals, especially at slack water. The smaller ones drifted horizontally while the larger individuals were occasionally and independently seen rising into the SIPL (see Supplementary Videos).
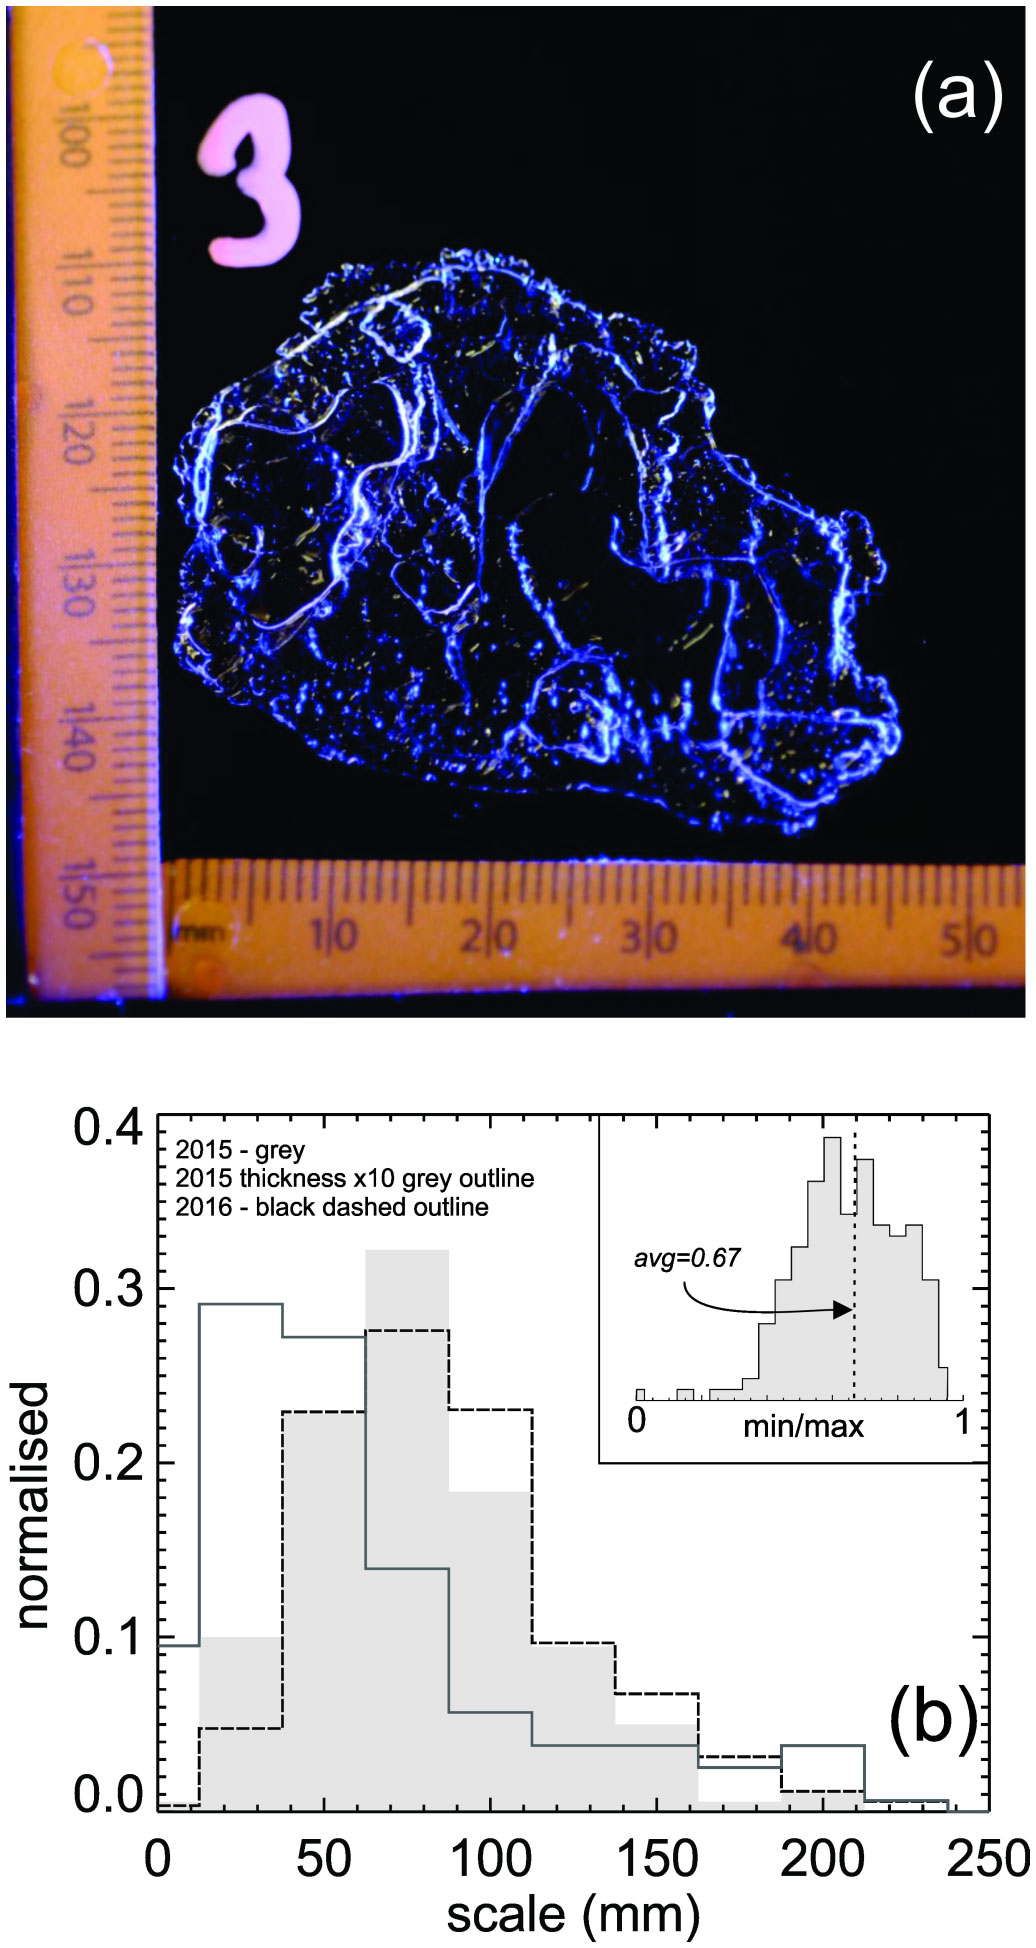
Figure 5 Crystal details including (A) an image of an example platelet (ruler in mm). (B) Scale distributions for 2015 (180 platelets) vector average of plan-view dimensions and the crystal thickness (scaled larger by a factor of 10) and 2016 (864 platelets, vector average of plan view dimensions). The ratio of the minimum to maximum side dimensions (i.e. not thickness) is shown as an inset.
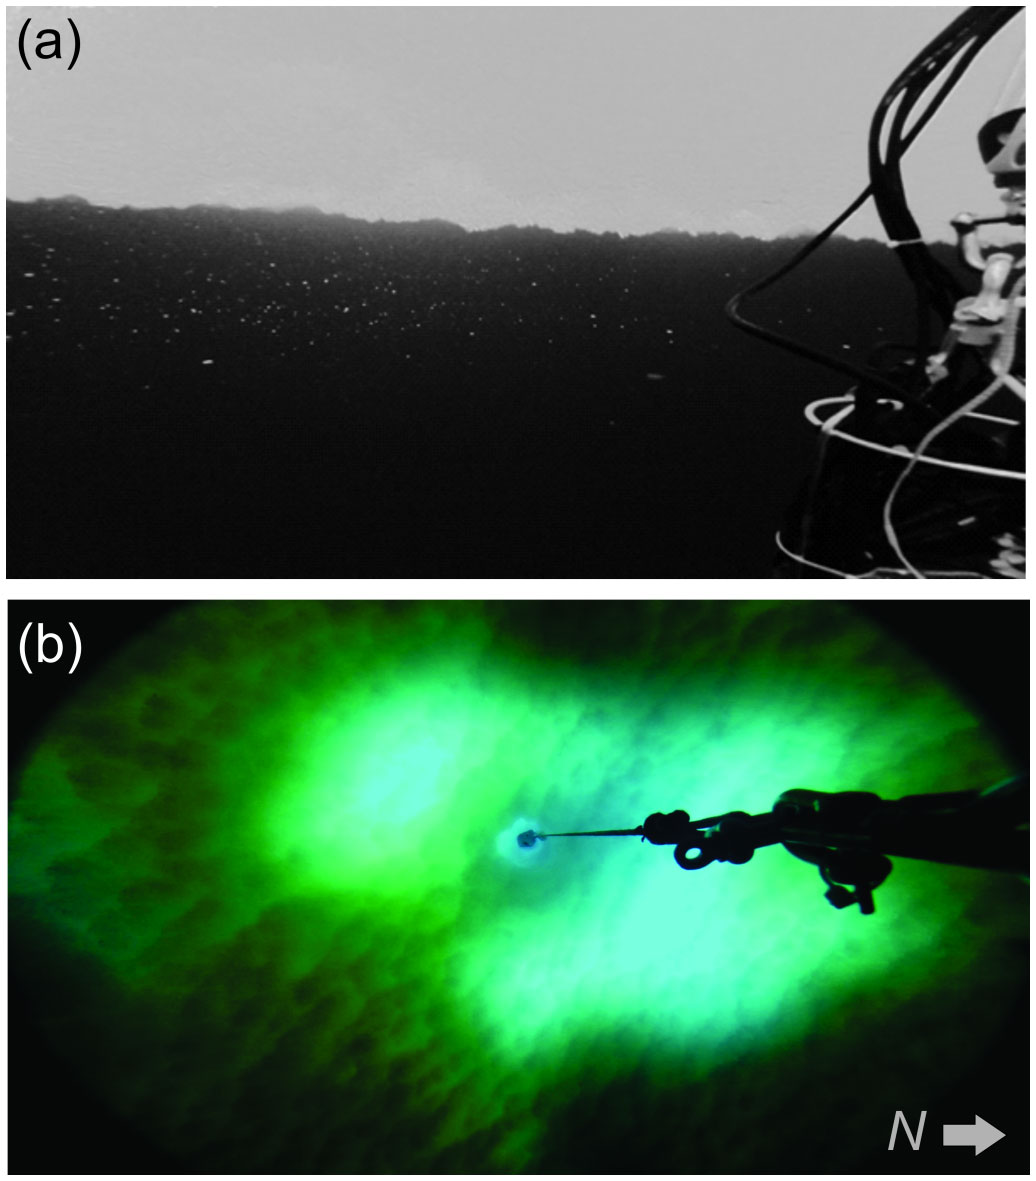
Figure 6 video stills showing (A) beneath ice showing suspended crystals (approximate horizontal field of view 5 m). The image has had its contrast manipulated to aid in identification of the crystals. (B) An upward looking image showing the underside of the SIPL. The square in the middle is 1 m x 1 m and the bright patches are where snow was cleared for the camp. Undulations were apparent at the 2-3 m scale (approximate northward direction identified).
The downwards looking 200 kHz echosounder provided a new perspective on the presence and behaviour of these suspended crystals as various acoustic backscatter conditions were observed over the nine days of sampling (Figure 7). These conditions included large individual biological agents (identified by their rapid erratic changes in direction and crossing of background particle lines) observed against a slowly varying background (Figure 7A). Occasionally the entire field varies rapidly (Figure 7B). It was also common to observe a varying intensity in the background field (Figure 7C), but individual target streaks would persist through the signal variation. The target strength was not a reliable separator however, as there would occasionally be strong scatterers that simply rose and entered the SIPL. Interpretation of video suggests these are relatively large crystals. From this we determine that there are three classes of scatterer – biology, and large and small crystals.
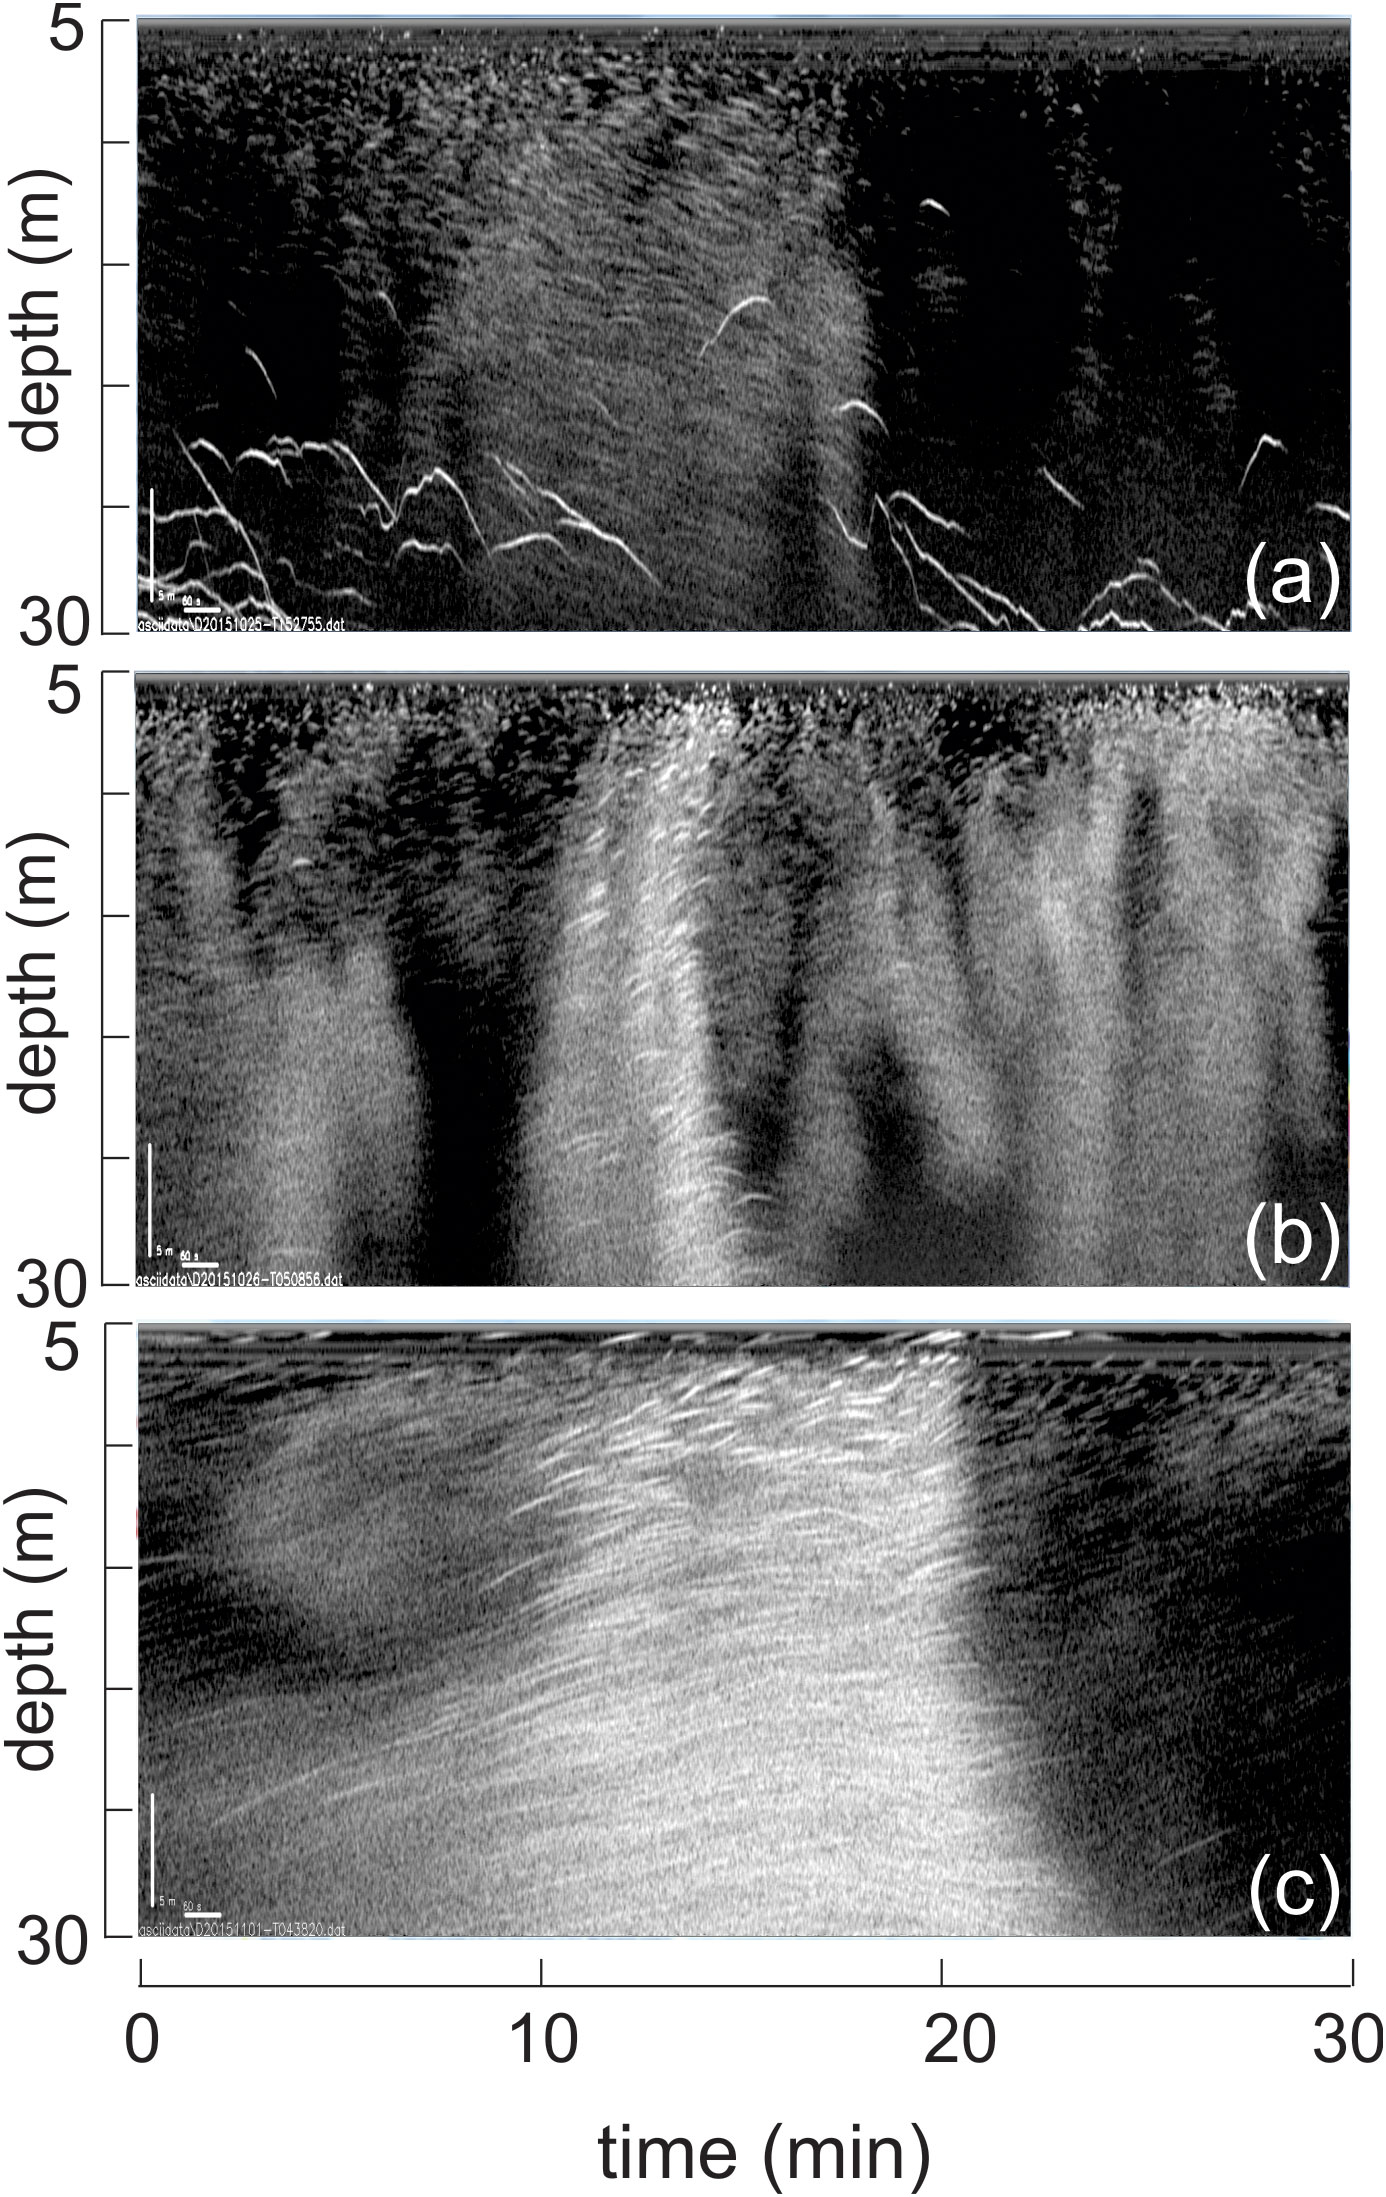
Figure 7 acoustic sounder images from different times. These images capture platelets as well as biological back-scatterers. A diagonal corner-to-corner path represents a rise speed of 14 mm s-1. The segments come from (A) 25oct2015 at 1528 UTC (DOY 298.65), (B) 26oct2015 UTC at 0509 (DOY 299.84) and (C) 1nov2015 0438 UTC (DOY=305.19).
Considering the Reynolds number (Re=characteristic velocity x dimension/kinematic viscosity) as quantifying the balance of inertia and viscosity, and with the larger crystals being on average around 10 cm in diameter and rise speeds of the order of 1 cm s-1, this implies a Reynolds number ranging from 50-2000 with an average of 1000. Instability behind a buoyant disk commences well below this at Re=~60 (Natarajan and Acrivos, 1993).
For most of the observation period the vertically integrated acoustic backscatter timeseries does not show any obvious consistent correlation with the velocity and scalar properties. However, exceptions occur near the end of day 298 (peak 2 in Figure 4 as identified in upper tidal trace) at which point we see shift from uni-directional flow through to a tidal oscillation and this comes at the end of a period of dropping temperatures (although only dropping by 30 mK) and increasing salinity. Simultaneously we observed the rise period to the highest backscatter (which is log-scale db). There is another instance where speed peaks correspond to changes in temperature, salinity and backscatter (peak 5). Near the end of the experiment at peak 7 again a velocity peak coincided with a change in backscatter, flow direction and salinity suggesting an entirely new water mass was moving by. It is noteworthy that the 3-4-day trends are comparable between temperature and acoustic backscatter as the pre day 299 conditions give way to a decline in backscatter while temperatures rise steadily over days 299-302. After day 302 the trends in both temperature and backscatter remain flat. These periods also correspond to changes in the tidal structure with unidirectional flow prior to day 298 then transitioning (days 299-302) to steady back and forth tides (post day 301).
Examination of the frequency structure of the forcing flow and responding timeseries (backscatter and temperature) provides clues as to the nature of the mechanics (Figure 8). The measurable current meter energy spectrum is constrained to lower frequencies with much of the spectrum above 50 cpd, implying that the variations seen in temperature and backscatter are not driven by large scale advection. The temperature spectrum (from the sensor within the supercooled upper ocean) broadly conforms to three sections, the upper and lower of which both follow a f -5/3 slope consistent with an isotropic turbulent cascade. However, this is interrupted with a band between 20-80 cpd (marker c in Figure 8 i.e. 20-70 min) suggesting some intervening process that is higher in frequency than the diurnal tide. Similarly, the echo sounder spectrum can be broken into several components. Between the tidal frequency and 100 cpd (marker a i.e. 15 min) the slope is less than unity. Beyond this the slope is much steeper, with a local peak at 60 cpd (marker b i.e. 24 min). This could either indicate enhanced energy in this range, or that the vertical averaging serves to dampen higher frequencies.
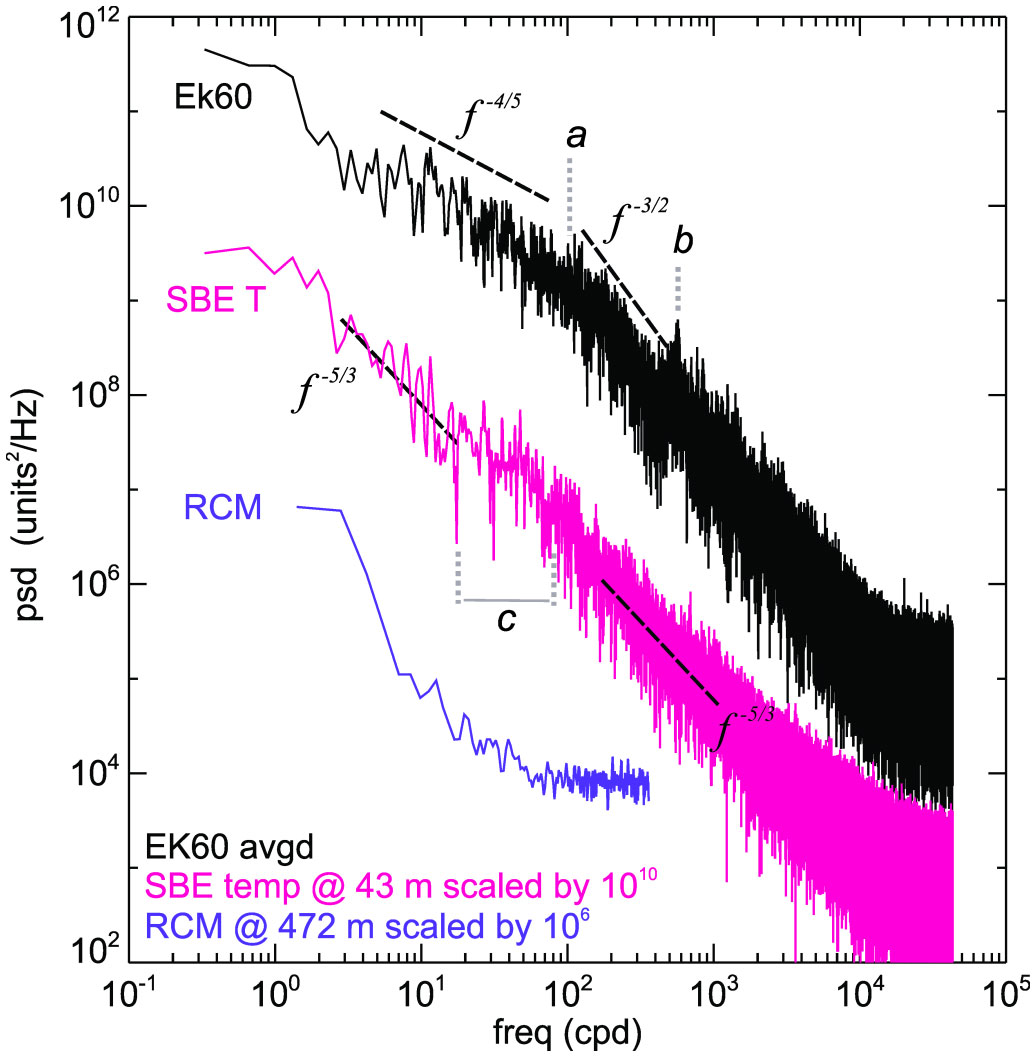
Figure 8 Frequency distributions displayed using apparent power spectral densities showing the vertically averaged acoustic backscatter (EK60), the temperature at 43 m and the current speed at 472 m. The spectra are scaled to sit close by one another. Indicative frequency slopes and annotation are discussed in the text.
Considering a convective turbulent velocity scale of u*=5 mm s-1 (as implied by observed ε where u* is derived from the observed dissipation rate by assuming ε~u*3/h) cycling over a surface layer of 50 m suggests a turnover time of around 3 hours (8 cpd). This suggests the variability we are seeing is happening relatively quickly compared to the mechanical operation of the upper layer. Conversely, the variations in background signal amplitude seen in Figures 7B, C occur around 10 s intervals so around 9000 cpd. These sit well into the high frequency tail of the spectrum (Figure 8). Another scale of variability that will be apparent, at least close to the surface, is the SIPL underside which exhibits around a 2-5 m undulation wavelength (Figure 6B). Horizontal flow interacting with these undulations will appear as a peak in the frequency spectrum. In the case of a hypothetical horizontal flow of 0.1 m s-1 (based on Figure 4A) implies a peak at around 20 s period (i.e. 4320 cpd). This peak would not be consistent in terms of frequency as implied by Figure 4A and so would contribute to the high frequency content of the spectrum above around 600 cpd (line b in Figure 8).
3.3 Boundary-layer structure and turbulence
The time-averaged temperature and salinity profiles (over around 48 hours) supported the structure from the CTD profile of a homogeneous water column (Figure 3). The averages revealed an apparent warm, salty layer in the 5 m just beneath the SIPL although this layer is not apparent in all individual profiles. The temperature effect on stability is almost passive in this temperature range and so does not compensate for the observed salinity increase and so the upper 15 m, on-average, is weakly unstable. It is possible that the near-SIPL instability is an effect of the ice hole, but the water in the hole itself is stabilised with much fresher water and it is not clear how rapid response sensors would register any false salinity readings. In addition, equivalent conditions have been observed just beneath the SIPL elsewhere (Robinson et al., 2014). The VMP profiles revealed mostly good quality turbulent spectra (Figure 9) allowing for reliable estimation of ε which provides insight into the dynamics of the vertical structure of suspended crystals (Figure 10). A time-averaged profile of turbulent dissipation rate ε (Figure 10B) is dominated by the higher values but generates a smooth profile, the bulk of which is comparable to a scaling argument for ε based on the characteristic turbulence velocity scale u* and the distance from the boundary (z) so that ε=u*3/(Kz), where K is von Kármán’s constant ~0.41. However, this fit works best beneath the upper layer (i.e. deeper than 10 m).
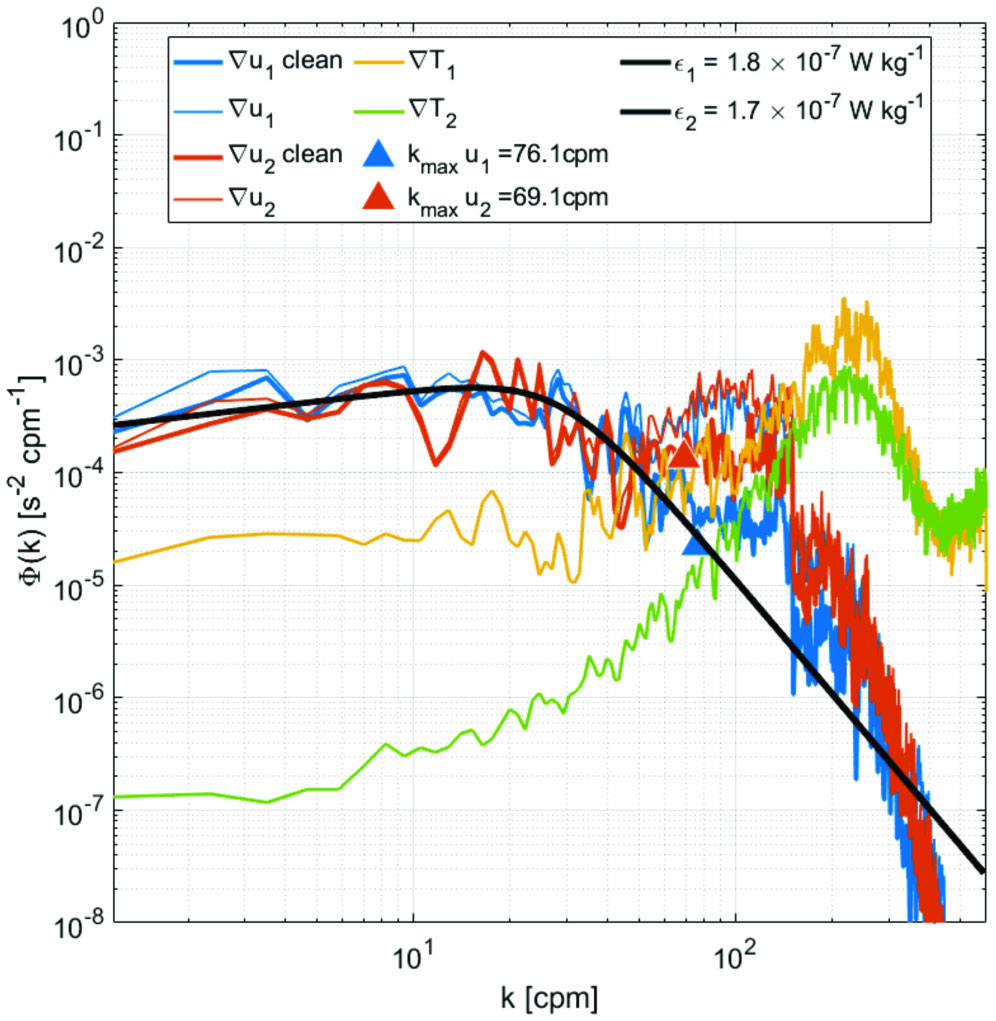
Figure 9 VMP microstructure example spectra showing temperature gradient (∇T1,2) and microscale velocity shear (∇u1,2) where the thin and thick lines show raw and filtered response. The black line is modelled energy spectra distribution for ε=1.6-1.7x10⁻⁷ W kg-1. The signal to the right of the triangles is amplified noise (Wolk et al., 2002).
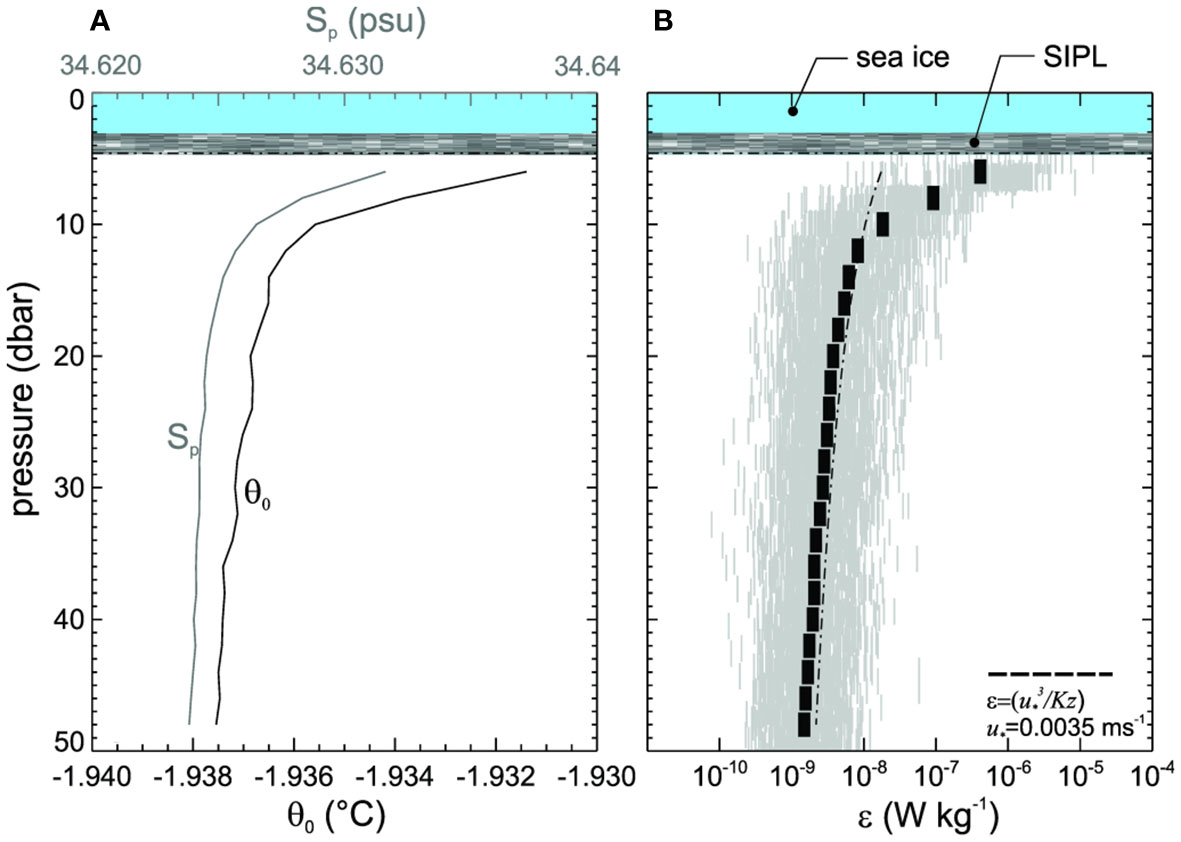
Figure 10 Averaged microstructure profile data over the top 50 m showing (A) time-averaged potential temperature (θ0) and salinity (Sp) and (B) time-averaged turbulence dissipation rate, the individual samples and the shear-only scaling for ε. Both panels include the sea ice beneath hydrostatic zero and SIPL.
4 Discussion
The observations (summarised in the sketches of Figure 11) combine to show relatively large ice crystals being entrained in a turbulent boundary-layer. Figure 11 illustrates the crystals being influenced not only by the shear- induced stirring but by convection, possibly induced by brine rejection. This boundary layer interaction process operates within the context of the cavity exchange with the coastal ocean and accompanying sea ice growth and decay. The sketches also represent the unique aspects of the observation region with the presence of the dirty ice of the McMurdo Ice Shelf system. This Discussion focuses around key questions relating to the presence of the crystals, their behaviour in the boundary layer and the implications for regional ice-ocean connections.
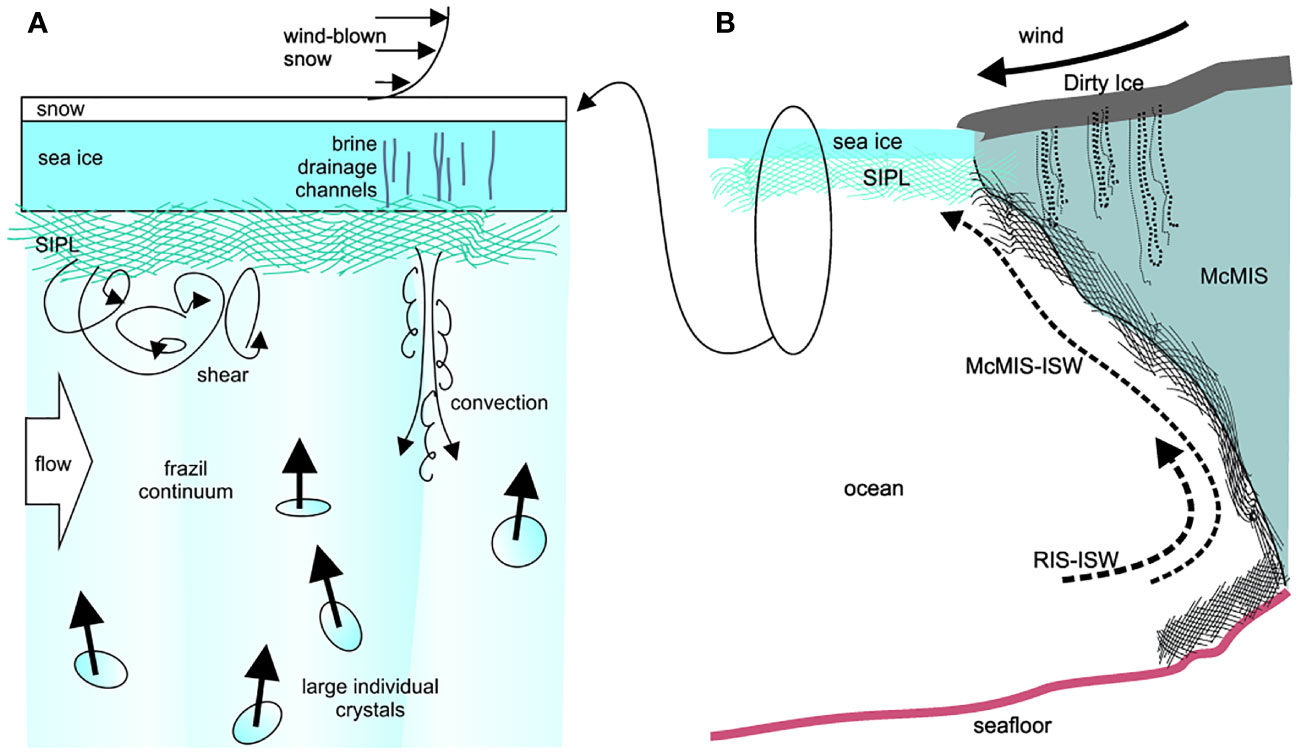
Figure 11 (A) Ice/SIPL/Ocean boundary layer structure showing crystals rising through the boundary layer processes. (B) Elevation sketch of the ISW plumes from the McMurdo and Ross cavities and how they might interact with a sea ice system.
4.1 Presence of large suspended crystals?
The crystal size measurement methodology focuses on the large structural material found in the SIPL. It does not capture the much smaller, presumably more typical <1 mm crystals (e.g. Frazer et al., 2020), nor is it a direct measurement of what is in suspension. However, it is clear that large crystals can exist in suspension as we observed them visually (Supplementary Videos 1, 2) and buoyancy means they must be a source for the SIPL. It remains uncertain as to what proportion of the large crystals extracted from the SIPL underside had grown in situ vs directly deposited. Given that they were barely amalgamated (c.f. the “loose” platelets of Arndt et al., 2020) it seems possible that they are recent large arrivals. In addition, it seems implausible that large crystals would couple within the boundary layer as this coupling would have to counter turbulent shear, and if it did succeed, would generate an even higher rise velocity.
As Hoppmann et al. (2020) explains, the understanding of the initiation of crystal formation is not yet well established. Generally, active acoustic probing provides a useful tool to interpret suspended particle dynamics. Away from ice shelves it is usual to relate acoustic backscatter to a combination of individual highly mobile biological targets and a background continuum signal. In the open or coastal ocean these usually relate to different species scales or suspended sediment. In such situations, fish and large zooplankton present as individual targets whilst the phytoplankton or sediment form a background continuum signal. The conditions in the present data suggest there is a high probability that the majority of our observed discrete targets are suspended platelet crystals and that buoyancy requires they form at depth and are not grown from surface-induced processes.
In the present sub-ice situation, the acoustic backscatter data falls into three categories – (1) rare large, bright individual backscatter, (ii) medium scale “less-bright” individual backscatter targets and (iii) a slowly varying background field. The Frazer et al. (2020) observations took place nearby (in a different year) and used four separate acoustic frequencies including one matching the present EK60. The nature of the ISW outflow is not consistent from year to year. In the present context they primarily captured the background field, as the majority of their crystals were estimated to be around 1 mm in scale and any large crystals would have been removed by the processing. Video observations and complex target behaviour support the contention that the majority of rare very “bright” individual targets were fauna – ranging from fish, fish schools through to seals. However, it was far more common to observe a hybrid of the 2nd and 3rd conditions whereby the sampled field consisted of many less-bright, but still clearly individual, signals against a coherent background field.
Laboratory and numerical work demonstrate that buoyant disks rotate so that their flat face is roughly horizontal although in some circumstances it is possible for an oblique equilibrium to exist which might be the cause of some of the horizontal motion observed here (Fabre et al., 2012). Furthermore, the behaviour of rising disks can be connected back to the initial conditions, suggesting attention be paid to the spontaneous growth from a very small nucleus (Daly, 1984; Tchoufag et al., 2014). Assuming the freshwater results of McFarlane et al. (2014) provide a minimum rise velocity (i.e. here we expect greater buoyancy difference between crystal and saltwater) then their results for non-vertical disks suggests vertical crystal velocity wc=αd (with dimensional coefficient α=1 s-1, at least for diameter d<6 mm, where the one-to-one equivalence has no dynamic significance). Rees Jones and Wells (2018) use one of the faster rise rates from the same set of results which is applicable to smaller crystal sizes (e.g. none of which conforms to the drag based estimates described in Daly, 1984) whereas Matsumura and Ohshima (2015) use a fixed rise rate of 1 mm s-1, again for small crystals.
Production of crystals at depth and its subsequent integration into sea ice is a key step in the formation of the SIPL (Hoppmann et al., 2015; Hunkeler et al., 2015). This has several implications, the most important being an alternate pathway for platelet arrival and structuring of the SIPL. If they arrive essentially mature at the ~5 cm scale, this is very different to arriving at the 1 mm scale and then growing (Dempsey et al., 2010) and the categories of backscatter described earlier suggest both happen. The issue of orientation suggests that the arrival velocity will be slower than if they were to rise in some other orientation with a reduced drag profile. Thus, there may be a correlation between rise speed and packing in the SIPL. Potentially this alignment relates to the large-scale variability seen in Figure 6C whereby large parts of the domain change backscatter, but individual scatterers are clearly seen through the transition. In other words, horizontal flow is slow, yet the scattering still changes as crystals re-orientate themselves within the sensing volume.
The influence of suspended crystals can be represented in larger-scale models such as Kim et al. (2006) and Roach et al. (2018). However, it will require some local-scale mechanics. For example, Dempsey et al. (2010) and Wongpan et al. (2015) simulate this aggregation by injecting a continuous flux of crystals from the ocean at the same time as recording (i) the rate at which the sea ice incorporation front moves downward and (ii) below this front but still within the SIPL, crystals continue to grow. In their approach, they maintain different size classes for the deposited systems as opposed to those floating up from below. This implies that there is an ability for the rising crystals to fill in the interstices of the SIPL, reducing the void fraction. This is a point made by Dempsey et al. (2010) who quantified the flux rate of 4 mm diameter platelets required to grow the observed sea ice to be of order 106 crystals m-2 d-1.
The growth to the large, suspended crystals also means that the brine rejection will happen essentially within the upper ocean layer as well at the sea ice underside. This affects the upper layer turbulence and entrainment. In turn, this influences the persistence and fate of the ISW plume. This shifts the buoyancy flux inherent in the energy conversion from a boundary process to what is effectively an “internal buoyancy source”.
4.2 Crystal behaviour in the turbulent under-ice boundary-layer
It is useful to compare vertical rise rate of crystals wc with turbulent mixing in the water column. The present profiler-resolved dissipation rates are comparable with Fer and Widell (2007) data from beneath Arctic Sea ice in a fjord. However, while both studies observed turbulent energy dissipation rates in the range ε=10-7 to 10-6 W kg-1, their results were from a faster-moving water column. It would appear the rougher ice underside here increases the turbulence to provide apparent matching conditions. In the upper water column (5-10 m), the dissipation rate is an order of magnitude, or more, greater than the value expected if we match the deeper ε. One hypothesis is that we are seeing brine rejection and associated enhanced turbulence. Regardless, the ε provides a dynamic context for considering how the suspended platelet crystals behave. The associated turbulent velocity scale u* is a combination of convection-induced turbulence and drag-induced stirring. Observations of boundary-layers beneath platelet ice have suggested that the drag coefficient is a factor of 6-30 times larger than might be expected for a smooth, melting ice surface (Robinson et al., 2017). This reinforces the apparent paradox that melting ice (the shelf basal underside) produces re-freezing that then affects how the entire system circulates. A key knowledge gap highlighted then is the under-shelf mixing in the basal melt layer. This will influence not only the sub-shelf re-freezing but the amount of supercooled water being ejected into the sea ice system.
Fer et al. (2012) observed crystal-laden water emerge from beneath the Brunt Ice Shelf into an ocean with 3 m thick fast ice. They did not observe an unstable temperature-salinity structure, but this may be due to sampling differences when working from a ship and through a larger hole. They did observe an increase in ε when supercooling conditions occurred, reaching around 5x10⁻⁷ W kg-1 when temperatures fell to 30 mK below surface freezing. They attributed the increase in turbulence to being due to crystal formation and rise. Conditions were comparable to that observed here with flow speeds reaching 0.15 m s-1. They too observed ice-related increase in 75 kHz ADCP backscatter although the resolution is much coarser than possible with dedicated echo sounders.
Mean stratification in the present 2015 K131 work is very weak in the upper 50 m so diffusion in this layer (thickness h) is estimated as Kv≈u*h where u* is derived from the observed dissipation rate by assuming ε=u*3/h. Given the Kv model of redistribution of material in the vertical, the relative influence of sinking (or rising) compared to the turbulent influence may be gauged using a turbulent particle Péclet Number (O'Brien et al., 2003) Pet=wc/u*. which compares the rise speed to turbulence intensity (c.f. Gopalan et al., 2008 who produced similar scaling for oil droplets but different to Daly, 1984 who used a molecular diffusion equivalent). Large Pet implies particle buoyancy dominates over turbulence so that in the absence of growth, Pet>>1 indicates that settlement outstrips the redistribution through turbulence. On the other hand, Pet<1 describes where the crystals are continually being redistributed throughout the water column regardless of their intrinsic rise speed (c.f. Rees Jones and Wells, 2018 frazil “explosion”). Dissipation rates in the range ε=10-7 to 10-6 W kg-1 over a vertical scale of 10 m results in an estimate of u*≈ 0.01-0.02 m s-1 which is larger than both the average and maximum observed rise rates and suggests a small apparent Pet. Placing the combined upper ocean turbulence and crystal size data in this Pet context (Figure 12), it appears that the average crystals and turbulence conditions result in a situation where the rise speed should more than exceed turbulence motions. However, considering the regime of smaller crystals in more turbulent conditions, then the ε would be comparable. Notably, all of the continuum crystals observed by Frazer et al. (2020) fall to the far left (small crystal diameter) of the Pet domain.
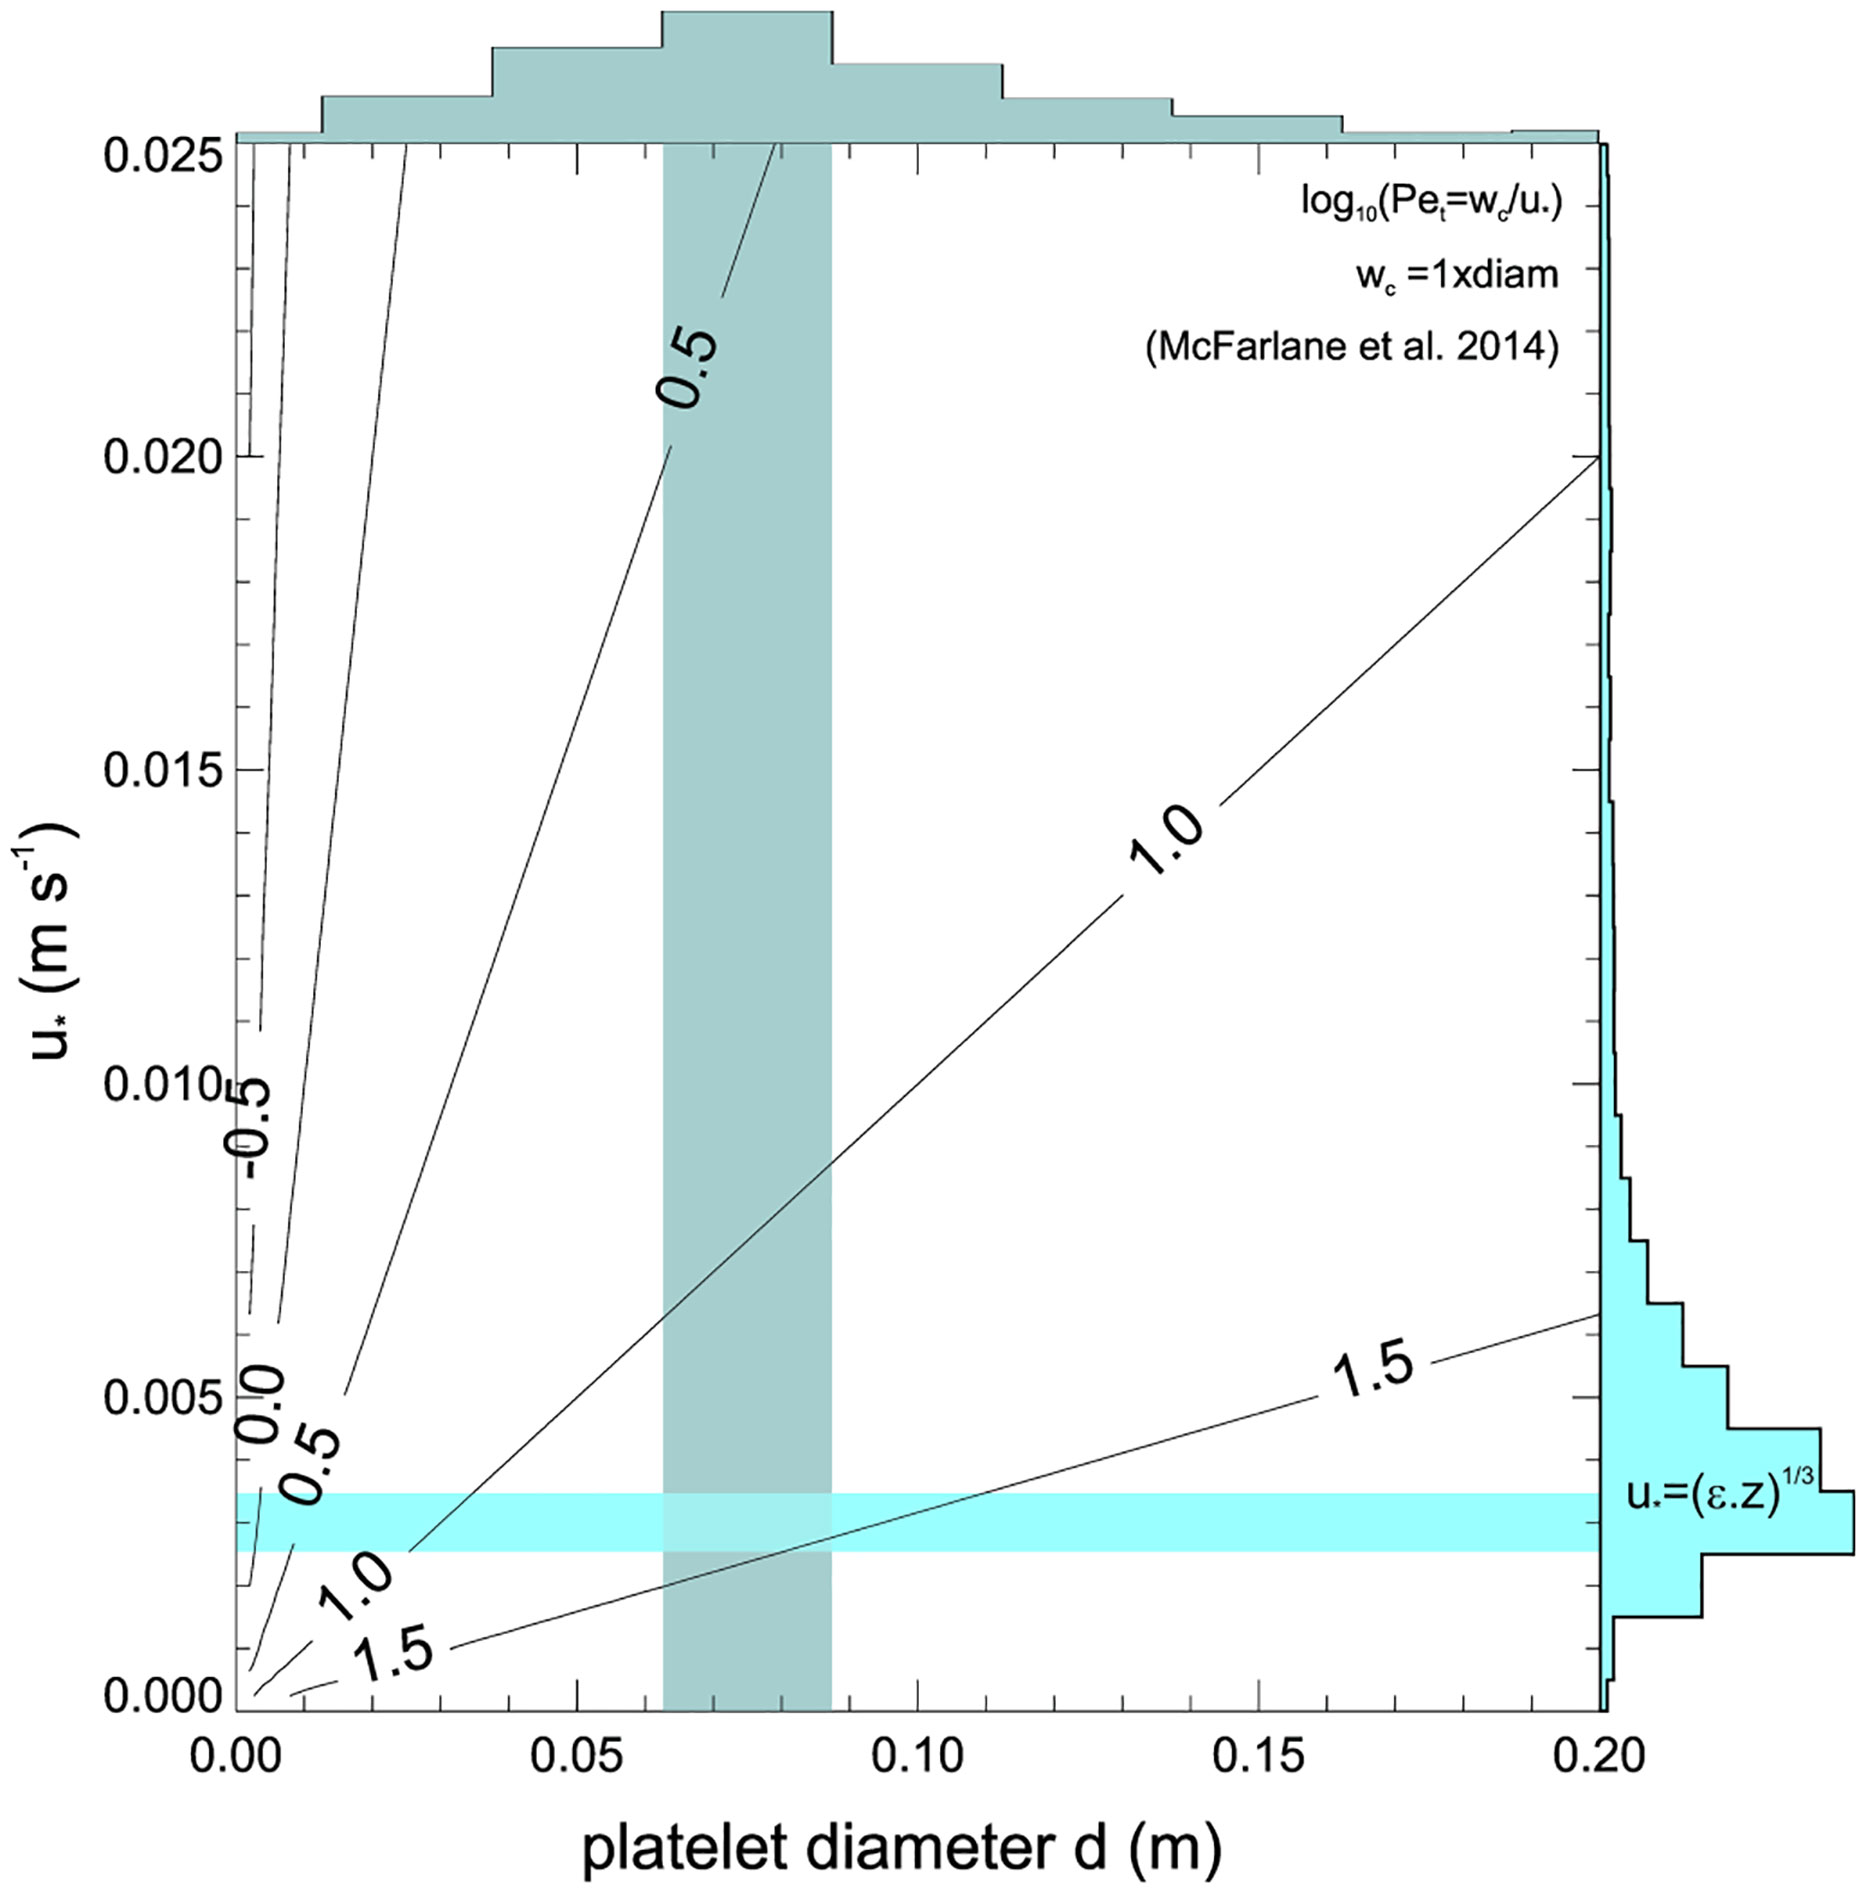
Figure 12 Variation of log10(Pet) as a function of platelet size (i.e. diameter) and boundary layer turbulent velocity scale u* showing approximate distribution and location of present results. The key assumption here is that the rise speed scales with diameter (see text) based on freshwater results from McFarlane et al. (2014). The diameter distribution is taken from Figure 5 and the u* distribution is from Figure 10 assuming the velocity scales with (εz)1/3.
4.3 Regional implications of flow-crystal interaction?
Local datasets such as the present experiment need to be placed into regional and continent-wide perspectives. There is a clear regional bias due to the majority of data coming from only a few field locations (Hoppmann et al., 2020). Debenham’s comment about the region being the “strangest on the planet” suggests there may be some unique features that won’t be commonly found (Debenham, 1965). While he wrote this in 1965 when Antarctica was still very under-surveyed, it is not clear that there are many locations quite like the McMurdo Ice Shelf. It may well be that the crystals observed here occur nowhere else.
At the regional Southern McMurdo Sound scale, Grima et al. (2016) and Brett et al. (2020) surveyed the area of the present study using remote sensing instruments that can detect platelet-influenced sea ice. Their surveys supported the conclusions drawn from the in-situ sampling of Leonard et al., (2006) and Langhorne et al. (2015) that showed how platelet ice mirrored a likely outflow plume from the McMurdo/Ross ice shelf system’s western limit. More recent survey work of Brett et al. (2020) shows a striking similarity between SIPL and the location of the Dirty Ice. However, this also corresponds to where one would expect basal cavity outflow so supply of ISW is available (Hughes et al., 2014). Following this water north, a number of studies have concluded that the ice shelf water from the Ross/McMurdo system persists for a hundred or more km northward (Hughes et al., 2014; Robinson et al., 2014). The timescale for this transport is of the order of a month. These data make it clear that the variation in tides over this period will influence the crystal sedimentation budget. First, the data indicate that the buoyancy driven upper ocean residual flow is faster and more continual during neap tides (Figure 4 ). So paradoxically, the low flow conditions are only seen away from neap conditions. The lowering of the flow speed and hence boundary layer turbulence is a shift to higher turbulent Péclet number conditions (Figure 12 ) whereby that buoyancy dominates. Consequently, the critical phase for the SIPL is slack water during spring tides which will allow crystals to settle out. The implication then is that the critical property to assess is the timescale over which a newly settled crystal becomes locked into the SIPL and if it occurs before the reverse tidal flow sets in?
4.4 Concluding remarks
Colleoni et al. (2018) show that ice shelf-sea ice-ocean connections remain a major outstanding challenge in models operating at climate timescales. Modelling studies focusing at the regional ISW plume scale require more observational data and context (Chen et al., 2019). Incorporation of the processes described here into modelling that typically resolve scales around 2 km or greater will be a challenge. A starting point might be the role present large platelets play in the McMurdo Sound polynya formation (Dai et al., 2020). Water column evolution and sea ice formation in polynya are spatially constrained phenomena driven by short, high-energy wind events that then drive formation of new sea ice. This energy conversion will be influenced by the presence of ISW that will enhance the processes. It is the by-product of this sequence that generates high salinity shelf water that ultimately has a global thermohaline impact. As large-scale models seek to improve their representation of polynya that will need to better account for the nature of ice shelf water plumes. Similarly, the present data suggest that such large spatiotemporal representations will need to find ways of including the effects of tidal fluctuations in some integrated fashion.
The topic is clearly still in a discovery phase with many fundamental questions remaining unanswered. This work suggests research themes for understanding sea ice formation near ice shelves should focus on the role of convection driven by SIPL crystal growth in modifying the turbulence in the upper water column and the feedbacks to the turbulence. In addition, the possible links between availability of nucleating material, crystal production and contribution to sea ice formation need to be examined, especially as to how this might support the formation of large, suspended ice crystals in an upper ocean influenced by tidal variations at both diurnal and spring-neap timescales.
Data availability statement
The datasets presented in this study can be found in online repositories. The names of the repository/repositories and accession number(s) can be found below: Stevens Craig, Robinson Natalie, O’Connor Gabby, Grant Brett (2015). Ocean-ice data from an Antarctic ice shelf water plume flowing beneath land-fast sea ice. SEANOE https://www.seanoe.org/data/00792/90432/ https://doi.org/10.17882/90432.
Author contributions
CS conceived the experiment, led the sampling field expedition, analysis and writing. NR contributed to the experiment design, sampling protocol validation and writing, GO’C produced the crystal size data and imagery, and BG collected the timeseries data, developed and realised the video and sounder sampling methodology. All authors contributed to the article and approved the submitted version.
Funding
Funding was provided by the Royal Society of New Zealand Marsden Fund, NIWA Strategic Science Investment Funding, N.Z. Antarctic Research Institute, the Deep South National Science Challenge, and the New Zealand Ministry of Business, Innovation and Employment through the Antarctic SciencePlatform (ANTA1801).
Acknowledgments
We would like to acknowledge Professor Pat Langhorne for her leadership on the wider topic. Tim Haskell is thanked for his development of the K131 infrastructure program. We are grateful to Inga Smith, Pat Wongpan, Cecilia Bitz, Greg Leonard and Andrew Pauling for their assistance and insight. We thank the reviewers for their constructive efforts to improve the work. Antarctica New Zealand provided field support.
Conflict of interest
The authors declare that the research was conducted in the absence of any commercial or financial relationships that could be construed as a potential conflict of interest.
Publisher’s note
All claims expressed in this article are solely those of the authors and do not necessarily represent those of their affiliated organizations, or those of the publisher, the editors and the reviewers. Any product that may be evaluated in this article, or claim that may be made by its manufacturer, is not guaranteed or endorsed by the publisher.
Supplementary material
The Supplementary Material for this article can be found online at: https://www.frontiersin.org/articles/10.3389/fmars.2023.1103740/full#supplementary-material
References
Arndt S., Hoppmann M., Schmithüsen H., Fraser A. D., Nicolaus M. (2020). Seasonal and interannual variability of landfast sea ice in atka bay, weddell Sea, Antarctica, to appear in the cryosphere. 14, 2775–2793. doi: 10.5194/tc-14-2775-2020
Atkins C. B., Dunbar G. B. (2009). Aeolian sediment flux from sea ice into southern McMurdo sound, Antarctica. Global Planetary Change 69 (3), 133–141. doi: 10.1016/j.gloplacha.2009.04.006
Brett G. M., Irvin A., Rack W., Haas C., Langhorne P. J., Leonard G. H. (2020). Variability in the distribution of fast ice and the Sub-ice platelet layer near McMurdo ice shelf. J. Geophysical Research: Oceans 125 (3), e2019JC015678. doi: 10.1029/2019JC015678
Campbell I. B., Claridge G. G. C. (2003). “Thermokarst landforms in the transantarctic mountains region of Antarctica,” in Proceedings of the eighth international conference on permafrost (Lisse, The Netherlands: Balkema), 21–25.
Cheng C., Jenkins A., Holland P., Wang Z., Liu C., Xia R. (2019). Responses of sub-ice platelet layer thickening rate and frazil-ice concentration to variations in ice-shelf water supercooling in McMurdo sound, Antarctica. Cryosphere 13, 265–280, 2019. doi: 10.5194/tc-13-265-201
Christensen M., Nilsson A. E. (2017). Arctic Sea ice and the communication of climate change. Popular Communication 15 (4), 249–268. doi: 10.1080/15405702.2017.1376064
Colleoni F., De Santis L., Siddoway C. S., Bergamasco A., Golledge N.R., Lohmann G, et al. (2018). Spatio-temporal variability of processes across Antarctic ice-bed–ocean interfaces. Nat. Commun. 9, 2289. doi: 10.1038/s41467-018-04583-0
Dai L., Xie H., Ackley S. F., Mestas-Nuñez A. M. (2020). Ice production in Ross Ice shelf polynyas during 2017–2018 from sentinel–1 SAR images. Remote Sens. 12 (9), 1484. doi: 10.3390/rs12091484
Daly S. F. (1984). Frazil ice dynamics (No. CRREL-MONO-84-1) (Hanover NH: Cold Regions Research and Engineering Lab.). Available at: https://apps.dtic.mil/dtic/tr/fulltext/u2/a142037.pdf.
Debenham F. (1965). The genesis of the McMurdo ice shelf, Antarctica. J. Glaciology 5 (42), 829–832. doi: 10.1017/S0022143000018888
Dempsey D. E., Langhorne P. J., Robinson N. J., Williams M. J. M., Haskell T. G., Frew R. D. (2010). Observation and modeling of platelet ice fabric in McMurdo sound, Antarctica. J. Geophysical Research: Oceans 115 (C1). doi: 10.1029/2008JC005264
Fabre D., Tchoufag J., Magnaudet J. (2012). The steady oblique path of buoyancy-driven disks and spheres. J. Fluid Mechanics 707, 24–36. doi: 10.1017/jfm.2012.231
Fer I., Makinson K., Nicholls K. (2012). Observations of thermohaline convection adjacent to Brunt Ice Shelf. J. Phys. Oceanogr. 42, 502–508. doi: 10.1175/JPO-D-11-0211.1
Fer I., Widell K. (2007). Early spring turbulent mixing in an ice-covered Arctic fjord during transition to melting. Continental Shelf Res. 27 (15), 1980–1999. doi: 10.1016/j.csr.2007.04.003
Frazer E. K., Langhorne P. J., Leonard G. H., Robinson N. J., Schumayer D. (2020). Observations of the size distribution of frazil ice in an ice shelf water plume, geophys. Res. Lett., e2020GL090498. doi: 10.1029/2020GL090498
Gopalan B., Malkiel E., Katz J. (2008). Experimental investigation of turbulent diffusion of slightly buoyant droplets in locally isotropic turbulence. Phys. Fluids 20 (9), 095102. doi: 10.1063/1.2969470
Grima C., Greenbaum J. S., Lopez Garcia E. J., Soderlund K. M., Rosales A., Blankenship D. D., et al. (2016). Radar detection of the brine extent at McMurdo Ice Shelf, Antarctica, and its control by snow accumulation. Geophysical Res. Lett. 43 (13), 7011–7018. doi: 10.1002/2016GL069524
Hewitt I. J. (2020). Subglacial plumes. Annual Review of Fluid Mechanics 52, 145–169. doi: 10.1146/annurev-fluid-010719-060252
Holland P. R., Feltham D. L., Jenkins A. (2007). Ice shelf water plume flow beneath Filchner-Ronne Ice Shelf, Antarctica. J. Geophys. Res. 112, C05044. doi: 10.1029/2006JC003915
Hoppmann M., Nicolaus M., Paul S., Hunkeler P. A., Heinemann G., Willmes S., et al. (2015). Ice platelets below Weddell Sea landfast sea ice. Ann. Glaciology 56 (69), 175. doi: 10.3189/2015AoG69A678
Hoppmann M., Richter M. E., Smith I. J., Jendersie S., Langhorne P. J., Thomas D. N., et al. (2020). Platelet ice, the Southern Ocean’s hidden ice: a review. Ann. Glaciology 61 (83), 341–368. doi: 10.1017/aog.2020.54
Hughes K. G., Langhorne P. J., Leonard G. H., Stevens C. L. (2014). Extension of an ice shelf water plume model beneath sea ice with application in McMurdo Sound, Antarctica. J. Geophys. Res. Oceans, 119, 8662–8687. doi: 10.1002/2013JC009411
Hunkeler P., Hendricks S., Hoppmann M., Paul S., Gerdes R. (2015). Towards an estimation of sub-sea-ice platelet-layer volume with multi-frequency electromagnetic induction sounding. Ann. Glaciology 56 (69), 137–146. doi: 10.3189/2015AoG69A705
Jenkins A., Bombosch A. (1995). Modeling the effects of frazil ice crystals on the dynamics and thermodynamics of ice shelf water plumes. J. Geophysical Research: Oceans 100 (C4), 6967–6981. doi: 10.1029/94JC03227
Jordan J. R., Kimura S., Holland P. R., Jenkins A., Piggott M. D. (2015). On the conditional frazil ice instability in seawater. J. Phys. Oceanogr 45, 1121–1138. doi: 10.1175/JPO-D-14-0159.1
Kim J. G., Hunke E. C., Lipscomb W. H. (2006). Sensitivity analysis and parameter tuning scheme for global sea-ice modeling. Ocean Model. 14 (1), 61–80. doi: 10.1016/j.ocemod.2006.03.003
Kusahara K. (2020). Interannual-to-multidecadal responses of antarctic ice shelf–ocean interaction and coastal water masses during the twentieth century and the early twenty-first century to dynamic and thermodynamic forcing. J. Climate 33 (12), 4941–4973. doi: 10.1175/JCLI-D-19-0659.1
Langhorne P. J., Hughes K. G., Gough A. J., Smith I. J., Williams M. J. M., Robinson N. J., et al. (2015). Observed platelet ice distributions in Antarctic sea ice: An index for ocean-ice shelf heat flux. Geophysical Res. Lett. 42 (13), 5442–5451. doi: 10.1002/2015GL064508
Leonard G. H., Purdie C. R., Langhorne P. J., Haskell T. G., Williams M. J. M., Frew R. D. (2006). Observations of platelet ice growth and oceanographic conditions during the winter of 2003 in McMurdo Sound, Antarctica. J. Geophys. Res. 111, C04012. doi: 10.1029/2005JC002952
Ludescher J., Yuan N., Bunde A. (2019). Detecting the statistical significance of the trends in the Antarctic sea ice extent: an indication for a turning point. Climate Dynamics 53 (1-2), 237–244. doi: 10.1007/s00382-018-4579-3
MacAyeal D. R. (1985). Evolution of tidally triggered meltwater plumes below ice shelves. Oceanology Antarctic continental shelf 43, 133–143. doi: 10.1029/AR043p0133
Mahoney A. R., Gough A. J., Langhorne P. J., Robinson N. J., Stevens C. L., Williams M. M. J., et al. (2011). The seasonal appearance of ice shelf water in coastal Antarctica and its effect on sea ice growth. J. Geophys. Res. 116, C11032. doi: 10.1029/2011JC007060
Matsumura Y., Ohshima K. I. (2015). Lagrangian Modelling of frazil ice in the ocean. Ann. Glaciology 56 (69), 373–382. doi: 10.3189/2015AoG69A657
McFarlane V., Loewen M., Hicks F. (2014). Laboratory measurements of the rise velocity of frazil ice particles. Cold Regions Sci. Technol. 106, 120–130. doi: 10.1016/j.coldregions.2014.06.009
McPhee M. G., Stevens C. L., Smith I. J., Robinson N. J. (2016). Platelet growth in supercooled water limited by ocean heat transfer. Ocean Sci. 12, 507–515. doi: 10.5194/osd-12-2807-2015
Moorman R., Morrison A. K., McC. Hogg A. (2020). Thermal responses to Antarctic ice shelf melt in an eddy-rich global ocean–sea ice model. J. Climate 33 (15), 6599–6620. doi: 10.1175/JCLI-D-19-0846.1
Natarajan R., Acrivos A. (1993). The instability of the steady flow past spheres and disks. J. Fluid Mechanics 254, 323–344. doi: 10.1017/S0022112093002150
O'Brien K. R., Ivey G. N., Hamilton D. P., Waite A. M., Visser P. M. (2003). Simple mixing criteria for the growth of negatively buoyant phytoplankton. Limnology Oceanography 48 (3), 1326–1337. doi: 10.4319/lo.2003.48.3.1326
Penrose J. D., Conde M., Pauly T. J. (1994). Acoustic detection of ice crystals in Antarctic waters. J. Geophys. Res. 99 (C6), 12 573–12 580. doi: 10.1029/93JC03507
Rees Jones D. W., Wells A. J. (2018). Frazil-ice growth rate and dynamics in mixed layers and sub-ice-shelf plumes. Cryosphere 12, 25–38. doi: 10.5194/tc-12-25-2018
Rignot E., Jacobs S., Mouginot J., Scheuchl B. (2013). Ice-shelf melting around Antarctica. Science 341 (6143), 266–270. doi: 10.1126/science.1235798
Roach L. A., Dean S. M., Renwick J. A. (2018). Consistent biases in Antarctic sea ice concentration simulated by climate models. Cryosphere 12, 365–383. doi: 10.5194/tc-12-365-2018
Robertson R., Padman L., Levine M. D. (1995). Fine structure, microstructure, and vertical mixing processes in the upper ocean in the western Weddell Sea. J. Geophysical Research: Oceans 100 (C9), 18517–18535. doi: 10.1029/95JC01742
Robinson N. J., Stevens C. L., McPhee M. G. (2017). Observations of amplified roughness from crystal accretion in the sub-ice ocean boundary layer. Geophysical Res. Lett. 44, 1814–1822. doi: 10.1002/2016GL071491
Robinson N. J., Stevens C. L., Stewart C. L., Williams M. J. M., Grant B. S. (2020). Oceanographic observations in supercooled water: Protocols for mitigation of measurement errors in profiling and moored experiments. Cold Regions Sci. Technol. 170, 102954. doi: 10.1016/j.coldregions.2019.102954
Robinson N. J., Williams M. J. M., Stevens C. L., Langhorne P. J., Haskell T. G. (2014). Evolution of a supercooled ice shelf water plume with an actively growing subice platelet matrix. J. Geophys. Res. Oceans 119, 3425–3446. doi: 10.1002/2013JC009399
Smedsrud L. H., Jenkins A. (2004). Frazil ice formation in an ice shelf water plume. J. Geophysical Research: Oceans 109, C03025. doi: 10.1029/2003JC001851
Smith I. J., Langhorne P. J., Haskell T. G., Trodahl H. J., Frew R. D., Vennell R. M. (2001). Platelet ice and the land-fast sea ice of McMurdo Sound, Antarctica. Ann. Glaciology 33, 21–27. doi: 10.3189/172756401781818365
Stevens C., Hulbe C., Brewer M., Stewart C., Robinson N., Ohneiser C., et al. (2020). Ocean mixing and heat transport processes observed under the Ross Ice Shelf control its basal melting. Proc. Natl. Acad. Sci. 117 (29), 16799–16804. doi: 10.1073/pnas.1910760117
Stevens C. L., Langhorne P. J., Robinson N. J. (2018). K131 Antarctic sea ice science: A case study of infrastructure, strategies, and skills. New Z. Sci. Rev. 74, 66–72.
Stevens C. L., Robinson N. J., Williams M. J. M., Haskell T. G. (2009). Observations of turbulence beneath sea ice in southern McMurdo Sound, Antarctica. Ocean Sci. 5, 435–445. doi: 10.5194/os-5-435-2009
Tchoufag J., Fabre D., Magnaudet J. (2014). Global linear stability analysis of the wake and path of buoyancy-driven disks and thin cylinders. J. Fluid Mechanics 740, 278–311. doi: 10.1017/jfm.2013.642
Wolk F., Yamazaki H., Seuront L., Lueck R. G. (2002). A new free-fall profiler for measuring biophysical microstructure. J. Atmospheric Oceanic Technol. 19 (5), 780–793. doi: 10.1175/1520-0426(2002)019<0780:ANFFPF>2.0.CO;2
Keywords: ice shelf water (ISW), frazil ice, turbulent boundary layer, Antarctica, fast ice formation, shear microstructure, supercool seawater
Citation: Stevens C, Robinson N, O’Connor G and Grant B (2023) Ocean turbulent boundary-layer influence on ice crystal behaviour beneath fast ice in an Antarctic ice shelf water plume: The “dirty ice”. Front. Mar. Sci. 10:1103740. doi: 10.3389/fmars.2023.1103740
Received: 20 November 2022; Accepted: 06 February 2023;
Published: 23 February 2023.
Edited by:
Leandro Ponsoni, Flanders Marine Institute, BelgiumReviewed by:
Pierre-Vincent Huot, Faculty of Sciences, KU Leuven, BelgiumJim Jordan, Université libre de Bruxelles, Belgium
Copyright © 2023 Stevens, Robinson, O’Connor and Grant. This is an open-access article distributed under the terms of the Creative Commons Attribution License (CC BY). The use, distribution or reproduction in other forums is permitted, provided the original author(s) and the copyright owner(s) are credited and that the original publication in this journal is cited, in accordance with accepted academic practice. No use, distribution or reproduction is permitted which does not comply with these terms.
*Correspondence: Craig Stevens, Y3JhaWcuc3RldmVuc0BuaXdhLmNvLm56