 Michelle M. McClure1,2*
 Melissa A. Haltuch1†
 Ellen Willis-Norton3
 David D. Huff1
 Elliott L. Hazen4Lisa G. Crozier1
 Michael G. Jacox4,5Mark W. Nelson6
 Kelly S. Andrews1
 Lewis A.K. Barnett7,8,9
 Aaron M. Berger1Sabrina Beyer3,10Joe Bizzarro10,11
 David Boughton10
 Jason M. Cope1
 Mark Carr3
 Heidi Dewar12
 Edward Dick10
 Emmanis Dorval12
 Jason Dunham13Vladlena Gertseva1
 Correigh M. Greene1Richard G. Gustafson1Owen S. Hamel1
 Chris J. Harvey1
 Mark J. Henderson14,15Chris E. Jordan1
 Isaac C. Kaplan1
 Steven T. Lindley10
 Nathan J. Mantua10
 Sean E. Matson16Melissa H. Monk10Peter Moyle17Colin Nicol18,19
 John Pohl1
 Ryan R. Rykaczewski20
 Jameal F. Samhouri1Susan Sogard10
 Nick Tolimieri1
 John Wallace1
 Chantel Wetzel1
 Steven J. Bograd4,11
- 1Northwest Fisheries Science Center, National Oceanic and Atmospheric Administration, National Marine Fisheries Service (NOAA NMFS), Seattle, WA, United States
- 2National Oceanic and Atmospheric Administration (NOAA) Pacific Marine Environmental Laboratory, Seattle, WA, United States
- 3Department of Ecology and Evolutionary Biology, University of California Santa Cruz, Santa Cruz, CA, United States
- 4Environmental Research Division, Southwest Fisheries Science Center, National Oceanic and Atmospheric Administration, National Marine Fisheries Service (NOAA NMFS), Monterey, CA, United States
- 5Physical Sciences Laboratory, National Oceanic and Atmospheric Administration, Oceanic and Atmospheric Research (NOAA OAR), Boulder, CO, United States
- 6ECS Federal, Inc., under contract for National Oceanic and Atmospheric Administration, National Marine Fisheries Service (NOAA NMFS) Office of Science and Technology, Silver Spring, MD, United States
- 7School of Aquatic & Fishery Sciences, University of Washington, Seattle, WA, United States
- 8Visiting Scientist at Northwest Fisheries Science Center, National Oceanic and Atmospheric Administration, National Marine Fisheries Service (NOAA NMFS), Seattle, WA, United States
- 9Alaska Fisheries Science Center, National Oceanic and Atmospheric Administration, National Marine Fisheries Service (NOAA NMFS), Seattle, WA, United States
- 10Southwest Fisheries Science Center, National Oceanic and Atmospheric Administration, National Marine Fisheries Service (NOAA NMFS), Santa Cruz, CA, United States
- 11Institute of Marine Science, University of California (UC), Santa Cruz, Santa Cruz, CA, United States
- 12Southwest Fisheries Science Center, National Oceanic and Atmospheric Administration, National Marine Fisheries Service (NOAA NMFS), La Jolla, CA, United States
- 13U.S. Geological Survey, Forest and Rangeland Ecosystem Science Center, Corvallis, OR, United States
- 14U.S. Geological Survey, California Cooperative Fish and Wildlife Research Unit, Department of Fisheries Biology, California State Polytechnic University Humboldt, Arcata, CA, United States
- 15U.S. Geological Survey, Vermont Cooperative Fish and Wildlife Research Unit, Rubenstein School of Environment and Natural Resources, University of Vermont, Burlington, VT, United States
- 16National Oceanic and Atmospheric Administration, National Marine Fisheries Service (NOAA NMFS) West Coast Region, Seattle, WA, United States
- 17Center for Watershed Sciences, University of California, Davis, CA, United States
- 18Ocean Associates, under contract to the Northwest Fisheries Science Center, National Marine Fisheries Service, National Oceanic and Atmospheric Administration (NOAA), Seattle, WA, United States
- 19PACE Engineering, Seattle, WA, United States
- 20Pacific Islands Fisheries Science Center, National Marine Fisheries Service, National Oceanic and Atmospheric Administration (NOAA), Honolulu, HI, United States
Introduction: Understanding how abundance, productivity and distribution of individual species may respond to climate change is a critical first step towards anticipating alterations in marine ecosystem structure and function, as well as developing strategies to adapt to the full range of potential changes.
Methods: This study applies the NOAA (National Oceanic and Atmospheric Administration) Fisheries Climate Vulnerability Assessment method to 64 federally-managed species in the California Current Large Marine Ecosystem to assess their vulnerability to climate change, where vulnerability is a function of a species’ exposure to environmental change and its biological sensitivity to a set of environmental conditions, which includes components of its resiliency and adaptive capacity to respond to these new conditions.
Results: Overall, two-thirds of the species were judged to have Moderate or greater vulnerability to climate change, and only one species was anticipated to have a positive response. Species classified as Highly or Very Highly vulnerable share one or more characteristics including: 1) having complex life histories that utilize a wide range of freshwater and marine habitats; 2) having habitat specialization, particularly for areas that are likely to experience increased hypoxia; 3) having long lifespans and low population growth rates; and/or 4) being of high commercial value combined with impacts from non-climate stressors such as anthropogenic habitat degradation. Species with Low or Moderate vulnerability are either habitat generalists, occupy deep-water habitats or are highly mobile and likely to shift their ranges.
Discussion: As climate-related changes intensify, this work provides key information for both scientists and managers as they address the long-term sustainability of fisheries in the region. This information can inform near-term advice for prioritizing species-level data collection and research on climate impacts, help managers to determine when and where a precautionary approach might be warranted, in harvest or other management decisions, and help identify habitats or life history stages that might be especially effective to protect or restore.
1 Introduction
Physical changes in the world’s oceans, driven by increasing carbon dioxide in the atmosphere, are already causing changes in the distribution and abundance of marine species (Poloczanska et al., 2016; Thorson et al., 2016; Pinsky et al., 2020a; Pinsky et al., 2020b). Globally, centers of distribution for fish species are expected to shift on average approximately 30 to 59 km per decade (Cheung et al., 2009; Poloczanska et al., 2013), assuming fish are able to track changing conditions. Although it is difficult to attribute species’ movements solely to changes in temperature, half of fish species in the North Sea with defined range limits have already shifted their range boundary with warming, and all but one of those shifts have been poleward (Perry et al., 2005). Likewise, many groundfish species throughout North American waters have changed their distributions in recent decades (Pinsky et al., 2013; Thorson et al., 2016). For example, in the Bering Sea, range extensions up to 98 km/decade have been observed for demersal fish and invertebrates (Poloczanska et al., 2016).
In addition to range shifts, increasing temperatures, pH, and other physical changes in the ocean are likely to lead to changes in productivity, mortality, or other vital rates that will impact abundance and biomass. In fact, abundance and biomass changes attributed to climate change have already been observed from phytoplankton and fish to marine mammals, sharks, and seabirds (Doney et al., 2012; Poloczanska et al., 2016). For example, primary productivity has increased in high latitudes and decreased in low/mid latitudes due to changes in nutrient supply attributable to sea ice changes, warming, and enhanced stratification (IPCC, 2019). At higher trophic levels, a decline in the weight-at-age of North Atlantic Cod (Gadus morhua) stocks was correlated with an increase in temperature from 1980 to 1992; this reduction resulted in lower reproductive output and a subsequent biomass decline in the species (Brander, 2010). Marine systems are in the midst of substantive, multi-faceted restructuring across trophic levels, which may have broad-scale impacts on ecological communities and the fisheries dependent upon them.
Understanding how different species may respond to climate change in terms of abundance, productivity or distribution is a critical first step towards anticipating changes in marine ecosystem structure and function, as well as developing strategies to adapt to the full range of potential changes. Assessments of the benefits of incorporating climate change into ocean planning have shown this step substantially reduces societal risk (Pinsky et al., 2020a). Climate Vulnerability Assessment (CVA) is a tool to assess whether and how a species or group of species will respond to climate change.
The vulnerability of a species is a function of its exposure to relevant changes in the environment, its biological sensitivity to particular environmental conditions (e.g., the species’ thermal tolerance ranges), and its adaptive capacity to accommodate the environmental change (Williams et al., 2008; Johnson and Welch, 2010; Foden et al., 2013; Mamauag et al., 2013; Pacifici et al., 2015; Stortini et al., 2015; Hare et al., 2016; Wheatley et al., 2017). Species that are both highly sensitive to an environmental factor and exposed to significant changes in that factor score as more vulnerable to climate change effects. At the species level, this vulnerability can be assessed quantitatively with species distribution models or mechanistic population models linked to climate models, in order to project the effects of climate change on abundance and distribution (Pacifici et al., 2015). Unfortunately, these quantitative efforts generally cannot be applied simultaneously to a large suite of species without dramatically reducing the aspects of vulnerability to be considered because there remains a lack of scientific infrastructure and insufficient data or understanding for many species (e.g., Morley et al., 2018). Recently, NOAA (National Oceanic and Atmospheric Administration) Fisheries developed an expert-opinion, trait-based approach, first applied in the northeast U.S. region, to provide an ecosystem-wide assessment of climate vulnerability (Morrison et al., 2015; Hare et al., 2016).
Here, we apply this CVA approach to the California Current Large Marine Ecosystem (henceforth California Current LME or CCLME) (Figure 1). The CCLME is a highly productive Eastern Boundary Current system characterized by the slow, equatorward, surface flowing California Current and the deep poleward flowing California Undercurrent that extends from near the United States-Canadian border (49°N) to the southern tip of the Baja California peninsula in Mexico (23°N) (Bograd et al., 2016). The system owes its uncommonly high biological productivity to coastal upwelling, which brings nutrients to the surface, supporting intense primary production (Bakun, 1990) and large biomass at higher trophic levels. In 2019, this system supported commercial harvest in California, Oregon, and Washington of 1.2 billion pounds of fish and shellfish earning around $675 million (USD) in landings revenue (National Marine Fisheries Service, 2022).
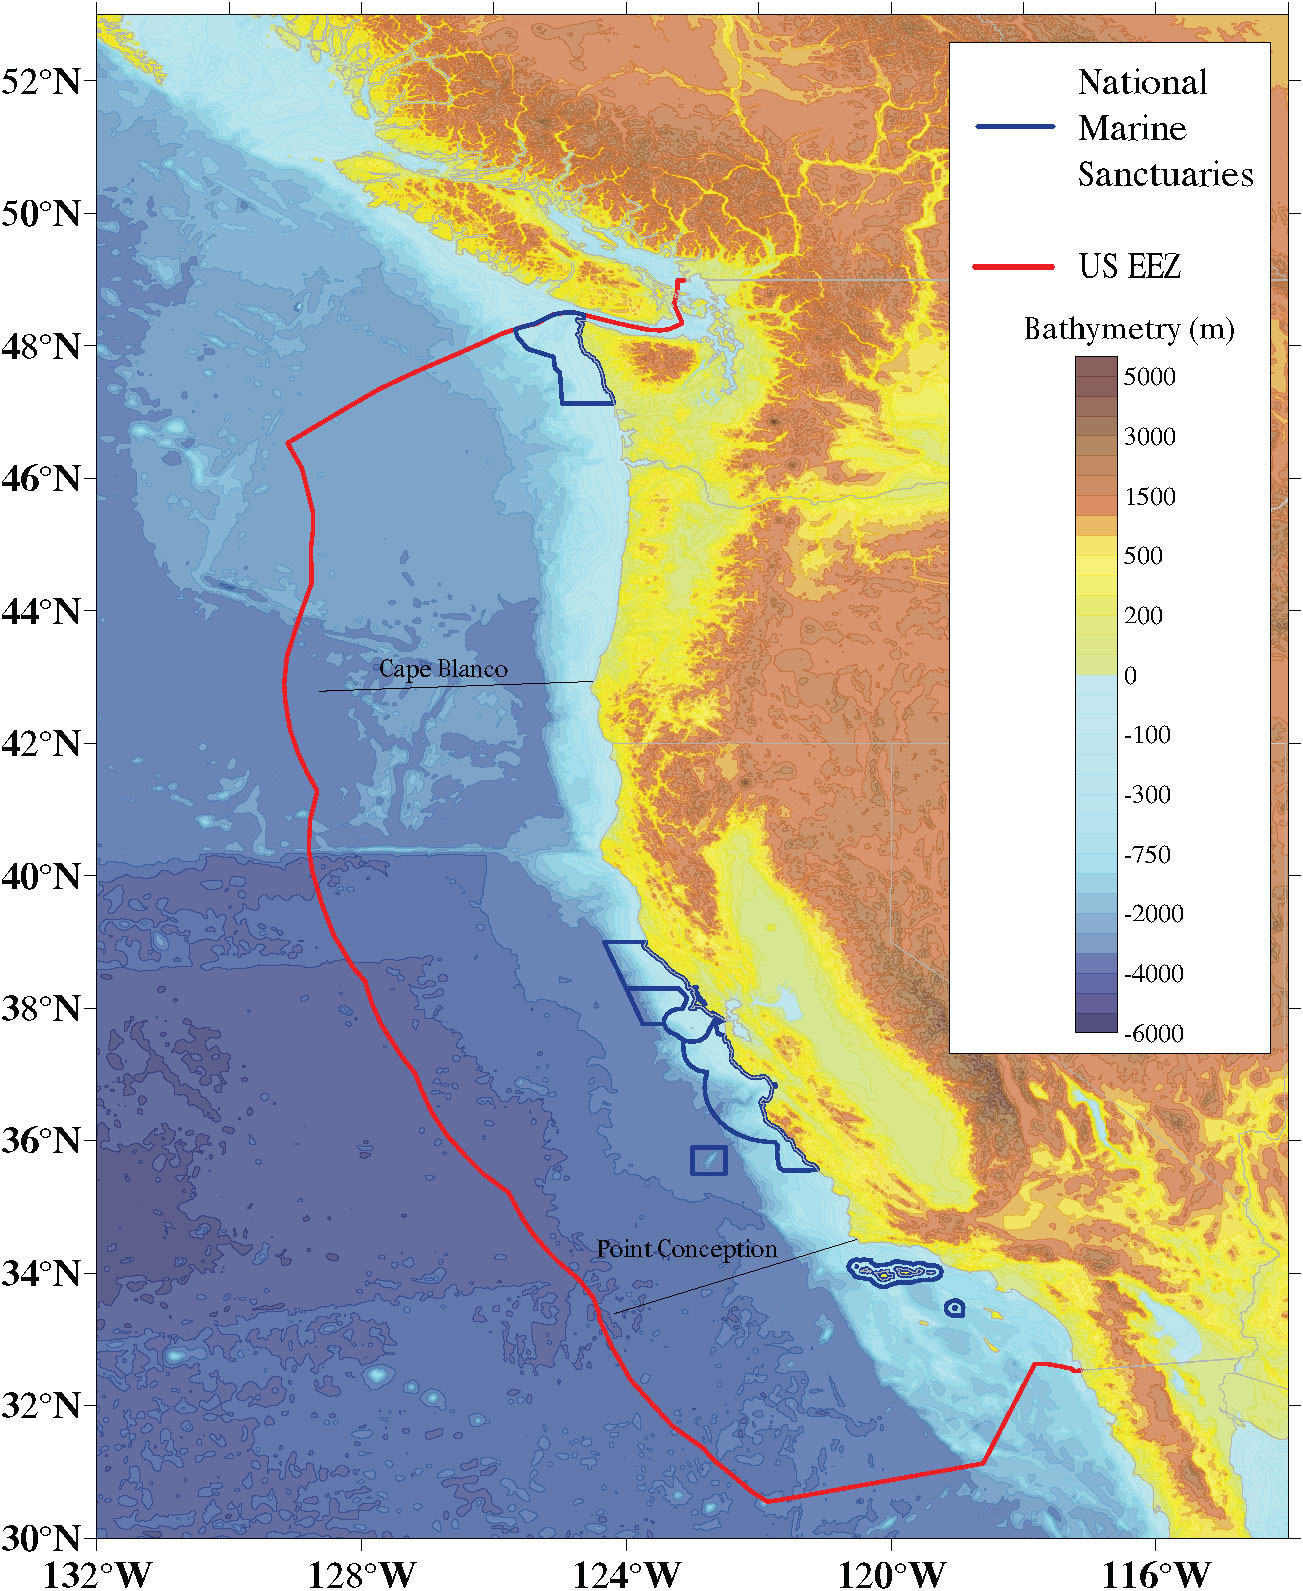
Figure 1 California Current Large Marine Ecosystem (CCLME). This study assessed species within U.S. borders only.
The effects of climate change are already being reported in the system. For example, zooplankton biomass in the southern California Current LME has declined dramatically over the past 60 years, attributed to a shift to smaller phytoplankton, causing a transition from pelagic tunicates to warm water lipid-poor copepods (Roemmich and McGowan, 1995; Lavaniegos and Ohman, 2003; Peterson and Schwing, 2003). Across many taxa, there has been increased abundance of warm-water species and decreased abundance of cold-water species in the region (Poloczanska et al., 2016), and shifts in the phenology or timing of reproduction for a number of species (Asch, 2015). Shifts in phenology can cause a mismatch between species and their prey (Cushing, 1990; Satterthwaite et al., 2014), thereby potentially impacting growth and survival. Ongoing changes in distribution and abundance of fish species may have a substantial impact on the California Current food-web as well as the U.S. West Coast fishing communities, the seafood industry, and statewide economies.
To provide foundational information for the future management of fish species in this system as well as identify key areas of future research, we conducted a CVA to: 1) characterize the relative vulnerability of 64 marine stocks managed for harvest or conservation purposes; 2) evaluate the likelihood that each species will substantially change its distribution based on its intrinsic biological and ecological attributes; 3) assess whether the net effect of climate change on each species is likely to be negative, neutral, or positive; and 4) evaluate the common drivers of vulnerability to climate change and probable distributional change. Such assessments of the fish stocks also can serve as the foundation of a more comprehensive assessment of the fisheries and communities dependent upon them (e.g. Wabnitz et al., 2018).
2 Methods
We applied the NOAA Fisheries Fish Stock Climate Vulnerability Assessment Methodology (Morrison et al., 2015), modified for the unique characteristics of the CCLME, to 64 species, most of which are managed under four Fishery Management Plans (FMPs) by the Pacific Fishery Management Council (PFMC, 2022a; PFMC, 2021; PFMC, 2022b; PFMC, 2022c).
2.1 Species selection
We selected species that encompassed the full range of higher taxa, life-history types, habitat associations, and management categories (highly protected to highly exploited). Because many species lack even the full complement of life history and other information needed for this CVA, we did limit the assessment to species with sufficient information to support evaluation based on the criteria we applied (Table 1). Many species that are infrequently targeted by fisheries lack life history information and a complete understanding of species distributions needed for CVAs. The 64 stocks encompass four functional groups corresponding to the Fishery Management Plans: Coastal and Pelagic Species (CPS) (7 species), Highly Migratory Species (HMS) (10 species), Anadromous Species (7 species), and Groundfish (40 species). Groundfish were further split into subgroups to reflect the range of life histories: Elasmobranchs (3 species), Rockfish (23 stocks), Flatfish (7 species), and Other Groundfish (7 species). The CPS group included one invertebrate, Market Squid (Doryteuthis opalescens), and the Anadromous Species included two species not included in a Fishery Management Plan, but listed as threatened under the U.S. Endangered Species Act and taken as bycatch in other fisheries: Southern Green Sturgeon (Acipenser medirostris) and Southern Eulachon (Thaleichthys pacificus) Distinct Population Segments. In two cases (both Puget Sound rockfish), a species was split into two distinct stocks based on understanding of distinct populations and distinct management units prior to the CVA. For simplicity, we use the term species to refer to both stocks and species in the rest of the paper.
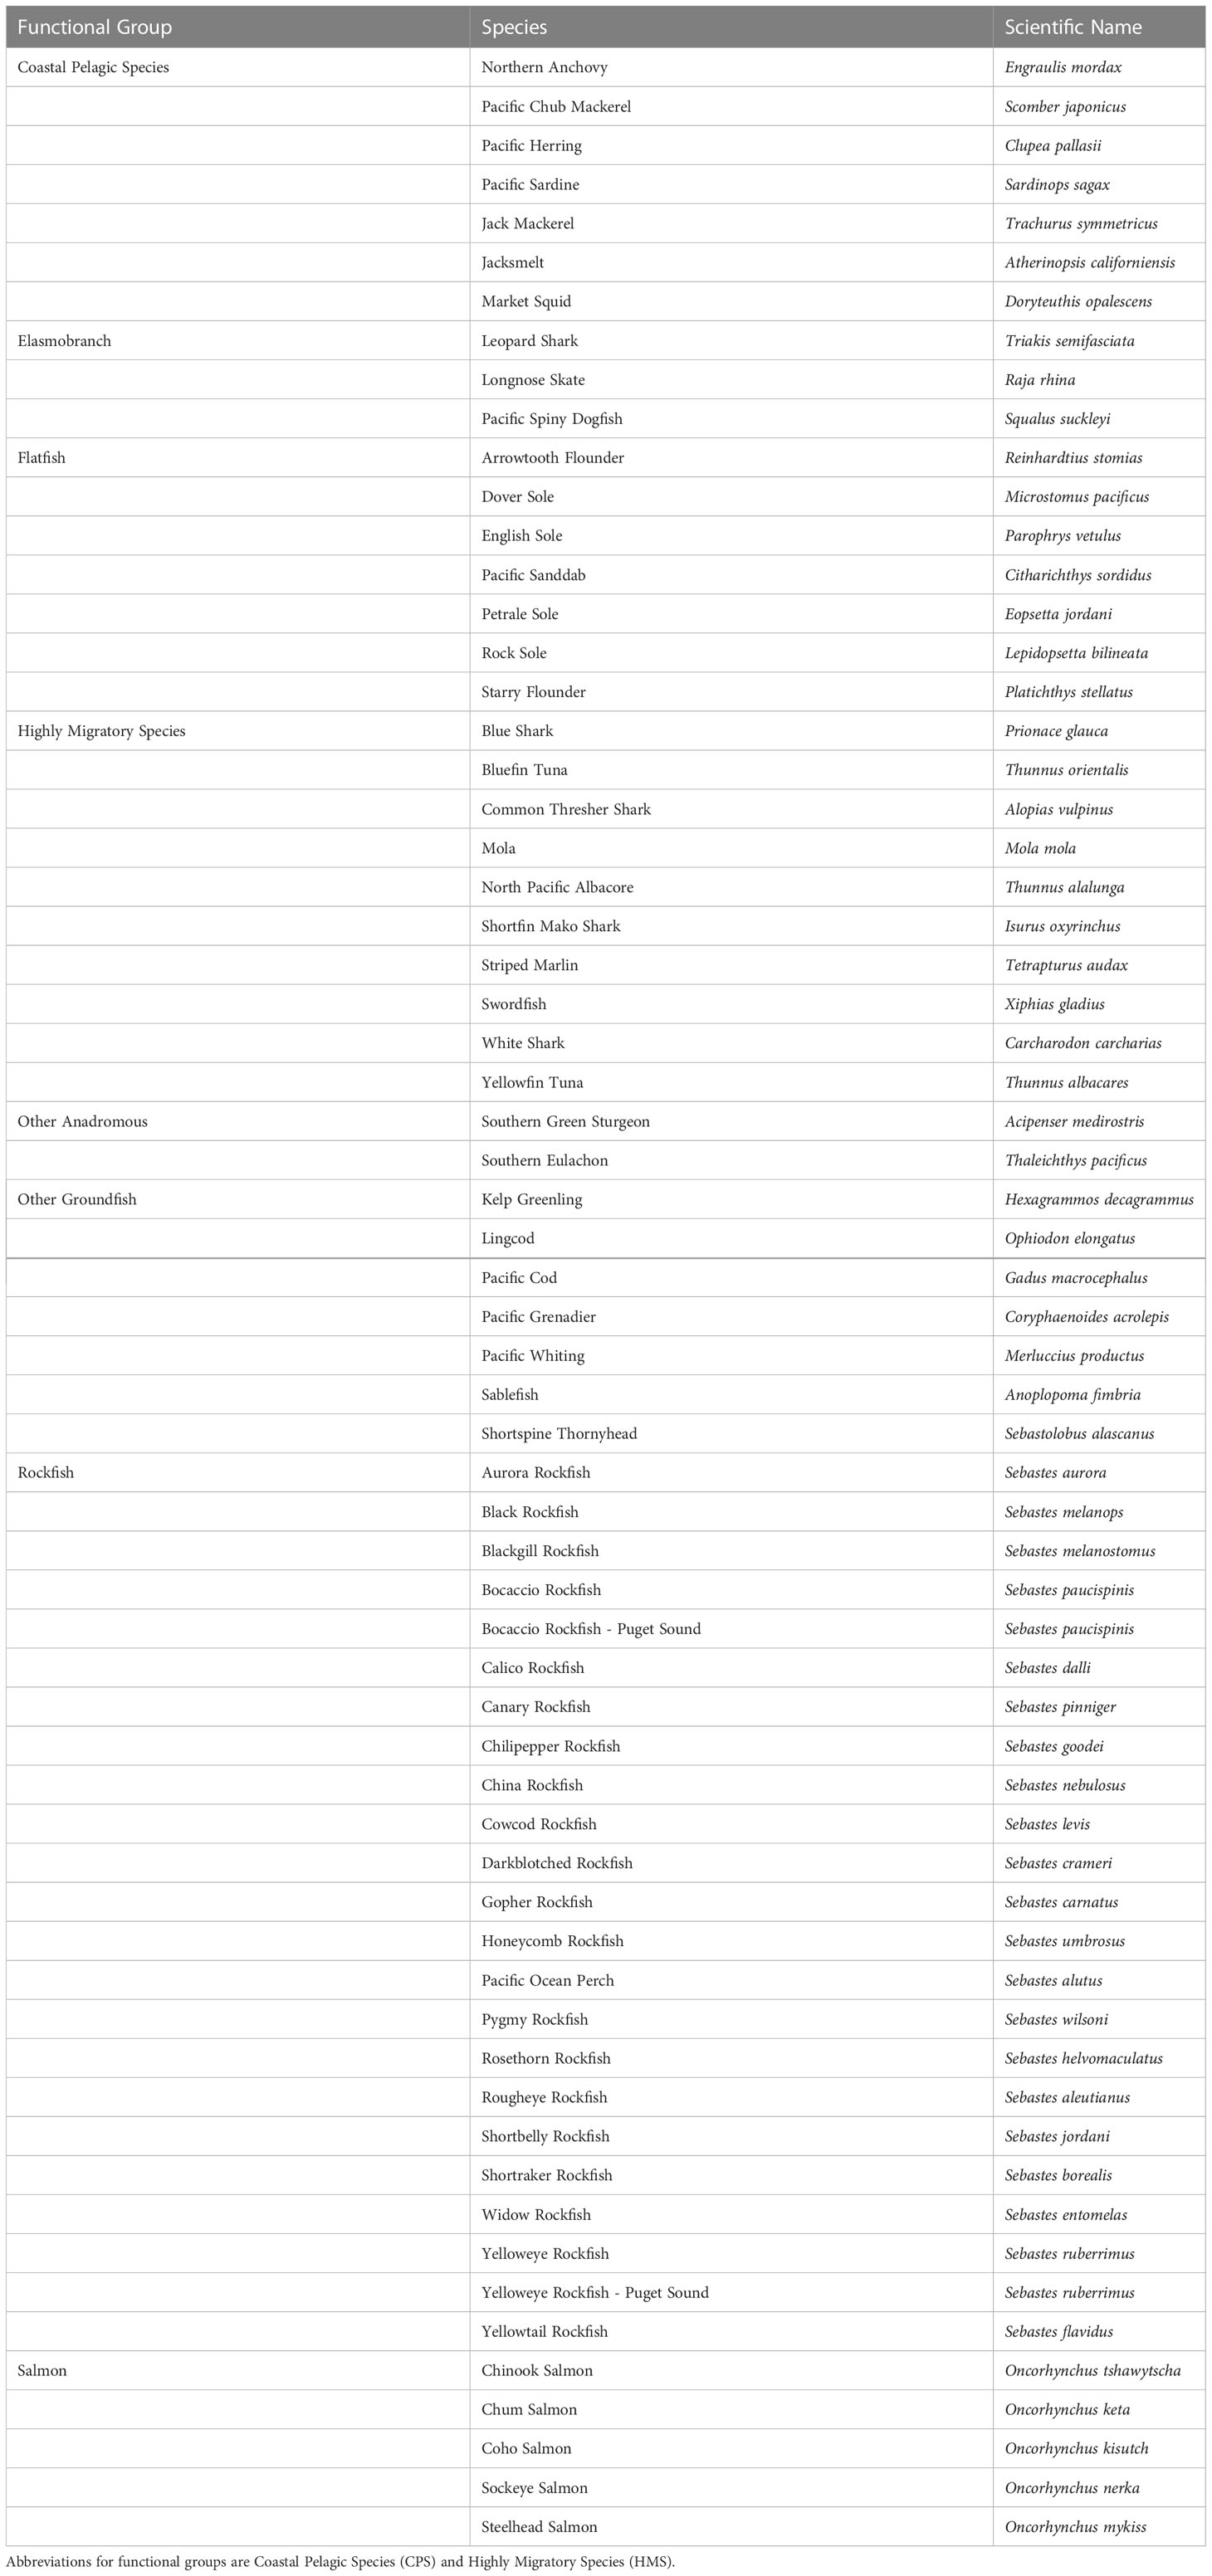
Table 1 List of species analyzed in this study.
Species were selected from the full range of latitudes and depths occupied by each functional group, as well as a wide range of life history patterns (Table 1). Species were also chosen to represent a diversity of exploitation levels, from highly targeted to not targeted (bycatch) to protected. For example, Mola (Mola mola), not included in a management plan, were selected because they are a common bycatch species in the California drift gillnet fishery (Hahlbeck et al., 2017).
Five of the six species of salmonids in the CCLME are included in our assessment: Chinook Salmon (Oncorhynchus tschawytscha), Sockeye Salmon (O. nerka), Chum Salmon (O. keta), Coho Salmon (O. kisutch), and steelhead (O. mykiss). Pink Salmon (O. gorbuscha) were not included because there are very few populations of this species in the region. Importantly, there are aspects of vulnerability that are particular to salmonid species. First, due to their anadromous life-histories, salmonids are subject to a variety of climatic influences in the freshwater stage (e.g., droughts and floods) that are not nearly as relevant for other marine species in this CVA (e.g., Hare et al., 2016; Crozier et al., 2019). Second, downscaled climate projections were available at much greater detail for the freshwater habitat used by these species (e.g., Isaak et al., 2016; Isaak et al., 2017). Finally, the five species included are largely managed at the finer level of Distinct Population Segments (DPS) under the Endangered Species Act (Waples, 1998). Here we assessed salmon at the species level, but a separate CVA was conducted at the DPS level for all six species, incorporating these additional factors (Crozier et al., 2019). The DPS-level assessment complements our species-level assessment by applying the same general methods at a finer geographic scale that is more useful for management within this functional group. This species-level assessment allows a direct comparison of salmon to the other functional groups of the CCLME.
2.2 Biological sensitivity factors
We used the same twelve biological and life history traits described in the NOAA methodology (Morrison et al., 2015; Hare et al., 2016) to determine the sensitivity of a species to climate change (Table 2). The stock size/status attribute was modified to use biomass reference points used for California Current stocks, rather than those used for stocks in other regions. These attributes reflect the major pathways by which changes in climate are likely to affect the productivity, distribution and abundance of marine species. Using the same biological attributes maintains consistency and comparability across regional CVAs. Species profiles, including information from the literature, were compiled to provide scorers with information about each of these sensitivity attributes (Supplementary Material 1).
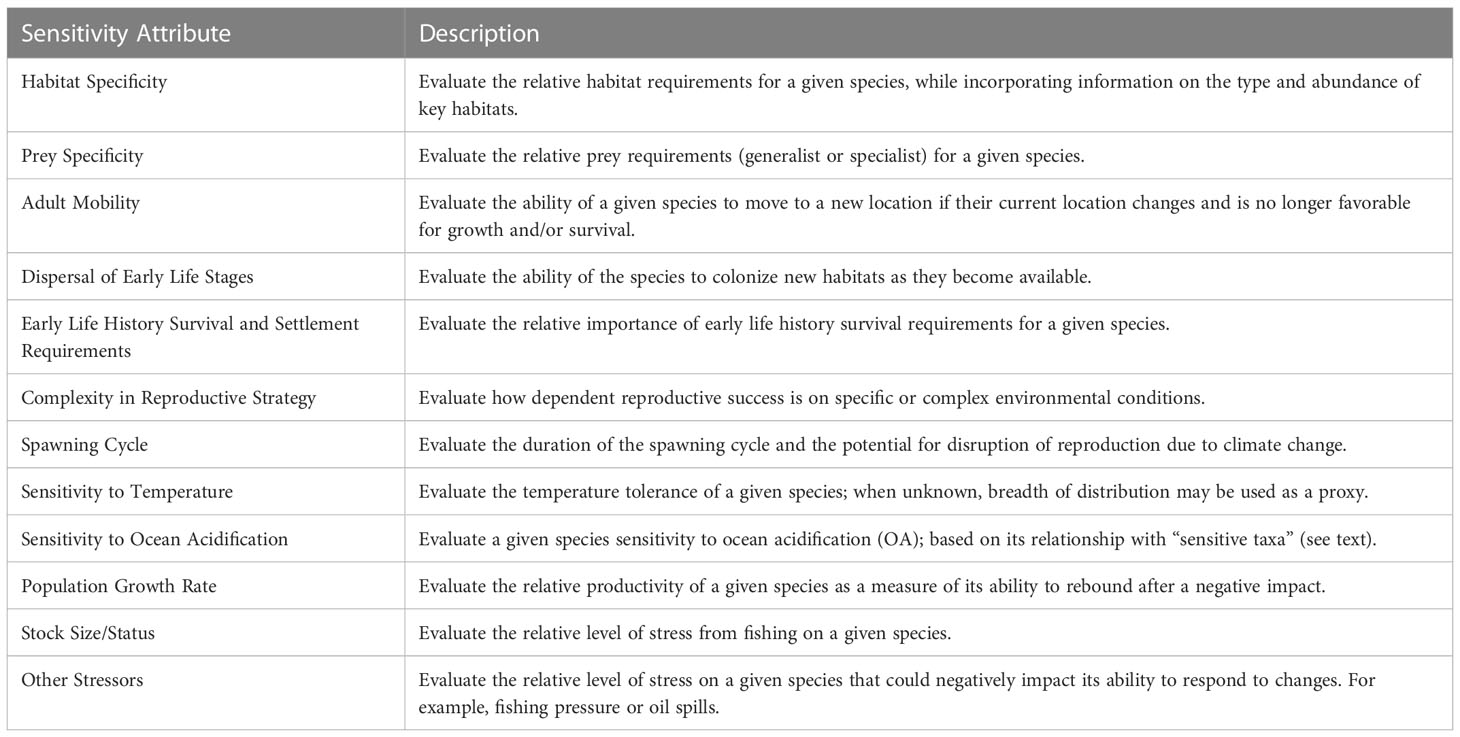
Table 2 List of the twelve sensitivity attributes used in this study (from Morrison et al., 2015).
2.3 Climate exposure factors
We used nine exposure factors to gauge the magnitude of change in the physical environment within a species’ range (Table 3). These were based on those identified in the Northeast CVA (Hare et al., 2016), with some modifications for the CCLME. Specifically, we did not include projected changes in temperature variance because, unlike in the North Atlantic, the northeast Pacific is projected to have no significant change in sea surface temperature (SST) variance (Alexander et al., 2018). In addition, because upwelling is such a critical driver of productivity in the system, we also incorporated changes in the strength and timing of upwelling-favorable winds into our analysis.
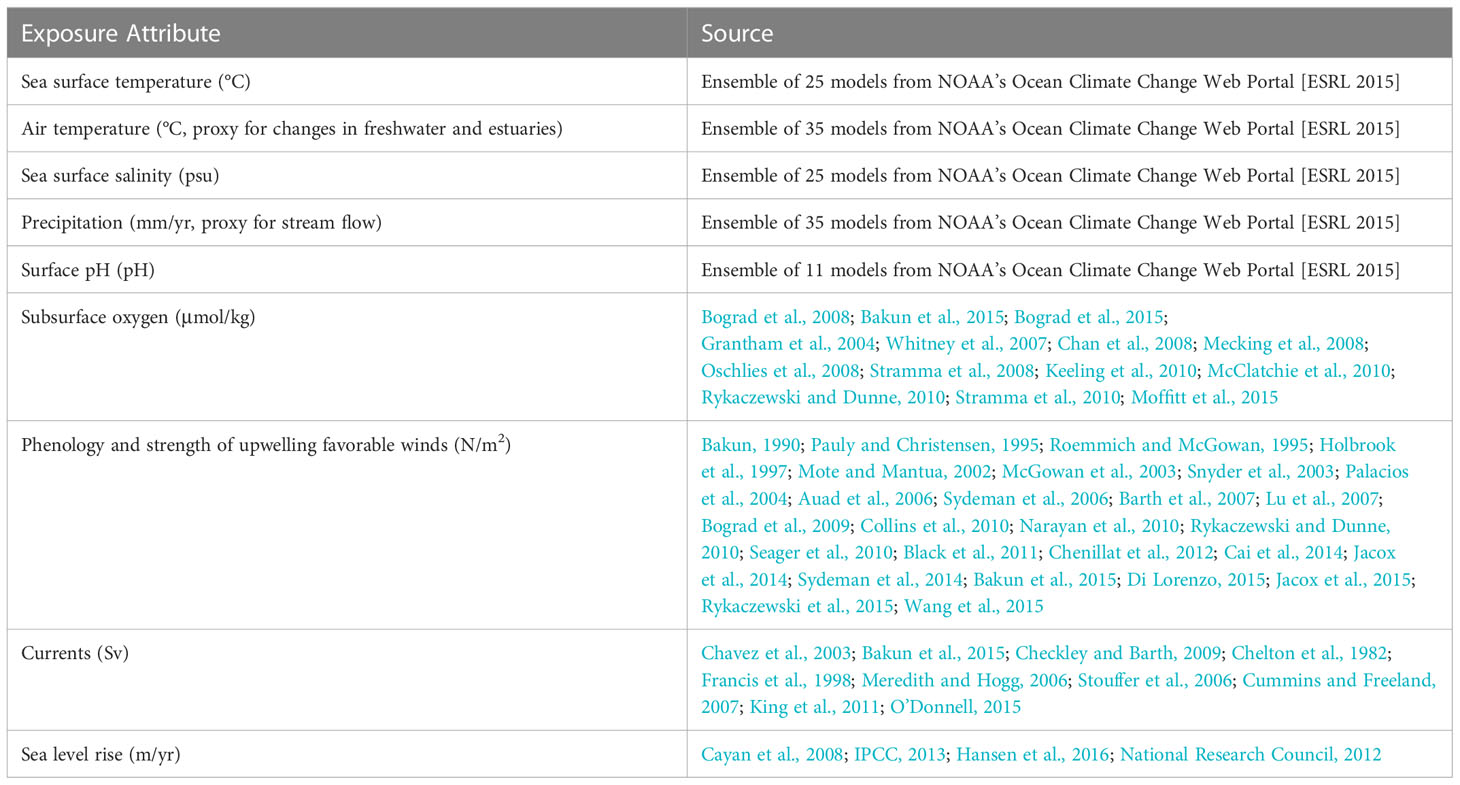
Table 3 Exposure factorss used in this climate vulnerability assessment.
For six exposure factors (Table 3), we were able to obtain quantitative measures of projected changes from Global Climate Models (GCM). We downloaded projections of SST, air temperature, salinity, and precipitation from an ensemble of 25 to 35 GCMs that contributed to phase 5 of the Coupled Model Intercomparison Project (CMIP5) (Supplementary Material 2) run with RCP 8.5 (the high emissions scenario) from NOAA’s Ocean Climate Change Web Portal (Scott et al., 2016). While this scenario has been criticized as less likely than others (Hausfather and Peters, 2020), there will be little difference if using RCP 4.5 since our analysis spans 2006-2055, and emissions scenarios do not diverge greatly until later in the century. We maintained the RCP 8.5 scenario for consistency with previous NOAA-led CVAs. Air temperature and precipitation projections were only used to assess climate exposure for salmonids, since they are the only species directly affected by these parameters. We also obtained projected pH from the eleven models that included this variable. We then calculated standardized change as the difference between the mean climate in the future (2006-2055) and the mean climate of the historical period (1955-2005), normalized by the historical interannual standard deviation. Normalizing the data scaled the projected change to the observed variability. So, for example, the impact of a 2°C temperature increase was considered 10-times greater in an ecosystem with 0.1°C inter-annual standard deviation than in one with a 1°C standard deviation. This in turn, meant that the metric was scaled in terms of the species’ realized niche over the period 1955-2005 (Tewksbury et al., 2008; Sunday et al., 2011). We also calculated the change in variance by dividing the variance of the future (2006-2055) by the variance of the past (1956-2005). The GCM ensemble output was mapped to a common 1° latitude by 1° longitude grid.
For temperature exposures, we did not use the relatively newly available downscaled models that include temperature changes for benthic habitats (Pozo Buil et al., 2021) because they were not available at the time we convened the experts. While they would be a valuable addition to a future study, they do not resolve the shelf area, and for this study, we were working to maintain consistency across regions for the suite of North American CVAs. Finally, exposure is based on normalized, rather than absolute change, meaning that SST change, while potentially greater, is divided by SST variability, which is also greater.
Given that GCMs are too coarse to resolve some important regional circulation and mesoscale processes, and that not all variables of interest were readily available from GCMs, we supplemented the quantitative exposure factors with a literature review of expected changes in additional variables (subsurface oxygen, upwelling-favorable winds, ocean currents, and sea level rise; Supplemental Material 3).
Both the exposure and the sensitivity factors were evaluated by experts in fish biology (usually with a focus on a particular taxon or functional group), oceanography, and climate science. Each expert (see list of authors) was assigned a list of species that included species within their expertise as well as a random selection of other species. Even though each participant was asked to score some species outside their specific expertise, they typically had sufficient general knowledge of the species and its role in the ecosystem. A total of four scientists (two with functional group expertise and two randomly assigned) independently scored each species’ sensitivity and exposure based on the information in species profiles written by other experts, the background exposure information, and their own expertise. For exposure factors, experts compared maps developed from the GCM ensemble with detailed descriptions or maps of each species’ distribution. For each metric, the experts were given five tallies to spread across four predefined scoring bins (Low=1, Moderate=2, High=3 and Very High=4) (Table 4), with a greater spread across the scoring bins by an expert indicating greater uncertainty. At a subsequent workshop, the expert group discussed the species, its traits, and climate factors likely to affect the species, after which experts were given the opportunity to alter the distribution of their tallies. We calculated the mean score for each attribute as described in Morrison et al. (2015), where the weight for each bin is determined from their logic table. The number of tallies in a given bin were multiplied by the appropriate weighting factor, then divided by the total number of tallies (Morrison et al., 2015). Experts also achieved consensus about data quality (from 1 to 3) of all factors.
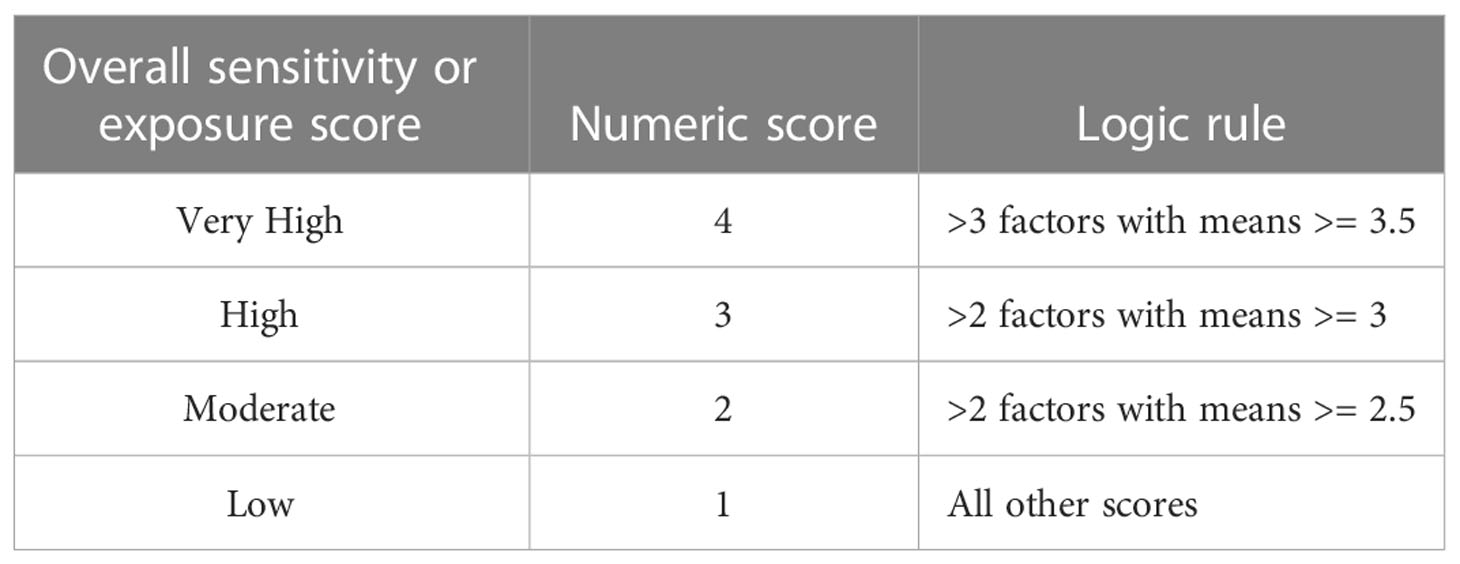
Table 4 Logic rule for calculating overall species’ climate exposure and biological sensitivity.
2.4 Assessing species vulnerability
Species vulnerability was a function of both exposure and sensitivity, with each factor weighted equally. We did not include adaptive capacity as a separate component, because the sensitivity component includes attributes indicative of both a species’ resiliency as well as its adaptive capacity (Morrison et al., 2015). This approach was similarly taken in Fortini and Schubert (2017).
By weighting sensitivity and exposure factors equally, each is treated as independent; a correlation analysis (Supplementary Material 4) confirms that biological sensitivity and climate exposure scores were not strongly correlated; all pairwise correlation coefficients were under 0.8. As a sensitivity test, we removed the exposure and sensitivity factors with the strongest correlations with other factors—sea level rise and dispersal of early life history characteristics—from the analysis and found that the overall vulnerability ranks did not change.
2.4.1 Generating overall vulnerability scores
To assess the overall climate vulnerability, we first applied a logic model (Table 4) separately to both the biological sensitivity and climate exposure factors’ weighted means. This model was intended to qualitatively summarize cumulative risk, and depended on both the number of factors and ratings for each. We calculated the overall climate vulnerability for each species as the product of the numeric values assigned to biological sensitivity and climate exposure. These scores range from 1 to 16 with values of 1 to 3 being categorized or ranked as Low, 4 to 6 as Moderate, 8 to 9 as High, and 12 to 16 as Very High climate vulnerability (there is no product that will equal 7, 10, or 11). In this paper, ‘ranks’ or ‘categories’ refer to these bins, and ‘scores’ refers to the numerical value in this vulnerability model.
We evaluated certainty in the assignment of a climate vulnerability category with a bootstrap analysis (Morrison et al., 2015) that randomly samples, with replacement, the expert reviewer tallies (n=20) for each biological sensitivity and climate exposure factor 1,000 times. The resampled tallies were used to calculate new climate vulnerability scores, and the percentage of runs in which the species was assigned to a different vulnerability rank was noted.
We also conducted an analysis that calculated the overall climate vulnerability score using median estimates of the weighted averages and calculating the Euclidean distance between the origin and point location on a plot of sensitivity × exposure, as a check to the logic rule approach. The results of this analysis were very similar to those from the logic rule and are not presented.
2.4.2 Distributional shifts
We used a subset of the biological sensitivity factors to evaluate the likelihood that a species would exhibit a shift in distribution with climate change. Stocks with highly mobile adults, broadly dispersing early life stages and low habitat specificity are likely to have the intrinsic ability to shift distribution under changing conditions. Those species with high temperature sensitivity were most likely to shift their distributions (Hare et al., 2016). We calculated the distributional shift score by applying the same component score logic model to the Temperature Sensitivity score and the inverse of the scores for Adult Mobility, Early Life Stage Dispersal, and Habitat Specificity. This resulted in a categorical ranking of the species’ expected ability to shift distribution given climate change from Low to Very High.
2.4.3 Overall negative or positive (directional) effect of climate change
In addition to exposure and sensitivity scores, experts scored the expected overall impact of climate change on each species as positive (value of 1), negative (value of -1), or neutral (value of 0) to describe the directional effect of climate change (Morrison et al., 2015), distributing four tallies across the three categories and calculating the mean. Species scoring < -0.333 are classified as being negatively affected; species scoring > 0.333 are classified as being positively affected, and species scoring between -0.333 and 0.333 are classified as being neutrally affected.
2.4.4 Importance of climate exposure factors and sensitivity attributes
For this sensitivity analysis, the overall vulnerability score for each species was calculated leaving out the scores for each sensitivity attribute or exposure factor. These analyses were then evaluated across species to determine influential factors and attributes in the overall vulnerability rank.
2.4.5 Sensitivity to external factors considered in vulnerability ratings
We considered the possibility that vulnerability rankings might change if only characteristics intrinsic to the species, such as its life history traits and habitat specificity, were included in the assessment. Thus, we conducted a sensitivity analysis that excluded two attributes driven or heavily influenced by external factors—Other Stressors and Stock Size/Status—and then recalculated the vulnerability scores.
2.5 Differences between functional groups and drivers of vulnerability to climate change
To examine differences in exposure and sensitivity attributes among species and to evaluate whether particular attributes were associated with High and Low vulnerability scores, we first reduced the number of predictive variables. Specifically, we collapsed the biological sensitivity and climate exposure factors for the 64 stocks using nonmetric multidimensional scaling (NMDS; Kruskal, 1964; Mather, 1976). This robust method produces ordination scores for each factor on each dimension or axis that serve as an indicator of its importance. We selected this approach over other ordination methods (e.g., Principal Components Analysis [PCA]) because NMDS is extremely flexible, makes few assumptions about the data, and is capable of analyzing many different data types that might not satisfy the assumption of normality (Dexter et al., 2018). We implemented this analysis with the R statistical program (R Core Team, 2016) using the ‘vegan’ package (Oksanen et al., 2017) and a Euclidean distance measure. First, a random initial starting configuration helped determine the appropriate number of dimensions (n≥2) for the best ordination by examining stress versus dimension plots for exposure and sensitivity separately. Kruskal (1964) recommended that reasonable fits for ordinations should have stress values less than 0.2. We identified the best solution when the standard deviation in stress (the correspondence between the original distance matrix and the ordination distances) over the preceding 10 iterations reached 0.00001. Using these criteria, two NMDS axes sufficiently described the variability in the exposure and sensitivity scores among the species. For the sensitivity ordination, a solution with a sufficiently low stress value (0.14) was converged upon after 20 random starts. Similarly, for the exposure ordination, a solution with a sufficiently low-stress value (0.08) was converged upon after 20 random starts. This suggests that the ordinations we found are meaningful (i.e., they correspond to the original matrix), and were unlikely to have occurred by chance. Ordination (column) scores for the factors and attributes were estimated using weighted averages of the species scores for each column. The NMDS analysis captured nearly all the variation in climate exposure and biological sensitivity in the resulting axes. Specifically, the proportion of variance represented by two axes between the original distance matrix and the ordination distances was 0.93 and 0.99 for the sensitivity and exposure ordinations, respectively.
We then used linear models to assess whether there were particular exposure or sensitivity attributes that were more associated with high or low vulnerability to climate change. We fit linear models with the attribute as the response and the NMDS axes as the predictor covariates using the ‘envfit’ function in the ‘vegan’ package (Oksanen et al., 2017). This package automatically normalizes the NMDS axes scores, so that the beta values provide an indication of the relative importance of that NMDS axis to that attribute. We arbitrarily identified attributes as ‘important’ if the linear model for that attribute had an r2 value larger than 0.7 and an absolute beta value for one of the NMDS axes that was larger than 0.8.
To determine whether there were significant differences between functional groups in their exposure or sensitivity characteristics, we also conducted a Multi-Response Permutation Procedure (mrpp) across functional groups using the ‘vegan’package (Oksanen et al., 2017). This is a flexible, non-parametric MANOVA approach, using the individual species’ NMDS ordination scores as input, that allows pairwise comparisons between the groups.
2.6 Species narratives
Species-specific narratives document the specific results for each species (Supplementary Material 5). These narratives include the overall climate vulnerability, directional effect, potential for distribution change and uncertainty in those scores. In addition, they provide the distribution of tallies and the data quality score for each exposure factor and biological sensitivity attribute. Finally, they provide an overview of each species’ life history and a summary of the likely climate effects on that species.
3 Results
Overall, two-thirds of the species we evaluated had, by this expert-opinion-based approach, Moderate or greater vulnerability to climate change and only one species was anticipated to have a positive response. We did not evaluate these species outside of the California Current LME, so these results pertain only to this system. Functional groups varied systematically in their attributes and vulnerabilities, and vulnerability was significantly associated with several key sensitivity attributes, including Population Growth Rate and Early Life History Requirements.
3.1 Species-level vulnerability
Of the 64 stocks or species included in the CCLME CVA, 5% were classified as Very Highly vulnerable to the anticipated effects of climate change, 20% were Highly vulnerable, 42% were Moderately vulnerable, and 33% had Low vulnerability to climate impacts (Figure 2). Two of the three species considered Very Highly vulnerable were anadromous (Chinook salmon and Southern Green Sturgeon), while the remaining species was a groundfish with a highly restricted range that is listed as threatened under the U.S. Endangered Species Act (Yelloweye Rockfish – Puget Sound (S. ruberrimus); National Marine Fisheries Service, 2017). Similarly, the Highly vulnerable category was dominated by salmonids and long-lived rockfishes. Also in the High category were Pacific Bluefin Tuna (Thunnus orientalis), which has a very vulnerable stock status due to heavy international fishing and Pacific Spiny Dogfish (Squalus suckleyi), which has higher sensitivity due to life history characteristics and higher exposure due to habitat preferences that caused higher scores than for other elasmobranchs. All but six of the 27 species categorized as Moderately vulnerable were groundfishes, with rockfishes dominating, and including some HMS species. The majority of Low vulnerability species were HMS, Flatfish, and CPS species (Figures 2 and 3A).
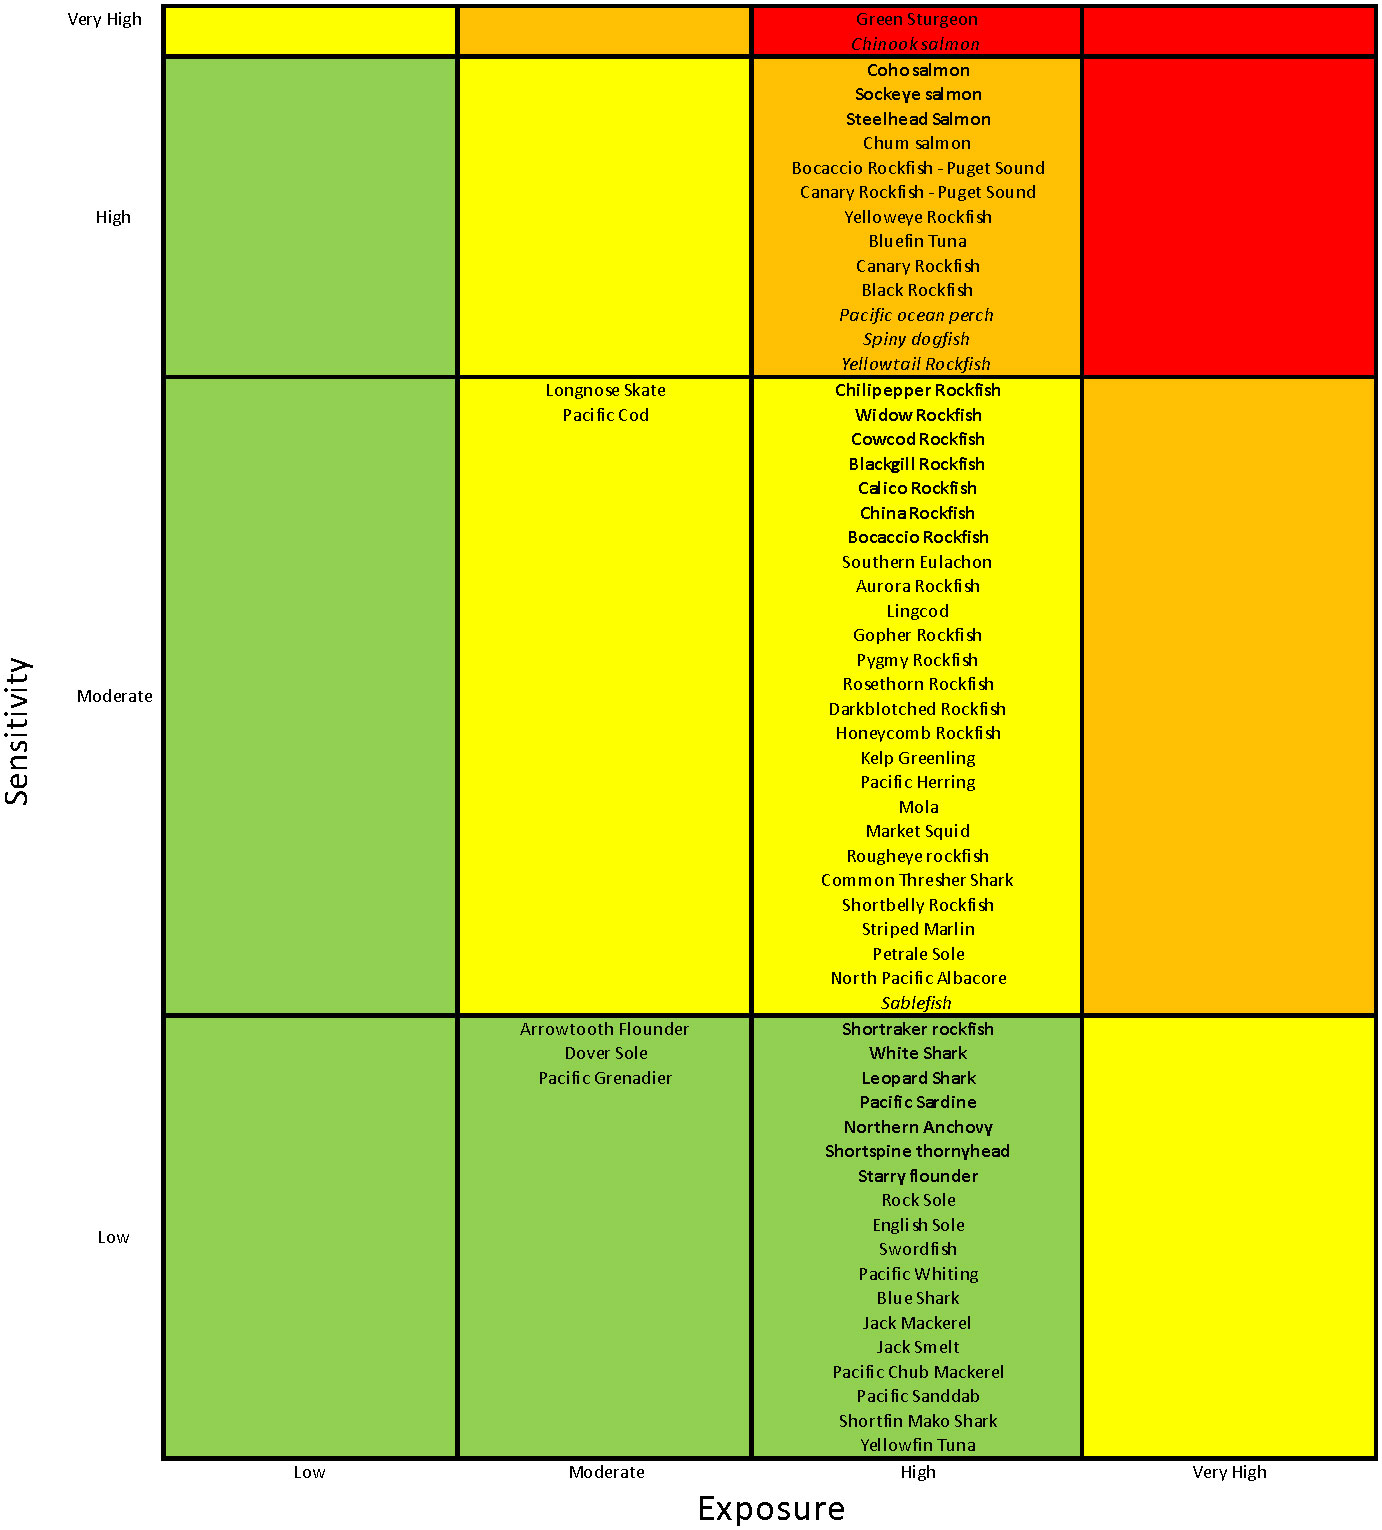
Figure 2 Vulnerability categorization for California Current LME species. Vulnerability categories are colored from green (Low) to red (Very High). Species or stocks in bold had a >25% chance of being placed in the next highest vulnerability category in our bootstrap analysis; those in italics had a >25% chance of being placed in the next lowest vulnerability category in that analysis.
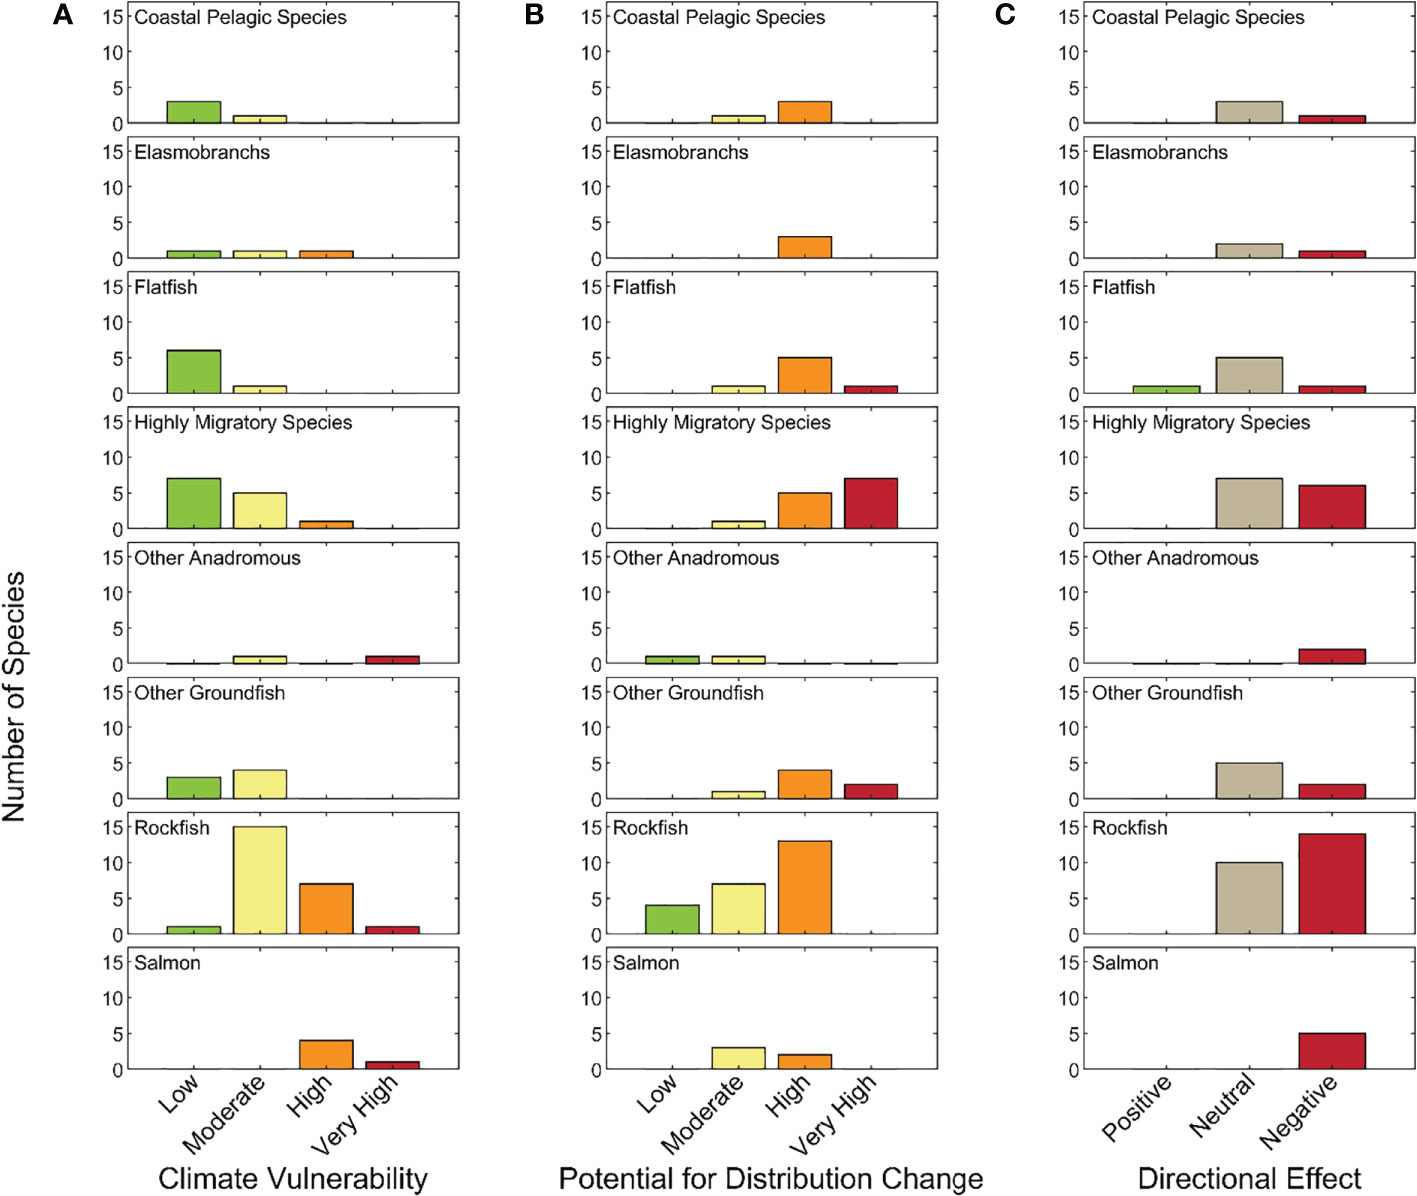
Figure 3 Number of species by (A) climate vulnerability category; (B) likelihood of change in geographic distribution; and (C) likelihood that climate change effects will be negative, neutral, or positive in each functional group.
Overall, the categorization was fairly robust according to the bootstrap analysis (a resampling of the experts’ tallies), with only about one-third of the species likely to fall in lower or higher risk categories more than 25% of the time (species in italics in Figure 2). All salmon species in the assessment fell in either the Very High (Chinook) or High (all others) categories; with all except Chum Salmon having a >25% likelihood of being in the other category (either direction). The remainder of species in the High vulnerability category that had a >25% likelihood of falling in another category were three rockfish species and one Elasmobranch with a high chance of being categorized as Moderate in the bootstrap analysis. A third or fewer of species in the Moderate and Low vulnerability categories had a high likelihood of being categorized differently in the bootstrap analysis. Because our analysis provides a relative ranking, the probability of being reclassified can help identify those species with the highest risk within each category.
3.2 Distributional shift
Most species (n=46, 72%) we evaluated were judged to have a High or Very High likelihood of effecting a distributional change. The Very High category was dominated by HMS (not surprisingly), CPS, and also included Elasmobranchs, Flatfish and Other Groundfish. Rockfishes and Green Sturgeon scored at the other end of the spectrum, with low probability of a shifting range, only three species (two rockfishes and Southern DPS of Green Sturgeon) were judged to have a low probability of range shift (Figure 3B).
3.3 Overall positive or negative (directional) effect
Nearly half of the species assessed (n=31) were thought to experience largely negative effects from climate change (i.e., overall score <-0.33) (Figure 3C). Only one species, Arrowtooth Flounder (Atheresthes stomias), was considered likely to respond positively (score >0.33) to climate change within the CCLME, as all its sensitivity attributes, except population growth rate, were judged to be Low risk. All remaining species had scores between 0.33 and -.033, with only two of these having scores ≥ 0 (thus most of the species that were judged to have a neutral response to climate change had primarily negative scores). All of the Anadromous species and just over half of the Rockfish and Other Groundfish species are expected to be negatively impacted. In addition, 9 of 27 species in the Flatfish, CPS, Elasmobranch, and HMS functional groups are expected to have negative impacts, with the remainder expected to have a neutral response to climate-driven environmental changes.
3.4 Importance of individual climate exposure factors and biological sensitivity attributes
Nearly all species had High exposure to climate-driven changes (the remaining 5 had Moderate exposure). The primary contributors to these high exposure scores were ocean acidification and temperature increases. (Figure 4). These two factors had high average scores across nearly all species in the analysis (Figure 4A). When removed from the vulnerability ranking in a sensitivity analysis, these two exposure factors also affected the vulnerability rankings for nearly a third of the species we assessed (Figure 4B).
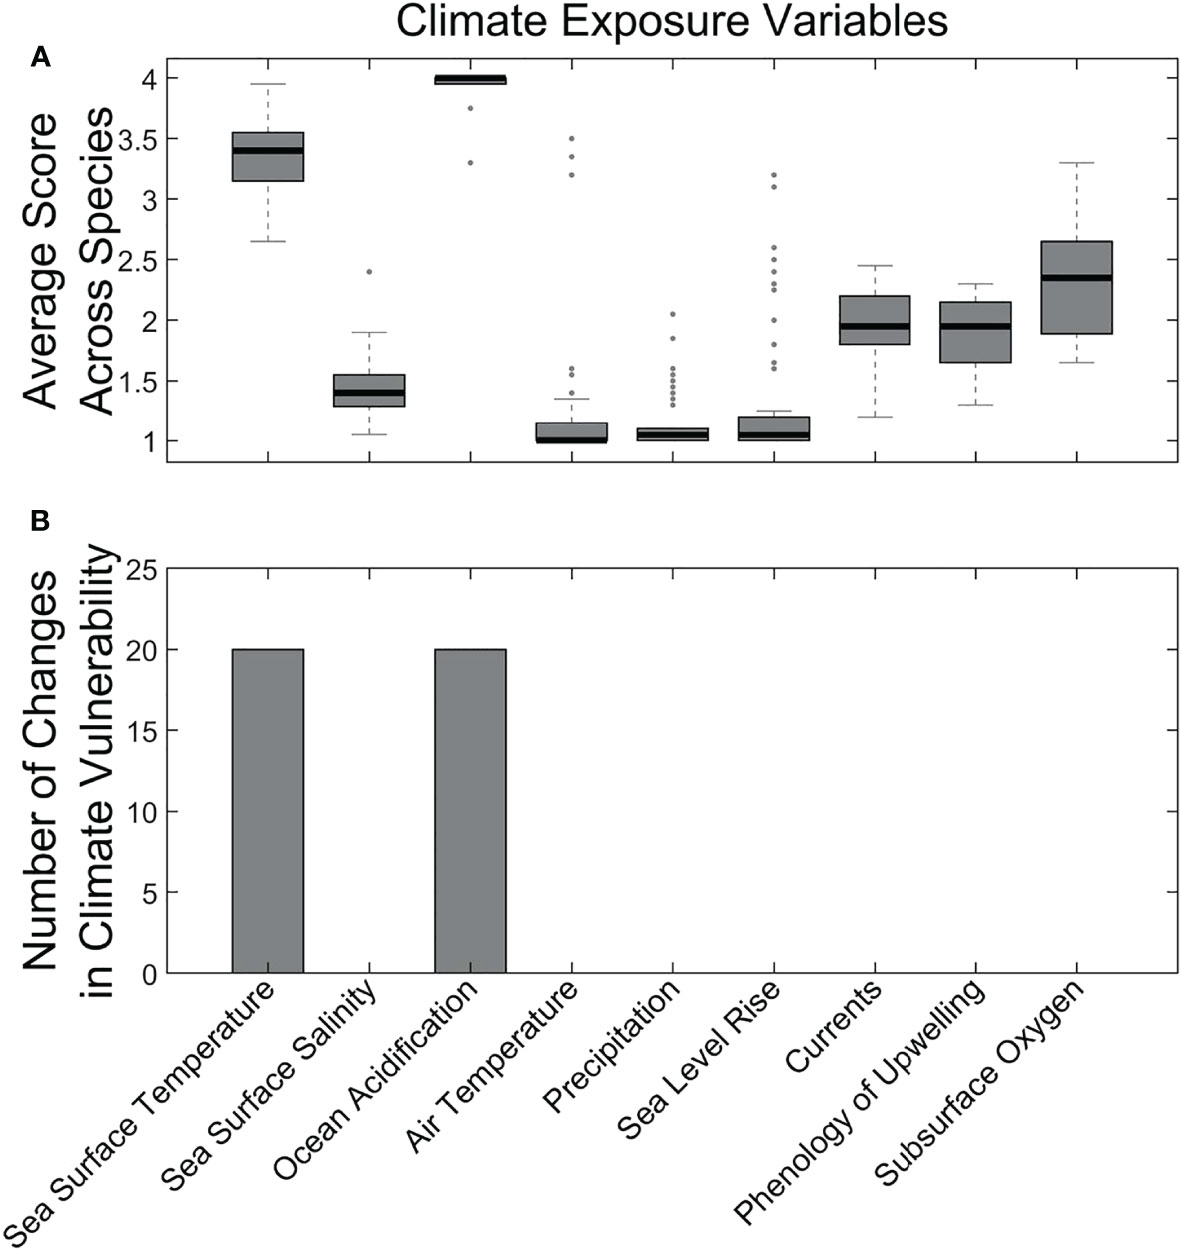
Figure 4 Average climate exposure scores across all species (A) and results of sensitivity analysis (i.e., removing the factor) for the effect of individual exposure factors on overall climate vulnerability (B). Methods follow those in Morrison et al. (2015).
The biological sensitivity attributes were less extreme than (or more complex than) the climate exposure factors and reflected more heterogeneity among species (Figure 5A). Variation in these attributes largely drove variation in overall vulnerability categorization (Supplementary Material 6). Two biological sensitivity attributes that had the strongest influence on climate vulnerability based on the sensitivity analysis that removed individual attributes were Population Growth Rate and Early Life History Requirements (Figure 5B). Other attributes that had lesser effects were Dispersal of Early Life Stages, Spawning Cycle duration, Stock Size, Reproductive Complexity, Temperature Sensitivity, and other stressors.
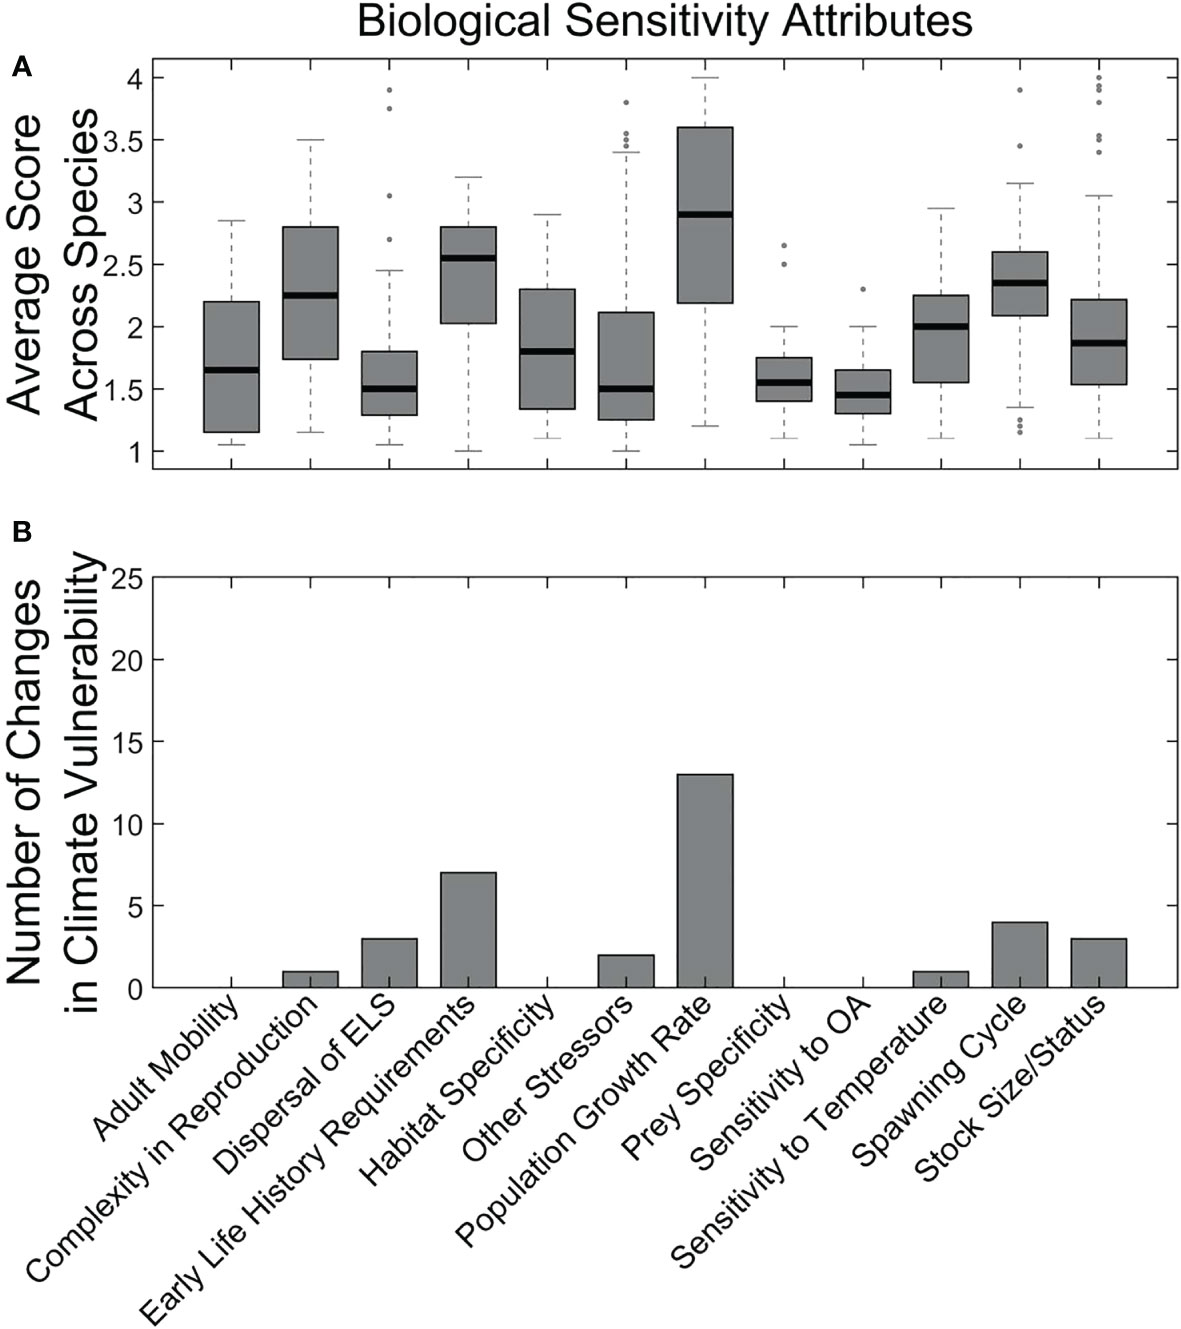
Figure 5 Average sensitivity attribute scores across all species (A) and results of sensitivity analysis (i.e., removing the attribute) for the effect of individual sensitivity attributes on overall climate vulnerability scores (B). Methods follow those in Morrison et al. (2015).
3.5 Sensitivity of vulnerability scores to ‘non-intrinsic’ conditions
An additional sensitivity analysis removed anthropogenic factors, such as heavy exploitation, in order to evaluate whether vulnerability ratings were being strongly influenced by these factors that are not intrinsic to the species’ biology and life history. In this analysis, the ratings of only three species (Yelloweye Rockfish, Striped Marlin (Kajikia audax), and Chinook Salmon) changed to a lower vulnerability rating, suggesting that overall vulnerability of CCLME species to climate change is largely driven by life history and other species characteristics (Results not shown.)
3.6 Differences between functional groups in drivers of vulnerability to climate change
The functional groups we defined were nearly all significantly different from each other in their vulnerability profiles (exposure and sensitivity characteristics), based on the mrpp analysis (Figure 6, Table 5). In fact, there were only three pairwise comparisons among all species groups that were not significantly different from each other in their exposure and sensitivity attributes (α=0.05). Other Anadromous Species were not significantly different from either Salmon or CPS; Flatfish and Other Groundfish were also not significantly different. In each case, the relevant groups share either distributional or life history characteristics, or both. Overall, this suggests that shared traits across broad phylogenetic or functional groupings contribute substantially to species’ assessed level of vulnerability to climate-driven environmental changes.
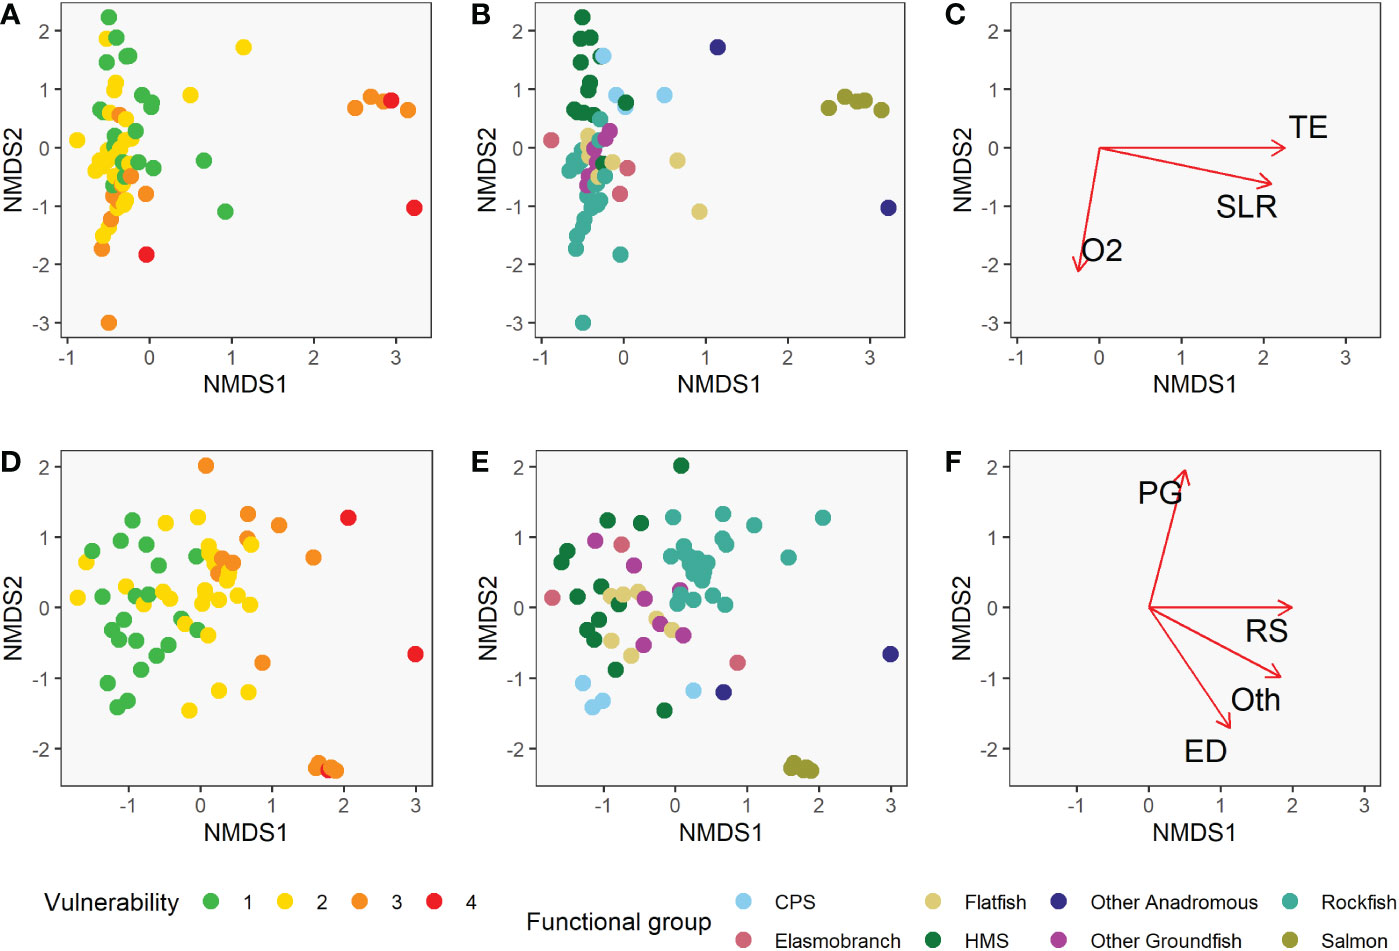
Figure 6 Non-metric multidimensional scaling (NMDS) plots showing the position of each of the 64 species relative to the two NMDS axes for climate exposure (A–C) and biological sensitivity (D–F). Panels (A) and (D) are color-coded by the species vulnerability scores, showing association between vulnerability and NMDS axis scores. Panels (B) and (E) are color-coded by functional group, showing that these groups tend to cluster along the NMDS axes. The correlation between the climate factors and the NMDS axes are represented by the length of the arrows in panel (C) and the correlation between the biological sensitivity attributes and the NMDS axes are represented by the length of the arrows in panel (F). Only factors with significant correlations with either NMDS axis are displayed these panels. Abbreviations for strongly correlated factors include population growth rate (PG), reproductive strategy (RS), early life history dispersal (ED), other (Oth), air temperature (TE), sea level rise (SLR), dissolved oxygen (O2).
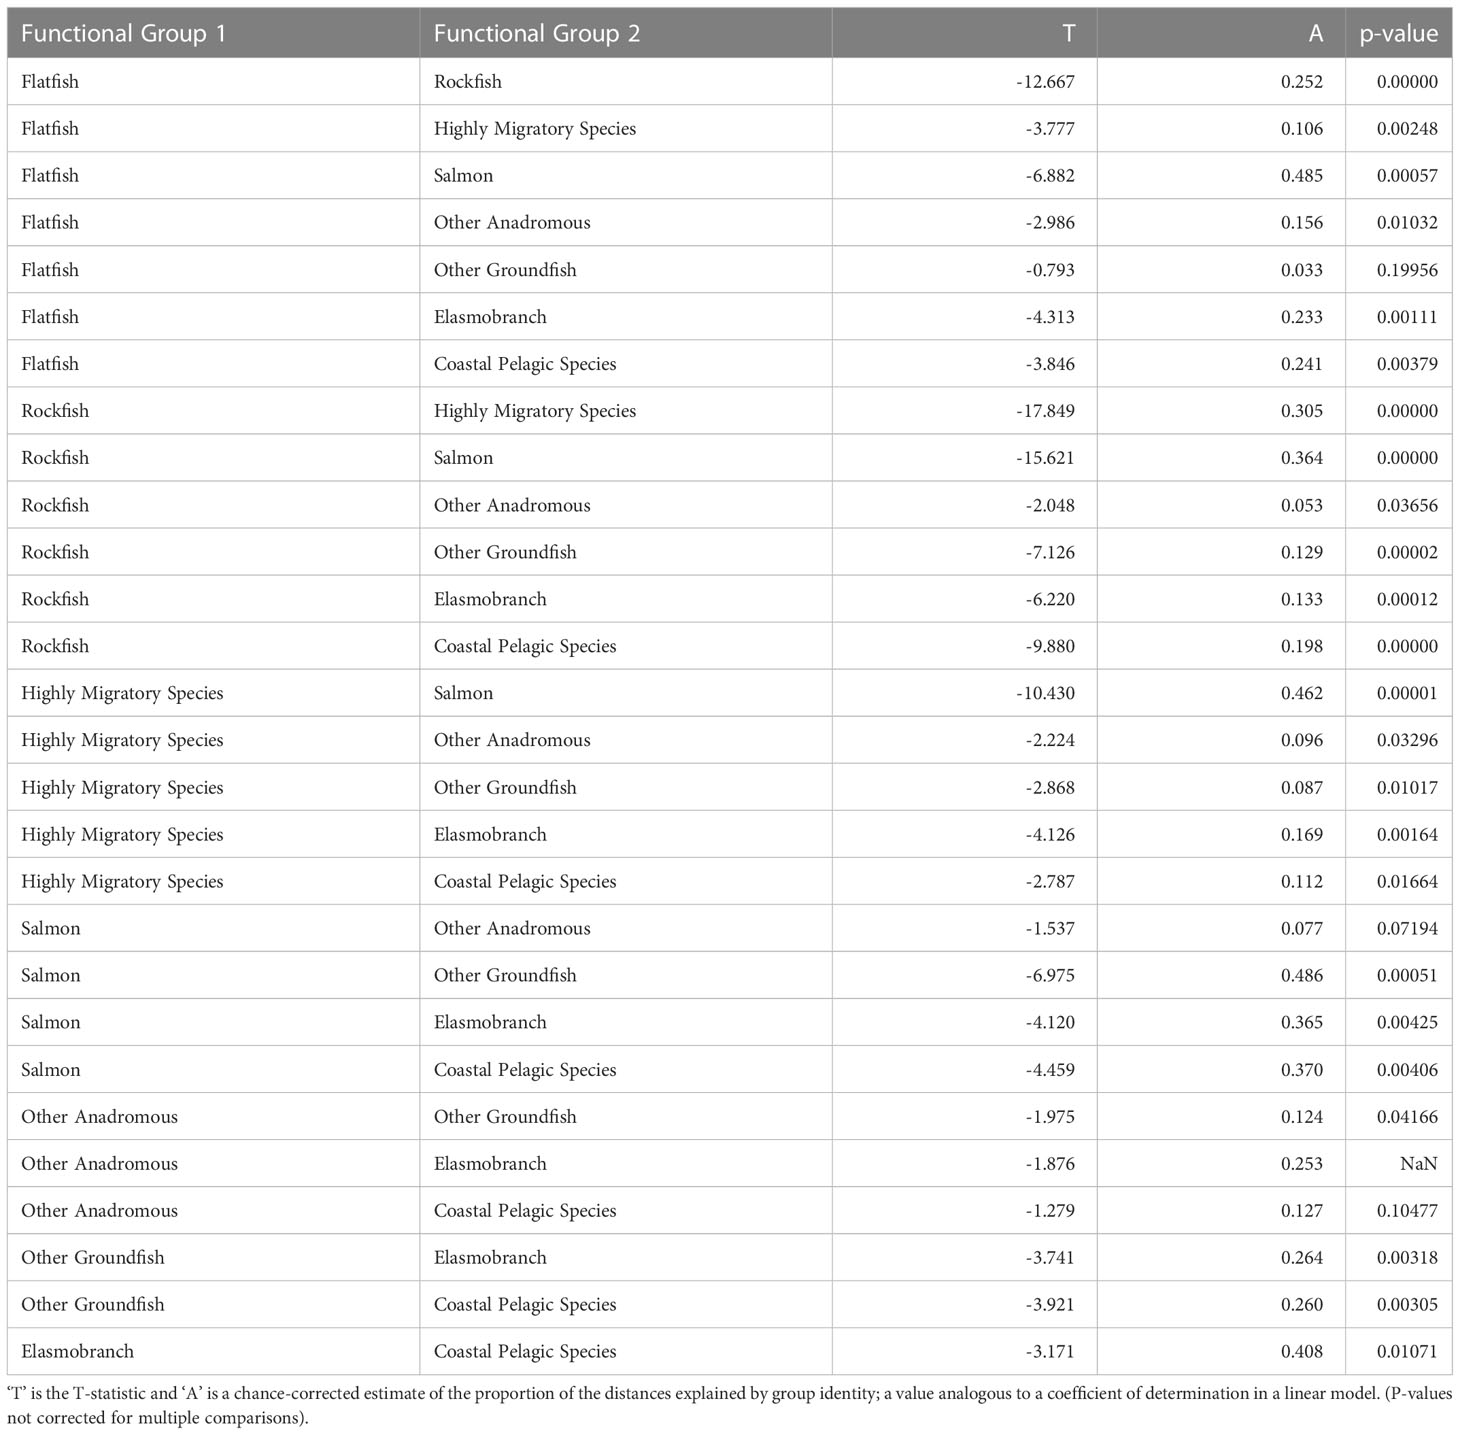
Table 5 Multi-Response Permutation Procedures results showing pairwise comparisons of functional groups in exposure and sensitivity characteristics.
Both sensitivity and exposure factors were strongly associated with ordinal vulnerability scores. The first NMDS axis of biological sensitivity attributes was highly significantly correlated with vulnerability (r=0.83, t = 11.80, df = 63, p-value < 2.2e-16). Reproductive strategy (β = 1.00) and Other Factors (β = 0.88) were identified as important factors relative to this axis, while Population Growth Rate (β = 0.97) and Early Life History Dispersal (β = -0.83) were important relative to the second NMDS axis (Figure 6, Table 6). The species expected to be most sensitive to climate change were those with more complex reproductive strategies. Exposure was also strongly associated with vulnerability on the first two NMDS axes (Exposure NMDS Axis 1: r = 0.44, t = 3.89, df = 63, p-value < 0.001; Exposure NMDS Axis 2: r = -0.39, t = -3.35, df = 63, p-value = 0.001). This translated to the most important factors being increased air temperature (which was not included for wholly marine species) (β = 1.00) and sea level rise (β = 0.96) on NMDS Axis 1, and increased hypoxia (β = -0.99) on Axis 2 (Figure 6, Table 7). More generally, the first axis was strongly associated with anadromy, with marine species being the least vulnerable and anadromous species the most vulnerable. In contrast, the second axis was more associated with groundfish versus HMS. Rockfish, and other groundfish that live near the benthos, are more susceptible to the effects of hypoxia, which is one of the reasons these functional groups were judged to be more vulnerable to climate-driven changes.
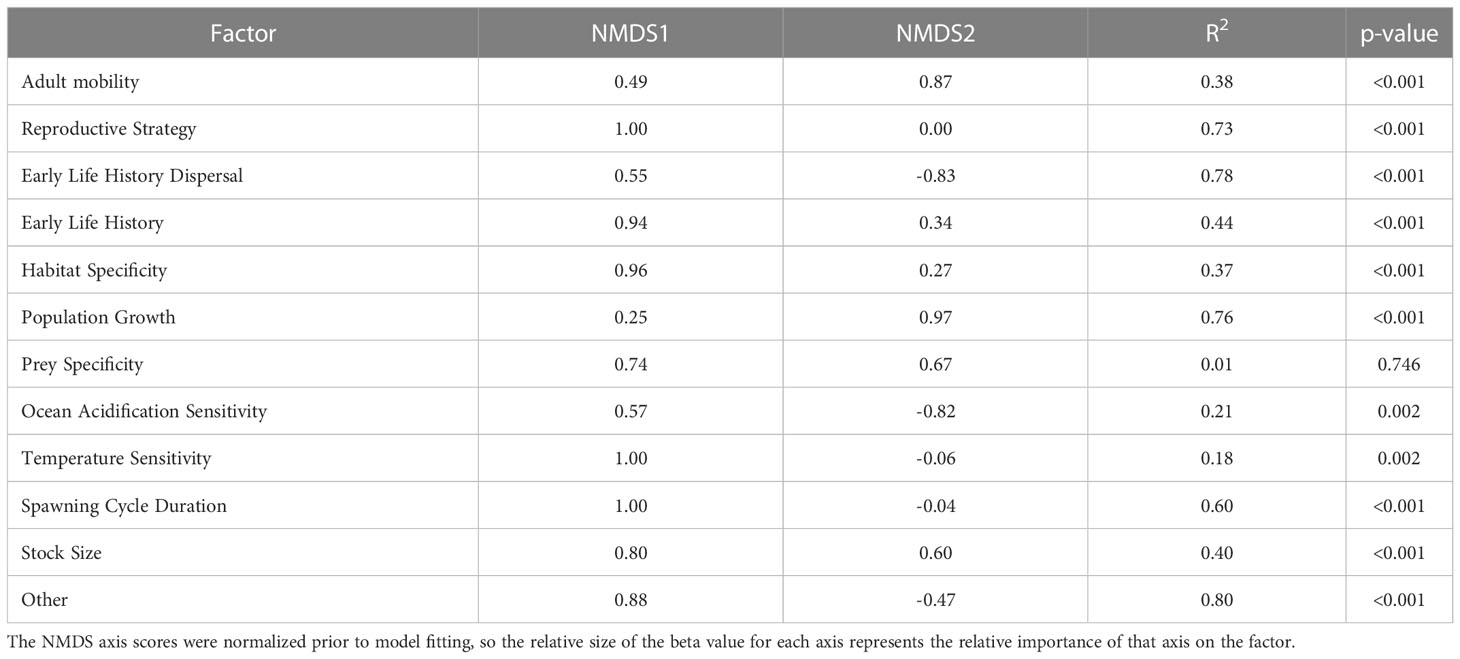
Table 6 Results from linear models relating the NMDS axes scores to each of the biological sensitivity factors.
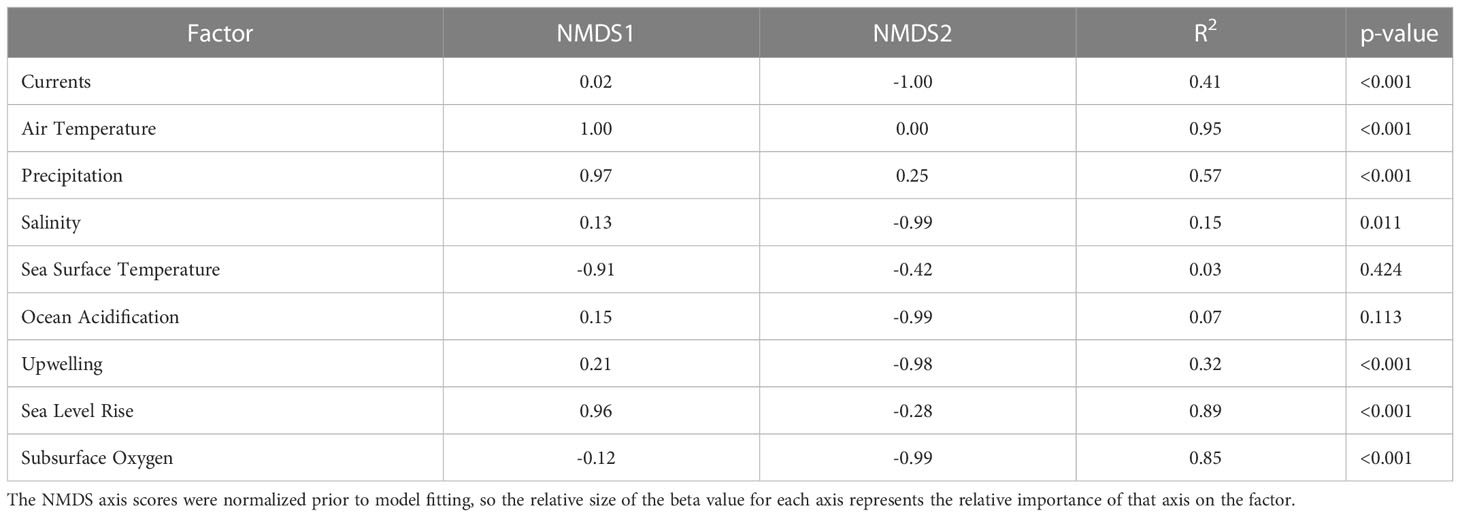
Table 7 Results from linear models relating the NMDS axes scores to each of the climate exposure factors.
4 Discussion
This paper presents an expert-opinion approach to providing a qualitative climate vulnerability assessment for 64 California Current LME marine and anadromous fish species and stocks. Given that there are relatively few mechanistic climate-population models available for species in the CCLME, this approach provides a valuable resource for managers to evaluate relative climate vulnerabilities. These results 1) provide timely advice for prioritizing species-level data collection and climate impacts research, 2) provide information about relative risk levels for these species for management use until better information becomes available, 3) help managers determine when and where a precautionary approach might be warranted in harvest decisions, and 4) help identify habitats or life history stages that might be especially important to protect.
We found that experts overwhelmingly expect the impacts of climate change to be negative to neutral for CCLME species, and that all species will be exposed to some level of environmental change (Figures 2-4; Supplementary Material 6). Vulnerability to climate changes was driven by life history characteristics, habitat use, overall population status and the presence of other stressors, such as fishing. Species classified as Highly or Very Highly vulnerable share one or more characteristics including: 1) complex life histories that utilize a wide range of freshwater and marine habitats [e.g., anadromous species consistent with Martins et al., 2012; Hare et al. (2016) and Crozier et al. (2019)]; 2) habitat specialization, particularly for areas that are likely to experience increased hypoxia (e.g., rockfishes); 3) long-lived species with low population growth rates (e.g., Pacific Spiny Dogfish or rockfishes); and/or 4) high commercial value combined with impacts from non-climate stressors (e.g., Bluefin Tuna). Species judged to have Low or Moderate vulnerability tend to be habitat generalists, occupy deep-water habitats or are highly mobile. Highly Migratory Species, Coastal Pelagic Species, Flatfish, and Other Groundfish all showed relatively high potential for distributional change, while some Rockfishes and anadromous species tended to have the lowest potential for changes in distribution. Importantly, distributional shifts can be in a variety of dimensions – including to deeper habitats with more favorable temperatures.
4.1 Drivers of vulnerability scores, uncertainty, and current conditions
Species-vulnerability categorizations within the California Current LME were generally consistent across our expert panel, were not overly sensitive to the boot-strapping exercise, and in several cases are consistent with observations or other research. However, there are some areas that may merit additional investigation.
Two other analyses that used the methodology of Morrison et al. (2015) had notable similarities and differences to our results. Ocean acidification was also an exposure attribute judged to be high in the Eastern Bering Sea (Spencer et al., 2019), and both OA and SST were strong drivers of vulnerability in exposure in the CVA for northeastern U.S. marine species (Hare et al., 2016). Because these two factors are among the most certain to occur, they move the overall exposure ratings higher for nearly all species. All three CVAs found that population growth rates were key drivers of vulnerability among the biological sensitivity factors. Further, all three noted that diadromous fishes had some of the highest vulnerability rankings. Contrasting with the results from these CVAs, we found a stronger effect of other biological sensitivity factors, such as reproductive strategy, on vulnerability. In addition, in the northeastern U.S., about one-fourth of the species were at Low vulnerability and 17% of the species in that region were likely to be positively affected by climate change. In the Eastern Bering Sea, which used both a shorter time scale and a more optimistic projection of climate changes, all species were categorized as having Low or Moderate vulnerability. In contrast, all but one of the species evaluated in the CCLME were projected to experience negative or neutral effects.
It could be argued that the inclusion of factors that were not part of the biology or ecology of the species, such as the impact from other stressors and stock status (relative to fishing), were not appropriate since they did not reflect an “intrinsic” vulnerability to climate change. Our sensitivity analysis suggests that these factors, while important, did not substantively change the relative ranking of species along the U.S. West Coast. Removing them automatically lowers the total sensitivity scores by our criteria, because the total sensitivity score depends on the number of attributes in high categories. Therefore, removing factors can only result in a lower score. More importantly, however, we note that the combined effects of climate change and ‘external’ factors do affect a species’ ability to respond to change in the environment (Essington et al., 2015). These factors are well-known to affect adaptive capacity. Populations that are negatively affected by fishing, in particular, have reduced effective population sizes and therefore genetic variance. Pollution and other stressors also lower the fitness of affected populations, making them less resilient to a change –particularly because some of these other stressors may be exacerbated by climate change (Hsieh et al., 2006). Fully estimating the climate vulnerability of a species, then, is incomplete without including the magnitude of non-climate stressors and they must be included in the vulnerability analysis.
Ocean acidification was gauged to be one of the most certain environmental changes in this region, with the most uncertain effect on the species we evaluated. Fishes in general are thought to be relatively less affected by decreasing pH, in comparison with other taxa such as pteropods (Busch and McElhany, 2016). However, the impacts of ocean acidification on food webs are almost entirely unknown, and have the potential to be dramatic, as impacts on lower trophic levels can propagate throughout the system (Marshall et al., 2017). Furthermore, pH is highly variable in the CCLME due to coastal upwelling (Frieder et al., 2012). Some CCLME fish and shellfish species are currently periodically exposed for relatively short periods of time to corrosive waters, particularly along the coasts of Oregon and Washington (Berger et al., 2021; Siedlecki et al., 2021). These species have not, however, experienced the prolonged, strong change that is projected under future conditions, nor do they have the option of moving out of such areas as they do now (Keller et al., 2017; Berger et al., 2021; Siedlecki et al., 2021). It is important to determine whether species will be affected by a decrease in the mean pH, even if they have been briefly exposed to those values previously, or whether the most extreme pH values control physiological and behavioral effects. Further research into the impacts of ocean acidification on fish species and the California Current food webs could help reduce the uncertainty of the impacts of this highly certain effect of increasing carbon dioxide in the earth system.
This assessment also made clear that decreases in subsurface oxygen will disproportionally affect rockfish and groundfish species because their benthic habitats already experience relatively low dissolved oxygen concentrations (Moffitt et al., 2015). In fact, massive rockfish die-offs were observed in the CCLME in 2002 when upwelling transported dissolved oxygen-depleted deep water onto the inner shelf (Grantham et al., 2004). These hypoxic conditions have been found seasonally each year since 2002, and were particularly notable in 2010, 2011, 2012, and 2014, when reduced catch-per-unit-effort of many groundfish species and die-off of invertebrate and fish species were also observed (Keller et al., 2017). While dissolved oxygen levels in the CCLME are seasonally and spatially variable, they are likely to decrease (i.e., the CCLME is likely to experience more hypoxia) as the climate changes (IPCC, 2014b; Howard et al., 2020; Pozo Buil et al., 2021; Siedlecki et al., 2021). In fact, given the strong natural variability in the northeast Pacific, this region is projected to experience especially pronounced oxygen loss (Long et al., 2016), suggesting that oxygen depletion will be an important factor in determining future population persistence and distribution, and potentially, overall community composition.
Other assessments have produced results similar to ours. For instance, our experts estimated that Coastal Pelagic and Highly Migratory Species would be the most likely functional groups to change distribution in response to climate change. A quantitative simulation projecting fishery landings of Pacific sardine (Sardinops sagax caerulea), a CPS species, also found a shift in distribution with climate change, with an increase of up to 50% of landings at northern ports (Smith et al., 2021). Checkley et al. (2017) found that factors we considered, including temperature increases and upwelling-favorable winds would likely shift both sardine and anchovy farther north. Other distribution models (Phillips et al., 2014; Christian and Holmes, 2016) predict large-scale northward shifts of albacore, a Highly Migratory Species, as our assessment does. English et al. (2022) looked at trends in biomass for 38 demersal species in British Columbia, most of which were also included in our analysis. They found that biomass trends were negatively associated with warming, consistent with our analysis, and also found that biomass declined in the warmest locations and increased in the cooler locations, suggesting a redistribution of species. Finally, Arrowtooth flounder, the only species in our assessment judged to have a likely positive response to climate change, was the subject of a comprehensive assessment of its vulnerability to ecosystem change in the Gulf of Alaska (Doyle et al., 2018). While these authors found some stage-specific sensitivity to climate change, their overall conclusion was that this species would exhibit low risk and high resilience in this region, matching our own results. In contrast, our assessment estimated a Moderate vulnerability to climate change for Pacific cod; this species has recently experienced a collapse in the Gulf of Alaska (Williams et al., 2022), suggesting that additional information about the population dynamics for this species in the California Current is likely to be important to identify environmental factors that are associated with recruitment and survivorship.
We conducted this assessment for species within the U.S. Exclusive Economic Zone, and managed, in part, by the Pacific Fishery Management Council. This creates two areas of uncertainty. The first is that many of these species cross national boundaries—the risk we report is thus the risk within continental U.S. waters, and may be different if the species is considered across its entire range. The second is that some of these species may encompass demographically distinct populations (equivalent to ESUs for salmonids) that have not yet been identified. The population structure of West Coast marine species such as lingcod is being evaluated (Longo et al., 2020). This uncertainty can be removed by re-conducting these risk assessments to reflect appropriate population boundaries when significant population differentiation is detected, as Crozier et al. (2019) did for salmonids.
4.2 CVA applications in management
Results from climate vulnerability assessments can be used by managers and scientists in a variety of ways, including prioritizing species for conservation or other actions, informing fishery and protected resource management decision-making, and identifying priority areas of research and enhanced monitoring. In doing so, there are a variety of important considerations.
First, the results of our climate vulnerability assessment are relative, and not quantitative. Thus, while a species may be considered to be Moderately vulnerable, by definition these species have areas of biological sensitivity and exposure that pose some degree of risk under climate change. This work identifies those areas on a species-specific basis; reviewing these factors for any species subject to regulatory or management decisions will provide key information about actions that may increase or decrease the risk to that species.
Second, expert opinion regarding the impact of climate change is overwhelmingly negative or neutral for the species we evaluated in the CCLME, with only a single species anticipated to benefit from climate change. This suggests that a precautionary approach to management may be warranted, to improve the likelihood that species are as resilient as possible as these changes accrue. Supporting the ability of species to maintain diversity in life history and morphological characteristics as well as adequate abundance and population growth rates are key components to promoting their ability to respond effectively to climate change (Moore et al., 2010; Schindler et al, 2010).
Next, species varied in the likelihood of changing distribution. In fact, we are seeing some of these changes already (Morley et al., 2018). For those species that are likely to shift their range or are currently shifting their range, this will bring an array of management challenges, since fisheries management is inherently spatial. State or nation-based controls, including the distribution of protected areas, may need to be revisited to consider likely future conditions. Further, fishing communities and individual fishers accustomed to historical species distributions may find it necessary to travel further to access shifting fishing grounds or to cope with lower availability (Young et al., 2019; Selden et al., 2020; Papaioannou et al., 2021). In addition, some species may move out of the boundaries of existing fishery-independent survey design, requiring rapid adaptation and resources to provide the critical survey data and information for assessing and managing species. Range shifts are also likely to affect fishing-dependent coastal communities, and societal adaptation may be required. For those species unlikely to shift their distributions in response to environmental changes, managers may choose to consider alternative approaches that improve their resilience and overall status, or that facilitate their movement (McClure et al., 2013).
Overall, the ecological impacts of shifting distributions—and particularly of unequal shifts within a marine community—are uncertain. This is not the only area of uncertainty relevant for the application of this analysis to management. Obviously, the projections of magnitude and rate of climate change are uncertain. The effects of ocean acidification on marine fishes are poorly understood. Many species depend on nearshore habitats for juvenile rearing, and this assessment does not incorporate many of the environmental factors relevant for these habitats, such as changes in estuarine and nearshore vegetation and bottom-type. The impact of climate change on poorly resolved features and processes that are important in this system such as spatial heterogeneity in upwelling, eddies, and currents also continue to be poorly understood. Thus, like Hare et al. (2016), we suggest an iterative approach to vulnerability assessments. Revisiting these assessments will be particularly important when significant advancements in climate data or projections (either regionally or globally) are made or when substantive improvements in our understanding of the biology and ecology of species and the impacts of poorly understood factors such as ocean acidification on them are achieved.
This assessment also indicates key areas for future research. Models that include more mechanistic understanding of climate drivers on populations, food webs and ecosystems, and that include those species judged to be most vulnerable to climate change, can inform appropriate management measures and contribute to the national move toward Ecosystem Based Fisheries Management and the implementation of the Pacific Fishery Management Council’s Fishery Ecosystem Plan (Pacific Fishery Management Council, 2013).
Importantly, our work is an assessment of the fished stocks in the California Current LME. A climate vulnerability assessment for the fisheries and communities that the fished stocks support requires a broader ecosystem-wide assessment of species that interact directly or indirectly with the fishery, as well as social and economic elements of those fisheries. This includes not only those directly involved in the fishery (fishers, processors, regulatory agencies), but also the communities that interact with these fisheries (e.g., Ekstrom et al., 2015; Colburn et al., 2016; Silva et al., 2019; Santora et al., 2020; Dudley et al., 2021). For example, Koehn et al. (2022) provide an assessment of the social-ecological vulnerability of West Coast fishing communities to climate-driven changes in fish species. Those communities that are particularly reliant on vulnerable species and that have a lower social adaptive capacity are especially vulnerable. Species-specific climate vulnerability assessments, such as that presented here, are critical both for identifying species to target for enhanced monitoring or mitigation planning and for providing the foundation for these more comprehensive social-ecological analyses (e.g., Barange et al., 2014; Maina et al., 2015; Wabnitz et al., 2018; Rogers et al., 2019; Payne et al., 2021).
We have shown that there are real risks to marine fishery species in the CCLME from climate change, and that its constituent communities are likely to be altered by range changes of many of the species found in this region. The species that are most vulnerable are those already at risk due to low population growth rates and impacts from non-climate stressors, and those with complex reproductive strategies. Climate is already modifying fish and fisheries in this region, and this work provides key information for both scientists and managers as they seek to understand and address the long-term sustainability of CCLME fisheries.
Data availability statement
The original contributions presented in the study are included in the article/Supplementary Material. Further inquiries can be directed to the corresponding author.
Ethics statement
Ethical review and approval was not required for the animal study because this was entirely a literature-based study.
Author contributions
All authors contributed to the development of background materials and/or provided expert opinions during the workshop for the analysis. MAH, MH, MN, DH and MM conducted statistical analysis and developed figures for the manuscript. MM, SJB, MAH, and EH led the overall effort, including running the expert workshop. EW-N, LC and MJ compiled information for exposure attributes. MM drafted much of the text with contributions, review and substantive editing from other authors. All authors contributed to the article and approved the submitted version.
Funding
This work was funded by the National Oceanographic and Atmospheric Administration (U.S. Department of Commerce), through the National Marine Fisheries Service Office of Science and Technology and the Northwest and Southwest Fisheries Science Centers.
Acknowledgments
The authors acknowledge the National Marine Fisheries Service Office of Science and Technology and Roger Griffis for financial, logistical and technical support of this project. Sandra Bigley provided copy editing and review of the manuscript, JoAnne Butzerin provided copy editing and review of the species narratives, Jim Hastie and two provided helpful review of the manuscript, and Rebecca Einhorn and Dana Greeley contributed to several figures. AB, Allan Hicks, Andi Stephens, Blake Feist, CW, CH, CG, DB, DH, Don Pearson, EDi, EW-N, EH, EDo, HD, IK, JS, JC, Jim Thorson, JB, John Field, JP, JW, KA, LB, Lyndsey Lefebvre, MN, Mary Hunsicker, Mary Yoklavich, Megan Stachura, MH, MHM, NM, NT, Ole Shelton, OH, Rebecca Thomas, RG, SB, SM, SL, SS, Tom Laidig, VG, Waldo Wakefield, and Xi He contributed to the development of species profiles and narratives. Comments from the Pacific Fishery Management Council’s Scientific and Statistical Committee improved the analysis and discussion. Any use of trade, firm, or product names is for descriptive purposes only and does not imply endorsement by the U.S. Government.
Conflict of interest
MN was employed by ECS Federal, Inc. CN was employed by Ocean Associates, Inc., and is currently employed by PACE Engineering, Inc.
The remaining authors declare that the research was conducted in the absence of any commercial or financial relationships that could be construed as a potential conflict of interest.
Publisher’s note
All claims expressed in this article are solely those of the authors and do not necessarily represent those of their affiliated organizations, or those of the publisher, the editors and the reviewers. Any product that may be evaluated in this article, or claim that may be made by its manufacturer, is not guaranteed or endorsed by the publisher.
Supplementary material
The Supplementary Material for this article can be found online at: https://www.frontiersin.org/articles/10.3389/fmars.2023.1103767/full#supplementary-material
Supplementary Table 1 | Table 1a Coastal Pelagic Species.
Supplementary Table 2 | Table 1b Elasmobranchs.
Supplementary Table 3 | Table 1c Flatfish.
Supplementary Table 4 | Table 1d Highly Migratory Species.
Supplementary Table 5 | Table 1e Other Anadromous Species.
Supplementary Table 6 | Table 1f Other Groundfish.
Supplementary Table 7 | Table 1g Rockfishes.
Supplementary Table 8 | Table 1h Salmon.
Data Sheet 1 | Supplementary Material 2, Downscaled Climate Factors
Data Sheet 2 | Supplementary Material 3, Literature Review for Other Exposure Factors
Data Sheet 3 | Supplementary Material 4, Correlation of Exposure and Sensitivity Attributes
Data Sheet 4 | Supplementary Material 5, Species Narratives
Data Sheet 5 | Supplementary Material 6, Comprehensive Results
References
Alexander M. A., Scott J. D., Friedland K. D., Mills K. E., Nye J. A., Pershing A. J., et al. (2018). Projected sea surface temperatures over the 21st century: Changes in the mean, variability and extremes for large marine ecosystem regions of northern oceans. Elementa: Sci. Anthropocene 6, 9. doi: 10.1525/elementa.191
Asch R. G. (2015). Climate change and decadal shifts in the phenology of larval fishes in the California current ecosystem. Proc. Natl. Acad. Sci. 112 (30), E4065–E4074. doi: 10.1073/pnas.1421946112
Auad G., Miller A., Di Lorenzo E. (2006). Long-term forecast of oceanic conditions off California and their biological implications. J. Geophys. Res. 111, C09008. doi: 10.1029/2005JC003219
Bakun A. (1990). Global climate change and intensification of coastal ocean upwelling. Science 247 (4939), 198–201. doi: 10.1126/science.247.4939.198
Bakun A., Black B. A., Bograd S. J., Garcia-Reyes M., Miller A. J., Rykaczewski R. R., et al. (2015). Anticipated effects of climate change on coastal upwelling ecosystems. Curr. Clim. Change Rep. 1 (2), 85–93. doi: 10.1007/s40641-015-0008-4
Barange M., Merino G., Blanchard J. L., Scholtens J., Harle J., Allison E. H., et al. (2014). Impacts of climate change on marine ecosystem production in societies dependent on fisheries. Nat. Clim. Change 4, 211–216. doi: 10.1038/nclimate2119
Barth J. A., Menge B. A., Lubchenco J., Chan F., Bane J. M., Kirincich A. R., et al. (2007). Delayed upwelling alters nearshore coastal ocean ecosystems in the northern California current. Proc. Natl. Acad. Sci. 104 (10), 3719–3724. doi: 10.1073/pnas.0700462104
Berger H. M., Siedlecki S. A., Matassa C. M., Alin S. R., Kaplan I. C., Hodgson E. E., et al. (2021). Seasonality and life history complexity determine vulnerability of dungeness crab to multiple climate stressors. AGU Adv. 2, e2021AV000456. doi: 10.1029/2021AV000456
Black B. A., Schroeder I. D., Sydeman W. J., Bograd S. J., Wells B. K., Schwing F. B. (2011). Winter and summer upwelling modes and their biological importance in the California current ecosystem. Glob. Change Biol. 17, 2536–2545. doi: 10.1111/j.1365-2486.2011.02422.x
Bograd S. J., Castro C. G., Di Lorenzo E., Palacios D. M., Bailey H., Gilly W., et al. (2008). Oxygen declines and the shoaling of the hypoxic boundary in the California current. Geophys. Res. Lett. 35, L12607. doi: 10.1029/2008GL034185
Bograd S. J., Leising A. W., Hazen E. L. (2016). “Oceanography,” in Ecosystems of California. Eds. Mooney H., Zavaleta E. (Oakland, CA: University of California Press), 95–105.
Bograd S. J., Pozo Buil M., Lorenzo E. D., Castro C. G., Schroeder I. D., Goericke R., et al. (2015). Changes in source waters to the southern California bight. Deep -Sea Res. Part II Top. Stud. Oceanogr. 112, 42–52. doi: 10.1016/j.dsr2.2014.04.009
Bograd S. J., Schroeder I., Sarkar N., Qiu X., Sydeman W. J., Schwing F. B. (2009). Phenology of coastal upwelling in the California current. Geophys. Res. Lett. 36, L01602. doi: 10.1029/2008GL035933
Brander K. (2010). Impacts of climate change on fisheries. J. Mar. Syst. 79 (3-4), 389–402. doi: 10.1016/j.jmarsys.2008.12.015
Busch D. S., McElhany P. (2016). Estimates of the direct effect of seawater pH on the survival rate of species groups in the California current ecosystem. PloS One 11 (8), e0160669. doi: 10.1371/journal.pone.0160669
Cai W., Borlace S., Lengaigne M., Van Rensch P., Collins M., Vecchi G., et al. (2014). Increasing frequency of extreme El niño events due to greenhouse warming. Nat. Clim. Change 4 (2), 111–116. doi: 10.1038/nclimate2100
Cayan D. R., Maurer E. P., Dettinger M. D., Tyree M., Hayhoe K. (2008). Climate change scenarios for the California region. Climatic Change 87, 21–42. doi: 10.1007/s10584-007-9377-6
Chan F., Barth J. A., Lubchenco J., Kirincich A., Weeks H., Peterson W. T., et al. (2008). Emergence of anoxia in the California current large marine ecosystem. Science 319 (5865), 920. doi: 10.1126/science.1149016
Chavez F. P., Ryan J., Lluch-Cota S. E., Ñiquen M. (2003). From anchovies to sardines and back: multidecadal change in the Pacific Ocean. Science 299 (5604), 217–221. doi: 10.1126/science.1075880
Checkley D. M., Asch R. G., Rykaczewski R. R. (2017). Climate, anchovy and sardine. Annu. Rev. Mar. Sci. 9, 469–493. doi: 10.1146/annurev-marine-122414-033819
Checkley D.M., Barth J. A. (2009). Patterns and processes in the California current system. Prog. Oceanogr. 83 (1-4), 49–64. doi: 10.1016/j.pocean.2009.07.028
Chelton D. B., Bernal P. A., McGowan J. A. (1982). Large-Scale interannual physical and biological interaction in the California current. J. Mar. Res. 40 (4), 1095–1125.
Chenillat F., Rivière P., Capet X., Di Lorenzo E., Blanke B. (2012). North pacific gyre oscillation modulates seasonal timing and ecosystem functioning in the California current upwelling system. Geophys. Res. Lett. 39, L01606. doi: 10.1029/2011GL049966
Cheung W. W. L., Lam V. W. Y., Sarmiento J. L., Kearney K., Watson R., Pauly D. (2009). Projecting global marine biodiversity impacts under climate change scenarios. Fish Fish. 10 (3), 235–251. doi: 10.1111/j.1467-2979.2008.00315.x
Christian J. R., Holmes J. (2016). Changes in albacore tuna habitat in the northeast Pacific Ocean under anthropogenic warming. Fish. Oceanogr. 25, 544–554. doi: 10.1111/fog.12171
Colburn L. L., Jepson M., Weng C., Seara T., Weiss J., Hare J. A. (2016). Indicators of climate change and social vulnerability in fishing dependent communities along the Eastern and gulf coasts of the united states. Mar. pollut. 74, 323–333. doi: 10.1016/j.marpol.2016.04.030
Collins M., An S. I., Cai W., Ganachaud A., Guilyardi E., Jin F. F., et al. (2010). The impact of global warming on the tropical Pacific Ocean and El Niño. Nat. Geosci. 3 (6), 391–397. doi: 10.1038/ngeo868
Crozier L. G., McClure M. M., Beechie T., Bograd S. J., Boughton D. A., Carr M., et al. (2019). Climate vulnerability assessment for pacific salmon and steelhead in the California current Large marine ecosystem. PloS One 14 (7), 49. doi: 10.1371/journal.pone.0217711
Cummins P. F., Freeland H. J. (2007). Variability of the north pacific current and its bifurcation. Prog. Oceanogr. 75 (2), 253–265. doi: 10.1016/j.pocean.2007.08.006
Cushing D. H. (1990). Plankton production and year-class strength in fish populations: an update of the match/mismatch hypothesis. Adv. Mar. Biol. 26, 249–293. doi: 10.1016/S0065-2881(08)60202-3
Dexter E., Rollwagen-Bollens G., Bollens S. M. (2018). The trouble with stress: A flexible method for the evaluation of nonmetric multidimensional scaling. Limnol. Oceanogr. Methods 16 (7), 434–443. doi: 10.1002/lom3.10257
Di Lorenzo E. (2015). The future of coastal ocean upwelling. Nature 518 (7539), 310–311. doi: 10.1038/518310a
Doney S. C., Ruckelshaus M., Duffy J. E., Barry J. P., Chan F., English C. A., et al. (2012). Climate change impacts on marine ecosystems. Annu. Rev. Mar. Sci. 4, 11–37. doi: 10.1146/annurev-marine-041911-111611
Doyle M. J., Debenham C., Barbeaux S. J., Buckley T. W., Pirtle J. L., Spies I. B., et al. (2018). A full life history synthesis of arrowtooth flounder ecology in the gulf of Alaska: Exposure and sensitivity to potential ecosystem change. J. Sea Res. 142, 28–51. doi: 10.1016/j.seares.2018.08.001
Dudley P. N., Rogers T. L., Morales M. M., Stoltz A. D., Sheridan C. J., Beulke A. K., et al. (2021). A more comprehensive climate vulnerability assessment for fisheries social-ecological systems. Front. Mar. Sci. 8. doi: 10.3389/fmars.2021.678099
Ekstrom J. A., Suatoni L., Cooley S. R., Pendleton L. H., Waldbusser G. G., Cinner J. E., et al. (2015). Vulnerability and adaptation of US shellfisheries to ocean acidification. Nat. Clim. Change 5 (3), 207–214. doi: 10.1038/nclimate2508
English P. A., Ward E. J., Rooper C. N., Forrest R. E., Rogers L. A., Hunter K. L., et al. (2022). Contrasting climate velocity impacts in warm and cool locations show that effects of marine warming are worse in already warmer temperate waters. Fish Fish. 23 (1), 239–255. doi: 10.1111/faf.12613
Essington T. E., Moriarty P. E., Froehlich H. E., Hodgson E. E., Koehn L. E., Oken K. L., et al. (2015). Fishing amplifies forage fish population collapses. Proc. Natl. Acad. Sci. 112 (21), 6648–6652. doi: 10.1073/pnas.1422020112
Foden W. B., Butchart S. H. M., Stuart S. N., Vié J. C., Akçakaya H. R., Angulo A., et al. (2013). Identifying the world’s most climate change vulnerable species: A systematic trait-based assessment of all birds, amphibians and corals. PloS One 8 (6), e65427. doi: 10.1371/journal.pone.0065427
Fortini L., Schubert O. (2017). Beyond exposure, sensitivity and adaptive capacity: a response based ecological framework to assess species climate change vulnerability. Climate Change Responses 4, 2. doi: 10.1186/s40665-017-0030-y
Francis R. C., Hare S. R., Hollowed A. B., Wooster W. S. (1998). Effects of interdecadal climate variability on the oceanic ecosystems of the NE pacific. Fish. Oceanogr. 7 (1), 1–21. doi: 10.1046/j.1365-2419.1998.00052.x
Frieder C. A., Nam S. H., Martz T. R., Levin L. A. (2012). High temporal and spatial variability of dissolved oxygen and pH in a nearshore California kelp forest. Biogeosciences 9 (10), 3917–3930. doi: 10.5194/bg-9-3917-2012
Grantham B. A., Chan F., Nielsen K. J., Fox D. S., Barth J. A., Huyer A., et al. (2004). Upwelling-driven nearshore hypoxia signals ecosystem and oceanographic changes in the northeast pacific. Nature 429 (6993), 749–754. doi: 10.1038/nature02605
Hahlbeck N., Scales K. L., Dewar H., Maxwell S. M., Bograd S. J., Hazen E. L. (2017). Oceanographic determinants of ocean sunfish (Mola mola) and bluefin tuna (Thunnus orientalis) bycatch patterns in the California large mesh drift gillnet fishery. Fish. Res. 191, 154–163. doi: 10.1016/j.fishres.2017.03.011
Hansen J., Sato M., Hearty P., Ruedy R., Kelley M., Masson-Delmotte V., et al. (2016). Ice melt, sea level rise and superstorms: evidence from paleoclimate data, climate modeling, and modern observations that 2°C global warming could be dangerous. Atmos. Chem. Phys. 16, 3761–3812. doi: 10.5194/acp-16-3761-2016
Hare J. A., Morrison W. E., Nelson M. W., Stachura M. M., Teeters E. J., Griffis R. B., et al. (2016). A vulnerability assessment of fish and invertebrates to climate change on the northeast US continental shelf. PloS One 11 (2), e0146756. doi: 10.1371/journal.pone.0146756
Hausfather Z., Peters G. P. (2020). Emissions – the ‘business as usual’ story is misleading. Nature 577 (7792), 618–620. doi: 10.1038/d41586-020-00177-3
Holbrook S. J., Schmitt R. J., Stephens J. S. (1997). Changes in an assemblage of temperate reef fishes associated with a climate shift. Ecol. Appl. 7 (4), 1299–1310. doi: 10.1890/1051-0761(1997)007[1299:CIAAOT]2.0.CO;2
Howard E. M., Penn J. L., Frenzel H., Seibel B. A., Bianchi D., Renault L., et al. (2020). Climate-driven aerobic habitat loss in the California current system. Sci. Adv. 6 (20), eaay3188. doi: 10.1126/sciadv.aay3188
Hsieh C.-H., Reiss C. S., Hunter J. R., Beddington J. R., May R. M., Sugihara G. (2006). Fishing elevates variability in the abundance of exploited species. Nature 443, 859–862. doi: 10.1038/nature05232
IPCC. (2013). Climate change 2013: The physical science basis. In: Contribution of working group I to the fifth assessment report of the intergovernmental panel on climate change. Eds. Stocker T. F., Qin D., Plattner G. K., Tignor M., Allen S. K., Boschung J., et al (Cambridge, United Kingdom and New York, NY, USA: Cambridge University Press), 1535 pp.
IPCC. (2014). Climate change 2014: Impacts, adaptation, and vulnerability. part a: Global and sectoral aspects. In: Contribution of working group II to the fifth assessment report of the IPCC. Eds. Field C. B., Barros V. R., Dokken D. J., Mach K. J., Mastrandrea M. D., Bilir T. E., et al (Cambridge, United Kingdom and New York: Cambridge University Press), 1132 pp.
IPCC. (2019). Summary for policymakers. In: IPCC special report on the ocean and cryosphere in a changing climate. Eds. Pörtner H.-O., Roberts D. C., Masson-Delmotte V., Zhai P., Tignor M., Poloczanska E., et al (Geneva, Switzerland: Intergovernmental Panel on Climate Change).
Isaak D. J., Wenger S. J., Peterson E. E., Ver Hoef J. M., Nagel D. E., Luce C. H., et al. (2017). The NorWeST summer stream temperature model and scenarios for the western U.S.: a crowd-sourced database and new geospatial tools foster a user community and predict broad climate warming of rivers and streams. Water Resour. Res. 53 (11), 9181–9205. doi: 10.1002/2017WR020969
Isaak D. J., Young M. K., Luce C. H., Hostetler S. W., Wenger S. J., Peterson E. E., et al. (2016). Slow climate velocities of mountain streams portend their role as refugia for cold-water biodiversity. Proc. Natl. Acad. Sci. 113 (16), 4374–4379. doi: 10.1073/pnas.1522429113
Jacox M. G., Fiechter J., Moore A. M., Edwards C. A. (2015). ENSO and the California current coastal upwelling response. J. Geophys. Res. Oceans 120, 1691–1702. doi: 10.1002/2014JC010650
Jacox M. G., Moore A. M., Edwards C. A., Fiechter J. (2014). Spatially resolved upwelling in the California current system and its connections to climate variability. Geophys. Res. Lett. 41 (9), 3189–3196. doi: 10.1002/2014GL059589
Johnson J. E., Welch D. J. (2010). Marine fisheries management in a changing climate: A review of vulnerability and future options. Rev. Fish. Sci. 18 (1), 106–124. doi: 10.1080/10641260903434557
Keeling R. F., Körtzinger A., Gruber N. (2010). Ocean deoxygenation in a warming world. Annu. Rev. Mar. Sci. 2, 199–229. doi: 10.1146/annurev.marine.010908.163855
Keller A. A., Ciannelli L., Wakefield W. W., Simon V., Barth J. A., Pierce S. D. (2017). Species-specific responses of demersal fishes to near-bottom oxygen levels within the California current large marine ecosystem. Mar. Ecol. Prog. Ser. 568, 151–173. doi: 10.3354/meps12066
King J. R., Agostini V. N., Harvey C. J., McFarlane G. A., Foreman M. G., Overland J. E., et al. (2011). Climate forcing and the California current ecosystem. ICES J. Mar. Sci. 68 (6), 1199–1216. doi: 10.1093/icesjms/fsr009
Koehn L. E., Nelson L. K., Samhouri J. F., Norman K. C., Jacox M. G., Cullen A. C., et al. (2022). Social-ecological vulnerability of fishing communities to climate change: A US West coast case study. PloS One 17 (8), e0272120. doi: 10.1371/journal.pone.0272120
Kruskal J. B. (1964). Multidimensional scaling by optimizing goodness of fit to a nonmetric hypothesis. Psychometrika 29, 1–27. doi: 10.1007/BF02289565
Lavaniegos B. E., Ohman M. D. (2003). Long-term changes in pelagic tunicates of the California current. Deep-Sea Res. Part II-Top. Stud. Oceanogr. 50 (14-16), 2473–2498. doi: 10.1016/S0967-0645(03)00132-2
Long M. C., Deutsch C., Ito T. (2016). Finding forced trends in oceanic oxygen. Global Biogeochem. Cycles 30, 381–397. doi: 10.1002/2015GB005310
Longo G. C., Lam L., Basnett B., Samhouri J., Hamilton S., Andrews K., et al. (2020). Strong population differentiation in lingcod (Ophiodon elongatus) is driven by a small portion of the genome. Evol. Appl. 13, 2536–2554. doi: 10.1111/eva.13037
Lu J., Vecchi G. A., Reichler T. (2007). Expansion of the Hadley cell under global warming. Geophys. Res. Lett. 34 (6), L06805. doi: 10.1029/2006GL028443
Maina J., Kithiia J., Cinner J., Neale E., Noble S., Charles D., et al. (2015). Integrating social–ecological vulnerability assessments with climate forecasts to improve local climate adaptation planning for coral reef fisheries in Papua new Guinea. Reg. Environ. Change 16 (3), 881–891. doi: 10.1007/s10113-015-0807-0
Mamauag S. S., Aliño P. M., Martinez R. J. S., Muallil R. N., Doctor M. V. A., Dizon E. C., et al. (2013). A framework for vulnerability assessment of coastal fisheries ecosystems to climate change–tool for understanding resilience of fisheries (VA-TURF). Fish. Res. 147, 381–393. doi: 10.1016/j.fishres.2013.07.007
Marshall K. N., Kaplan I. C., Hodgson E. E., Hermann A., Busch D. S., McElhany P., et al. (2017). Risks of ocean acidification in the California current food web and fisheries: ecosystem model projections. Global Change Biol. 23, 1525–1539. doi: 10.1111/gcb.13594
Martins E. G., Hinch S. G., Cooke S. J., Patterson D. A. (2012). Climate effects on growth, phenology, and survival of sockeye salmon (Oncorhynchus nerka): A synthesis of the current state of knowledge and future research directions. Rev. Fish Biol. Fish. 22 (4), 887–914. doi: 10.1007/s11160-012-9271-9
Mather P. M. (1976). Computational methods of multivariate analysis in physical geography (London: John Wiley & Sons), 530 pp.
McClatchie S., Goericke R., Cosgrove R., Auad G., Vetter R. (2010). Oxygen in the southern California bight: Multidecadal trends and implications for demersal fisheries. Geophys. Res. Lett. 37, L19602. doi: 10.1029/2010GL044497
McClure M. M., Alexander M., Borggaard D., Boughton D., Crozier L., Griffis R., et al. (2013). Incorporating climate science in applications of the U.S. endangered species act for aquatic species. Conserv. Biol. 27 (6), 1222–1233. doi: 10.1111/cobi.12166
McGowan J. A., Bograd S. J., Lynn R. J., Miller A. J. (2003). The biological response to the 1977 regime shift in the California current. Deep-Sea Res. Part II-Top. Stud. Oceanogr. 50 (14-16), 2567–2582. doi: 10.1016/S0967-0645(03)00135-8
Mecking S., Langdon C., Feely R. A., Sabine C. L., Deutsch C. A., Min D. H. (2008). Climate variability in the north pacific thermocline diagnosed from oxygen measurements: An update based on the US CLIVAR/CO2 repeat hydrography cruises. Global Biogeochem. Cycles 22 (3), GB3015. doi: 10.1029/2007GB003101
Meredith M. P., Hogg A. M. (2006). Circumpolar response of southern ocean eddy activity to a change in the southern annular mode. Geophys. Res. Lett. 33 (16), L16608. doi: 10.1029/2006GL026499
Moffitt S. E., Moffitt R. A., Sauthoff W., Davis C. V., Hewett K., Hill T. M. (2015). Paleoceanographic insights on recent oxygen minimum zone expansion: Lessons for modern oceanography. PloS One 10 (1), e0115246. doi: 10.1371/journal.pone.0115246
Moore J. W., McClure M., Rogers L. A., Schindler D. E. (2010). Synchronization and portfolio performance of threatened salmon. Conserv. Lett. 3, 340–348. doi: 10.1111/j.1755-263X.2010.00119.x
Morley J. W., Selden R. L., Latour R. J., Frölicher T. L., Seagraves R. J., Pinsky M. L. (2018). Projecting shifts in thermal habitat for 686 species on the north American continental shelf. PloS One 13 (5), e0196127. doi: 10.1371/journal.pone.0196127
Morrison W. E., Nelson M. W., Howard J. F., Teeters E. J., Hare J. A., Griffis R. B., et al. (2015). Methodology for assessing the vulnerability of marine fish and shellfish species to a changing climate. NOAA Technical Memorandum NMFS-OSF-3, Silver Spring, MD, USA (National Marine Fisheries Service, NOAA, U.S. Dept. of Commerce).
Mote P. W., Mantua N. J. (2002). Coastal upwelling in a warmer future. Geophys. Res. Lett. 29 (23), 1–4. doi: 10.1029/2002GL016086
Narayan N., Paul A., Mulitza S., Schulz M. (2010). Trends in coastal upwelling intensity during the late 20th century. Ocean Sci. 6 (3), 815–823. doi: 10.5194/os-6-815-2010
National Marine Fisheries Service (2017). Rockfish recovery plan: Puget Sound/Georgia basin yelloweye rockfish (Sebastes ruberrimus) and bocaccio (Sebastes paucispinis) (Seattle, WA: National Marine Fisheries Service).
National Marine Fisheries Service (2022) Fisheries economics of the united states 2020. U.S. department of commerce, NOAA current fishery statistics no. 2020. Available at: http://www.fisheries.noaa.gov/nationalsustainble-fisheries/fisheries-united-states.
National Research Council (2012). Sea-Level rise for the coasts of California, Oregon, and Washington: past, present, and future (Washington DC, USA: National Academies Press).
O’Donnell C. J. (2015). Global trends in eddy kinetic energy from satellite altimetry Doctoral thesis, (Norwich, UK: University of East Anglia).
Oksanen J., Blanchet F. G., Kindt R., Legendre P., Minchin P. R., O’Hara R. B., et al. (2017). Vegan: Community ecology package (R package version 2), 3–5.
Oschlies A., Schulz K. G., Riebesell U., Schmittner A. (2008). Simulated 21st century’s increase in oceanic suboxia by CO2-enhanced biotic carbon export. Global Biogeochem. Cycles 22 (4), GB4008. doi: 10.1029/2007GB003147
Pacific Fishery Management Council (2013). Pacific coast fishery ecosystem plan for the U.S. portion of the California current Large marine ecosystem (Portland, OR: Pacific Fishery Management Council).
Pacifici M., Foden W. B., Visconti P., Watson J. E. M., Butchart S. H. M., Kovacs K. M., et al. (2015). Assessing species vulnerability to climate change. Nat. Clim. Change 5 (3), 215–225. doi: 10.1038/Nclimate2448
Palacios D. M., Bograd S. J., Mendelssohn R., Schwing F. B. (2004). Long-term and seasonal trends in stratification in the California current 1950–1993. J. Geophys. Res. 109, C10016. doi: 10.1029/2004JC002380
Papaioannou E. A., Selden R. L., Olson J., McCay B. J., Pinsky M. L., St. Martin K. (2021). Not all those who wander are lost–responses of fishers’ communities to shifts in the distribution and abundance of fish. Front. Mar. Sci. 8. doi: 10.3389/fmars.2021.669094
Pauly D., Christensen V. (1995). Primary production required to sustain global fisheries. Nature 374 (6519), 255–257. doi: 10.1038/374255a0
Payne M. R., Kudahl M., Engelhard G. H., Peck M. A., Pinnegar J. K. (2021). Climate risk to European fisheries and coastal communities. Proc. Natl. Acad. Sci. 118, e2018086118. doi: 10.1073/pnas.2018086118
Perry A. L., Low P. J., Ellis J. R., Reynolds J. D. (2005). Climate change and distribution shifts in marine fishes. Science 308 (5730), 1912–1915. doi: 10.1126/science.1111322
Peterson W. T., Schwing F. B. (2003). A new climate regime in northeast pacific ecosystems. Geophys. Res. Lett. 30 (17), 1896. doi: 10.1029/2003gl017528
PFMC (2021) Coastal pelagic species fishery management plan as amended through amendment 16. Available at: https://www.pcouncil.org/documents/2021/10/coastal-pelagic-species-fishery-management-plan-as-amended-through-amendment-18-january-2021.pdf/.
PFMC (2022a) Pacific coast groundfish fishery management plan for the California, Oregon and Washington groundfish fishery. Available at: https://www.pcouncil.org/documents/2022/08/pacific-coast-groundfish-fishery-management-plan.pdf/.
PFMC (2022b) Fishery management plan for U.S. West coast fisheries for highly migratory fisheries. Available at: https://www.pcouncil.org/documents/2022/07/fishery-management-plan-for-west-coast-fisheries-for-highly-migratory-species-through-amendment-5.pdf/.
PFMC (2022c) Pacific coast salmon fishery management plan for commercial and recreational salmon fisheries off the coasts of Washington, Oregon and California, as revised through amendment 23. Available at: https://www.pcouncil.org/documents/2022/12/pacific-coast-salmon-fmp.pdf/.
Phillips A. J., Ciannelli L., Brodeur R. D., Pearcy W. G., Childers J. (2014). Spatio-temporal associations of albacore CPUEs in the northeastern pacific with regional SST and climate environmental variables. ICES J. Mar. Sci. 71, 1717–1727. doi: 10.1093/icesjms/fst238
Pinsky M. L., Rogers L. A., Morley J. W., Frölicher T. L. (2020a). Ocean planning for species on the move provides substantial benefits and requires few trade-offs. Sci. Adv. 6 (50), eabb8428. doi: 10.1126/sciadv.abb8428
Pinsky M. L., Selden R. L., Kitchel Z. J. (2020b). Climate-driven shifts in marine species ranges: Scaling from organisms to communities. Annu. Rev. Mar. Sci. 12, 153–179. doi: 10.1146/annurev-marine-010419-010916
Pinsky M. L., Worm B., Fogarty M. J., Sarmiento J. L., Levin S. A. (2013). Marine taxa track local climate velocities. Science 341 (6151), 1239–1242. doi: 10.1126/science.1239352
Poloczanska E. S., Brown C. J., Sydeman W. J., Kiessling W., Schoeman D. S., Moore P. J., et al. (2013). Global imprint of climate change on marine life. Nat. Clim. Change 3 (10), 919–925. doi: 10.1038/Nclimate1958
Poloczanska E. S., Burrows M. T., Brown C. J., García Molinos J., Halpern B. S., Hoegh-Guldberg O., et al. (2016). Responses of marine organisms to climate change across oceans. Front. Mar. Sci. 3. doi: 10.3389/fmars.2016.00062
Pozo Buil M., Jacox M. J., Fiechter J., Alexander M. A., Bograd S. J., Curchitser E. N., et al. (2021). Dynamically downscaled ensemble projections for the California current system. Front. Mar. Sci. 8. doi: 10.3389/fmars.2021.612874
R Core Team (2016). R: A language and environment for statistical computing, version 3.0 (Vienna, Austria: R Foundation for Statistical Computing).
Roemmich D., McGowan J. (1995). Climatic warming and the decline of zooplankton in the California current. Science 267 (5202), 1324–1326. doi: 10.1126/science.267.5202.1324
Rogers L. A., Griffin R., Young T., Fuller E., St. Martin K., Pinsky M. L. (2019). Shifting habitats expose fishing communities to risk under climate change. Nat. Clim. Change 9, 512–516. doi: 10.1038/s41558-019-0503-z
Rykaczewski R. R., Dunne J. P. (2010). Enhanced nutrient supply to the California current ecosystem with global warming and increased stratification in an earth system model. Geophys. Res. Lett. 37, L21606. doi: 10.1029/2010GL045019
Rykaczewski R. R., Dunne J. P., Sydeman W. J., García-Reyes M., Black B. A., Bograd S. J. (2015). Poleward displacement of coastal upwelling-favorable winds in the ocean’s eastern boundary currents through the 21st century. Geophys. Res. Lett. 42, 6424–6431. doi: 10.1002/2015GL064694
Santora J. A., Mantua N. J., Schroeder I. D., Field J. C., Hazen E. L., Bograd S. J., et al. (2020). Habitat compression and ecosystem shifts as potential links between marine heatwave and record whale entanglements. Nat. Commun. 11 (1), 1–12. doi: 10.1038/s41467-019-14215-w
Satterthwaite W. H., Carlson S. M., Allen-Moran S. D., Vincenzi S., Bograd S. J., Wells B. K. (2014). Match-mismatch dynamics and the relationship between ocean-entry timing and relative ocean recoveries of central valley fall run Chinook salmon. Mar. Ecol. Prog. Ser. 511, 237–248. doi: 10.3354/meps10934
Schindler D. E., Hilborn R., Chasco B., Boatright C. P., Quinn T. P., Rogers L. A., et al. (2010). Population diversity and the portfolio effect in an exploited species. Nature 465 (3), 609–613. doi: 10.1038/nature09060
Scott J. D., Alexander M. A., Murray D. R., Swales D., Eischeid J. (2016). The climate change web portal: A system to access and display climate and earth system model output from the CMIP5 archive. Bull. Am. Meteorol. Soc 97 (4), 523–530. doi: 10.1175/BAMS-D-15-00035.1
Seager R., Naik N., Vecchi G. A. (2010). Thermodynamic and dynamic mechanisms for large-scale changes in the hydrological cycle in response to global warming. J. Climate 23 (17), 4651–4668. doi: 10.1175/2010JCLI3655.1
Selden R. L., Thorson J. T., Samhouri J. F., Bograd S. J., Brodie S., Carroll G., et al. (2020). Coupled changes in biomass and distribution drive trends in availability of fish stocks to US West coast ports. ICES J. Mar. Sci. 77 (1), 188–199. doi: 10.1093/icesjms/fsz211
Siedlecki S. A., Pilcher D., Howard E. M., Deutsch C., MacCready P., Norton E. L., et al. (2021). Coastal processes modify projections of some climate-driven stressors in the California current system. Biogeosciences 18 (9), 2871–2890. doi: 10.5194/bg-18-2871-2021
Silva M. R. O., Pennino M. G., Lopes P. F. M. (2019). Social-ecological trends: Managing the vulnerability of coastal fishing communities. Ecol. Soc 24 (4), 4. doi: 10.5751/ES-11185-240404
Smith J. A., Muhling B., Sweeney J., Tommasi D., Pozo Buil M., Fiechter J., et al. (2021). The potential impact of a shifting pacific sardine distribution on US West coast landings. Fish Oceanog. 30 (4), 437–454. doi: 10.1111/fog.12529
Snyder M. A., Sloan L. C., Diffenbaugh N. S., Bell J. L. (2003). Future climate change and upwelling in the California current. Geophys. Res. Lett. 30, 1823. doi: 10.1029/2003GL017647
Spencer P. D., Hollowed A. B., Sigler M. F., Hermann A. J., Nelson M. W. (2019). Trait-based climate vulnerability assessments in data-rich systems: An application to eastern Bering Sea fish and invertebrate stocks. Global Change Biol. 24, 3954–3971. doi: 10.1111/gcb.14763
Stortini C. H., Shackell N. L., Tyedmers P., Beazley K. (2015). Assessing marine species vulnerability to projected warming on the scotian shelf, Canada. ICES J. Mar. Sci. 72 (6), 1731–1743. doi: 10.1093/icesjms/fsv022
Stouffer R. J., Yin J., Gregory J. M., Dixon K. W., Spelman M. J., Hurlin W., et al. (2006). Investigating the causes of the response of the thermohaline circulation to past and future climate changes. J. Climate 19 (8), 1365–1387. doi: 10.1175/JCLI3689.1
Stramma L., Johnson G. C., Firing E., Schmidtko S. (2010). Eastern Pacific oxygen minimum zones: Supply paths and multidecadal changes. J. Geophys. Res. 115, C09011. doi: 10.1029/2009JC005976
Stramma L., Johnson G. C., Sprintall J., Mohrholz V. (2008). Expanding oxygen-minimum zones in the tropical oceans. Science 320 (5876), 655–658. doi: 10.1126/science.11538
Sunday J. M., Bates A. E., Dulvy N. K. (2011). Global analysis of thermal tolerance and latitude in ectotherms. Proc. Biol. Sci. 278 (1713), 1823–1830. doi: 10.1098/rspb.2010.1295
Sydeman W. J., Bradley R. W., Warzybok P., Abraham C. L., Jahncke J., Hyrenbach K. D., et al. (2006). Planktivorous auklet ptychoramphus aleuticus responses to ocean climate 2005: Unusual atmospheric blocking? Geophys. Res. Lett. 33, L22S09. doi: 10.1029/2006GL026736
Sydeman W. J., García-Reyes M., Schoeman D. S., Rykaczewski R. R., Thompson S. A., Black B. A., et al. (2014). Climate change and wind intensification in coastal upwelling ecosystems. Science 345 (6192), 77–80. doi: 10.1126/science.1251635
Tewksbury J. J., Huey R. B., Deutsch C. A. (2008). Putting the heat on tropical animals. Science 320, 1296–1297. doi: 10.1126/science.1159328
Thorson J. T., Pinsky M. L., Ward E. J. (2016). Model-based inference for estimating shifts in species distribution, area occupied and centre of gravity. Methods Ecol. Evol. 7 (8), 990–1002. doi: 10.1111/2041-210x.12567
Wabnitz C. C. C., Lam V. M. Y., Reygondeau G., Teh L. C. L., Al-Abdulrazzak D., Khalfallah M., et al. (2018). Climate change impacts on marine biodiversity, fisheries and society in the Arabian gulf. PloS One 13 (5), e0194537. doi: 10.1371/journal.pone.0194537
Wang D., Gouhier T. C., Menge B. A., Ganguly A. R. (2015). Intensification and spatial homogenization of coastal upwelling under climate change. Nature 518 (7539), 390–394. doi: 10.1038/nature14235
Waples R. S. (1998). Evolutionarily significant units, distinct population segments, and the endangered species act: Reply to pennock and dimmick. Conserv. Biol. 12 (3), 718–721. doi: 10.1046/j.1523-1739.1998.97524.x
Wheatley C. J., Beale C. M., Bradbury R. B., Pearce-Higgins J. W., Critchlow R., Thomas C. D. (2017). Climate change vulnerability for species–assessing the assessments. Global Change Biol. 23 (9), 3704–3715. doi: 10.1111/gcb.13759
Whitney F. A., Freeland H. J., Robert M. (2007). Persistently declining oxygen levels in the interior waters of the eastern subarctic pacific. Prog. Oceanogr. 75 (2), 179–199. doi: 10.1016/j.pocean.2007.08.007
Williams M. J. P., Gisclair B. R., Cerny-Chipman E., LeVine M., Peterson T. (2022). The heat is on: Gulf of Alaska pacific cod and climate-ready fisheries. ICES J. Mar. Sci. 79 (2), 573–583. doi: 10.1093/icesjms/fsab032
Williams S. E., Shoo L. P., Isaac J. L., Hoffmann A. A., Langham G. (2008). Towards an integrated framework for assessing the vulnerability of species to climate change. PloS Biol. 6 (12), 2621–2626. doi: 10.1371/journal.pbio.0060325
Keywords: climate vulnerability assessment, marine fishes, fisheries management, climate change, exposure, sensitivity, trait-based vulnerability, California Current
Citation: McClure MM, Haltuch MA, Willis-Norton E, Huff DD, Hazen EL, Crozier LG, Jacox MG, Nelson MW, Andrews KS, Barnett LAK, Berger AM, Beyer S, Bizzarro J, Boughton D, Cope JM, Carr M, Dewar H, Dick E, Dorval E, Dunham J, Gertseva V, Greene CM, Gustafson RG, Hamel OS, Harvey CJ, Henderson MJ, Jordan CE, Kaplan IC, Lindley ST, Mantua NJ, Matson SE, Monk MH, Moyle P, Nicol C, Pohl J, Rykaczewski RR, Samhouri JF, Sogard S, Tolimieri N, Wallace J, Wetzel C and Bograd SJ (2023) Vulnerability to climate change of managed stocks in the California Current large marine ecosystem. Front. Mar. Sci. 10:1103767. doi: 10.3389/fmars.2023.1103767
Received: 20 November 2022; Accepted: 17 January 2023;
Published: 21 February 2023.
Edited by:
Jonathan Y.S. Leung, University of Adelaide, AustraliaReviewed by:
Christian Salvadeo, Universidad Autónoma de Baja California Sur, MexicoPatrick Thompson, Fisheries and Oceans Canada (DFO), Canada
Copyright © 2023 McClure, Haltuch, Willis-Norton, Huff, Hazen, Crozier, Jacox, Nelson, Andrews, Barnett, Berger, Beyer, Bizzarro, Boughton, Cope, Carr, Dewar, Dick, Dorval, Dunham, Gertseva, Greene, Gustafson, Hamel, Harvey, Henderson, Jordan, Kaplan, Lindley, Mantua, Matson, Monk, Moyle, Nicol, Pohl, Rykaczewski, Samhouri, Sogard, Tolimieri, Wallace, Wetzel and Bograd. This is an open-access article distributed under the terms of the Creative Commons Attribution License (CC BY). The use, distribution or reproduction in other forums is permitted, provided the original author(s) and the copyright owner(s) are credited and that the original publication in this journal is cited, in accordance with accepted academic practice. No use, distribution or reproduction is permitted which does not comply with these terms.
*Correspondence: Michelle M. McClure, bWljaGVsbGUubWNjbHVyZUBub2FhLmdvdg==
†Present address: Melissa A. Haltuch, Alaska Fisheries Science Center, National Oceanic and Atmospheric Administration, National Marine Fisheries Service (NOAA NMFS), Seattle, WA, United States