 Francesco Mugnai1
 Barbara Mikac2*
 Marina Antonia Colangelo1,3,4*
 Kenan Oguz Matterson1
 Marco Abbiati2,3,4
 Federica Costantini1,3,4
- 1Dipartimento di Scienze Biologiche, Geologiche e Ambientali, Università di Bologna, Ravenna, Italy
- 2Dipartimento di Beni Culturali, Università di Bologna, Ravenna, Italy
- 3Consorzio Nazionale Interuniversitario per le Scienze del Mare (CoNISMa), Rome, Italy
- 4Centro Interdipartimentale di Ricerca per le Scienze Ambientali, Università di Bologna, Ravenna, Italy
Monitoring spatial and temporal changes of marine benthic communities using standardized procedures is essential to take necessary steps towards conservation of marine ecosystems. In this study we combined Artificial Substrate Units (ASUs) for sampling of benthic communities, with integrative taxonomy approach that incorporated morphological identification of organisms and COI DNA metabarcoding, to characterize the diversity of communities at three locations across the Central Mediterranean Sea (Livorno and Palinuro, Italy; Rovinj, Croatia) in 2019 and 2020. Significant differences in the communities’ structure were observed both at large spatial scale between sampled locations, and at small spatial scale (less than ten kilometers) between sites. Moreover, significant temporal variability in species richness and structure of benthic assemblages was detected, with higher richness in 2020. Revealed variability can probably be attributed to the peculiar geomorphological, oceanographical, and ecological features of locations, but also to the influence of interplaying local chemical and physical factors and biological processes such as species settlement, competition, and migration that can act at small spatial and temporal scales. The similarity in the species composition and community structure accessed by morphological and metabarcoding approaches was low, with only 16% of the species (out of 133 species identified overall) commonly detected by both approaches. This is mostly both due to a lack of data on COI sequences of numerous benthic invertebrates in the public barcoding databases on the one hand, and difficulties in detecting small and cryptic taxa through morphological analyses on the other. This suggests that combining of two approaches is required to fully describe the biodiversity of benthic assemblages. Finally, comparison of the spatial variability of the benthic communities’ structure with two approaches at different taxonomic levels, indicated that genus and family levels give results that are consistent to those obtained by the species level. This suggests that family level might be satisfactory in monitoring the spatial-temporal variability of Mediterranean hard bottom benthic communities.
1 Introduction
Characterization of marine benthic communities is fundamental for monitoring spatial and temporal biodiversity changes in response to climate and anthropogenic stressors (Pecl et al., 2017; Blowes et al., 2019; Duarte C et al., 2020). While the assessment of benthic communities can be performed using different methods, the use of an integrative approach (Schlick-Steiner et al., 2010) can be considered a key tool to their full characterization (Sheth and Thaker, 2017; Daglio and Dawson, 2019). Studies that rely uniquely on the identification of the organisms based on the morphology or on the use of molecular tools such as DNA barcoding and metabarcoding (Valentini et al., 2016) may lead to uncertainties in species identification and to underestimation of species richness and thus reducing the accuracy of the assessments (Schlick-Steiner et al., 2010). Moreover, morphological analyses are time consuming and highly dependent on the taxonomic expertise (de Carvalho et al., 2007), whereas molecular identification of species depends on technical constraints in extraction and markers variability as well as information available in online barcoding databases (Mugnai et al., 2021). Additionally, the two approaches can lead to a different taxonomic resolution that can affect the detection of significant spatial and temporal variability in the community structure. A meta-analysis of all available studies comparing traditional morphological methods and DNA metabarcoding by Keck and colleagues (2022), evidenced that DNA metabarcoding provides diversity estimates (expressed as species richness) that are globally consistent to those obtained using traditional methods. Nevertheless, until now, studies evaluating at what taxonomic level (taxonomic sufficiency, see Olsgard et al., 1998; Olsgard and Somerfield, 2000; Lasiak, 2003) these approaches can better capture benthic biodiversity have been scarce in the marine realm, where they have primarily focused on diversity indices and on north Atlantic Europe (see Cahill et al., 2018; Keck et al., 2022). To our knowledge no studies investigate how the spatial structure of the marine benthic communities accessed by metabarcoding, is affected by the taxonomic resolution.
Another critical issue to address in biodiversity assessments is the standardization of sampling, which can often result in non-comparable and non-reproducible studies across space, time, and research teams (Ransome et al., 2017). In this regard, the use of Standardized Sampling Structures (SSS), such as artificial tiles (Underwood and Chapman, 2006) and nylon pan scourers (namely here ASUs – Artificial Substrate Units; Schoener, 1974), have been reported as an effective solution (Gee and Warwick, 1996; Ransome et al., 2017; Di Camillo et al., 2018; Carreira-Flores et al., 2020). ASUs, unlike artificial tiles, are easy to deploy and are formed by interstices resembling sponges and algae holdfasts, acting as species collectors by providing a habitat for the settlement, recruitment, and growth of small fauna and/or taxa in their early life stages, namely cryptofauna (Dennis and Aldhous, 2004). Cryptofauna is a crucial component of marine hard-bottom communities, playing a significant role in ecosystem functioning (Monroy-Velázquez et al., 2020; Palomino-Alvarez et al., 2021). The cryptofauna, characterized mainly by small invertebrates hiding in crevices and niches (Dennis and Aldhous, 2004; Carvalho et al., 2019), is difficult to be sampled and analyzed, and its presence is often underestimated during benthic surveys (Fraschetti et al., 2005; Carvalho et al., 2019; Ip et al., 2022). Standardized sampling structures and methods such as ASUs combined with metabarcoding can overcome that problem. ASUs are already used to measure diversity and community composition and structure of benthic marine cryptofauna in different regions of the globe, including the western Mediterranean Sea (Cahill et al., 2018; Monroy-Velázquez et al., 2020; Palomino-Alvarez et al., 2021). However, several regions of the Mediterranean Sea are still scarcely known in terms of their benthic diversity. Herein, we deployed ASUs in three distinct locations of the Central Mediterranean Sea (Livorno and Palinuro, Italy; Rovinj, Croatia) and we characterized the structure of benthic communities developed in two consecutive years (2019 and 2020) using morphological and metabarcoding approaches. Specifically, we (i) assessed the spatial and temporal (2019-2020) variability of the communities using a traditional approach based on morphological characters and we (ii) analyzed the assemblages collected in 2019 using a COI metabarcoding approach to evaluate their variability at different spatial scales. We then (iii) compared traditional morphological identification and DNA metabarcoding and analyzed at which taxonomic level morphological and metabarcoding methods can detect the spatial variability of benthic assemblages. This study will fill the current gap in the knowledge of biodiversity of hard bottom benthic communities in the Central Mediterranean Sea, providing a baseline for future monitoring and will give recommendations on the most effective methodology to be applied in future research.
2 Materials and methods
2.1 Sampling design
The Artificial Substrate Units sample (hereafter “ASUs sample”) was made up of three nylon pan scorers tied together with a cable tie and attached to a stainless-steel rod that was anchored to the substrate. ASUs samples were deployed by scuba diving at a depth ranging from 14 to 25 m in three locations across the Central Mediterranean Sea: Rovinj (Croatia, North Adriatic Sea), Palinuro (Italy, South Tyrrhenian Sea) and Livorno (Italy, North Tyrrhenian Sea). Within each location, three sites were randomly selected at some kilometers of distance from each other: Rovinj: Piccola Figarola (FIG), Bagnole (BAG), San Giovanni (SAN); Palinuro: Punta Spartivento (SPA), Cala del Ribatto (RIB), Costa Azzurra (COS) and Livorno: Calafuria (CAL), Sonnino (SON), Isola (ISO) (Figure 1, Table S1). In each site, three ASUs samples were randomly deployed a few meters apart from each other, in summer 2018 and recovered in summer 2019 (Year 1), while new ASUs samples were deployed in summer 2019 and recovered in summer 2020 (Year 2). Each ASUs sample was recovered by placing it inside a plastic bag for preventing the loss of organisms, paying attention not to touch the collected sample to avoid contamination. Due to exceptional rough maritime conditions, two ASUs samples were lost in winter 2019 (one in Livorno, SON site, and one in Palinuro, SPA site) and two in winter 2020 (both in Palinuro, RIB site). Thus, a total of 50 ASUs samples were processed across the two years (25 ASUs samples per each year).
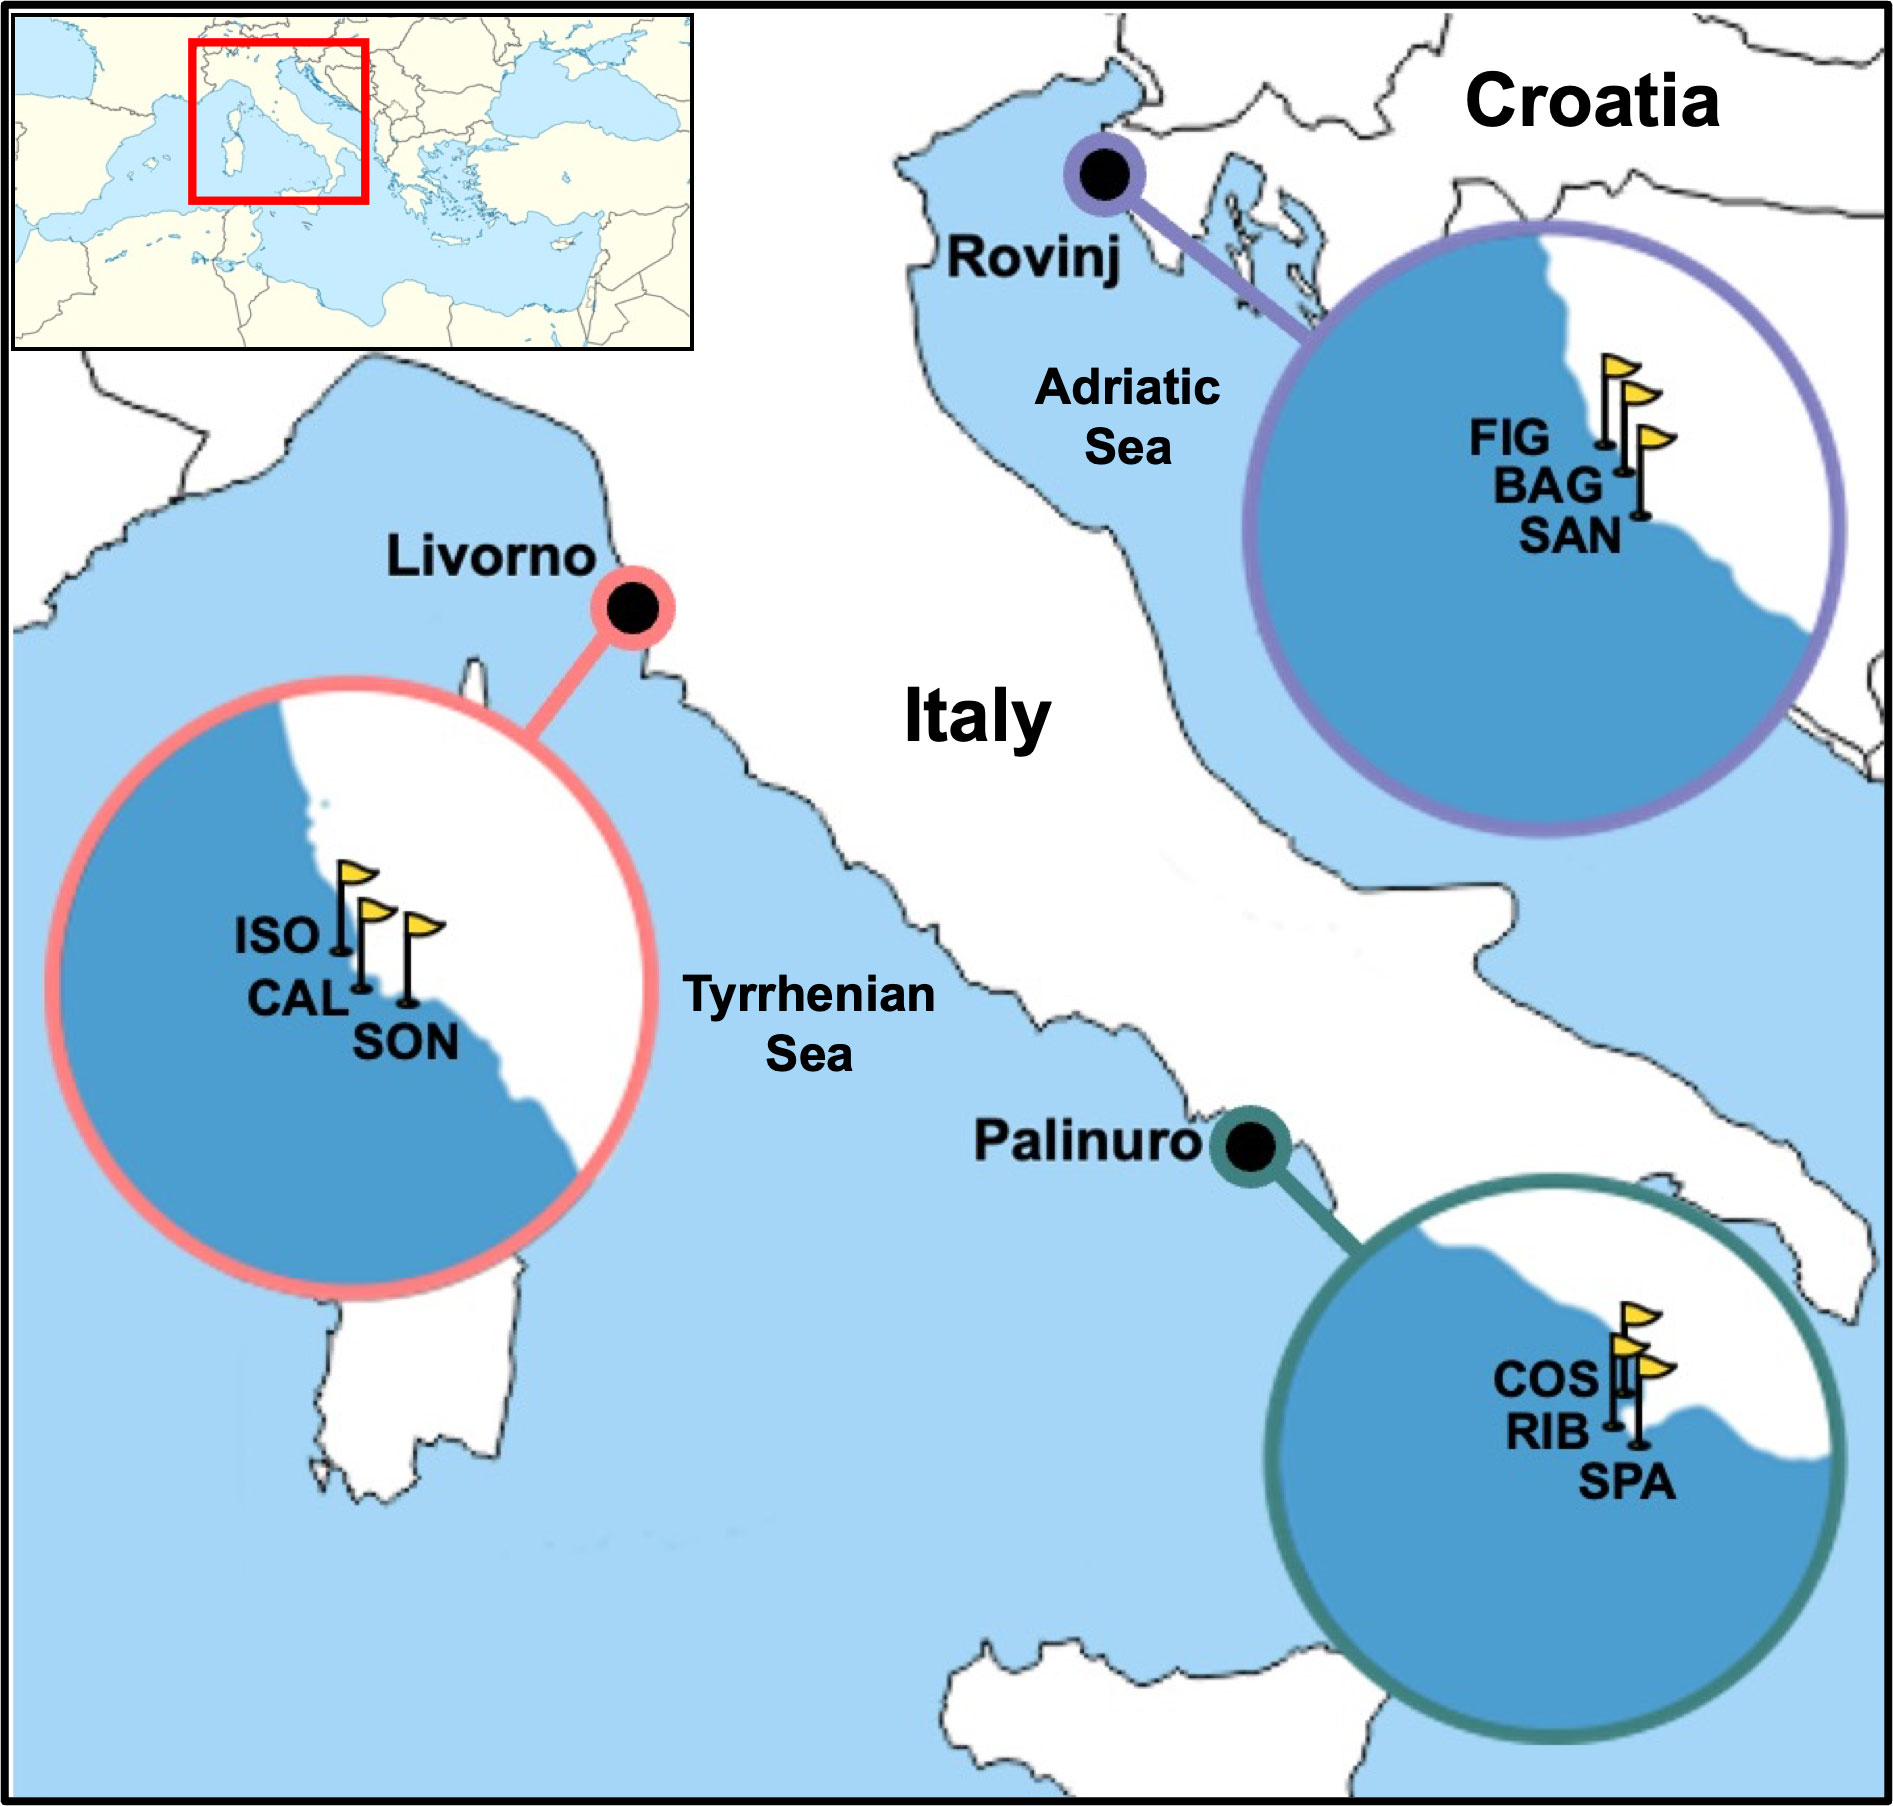
Figure 1 Sampling locations (Livorno and Palinuro, Italy; Rovinj, Croatia; represented by dots) and relative sampling sites (represented by yellow flags in each zoomed circle). Calafuria (CAL), Isola (ISO), Sonnino (SON), Costa Azzurra (COS), Cala del Ribatto (RIB), Punta Spartivento (SPA), Bagnole (BAG), Piccola Figarola (FIG), San Giovanni (SAN).
In laboratory, ASUs samples were placed in 1 L plastic jars with molecular-grade absolute ethanol, and the water content of the plastic bag was added after sieving at 40 µm sterile stainless-steel sieve. The jars were then stored at 4°C until processing. At each step, all the consumables were bleached to prevent sample cross-contamination.
The morphological identification of specimens was performed on one ASUs sample (replicate) randomly chosen per each site, for a total of nine samples per each time. The COI metabarcoding was only performed on all 2019 ASUs samples. See Figure S1 for a general outline about sample processing.
2.2 Morphological identification
In laboratory, the three pan scourers that made up each ASUs sample were separated. Each pan scourer was shaken vigorously in a bucket containing 5 L deionized water to remove loose material and organisms. Then, each pan scourer was unraveled to pick out the remaining organisms that remained stuck in the mesh, under the stereoscope.
The bucket content was then sieved through embedded 500 µm and 40 µm sterile stainless-steel sieves. The macrofaunal fraction (≥ 500 µm) was stored apart in molecular-grade absolute ethanol in a 250 mL sterile plastic jar to perform morphological identification of the organisms. The remaining sample fraction (40-500 µm) was stored in another sterile 250 mL plastic jar filled with 95% absolute ethanol. To avoid any possible external contamination the bench and all laboratory material used were bleached between one ASUs sample and the other.
The organisms were initially separated under stereoscope into four major taxonomic groups: Annelida, Arthropoda, Echinodermata, Mollusca. All the organisms that did not fit into these groups were placed in the “Others” group. For each taxonomic group, the organisms were identified using stereoscope and light microscope to the lowest taxonomic level possible with the help of the dichotomous keys and other relevant scientific literature, and then counted. The organisms belonging to the group “Others” were only counted, but not identified (see Table S2 for the complete list of taxa found in ASUs samples over the two sampling years). After identification, all the macrofaunal organisms from each ASUs sample were merged with their respective 40-500 µm fraction for further genetic analysis (hereafter “DNA bulk sample”).
2.3 Metabarcoding analysis
To obtain a well-homogenized product, each DNA bulk sample was transferred into an ice blender and blended at full speed for 15 seconds. The homogenate was poured into the 40 μm mesh net and washed with molecular-grade absolute ethanol several times. The resulting wet homogenate was gently squished to let the aqueous phase go through the net to dry the fraction as much as possible. This dried homogenate was then placed in a sterile 15 ml falcon tube with molecular-grade absolute ethanol, shaken vigorously and stored at -20°C.
The DNA extraction on about 1 ml of each sample was carried out using the Macherey-Nagel NucleoSpin Soil kit (Thermo Fisher Scientific Inc., Waltham, MA, USA) (Mahmoudi et al., 2011) following the protocol provided by the manufacturer. Each DNA extract was quantified using a Qubit 2.0 fluorometer (Thermo Fisher Scientific Inc., Waltham, MA, USA) using the Invitrogen Qubit dsDNA BR Assay Kit. Samples were amplified using the newly designed degenerate primer set targeting a 313-bp fragment of cytochrome c oxidase subunit 1 (COI) (forward IIICRrev: GGNTGAACNGTNTAYCCNCC; reverse HBR2d: TAWACTTCDGGRTGNCCRAARAAYCA) that has been developed to amplify a wide range of phyla across eukaryotes and algae. Forward and reverse primers were indexed with 11–13 nucleotide long tags differentiated by at least three different nucleotides (for details see: Corse et al., 2017), and a 0 to 3 nt heterogeneity spacer (none/N/NN/NNN) was added to mitigate the issues caused by low sequence diversity in Illumina amplicon sequencing (Fadrosh et al., 2014). A unique combination of tags was used for each sample. A high sensitivity Taq polymerase was employed (Qiagen Multiplex PCR Kit, Qiagen, Hilden, Germany), and the PCR reaction was performed in 15 ml of final volume (7.5 μl of Multiplex Mastermix, 2.5 μl molecular grade water, 1.5 μl of each 10 mM primer, 2 μl of DNA) using a 2720 thermal cycler by Applied Biosystems (Thermo Fisher Scientific Inc., Waltham, MA, USA). Extraction controls consisting of negative (aerosol and nuclease-free water samples) and positive (known DNA pools of marine and terrestrial multi-species mock communities, data available under request to Dubut V.) controls were included in all PCR reactions. The methodology is described in Thomasdotter et al. (in press). The used amplification protocol was as it follows: (i) 15 min 95°C, (ii) 5 cycles (30 s 95°C, 40 s 45°C, 1 min 72°C), (iii) 30 cycles (30 s 94°C, 40 s 48°C, 1 min 72°C), (iv) 10 min 72°C. Three independent PCR technical replicates were made to perform post-sequencing quality checks. Every single PCR plate content was pooled in a single 1.5 ml sterile Eppendorf tube, according to relative sample quantification using a Qubit 2.0 fluorometer. Bulk pools were purified using Macherey-Nagel NucleoSpin Gel and PCR Clean-up kit (Thermo Fisher Scientific Inc., Waltham, MA, USA), according to manufacturer’s protocol. Single indexing PCRs using a couple of individual P5, and P7 Illumina adapters were performed on each purified technical replicate pool. The total indexing PCR volume was 60 μl (19.8 µl H2O, 30 µl Mastermix, 2.1 µl of each Illumina index, 6 μl cleaned PCR pool) and was performed using Thermo Scientific Phusion High-Fidelity PCR Master Mix (Thermo Fisher Scientific Inc., Waltham, MA, USA). The indexing PCR protocol consisted in (i) 30 s 98°C, (ii) 12 cycles (40 s 98°C, 45 s 55°C, 1 min 72°C), (iii) 10 min 72°C. An electrophoresis run using 1.5% agarose gel was then performed for quality checking and correct indexed DNA bands were cut out with a scalpel and purified using Macherey-Nagel NucleoSpin® Gel and PCR Cleanup kit, following the protocol provided by the manufacturer. The three technical replicates were then quantified (Qubit 2.0 fluorometer), properly diluted and pooled at final 20 µM into a sterile 1.5 ml Eppendorf tube. A final quality check was then performed using a Bioanalyzer 2100 (Agilent Technologies, Inc., Santa Clara, CA, USA). The libraries were then sent out to a sequencing facility (Cirad, https://www.cirad.fr/en, France) and sequenced via Illumina MiSeq benchtop system using v2 chemistry (250 bp paired-end sequencing).
2.4 Bioinformatic analysis
Raw FastQ files from Illumina sequencing were supplied to us by the sequencing facility. Using FastQC software (Andrews, 2010), the quality of raw sequencing files was checked. OBITools package (Boyer et al., 2016) was used for trimming and joining forward and reverse reads, for removing unaligned sequences and for samples demultiplexing. The resulting 6 demultiplexed fastq files were then merged, and the amplicon length of 313 bp ±10% was selected. Chimeric sequences were sorted out using VSEARCH (Rognes et al., 2016), and non-chimeric ones were clustered (97%) into Molecular Operational taxonomic Units (MOTUs) using SWARM (Mahé et al., 2015) with d = 1 following indication by Brandt et al. (2021) that observed comparable OTU numbers for COI clustering at d = 1–13. Moreover, clustering at d-values higher than 1 can led to the loss of true species diversity, particularly for taxa known to be poorly resolved, as in the case of those living in marine natural habitats (Brandt et al., 2021). Singletons were removed through Metabarpark scripts (https://github.com/metabarpark/R_scripts_metabarpark), and the taxonomic assignment involved RDP Classifier (Lan et al., 2012) with default parameters. The COI barcoding reference database employed was COInr-Med+, which includes marine-only Mediterranean taxa, basing on OBIS (www.obis.org) and including new barcodes from central-western Mediterranean Sea (Mugnai et al., 2023). Possible contamination of samples was checked removing MOTUs present in negative and positive controls employed. All the above commands were run individually per each of the three technical replicates, and a final MOTUs table including mean values of the three runs was obtained. The final MOTUs table was normalized to the minimum library size using the online platform MicrobiomeAnalyst (https://www.microbiomeanalyst.ca, MDP protocol), with default normalization parameters. From this normalized MOTUs table, taxonomic lineages were assigned and 0.8 bootstrap threshold (Wang et al., 2007) was chosen for the taxonomic assignments of MOTUs per each taxonomic level (Claesson et al., 2009) (Table S3).
2.5 Data analysis
Descriptive faunal analyses of the main taxonomic groups were done for morphology and metabarcoding datasets. Alpha diversity as taxa/MOTUs richness (S) and faunal abundance (N) (in terms of number of individuals and number of recovered reads per MOTUs, respectively) were calculated for each sample. Permutational multivariate analysis of variance (PERMANOVA; Anderson, 2017) based on Euclidean distance matrices of untransformed data, was used to evaluate (i) spatial-temporal variability of richness and abundance of benthic communities based on morphology (two factors: Location and Year crossed), and (ii) variability of richness and abundance of benthic communities at different spatial scales based on metabarcoding data (two factors: Location and Site nested in Location). To visualize similarity in community structure among samples for each method and sampling design, non-metric multidimensional scaling (nMDS) was performed. Then, differences in the community structure for each of the two-factor models were analyzed by PERMANOVA based on Bray-Curtis similarity of fourth root transformed data.
The similarity percentages analysis (SIMPER; Clarke, 1993) was performed on morphologic data to identify taxa that most contributed to dissimilarities in community structure detected trough morphology among Locations and Years.
To evaluate the effect of taxonomic sufficiency, the following analyses were performed on 2019 datasets. First, the data for the same 9 replicates used for the morphologic analysis were extracted from the whole metabarcoding dataset. Then, a preliminary analysis to evaluate whether the “Others” group could influence the results was done. For each method two abundance matrices with and without the group “Others” were built. The corresponding similarity matrices obtained by Bray-Curtis index, were compared by RELATE analysis, which compares pairs of similarity matrices through the Spearman rank correlation coefficient (Rho) (Somerfield and Clarke, 1995). Owing to the very high correlation between matrices with and without the group “Others” for both methods, new matrices were obtained from the initial species-per-sample matrix by aggregating raw data at increasingly higher taxonomic levels (genus, family, order, class, and phylum) without the “Others” group. Specifically, for the metabarcoding dataset, we performed the aggregation matrices starting from the species matrix obtained keeping the MOTUs by filtering for bootstrap values ≥ 0.80. For each taxonomic level for both methods, similarity matrices were obtained by Bray-Curtis similarity after the fourth root transformation. The similarity in community structure among Locations for each matrix was displayed by nMDS and formal significance tests for differences in community structure among Locations were done by one-way PERMANOVA followed by pairwise comparison when Location factor resulted significant. The resulting similarity matrices were analyzed by RELATE routine. Spearman rank correlation (Rho) was calculated between the corresponding elements of each pair of similarity matrices for species abundances and similarity matrices derived from abundances of higher taxonomic levels, separately for the morphological and metabarcoding datasets, and between morphological and metabarcoding similarity matrices at the corresponding taxonomic levels. The inter-matrix correlations matrix was used as input similarities in the creation of the ‘second stage’ nMDS ordination plot (Somerfield and Clarke, 1995) to visualize the degree of similarity among resemblance matrices obtained using various levels of taxonomic resolution for a given dataset, and between matrices obtained by the two methods at the same taxonomic resolution.
All the PERMANOVA analyses were carried out using unrestricted permutation of raw data and 9999 permutations. When significant main factors or interactions were detected, the specific procedure provided within PERMANOVA was used for a posteriori pairwise comparisons. If less than 900 unique values in the permutation distribution were available, asymptotical Monte Carlo p-values (pMC) were used instead of permutational p-values. All statistical analyses were carried out using the software PRIMER (version 7.0.21) (Clarke and Gorley, 2015, www.primer-e.com), with significant criterion for all tests set at α = 0.05.
Table comparing the species found by the morphological and metabarcoding methods in 9 samples from 2019 was created. To understand why some species were found only with one method and not with the other, for the species detected only by morphology, research of their COI sequences in NCBI (https://www.ncbi.nlm.nih.gov/nuccore) and BOLD (https://boldsystems.org/index.php) genetic databases was performed.
3 Results
3.1 Spatial-temporal variability of benthic communities based on morphological data
A total of 1,775 and 4,037 specimens of macrofaunal invertebrates were retrieved in 2019 and 2020 ASUs samples respectively, belonging to 211 taxa from the four phyla: Annelida, Arthropoda, Echinodermata, Mollusca. In general, the abundance was higher in 2020 than in 2019 (Figure 2A). In 2019 Mollusca was the most abundant phylum in Rovinj, while Annelida was the most abundant in Livorno and Palinuro. In 2020 mollusks were the most abundant in all three locations, followed by annelids in Livorno and Palinuro, and arthropods in Rovinj. Echinodermata had low abundance overall with higher values in 2020. Taxa richness was also higher in 2020 than in 2019 (Figures 2B, 3). Annelida was the richest phylum overall, followed by Mollusca. Echinodermata had the lowest taxa richness across all locations and years, except for Livorno in 2019 where Arthropoda was the least rich group. Taxa richness was significantly different between Locations, Years and for their interaction (Table 1). The results of the post hoc analysis carried out on the interaction revealed that Taxa richness in 2019 was significatively higher in Rovinj compared to Livorno and Palinuro (ROV > LIV; ROV > PAL) (Table 1). Moreover, in 2020 higher taxa richness were detected in Palinuro and Rovinj in respect to 2019 (Table 1). Structure of the faunal assemblages was significatively different between Locations, Years, and for their interaction. Post-hoc tests evidenced significative differences in structure of the faunal assemblages between the locations Palinuro and Rovinj in 2019, as well as between the two Years in Palinuro and Rovinj (Table 2). The nMDS plot confirmed differences in the structure of the faunal assemblages between Years and between Locations within Years (Figure 4). In 2019, SIMPER analysis (Table S3) evidenced the highest average dissimilarity in community structure between Palinuro and Rovinj (68.63%). This difference was mostly due to the higher abundance of the polychaete annelids Filograna sp. and Vermiliopsis infundibulum (Philippi, 1844) in Palinuro, and higher abundance of the bivalve Hiatella arctica (Linnaeus, 1767) in Rovinj, but also due to the exclusive presence of several species of polychaetes, crustaceans and molluscs in Rovinj. Taxa that mostly contributed to the dissimilarity in community structure between Livorno and Palinuro in 2019 (63.79%) were polychaete annelids Filograna sp., V. infundibulum and Spirobranchus cf. polytrema (Philippi, 1844) that were more abundant or exclusive (S. cf. polytrema) in Palinuro, and echinoderm Ophiotrix fragilis (Abildgaard in O.F. Müller, 1789) and the bivalve H. arctica that were more abundant in Livorno. Dissimilarity between Livorno and Rovinj in 2019 (59.95%) was mostly due to the exclusive presence of decapod crustaceans Galathea sp. and Pilumnus spinifer H. Milne Edwards, 1834 and bivalves Striarca lactea (Linnaeus, 1758) and Hiatella striata (Fleuriau de Bellevue, 1802) in Rovinj, as well as to the higher abundance of amphipod Jassa sp. also in Rovinj. Several other polychaete species present exclusively in Rovinj contributed to this difference.
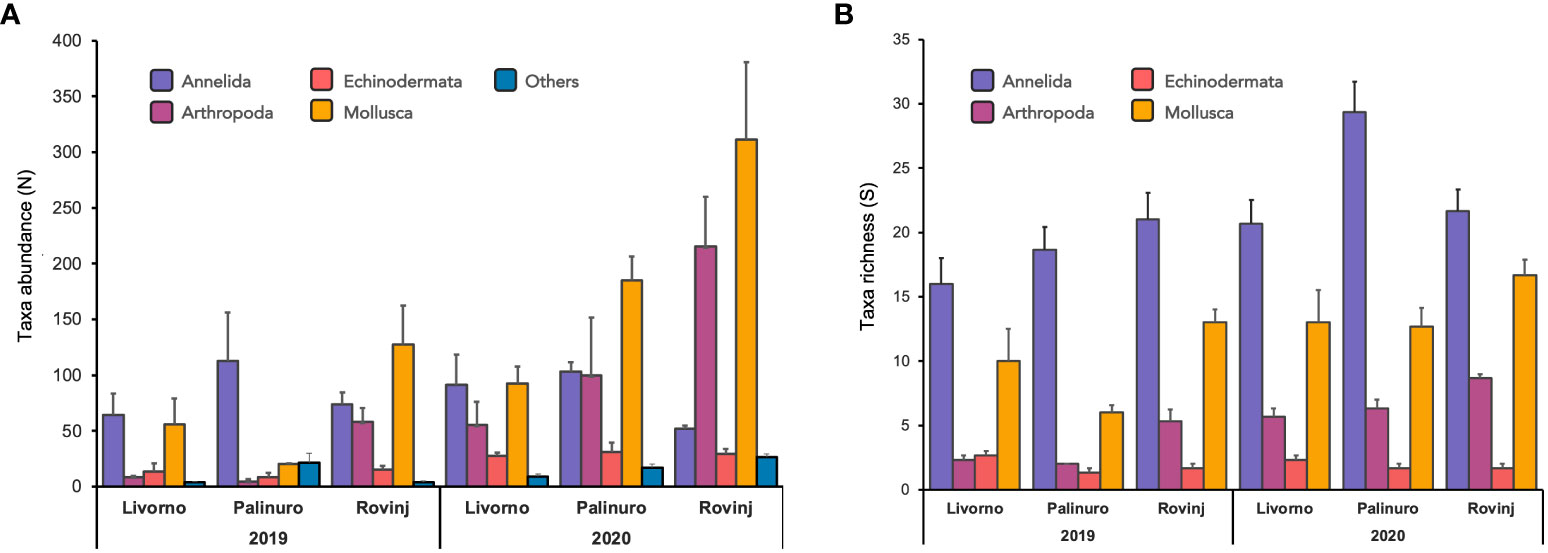
Figure 2 (A) Mean taxa abundance (± SE; n = 3) of 5 main taxonomic groups across locations and years, based on morphological analyses. Individuals not belonging to any of the four target phyla (Annelida, Arthropoda, Echinodermata, Mollusca) were only counted and included in the taxonomic group “Others”. (B) Mean taxa richness (± SE; n = 3) per phylum across locations and years, based on morphological analyses.

Figure 3 Mean taxa richness (± SE; n = 3) across Locations and Years based on morphological analyses.
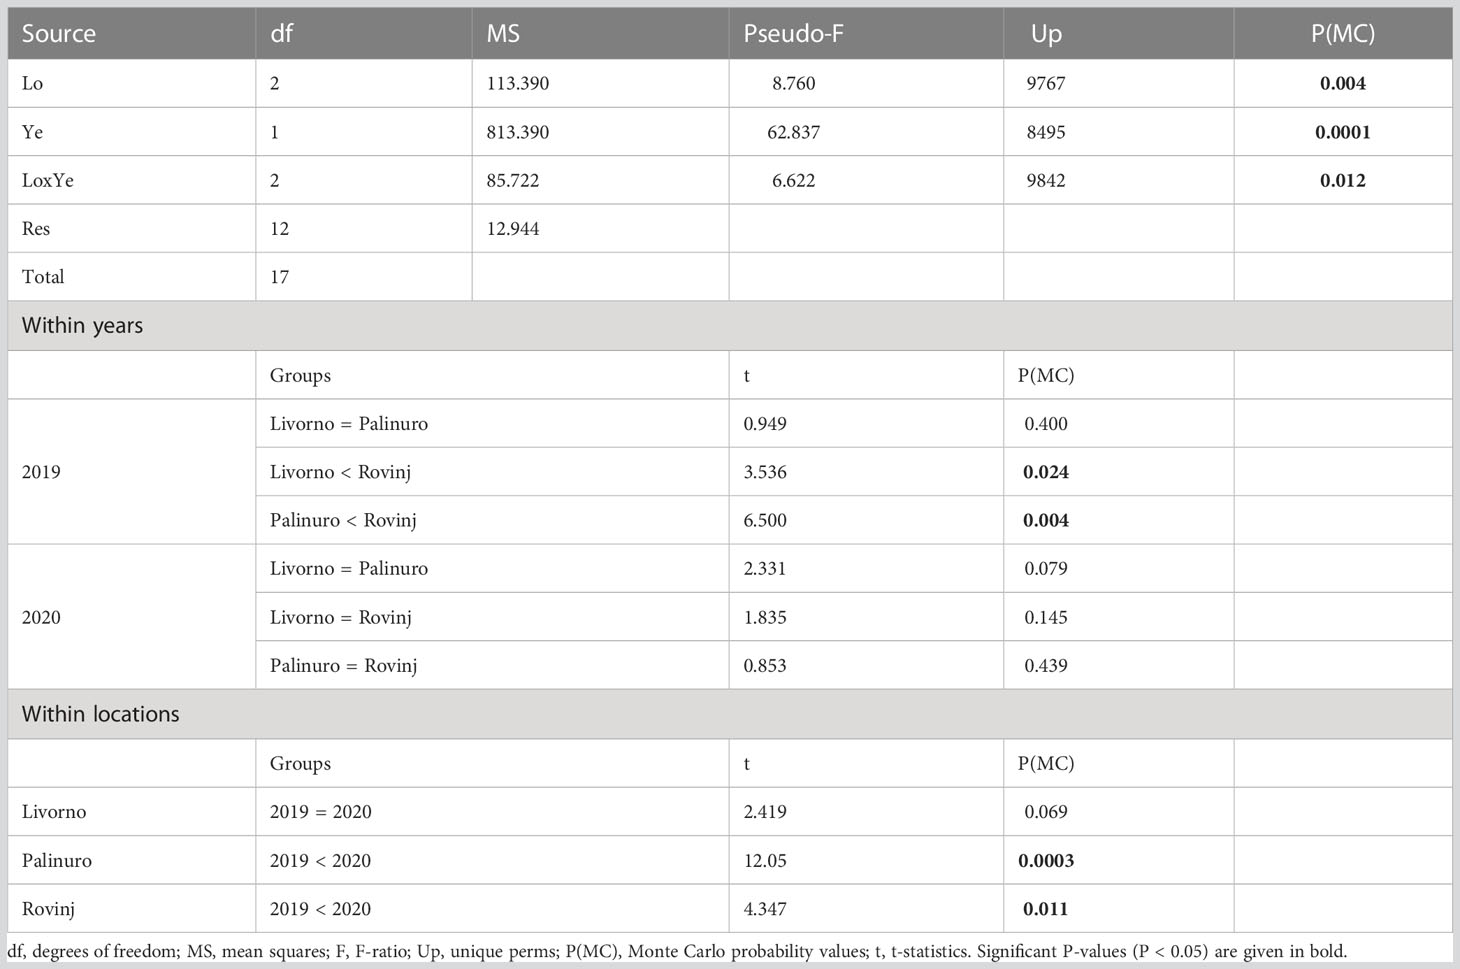
Table 1 Results of PERMANOVA analysis and post-hoc comparisons, testing for differences in taxa richness of faunal assemblages between Locations (Lo) and Years (Ye).
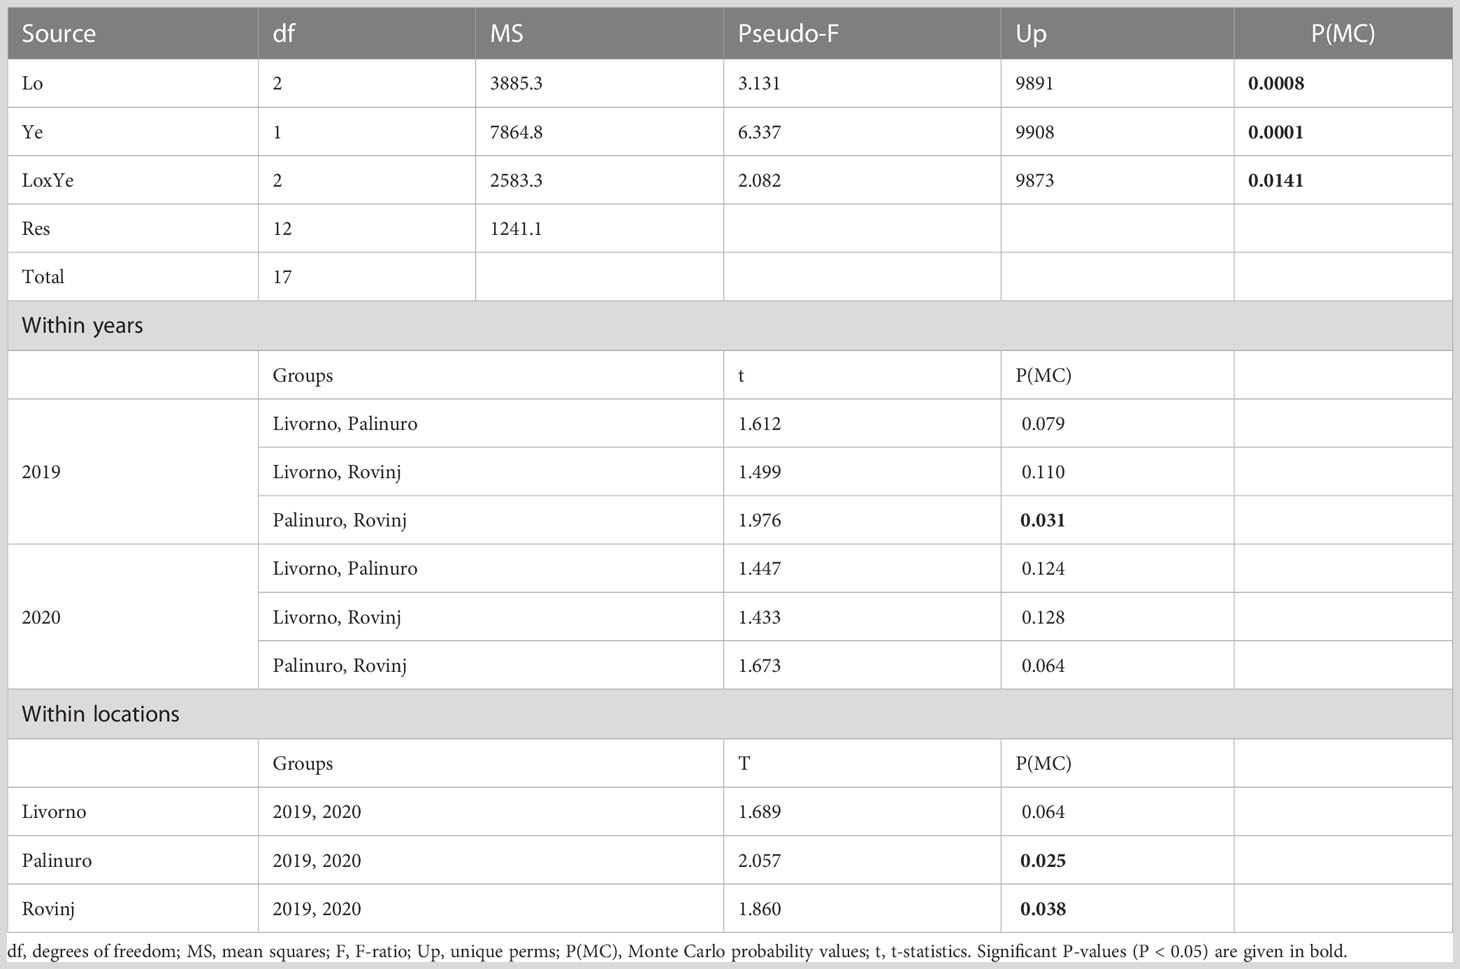
Table 2 Results of PERMANOVA analysis and post-hoc comparisons, testing for differences in structure of faunal assemblages between Locations (Lo) and Years (Ye).
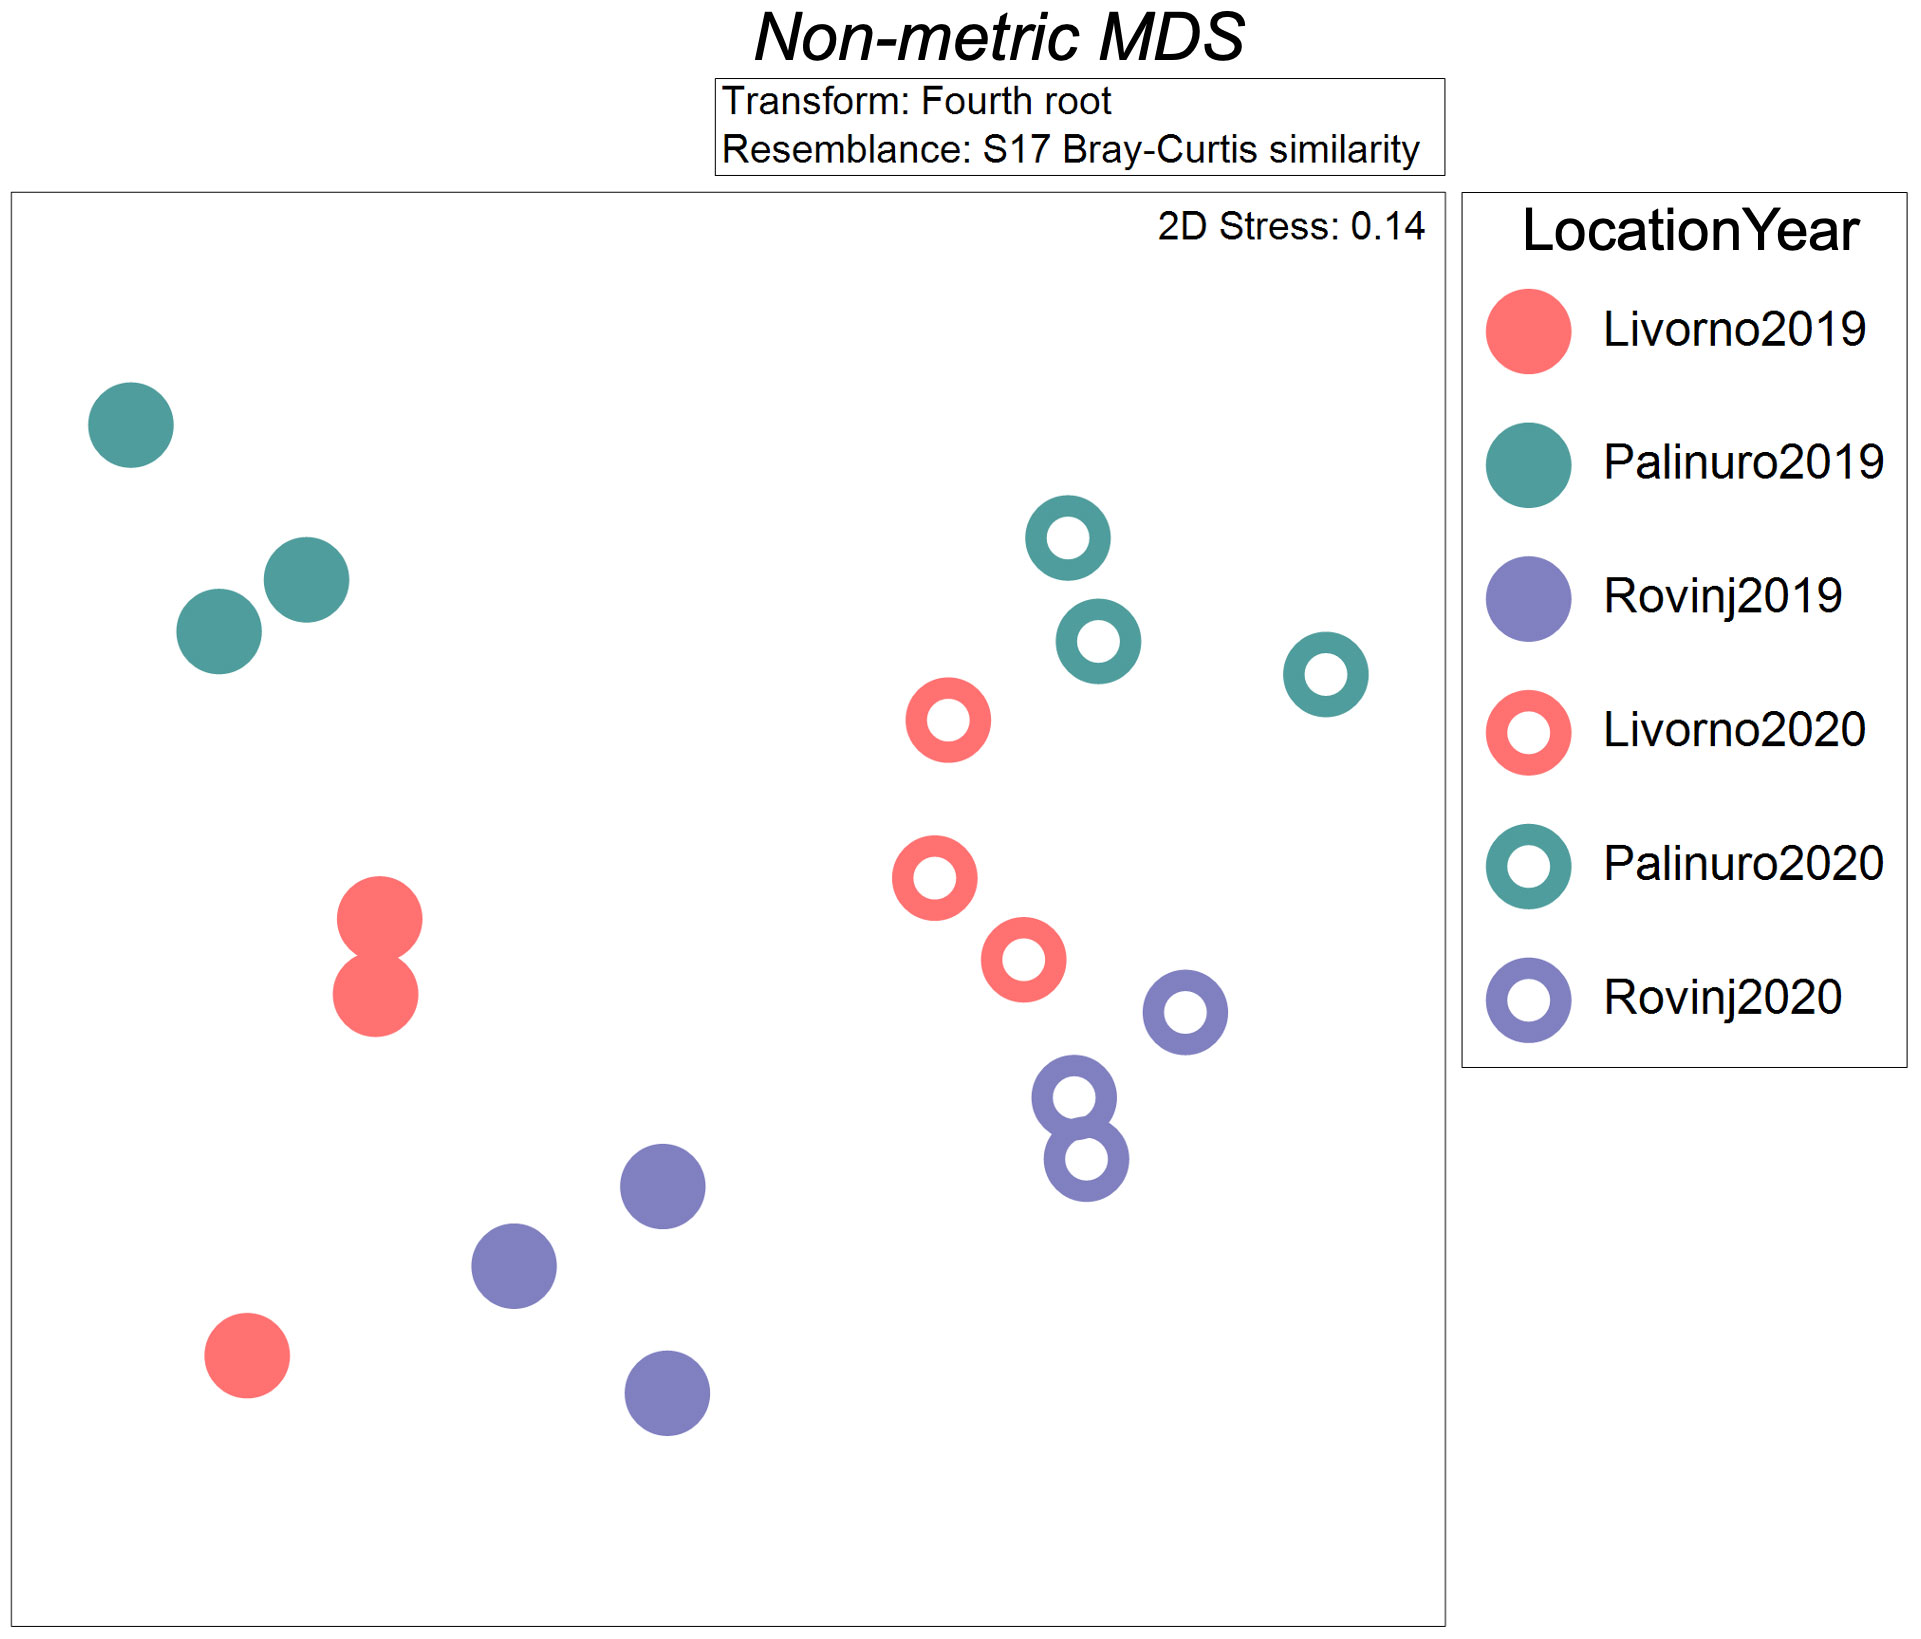
Figure 4 Non-metric multidimensional scaling (nMDS) plot of spatial and temporal structure of cryptobenthic communities based on morphological analyses, carried out on fourth root transformed data through Bray-Curtis similarity index.
In 2020, the average dissimilarities in community structures between the three locations were lower than in 2019 (Table S4). The highest average dissimilarity occurred between Palinuro and Rovinj (60.41%). Bivalves H. arctica and Limaria tuberculata (Olivi, 1792) were more abundant in Rovinj, while Arcuatula senhousia (W. H. Benson, 1842) was more abundant in Palinuro. Moreover, bivalve Nuculidae ind. and crustaceans Tanidacea ind. were exclusively present in Rovinj. Average dissimilarity in community structures between Livorno and Palinuro in 2020 (59.58%) was mostly due to the higher abundance of bivalve H. arctica and exclusive presence of bivalve Mimachlamys varia (Linnaeus, 1758) in Livorno and higher abundance of gastropod Jujubinus sp. and exclusive presence of annelid polychaete Thelepus cincinnatus (Fabricius, 1780) in Palinuro. The lowest dissimilarity in community structure in 2020 was between Livorno and Rovinj (56.10%) and was mostly due to the higher abundance or exclusive presence of several mollusks and crustaceans in Rovinj. Crustaceans Tanaidacea ind. and Isopoda ind., gastropode Jujubinus sp. and bivalve H. arctica were more abundant in Rovinj, while bivalves Nuculidae ind. were exclusively present in Rovinj. Comparing community structure between 2019 and 2020 at each location, the highest difference resulted in Palinuro (72.86%) (Table S4) because of the presence of the polychaete Filograna sp. only in 2019, and the presence of crustacean Jassa sp., the gastropod Jujubinus sp. and the polychaetes Hesiondae ind. only in 2020. Moreover, gastropod Bittium reticulatum (da Costa, 1778) was more abundant in 2020. Numerous other species appeared exclusively in 2020, contributing to the difference in community structure between the two years in Palinuro Location. In Livorno, the average dissimilarity in community structure between 2019 and 2020 resulted 66.54% and was mostly due to the higher abundance or exclusive presence of several species of polychaetes, mollusks and crustaceans in 2020. The lowest average dissimilarity in community structures between 2019 and 2020 was noticed in Rovinj (62.18%) and was particularly due to the higher abundance or exclusive presence of several species of mollusks and crustaceans in 2020.
3.2 Spatial variability of the communities based on COI metabarcoding data
A total of 13,258 MOTUs were obtained after contamination checking and bootstrap threshold filtering procedures, dropping to 596 MOTUs after data normalization (Table S3). To better describe the communities of the ASUs samples, MOTUs were then grouped into the same five categories considered for the morphological approach (Annelida, Polychaeta, Mollusca, Echinodermata, and Others; see Table S5 for reads abundance per each taxonomic level). Annelida resulted to be the most abundant phylum in all Sites and Locations, followed by Arthropoda (Figure 5A, Table S5A). The exception was for RIB site (Palinuro), where Arthropoda resulted the most abundant phylum, followed by Annelida. Mollusca and “Others” had similar abundances, and their differences in abundance depended on sites. The “Others” group was mainly composed of Cnidaria (60-80%) and Porifera (18-35%), followed by Chordata (1-8%) and Bryozoa (1-3%). A very low presence of Myzozoa, Nematoda, Nemertea and Platyhelminthes were detected as well, albeit not accounting for more than 1% in total. After removing the “Others” group, Arthropoda resulted the richest phylum in all sites and locations, with higher values in Livorno, followed by Annelida which showed the similar pattern (Figure 5B). Mollusca and Echinodermata resulted evenly distributed across all Sites, with the former accounting for 3-4 times more species than the latter.
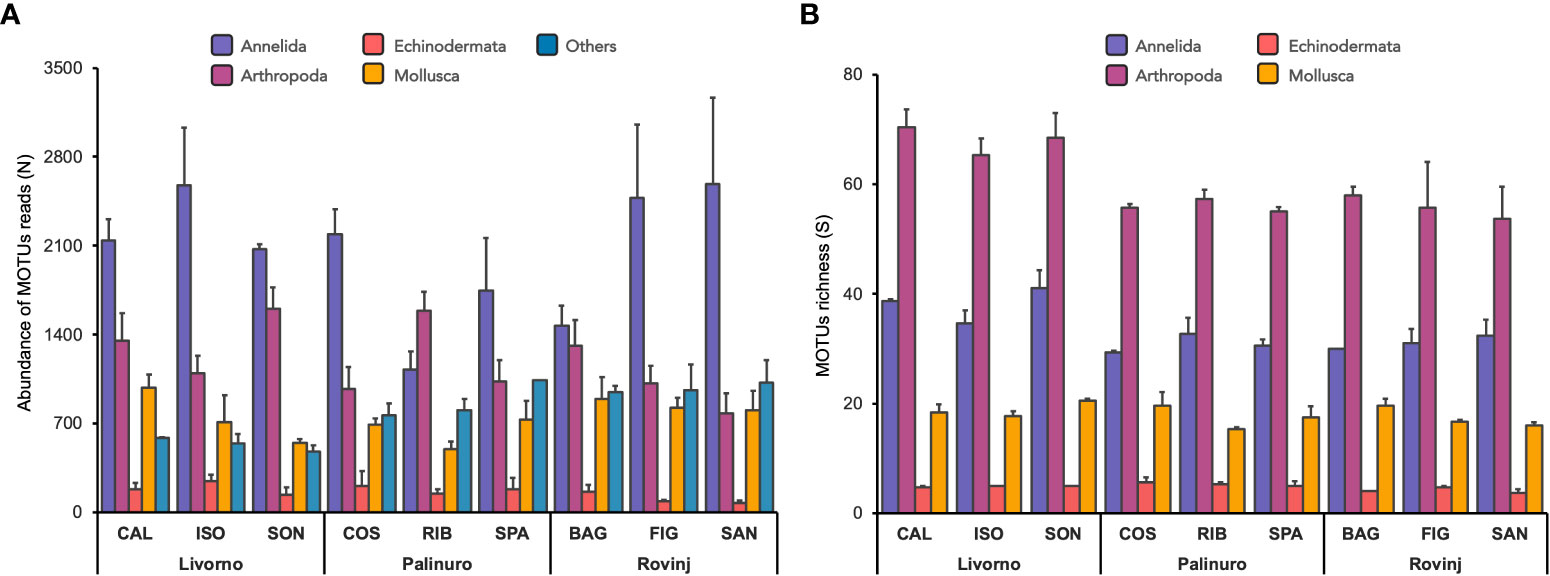
Figure 5 (A) Mean abundance of MOTUs reads (± SE; n = 3) of 5 main taxonomic groups across locations and sites. The group “Others” includes the phyla Bryozoa, Chordata, Cnidaria, Myzozoa, Nematoda, Nemertea, Platyhelminthes, Porifera, Sipuncula. (B) Mean MOTUs richness (± SE; n = 3) per phylum across locations and years.
Although Livorno accounted for 20% MOTUs more than Palinuro and Rovinj (which were comparable in terms of MOTUs richness), no significant differences in MOTUs richness were revealed between Locations and Sites (Table 3, Figure 6).
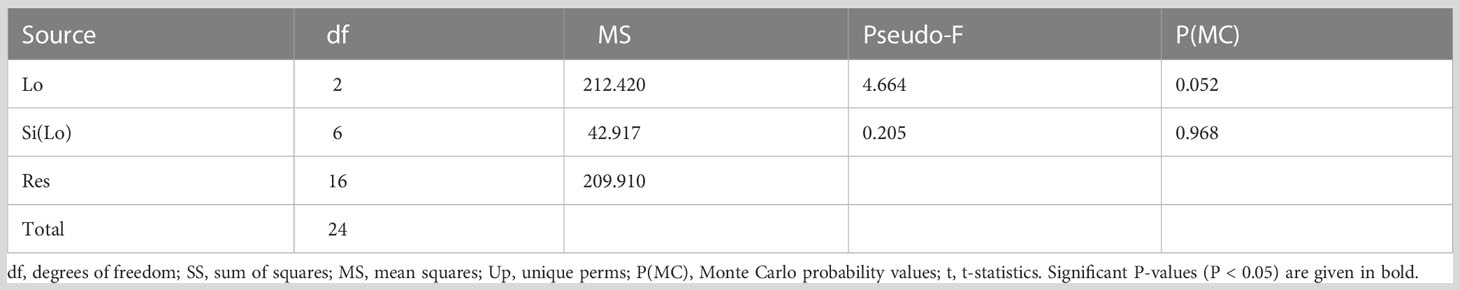
Table 3 Results of PERMANOVA analysis testing for differences in MOTUs richness of faunal assemblages between Locations (Lo) and Sites (Si).
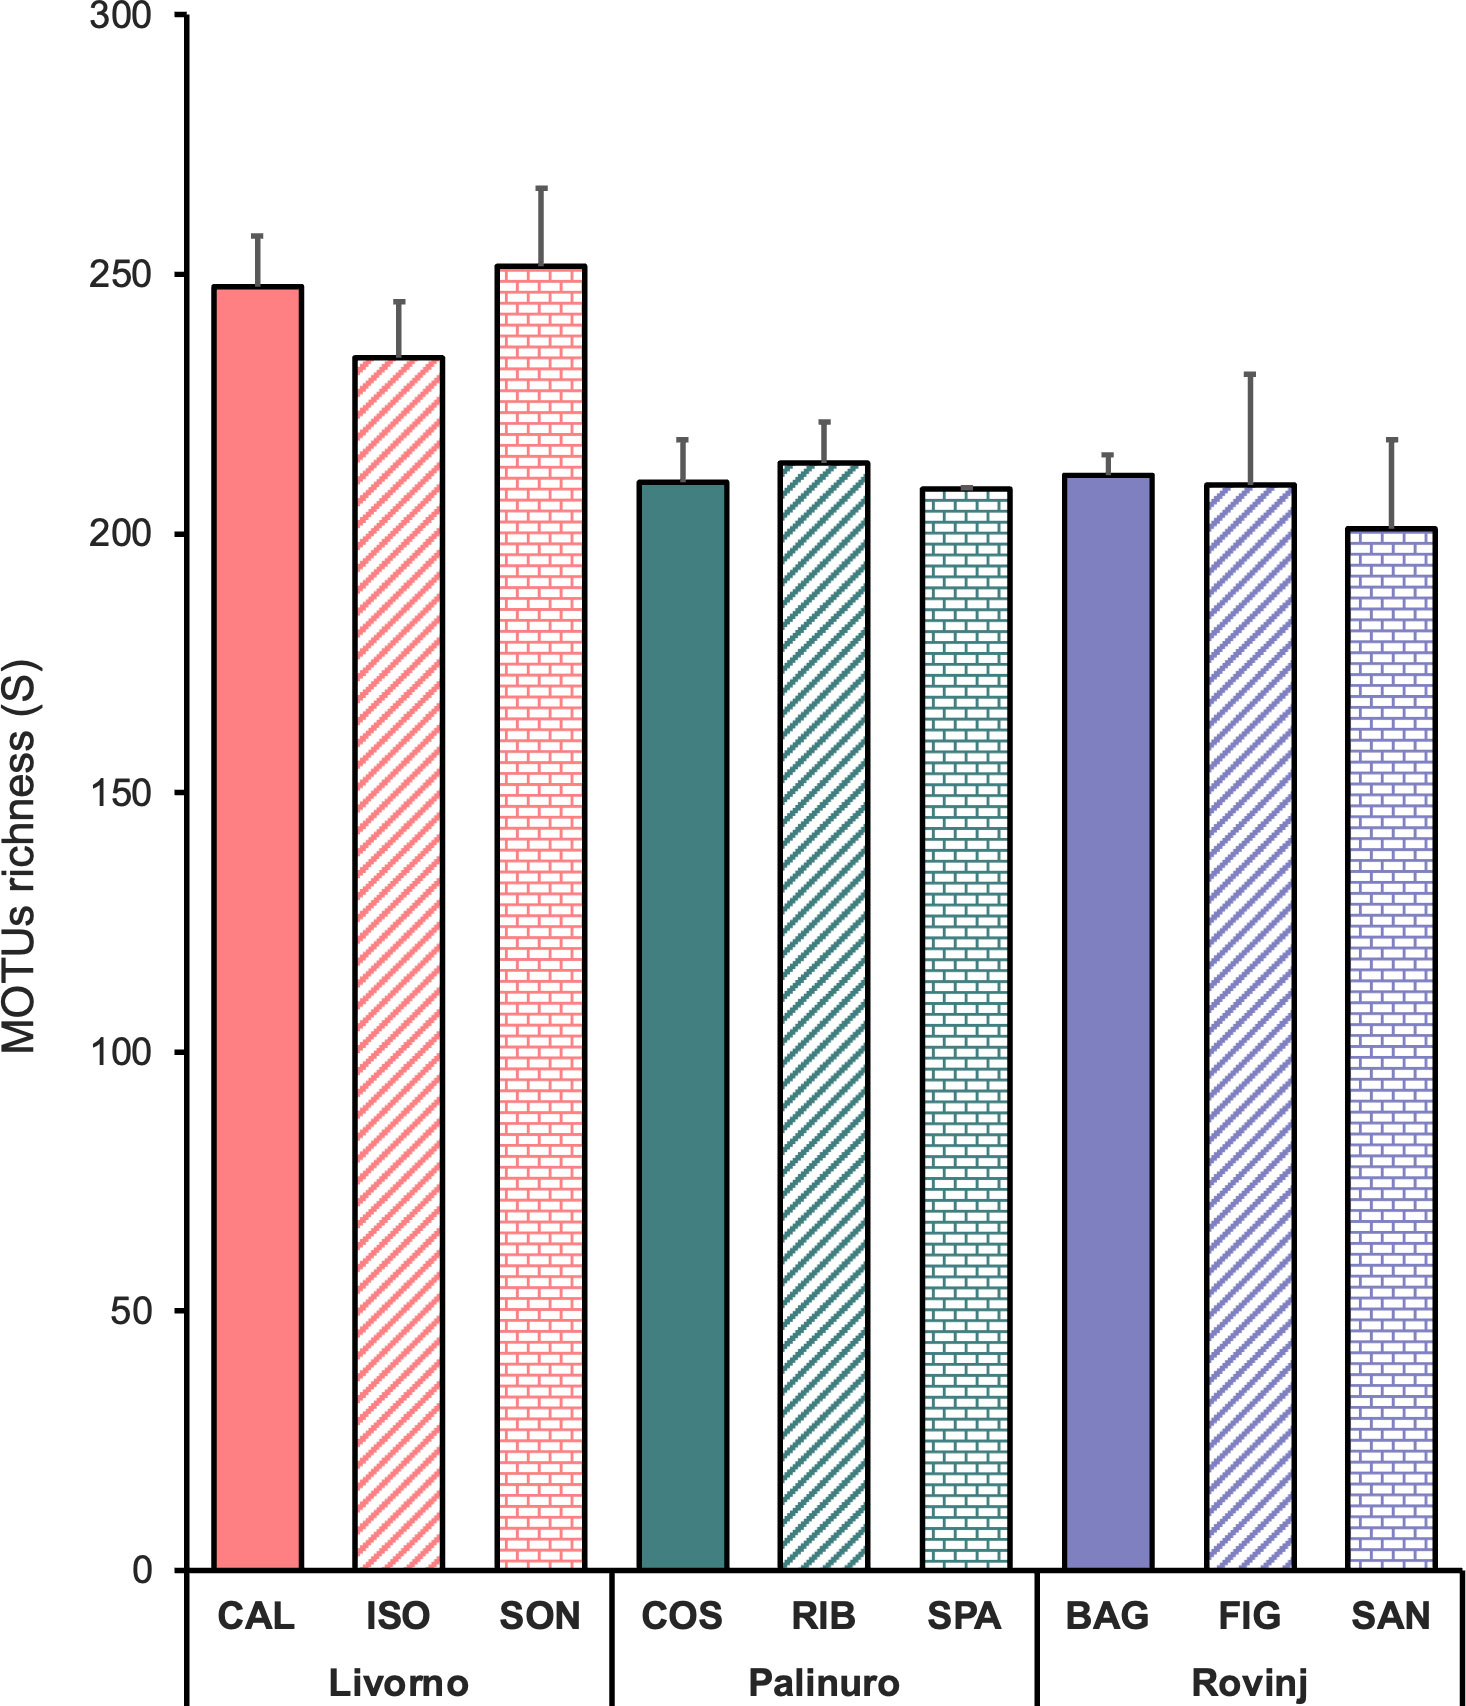
Figure 6 Mean MOTUs richness (± SE; n = 3) among locations and sites, belonging to the four phyla Annelida, Arthropoda, Echinodermata and Mollusca.
The nMDS plot showed a relatively clear separation of the communities’ structure among Locations, but also a high variability within each Location (Figure 7). In fact, PERMANOVA evidenced statistically significant differences in the structure of benthic communities based on metabarcoding analyses across Locations and Sites nested in Locations. Post-hoc tests indicated significant differences between Livorno and Rovinj, and between Livorno and Palinuro (Table 4).
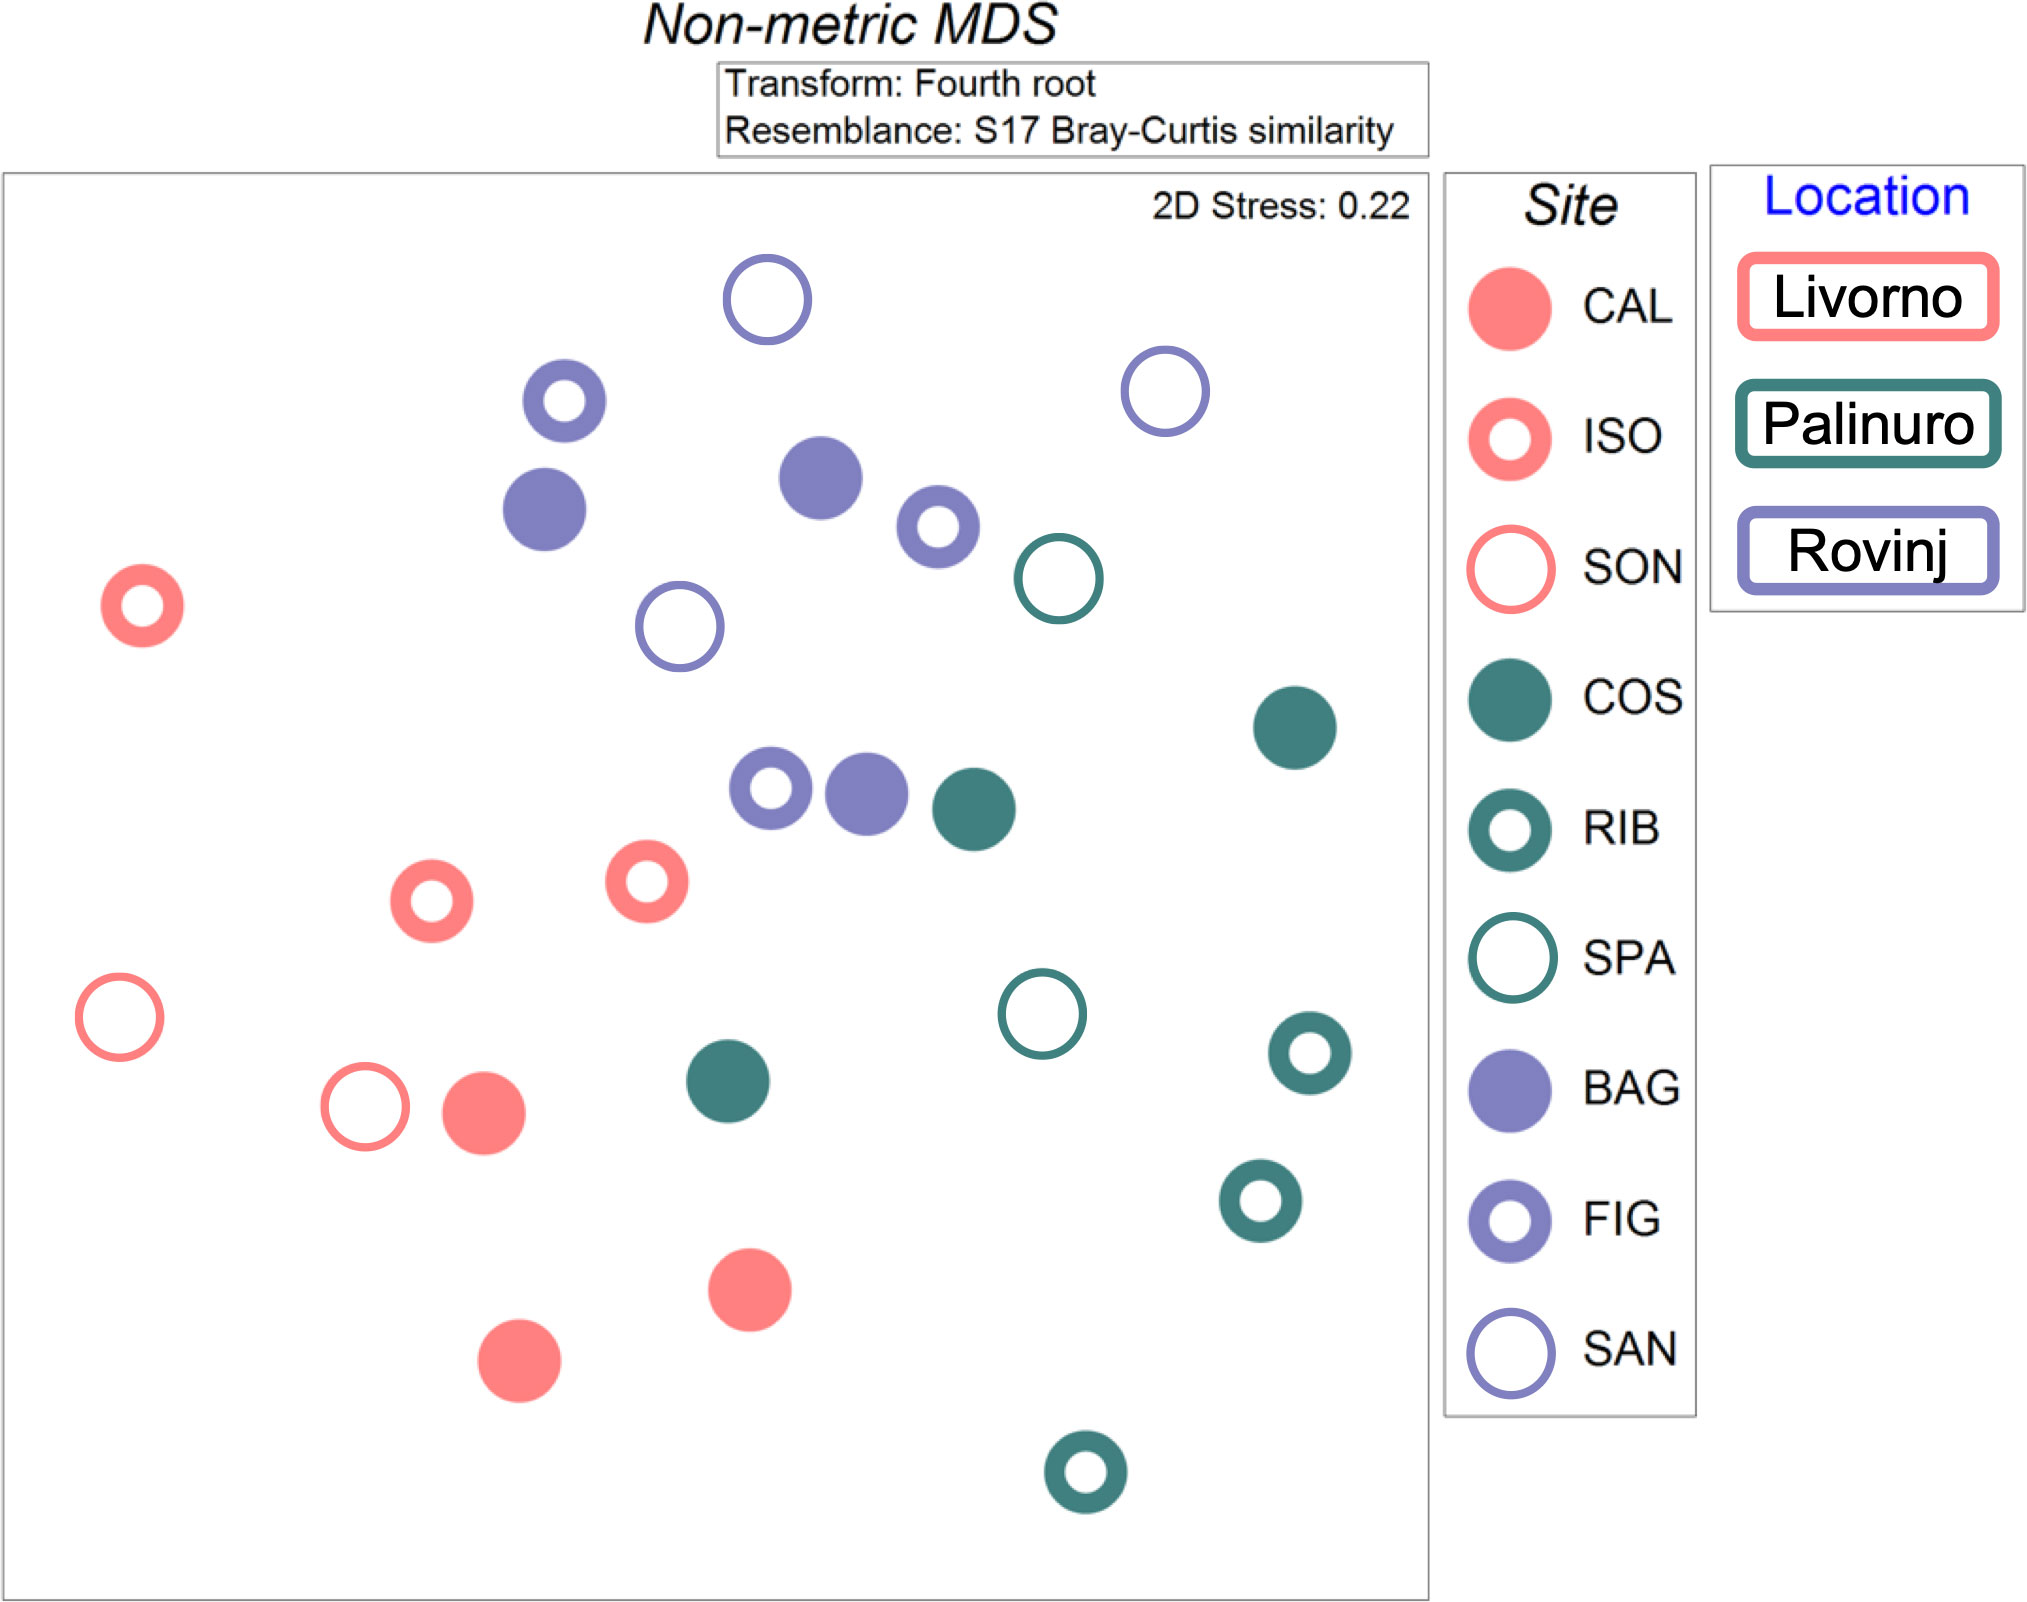
Figure 7 Non-metric multidimensional scaling (nMDS) plot of cryptobenthic communities’ structure between Locations and Sites based on metabarcoding analyses, carried out on fourth root transformed data through Bray-Curtis similarity index. Two samples were lost, one in Livorno (SON) and one in Palinuro (SPA).
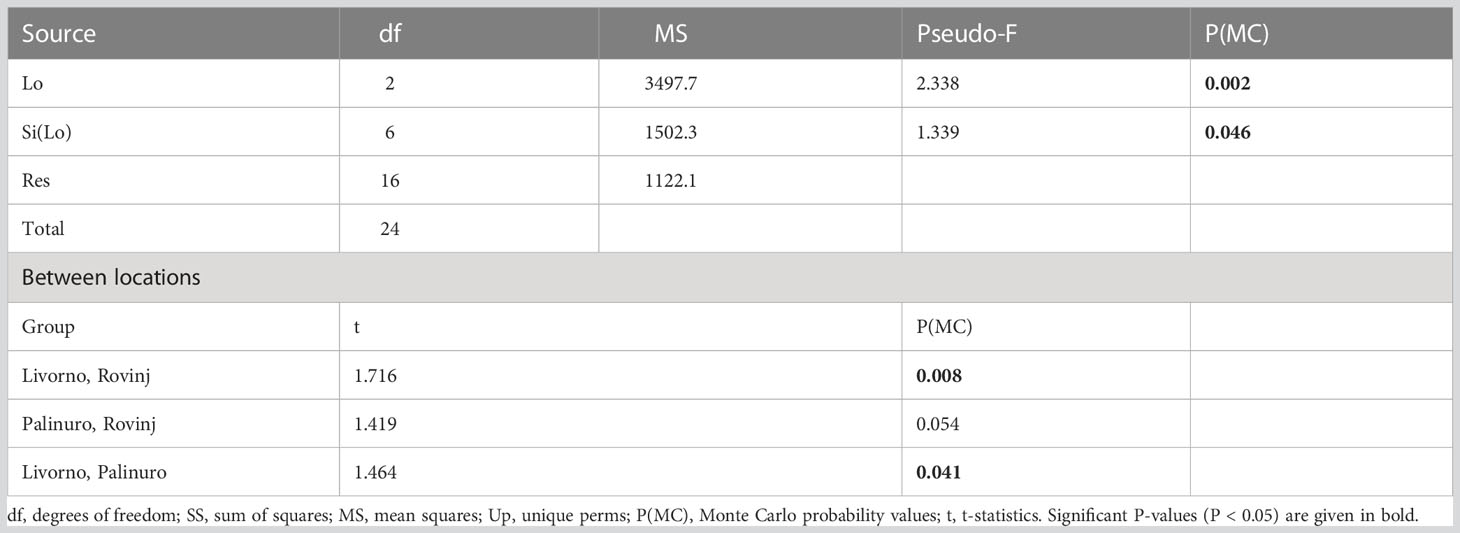
Table 4 Results of PERMANOVA analysis and post-hoc comparisons, testing for differences in structure of faunal assemblages based on metabarcoding analyses between Locations (Lo) and Sites nested in Locations (Si(Lo)).
3.3 Comparison between morphological- and metabarcoding-based approaches
Before analyzing the correlation between morphological and metabarcoding methods in detecting a spatial variability of the communities’ structure, a preliminary analysis was carried out. A RELATE analysis considering the 4 target phyla (Annelida, Arthropoda, Echinodermata, Mollusca) with and without the “Others” group was done both for morphological and metabarcoding matrices. The correlation between “with Others” and “without Others” matrices for the morphological method resulted highly significant with Rho value of 0.894. Similarly, the correlation between “with Others” and “without Others” matrices obtained by metabarcoding approach resulted significant as well, with Rho value of 0.763. Owing to these results, comparisons among matrices obtained at different taxonomic resolution within each method (morphological and metabarcoding) and between the two approaches at each corresponding taxonomic resolution were done without the group “Others”.
The MDS plots obtained from fourth root transformed abundances data of the different taxonomic levels for morphological data appeared similar at level of species, genus, and family (Figure 8). This was confirmed by the high correlation coefficient between species and genus and genus and family (Table 5). The MDS plots obtained by abundance data aggregated to higher taxonomic levels (order, class, and phylum) appeared to be less similar compared to those at lower taxonomic levels and the correlation coefficients between species and higher taxonomic levels resulted lower (Table 5, Figure 8). PERMANOVA results showed significant differences in faunal structure among Locations for all taxonomic levels (species level: Pseudo-F = 2.83, P(MC) = 0.0163; genus level: Pseudo-F = 2.542, P(MC) = 0.023; family level: Pseudo-F = 2.721, P(MC) = 0.025; order level: Pseudo-F = 3.245, P(MC) = 0.023; class level: Pseudo-F = 4.113, P(MC) = 0.022; phylum level: Pseudo-F = 17.068, P(MC) = 0.0002) and pairwise comparisons were statistically significant between Palinuro and Rovinj for each taxonomic level, while at order, class and phylum levels differences also occurred between Livorno and Rovinj (Table S6). MDS ordinations of matrices derived from metabarcoding data, after fourth root transformed abundances of various taxonomic levels are reported in Figure 8. They appeared very similar at the levels of species, genus, and family, indicating that at these levels the overall patterns of spatial variation of community structure were retained, as confirmed by high correlation coefficients (Table 5). High correlation values (> 0.80) occurred only between species and genus, species and family and genus and family. The MDS plots obtained by abundance aggregated to order, class, and phylum levels, appeared to be less similar compared to those at lower taxonomic level and the correlation coefficients between species and higher taxonomic levels resulted <0.80 (Table 5, Figure 8). PERMANOVA revealed significant differences in faunal structure for the Location factor at species (Pseudo-F = 2.051, P(MC) = 0.049), genus (Pseudo-F = 2.162, P(MC) = 0.042), and phylum (Pseudo-F = 2.812, P(MC) = 0.049) levels. However, pairwise comparisons were not statistically different (Table S6).
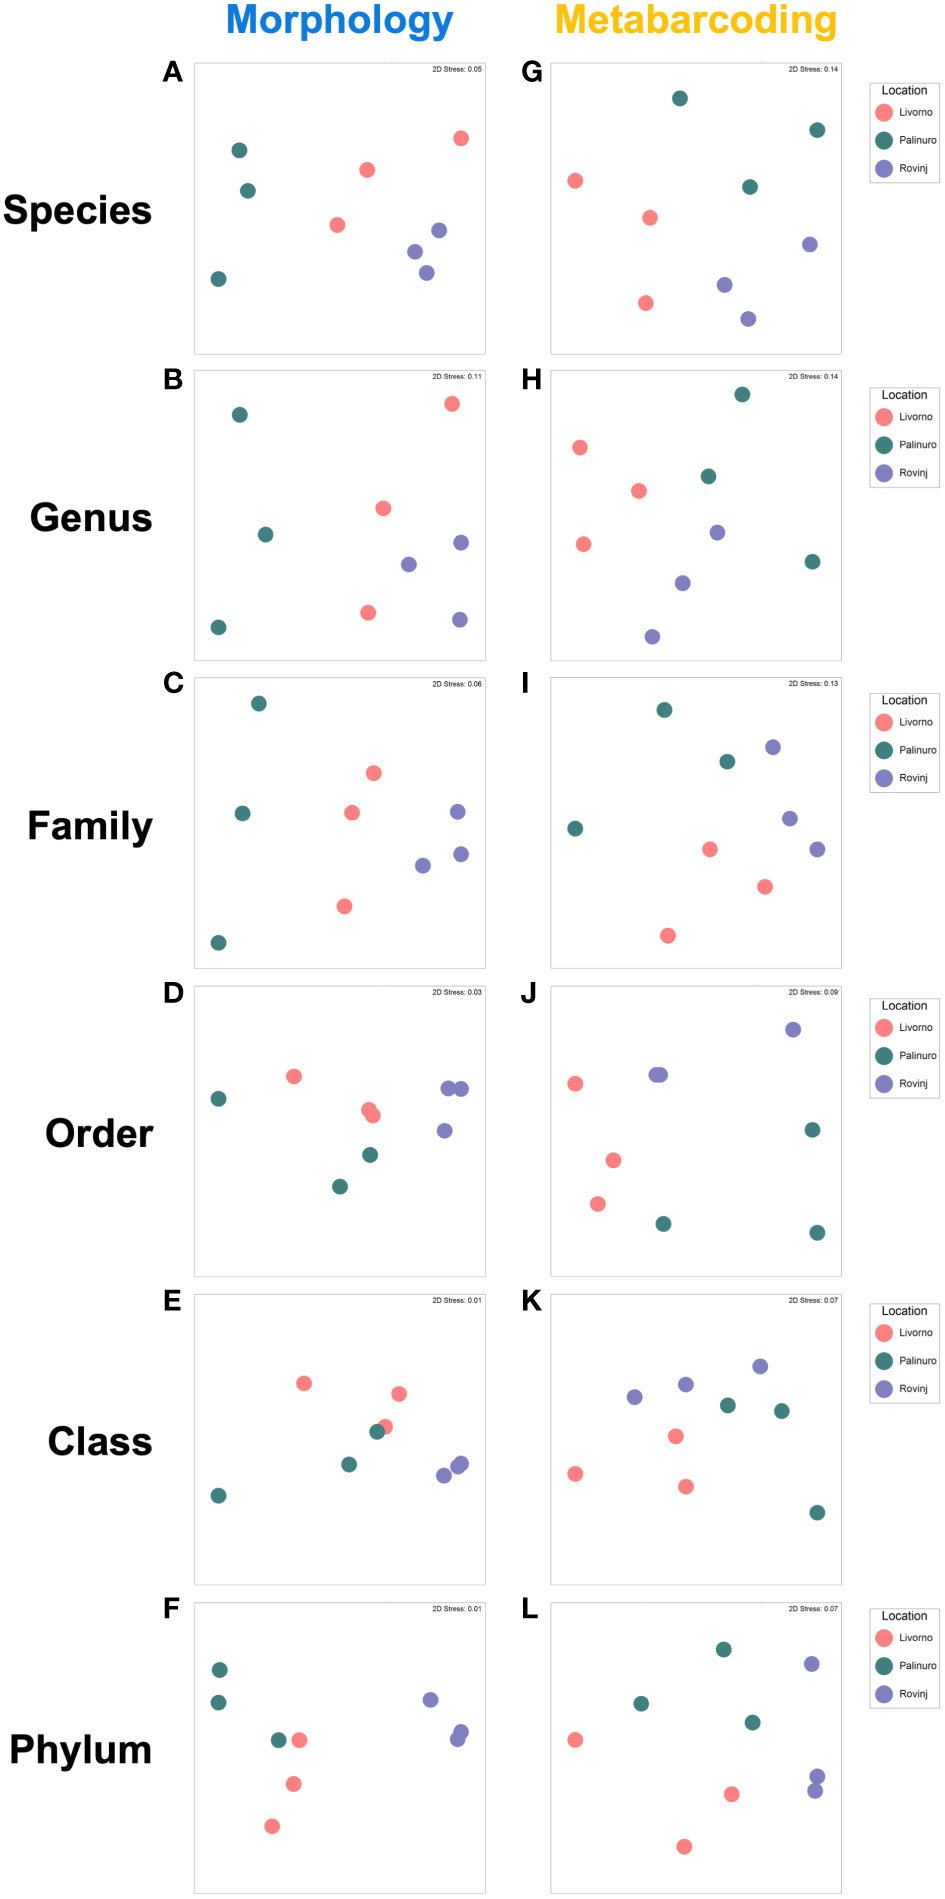
Figure 8 Non-metric multidimensional scaling (nMDS) plots carried out on morphological and metabarcoding data based on Species (A, G), Genus (B, H), Family (C, I), Order (D, J), Class (E, K) and Phylum (F, L) level.
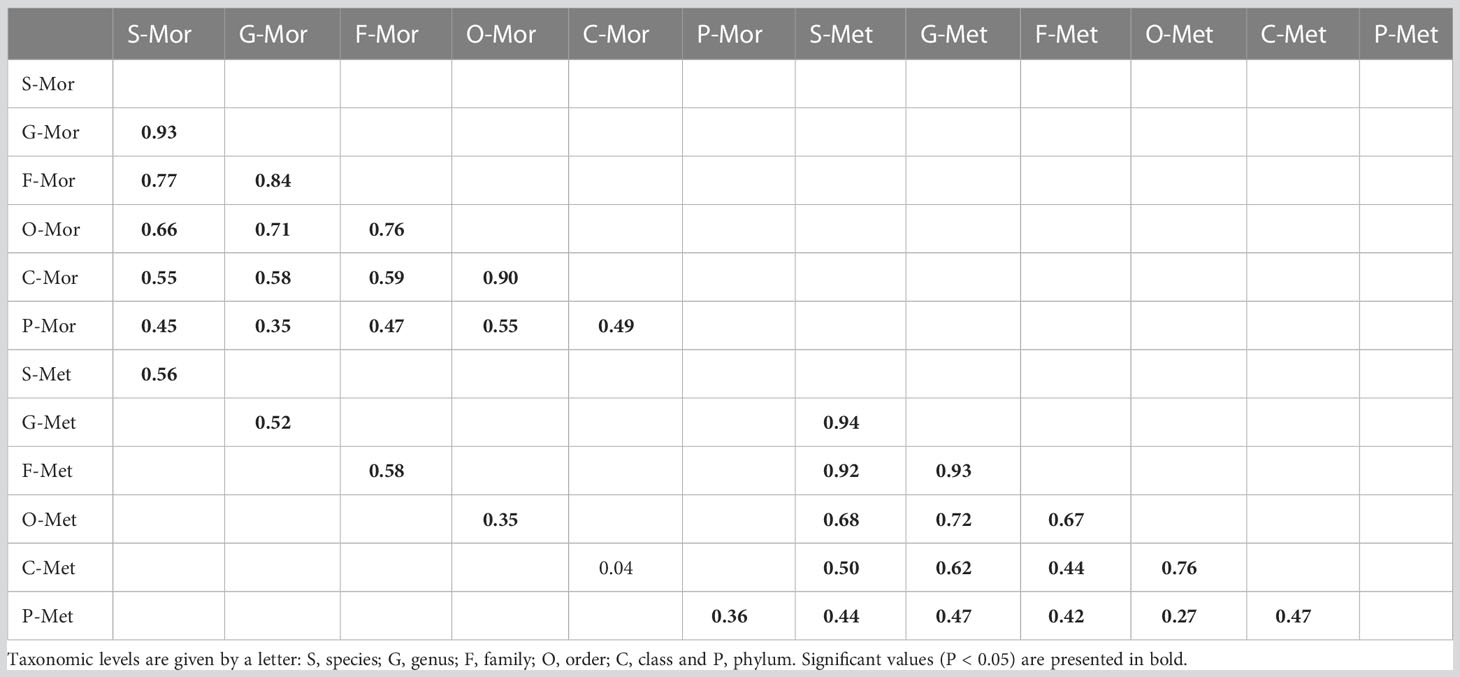
Table 5 Spearman rank correlation (Rho) values calculated between the corresponding elements of each pair of similarity matrices for species abundances, and similarity matrices derived from abundances of higher taxonomic levels, separately for each dataset (morphological, Mor; metabarcoding, Met), and between morphological and metabarcoding similarity matrices per each taxonomic level.
When comparing the MDS plots obtained from the morphological and metabarcoding methods at corresponding taxonomic level, the spatial pattern of the community structures resulted different (Figure 8). This was confirmed by the very low correlation coefficients (Table 5), below the 0.80 threshold suggested by Somerfield and Clarke, 1995.
Patterns among matrices were visualized through 2nd stage MDS plot (Figure 9), where each symbol represents a similarity matrix, and the relative distance between symbols reflects the degree to which the similarity matrices are correlated. The plot showed a clear separation of the two methods on the first dimension and a separation of groups for taxonomic levels on the second dimension. Regarding morphological approach, matrices were arranged from species to phylum in a progressive disposition with species, genus, and family closer to each other compared to phylum, class, and order levels. On the other hand, the order, class, and phylum matrices from metabarcoding data resulted arranged around the cluster species, genus, and family.
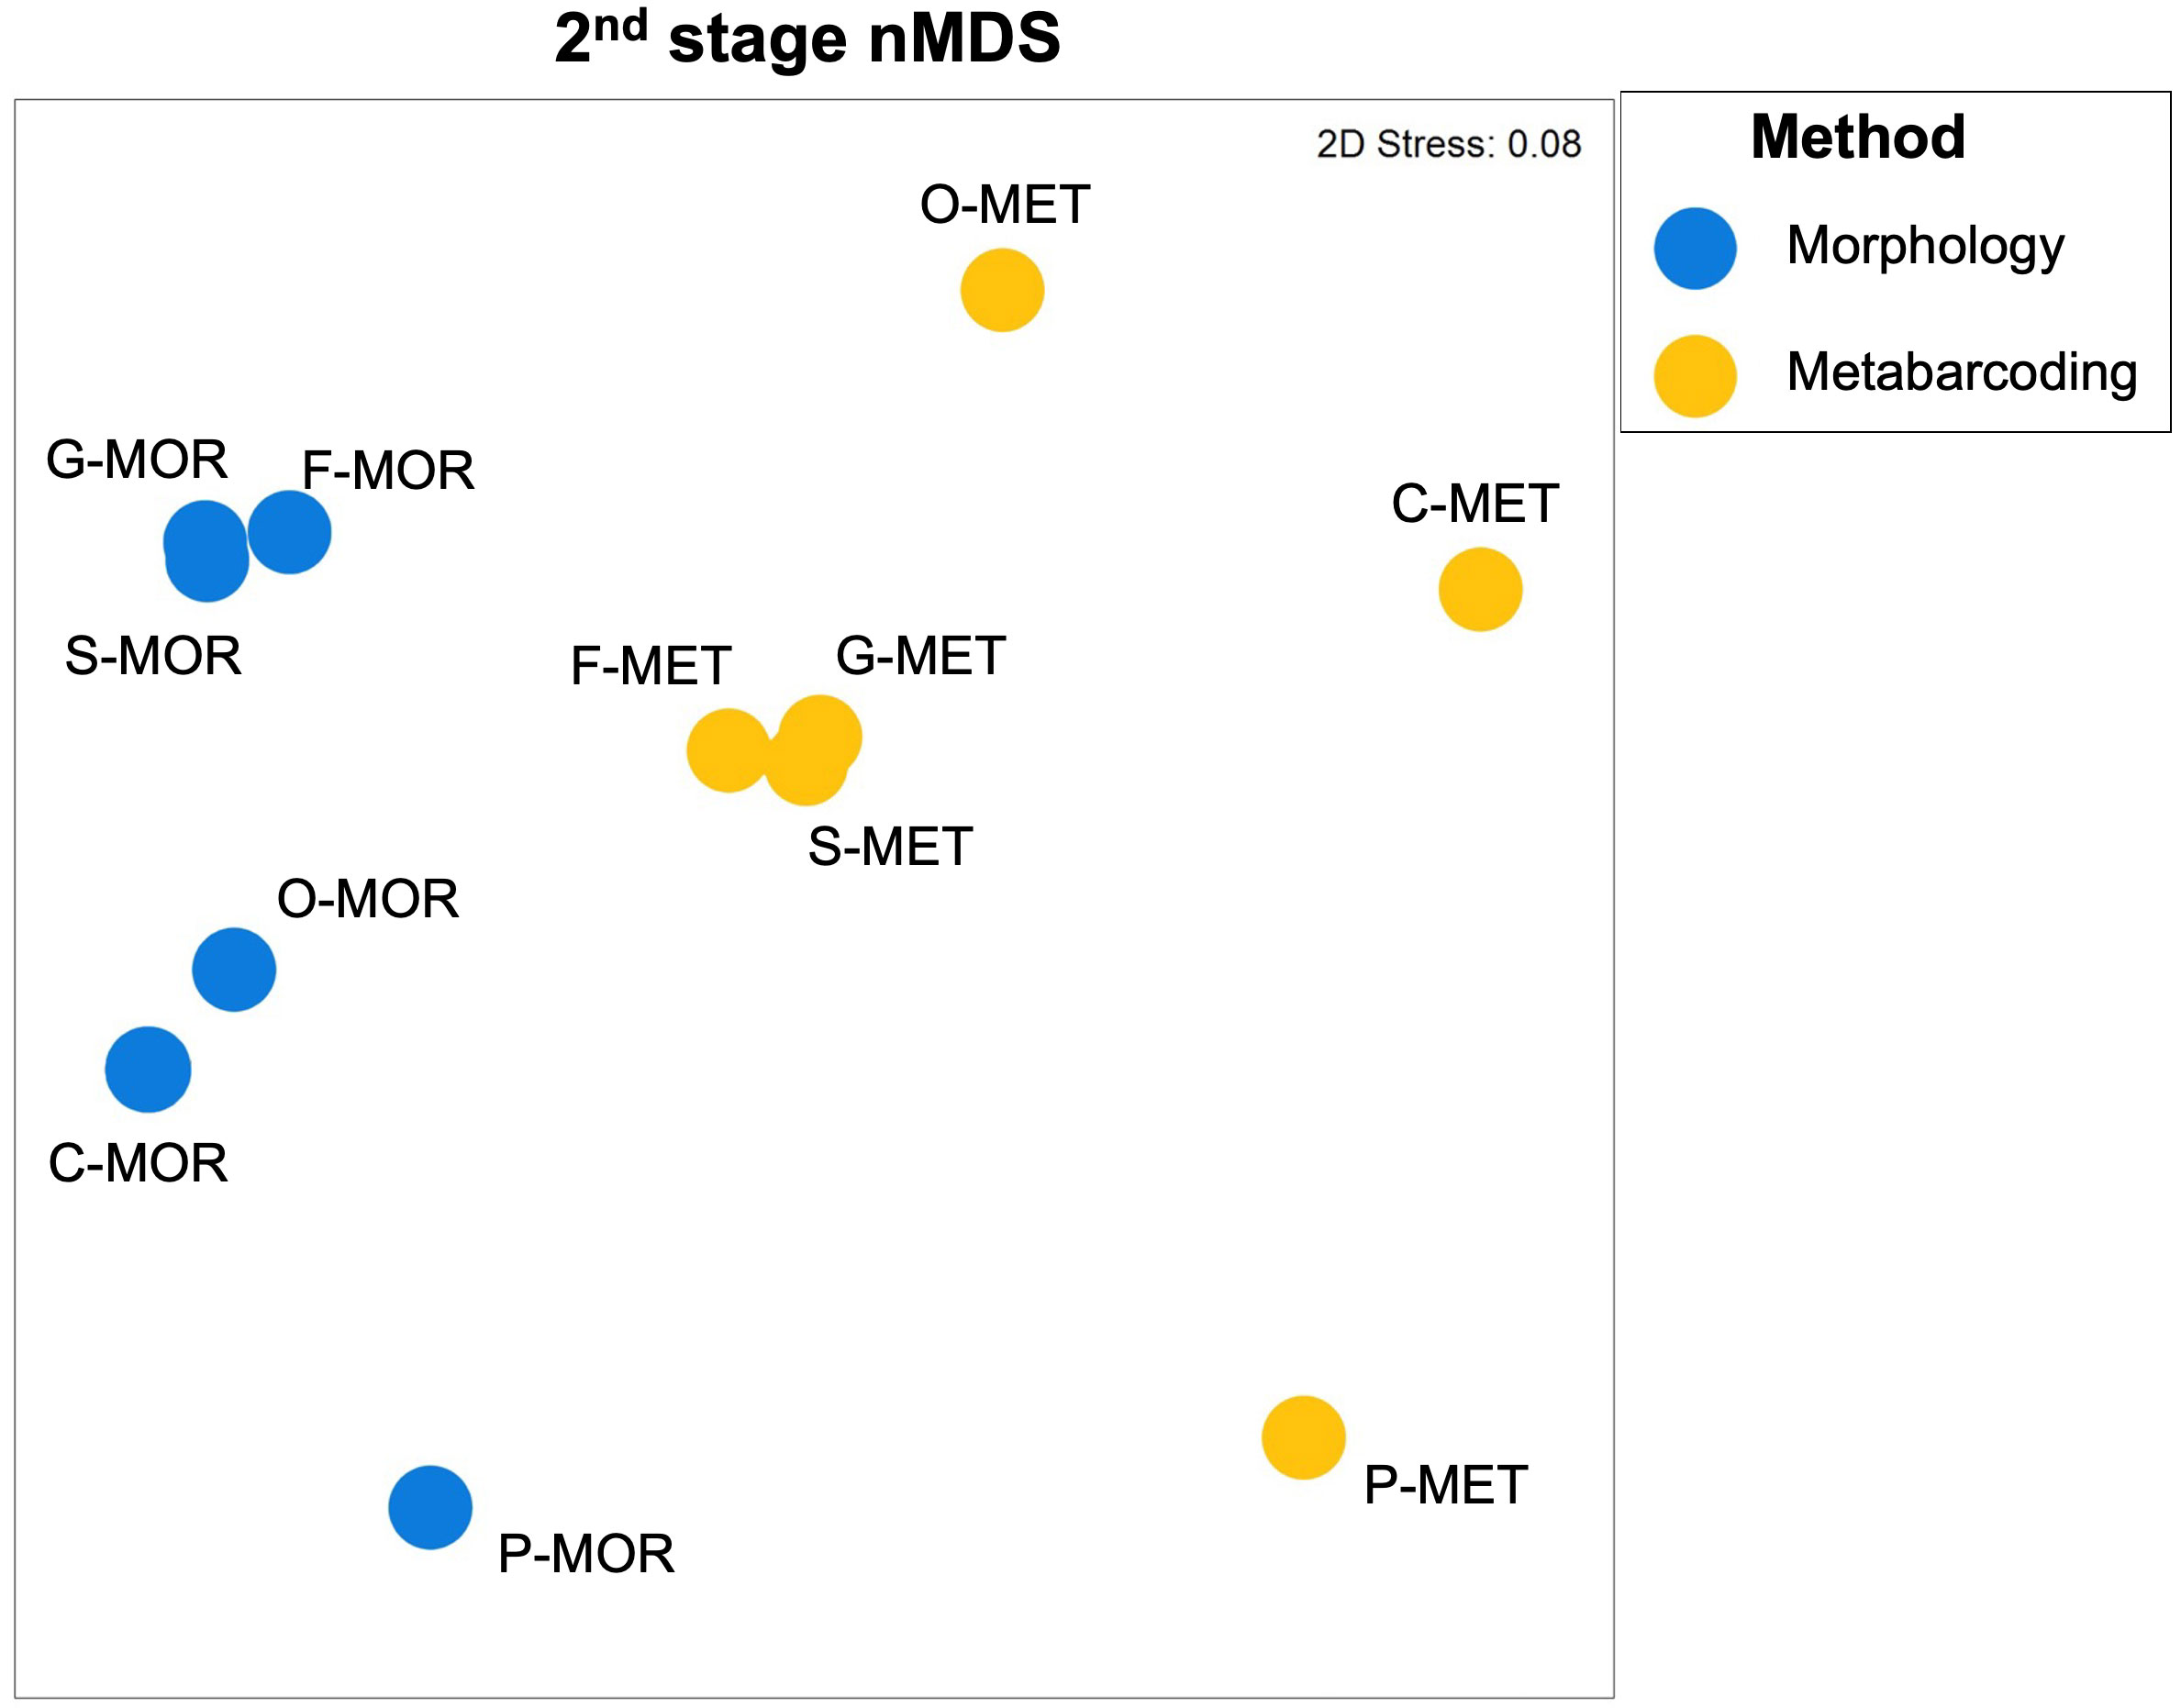
Figure 9 Second stage nMDS plot showing patterns of relationship in the dissimilarity structure among the dataset in terms of taxonomic resolution (S, species; G, genus; F, family; O, order; C, class; P, phylum) and morphological (MOR) and metabarcoding (MET) methods.
The above observed patterns may be explained by comparing the species found by morphological and metabarcoding methods in the four chosen phyla (Annelida, Arthropoda, Echinodermata, Mollusca) from 9 samples (Table 6). Seventy-three species were identified using morphology and 81 using metabarcoding, while only 21 species were detected by both methods (Table 6). Fifty-two species were detected only through morphology but not with metabarcoding. Among them, Annelida represented 62%, followed by Mollusca (28%), Arthropoda (6%) and Echinodermata (4%). Of these species, 26 (50%) do not have COI sequences available neither in NCBI nor in BOLD databases. On the other hand, 21 species have COI sequences present in both online databases, and some of them also with a high coverage in terms of number of sequenced individuals (e.g., arthropods Jassa marmorata Holmes, 1905 and Pilumnus spinifer H. Milne Edwards, 1834; polychaetes Thelepus cincinnatus (Fabricius, 1780) and Spirobranchus triqueter (Linnaeus, 1758) which is present in the databases with its older synonym Pomatoceros triqueter (Linnaeus, 1758); ophiuroid Ophiothrix fragilis (Abildgaard in O.F. Müller, 1789); bivalve Arcuatula senhousia. Five of the species detected only by morphological analyses have COI sequences available in only one of the two databases. 60 species were detected only through metabarcoding but not with morphological analyses. Of these, 24 species (40%) are annelids, particularly representatives of the family Syllidae (13 species), 17 species (28%) are arthropods, 12 species (20%) are mollusks, and 7 species (11.7%) are echinoderms. The most unbalance between the species exclusively identified with a single approach can be attributed to Annelida phylum in metabarcoding.
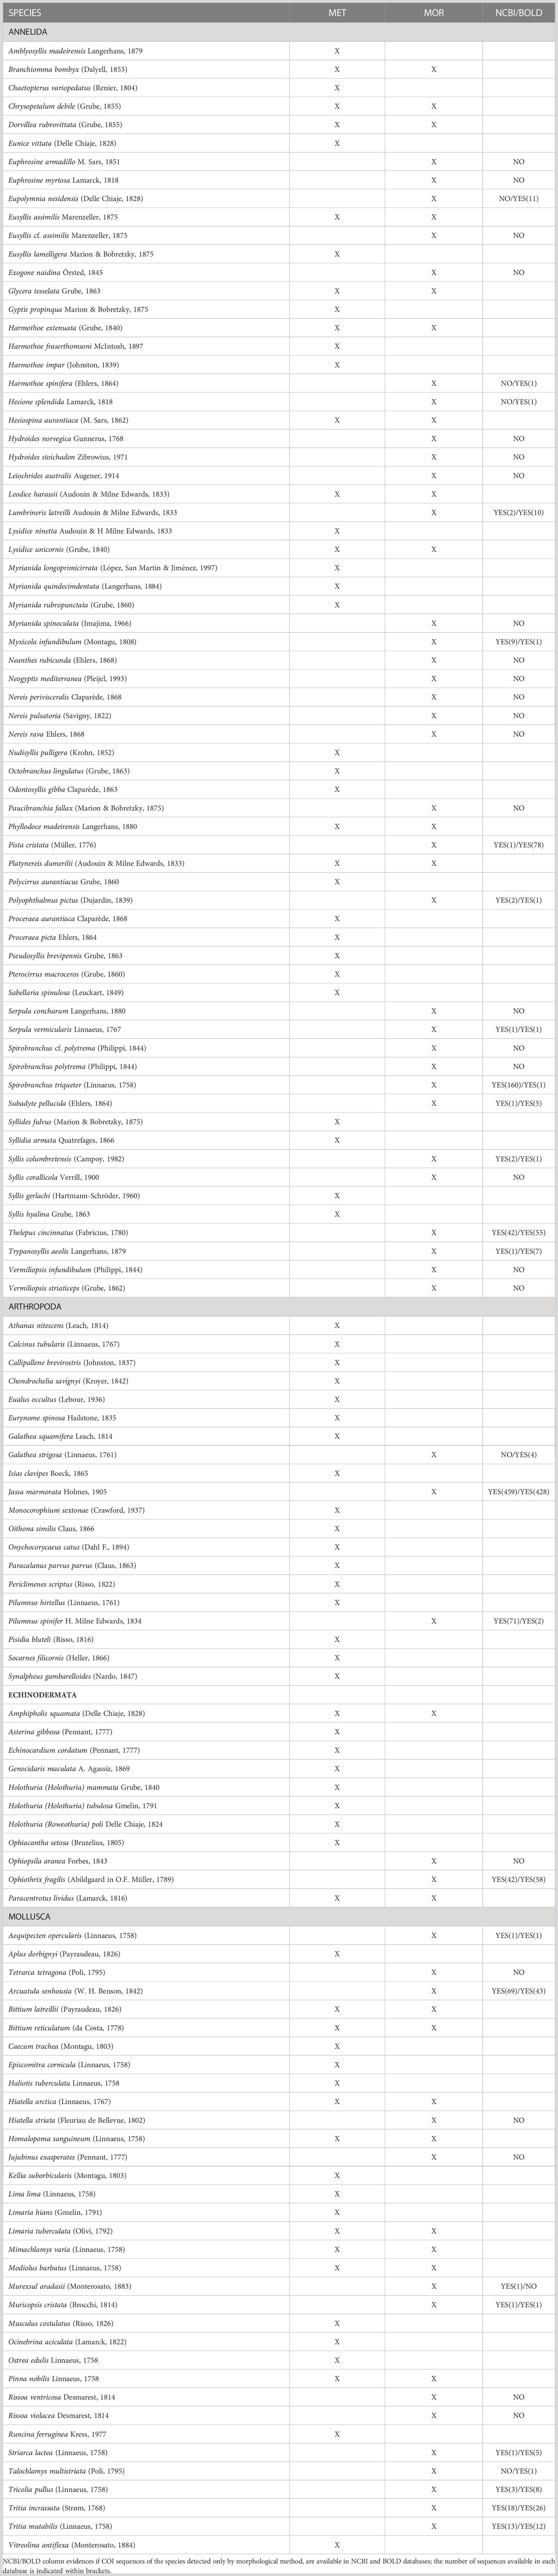
Table 6 List of taxa identified to the species level by molecular metabarcoding (MET) methods and morphological (MOR) methods, in 9 ASUs samples from 2019.
4 Discussion
This was the first study employing Artificial Substrate Units (ASUs, nylon pan scourers) in multiple locations in the Central Mediterranean Sea to assess marine benthic communities using an integrated, morpho-molecular approach trough space and time. Based on these results we observed significant variability in the richness and structure of the faunal assemblages developed on ASUs both between two consecutive years and among sites less than ten meters a part. Moreover, despite the number of species, genera and families detected was not so different between the morphological and metabarcoding approach, the similarity in the species composition and community structure assessed by the two methods was low.
Our analyses evidenced a high temporal variation in abundance and richness of benthic communities of the three studied locations, with abundances doubled in 2020 in respect to 2019, and overall richness increased by 30% in 2020, particularly in Palinuro and Rovinj locations. The SIMPER analysis showed that dissimilarities between Locations and Years were made up of small contributions from many taxa. This indicated communities with a highly complex structure, where many taxa were almost equally important for the total species composition (Dahl and Dahl, 2002). Temporal variation was mostly due the exclusive presence of numerous polychaetes and mollusks as well as several arthropods in 2020 compared to 2019, which is particularly evident in Palinuro. Observed trends could be due to the impact of abiotic factors (both chemical and physical) that could have influenced biological processes such as species settlement and competition (DeLaHoz et al., 2018). During winter 2019/2020 an extreme sea storm occurred in Palinuro, which could have damaged physically the early-formed ASUs assemblages deployed in 2019, that could have led to creation of free space available for the occupation of different adult species and settlement of new larval pools in spring with, as a consequence, increased species richness in 2020 (McQuaid and Branch, 1985) and a change in the communities structure compared to that of 2019. The stormy event in winter 2019/2020 could have had consequences on primary production, sedimentation, and consequent light privation in Palinuro, which induced changes in species composition (Benedetti-Cecchi et al., 2000; Irving and Connell, 2002; Terlizzi et al., 2003). In fact, several studies evidenced that artificial substrates such as ASUs can be colonized both by larval recruitment from the plankton and by migration of adults and juveniles from adjacent habitats which usually act in a very short temporal range (Chapman, 2002; Fraschetti et al., 2002; Smith and Rule, 2002; Rule and Smith, 2005). This indicates the efficiency of these artificial structures to detect early growing communities, being perfectly suited for mid-term monitoring, but maybe less suitable in long term monitoring of local assemblages (Smith and Rule, 2002; Scribano et al., 2021). Assessing marine communities over a temporal gradient is fundamental to establish a baseline towards long term monitoring (Teixidó et al., 2011; Gravina et al., 2020).
The ASUs communities were significantly different between the three locations using both methods of taxa identification. Geomorphological, oceanographic, and ecological features of the two basins of the Mediterranean Sea where ASUs were deployed (Tyrrhenian Sea - Livorno and Palinuro, and Adriatic Sea - Rovinj) could be drivers of these differences. The Adriatic Sea is much shallower than the Tyrrhenian Sea and is characterized by the presence of a less complex circulation with a cold gyre in its northern part. An incoming current from the Ionian Sea flows northward along the eastern coast of the basin, it deviates westward and flows southward along the Italian coast entering the Ionian Sea. Conversely, the Tyrrhenian Sea presents a more complex water circulation due to the interaction of Levantine Intermediate Water (LIW) and Tyrrhenian Deep Water (TDW) that together with the conformation of the coast and the sea bottom create a series of cyclonic and anticyclonic gyres that define two different hydrodynamical provinces (Rossi et al., 2014) where Livorno and Palinuro are located. Within locations, metabarcoding analysis evidenced highly significant differences at scales of less than ten kilometers in terms of community structure but not at level of MOTUs richness. This may be due to the fact that richness index considers only the number of taxa without considering the variation of dominance among species within communities. Small- and large-scale spatial variability a well documented property of hard bottom benthic assemblages, with small-scale variability being often larger (Hewitt et al., 1998; Menconi et al., 1999; Fraschetti et al., 2005). It is caused by various interplaying biological (e.g., predation, competition, recruitment) and physical-chemical (e.g., light intensity, temperature, salinity, hydrodynamics, sedimentation, habitat complexity) factors that are operating in marine environment (Benedetti-Cecchi et al., 2000; Terlizzi et al., 2007; Mikac et al., 2020). In our study spatial variability could be related also to the different lifestyles of the taxa. For example, the colonist polychaetes included many errant taxa (e.g., syllids, nereids, polynoids, eunicids, phyllodocids) which were not limited by food availability as they could freely forage beyond the ASUs. The increased motility of polychaetes may have contributed to their increased variation in diversity amongst sites and locations (Giangrande et al., 2003; Gobin and Warwick, 2006). Methods of larval dispersal could also have contributed to the observed variations in diversity. For example, the pelagic larvae of some taxa add a “chance” factor to the species diversity, while other taxa could have entered the ASUs as adults (Giangrande et al., 2017). Our results highlight the importance of assessing biodiversity at small spatial scales, where high trends in biological variability occur (Coleman, 2002; Fraschetti et al., 2005; Terlizzi et al., 2005).
We concentrated our morphological identification on only four main categories (Annelida, Arthropoda, Mollusca, and Echinodermata), due to the lack of taxonomic expertise for other groups and long determination procedure. On the other hand, metabarcoding allowed to detect also other phyla like Cnidaria, Porifera, Chordata, Bryozoa and others. Although these phyla are in general present with lower abundance and richness, they play important roles in the structure and functions of benthic communities. Nevertheless, when we compared the two approaches for the four main faunal categories, metabarcoding identification revealed species which were not detected by the morphological analyses. This is especially true for the groups which contain many small cryptic species, such as Annelids and Arthropods whose identification by morphological analyses is very hard (Nygren, 2014; Beermann et al., 2018). Although the number of identified species with the two approaches was similar, slight differences in proportions of main taxonomic groups were evident: morphological analysis mainly detected Mollusca (44.4%) and Annelida (42.3%), followed to by Echinodermata (11.7%) and Arthropoda (1.5%), while metabarcoding detected mostly Annelida (58.9%) and Mollusca (23.0%), followed by Arthropoda (11.1%) and Echinodermata (7.0%). This result is coherent with what found by Pearman and colleagues (2016) where Annelida accounted for most reads in COI metabarcoding. Arthropoda as well presented higher richness in COI metabarcoding compared to morphological data. Discrepancy between the two datasets and higher richness of Annelida and Arthropoda detected by metabarcoding method might be due to the fact that these groups contain numerous small taxa belonging also to meiofaunal fraction (< 500 µm), like polychaetes from the family Syllidae (such as Amblyosyllis madeirensis Langerhans, 1879, species from the genera Myrianida and Proceraea, and others) and Crustaceans from the orders Amphipoda (such as Socarnes filicornis (Heller, 1866)), Copepoda (such as Isias clavipes Boeck, 1865), Pantopoda (such as Callipallene brevirostris (Johnston, 1837)) and Tanaidacea (such as Chondrochelia savignyi (Kroyer, 1842)). Due to their small body size these species were possibly absent from the macrofaunal samples analyzed by the morphological method. Similar discrepancies in Mollusca observed by morphology but not by metabarcoding were observed by Cahill et al. (2018), despite the high abundance of COI sequences of this taxon in the databases (Mugnai et al., 2021). The number of shared species detected by both approaches was rather low. One of the plausible reasons is that for many species that were detected morphologically but not by metabarcoding (precisely for 50% of those species) there is no available data on their COI sequences in NCBI and BOLD databases. On the other hand, as already implied, the discrepancy in the species lists obtained by the two approaches could be attributed to the different samples processing methods. In fact, the low number of shared species between the two approaches could also be connected to technical limitations of the metabarcoding technique, from DNA extraction and library preparation to bioinformatic. Even if species are present in the bulk sample, both DNA extraction and PCR amplification can bring uneven yield in terms of quantity of genetic material extracted per organism and consequent under-amplification of its DNA. This can have repercussions on sequencing artefacts such as mis-tagging or pseudogenes. Moreover, the employment of different metabarcoding pipelines such as QIIME2 (Bolyen et al., 2019) or VTAM (González et al., 2020) could also affect differences in the final MOTUs dataset, particularly regarding the taxonomic assignment, due to differences in the procedures followed by each algorithm (Mugnai et al., 2023).
Comparing the spatial structure of the communities detected with the two methods at corresponding taxonomic level, we have observed a high statistically significant correlation from species to phylum levels within each method. Nevertheless, according to Somerfield and Clarke (1995) that affirmed that results are still fine when correlations assume values below 0.80, our outcomes suggest that the family level gives a better result for the two datasets in detecting the spatial structure of the communities across locations. Moreover, the 2nd stage MDS very well highlighted that the two approaches allow to detect different spatial structures at all different taxonomic resolutions, suggesting that taxonomic sufficiency works differently for the two methods. In fact, despite the number of identified species with the two approaches was similar (73 by morphology, 81 by metabarcoding), only 21 of them (15.8%) were commonly detected by both approaches. Of the species identified by both methods, 12 were barcoded by Mugnai et al. (2023) and employed in the customized, local COI database, suggesting again the importance of enriching the local and global barcoding databases by combining both morphological and metabarcoding analyses (Mugnai et al., 2021).
The results obtained using morphology, support the use of higher taxonomic levels to detect changes in the structure of benthic communities. In fact, PERMANOVA detected differences in community structure between Palinuro and Rovinj even at phylum level. From order to phylum resolution, differences occurred also between Livorno and Rovinj. Putting the threshold for sufficient condition for the adoption of the TS approach, correlation index Rho > 0.7 (Somerfield and Clarke, 1995; Heino, 2010), high correlation occurred among species, genus, and family. So, for the morphological dataset, coarsening taxonomic resolution to the genus and family preserved the capability to detect spatial variability in community structures using ASUs.
Also results obtained by metabarcoding approach showed a different pattern. In fact, very high correlation values (Rho > 0.80) were obtained comparing species, genus, and family matrices, indicating that the coarser taxonomic resolutions on the levels of genus and family were consistent in capturing the community structure variability. Despite the high correlation among species, genus, and family, PERMANOVA main test detected difference for location factor only at species and genus levels, and pairwise comparisons did not show statistical differences between locations. These results may be due to the dominance of few species and genera across all samples in all locations like for example the polychaete Hesiospina aurantiaca (M. Sars, 1862) and the bivalve Limaria tuberculata (Olivi, 1792).
In conclusion, our study showed that the family level may be satisfactory for monitoring the spatial variability of hard bottom benthic communities, in agreement with Cahill et al. (2018). The integration of the two techniques of metabarcoding and morphology-based identification proved to be exhaustive and reliable for characterizing marine benthic assemblages using ASUs as well as for estimating their spatial and temporal variability. Beside the low common species detected, both methods revealed high large scale spatial variability in the structure of the benthic communities. With morphology, the prevalence of polychaetes Filograna sp., Vermiliopsis infundibulum and Spirobranchus cf. polytrema retrieved in Palinuro in 2019 could have prevented the colonization of other organisms during early settlement phases, such as mollusks and echinoderms, which in fact resulted higher in 2020, with Annelida decreasing consequently. A similar trend is noticeable in Rovinj, where Annelida (mainly Polychaeta) are known to be early recruiters together with Mollusca (Fortic et al., 2021). It is not surprising the high prevalence of Annelida, as their individuals are frequently associated with algae such as Ericaria amentacea (C.Agardh) Molinari & Guiry, 2020 (Fraschetti et al., 2002) and the ASUs structure is actually mimicking the filamentous algae. In addition, the plastic material of ASUs seems not to negatively influence neither the structural diversity nor the settlement of the organisms (Pitacco et al., 2013). Among annelids the family Syllidae resulted the most abundant in both sampling years and locations, as previously reported by Mikac et al. (2020).
From this study we can affirm that both morphological and metabarcoding approaches are affordable in different ways in characterizing marine benthic communities, albeit suffering from different weaknesses. The most evident one when dealing with morphological identification of individuals is the slow and cumbersome process of following dichotomous keys to define the identity of the organism (de Carvalho et al., 2007; Troudet et al., 2017). Although this process can be faster while advancing with personal experience, the specialization of a taxonomist is usually limited to few taxonomic groups. In addition, the occurrence of cryptic species can lead to misidentification of the organisms or to the impossibility of assigning the species level. We also must consider that different operators can introduce biases during the identification of the organisms. Most of these limitations can be overcome by the metabarcoding approach, which is faster and less dependent from the operator’s expertise (Porter and Hajibabaei, 2018).
The low percentages of occurrence of the phylum Echinodermata detected by the metabarcoding could be both linked to low barcoding knowledge (Mugnai et al., 2021) and to the lacks in proper primer design (Hoareau and Boissin, 2010). Unfortunately, this statement can be extended to many other invertebrate groups, and biodiversity studies relying only on metabarcoding can lack detailed resolution, particularly at lower taxonomic levels. Moreover, when employing only a specific molecular marker, we can underestimate the presence of other organisms in our samples. Albeit the COI is the most used molecular marker to assess metazoans (Andújar et al., 2018), lacks in COI barcoding repositories are evident (Weigand et al., 2019; Duarte S. et al., 2020; Mugnai et al., 2021). To properly assess marine communities, a multi-marker approach must be encouraged (Compson et al., 2020; Liu and Zhang, 2021, Mugnai et al. in prep). Alternatives could be the whole genome sequencing (Arredondo-Alonso et al., 2021) and the genome skimming approaches (Coissac et al., 2016; Trevisan et al., 2019), which can provide wider and more exhaustive knowledge of the assessed communities, and whose costs are becoming more and more accessible. Moreover, the use of different DNA extraction kits, metabarcoding pipelines and algorithms for taxonomic assignment could be employed to seek for discrepancies in identified taxa and resolution at lineage level (Mugnai et al., 2023).
Data availability statement
The data presented in the study are included in the article as Supplementary Material. The original output files of each sample have been submitted to the NCBI sequence read archive under the BIOPROJECT accession number PRJNA997896. Further inquiries can be directed to the corresponding authors.
Author contributions
FM participated to the sampling and performed the sampling processing and metabarcoding analysis in the laboratory, analyzed the data and wrote the manuscript. BM performed the morphological analysis in the laboratory and wrote and edited the manuscript. MAC participated in statistical data analysis and edited the manuscript. KOM participated in the sampling and sample processing in the field and performed metabarcoding analysis. VD conceived and developed the metabarcoding protocol. FM performed molecular biology experiments regarding the development and optimization of the metabarcoding protocol. MA conceived the experiment, participated in the field activities, and edited the manuscript. AC leaded the SEAMOBB project. FC conceived the experiment, performed the field activities and the sample processing, wrote, reviewed, and edited the manuscript. All the Authors revised the final version of the manuscript.
Funding
The work was financed by the SEAMoBB (Solutions for sEmi-Automated Monitoring of Benthic Biodiversity) project, co-funded by ERA-Net Mar-TERA (id. 145) and managed by the Ministero dell’Istruzione, dell’Università e della Ricerca (MIUR) Grant No. MIUR n. 728053 - SEAMoBB.
Acknowledgments
Thanks to students from the Marine Biology Course at the University of Bologna, Ravenna Campus (M. Vingiani, M. Lippi, C. Cozzula, A. Silvestri, A. Orengo, A. Giordano, G. Giacalone, G. Carbone, I. Ronchi and G. Olivieri) for their contributions to this work through field sampling and sample pre-processing activities. Thanks to Dr. Francesco Paolo Mancuso for his contribution to the field sampling activities in 2018. Thanks to all the diving centers for field activities support (Rovinj Sub, Rovinj, Croatia; Palinuro Sub, Palinuro, Italy; Accademia Blu Diving Center, Livorno, Italy), and thanks to the Hotel Le Tre Caravelle (Palinuro, Salerno, Italy), the CIBM (Centro Interuniversitario di Biologia Marina ed Ecologia Applicata “G.Bacci”, Livorno, Italy) and the Ruđer Bošković Institute (Rovinj, Croatia) for their logistic support in field activities. We thank the anonymous referees for their suggestions that improved the manuscript. We warmly thanks the staff of the Institut Méditerranéen de Biodiversité et d’Ecologie (IMBE; Aix Marseille Université, CNRS, France) that participated the SEAMoBB project: Anne Chenuil leaded the SEAMoBB project and participated the design of the sampling scheme; Vincent Dubut conceived and developed the metabarcoding protocol; Florent Marschal performed molecular biology experiments regarding the development and optimization of the metabarcoding protocol; Emese Meglécz did the bioinformatics analysis for the pre-run used to finalize the metabarcoding protocol; Pascal Mirleau and Gabriel Nève collected and identified specimens for the mock community samples. Data used in this study were partly produced by the molecular facilities of CIRAD (Montferrier-sur-Lez, France) and SCBM (IMBE, Marseille, France)".
Conflict of interest
The authors declare that the research was conducted in the absence of any commercial or financial relationships that could be construed as a potential conflict of interest.
Publisher’s note
All claims expressed in this article are solely those of the authors and do not necessarily represent those of their affiliated organizations, or those of the publisher, the editors and the reviewers. Any product that may be evaluated in this article, or claim that may be made by its manufacturer, is not guaranteed or endorsed by the publisher.
Supplementary material
The Supplementary Material for this article can be found online at: https://www.frontiersin.org/articles/10.3389/fmars.2023.1113322/full#supplementary-material
References
Anderson M. J. (2017). Permutational multivariate analysis of variance (PERMANOVA) Eds. N. Balakrishnan, T. Colton, B. Everitt, W. Piegorsch, F. Ruggeri, J. L. Teugels JL. (Oxford: Wiley: Wiley StatsRef: statistics reference online), 1–15.
Andrews S. (2010). FastQC: a quality control tool for high throughput sequence data. (Cambridge: Babraham Bioinformatics).
Andújar C., Arribas P., Yu D. W., Vogler A. P., Emerson B. C. (2018). Why the COI barcode should be the community DNA metabarcode for the metazoa. Mol. Ecol. 27, 3968–3975. doi: 10.1111/mec.14844
Arredondo-Alonso S., Pöntinen A. K., Cléon F., Gladstone R. A., Schürch A. C., Johnsen P. J., et al. (2021). ). a high-throughput multiplexing and selection strategy to complete bacterial genomes. GigaScience 10, giab079. doi: 10.1093/gigascience/giab079
Beermann J., Westbury M. V., Hofreiter M., Hilgers L., Deister F., Neumann H., et al. (2018). Cryptic species in a well-known habitat: applying taxonomics to the amphipod genus Epimeria (Crustacea, peracarida). Sci. Rep. 8, 6893. doi: 10.1038/s41598-018-25225-x
Benedetti-Cecchi L., Bulleri F., Cinelli F. (2000). The interplay of physical and biological factors in maintaining mid-shore and low-shore assemblages on rocky coasts in the north-west Mediterranean. Oecologia 123, 406–417. doi: 10.1007/s004420051028
Blowes S. A., Supp S. R., Antão L. H., Bates A., Bruelheide H., Chase J. M., et al. (2019). The geography of biodiversity change in marine and terrestrial assemblages. Science 366, 339–345. doi: 10.1126/science.aaw1620
Bolyen E., Rideout J. R., Dillon M. R., Bokulich N. A., Abnet C. C., Al-Ghalith G. A., et al. (2019). Reproducible, interactive, scalable and extensible microbiome data science using QIIME 2. Nat. Biotechnol. 37, 852–857. doi: 10.1038/s41587-019-0209-9
Boyer F., Mercier C., Bonin A., Le Bras Y., Taberlet P., Coissac E. (2016). OBITOOLS: a UNIX-inspired software package for DNA metabarcoding. Mol. Ecol. Resour. 16, 176–182. doi: 10.1111/1755-0998.12428
Brandt M. I., Trouche B., Quintric L., Günther B., Wincker P., Poulain J., et al. (2021). Bioinformatic pipelines combining denoising and clustering tools allow for more comprehensive prokaryotic and eukaryotic metabarcoding. Mol. Ecol. Resour. 21, 1904–1921. doi: 10.1111/1755-0998.13398
Cahill A. E., Pearman J. K., Borja A., Carugati L., Carvalho S., Danovaro R., et al. (2018). A comparative analysis of metabarcoding and morphology-based identification of benthic communities across different regional seas. Ecol. Evol. 8, 8908–8920. doi: 10.1002/ece3.4283
Carreira-Flores D., Neto R., Ferreira H., Cabecinha E., Díaz-Agras G., Gomes P. T. (2020). Artificial substrates as sampling devices for marine epibenthic fauna: a quest for standardization. Reg. Stud. Mar. Sci. 37, 101331. doi: 10.1016/j.rsma.2020.101331
Carvalho S., Aylagas E., Villalobos R., Kattan Y., Berumen M., Pearman J. K. (2019). Beyond the visual: using metabarcoding to characterize the hidden reef cryptobiome. Proc. R. Soc B-Biol. Sci. 286. doi: 10.1098/rspb.2018.2697
Chapman J. (2002). A framework for transformational change in organisations. Leadersh. Organ. Dev. J. 23, 16–25. doi: 10.1108/01437730210414535
Claesson M. J., O’Sullivan O., Wang Q., Nikkilä J., Marchesi J. R., Smidt H., et al. (2009). Comparative analysis of pyrosequencing and a phylogenetic microarray for exploring microbial community structures in the human distal intestine. PloS One 4, e6669. doi: 10.1371/journal.pone.0006669
Clarke K. R. (1993). Non-parametric multivariate analyses of changes in community structure. Austral Ecol. 18, 117–143. doi: 10.1111/j.1442-9993.1993.tb00438.x
Corse E., Meglécz E., Archambaud G., Ardisson M., Martin J. F., Tougard C., et al. (2017). A from‐benchtop‐to‐desktop workflow for validating HTS data and for taxonomic identification in diet metabarcoding studies. Mol. Ecol. Resour. 17(6), e146–e159. doi: 10.1111/1755-0998.12703
Coissac E., Hollingsworth P. M., Lavergne S., Taberlet P. (2016). From barcodes to genomes: extending the concept of DNA barcoding. Mol. Ecol. 25, 1423–1428. doi: 10.1111/mec.13549
Coleman M. A. (2002). Small-scale spatial variability in intertidal and subtidal turfing algal assemblages and the temporal generality of these patterns. J. Exp. Mar. Biol. Ecol. 267, 53–74. doi: 10.1016/S0022-0981(01)00358-6
Compson Z. G., McClenaghan B., Singer G. A. C., Fahner N. A., Hajibabaei M. (2020). Metabarcoding from microbes to mammals: comprehensive bioassessment on a global scale. Front. Ecol. Evol. 8. doi: 10.3389/fevo.2020.581835
Daglio L. G., Dawson M. N. (2019). Integrative taxonomy: ghosts of past, present and future. J. Mar. Biological Assoc. U. K. 99, 1237–1246. doi: 10.1017/S0025315419000201
Dahl L., Dahl K. (2002). Temporal, spatial and substrate-dependent variations of Danish hard-bottom macrofauna. Helgol. Mar. Res. 56, 159–168. doi: 10.1007/s10152-002-0111-5
de Carvalho M. R., Bockmann F. A., Amorim D. S., Brandão C. R. F., de Vivo M., de Figueiredo J. L., et al. (2007). Taxonomic impediment or impediment to taxonomy? a commentary on systematics and the cybertaxonomic-automation paradigm. Evol. Biol. 34, 140–143. doi: 10.1007/s11692-007-9011-6
DeLaHoz M. V., Sardà F., Coll M., Sáez R., Mechó A., Oliva F., et al. (2018). Biodiversity patterns of megabenthic non-crustacean invertebrates from an exploited ecosystem of the northwestern Mediterranean Sea. Reg. Stud. Mar. Sci. 19, 47–68. doi: 10.1016/j.rsma.2018.03.002
Dennis C., Aldhous P. (2004). A tragedy with many players. Nature 430, 396–398. doi: 10.1038/430396a
Di Camillo C. G., Gravili C., De Vito D., Pica D., Piraino S., Puce S., et al. (2018). The importance of applying standardised integrative taxonomy when describing marine benthic organisms and collecting ecological data. Invertebr. Syst. 32, 794–802. doi: 10.1071/IS17067
Duarte C. M., Agusti S., Barbier E., Britten G. L., Castilla J. C., Gattuso J.-P., et al. (2020). Rebuilding marine life. Nature 580, 39–51. doi: 10.1038/s41586-020-2146-7
Duarte S., Vieira P. E., Costa F. O. (2020). Assessment of species gaps in DNA barcode libraries of non-indigenous species (NIS) occurring in European coastal regions. MBMG 4, e55162. doi: 10.3897/mbmg.4.55162
Fadrosh D. W., Ma B., Gajer P., Sengamalay N., Ott S., Brotman R. M., Ravel J. (2014). An improved dual-indexing approach for multiplexed 16S rRNA gene sequencing on the Illumina MiSeq platform. Microbiome 2, 6. doi: 10.1186/2049-2618-2-
Fortic A., Mavrič B., Pitacco V., Lipej L. (2021). Temporal changes of a fouling community: colonization patterns of the benthic epifauna in the shallow northern Adriatic Sea. Reg. Stud. Mar. Sci. 45, 101818. doi: 10.1016/j.rsma.2021.101818
Fraschetti S., Giangrande A., Terlizzi A., Miglietta M., Della Tommasa L., Boero F. (2002). Spatio-temporal variation of hydroids and polychaetes associated with Cystoseira amentacea (Fucales: phaeophyceae). Mar. Biol. 140, 949–957. doi: 10.1007/s00227-001-0770-9
Fraschetti S., Terlizzi A., Benedetti-Cecchi L. (2005). Patterns of distribution of marine assemblages from rocky shores: evidence of relevant scales of variation. Mar. Ecol. Prog. Ser. 296, 13–29. doi: 10.3354/meps296013
Gee J. M., Warwick R. M. (1996). A study of global biodiversity patterns in the marine motile fauna of hard substrata. J. Mar. Biological Assoc. U. K. 76, 177–184. doi: 10.1017/S0025315400029106
Giangrande A., Delos A. L., Fraschetti S., Musco L., Licciano M., Terlizzi A. (2003). Polychaete assemblages along a rocky shore on the south Adriatic coast (Mediterranean sea): patterns of spatial distribution. Mar. Biol. 143, 1109–1116. doi: 10.1007/s00227-003-1162-0
Giangrande A., Gambi M. C., Gravina M. F. (2017). Paradigm shifts in community ecology: open versus closed units, challenges and limits of connectivity studies. Mar. Ecol. 38 (6), e12480. doi: 10.1111/maec.12480
Gobin J. F., Warwick R. M. (2006). Geographical variation in species diversity: a comparison of marine polychaetes and nematodes. J. Exp. Mar. Biol. Ecol. 330, 234–244. doi: 10.1016/j.jembe.2005.12.030
González A., Dubut V., Corse E., Mekdad R., Dechatre T., Meglécz E. (2020). VTAM: a robust pipeline for validating metabarcoding data using internal controls. bioRxiv 11, 6. doi: 10.1101/2020.11.06.371187
Gravina M. F., Bonifazi A., Del Pasqua M., Giampaoletti J., Lezzi M., Ventura D., et al. (2020). Perception of changes in marine benthic habitats: the relevance of taxonomic and ecological memory. Diversity 12 (12), 480. doi: 10.3390/d12120480
Heino J. (2010). Are indicator groups and cross-taxon congruence useful for predicting biodiversity in aquatic ecosystems? Ecol. Indic. 10, 112–117. doi: 10.1016/j.ecolind.2009.04.013
Hewitt J. E., Thrush S. F., Cummings V. J., Turner S. J. (1998). The effect of changing sampling scales on our ability to detect effects of large-scale processes on communities. J. Exp. Mar. Biol. Ecol. 227, 251–264. doi: 10.1016/S0022-0981(97)00274-8
Hoareau T., Boissin E. (2010). Design of phylum-specific hybrid primers for DNA barcoding: addressing the need for efficient COI amplification in the Echinodermata. Mol. Ecol. Resour. 10, 960–967. doi: 10.1111/j.1755-0998.2010.02848.x
Ip Y. C. A., Chang J. J. M., Oh R. M., Quek Z. B. R., Chan Y. K. S., Bauman A. G., et al. (2022). Seq’ and ARMS shall find: DNA (meta)barcoding of autonomous reef monitoring structures across the tree of life uncovers hidden cryptobiome of tropical urban coral reefs. Mol. Ecol., mec.16568. doi: 10.1111/mec.16568
Irving A., Connell S. (2002). Sedimentation and light penetration interact to maintain heterogeneity of subtidal habitats: algal versus invertebrate dominated assemblages. Mar. Ecol. Prog. Ser. 245, 83–91. doi: 10.3354/meps245083
Keck F., Blackman R. C., Bossart R., Brantschen J., Couton M., Hürlemann S., et al. (2022). Meta-analysis shows both congruence and complementarity of DNA and eDNA metabarcoding to traditional methods for biological community assessment. Mol. Ecol. 31, 1820–1835. doi: 10.1111/mec.16364
Lan Y., Wang Q., Cole J. R., Rosen G. L. (2012). Using the RDP classifier to predict taxonomic novelty and reduce the search space for finding novel organisms. PloS One 7, e32491. doi: 10.1371/journal.pone.0032491
Lasiak T. (2003). Influence of taxonomic resolution, biological attributes and data transformations on multivariate comparisons of rocky macrofaunal assemblages. Mar. Ecol. Prog. Ser. 250, 29–34. doi: 10.3354/meps250029
Liu J., Zhang H. (2021). Combining multiple markers in environmental DNA metabarcoding to assess deep-Sea benthic biodiversity. Front. Mar. Sci. 8. doi: 10.3389/fmars.2021.684955
Mahé F., Rognes T., Quince C., de Vargas C., Dunthorn M. (2015). Swarm v2: highly-scalable and high-resolution amplicon clustering. PeerJ 3, e1420. doi: 10.7717/peerj.1420
Mahmoudi N., Slater G. F., Fulthorpe R. R. (2011). Comparison of commercial DNA extraction kits for isolation and purification of bacterial and eukaryotic DNA from PAH-contaminated soils. Can. J. Microbiol. 57, 623–628. doi: 10.1139/w11-049
McQuaid C., Branch G. (1985). Trophic structure of rocky intertidal communities: response to wave action and implications for energy flow. Mar. Ecol. Prog. Ser. 22, 153–161. doi: 10.3354/meps022153
Menconi M., Benedetti-Cecchi L., Cinelli F. (1999). Spatial and temporal variability in the distribution of algae and invertebrates on rocky shores in the northwest Mediterranean. J. Exp. Mar. Biol. Ecol. 233, 1–23. doi: 10.1016/S0022-0981(98)00123-3
Mikac B., Licciano M., Jaklin A., Iveša L., Giangrande A., Musco L. (2020). Diversity and distribution patterns of hard bottom polychaete assemblages in the north Adriatic Sea (Mediterranean). Diversity 12, 408. doi: 10.3390/d12100408
Monroy-Velázquez L. V., Rodríguez-Martínez R. E., Blanchon P., Alvarez F. (2020). The use of artificial substrate units to improve inventories of cryptic crustacean species on Caribbean coral reefs. PeerJ 8, e10389. doi: 10.7717/peerj.10389
Mugnai F., Costantini F., Chenuil A., Leduc M., Ortega J. M. G., Meglécz E. (2023). Be positive: customized reference databases and new, local barcodes balance false taxonomic assignments in metabarcoding studies. PeerJ 11, e14616. doi: 10.7717/peerj.14616
Mugnai F., Meglécz E., Abbiati M., Bavestrello G., Bertasi F., Bo M., et al. (2021). Are well-studied marine biodiversity hotspots still blackspots for animal barcoding? Glob. Ecol. Conserv. 32, e01909. doi: 10.1016/j.gecco.2021.e01909
Nygren A. (2014). Cryptic polychaete diversity: a review. Zool. Scr. 43, 172–183. doi: 10.1111/zsc.12044
Olsgard F., Somerfield P. J. (2000). Surrogates in marine benthic investigations - which taxonomic unit to target? J. Aquat. Ecosyst. Stress Recovery 7, 25–42. doi: 10.1023/A:1009967313147
Olsgard F., Somerfield P., Carr M. (1998). Relationships between taxonomic resolution, macrobenthic community patterns and disturbance. Mar. Ecol. Prog. Ser. 172, 25–36. doi: 10.3354/meps172025
Palomino-Alvarez L. A., Vital X. G., Castillo-Cupul R. E., Suárez-Mozo N. Y., Ugalde D., Cervantes-Campero G., et al. (2021). Evaluation of the use of autonomous reef monitoring structures (ARMS) for describing the species diversity of two coral reefs in the Yucatan peninsula, Mexico. Diversity 13, 579. doi: 10.3390/d13110579
Pearman J. K., Anlauf H., Irigoien X., Carvalho S. (2016). Please mind the gap – visual census and cryptic biodiversity assessment at central red Sea coral reefs. Mar. Environ. Res. 118, 20–30. doi: 10.1016/j.marenvres.2016.04.011
Pecl G. T., Araújo M. B., Bell J. D., Blanchard J., Bonebrake T. C., Chen I.-C., et al. (2017). Biodiversity redistribution under climate change: impacts on ecosystems and human well-being. Science 355, eaai9214. doi: 10.1126/science.aai9214
Pitacco V., Mavrič B., Orlando-Bonaca M., Lipej L. (2013). Rocky macrozoobenthos mediolittoral community in the gulf of Trieste (North Adriatic) along a gradient of hydromorphological modifications. Acta Adriat. 54 (1), 67–86.
Porter T. M., Hajibabaei M. (2018). Automated high throughput animal CO1 metabarcode classification. Sci. Rep. 8, 4226. doi: 10.1038/s41598-018-22505-4
Ransome E., Geller J. B., Timmers M., Leray M., Mahardini A., Sembiring A., et al. (2017). The importance of standardization for biodiversity comparisons: a case study using autonomous reef monitoring structures (ARMS) and metabarcoding to measure cryptic diversity on mo’orea coral reefs, French Polynesia. PloS One 12, e0175066. doi: 10.1371/journal.pone.0175066
Rognes T., Flouri T., Nichols B., Quince C., Mahé F. (2016). VSEARCH: a versatile open source tool for metagenomics. PeerJ 4, e2584. doi: 10.7717/peerj.2584
Rossi V., Ser-Giacomi E., López C., Hernández-García E. (2014). Hydrodynamic provinces and oceanic connectivity from a transport network help designing marine reserves. Geophys. Res. Lett. 41, 2883–2891. doi: 10.1002/2014GL059540
Rule M., Smith S. (2005). Spatial variation in the recruitment of benthic assemblages to artificial substrata. Mar. Ecol. Prog. Ser. 290, 67–78. doi: 10.3354/meps290067
Schlick-Steiner B. C., Steiner F. M., Seifert B., Stauffer C., Christian E., Crozier R. H. (2010). Integrative taxonomy: a multisource approach to exploring biodiversity. Annu. Rev. Entomol. 55, 421–438. doi: 10.1146/annurev-ento-112408-085432
Schoener A. (1974). Experimental zoogeography: colonization of marine mini-islands. Am. Nat. 108, 715–738. doi: 10.1086/282951
Scribano G., Marchini A., Ros M. (2021). Population dynamics and life history traits of the non-indigenous Paranthura japonica Richardson1901, (909) in a recently invaded Mediterranean site. Reg. Stud. Mar. Sci. 46, 101883. doi: 10.1016/j.rsma.2021.101883
Sheth B. P., Thaker V. S. (2017). DNA Barcoding and traditional taxonomy: an integrated approach for biodiversity conservation. Genome 60, 618–628. doi: 10.1139/gen-2015-0167
Smith S. D. A., Rule M. J. (2002). Artificial substrata in a shallow sublittoral habitat: do they adequately represent natural habitats or the local species pool? J. Exp. Mar. Biol. Ecol. 277, 25–41. doi: 10.1016/S0022-0981(02)00242-3
Somerfield P., Clarke K. (1995). Taxonomic levels, in marine community studies, revisited. Mar. Ecol. Prog. Ser. 127, 113–119. doi: 10.3354/meps127113
Teixidó N., Garrabou J., Harmelin J.-G. (2011). Low dynamics, high longevity and persistence of sessile structural species dwelling on Mediterranean coralligenous outcrops. PloS One 6, e23744. doi: 10.1371/journal.pone.0023744
Terlizzi A., Anderson M., Fraschetti S., Benedetti-Cecchi L. (2007). Scales of spatial variation in Mediterranean subtidal sessile assemblages at different depths. Mar. Ecol. Prog. Ser. 332, 25–39. doi: 10.3354/meps332025
Terlizzi A., Scuderi D., Fraschetti S., Anderson M. J. (2005). Quantifying effects of pollution on biodiversity: a case study of highly diverse molluscan assemblages in the Mediterranean. Mar. Biol. 148, 293–305. doi: 10.1007/s00227-005-0080-8
Terlizzi A., Scuderi D., Fraschetti S., Guidetti P., Boero F. (2003). Molluscs on subtidal cliffs: patterns of spatial distribution J. Mar. Biological Assoc. U. K. 83, 165–172. doi: 10.1017/S0025315403006933h
Thomasdotter A., Shum P., Mugnai F., Vingiani M., Dubut V., Florent Marschal F., et al. (2023). Spineless and overlooked: DNA metabarcoding of autonomous reef monitoring structures reveals intra- and interspecific genetic diversity in Mediterranean invertebrates. Mol. Ecol. Res. (in press).
Trevisan B., Alcantara D. M. C., Machado D. J., Marques F. P. L., Lahr D. J. G. (2019). Genome skimming is a low-cost and robust strategy to assemble complete mitochondrial genomes from ethanol preserved specimens in biodiversity studies. PeerJ 7, e7543. doi: 10.7717/peerj.7543
Troudet J., Grandcolas P., Blin A., Vignes-Lebbe R., Legendre F. (2017). Taxonomic bias in biodiversity data and societal preferences. Sci. Rep. 7, 9132. doi: 10.1038/s41598-017-09084-6
Underwood A. J., Chapman M. G. (2006). Early development of subtidal macrofaunal assemblages: relationships to period and timing of colonization. J. Exp. Mar. Biol. Ecol. 330, 221–233. doi: 10.1016/j.jembe.2005.12.029
Valentini A., Taberlet P., Miaud C., Civade R., Herder J., Thomsen P. F., et al. (2016). Next-generation monitoring of aquatic biodiversity using environmental DNA metabarcoding. Mol. Ecol. 25, 929–942. doi: 10.1111/mec.13428
Wang Q., Garrity G. M., Tiedje J. M., Cole J. R. (2007). Naïve Bayesian classifier for rapid assignment of rRNA sequences into the new bacterial taxonomy. Appl. Environ. Microbiol. 73, 5261–5267. doi: 10.1128/AEM.00062-07
Keywords: standardized method, COI metabarcoding, morphology, biodiveristy monitoring, marine invertebrates
Citation: Mugnai F, Mikac B, Colangelo MA, Matterson KO, Abbiati M and Costantini F (2023) Integrative taxonomy approach to detect spatial and temporal variability of the Mediterranean benthic communities through artificial substrate units (ASUs). Front. Mar. Sci. 10:1113322. doi: 10.3389/fmars.2023.1113322
Received: 01 December 2022; Accepted: 20 June 2023;
Published: 15 August 2023.
Edited by:
Katerina Vasileiadou, Hellenic Centre for Marine Research (HCMR), GreeceReviewed by:
Ana Cristina Costa, University of the Azores, PortugalMaria Flavia Gravina, University of Rome Tor Vergata, Italy
Copyright © 2023 Mugnai, Mikac, Colangelo, Matterson, Abbiati and Costantini. This is an open-access article distributed under the terms of the Creative Commons Attribution License (CC BY). The use, distribution or reproduction in other forums is permitted, provided the original author(s) and the copyright owner(s) are credited and that the original publication in this journal is cited, in accordance with accepted academic practice. No use, distribution or reproduction is permitted which does not comply with these terms.
*Correspondence: Barbara Mikac, YmFyYmFyYS5taWthY0B1bmliby5pdA==; Marina Antonia Colangelo, bWFyaW5hLmNvbGFuZ2Vsb0B1bmliby5pdA==