 Soohyun Um
 Jaeyoun Lee
 Yechan Lee
 Wan Namkung
 Seung Hyun Kim
- College of Pharmacy, Yonsei Institute of Pharmaceutical Sciences, Yonsei University, Incheon, Republic of Korea
Five previously undescribed pentacyclic triterpenoid saponins, pannoside A–E (1–5), were discovered from the whole plant of seashore aster, Tripolium pannonicum, collected from the Songdo tidal flat, Incheon, Korea. The planar structures of pannosides were elucidated as pentacyclic triterpenoids bearing sugar moieties and 3-hydroxybutyrate (3-HB) based on the interpretation of the NMR, IR spectroscopic and MS data. The relative configurations of the aglycone and sugar moieties of 1–5 were determined based on careful analysis of ROESY correlations. To determine the absolute configuration of 3-hydroxybutyrate, we utilized the phenylglycine methyl ester (PGME) derivatization with LC-MS chromatographic analysis. Pannoside E (5) exhibited inhibitory activities against diverse cancer cell lines including prostate carcinoma and non-small cell lung carcinoma, with IC50 values of 0.34 and 0.89 μM, respectively. Pannosides are the first triterpenoid saponin isolated from T. pannonicum, implying that undiscovered secondary metabolites from a halophyte could be a good source of bioactive compounds.
1 Introduction
A tidal mudflat is a flat topography formed on a calm shoreline owing to the deposition of fine soil caused by tides over time (Dyer et al., 2000; Liu et al., 2013). Tidal mudflats are coastal sedimentary landforms composed mostly of material delivered by high and low tides. For them to spread widely on the exposed surface when the water recedes (low tide), they require a large flat terrain with high tide and a long period of time to accumulate (Möller et al., 2014). When the frequency of seawater intrusion diminishes as the ground level rises, halophytes begin to settle down, and when the tidal flat rises to the point where seawater only enters seasonally, halophytes populate densely (Xin et al., 2022). The resulting tidal mudflats are salt marshes that differ from typical tidal mudflats in that the flora grows (Caçador et al., 2016). A salt marsh is a landscape in which sand or clay is periodically deposited on the coastline because of a drop in estuary flow velocity with a gentle coastal slope (Baptist et al., 2021). Depending on the soil type and sedimentary topography, salt marshes can take on a variety of forms, including mud and sandy marshes. These forms are inhabited by a wide range of organisms including halophytes, invertebrates, and microalgae (Caçador et al., 2016).
In salt marshes, where herbivore consumption is limited, halophytes are the beginning of the food chain, and most halophytes are supplied to the organic detrital particle food chain by microbial decomposition (Simões et al., 2011). The leaves or stems of halophytes gradually fall to the sedimentary ground where decomposition begins. Halophytes decomposed by marine microbes become organic matter that is suitable for use by benthic invertebrates (Simões et al., 2011). Therefore, halophytes are responsible for the primary production of salt marshes and have become the source of the tidal mudflat ecosystem food web (Lefeuvre et al., 2000). In addition, their ecological position is crucial, as they prevent coastal erosion by dampening external waves and stabilizing the sedimentary salt marsh by anchoring themselves to it with roots (Feagin et al., 2009). Halophytes inhabiting these unique environments have been the subject of extensive ecological studies (Hall and Melanie, 1997; Balke et al., 2014; Bouma et al., 2016); however, research on their metabolites is undervalued as they are not typically employed as herbal remedies traditionally. Further investigation is required as well into the Korean halophyte metabolites, which are in risk of extinction as a result of ongoing land reclamation. Novel metabolites produced by halophytes are likely to have diverse carbon backbones and biological activities.
In general, plant secondary metabolites with high industrial use in agriculture, food, and medicine include steroids, terpenes, alkaloids, antibiotics, vitamins, and sweeteners (Kumar et al., 2022; Ochatt et al., 2022). The use of triterpenoid saponins of the terpene class has been widely studied. Triterpenoid saponins are triterpene glycosides belonging to the saponin category of substances (Augustin et al., 2011). Plants produce a variety of terpenoids and saponins to protect themselves from physical wounds, infections with pathogenic bacteria, and insect wounds (Georgian et al., 2019). Triterpenoid saponins are present in various plant species. Triterpenoid saponins are especially abundant in legumes, such as soybeans and peas (Vinutha et al., 2017) and can also be found in Quillaja, Hippocastani, Primulae, Glycyrrbizae, Ginseng, and Aster (Hussain et al., 2019). In order to discover new triterpenoid saponin compounds, we collected 6 halophyte species including Phragmites communis, Suaeda japonica, Suaeda maritima, Salicornia europaea, Sonchus brachyotus, and Tripolium pannonicum from a salt marsh area in the Yellow Sea of the Republic of Korea, one of the five largest tidal mudflats in the world. Among these, saponin compounds with a molecular weight of m/z 1000–1500 were detected in the extract of T. pannonicum which is known to produce secondary metabolites such as caffeoyl esters, flavonoid glycosides, and flavonoids (Wubshet et al., 2013) by our liquid chromatography-mass spectrometry (LC-MS) screening system. Herein, we report the structural elucidation and biological activity of five new triterpenoid saponins isolated from T. pannonicum.
2 Materials and methods
2.1 General experimental procedures
Using Sephadex LH-20 resin for fractionation (GE Healthcare, Chicago, IL, USA) and YMC-triart C18 column (150 × 2.0 mm, 5 μm; YMC KOREA Co., Seongnam, Korea) for analysis, column chromatography was conducted. Preparative LC-MS analytical grade solvents were provided by J.T. Baker (Philipsburg, NJ, USA) and Burdick & Jackson (Muskegon, MI, USA). For the extraction of plant material, we employed solvents purchased from SK Chemical Co. Ltd. in Seongnam, Korea, and for NMR spectroscopy, we used solvents purchased from Cambridge Isotope Laboratories (Andover, MA, USA). The analytical high-performance liquid chromatography (HPLC) measurements of LC-MS were carried out using an Agilent 1290 UHPLC system (Agilent Technologies, Santa Clara, California, United States), which was outfitted with a 1290 Infinity binary pump. An Agilent 6530 iFunnel quadrupole-time of flight mass spectrometer (Q-TOF-MS, Agilent Technologies) equipped with an electrospray ion (ESI) source was used for mass spectrometry. The MS experiment was carried out under continuous conditions with positive and negative mode. HR‐ESI‐MS data was processed with Mass Hunter Data acquisition and Qualitative analysis software. An Agilent 1100 series capillary LC system linked with a Waters micromass ZQ mass spectrometer (Waters Co.) was used to perform semi-preparative LC-MS on a J’sphere ODS-H80 (20 × 250 mm, 4 μm, Waters Co., Milford, MA, USA). NMR spectra were collected using a Bruker 800MHz NMR spectrometer outfitted with a Bruker CryoPlatform (CD3OD-d4, 800 MHz for 1H and 200 MHz for 13C) at the Korea Basic Science Institute in Ochang, Korea, as well as a Jeol 600MHz NMR spectrometer (CD3OD-d4, 600 MHz for 1H and 150 MHz for 13C) at Yonsei University. MestReNova ver. 12.0.1 was used to process the data for the NMR spectra. Combinational data from 2D NMR experiments such as correlation spectroscopy (COSY), heteronuclear single quantum coherence (HSQC), and heteronuclear multiple bond correlation (HMBC) rotating frame overhause effect spectroscopy (ROESY) and total correlation spectroscopy (TOCSY) were interpreted to assign chemical structures.
2.2 Plant collection, extract, and compound purification
Six plant materials, P. communis, S. japonica, S. maritima, S. europaea, S. brachyotus, and T. pannonicum, were harvested from a tidal mudflat marsh in Songdo, Incheon, South Korea (37° 23’ 7.7″ N, 126° 40’ 44″ E) in October 2021 for fundamental metabolite screening experiments. In September 2022, the target plant material, T. pannonicum, was gathered on bulk-weighing scales at the same location. The entire T. pannonicum was placed in a dehydrator and heated to 60°C for 12 h. The dried sample was initially ground into powder, and then the material was extracted twice with methanol (12L) through a sonication-assisted extraction process (40°C, 3 h). To obtain a crude extract, the filtered solution was concentrated in vacuo. The extract (12.8 g) was processed using Sephadex LH-20 resin and eluted with methanol to yield eight fractions (FR1-FR8, every 15 min, for a total of 120 min). Fraction 2 (15–30 min) was further purified by preparative reverse phase high-performance liquid chromatography with mass spectrometry (RP-LC-MS) with elution of 50% aqueous acetonitrile (0.1% formic acid). The targeted compounds eluted at a retention time of 21.2, 26.9, 35.7, 18.4, and 23.5 min were specified as pannosides A (3.2 mg), B (2.6 mg), C (2.1 mg), D (1.8 mg), and E (1.4 mg), respectively.
pannoside A (1) White amorphous powder; IR νmax (KBr) 3309, 2944, 2833, 1651, 1115, 1026 cm-1; UV (MeOH); HR‐ESI‐MS m/z 1249.5588 [M + Na]+ (calcd. for C60H90O26Na, m/z 1249.5623); for 1H (CD3OD, 800 MHz) and 13C NMR (CD3OD, 200 MHz) spectroscopic data, see Tables 1, 2.
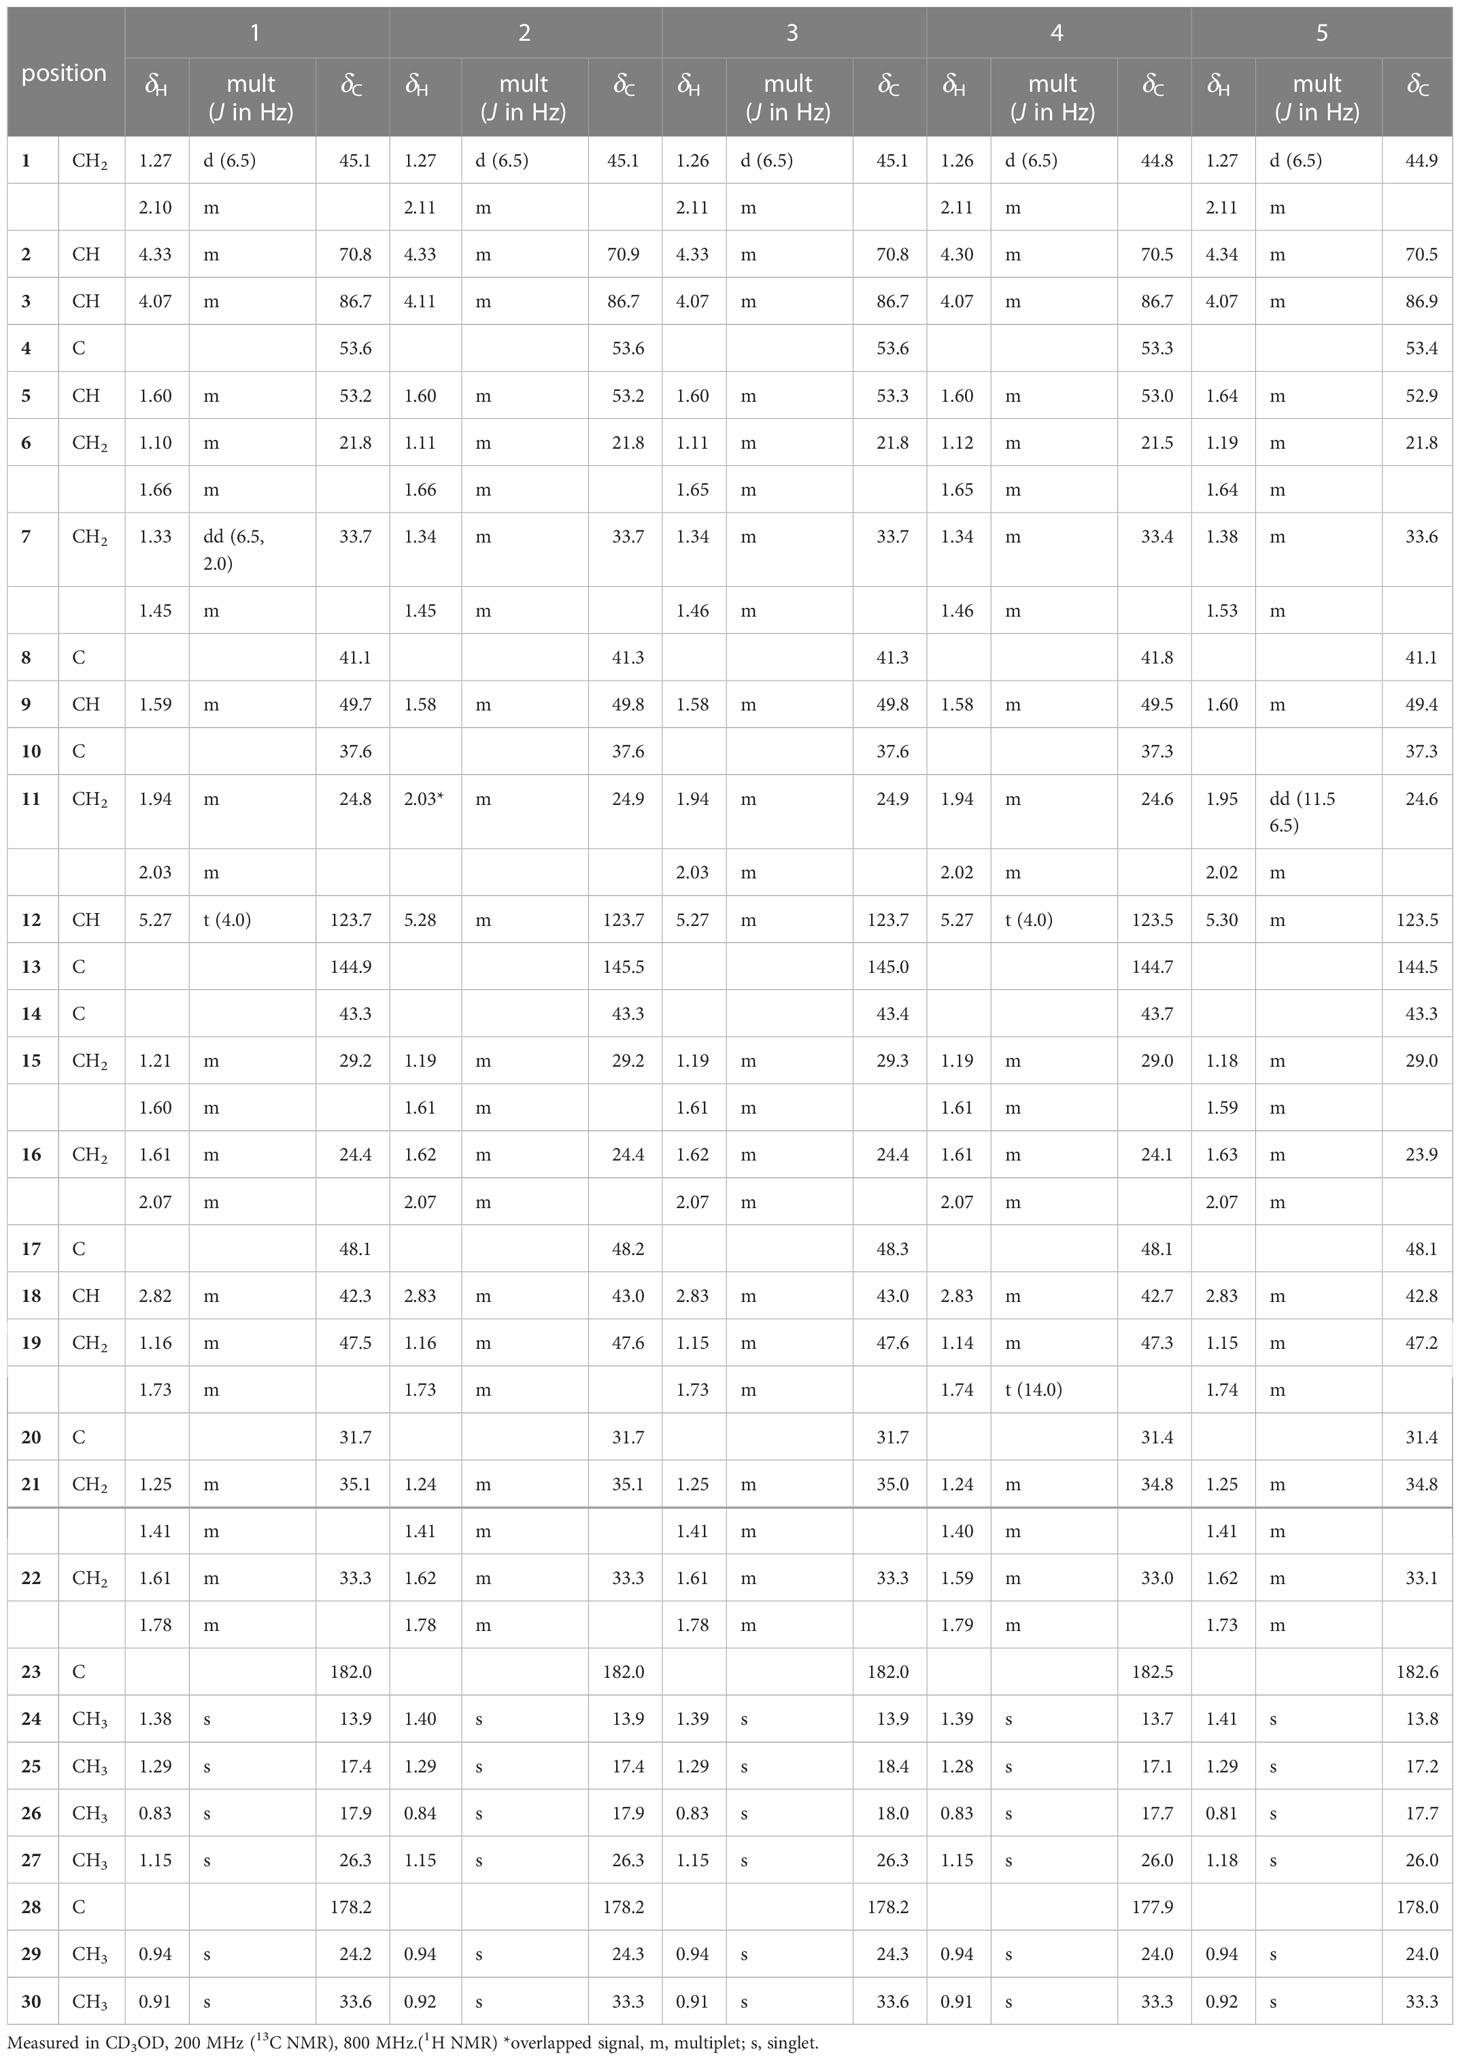
Table 1 1H and 13C NMR spectroscopic data of aglycone of pannosides A–E (1–5).
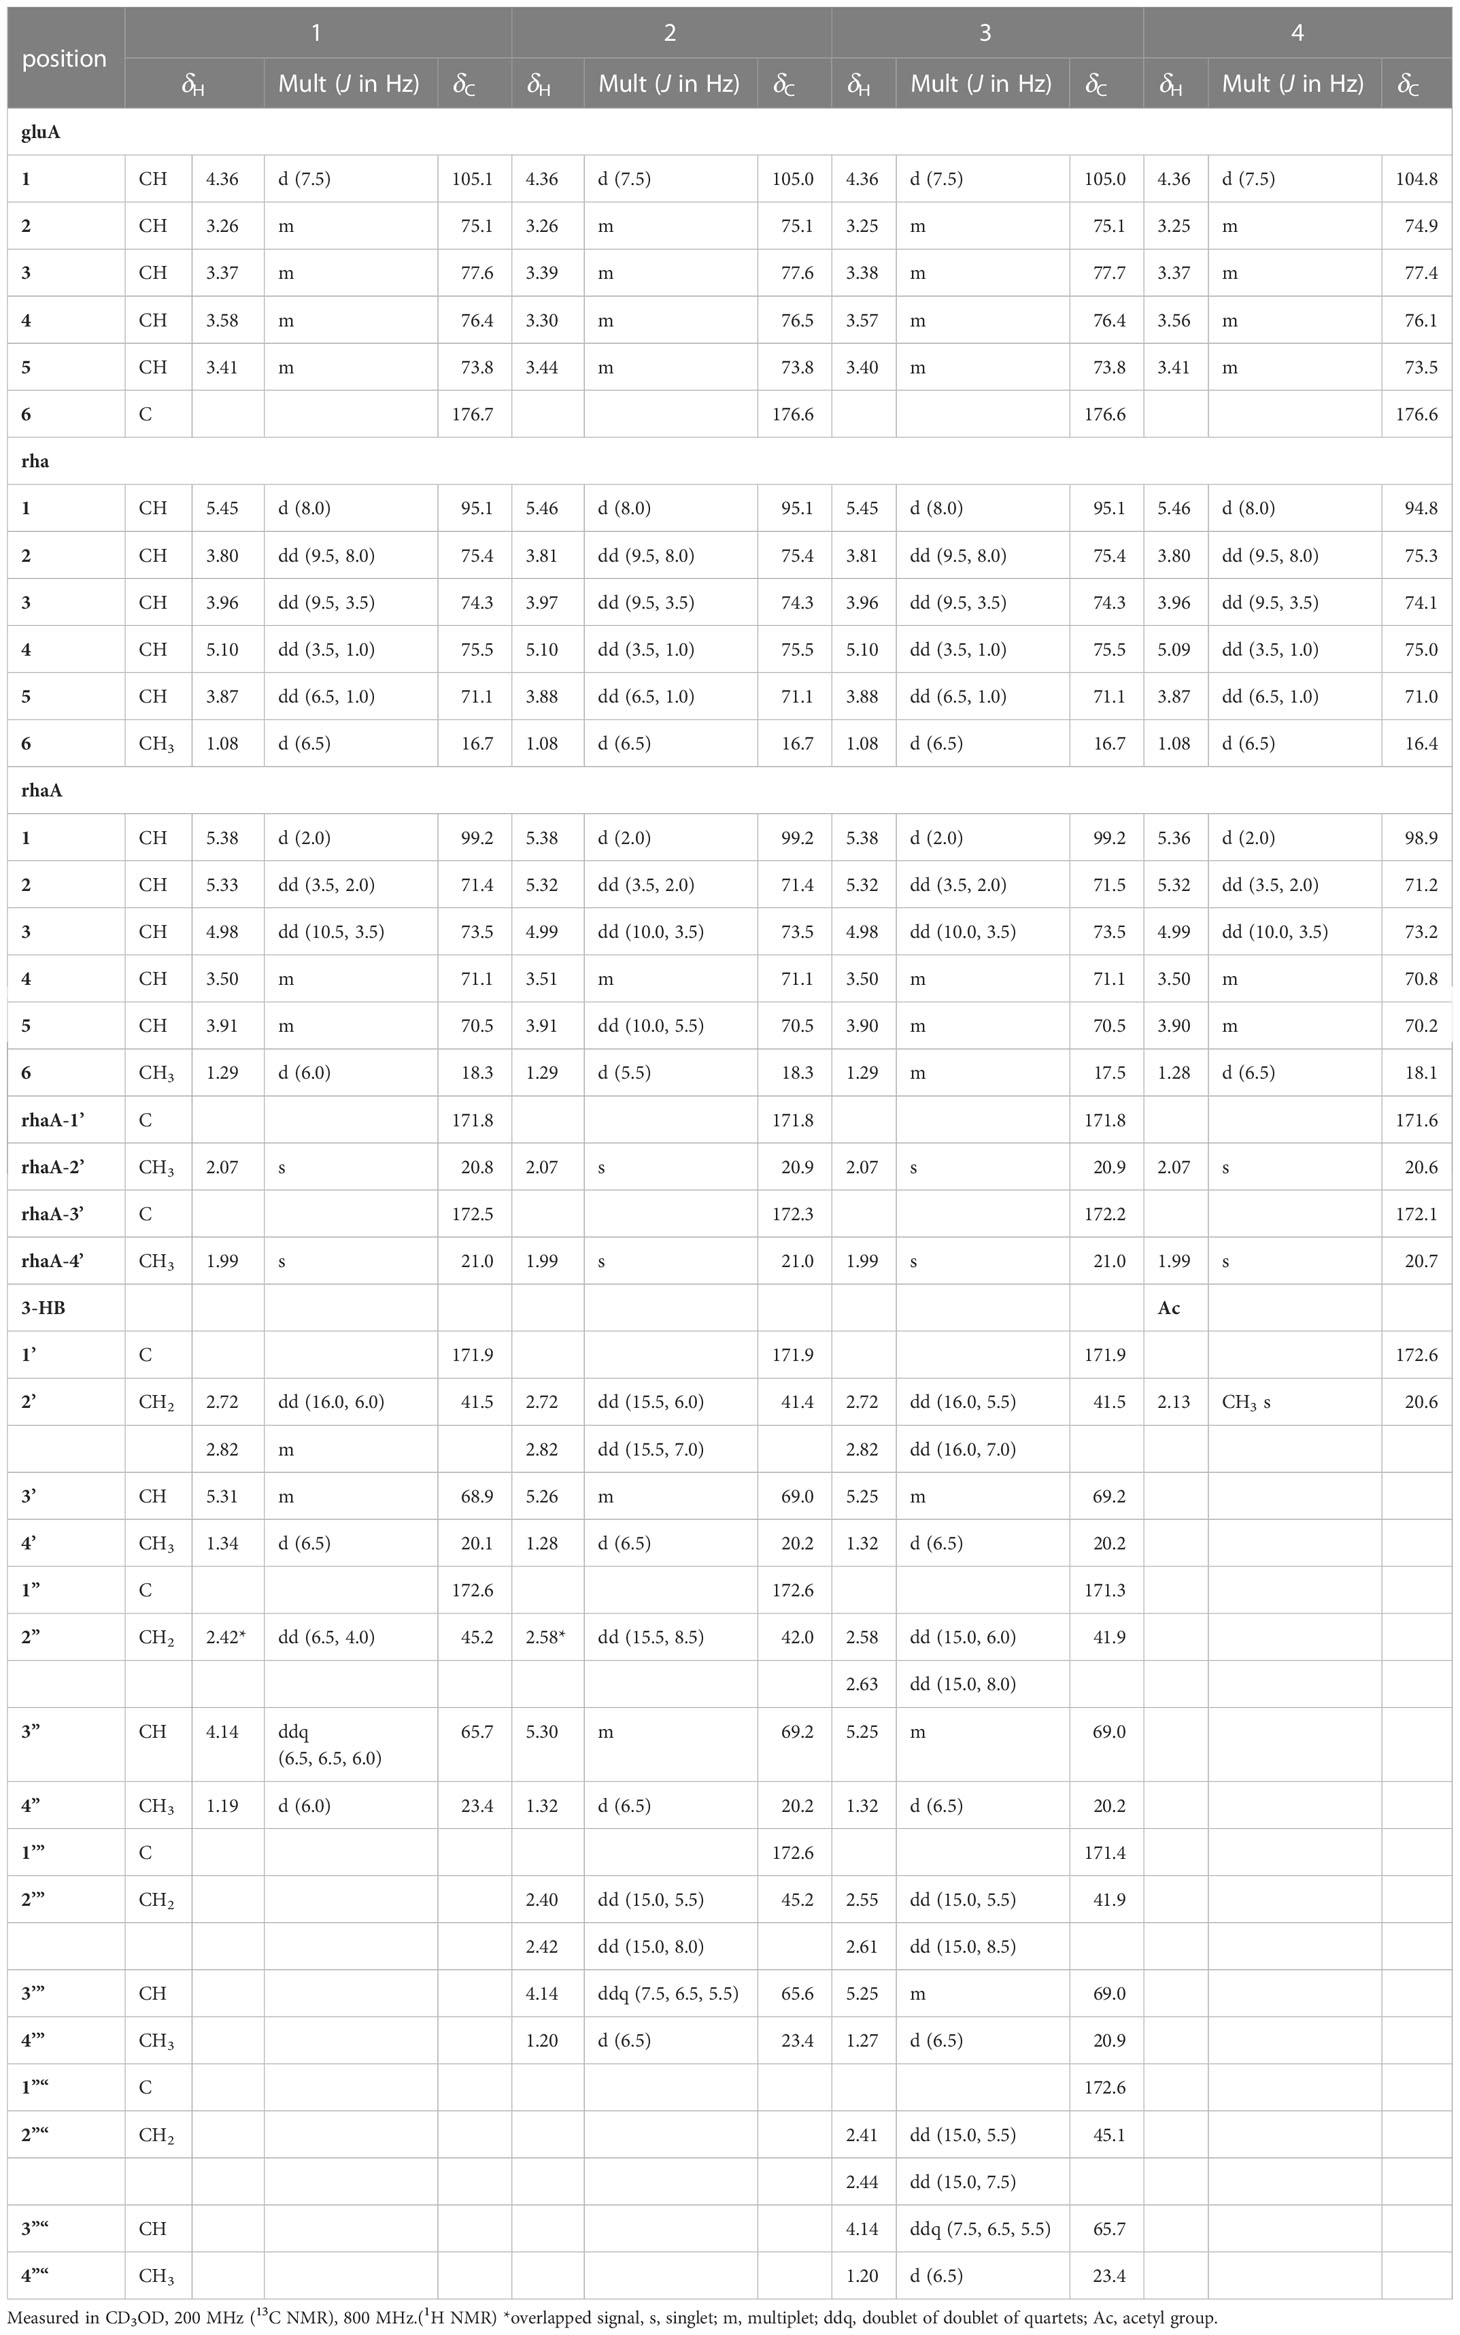
Table 2 1H and 13C NMR spectroscopic data of the sugar and 3-HB moieties of pannosides A–D (1–4).
pannoside B (2) White amorphous powder; IR νmax (KBr) 3309, 2944, 2834, 1651, 1115, 1024 cm-1; UV (MeOH); HR‐ESI‐MS m/z 1335.5984 [M + Na]+ (calcd. for C64H96O28Na, m/z 1335.5991); for 1H (CD3OD, 800 MHz) and 13C NMR (CD3OD, 200 MHz) spectroscopic data, see Tables 1, 2.
pannoside C (3) White amorphous powder; IR νmax (KBr) 3321, 2944, 2833, 1651, 1113, 1026 cm-1; UV (MeOH); HR‐ESI‐MS m/z 1421.6340 [M + Na]+ (calcd. for C68H102O30Na, m/z 1421.6359); for 1H (CD3OD, 800 MHz) and 13C NMR (CD3OD, 200 MHz) spectroscopic data, see Tables 1, 2.
pannoside D (4) White amorphous powder; IR νmax (KBr) 3326, 2944, 2833, 1651, 1117, 1026 cm-1; UV (MeOH); HR‐ESI‐MS m/z 1119.4947 [M + Na]+ (calcd. for C54H80O23Na, m/z 1119.4993); for 1H (CD3OD, 800 MHz) and 13C NMR (CD3OD, 200 MHz) spectroscopic data, see Tables 1, 2.
pannoside E (5) White amorphous powder; IR νmax (KBr) 3309, 2944, 2833, 1651, 1117, 1026 cm-1; UV (MeOH); HR‐ESI‐MS m/z 1511.6364 [M + Na]+ (calcd. for C70H104O34Na, m/z 1511.6312); for 1H (CD3OD, 800 MHz) and 13C NMR (CD3OD, 200 MHz) spectroscopic data, see Tables 1, 3.
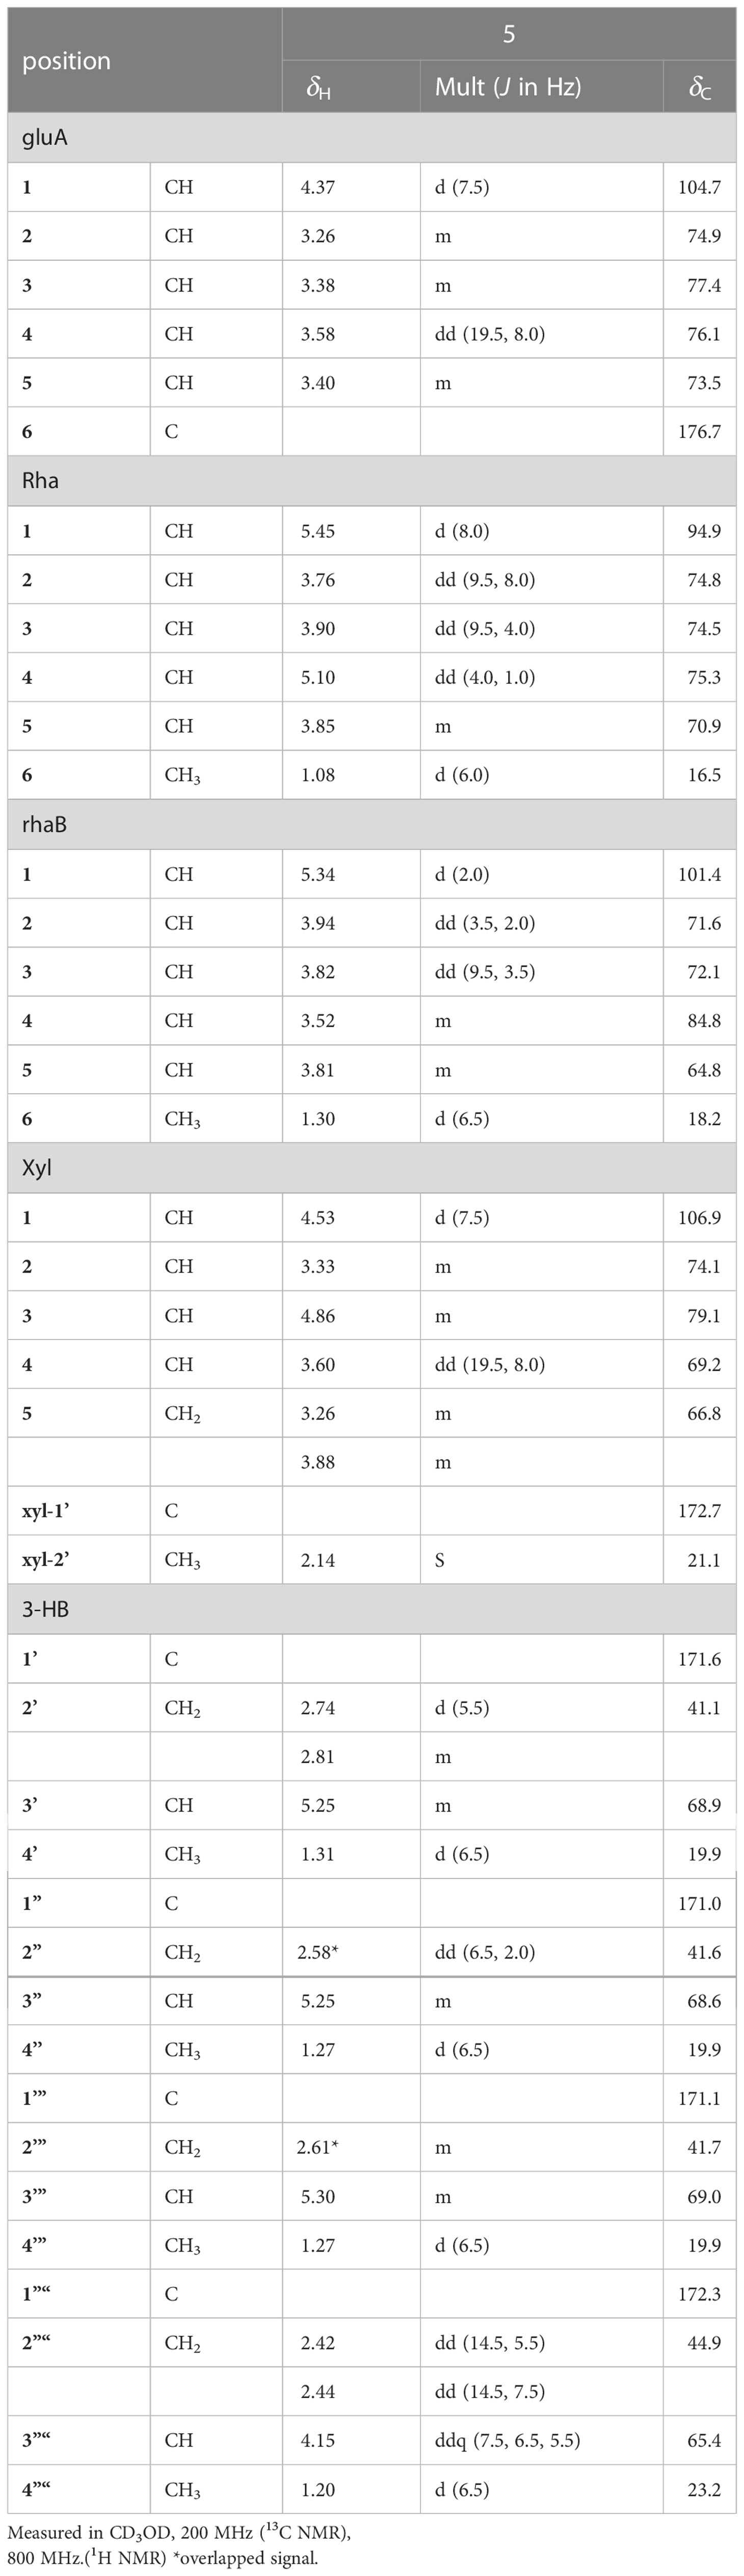
Table 3 1H and 13C NMR spectroscopic data of the sugar and 3-HB moieties of pannoside E (5).
2.3 Determination of absolute configuration of 3-HB residues
Acid hydrolysis of pannoside A (1) was carried out using 6N HCl at 120°C for overnight to obtain 3-HB residues. The reactant was then rapidly cooled by immersing the reaction vial in ice water, the reaction solvent was evaporated under a vacuum, and residual HCl was eliminated using a freeze dryer overnight. After drying, the hydrolysate containing 3-HB residues and authentic standards of S- and R-3-hydroxybutyrate (Angene Chemical, India) were dissolved in 2 mL of tetrahydrofuran (THF, Sigma-Aldrich, USA) and treated with 10 mg of S-phenylglycine methyl ester (S-PGME) (98.0%, Combi-Blocks, USA), 10 mg of 1-(3-Dimethylaminopropyl)-3-ethylcarbodiimide hydrochloride (EDC, Combi-Blocks, USA), and 10 mg of 4-dimethylaminopyridine (4-DMAP). The reaction mixtures were stirred at room temperature for 1 h. The reactant mixtures were analyzed by QTOF-MS using a gradient system (10–50% aqueous acetonitrile with 0.1% formic acid over 40 min).
2.4 Analyses of metabolites from T. pannonicum
Molecular networks based on tandem mass spectrometry were constructed using the Global Natural Product Social Molecular Networking (GNPS) platform (http://gnps.ucsd.edu ) (Wang et al., 2016; Nothias et al., 2020) to analyze the metabolites of T. pannonicum. The dried crude extract was diluted in methanol at a concentration of 250 μg/mL and analyzed with LC/quadrupole time-of-flight (Q-TOF)-MS (A: water, B: acetonitrile, a gradient system: 0–20 min (10–100% B), 20–25 min (100% B), and 25–30 min (10% B), 0.3 mL/min of flow rate, and injection volume of 20 μL). MS-Convert was used to convert the data to mzML file format. Using the extracted ion mode (EIC), the production of each metabolite was measured by comparing the peak areas. The analysis was processed by the following condition; precursor ion mass tolerance: 2.0 Da, fragment ion mass tolerance: 0.5 Da, cosine score to generate molecular networks: 0.7, minimum matched peaks: 6, and minimum cluster size: 2. After analysis, the data were visualized using Cytoscape software ver. 3.9.0 (Shannon et al., 2003).
2.5 Cell culture
HT29 and PC3 cells were purchased from the Korean Cell Line Bank (Seoul, Korea) and PC9 cells were obtained from Yohan Seo (Daegu Gyeongbuk Medical Innovation Foundation, Korea). HT29, PC3, and PC9 cells were cultured in Roswell Park Memorial Institute (RPMI) 1640. RPMI1640 media was supplemented with 10% fetal bovine serum (FBS), 100 U/mL penicillin, and 100 μg/mL streptomycin, and cells were maintained at 37°C in a humidified atmosphere with 5% CO2.
2.6 Cell viability assay
Cell viability was estimated using the Cell Titer 96® AQueous One Solution Assay Kit (Promega, Madison, WI, USA). HT29, PC3, and PC9 cells were grown in 96-well plates in growth medium supplemented with 2% FBS for 24 h, and then cells were treated with test compounds, and the growth medium and test compounds were changed every 24 h. After 72 h, a cell viability assay was conducted according to the manufacturer’s instructions. The absorbance was measured at 490 nm using an Infinite M200 microplate reader (Tecan, Männedorf, Switzerland).
3 Results and discussion
3.1 Structure elucidation
Pannoside A (1) was isolated as a white, amorphous powder. Its molecular formula was calculated as m/z 1249.5588 [M + Na]+ (calcd. for C60H90O26Na, m/z 1249.5623) with 16 degrees of unsaturation based on the HR-ESI mass and 13C NMR spectrometric data (Figure S2). The infrared (IR) spectrum showed absorptions at 3309 and 1651 cm–1 indicating carbonyl and hydroxyl groups, respectively. The 1H NMR spectrum of 1 exhibited one olefinic signal at δH 5.28 (t, J = 4.0 Hz) and six tertiary methyl signals at δH 1.38. 1.29, 1.15, 0.94, 0.91, and 0.83 (18H, s, CH3 × 6), and nine methylene proton signals between δH 2.10 and 1.10. In addition, 1H NMR data showed two oxygenated methine proton signals at δH 4.33 and 4.07, with three additional methine proton resonances at δH 2.82, 1.60, and 1.59. Subsequent 1H NMR data analysis revealed three anomeric proton signals at δH 5.45 (d, J = 8.0 Hz, H-1-rha), 5.38 (d, J = 2.0 Hz, H-1-rhaA), and 4.36 (d, J = 7.5 Hz, H-1-gluA) and overlapped protons between δH 5.33 and δH 3.26, indicating the presence of three sugar moieties. Furthermore, the two doublet resonances δH 1.34 and 1.19 were assigned to secondary methyl protons (6H, d, CH3 × 2), while the two multiplet proton signals at δH 5.31 and 4.31 were assigned to methine protons. The four methylene proton resonances at δH 2.82, 2.72, 2.44, and 2.40 were connected to the methine protons (δH 5.31 and 4.31) with vicinal couplings, suggesting the presence of two 3-hydroxybutyrate (3-HB) residues in 1. The 13C NMR spectrum revealed 60 carbon resonances and the presence of a glucuronyl moiety (δC 105.1, 77.6, 76.4, 75.1, and 73.8), rhamnosyl moiety (δC 95.1, 75.5, 75.4, 74.3, 71.1, and 16.1), and acetylated rhamnosyl moiety (δC 99.2, 73.5, 71.4, 71.1, 70.5, and 18.3) (Figure 1).
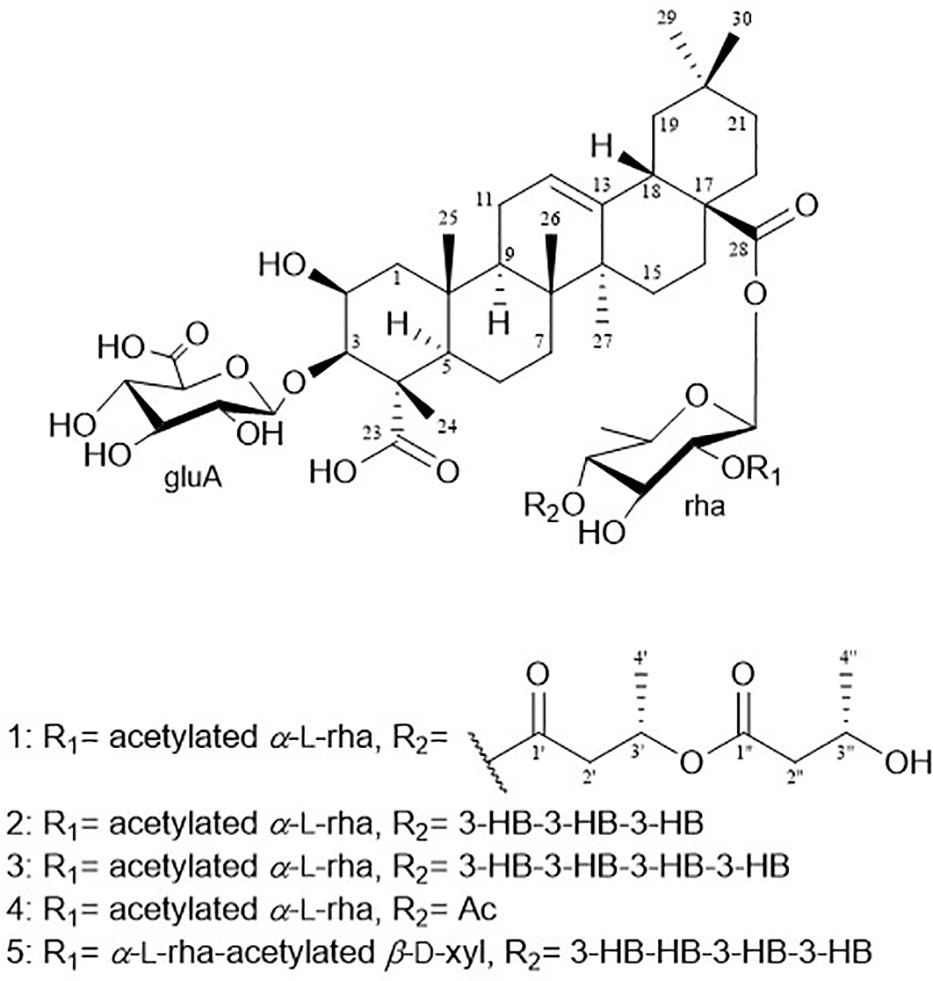
Figure 1 Chemical structures of pannosides A–E (1–5).
Finally, 1D and 2D NMR analyses successfully established the aglycone structure of 1 (Figures S1–S7). Among the remaining 30 carbon resonances, six methyls, nine methylenes, six methines (including two oxygenated and one olefinic), and nine quaternary carbons (including two hydroxyl) were identified. The proton couplings between H2-1/H-2/H-3, H-5/H2-6/H2-7, H2-11/H2-12, H2-15/H2-16, H-18/H2-19, and H2-21/H2-22 were established using the correlation spectroscopy (COSY) spectrum. The heteronuclear multiple bone correlations (HMBCs) from H3-24 (δH 1.38) to C-3 (δC 86.7) and C-23 (δC 182.0) and from H3-25 (δH 1.38) to C-1 (δC 45.1), C-4 (δC 53.2), and C-10 (δC 37.6) revealed a partial structure of ring A in 1. Notable HMBCs between H3-25, C-5, and C-9 (δC 49.7) in conjunction with the 1H–1H COSY correlations unambiguously constructed the partial structure of ring B connecting rings A and B. The long-range heteronuclear couplings from H3-26 to C-7 (δC 33.7), C-8 (δC 41.1), and C-9 (δC 49.7) and from H2-11 to C-9 (δC 49.7), olefinic C-12 (δC 123.7), and C-13 (δC 144.9) indicated the presence of ring C. The connectivity of rings B and C was determined by HMBCs from H3-26 to C-7, C-8, and C-9. Ring D was deduced by HMBCs from H3-27 (δH 1.15) to C-13, C-14 (δC 43.3), and C-15 (δC 29.2), with the correlation spectroscopy (COSY) correlations between H2-15/H2-16, and HMBCs from H3-27 to C-8, C-13, C-14, and C-15 also allowed the connection of ring D with C. The last ring in the aglycone moiety was determined by further HMBC couplings from the tertiary methyl groups H3-29 and H3-30 (δH 0.94 and 0.91) to C-20 (δC 31.7) and from H2-19 (δH 1.73 and 1.16) to C-17 (δC 48.1) and C-18 (δC 2.82). The two carbonyl groups, C-23 (δC 182.0) and C-28 (δC 178.2), were connected to rings A and E, respectively, assigned by HMBCs from H3-24 and H2-22 (δH 1.78 and 1.61), accounting for nine degrees of unsaturation of 1 (Figure 2). As a result, the planar structure of the aglycone in 1 was proposed as a pentacyclic triterpenoid glycoside called medicagenic acid.
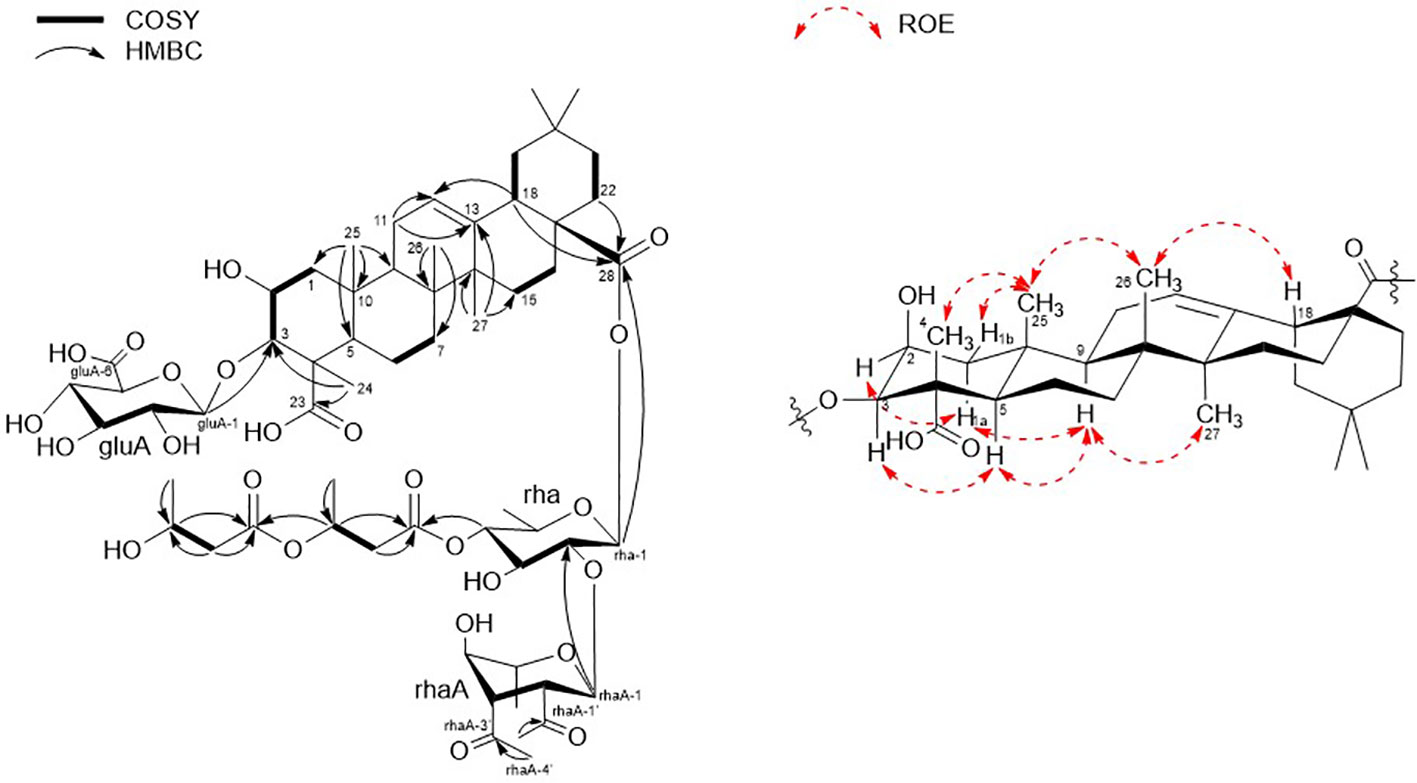
Figure 2 Key COSY, HMBC, and ROESY correlations of 1.
The rotating frame Overhause effect spectroscopy (ROESY) spectrum of 1 allowed us to partially determine the relative configuration. In the ROESY spectrum, the ROE correlations of H-3 with H-5, H-5 with H-9, and H-9 with H3-27 indicated that H-3, H-5, H-9, and H3-27 were in the same orientation. Moreover, based on its ROE correlations of H3-25 with H3-26, H3-26 with H-18, and H3-25 with H3-24 revealed that H-18, H3-24, H3-25, and H3-26 were in the identical orientation. Lastly, the ROE correlations of H-2 with H-1a and H-5 with H-1a were observed while the ROE cross-peak between H3-25 and H-1b was detected on the ROESY data, determining chemical structure of the aglycone in 1 as (2S, 3R, 4S, 5R, 8R, 9R, 10R, 14S, 17S, 18S)-2,3-dihydroxyolean-12-en-23,28-dioic acid or 2β,3β-dihydroxyolean-12-en-23,28-dioic acid (Figure 2).
Two anomeric protons showed large J coupling constants with their neighboring protons (7.5 for H-1gluA δH 4.36, 8.0 for H-1rha δH 5.45), indicating the β-configuration, and one small J coupling constant (2.0 for H-1rhaA δH 5.38), indicating the α-configuration. Presence of one β-d-glucuronic acid (gluA), one β-d-rhamnose (rha), and one acetylated α-l-rhamnose (rhaA) was revealed (Angyal, 1969). 1H and 13C signals belonging to the same sugar units were assigned by analysis of the total correction spectroscopy (TOCSY) and HMBC data. The sequences and attachment of saccharides were determined using HMBC. The HMBC cross-peaks from H-1gluA (δH 4.36) to C-3 (δC 86.7) and from H-1rha (δH 5.45) to C-28 (δC 178.2) indicated that glucuronic acid and rhamnose were connected to C-3 and C-28 of the aglycone, respectively. Similarly, the HMBC correlation H-1rhaA (δH 5.38) and C-2rha (δC 75.4) revealed a linkage between the two sugar units. The glycosyl chain (rha and rhaA) at C-28 of the aglycone consists of rhamnose linked to two 3-hydroxybutyrate (3-HB) units. The HMBC correlations between H-1rha (δH 5.45), C-28 (δC 178.2), H-4rha (δH 5.10), and C-1’ (δC 171.9) revealed a linkage between rha and 3-HB at C-2’. The presence of two 3-HB units was confirmed by the presence of eight additional carbons, two carbonyls, two methines, two methylenes, and one methyl, which showed HMBC correlations between H-3’ (δH 5.31), C-1” (δC 172.6), H-2” (δH 2.42, overlapped), C-1”, H-4’ (δH 1.34), C-3’ (δC 68.9), H-3” (δH 4.14), C-1”, H-4” (δH 1.19) and C-3” (δC 65.7) revealed a relationship of 3-HB.
The hydrolysate of 1 was obtained by performing acid hydrolysis with 6 N HCl in order to determine the absolute configurations of the 3-HB units in 1. The hydrolysate was derivatized with S-PGME and the retention times were compared with the S-PGME derivatives of the authentic standards of S- and R-3-hydroxybutyrate by LC-MS. The S-PGME derivative of hydrolysate of 1 eluted at the identical retention time as S-PGME derivative of the authentic standards of S-3-hydroxybutyrate determining the absolute configuration of the 3-HB units as S form. (Figure S36) Based on the above data, the structure of 1 was determined to be 3-O-β-d-glucuronic acid-(28-O-β-d-rhamnopyranosyl-4-O-(S)-3’-oxopentanyl-(S)-3”-hydroxybutanoate-[O-α-l-(2,3-O-diacetyl)-rhamnopyranosyl-(1→2)]-medicagenic acid (Figures 1 , 2).
Pannoside B (2) was obtained as a white amorphous powder, and its molecular formula was determined to m/z 1335.5984 [M + Na]+ by HR-ESI-MS (calcd. for C64H96O28, 1335.5991). A comparison of the chemical shifts of 1H and 13C NMR data and 2D NMR spectra showed that 2 contains the identical medicagenic acid and sugar units (β-d-glucuronic acid, β-d-rhamnose, and acetylated α-l-rhamnose) as those of 1 with additional 3-hydroxybutyrate (3-HB) (Figures S8–S14). Comparing the 13C NMR spectrum of 2 with that of 1, four additional carbons, one carbonyl, one methine, one methylene, and one methyl, were detected in 2 (Table 2). Additional HMBC correlations between H-3” (δH 5.30) and C-1’” (δC 172.6) revealed the presence of an additional 3-HB. Based on these results, the structure of pannoside B was determined to be 3-O-β-d-glucuronic acid-(28-O-β-d-rhamnopyranosyl-O-4-[(S)-3’-oxo-(((S)-3”-oxopentanyl)oxy)butanyl-(S)-3’”-hydroxybutanoate]-[O-α-l-(2,3-O-diacetyl)-rhamnopyranosyl-(1→2)]-medicagenic acid (Figure 1).
Pannoside C (3) was obtained as a white amorphous powder, and its molecular formula was determined as m/z 1421.6340 [M + Na]+ by HR HR-ESI-MS (calcd. for C68H102O30Na 1421.6359). Comparison of the chemical shifts of 1H and 13C NMR data and 2D NMR spectra showed that 3 contained the same medicagenic acid and sugar units (β-d-glucuronic acid, β-d-rhamnose, and acetylated α-l-rhamnose) as those of 1 and 2, with additional 3-HB units (Figures S15–S21). The presence of four 3-HB units was confirmed by the presence of eight additional carbons, two carbonyls, two methines, two methylene, and one methyl, which showed additional HMBC correlations between H-3’” (δH 5.25), C-1”“ (δC 172.6), H-2”“ (δH 2.41 and 2.44), and C-1”“. Based on these results, the structure of 3 was determined to be 3-O-β-d-glucuronic acid-(28-O-β-d-rhamnopyranosyl-4-O-[(S)-3’-oxo-(((S)-3”-oxo-(((S)-3’”-oxopentanyl)oxy)butanyl)oxy)butanyl-(S)-3”“-hydroxybutanoate]-[O-α-l-(2, 3-O-diacetyl)-rhamnopyranosyl-(1→2)]-medicagenic acid (Figure 1).
Pannoside D (4) was obtained as a white amorphous powder, and its molecular formula was determined as m/z 1119.4947 [M + Na]+ by HR HR-ESI-MS (calcd. for C54H80O23Na 1119.4993). Comparison of the chemical shifts of the 1D and 2D NMR spectra showed that 4 contains the same medicagenic acid and sugar units (β-d-glucuronic acid, β-d-rhamnose, and acetylated α-l-rhamnose) as those of 1, 2, and 3, with no presence of 3-HB (Figures S22–S28). The absence of the 3-HB unit was confirmed by the terminal carbonyl, which showed HMBC correlations between H-4rha (δH 5.09) and C-1’ (δC 172.6) and H-2’ (δH 2.16), C-1’. In addition, six carbonyls supported the structure of pannoside D. Accordingly, pannoside D was assigned as 3-O-β-d-glucuronic acid-28-O-β-d-rhamnopyranosyl-4-O-acetyl-[O-α-l-(2, 3-O-diacetyl)-rhamnopyranosyl-(1→2)]-medicagenic acid (Figure 1).
Pannoside E (5) was obtained as a white amorphous powder, and its molecular formula was determined as m/z 1511.6364 [M + Na]+ by HR HR-ESI-MS (calcd. for C70H104O34Na 1511.6312). A comparison of the chemical shifts of 1H and 13C (DEPT-135) data and 2D NMR spectra showed that 5 contained the same medicagenic acid as those of 1–4, with a modified sugar unit and an additional monosaccharide. Assignments of the four monosaccharides were established using extensive 2D NMR experiments (Figures S29–S35). From the 13C (DEPT-135) NMR data, the four anomeric carbon signals were identified as C-1gluA (δC 104.7), C-1rha (δC 94.9), C-1rhaB (δC 101.4), and C-1xyl (δC 106.9). In addition, the HMBC correlations of H-3xyl (δH 4.86) with C-1’xyl (δC 172.7) and H3-2’xyl (δH 2.14) with C-1’xyl indicated acetylated xylose. Four anomeric protons showed large J coupling constants with their neighboring protons (7.5 for H-1gluA δH 4.37, 8.0 for H-1rha δH 5.40, and 7.5 for H-1xyl δH 4.53), indicating the β-configuration and one small J coupling constant (2.0 for H-1rhaB δH 5.34), indicating the α-configuration. Rhamnose (rhaB) and acetylated xylose (xyl) were different from those of compounds 1, 2, 3, and 4 and were revealed with COSY, HSQC, and HMBC. With the above data, the presence of one β-d-glucuronic acid (gluA), β-d-rhamnose (rha), α-l-rhamnose (rhaB), and one acetylated β-d-xylose (xyl) was revealed. The attachment sequences of the saccharides were determined using HMBC. The HMBC cross-peaks from H-1gluA (δH 4.37) to C-3 (δC 86.9) and from H-1rha (δH 5.45) to C-28 (δC 178.0) indicated that gluA and rha were connected to C-3 and C-28 of the aglycone, respectively. In addition, the HMBC correlations of H-2rha (δH 3.76), C-1rhaB (δC 101.4), H-4rhaB (δH 3.52), and C-1xyl (δC 106.9) revealed the linkage of three sugar units, rha-rhaB-xyl. The structure of pannoside E was determined as 3-O-β-d-glucuronic acid-(28-O-β-d-rhamnopyranosyl-4- O-[(S)-3’-oxo-(((S)-3”-oxo-(((S)-3’”-oxopentanyl)oxy)butanyl)oxy)butanyl-(S)-3”“-hydroxybutanoate]-[O-α-l-rhamnopyranosyl-(1→2)-[O-β-d-(3-O-acetyl)-xylopyranosyl-(1→4)]-medicagenic acid (Figure 1).
3.2 Analyses of metabolites from T. pannonicum
The existence of a broad range of probable yet undiscovered pannoside congeners prompted this study, we used a standardized HRMS2 analysis approach to determine their abundance by using the GNPS platform. HRMS2-based metabolomic analysis of the methanol crude extract of T. pannonicum and GNPS-based visualization of MS2-data were performed according to a standardized procedure. The GNPS analysis identified 36 clusters and 1,709 nodes from the crude methanol extract of T. pannonicum. Each node represents an individual metabolite of T. pannonicum extracts detected from QTOF-MS and the nodes with the similar tandem mass patterns created the cluster. The GNPS networks were evaluated for molecular ion peaks of compounds 1–5 and potential structural congeners with different sugar and/or 3-HB residue lengths. The new terpenoid saponins (1–4) formed a large cluster (Figure 3), which revealed structural similarities between the compounds, including m/z 1244.6 [M + NH4]+ (1), 1330.6 [M + NH4]+ (2), 1416.6 [M + NH4]+ (3), and 1114.5 [M + NH4]+ (4), with the exception of 5 (m/z 1506.6 [M + NH4]+). The detected m/z subnetwork associated with compounds 1–4 had 21 connected nodes with molecular ion peaks that were partially ascribed to congeners with additional sugar moieties or modified sugars (m/z 1230.5, 1260.5, 1346.5, 1374.5, 1388.5, 1390.5, 1420.5, 1432.5, 1436.5, 1458.5, 1466.5, 1474.5, 1480.5, 1518.5, and 1522.5 [M + NH4]+), and derivatives with different 3-HB residue lengths (m/z 1158.5, 1244.5, 1330.5, 1416.5, and 1502.5 [M + NH4]+). Pannoside E, as revealed by structural analysis, differed somewhat in structure from the other compounds in the cluster owing to the presence of an extra sugar. The GNPS results show that metabolites of T. pannonicum are classified into several classes and the biggest cluster was triterterpenoid saponins cluster. All 21 congeners in the cluster with structural resemblance to pannosides A–D (1–4) are expected to have the same aglycone moiety, but given that they are so few in quantity, new derivatives will be identified by additional separation in the future.
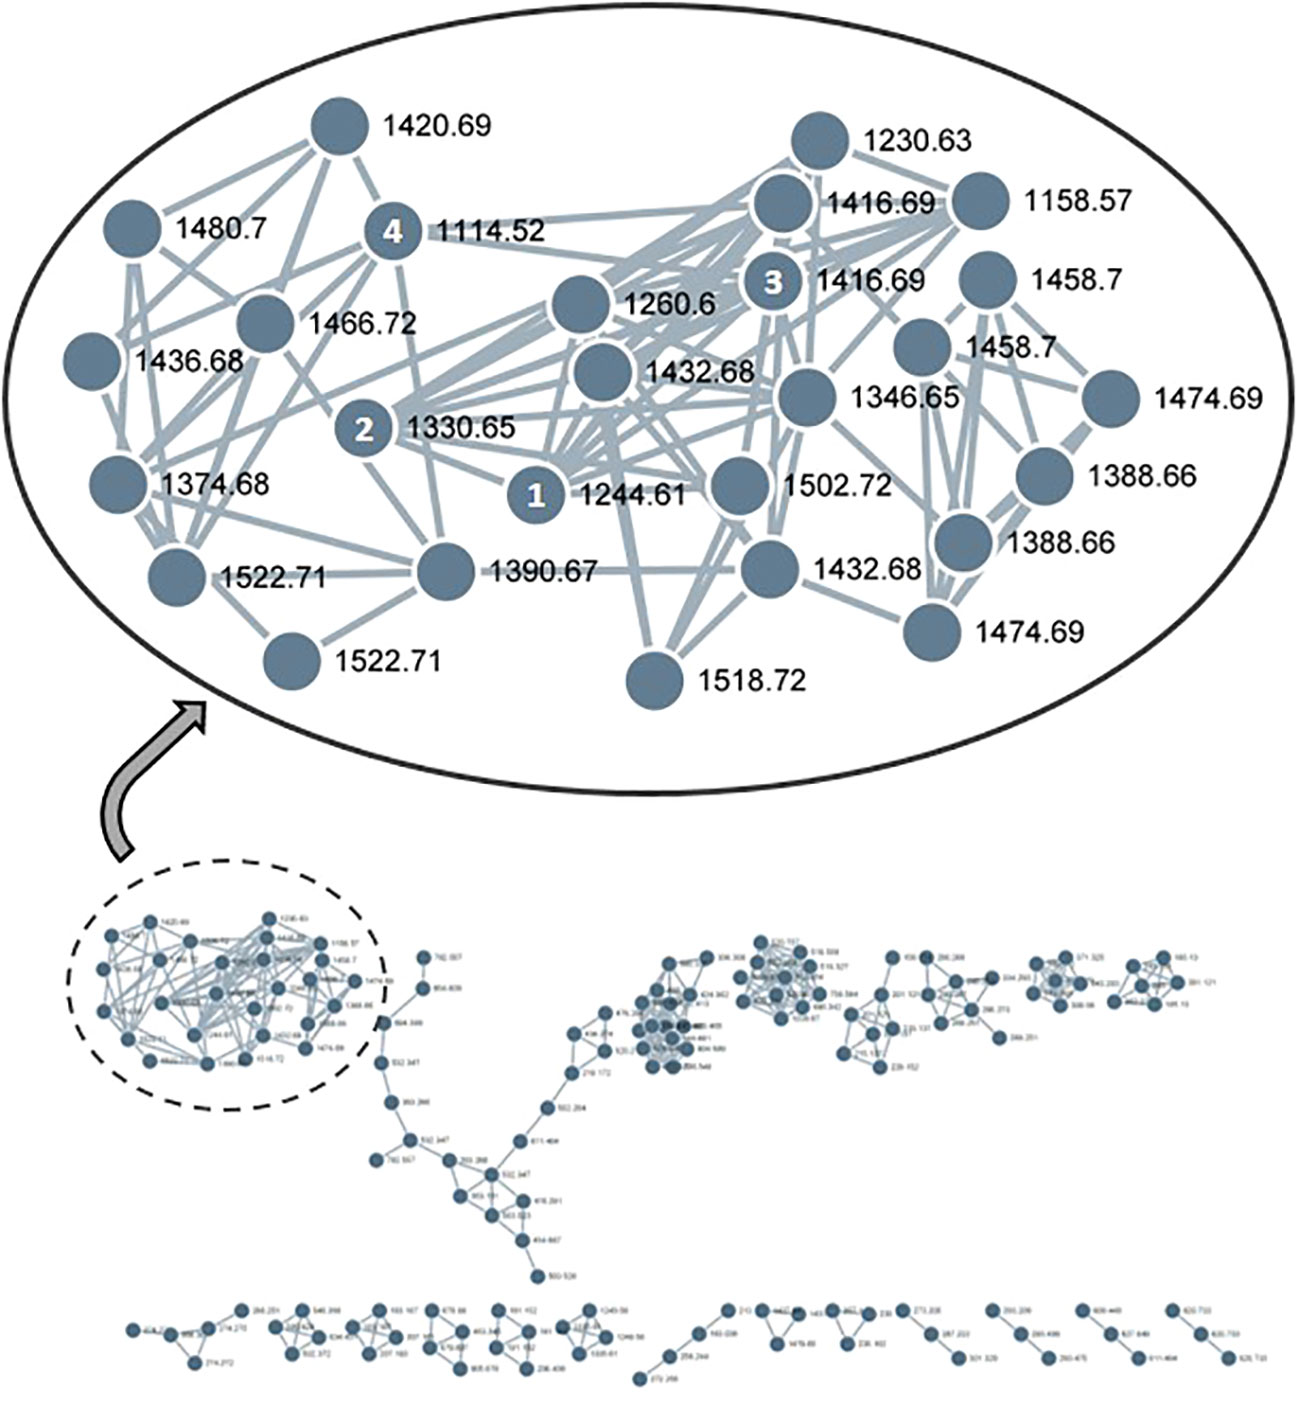
Figure 3 GNPS-cluster assigned to pannoside analogs from methanol extract of Tripolium pannonicum. 21 nodes composed the cluster, excepting overlaps. Numbers on nodes mean compounds 1–4. 1, pannoside A (m/z 1244.6 [M + NH4]+); 2, pannoside B (m/z 1330.6 [M + NH4]+); 3, pannoside C (m/z 1416.6 [M + NH4]+); 4, pannoside D (m/z 1114.5 [M + NH4]+).
3.3 Effect of pannosides A–E (1–5) on cell viability of HT29, PC3, and PC9 cells
To investigate the cytotoxic effects of pannosides A–E, we observed the effects of compounds 1–5 on cell viability in HT29 colorectal adenocarcinoma, PC3 prostate carcinoma, and PC9 non-small cell lung carcinoma cell lines (Table 4). Pannoside E (5) significantly decreased cell viability of HT29, PC3, and PC9 cells in a dose-dependent manner, and particularly potently reduced cell viability of PC3 and PC9 cells with IC50 values of 0.34 and 0.89 μM, respectively (Figure 4).
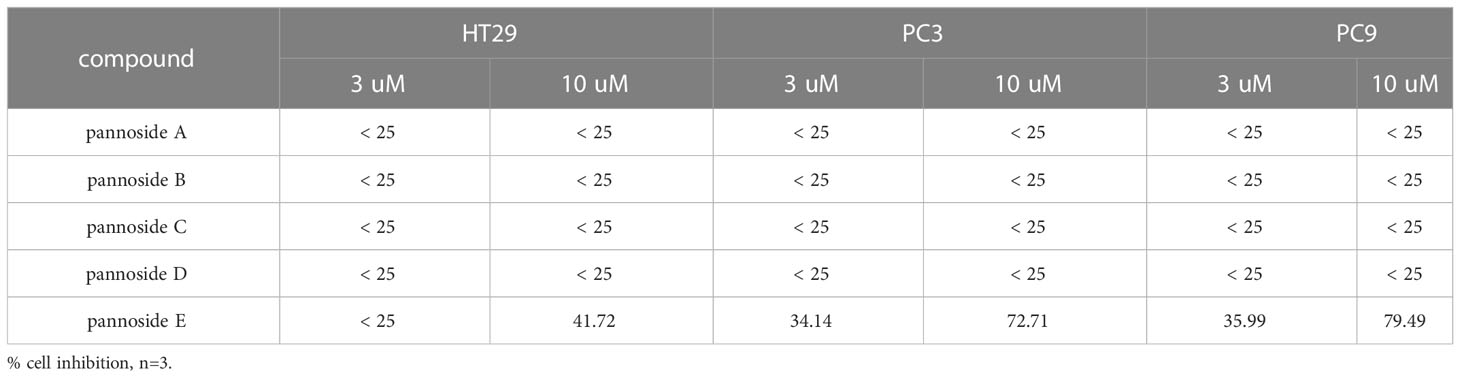
Table 4 Effect of pannosides A–E on cell viability in HT29, PC3, PC9 cells.
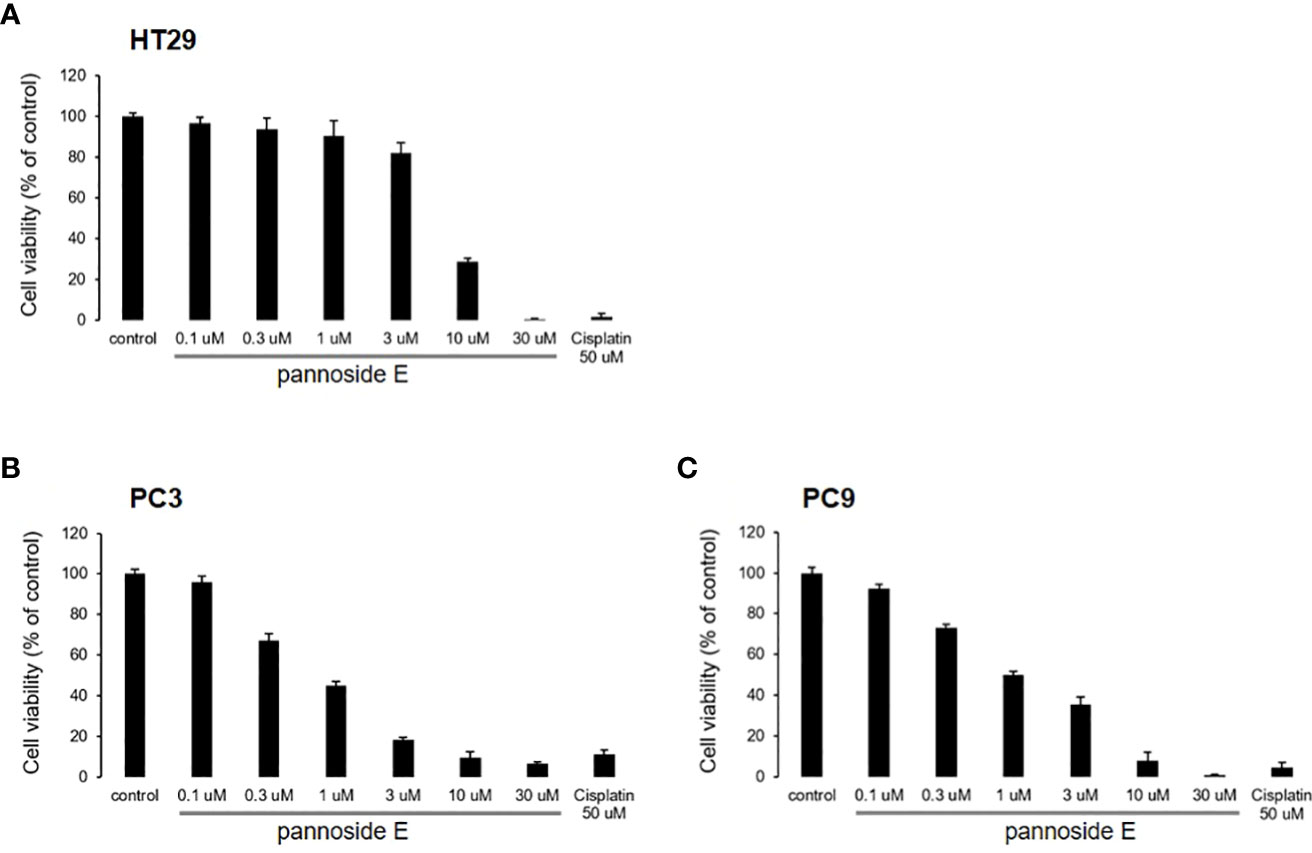
Figure 4 Effect of pannosides E on cell viability in HT29, PC3, PC9 cells. (A–C) HT29, PC3, PC9 cells were cultured with pannoside E for 72h. Cell viability was measured by absorbance at 490 nm (mean ± S.D., n = 6).
4 Conclusion
T. pannonicum, often known as sea aster or seashore aster, is a flowering plant that is native to Eurasia and northern Africa. Typically, the plant thrives on saline soils, including salt marshes, salt meadows, and other regions with high salt concentrations (Caçador et al., 2016). It has been studied primarily from an ecological or nutritional perspective (Szymańska et al., 2015; Turcios et al., 2021; ) but rarely has research been undertaken on a single chemical compound; nevertheless, compounds such as quercetin, luteolin, apigenin, and caffeoylquinic acid have been reported (Wubshet et al., 2013). In our ongoing halophyte metabolite screening study, previously unknown saponins, pannoside A-E (1–5), were isolated from the whole plant of T. pannonicum, which are the first saponin compounds isolated from the plant.
Based on 1/2D NMR spectroscopy and HRMS data, the compounds were determined as pentacyclic triterpenoid saponins bearing medicagenic acid, an acetyl-incorporated 6/6/6/6/6 pentacyclic carbon scaffold, with unusual hydroxybutyrate residues. With rigorous examination of ROESY correlations, the relative configurations of the aglycone of 1–5 were identified as 2β,3β-dihydroxyolean-12-en-23,28-dioic acid. The configuration of the sugar moieties was determined by J-based configuration analysis. Furthermore, because both the S- and R-forms of 3-hydroxybutyrate elute at the same time on LC-MS analysis, determining the absolute configuration of 3-hydroxybutyrate has hitherto been ignored among medicagenic acid containing triterpenoid saponins to the best of our knowledge (Mabou et al., 2014; Mabou et al., 2015). After acid hydrolysis of 1, we used the PGME derivatization method to chromatographically assign the absolute configuration of the S- and R-PGME adducts of 3-hydroxybutyrate by LC-MS analysis for the first time. Pannoside E (5) significantly reduced the viability of PC3 prostate cancer and PC9 lung cancer cells in terms of biological activity.
In traditional medicine, the extracts of halophytes are used, either directly or indirectly, in the treatment of a wide range of diseases that are associated with the digestive system, the respiratory system, the skin, rheumatism, and the urinary system. Meanwhile, halophytes are utilized in modern medicine to examine the roles of antioxidants, antitumor agents, anticancer agents, and antibacterial compounds (Grigore, 2021). However, secondary metabolites in halophytes with complex carbon structures are rarely discovered, and there are relatively few reports on new compounds recently. Our findings indicate that new compounds can be discovered by conducting ongoing research on the secondary metabolites of halophytes, which have received less attention than medicinal plants. In the same vein, we will further isolate minor derivatives of pannosides from T. pannonicum and continue to study their biological activity effects in the future.
Data availability statement
The original contributions presented in the study are included in the article/Supplementary Material. Further inquiries can be directed to the corresponding author.
Author contributions
SU and SK conceptualized this study. SU collected the plant material and metabolomic analysis. JL extracted the plant and analyzed the data. SU and JL purified and identified compounds by NMR spectroscopic data. SU, JL, YL, WN, and SK wrote and edited the text. SU and JL contributed equally to this work. All authors contributed to the article and approved the submitted version.
Acknowledgments
We acknowledge financial support from the National Research Foundation of Korea (NRF-2018R1A6A1A03023718 and NRF-2020R1A2C1012632), funded by the Ministry of Education, Science and Technology, Republic of Korea.
Conflict of interest
The authors declare that the research was conducted in the absence of any commercial or financial relationships that could be construed as a potential conflict of interest.
Publisher’s note
All claims expressed in this article are solely those of the authors and do not necessarily represent those of their affiliated organizations, or those of the publisher, the editors and the reviewers. Any product that may be evaluated in this article, or claim that may be made by its manufacturer, is not guaranteed or endorsed by the publisher.
Supplementary material
The Supplementary Material for this article can be found online at: https://www.frontiersin.org/articles/10.3389/fmars.2023.1117407/full#supplementary-material
References
Angyal S. J. (1969). The composition and conformation of sugars in solution. Angew. Chem. Int. Ed. 8, 157–166. doi: 10.1002/anie.196901571
Augustin J. M., Kuzina V., Andersen S. B., Bak S. (2011). Molecular activities, biosynthesis and evolution of triterpenoid saponins. Phytochemistry 72, 435–457. doi: 10.1016/j.phytochem.2011.01.015
Balke T., Hherman P. M. J., Bouma T. J. (2014). Critical transitions in disturbance-driven ecosystems: identifying windows of opportunity for recovery. J. Ecol. 102, 700–708. doi: 10.1111/1365-2745.12241
Baptist M. J., Dankers P., Cleveringa J., Sittoni L., Willemsen P. W. J. M., van Puijenbroek M. E. B., et al. (2021). Salt marsh construction as a nature-based solution in an estuarine social-ecological system. Nature-Based Solutions 1, 100005. doi: 10.1016/j.nbsj.2021.100005
Bouma T. J., van Belzen J., Balke J., van Dalen J., Klaassen P., Hartog D. P., et al. (2016). Short-term mudflat dynamics drive long-term cyclic salt marsh dynamics. Limnol. Oceanogr. 61, 2261–2275. doi: 10.1002/lno.10374
Caçador I., Duarte B., Marques J. C., Sleimi N. (2016). “6 - carbon mitigation: a salt marsh ecosystem service in times of change,” in Halophytes for food security in dry lands (San Diego: Academic Press).
Dyer K. R., Christie M. C., Wright E. W. (2000). The classification of intertidal mudflats. Cont. Shelf Res. 20, 1039–1060. doi: 10.1016/S0278-4343(00)00011-X
Feagin R. A., Lozada-Bernard S. M., Ravens T. M., Möller I., Yeager K. M., Baird A. H., et al. (2009). Does vegetation prevent wave erosion of salt marsh edges? Proc. Natl. Acad. Sci. U.S.A. 106, 10109–10113. doi: 10.1073/pnas.0901297106
Georgian D., Ramadoss N., Dona C., Basu C. (2019). Therapeutic and medicinal uses of yerpenes. Medicinal Plants: From Farm to Pharm., 333–359. doi: 10.1007/978-3-030-31269-5_15
Grigore M.-N. (2021). Handbook of halophytes: From molecules to ecosystems towards biosaline agriculture (Springer) 3, 2279–2302.
Hall S. J., Melanie J. C. H. (1997). Physical disturbance and marine benthic communities: The effects of mechanical harvesting of cockles on non-target benthic infauna. J. Appl. Ecol. 34, 497–517. doi: 10.2307/2404893
Hussain M., Debnath B., Qasim M., Bamisile B. S., Islam W., Hameed M. S., et al. (2019). Role of aaponins in plant defense against specialist herbivores. Molecules 24, 2067. doi: 10.3390/molecules24112067
Kumar S., Saini R., Suthar P., Kumar V., Sharma R. (2022). Plant secondary metabolites: Their food and therapeutic importance. Plant Secondary Metabolites Springer. doi: 10.1007/978-981-16-4779-6_12
Lefeuvre J.-C., Bouchard V., Feunteun E., Grare S., Laffaille P. (2000). European Salt marshes diversity and functioning: The case study of the mont saint-Michel bay, France. Wetl. Ecol. Manage. 8, 147–161. doi: 10.1023/A:1008440401950
Liu Y., Li M., Mao L., Cheng L., Ki F. (201311). Toward a method of constructing tidal flat digital elevation models with MODIS and medium-resolution satellite images. J. Coast. Res. 29, 438–448. doi: 10.2112/JCOASTRES-D-12-00088.1
Mabou F. D., Ngnokam D., Harakat. D., Voutquenne-nazabadioko L. (2015). New oleanane-type saponins: Leptocarposide b-d, from Ludwigia leptocarpa (Onagraceae). Phytochem. Lett. 14, 159–164. doi: 10.1016/j.phytol.2015.10.008
Mabou F. D., Tebou P. L., Ngnokam D., Harakat D., Voutquenne-Nazabadioko L. (2014). Leptocarposide: a new triterpenoid glycoside from ludwigia leptocarpa (Onagraceae). Magn. Reson. Chem. 52, 32–36. doi: 10.1002/mrc.4023
Möller I., Kudella M., Rupprecht F., Spencer T., Paul M., van Wesenbeeck B. K., et al. (2014). Wave attenuation over coastal salt marshes under storm surge conditions. Nat. Geosci. 7, 727–731. doi: 10.1038/ngeo2251
Nothias L. F., Petras D., Schmid R., Dührkop K., Rainer J., Sarvepalli A., et al. (2020). Feature-based molecular networking in the GNPS analysis environment. Nat. Methods 17, 905–908. doi: 10.1038/s41592-020-0933-6
Ochatt S., Alan A. R., Bhattacharya A., Hano C., Kiselev K. V., Marconi P. L., et al. (2022). Secondary metabolites: A boon from plants, the best chemist in nature: preface from the editors. Plant Cell Tiss. Organ Cult. 149, 1–6. doi: 10.1007/s11240-022-02289-2
Shannon P., Markiel A., Ozier O., Baliga N. S., Wang J. T., Ramage D., et al. (2003). Cytoscape: a software environment for integrated models of biomolecular interaction networks. Genome Res. 13, 2498–2504. doi: 10.1101/gr.1239303
Simões M. P., Calado M. L., Madeira M., Gazarini L. C. (2011). Decomposition and nutrient release in halophytes of a Mediterranean salt marsh. Aquat. Bot. 94, 119–126. doi: 10.1016/j.aquabot.2011.01.001
Szymańska S., Płociniczak T., Piotrowska-Seget Z., Złoch M., Ruppel S. (2015). Metabolic potential and community structure of endophytic and rhizosphere bacteria associated with the roots of the halophyte Aster tripolium l. Microbiology 182, 68–79. doi: 10.1016/j.micres.2015.09.007
Turcios A. E., Cayenne A., Uellendahl H., Papenbrock J. (2021). Halophyte plants and their residues as feedstock for biogas production–chances and challenges. Appl. Sci. 11, 2746. doi: 10.3390/app11062746
Vinutha T., Bansal N., Kumari K., Prashat G. R., Sreevathasa R., Krishnan V., et al. (2017). Comparative analysis of tocopherol biosynthesis genes and its transcriptional regulation in soybean seeds. J. Agric. Food Chem. 65, 11054–11064. doi: 10.1021/acs.jafc.7b03448
Wang M., Carver J. J., Phelan V. V., Sanchez L. M., Garg N., Peng Y., et al. (2016). Sharing and community curation of mass spectrometry data with global natural products social molecular networking. Nat. Biotechnol. 34, 828–837. doi: 10.1038/nbt.3597
Wubshet S. G., Schmidt J. S., Wiese S., Staerk D. (2013). High-resolution screening combined with HPLC-HRMS-SPE-NMR for identification of potential health-promoting constituents in Sea aster and searocket–new Nordic food ingredients. J. Agric. Food Chem. 61, 8616–8623. doi: 10.1021/jf402949y
Keywords: Tripolium pannonicum, halophyte, pentacyclic triterpenoids, saponins, cytotoxicity
Citation: Um S, Lee J, Lee Y, Namkung W and Kim SH (2023) Pentacyclic triterpenoids saponins pannosides A-E from Tripolium pannonicum. Front. Mar. Sci. 10:1117407. doi: 10.3389/fmars.2023.1117407
Received: 06 December 2022; Accepted: 01 February 2023;
Published: 16 February 2023.
Edited by:
Hui Cui, Guangzhou University of Chinese Medicine, ChinaReviewed by:
Qinglian Li, South China Sea Institute of Oceanology, CAS, ChinaValeria Costantino, University of Naples Federico II, Italy
Copyright © 2023 Um, Lee, Lee, Namkung and Kim. This is an open-access article distributed under the terms of the Creative Commons Attribution License (CC BY). The use, distribution or reproduction in other forums is permitted, provided the original author(s) and the copyright owner(s) are credited and that the original publication in this journal is cited, in accordance with accepted academic practice. No use, distribution or reproduction is permitted which does not comply with these terms.
*Correspondence: Seung Hyun Kim, a2ltc2gxMUB5b25zZWkuYWMua3I=
†These authors have contributed equally to this work and share first authorship