 Catarina V. Guerreiro1,2,3*
 Afonso Ferreira1
 Lluisa Cros4
 Jan-Berend Stuut5,6
 Alex Baker7Andreia Tracana1
 Catarina Pinto1,2
 Vera Veloso1
 Andrew P. Rees8
 Mário A. P. Cachão9Telmo Nunes3
 Vanda Brotas1,3
- 1Marine and Environmental Science Centre (MARE)/Aquatic Research Network (ARNET), Faculdade de Ciências, Universidade de Lisboa, Lisbon, Portugal
- 2Instituto Dom Luiz (IDL), Faculdade de Ciências, Universidade de Lisboa, Lisbon, Portugal
- 3Department of Plant Biology, Faculty of Sciences of the University of Lisbon, Lisbon, Portugal
- 4Institut de Ciencies del Mar (CSIC), Passeig Marítim de la Barceloneta, Barcelona, Spain
- 5Department of Ocean Systems, NIOZ Royal Netherlands Institute for Sea Research, Texel, Den Burg, Netherlands
- 6Faculty of Earth and Life Sciences, Vrije Universiteit (VU), Amsterdam, Netherlands
- 7School of Environmental Sciences, University of East Anglia, Norwich, United Kingdom
- 8Plymouth Marine Laboratory (PML), Plymouth, United Kingdom
- 9Departament of Geology, Faculty of Sciences of the University of Lisbon, Lisbon, Portugal
Changes in coccolithophore productivity in response to climate-driven ocean warming are likely to have cascading biogeochemical effects that feed back to the changing climate. This paper investigates the role (and interplay) of large-scale oceanographic and atmospheric processes across the North- and Equatorial Atlantic, including Saharan dust deposition, on the distribution of coccolithophore communities. The study is based on biological and hydrological data collected across the photic zone of the ocean, and aerosol data collected from the lower atmosphere, across 50°N–1°S during the Atlantic Meridional Transect in boreal Autumn of 2018 (AMT28), in synergy with Earth Observations. Results confirm existing understanding of the distribution of coccolithophore communities which are related to major meridional hydrological gradients across the North Atlantic. Dynamic, oxygenated and microphytoplankton-enriched waters at higher-latitudes were characterized by less diverse coccolithophore populations, dominated by placolith-bearing r-selected coccolithophores. In contrast, the heavily stratified and picoplankton-enriched waters of the subtropical gyre revealed more diverse populations, dominated by umbelliform coccolithophores and holococcolithophores at the surface, and by floriform taxa in the lower photic zone. Mean concentrations of 14.4×10³ cells/L present in the North Atlantic Tropical Gyre Province (30–12°N), only slightly lower compared to 17.7×10³ cells/L produced in the North Atlantic Drift province (50–40°N), provide a snapshot perspective on the importance of coccolithophore production in heavily stratified gyre conditions. Higher concentrations of 19’-Hexanoyloxyfucoxanthin (HexFuco) in regions of enhanced production of r-selected placolith-bearing species suggest that this pigment should not be generalized as a proxy for the entire coccolithophore community. Enhanced abundances of fast-blooming Emiliania huxleyi and Gephyrocapsa oceanica, and of cyanobacteria (including both picoplankton and N2-fixing Trichodesmium spp.) at the surface of the region of more persistent Saharan dust deposition (at ~12-10°N) appeared to result from dust-born nutrient input. Underneath this stratified surface layer, enhanced productivity in the deep chlorophyll maximum (DCM) appeared decoupled from that on the surface, fueled by geostrophic eastward shoaling of the nutricline across the tropical North Atlantic. As this was the region of highest macronutrient concentrations measured along and below the nutricline, our data suggest that the NE tropical Atlantic may act as a permanent dust-born nutrient depocenter as previously hypothesized.
1 Introduction
Ongoing climate warming is likely to hamper the efficiency of the biological carbon pump through altering the latitudinal distribution of temperature, light, and nutrient concentrations in the upper ocean, all synergistically interplaying to modulate the productivity and composition of phytoplankton communities (e.g., Laufkötter et al., 2015). According to the most recent IPCC report (2021), enhanced ocean warming and high latitude freshening over the last decades have weakened the overturning of surface ocean waters, which has inevitable consequences for nutrient cycling in the open ocean and associated primary production. Several studies report a decrease of global phytoplankton productivity over the past century due to reduced nutrient availability driven by increasing thermal stratification (e.g., Behrenfeld et al., 2006; Polovina et al., 2008; Boyce et al., 2010; Krumhardt et al., 2017; Moore et al., 2018). This overall warming-driven decrease in global primary production has been projected to continue over the mid-21st century, particularly in tropical and subtropical regions, and in most of the Atlantic (Krumhardt et al. (2017). While some studies suggest that phytoplankton communities can adapt physiologically and evolutionarily to climate change (Irwin et al., 2015), others indicate a sharp decline in tropical phytoplankton diversity and a poleward shift in species’ thermal niches (e.g., Thomas et al., 2012). This includes an abundance increase and northward expansion of small-sized phytoplankton species (e.g., Dutkiewicz et al., 2013), including N2-fixing diazotrophic cyanobacteria (Krumhardt et al., 2016; Krumhardt et al., 2017) and calcifying nanoplankton (Winter et al., 2013; Rivero-Calle et al., 2015; Oziel et al., 2020), possibly reflecting their capacity to thrive at low nutrient levels compared to microphytoplankton, e.g., diatoms (e.g., Boyd et al., 2010; Lancelot, 2012; Krumhardt et al., 2017).
A mechanism that has been hypothesized to counteract the negative effects from ocean stratification is the deposition of atmospheric nutrients by dust outbreaks triggered by ongoing climate-induced land desertification (Moulin and Chiapello, 2006; Mirzabaev et al., 2019) and biomass burning (Turco et al., 2019; Ruffault et al., 2020; Ito et al., 2021). In fact, mineral dust is considered the dominant source of Fe and other trace metals to the global ocean (e.g., Martin, 1990; Coale et al., 1996; Boyd et al., 2007; Baker et al., 2013). This matters because dissolved (bioavailable) Fe is often only present at trace concentrations in oxygenated open ocean surface waters (e.g., Ussher et al., 2013), thereby limiting primary production in up to 30–40% of the global ocean (Moore et al., 2002; Boyd and Ellwood, 2010). Guieu et al. (2014) report the importance of strong and short-term (pulse-like) dust-born nutrient deposition events for marine productivity at High Nutrient Low Chlorophyll regions, up to one order of magnitude larger than vertical supply from the sub-surface in oligotrophic regions. In addition, dust also acts as mineral ballast to increase the sinking velocities of carbon-enriched marine snow aggregates, critical for the export and sequestration of particulate organic carbon (POC) produced by phyto- and zooplankton (van der Jagt et al., 2018).
Of all the continental deserts, the Sahara Desert is the world’s largest source of atmospheric soil dust (Figure 1). Megatons of Saharan-dust blown into and over the Atlantic every year are thought to supply macronutrients and trace metals for marine phytoplankton in the tropical North Atlantic (Goudie and Middleton, 2001; Jickells et al., 2005). Being adjacent to NW Africa, a region affected by ongoing desertification (Mirzabaev et al., 2019), the North Atlantic provides a unique opportunity to investigate the effects of Saharan dust outbreaks on ocean productivity and biogeochemistry. This process is likely to be especially important for organisms living in the subtropical gyre and in the tropical region outside the equatorial upwelling, where nearly permanently stratified Low Nutrient Low Chlorophyll waters result in low productivity during most of the year (see Mann and Lazier, 2006; Moore et al., 2018). Fixed nitrogen in the remote open North Atlantic is largely delivered by in situ diazotrophic N2-fixation (Mahaffey et al., 2014). This process is co-limited by Fe and P (Mills et al., 2004), with these limitations being partially alleviated by the deposition of atmospherically processed African dust (e.g., Baker et al., 2006; Buck et al., 2010). In turn, dust-stimulated N2-fixation may fuel up to 50% of the export production (Mills et al., 2004 and refs. therein) through promoting the growth of other phytoplankton groups for which N2-limitation is relieved by diazotrophic N2-release (Moore et al., 2002; Pabortsava et al., 2017). This is the case for Trichodesmium spp. which are reportedly most abundant in areas of higher Saharan dust input (Mills et al., 2004 and refs. therein; Pabortsava et al., 2017; Shelley et al., 2017). However, little is known about the effects of Saharan dust on other major phytoplankton groups.
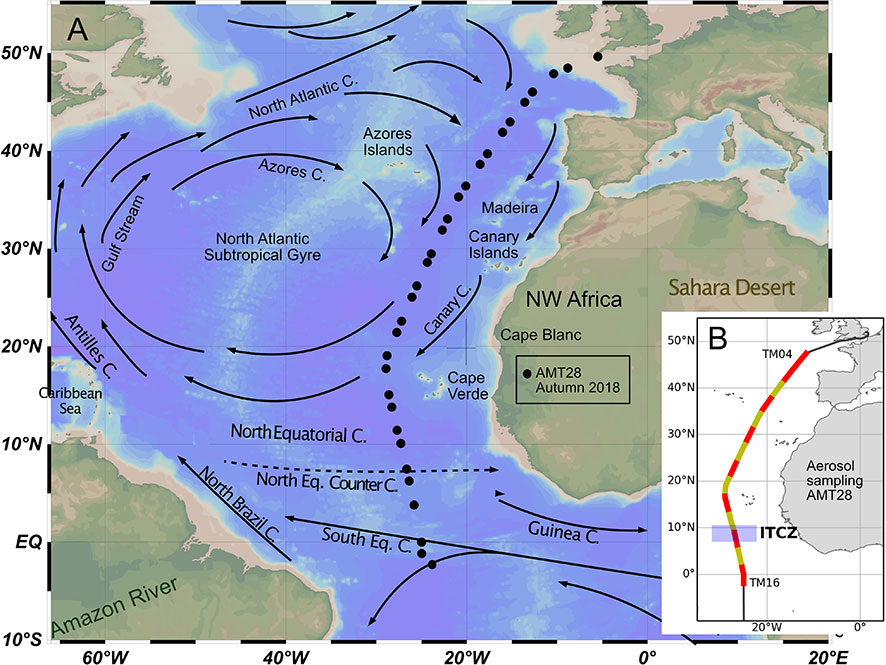
Figure 1 Location of the CTD sampling stations across the North- and equatorial Atlantic, collected during AMT28, and a schematic representation of the main surface currents in the region (A); location of aerosol sampling and approximate position of the ITCZ during the expedition (B).
Among the main groups of marine phytoplankton, coccolithophores are the main primary producers able to biomineralize calcite platelets (coccoliths) around their cell surface to form an exoskeleton (coccosphere) (Pienaar, 1994; Monteiro et al., 2016) through a biogeochemical process that incorporates carbon in calcite and releases CO2 into the environment (Rost and Riebesell, 2004). This means that coccolithophores influence the carbon cycle both via photosynthesis (while producing POC – CO2 sink); via calcification (while producing particulate inorganic carbon, PIC – CO2 source); and via carbon-burial in oceanic sediments through coccolith-ballasting POC (Rost and Riebesell, 2004; Ziveri et al., 2007; Guerreiro et al., 2021). Hence, coccolithophores contribute crucially to modulate biogenic PIC/POC export from the surface down to the deep ocean (also termed “rain ratio”), which is largely what determines the efficiency of the biological carbon pump in sequestering atmospheric CO2 (Rost and Riebesell, 2004; Cermeño et al., 2008).
As a group, coccolithophores are more diverse and contribute higher percentages to the phytoplankton community in open-ocean, stratified oligotrophic waters from low- to mid-latitude regions (e.g., Winter et al., 1994), hence displaying features more typical of K-selected taxa (Margalef, 1978), compared to eutrophic environments (e.g., coastal-neritic and upwelling waters) where they are less diverse and surpassed by more opportunistic groups (r-selected taxa, Margalef, 1978), e.g., diatoms. Still, the group also includes more opportunistic species that quickly respond to short-term change, able to produce massive blooms in the open-ocean (e.g., Knappertsbusch and Brummer, 1995; Souza et al., 2011) and within coastal and upwelled waters (e.g., Baumann et al., 2000; Guerreiro et al., 2013) that are often optically reflective enough and close enough to the ocean’s surface to be detected by remote sensing (e.g., Balch, 2018).
Despite their lower nutrient requirements compared to, for instance, diatoms (e.g., Margalef, 1978; Boyd et al., 2010), coccolithophores are also susceptible to ocean nutrient depletion. Their limitation to Fe and Zn has been evidenced from incubation experiments suggesting that changes in dust deposition may affect their calcification in regions marked by trace-metal limitation (Schulz et al., 2004), and result in higher coccolithophore-based biomass and carbonate production (Crawford et al., 2003). Recent work based on coccolith species fluxes from four sediment-trap time-series across the tropical North Atlantic report evidence supporting the hypothesis of Saharan dust acting as a fertilizer for marine phytoplankton, including opportunistic coccolithophore species (Guerreiro et al., 2017; Guerreiro et al., 2019). A striking flux increase of POC and of coccolith fluxes by fast-blooming surface-dwelling species E. huxleyi and G. oceanica during times of enhanced dust deposition and Amazon water dispersal was seen promoting a more efficient coccolith-ballasting and resulting in lower rain ratios (Korte et al., 2020; Guerreiro et al., 2021). Whether these species have grown by directly consuming nutrients supplied by dust, or indirectly by consuming N2 released from dust-stimulated N2-fixation, and whether these events mostly reflected an ecological response and/or a higher export efficiency due to dust- and coccolith-ballasting (see Pabortsava et al., 2017), remain as open questions.
To tackle these issues, we have investigated links between biological, oceanographic, and atmospheric processes influencing coccolithophore communities across the entire North- and Equatorial Atlantic, including Saharan dust deposition. The study is based on multidisciplinary in situ data collected during the Atlantic Meridional Transect (AMT28 – Figure 1), in synergy with a range of satellite and modelled data and contributes to distinguishing the effects of distinct drivers of coccolithophore productivity in the North Atlantic. Our goal is to provide robust baseline information of modern ecological analogues to inform how oceanographic processes and dust deposition will impact ocean productivity in a future ocean.
2 Regional settings
2.1 Water masses
Water masses of the uppermost 500 m in the temperate and subtropical regions of our study area (50°–20°N, sites 1–19), mostly consist of Eastern North Atlantic Central Water (ENACW) marked by large temperature (T) and salinity (S) ranges (T: 8–18 °C; S: 35.2–36.7) and low nutrient concentrations (Emery, 2001; Liu and Tanhua, 2021), formed in the inter-gyre region at latitudes between 39–48° N during the winter subduction (Pollard et al., 1996). To the south of 20° N (sites 20–31), the uppermost 100 m mostly consist of salty and nutrient-depleted Tropical Surface Water (TSW) (T: ~27°C, S: 36.7–37) above the cooler, less salty and relatively nutrient-enriched South Atlantic Central Water (SACW) at depths down to ~500 m (T: 6.0–18°C, S: 34.3–35.8) (Emery and Meincke, 1986; Reid, 1994; Stramma and England, 1999). Within the eastern tropical North Atlantic, SACW waters are found at < 100 m, shallow enough to reach the ephotic zone through the action of the surface winds, and with substantial contributions of the saltier and warmer ENACW in its lower part (300–550 m) (Pelegrí et al., 2017).
2.2 Surface circulation and biogeographic provinces
Surface water circulation in the study area, involving ENACW along 50–20°N, and TSW and SACW along 20°N–1°S, is mostly forced by the overlying anticyclonic wind system that occurs north of the Equator (~45–15°N), driving a clockwise circular ocean current system across the entire North Atlantic, termed North Atlantic Subtropical Gyre (Figure 1). On the west, the gyre is bounded by the strong and narrow northward-flowing Gulf Stream, which bifurcates over the Newfoundland Basin to feed into the northeastward flowing North Atlantic Current (NAC, at ~45–40°N), and into the southeastward-flowing Azores Current (AzC, at 36–33°N) directly into the gyral circulation. Part of the NAC recirculates into the gyre when encountering the European continental shelf, feeding into the broader and slower Portugal/Canary Current continuum that flows southwards along the Iberian Peninsula and NW coast of Africa. At ~21°N, the Canary Current detaches from the continental shelf and starts flowing westwards, feeding into the westward-flowing North Equatorial Current (NEC) which, in turn, connects back to the Gulf Stream through the northwestward-flowing Antilles Current (Aiken et al., 2017 and refs. therein) (Figure 1).
Such wind-forced gyral circulation has direct effects on the mixed layer depth (MLD) dynamics and, subsequently, on the biogeographic distribution of phytoplankton communities. According to Longhurst (2007), our meridional transect crosses two important circulation-driven biomes: the North Atlantic Westerly Wind Biome (60–30°N), where the MLD is markedly modulated by seasonal variations in westerly wind stress and solar insolation; and the Trade Wind Biome (30°N–5°S) where the MLD is much less seasonal, modulated by variations in the magnitude and latitudinal position of the trade winds.
Each of the two biomes are divided in two biogeographic provinces, reflecting smaller-scale variations in terms of MLD dynamics, ocean temperature and nutrient availability (Longhurst, 2007). The Westerly Wind Biome is divided into the North Atlantic Drift Province (NADR) at 60–40°N (Sites 1-7), and the North Atlantic Subtropical Gyre Province (NAST-E) at 40–30°N (Sites 8–13). The Trade Wind Biome is, in turn, divided into the North Atlantic Tropical Gyre Province (NATR) at 30–12°N (Sites 14-23); and the Western Tropical Atlantic Province (WTRA) at 12/14°N–5°S and to the west of 15°W (Sites 24-31). Between the NEC and the Equator is the North Equatorial Counter Current (NECC), flowing against the wind in eastward direction, and with no influence on the gyre equatorial edge (Stramma and England, 1999; Aiken et al., 2017), both of which are subjected to the latitudinal migrations of the Intertropical Convergence Zone (ITCZ) (Basha et al., 2015).
2.3 Saharan dust deposition in the open Atlantic Ocean
Despite the highly variable and intermittent nature of atmospheric dust deposition, the Saharan dust plume region is characterized by well-marked spatiotemporal gradients (Powell et al., 2015), which are seasonally modulated by the ITCZ (Ben-Ami et al., 2012; Yu et al., 2019; van der Does et al., 2021). Highest dust fluxes in winter occur in the eastern tropical North Atlantic, closer to the dust sources in Africa (Skonieczny et al., 2013; Fomba et al., 2014; Fischer et al., 2016), and mainly transported by the Harmattan winds at lower altitudes in the atmosphere (0–3 km). During summer, the highest dust fluxes occur closer to the Caribbean in the western tropical North Atlantic (Prospero et al., 2014), mainly transported by the Saharan Air Layer at higher altitudes in the atmosphere (5–7 km) (Stuut et al., 2005; Adams et al., 2012; Tsamalis et al., 2013). Highest surface dissolved iron (dFe) and total dFe concentrations in waters of the oligotrophic tropical North Atlantic (~5–30° N) reflect the latitudinal extent of the Saharan dust plume (Bergquist and Boyle, 2006; Measures et al., 2008; Ussher et al., 2013; Shelley et al., 2017).
3 Material and methods
3.1 In situ sampling
Sampling was conducted between 25 September and 10 October 2018, on board of RRS James Clark Ross during the Atlantic Meridional Transect (AMT28). Coccolithophore communities were inspected in 150 seawater samples collected from 31 predawn and noon CTD (conductivity, temperature, depth) casts along a track crossing the Atlantic from ~50°N to 1°S (Figure 1 and Table 1).
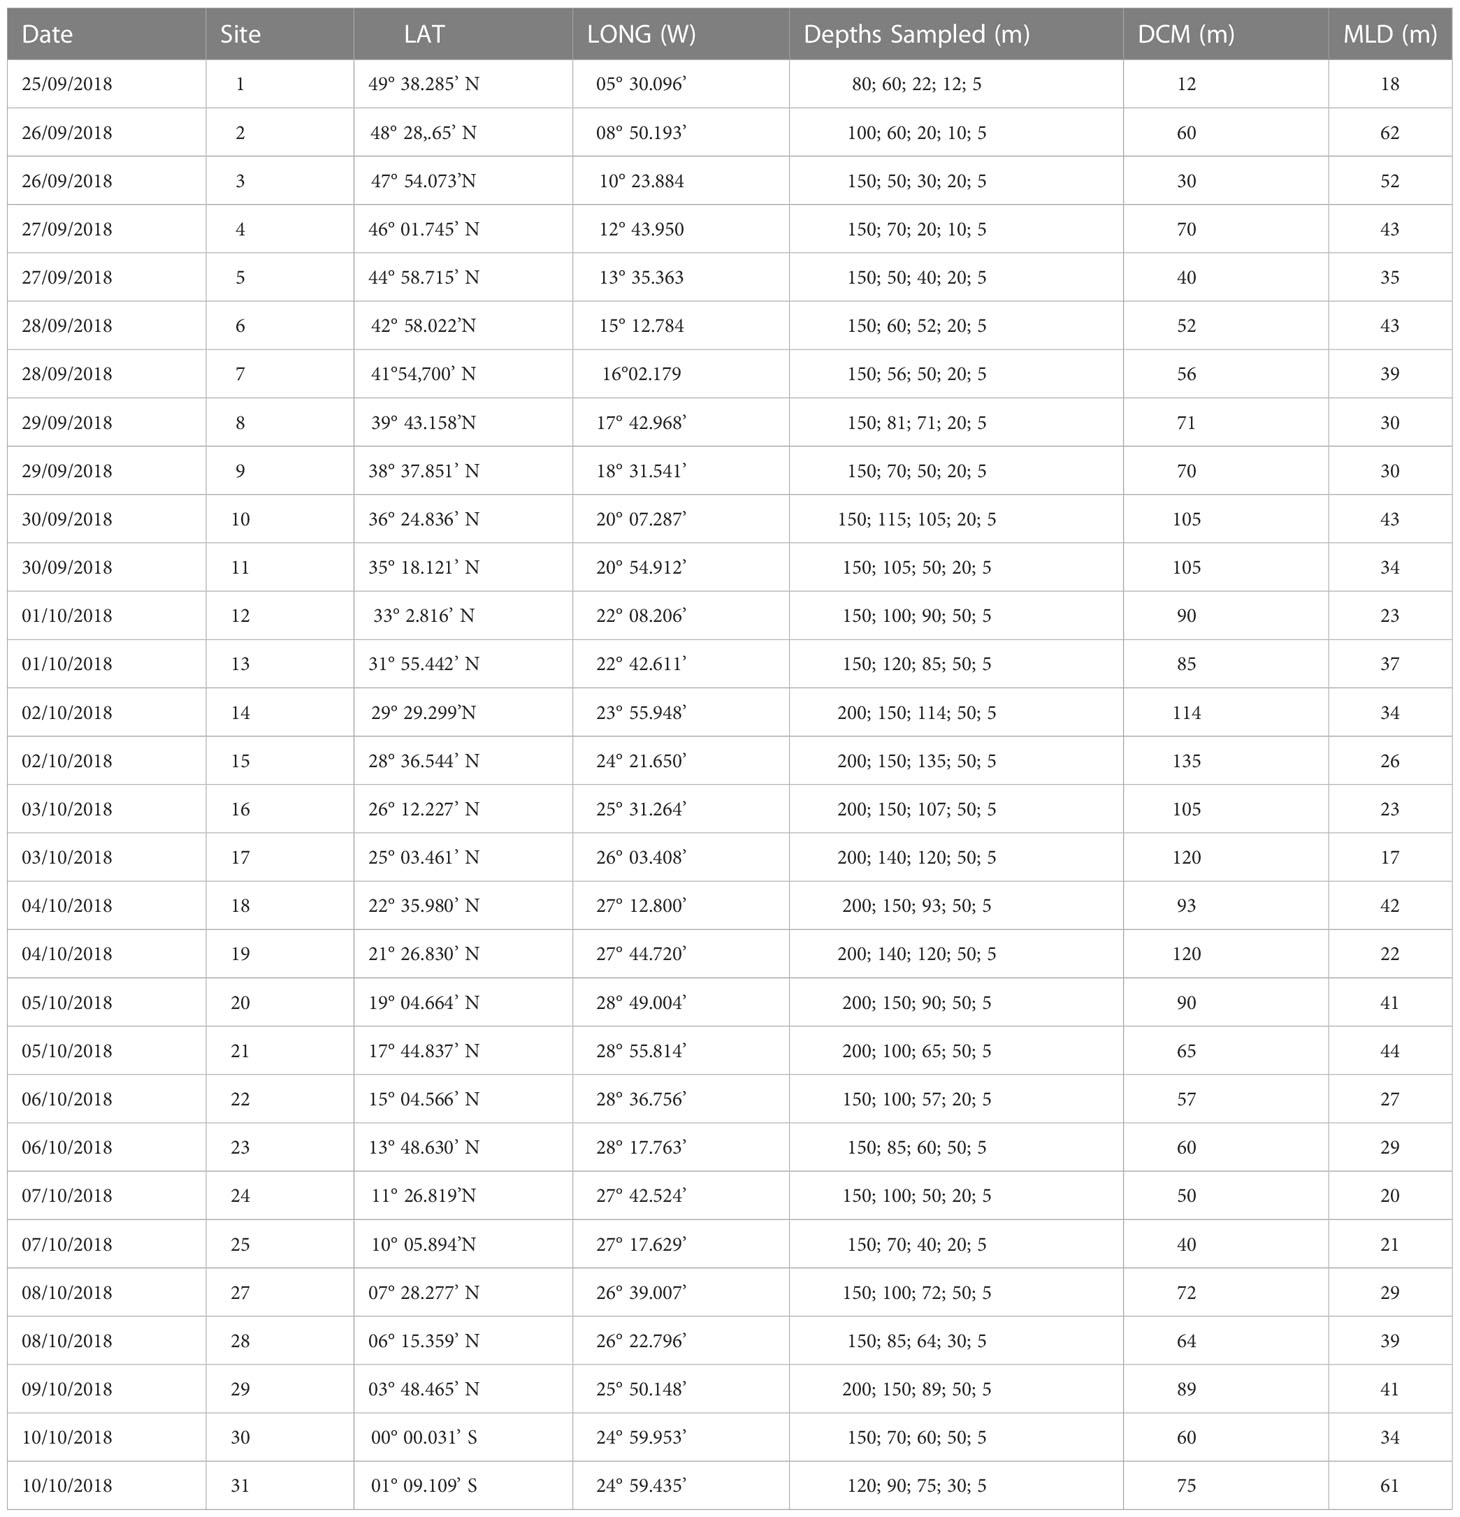
Table 1 Metadata information regarding the sites sampled during AMT28 used in this study. MLD determined following the temperature criterion (Levitus, 1982).
Hydrological data (i.e., temperature, salinity, oxygen, fluorometry and nutrients) and seawater samples for the coccolithophore and photosynthetic pigment analysis were collected using OTE (Ocean Test Equipment) Niskin bottles (24 x 20L) mounted on a stainless-steel rosette and a Seabird CTD system. Samples were collected at discrete water depth levels between 5 and 200 m depth to assess the distribution of coccolithophore species along the photic zone of the ocean. Pigment markers were analysed from samples collected at 5 m and DCM, while nutrient samples were collected at every depth from each CTD cast following GO-SHIP protocols (Becker et al., 2020). CTD data are represented as contour plots constructed with the inverse distance to power gridding method of Surfer Version 8.
Aerosol samples were collected using an Anderson high volume (1 m3 min-1) sampler, which operated under control from an automatic wind sector controller in order to avoid contamination from the ship’s stack. This device interrupted pumping if the relative wind speed was below 2 m s-1, or if the wind direction was between 150 and 280 degrees relative to the ship’s bow. Samples were collected onto single 203 x 254 mm Whatman 41 cellulose filters which had been washed prior to use with dilute (0.5 M and 0.1 M) hydrochloric acid solution. Sample collection times were generally 24 hours, although pumping times were occasionally shorter due to the operation of the wind sector controller (see Table 2). After collection, filters were sealed in zip-lock polyethylene bags and frozen (detailed description on sampling procedures in Rickli et al., 2010).
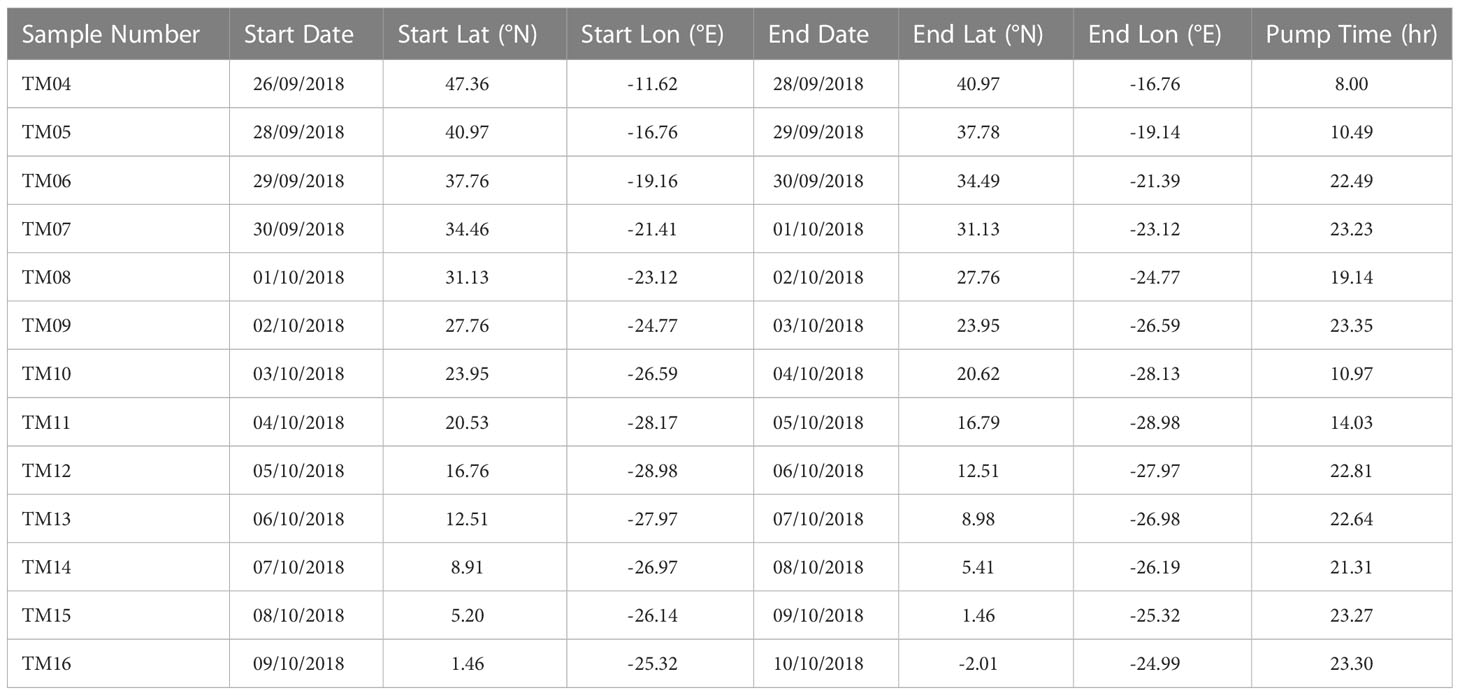
Table 2 Summary of aerosol collection periods and pump operation times during AMT28. See Figure 1B for the location of the aerosol collection periods.
3.2 Laboratory and microscope analysis
3.2.1 Coccolithophores
For the study of coccolithophores, seawater samples of around 2 to 5 L were filtered onto cellulose acetate filters (0.45 μm pore size, 47 mm diameter) using a low-pressure vacuum system directly on board. The filters were then rinsed with a buffered solution to remove salt, dried at room temperature, and stored in petri dishes. A randomly chosen section (approx. 30°–45°) of each filter (radius of ~16 mm) was cut and permanently mounted on a glass slide. Coccospheres (cells) were identified and counted under polarized light microscope (Zeiss Ortholux II-POL-BK) at 1250× magnification. The examined area per filter varied between 9×10⁵ and 9.8×106 mm2, depending on the general cell density. The number of cells per litre (cells/l) was estimated from the number of counted coccospheres in the examined area, multiplied by the ratio of total filter area to examined area, and divided by the volume of filtered water (Cros, 2001).
Coccolithophores taxonomy followed Jordan et al. (2004), Cros and Fortuño (2000), Frada et al. (2010) and Young et al. (2011). To refine the differentiation of Syracosphaera spp., Ophiaster spp., Michaelsarsia spp., Acanthoica spp. and holococcolithophores, Ca 26 samples selected to be inspected using the Scanning Electron Microscope (SEM, JEOL JSM5200-LV at FCUL, mostly at 15kV), containing higher numbers of rare species and holoccocolithophores. A randomly chosen section of the selected filters was fixed with carbon tape on a SEM stub and sputtered with an Au coating.
Coccolithophore taxa were further grouped according to their similarities in terms of meridional and in-depth distribution during AMT28, following similar criteria to those of Young (1994). Alterations to Young (1994) are described in the Supplementary Material (Figures II-IV). The ratio between upper photic zone (UPZ) r-selected species and lower photic zone (LPZ) species was used as a proxy for inferring regions of surface nutrient-enrichment vs. enhanced stratification (i.e., higher UPZ/LPZ ratios indicate more productive surface conditions). The ratio was calculated for each studied discrete sampling depth as the sum of the abundances of E. huxleyi and Gephyrocapsid species divided by the sum of the abundances of Florisphaera profunda and Gladiolithus flabellatus (e.g., Molfino and McIntyre, 1990; Beaufort et al., 1997; Stoll et al., 2007; Guerreiro et al., 2019). Finally, the Shannon–Wiener diversity index (H’ exp) (e.g., Tuomisto, 2013) was calculated from the cell counts using the polarizing light microscope, for assessing the coccolithophore species diversity at each sampling site.
3.2.2 Phytoplankton cells and photosynthetic pigments
For the photosynthetic pigment analysis, a volume of 1 to 4 L of seawater was vacuum-filtered through GF/F glass fibre filters (Whatman) of pore size 0.7 μm and 25 mm diameter, which were further folded into 2 mL cryovials, flash frozen in liquid nitrogen and stored at -80°C. Pigments were later determined using High Performance Liquid Chromatography, following Zapata et al. (2000); the column used was a Waters C8 Symmetry with 150 x 2.1 mm and 3.5 μm particle size, and a flow rate of 200 μL min-1. The HPLC was calibrated using a suite of standards purchased from DHI (Denmark). Pigments were identified based on retention time and spectral match using a photo-diode array.
To obtain an overview of the distribution of major taxonomic groups, a marker-pigment approach was used. Fucoxanthin (Fuco) was used as pigment marker for diatoms, peridinin (Perid) for autotrophic dinoflagellates, 19’hexanoyloxyfucoxanthin (HexFuco) for coccolithophores (Haptophyta Type 6), and zeaxanthin (Zea) for marine cyanobacteria sensu latu (s.l.), i.e., including picoplankton and N2-fixing filamentous diazotrophs (detailed description of the pigment analysis in Brotas et al., 2022). While HexFuco is an exclusive pigment of coccolithophores, fucoxanthin is not exclusive of diatoms, nor zeaxanthin of Cyanobateria, nor is peridinin present in all Dinoflagellate species. Nevertheless, this simplistic approach was considered the most appropriate for our studied region since the phytoplankton community has been reported to change significantly across the large hydrological gradients as those covered by the AMT, therefore less suitable for implementing other pigment analysis approaches (e.g. CHEMTAX), as discussed in Brotas et al. (2022)
For the phytoplankton cells count and identification, samples of 200 mL were collected at each sampling site, placed put in amber glass bottles, and fixed with acidic Lugol’s iodine solution. Taxonomic analysis and abundance quantification of filamentous cyanobacteria (e.g., Trichodesmium spp.) were made with a Zeiss Axiovert 200 inverted microscope over a 50 mL chamber (see Utermöhl, 1958).
3.2.3 Macronutrients and mixed layer depth
To determine the concentration of macronutrients, water samples taken at each CTD cast were sub-sampled into clean (acid-washed) 60 mL HDPE (Nalgene) sample bottles, which were rinsed three times with sample seawater prior to filling and capping. The samples were analysed on the ship as soon as possible after sampling and were not stored or preserved. Micro-molar nutrient analysis was carried out on board using a four channel SEAL analytical AAIII segmented flow nutrient auto-analyser. The colorimetric analysis methods used were: nitrate (Brewer and Riley, 1965, modified), nitrite (Grasshoff, 1976), and phosphate and silicate (Kirkwood, 1989). The MLD was determined following the temperature criterion defined by Levitus (1982), according to which the mixed layer is the depth at which the difference in temperature from the surface value is 0.5° C.
3.2.4 Aerosol concentration, composition and deposition fluxes
The Whatman 41 aerosol filters were cut into four equal portions, with separate portions used for analysis of dust, water-soluble and ammonium acetate-soluble components. For dust analysis, the filter portion was ashed in a low temperature asher (e.g., van der Does et al., 2018) to isolate the aeolian dust collected during AMT28 (Tarran, 2018, cruise report). The amount of dust that remained after ashing was measured on a Toledo micro balance. Dust concentrations were calculated using the mass total dust per filter (mg) and the volumes of filtered air (m³) per filter.
Soluble nutrients were determined in aerosol samples following extraction of portions of each sample into ultrapure water for nitrate () and ammonium () ions (Yodle and Baker, 2019) and into ~ 1 M ammonium acetate solution for soluble phosphorus (s-P) and iron (s-Fe) (Baker et al., 2007), with the extraction solutions being passed through 0.2 mm cellulose acetate cartridge filters (Sartorius). Analysis was by ion chromatography for nitrogen species (Baker et al., 2007) and inductively coupled plasma – mass spectrometry for s-P and s-Fe, with P and Fe determined as their oxygen adducts (31P16O and 56Fe16O respectively) in triple-quad mode (iCAP TQ, Thermo). Estimations of wet and dry dust deposition fluxes from the measured atmospheric concentrations are described in the Supplementary Material.
3.3 Earth observation data
Time series of relevant hydrological and meteorological parameters were obtained from satellite data and used to assess the environmental conditions during the in-situ sampling conducted whilst at sea. The full list of parameters includes the sea surface temperature (SST; °C), sea surface salinity (SSS; unitless), Chl-a concentration (Chl-a; mg m-3), the aerosol optical thickness at 865 nm (AOT; unitless), the photosynthetically available radiance (PAR; μEinstein m-2 d-1), the wind speed (m s-1) and wind direction (degrees) and the daily rain rate (mm d-1). Data were downloaded from various sources and processed for the study period and for 1998-2020 (list and description in the Supplementary Material - Table I).
4 Results
4.1 Meteorological and hydrological conditions
Mean surface ocean conditions changed along the transect, with cooler, of lower salinities and higher Chl-a concentrations waters under the windier conditions in the NADR (> 40°N), from which they gradually changed to increasingly warmer, saline and Chl-poor waters towards the gyre central region (~30–25°N) where SSS was highest and Chl-a was lowest across the transect (Figures 2A–C). From there, SST continued to increase southwards while SSS gradually decreased until reaching its lowest values in the WTRA equatorial region (Figures 2A, B). Weaker winds and higher rain rates at ~12–5°N indicated the influence of the ITCZ (Figures 2D, E). A warm lens of very low SSS and high Chl-a concentrations was expanding from the Amazon and Orinoco River mouths into the open equatorial North Atlantic to form a Chl-enriched continuum across the tropical NE Atlantic (i.e., along ~22–5°N, to the east of 30°W) (Figures 2A–C). South of this region, a band of lower SST, higher SSS and low Chl-a concentrations extended across the entire ocean basin. Chl-a increased to slightly higher concentrations along the Equator. Chl-enrichment along the NATR-WTRA transition to the east of 30°W (at ~22–10°N) occurred under strong NE winds and the highest mean AOT of the study area (Figures 2C, D, F),
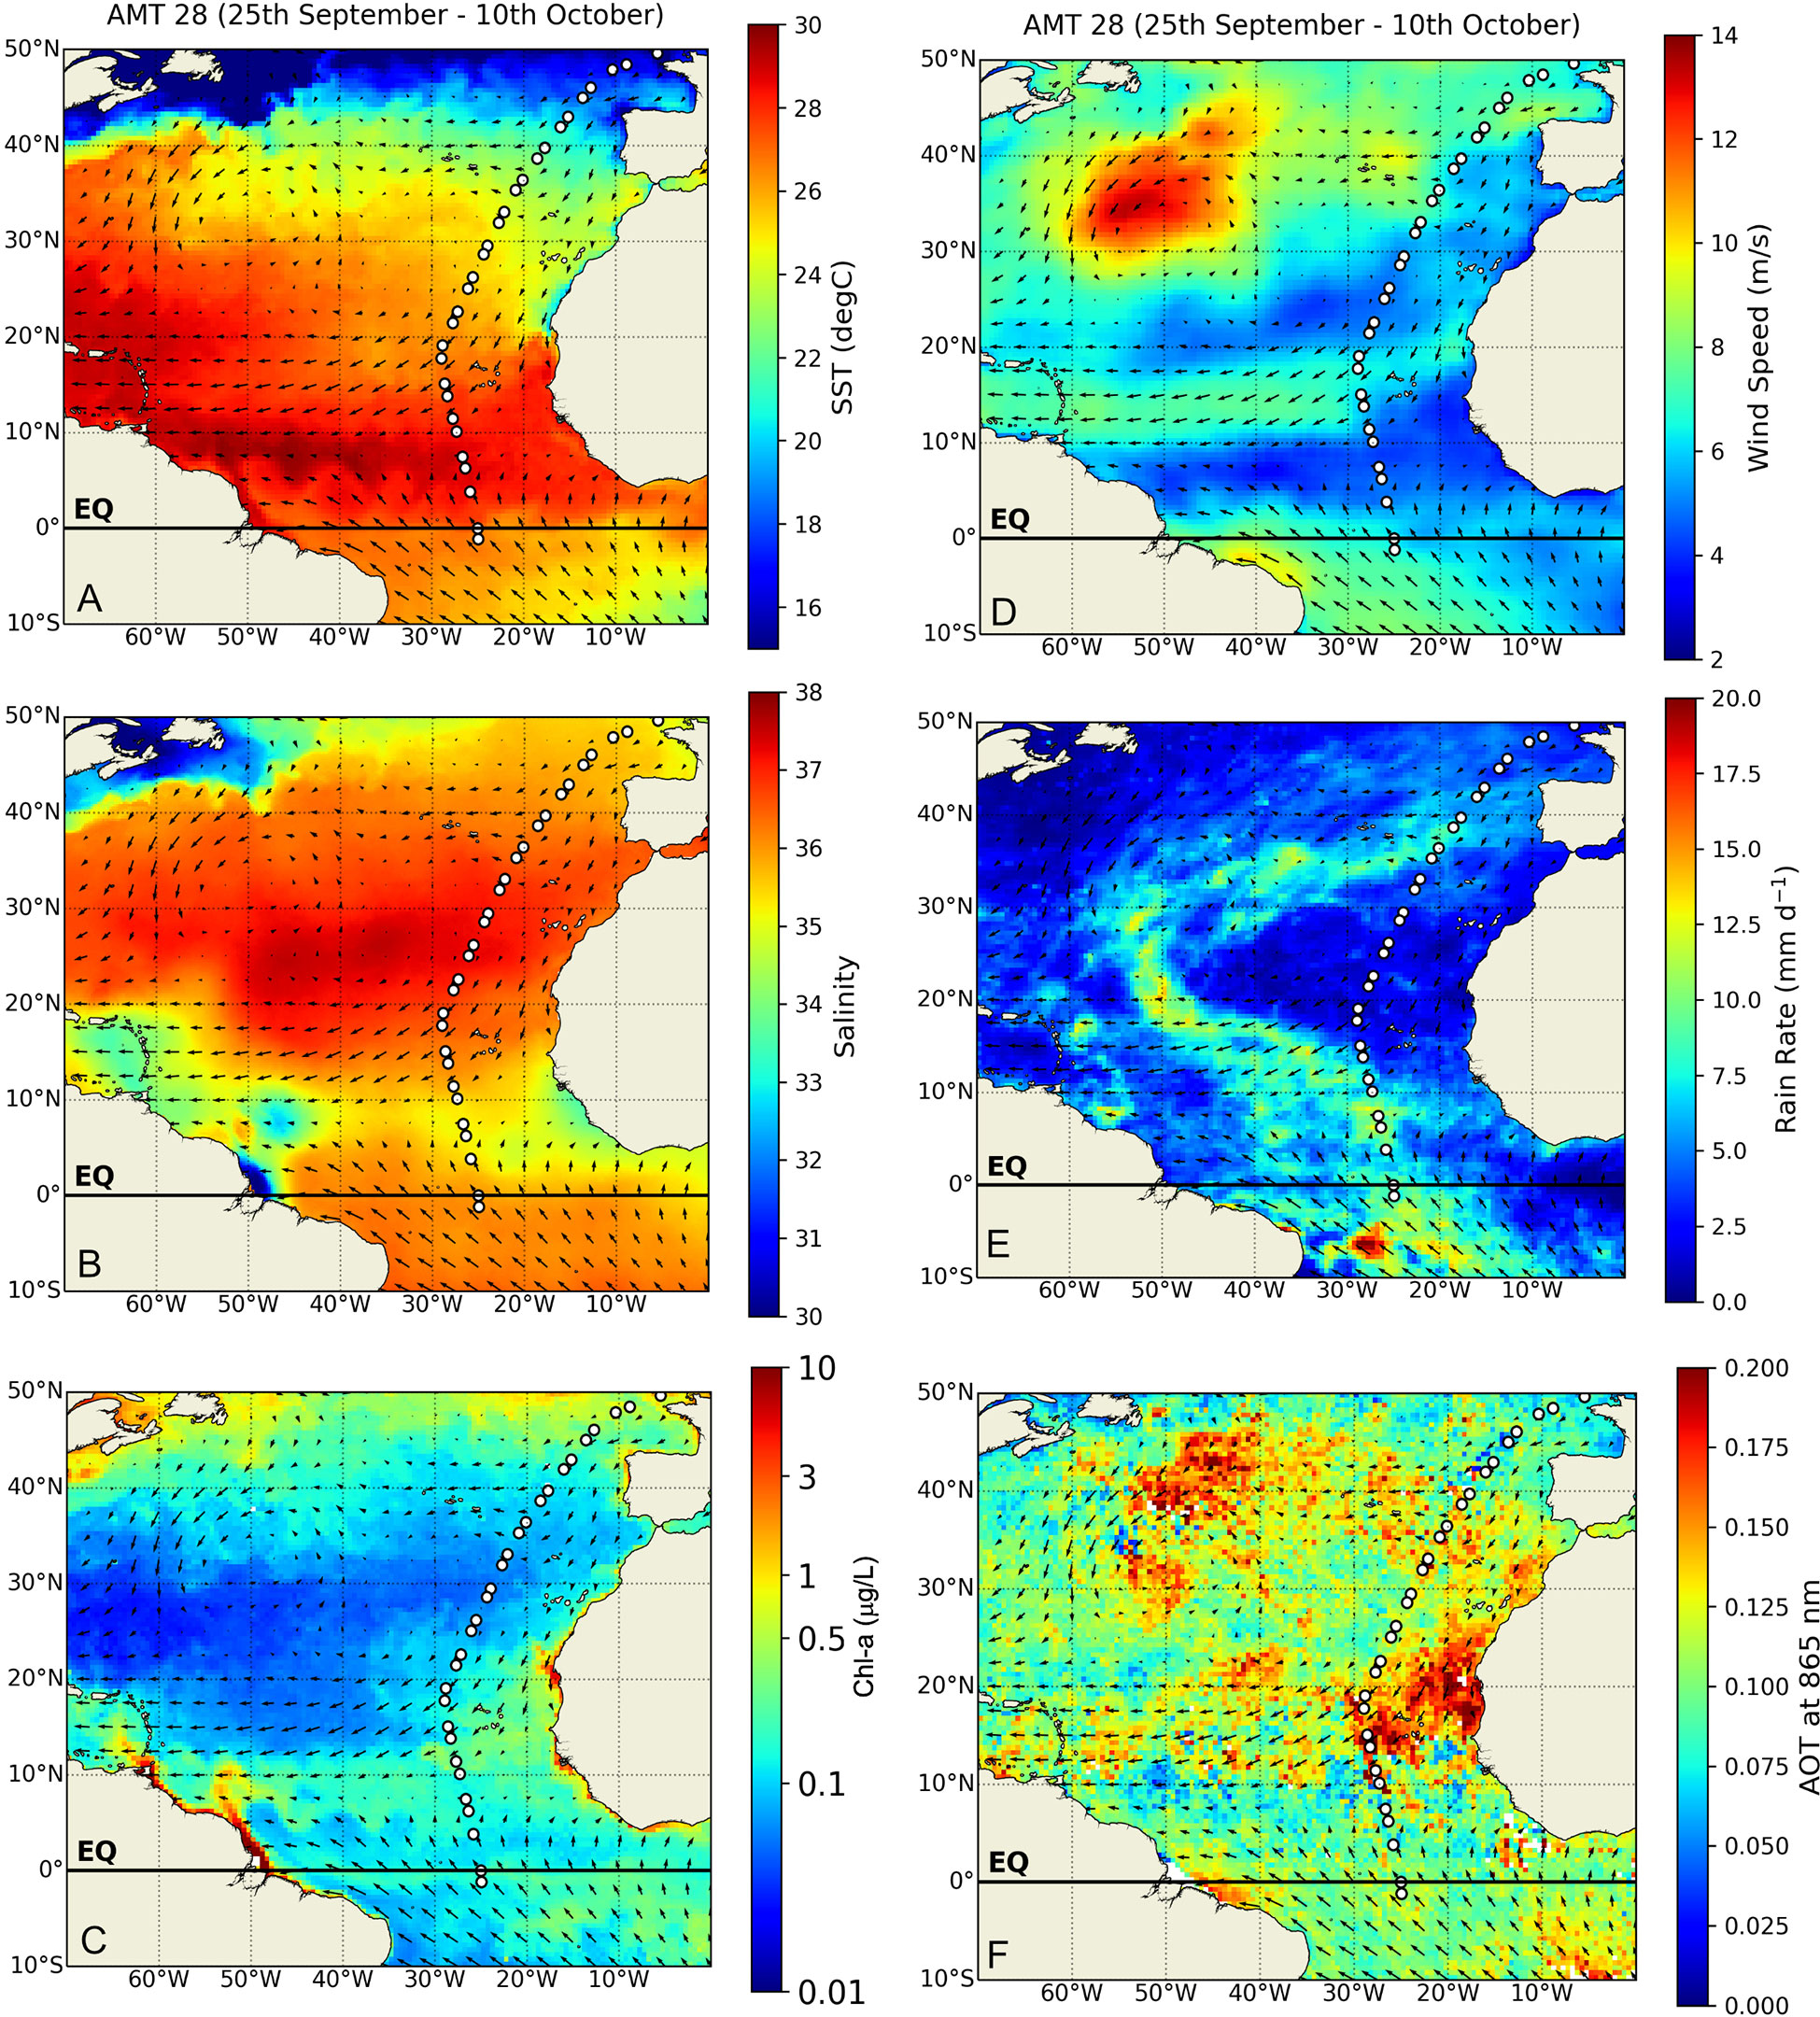
Figure 2 Satellite-derived atmospheric and surface ocean conditions averaged for the entire North- and Equatorial Atlantic during the AMT 28 sampling period (25 September to 10 October 2018): (A) sea surface temperature (SST, °C), (B) sea surface salinity, (C) Chl-a concentrations (μg/L) (D) wind speed (m/s), (E) rain rates (mm/day), and (F) aerosol optical thickness (AOT). Arrows shown in all figures represent spatial variations on the averaged wind direction during AMT28.
Hydrological parameters measured within the uppermost 200 m of the ocean (Figures 3, 4) confirmed the meridional surface patterns described above. Colder and denser water masses in the NADR were characterized by the highest Chl-fluorescence and oxygen levels along the transect, and a DCM extending from 12 m depth at Site 1 to 30–71 m along Sites 2–9. To the south of the NADR, a gradient of increasing temperature and decreasing density and oxygen occurred along the uppermost 30–40 m depth, with a region of highest salinity along ~39–20°N related to the gyre (Figures 3A, C, D). Here, high salinities and warm temperatures deepened the most across the transect (down to >200 m) (Figures 3A, B), as well as the DCM (down to 135 m at site 15), while Chl-fluorescence was minimum at the surface (Figure 4E). To the south of the gyre, salinity dropped until reaching a surface minimum at sites 27–28 (Figure 3B), signalling contributions from the Amazon River plume and from ITCZ-related rainfall prior to the expedition (Figures 2B, E). At 18–5°N, a 25 m uppermost layer of heavily stratified tropical water was overlaid over a colder and less saline water mass which was upwelling between the Equator and 15°N (Figures 3A–C), and coinciding with a sub-surface Oxygen Minimum Zone (OMZ) (Figure 3D). The DCM was shallower in this region (50–40 m at Sites 24–25), following the rising of the pycnocline (Figure 4E).
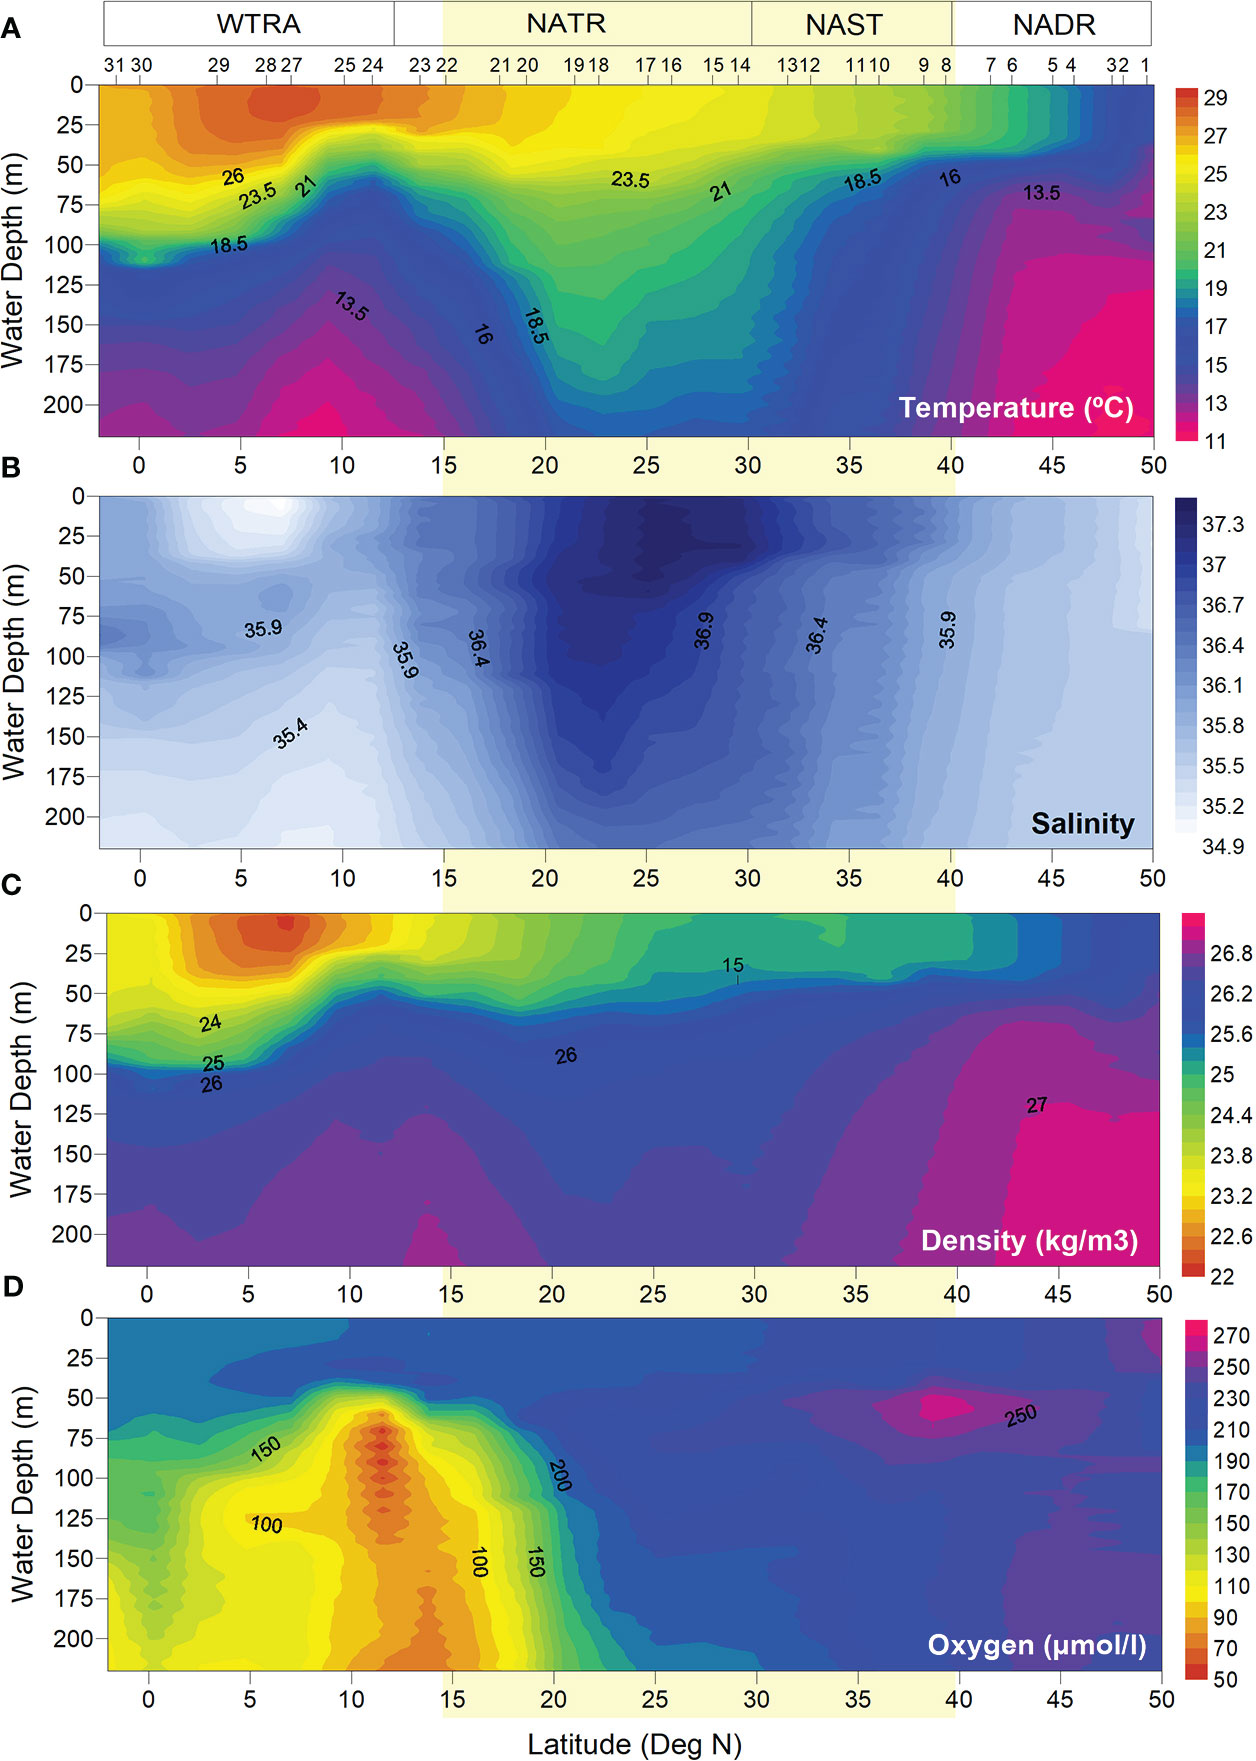
Figure 3 Hydrological conditions measured in situ at AMT 28 sampling sites: (A) temperature (°C), (B) salinity, (C) density (kg/m3), and (D) dissolved oxygen concentration (μmol/L). Light-yellow band indicates the approximate location of the North Atlantic Subtropical Gyre at ~15-40° N (Aiken et al., 2017).
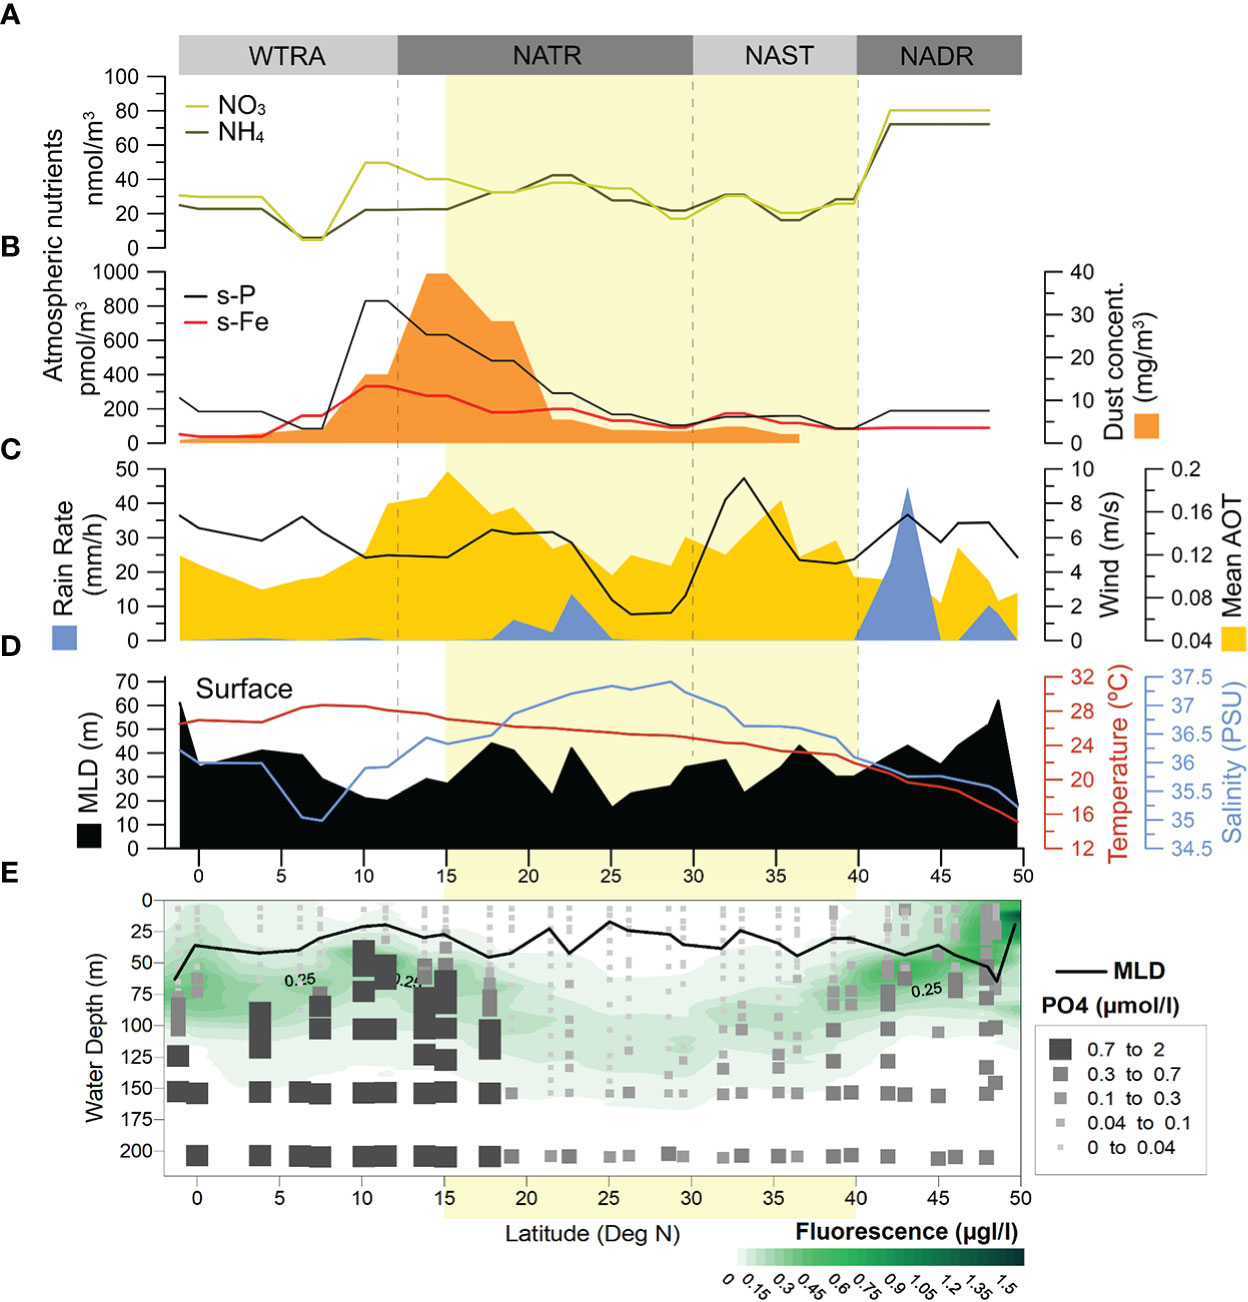
Figure 4 Environmental conditions during AMT28: (A) concentrations of atmospheric NO3 and NH4, (B) concentrations of atmospheric dust (dark orange), and of atmospheric soluble phosphorus (s-P) and iron (s-Fe); (C) remotely sensed rain rate (blue), wind strength (black line) and mean aerosol optical thickness (AOT – light orange); (D) in-situ measured MLD (black), surface temperature (red line), surface salinity (blue line), and (E) in-situ measured MLD (black curve), Chl-fluorescence (green) and PO4 concentrations. Light-yellow band indicates the approximate location of the North Atlantic Subtropical Gyre at ~40-15° N (Aiken et al., 2017.
MLDs were often greater under stronger wind-stress conditions, more notably in the southern part of the transect (Figures 4C, D), although this was not always the case. A good example of one such exception concerns the windier conditions in the AzC region (centred at ~33°N) under which no deepening of the MLD was observed. The lowest MLDs across the transect were observed at the centre of the gyre (Site 17, at 25°N), followed by the northernmost end of the transect (Site 1, at 49°N) and northern part of the WTRA (Sites 24–25, at ~11–10° N). During the sampling period, rain only occurred in the NADR and, to a much lesser extent, in the southern part of the gyre (~22–19° N), but not in the region underneath the ITCZ (Figure 4C).
4.2 Atmospheric dust deposition
The occurrence of two dust outbreak events during AMT28 was depicted from daily images of the atmosphere taken by NASA Worldview (Figure 5). While the first event began at the start of the expedition, the dust plume only crossed our transect by 27–30 September (between Sites 4 and 11, 46–36°N), in line with the AOT increase observed in the NADR and northern NAST (Figure 4C). The second event was during 3–7 October (between Sites 16 and 25, 26–10°N), thereby coinciding with the period during which the photic zone was sampled across the NATR-WTRA (Figure 5). This was also the region of highest dust concentrations measured in-situ (Figure 4B), and where high AOT levels extended the most to the west (Figures 2F), suggesting transport of African dust by the trade winds.
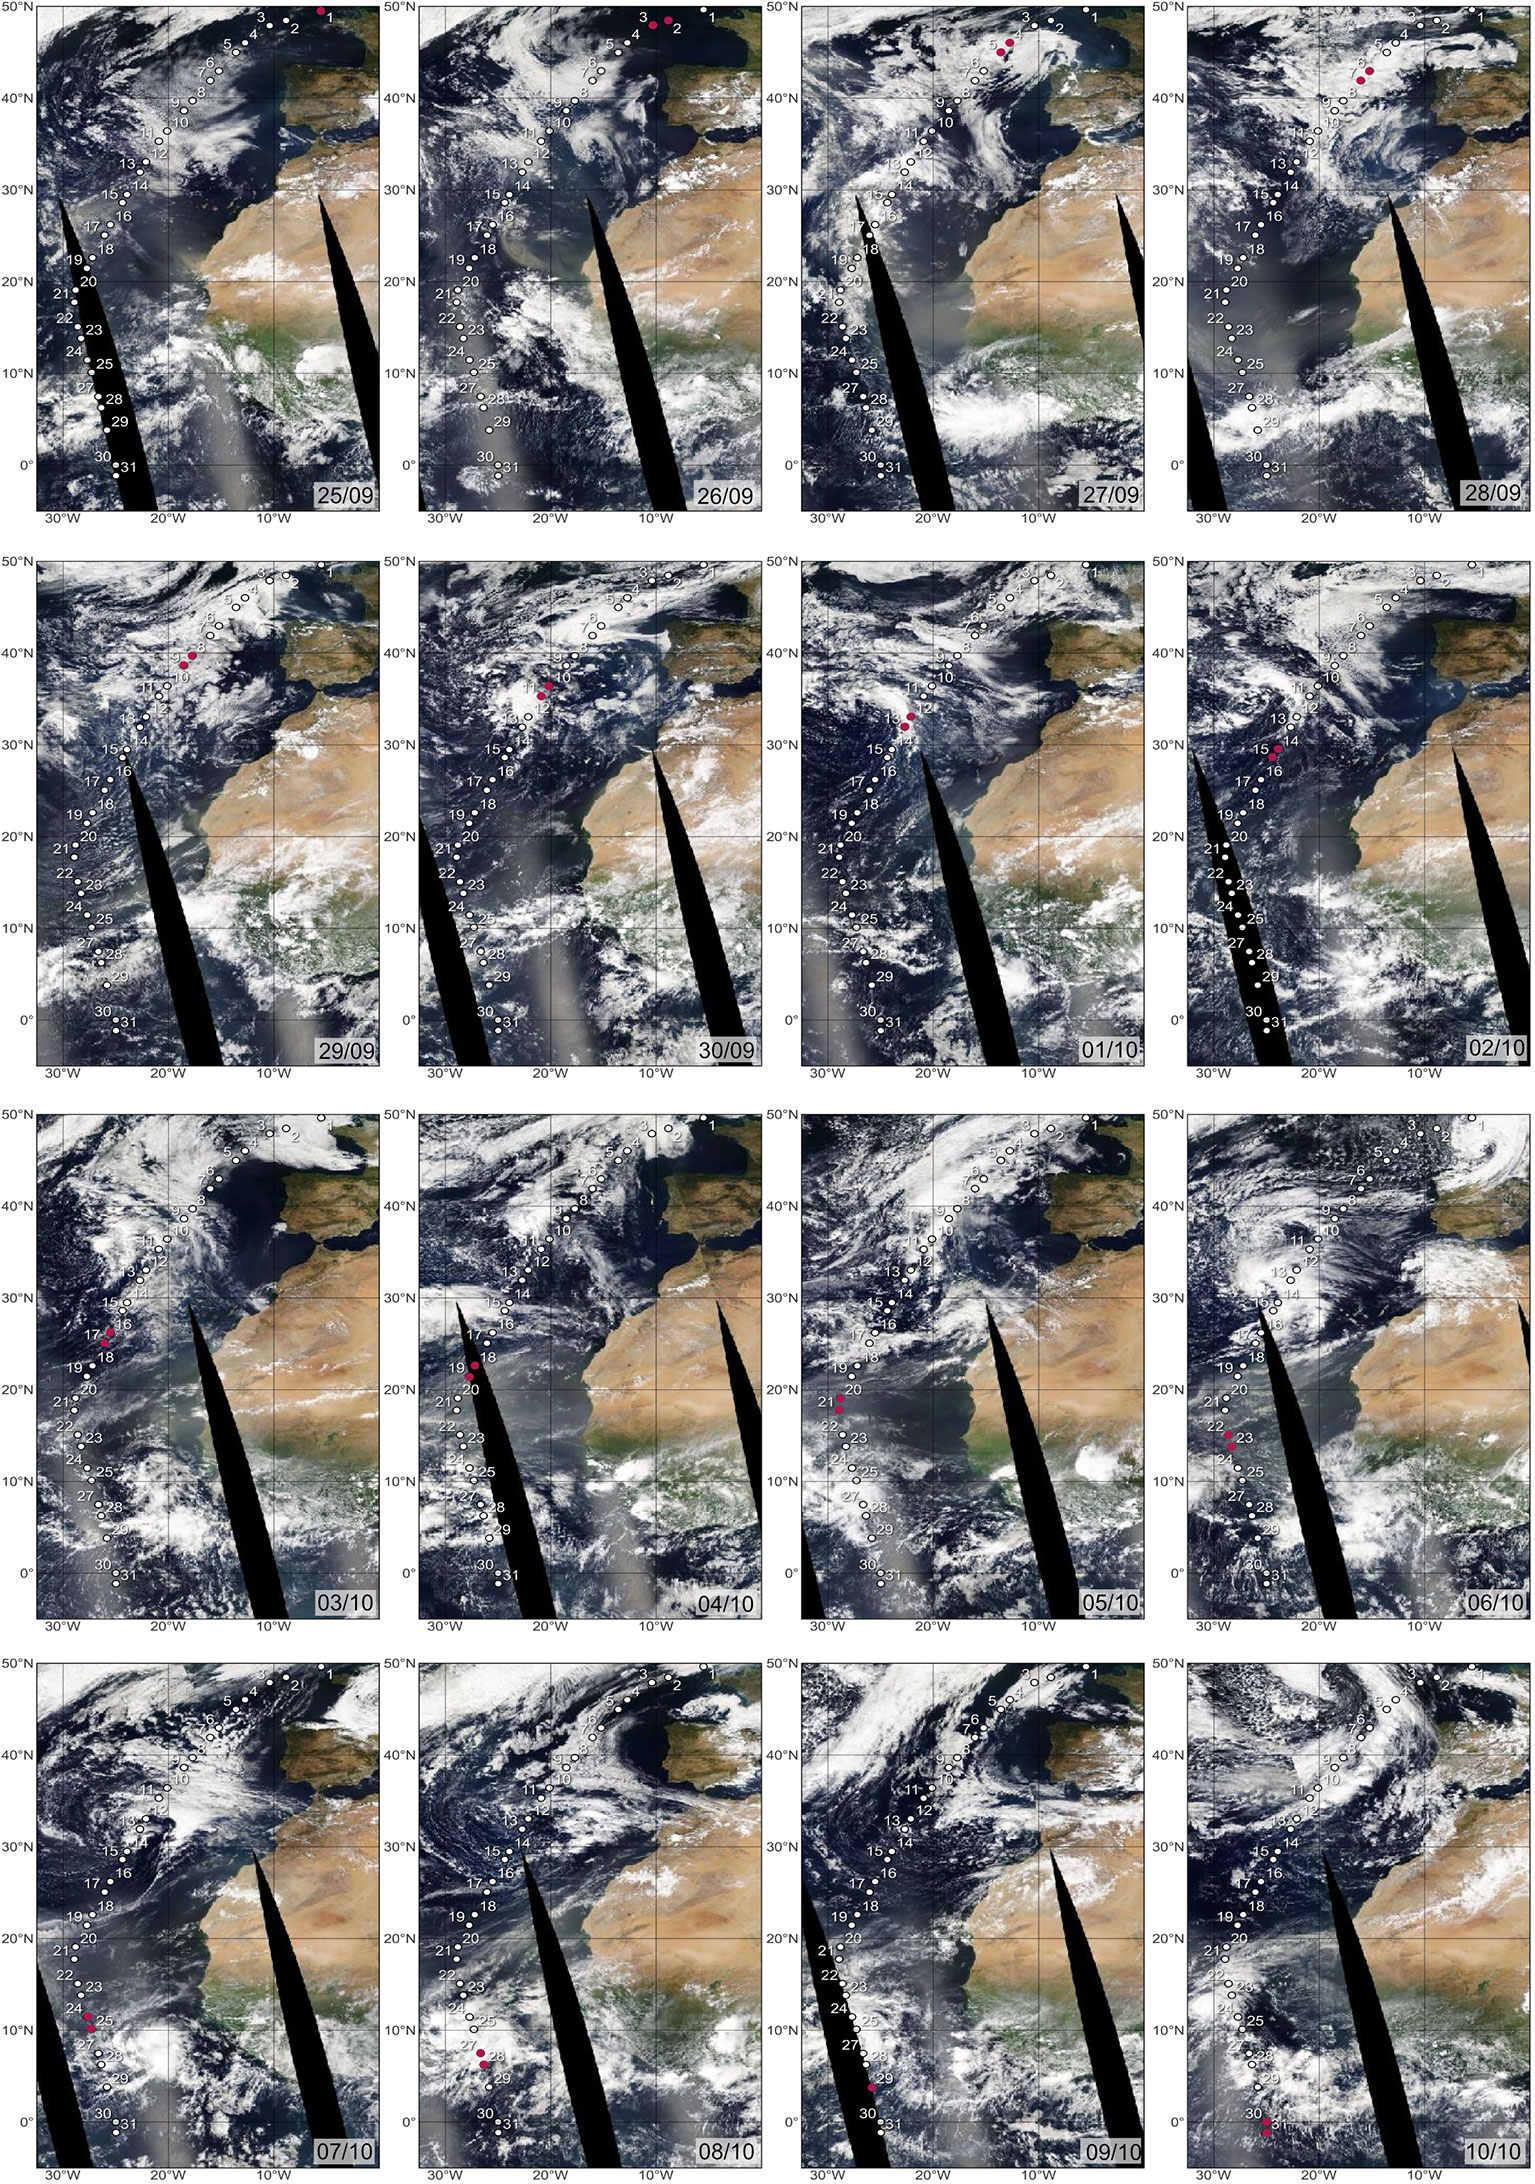
Figure 5 True colour daily satellites images from NASA MODIS AQUA (https://worldview.earthdata.nasa.gov) showing dust plumes blowing from NW Africa into the adjacent NE Atlantic during AMT28. White circles indicate the sampling sites during the expedition, whereas the red circles indicate where the ship was in each sampling day.
Concentrations of atmospheric soluble Fe and P increased strikingly across the NATR-WTRA, pointing to the occurrence of dust-born nutrient input at the surface of the ocean. S-Fe also showed a slight increase in the NAST, while s-P increased in the NADR, NAST, and in the equatorial North Atlantic, but to a much lesser extent compared to the NATR-WTRA transition (Figure 4B). While atmospheric nitrates also increased in this region, particularly NO3, concentrations were much higher than s-Fe and s-P within the gyre region, and highest to the north of 45°N (Figure 4A).
4.3 Macronutrient concentrations in the upper ocean
All macronutrients measured across the photic zone revealed a similar meridional and in-depth distribution, consistently higher below the surface and usually coinciding with the DCM. Highest concentrations occurred across the NATR-WTRA transition (Sites 21–27 at 17–7°N) (e.g., Figure 4E), coinciding with the sub-surface OMZ (Figure 4D), and with the region of highest atmospheric dust concentrations and mean AOT (Figures 4B, C). NOx had the highest range of concentrations (~0–36 μmol/L), followed by SiO2 (~0–20 μmol/L), and PO4 (0–2 μmol/L, Figure 4E) (NOx and SiO2 are shown in Figure I - Supplementary Material). A surficial and relatively diluted nutricline at the northernmost part of the transect gradually deepened and sharpened towards the south, down to ~160–200 m depth at the gyre central-southern region (Sites 14–19, ~30–21°N). From there, the nutricline (i.e., ocean layer where the greatest change in the nutrient concentration occurs with depth) became gradually shallower southwards, up to ~40–50 m depth at the NATR–WTRA transition. Southwards, the nutricline for NOx and PO4 gradually deepened to ~80–120 m, becoming increasingly more diluted towards the Equator (Sites 30–31). SiO2 concentrations had a similar meridional pattern but were more broadly vertically distributed to the south of 18°N compared to NOx and PO4. SiO2 concentrations were higher in the uppermost 50 m at the ITCZ-influenced region (8–3°N) compared to NOx and PO4.
4.4 Coccolithophore total cells concentrations, UPZ/LPZ ratios and species diversity
Coccolithophores produced a mean of 23×103 cells/L (1×10³–111×103cells/L) at the NADR, followed by 18×103 cells/L (2×10³–60×103cells/L) at the WTRA, 14×103 cells/L (1×10³–49×103cells/L) at the NATR, and finally 11×103 cells/L (2×10³–23×103cells/L) at the NAST (Table II – Supplementary Material).
A degree of variability was driven by the heterogeneous distribution of ecologically distinct taxa, but higher cell densities generally followed the meridional distribution of the DCM (Figure 6A). Coccolithophores were most abundant along the uppermost 30 m in the NADR. High but comparably lower cell densities also occurred: in the gyre region, both at the surface and at ~135 m depth (Sites 16 and 15, respectively); in the southern part of the NATR (Site 22, at 57 m); across the NATR-WTRA transition (Sites 24 and 25, at 40–50 m); and at the Equator (Site 30, at 60 m). Lowest cell densities usually occurred below ~125 m depth along the transect, except in the gyre where coccolithophores were more abundant along and below the DCM. Lower concentrations occurred at the surface occurred in the gyre and in the ITCZ-influenced region (Sites 27–28) (Figure 6A).
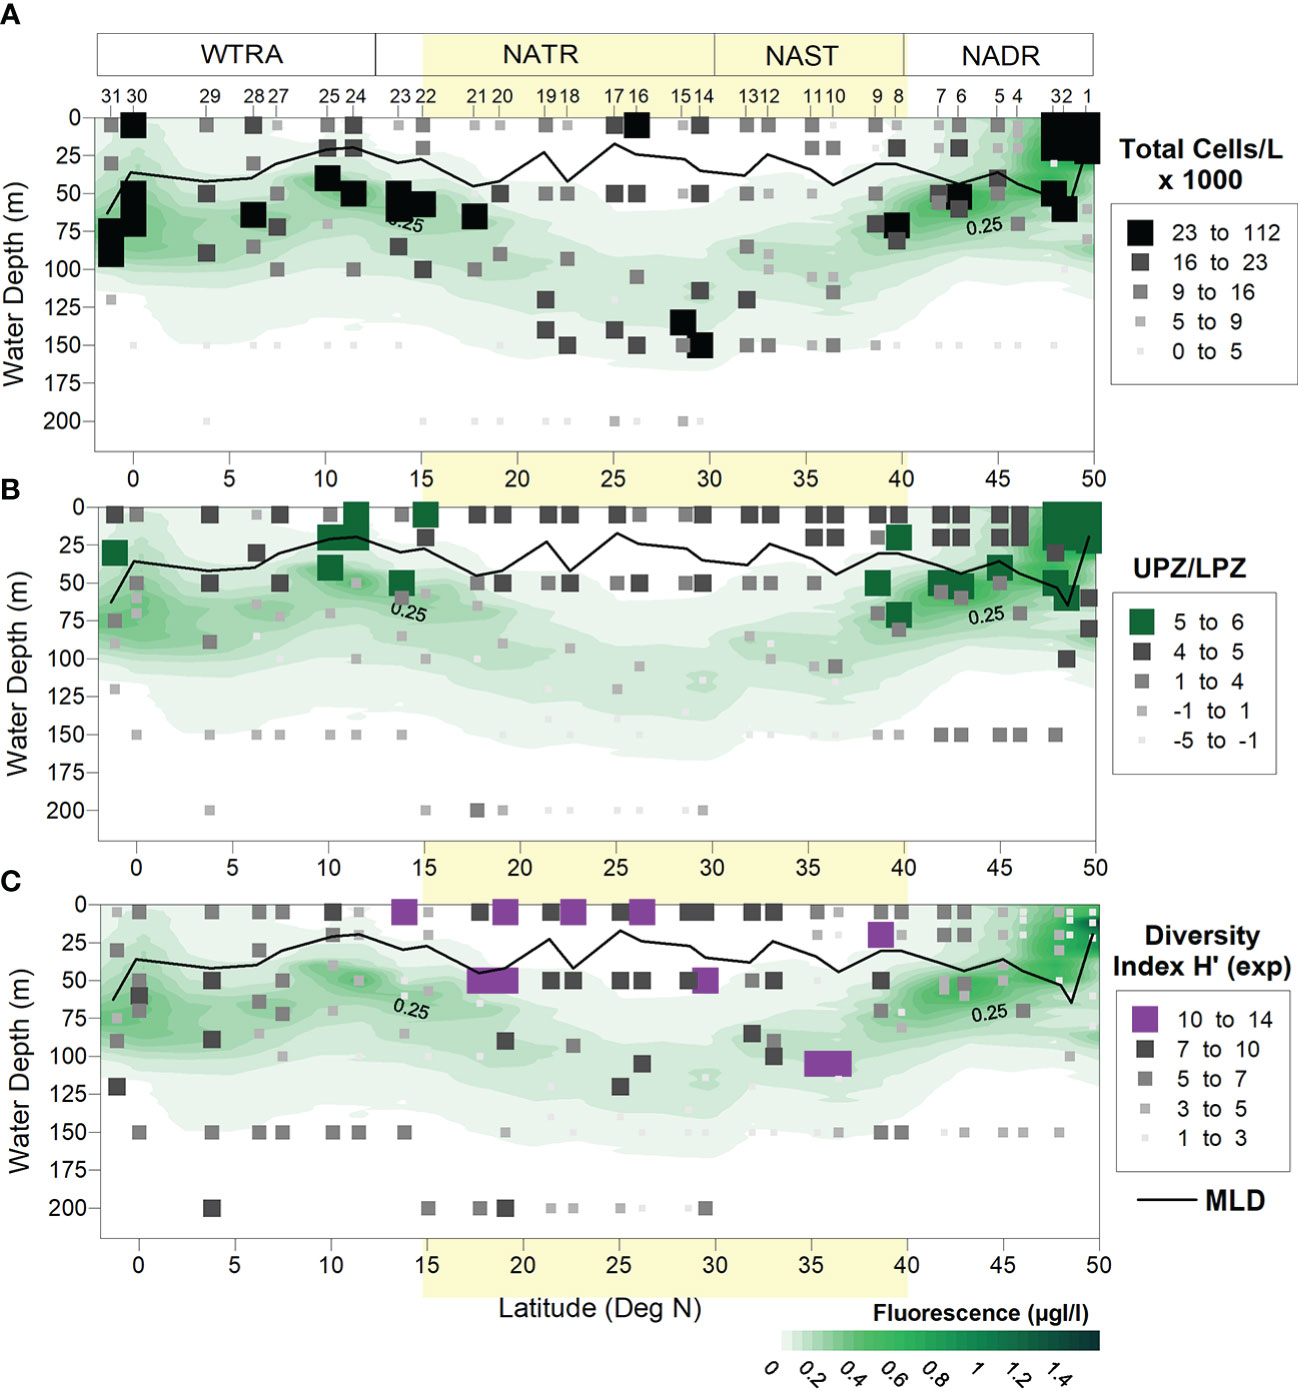
Figure 6 Meridional and vertical distribution of (A) coccolithophore total cell densities (cells/L), (B) UPZ/LPZ ratios calculated from the ratio between the cell concentrations by UPZ-species E. huxleyi and Gephyrocapsid species, and LPZ-species F. profunda and G. flabellatus, and (C) Shannon-Weaver species diversity index (H’ Exp). UPZ and LPZ stand for upper- and lower photic zone. Light-yellow band indicates the approximate location of the North Atlantic Subtropical Gyre at ~15-40° N (Aiken et al., 2017).
Higher UPZ/LPZ ratios, indicative of more nutritious conditions in the upper- compared to the lower photic zone, occurred in the NADR (i.e., at the surface at >47°N, and in sub-surface waters at 47-40°N), near the Equator (at 25 m depth of Site 31), and across the NATR-WTRA transition (both at the highly stratified uppermost 20 m and along the shallow DCM underneath) (Figure 6B).
In terms of species richness, a total of 87 heterococcolithophore taxa were identified in this study, of which 45 species and five genera (Michaelsarsia spp., Ophiaster spp., Syracosphaera spp., Alisphaera spp. and Pontosphaera spp.) were identified using the polarizing light microscope, while the SEM analysis allowed the identification of 42 additional species. In terms of holococcolithophores, three taxa (S. pulchra HOL, S. anthos HOL, and Syracolithus spp.) were identified with the polarizing light microscope, while the SEM confirmed these genera and revealed 29 more species, of which Helladosphaera cornifera, Homozygosphaera triarcha, and Syracosphaera pulchra HOL oblonga type were the most abundant. The full list of identified taxa is in the Taxonomic Appendix.
Coccolithophore species diversity inferred from the Shannon–Weaver diversity index was clearly higher along the uppermost ~50 m depth within the gyre, and lower at higher latitudes in the NADR (> 45°N), and in the gyre’s lower photic zone (> 150 m). A diversity peak occurred at ~100 m in the AzC region (Sites 10–11) (Figure 6C).
4.5 Coccolithophore species’ abundances and meridional distribution
Placolith-bearing r-selected taxa, including E. huxleyi, G. oceanica, G. ericsonii and G. muellerae, were by far the most abundant group during AMT28. Higher cell concentrations occurred along the uppermost 60–80 m across the transect (Figure 7A), contributing highest mean percentages to the coccolithophore community in the NADR (69%) and WTRA (42%), and the lowest in the gyre (28% and 23% in the NAST and NATR, respectively) (Table II – Supplementary Material). E. huxleyi was the most abundant, often following the DCM but also thriving at the surface. Its highest concentrations occurred in the northernmost part of the transect (max. 96% at 60 m of Site 1), but also across the NATR-WTRA transition and at the Equator (max. 67% at 20m of Site 24 and 64% at 75m of Site 31).
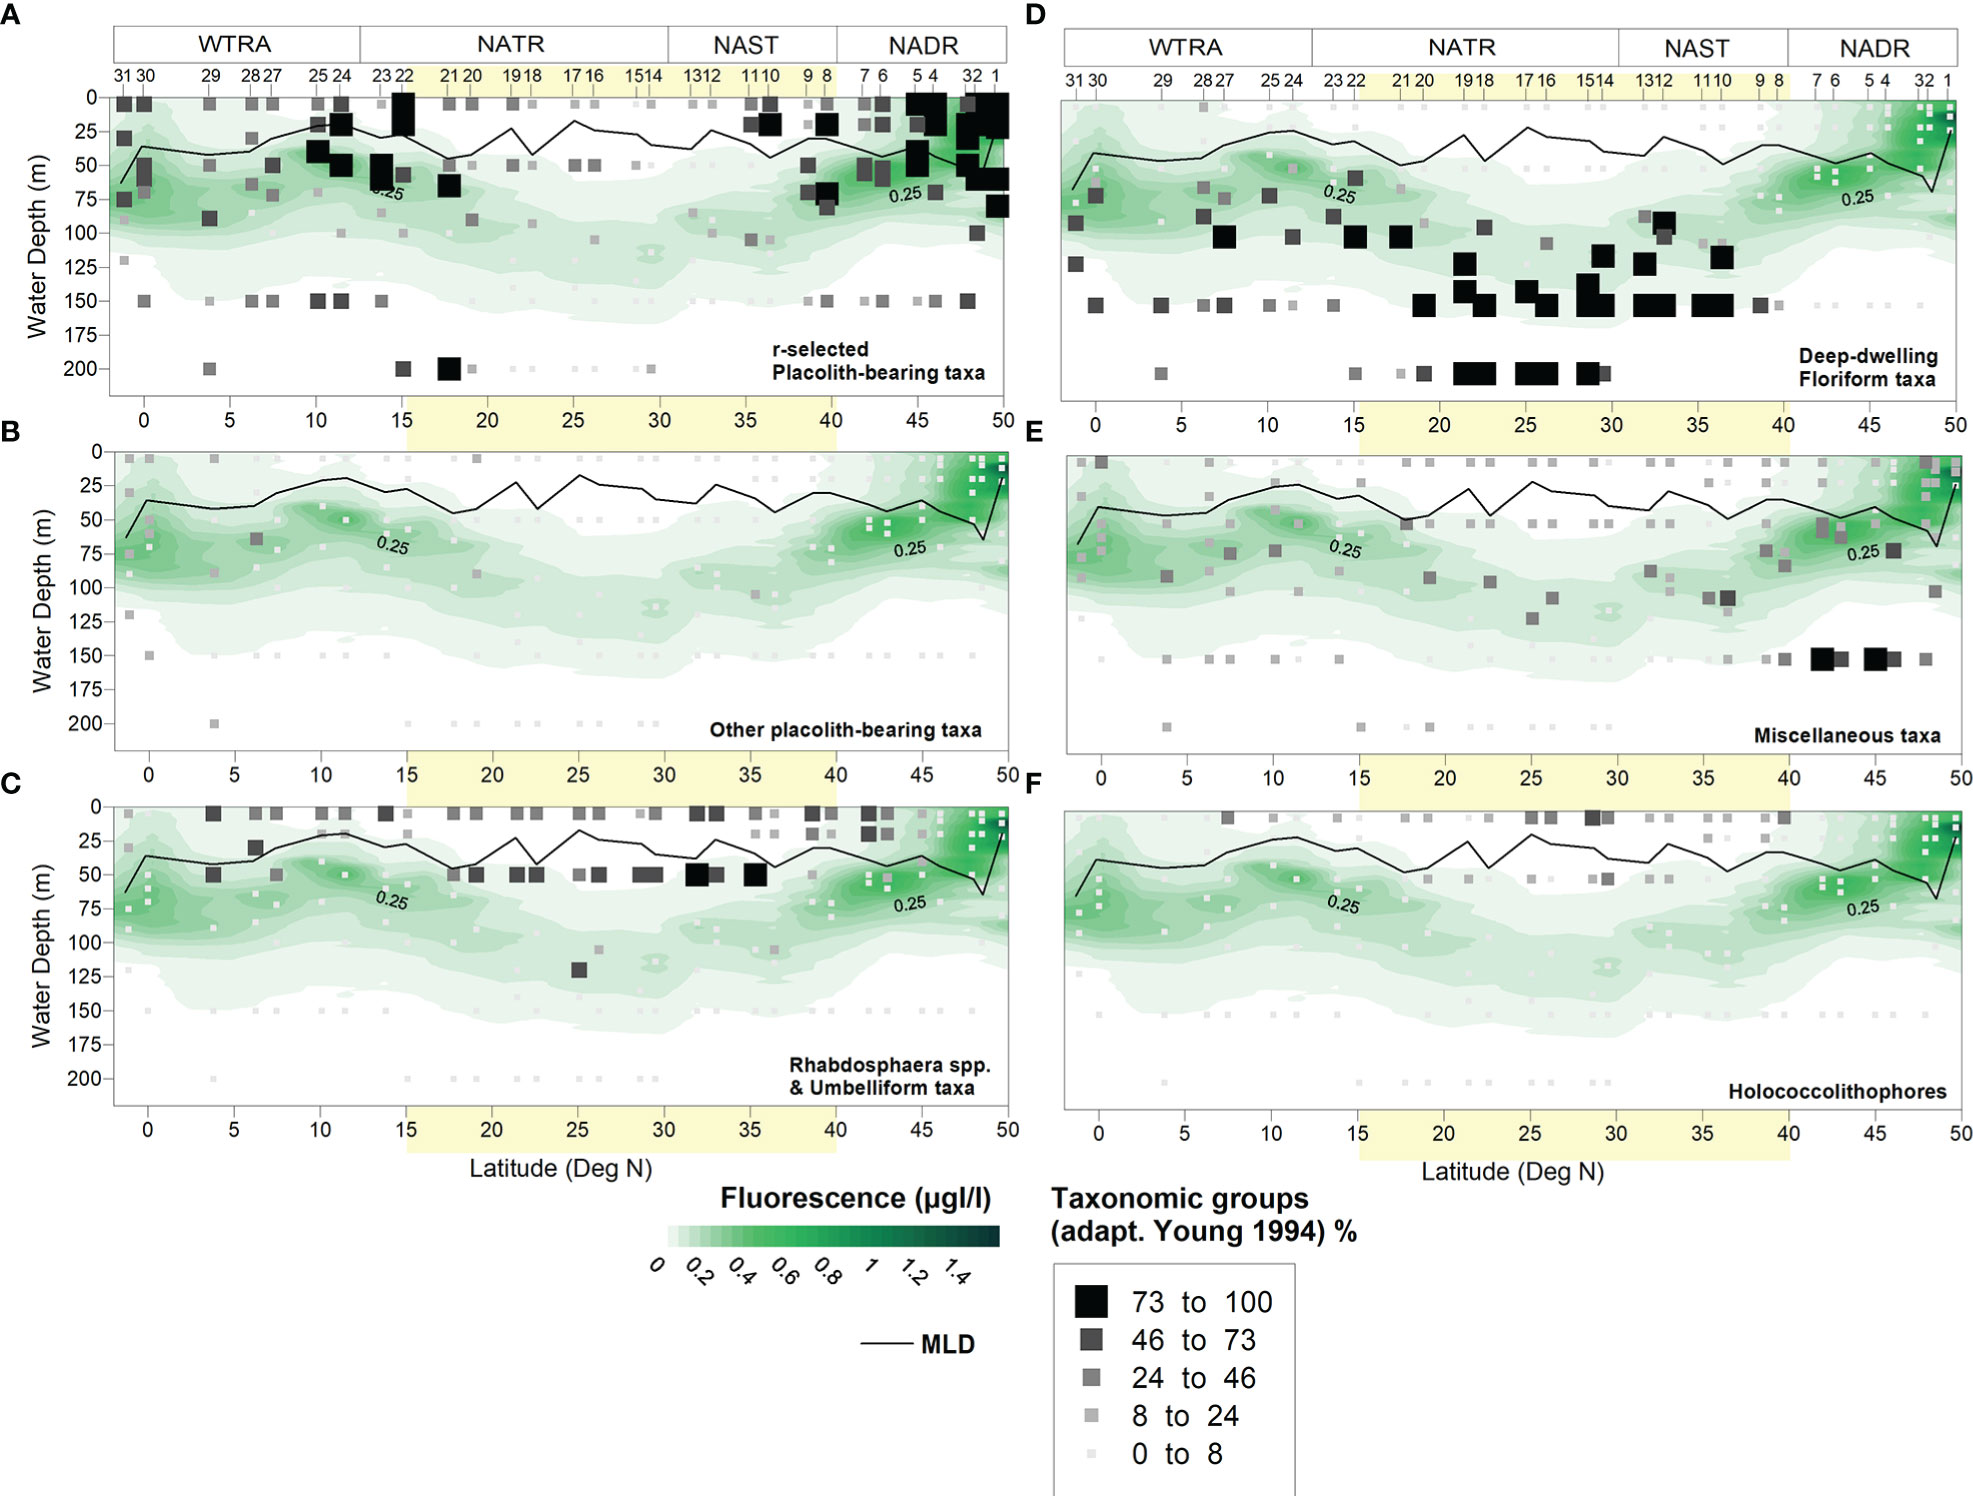
Figure 7 Meridional and vertical distribution of cell concentrations produced by the main coccolithophore taxonomic groups (adapted from Young, 1994) living along the photic zone during across the North Atlantic during AMT28: (A) r-selected placolith-bearing taxa including E. huxleyi, G. oceanica, G. ericsonii, G. muellerae; (B) other placolith-bearing taxa including Umbilicosphaera spp., Oolithotus spp. and C. leptoporus; (C) species within Rhabdosphaera spp. and umbelliform taxa including Umbellosphaera spp. and D. tubifera; (D) deep-dwelling floriform taxa including F. profunda, G. flabellatus and A. robusta; (E) miscellaneous taxa including (ordered from more to less abundant) Syracosphaera spp., Ophiaster spp., S. pulchra, Calciosolenia spp., Helicosphaera spp., Coronosphaera spp., Acanthoica spp., Michaelsarsia spp., R. sessilis, other taxa contributing < 5% to the coccolithophore assemblage, and indetermined taxa; (F) holococcolithophore species. Light-yellow band indicates the approximate location of the North Atlantic Subtropical Gyre at ~15-40° N (Aiken et al., 2017).
G. muellerae was mostly thriving in the NADR, reaching its maximum in the AzC Front region (up to 78% at 71 m of Site 8). G. ericsonii was also abundant across in the AzC Front region (Sites 8–9) but also across the NATR-WTRA transition (up to 68% at 50 m of Site 23). Finally, G. oceanica was the least abundant and most persistently surficial of the gephyrocapsids, with maxima in the NADR (at 47–44°N), in the WTRA (up to 14% at 20 m of Site 25 at 11°N), and to a lesser extent, at the Equator (Figure II - Supplementary Material).
Deep-dwelling floriform taxa were the second most abundant group, usually distributed along- and below the DCM (down to 200 m at 29–22°N), but also occurring at shallower levels (~75–100 m) across the NATR-WTRA transition (Figure 7D). Highest mean percentages occurred in the gyre (28% and 41% in the NAST and NATR, respectively) and in the WTRA (24%), but nearly absent in the NADR. F. profunda was by far the dominant species, reaching up to 99% of the total coccolithophore assemblage at 140 m of Site 17, but also thriving in more productive conditions across the NATR-WTRA transition (Site 22 at 15°N) and at the Equator (Site 30). Albeit less abundant, G. flabellatus and A. robusta showed a similar meridional distribution, except that G. flabellatus was thriving deeper and more restricted to the gyre (Table II and Figure III - Supplementary Material).
The miscellaneous group produced up to 21% mean percentage at the NADR, compared to only 10–15% in the other provinces. These taxa were more abundant in the LPZ of the NADR (> 40° N), reaching up to >76% at 150 m of Sites 5 and 7 (Figure 7E), and showing a broader meridional and vertical distribution range compared to the previous groups. Syracosphaera spp. and S. pulchra were the most abundant taxa, generally thriving in the uppermost 75-80 m depth, but also producing high cell concentrations at more surficial levels within the gyre (Table II and Figure V - Supplementary Material).
Rhabdosphaera and Umbelliform taxa were notably more abundant in the gyre, producing mean percentages of 17–20% in the NAST and NATR compared to only 8% in the NADR and 11% in the WTRA. These taxa were consistently more abundant above the DCM (i.e., uppermost 50 m), coinciding with the gyre surface regions of lowest Chl-fluorescence and highest H’(exp). Increases in their abundance also occurred in the ITCZ-influenced stratified region (~7–6°N, Sites 27–28) (Figure 7C). Umbellosphaera spp. were dominant, presenting a broad distribution along 45–5°N, while Discosphaera tubifera was more restricted to the gyre (Table II and Figure IV - Supplementary Material).
Like the umbelliform taxa, holococcolithophores were also more abundant in the uppermost 25-50 m of the gyre, contributing mean percentages of 6% at NAST and NATR, compared to < 3% in the other provinces (Figure 7F and Table II - Supplementary Material). Given the reportedly higher susceptibility of holococcoliths to dissolution (Kleijne, 1991; Cros, 2001), their high abundance and diversity testify upon the quality of our samples in terms of coccolith-carbonate preservation and related freshness of the assemblages.
Finally, the other placolith-bearing taxa comprised the least abundant group along the transect. Highest mean percentages of 6% occurred in the WTRA, compared to only 0-2% in the other provinces, and more abundant in the DCM underneath the highly stratified equatorial North Atlantic (up to 11% at 64 m of Site 28, at 6°N) (Figure 7B). Umbilicosphaera spp. and Oolitothus spp. were more abundant to the south of 25°N, while Calcidiscus leptoporus was more broadly distributed to the south of 40°N. None of these species showed a specific vertical distribution (Table II and Figure VI - Supplementary Material).
4.6 Phytoplankton pigments meridional distribution
TChl-a concentrations presented low values in all stations, both in surface and DCM, except for the northern station at 49°, where it reached (2.85 μg/L). As for Chla-fluorescence, measured across the entire photic zone, values at the DCM were generally higher compared to the surface; minimum values were found in the gyre region. (Figure 8A). Of the five pigment/TChl-a ratios used as proxies for the phytoplankton groups, cyanobacteria s.l. (Zea) were the highest across the transect, followed by coccolithophores (HexFuco), dinoflagellates (Perid), and finally diatoms (Fuco).
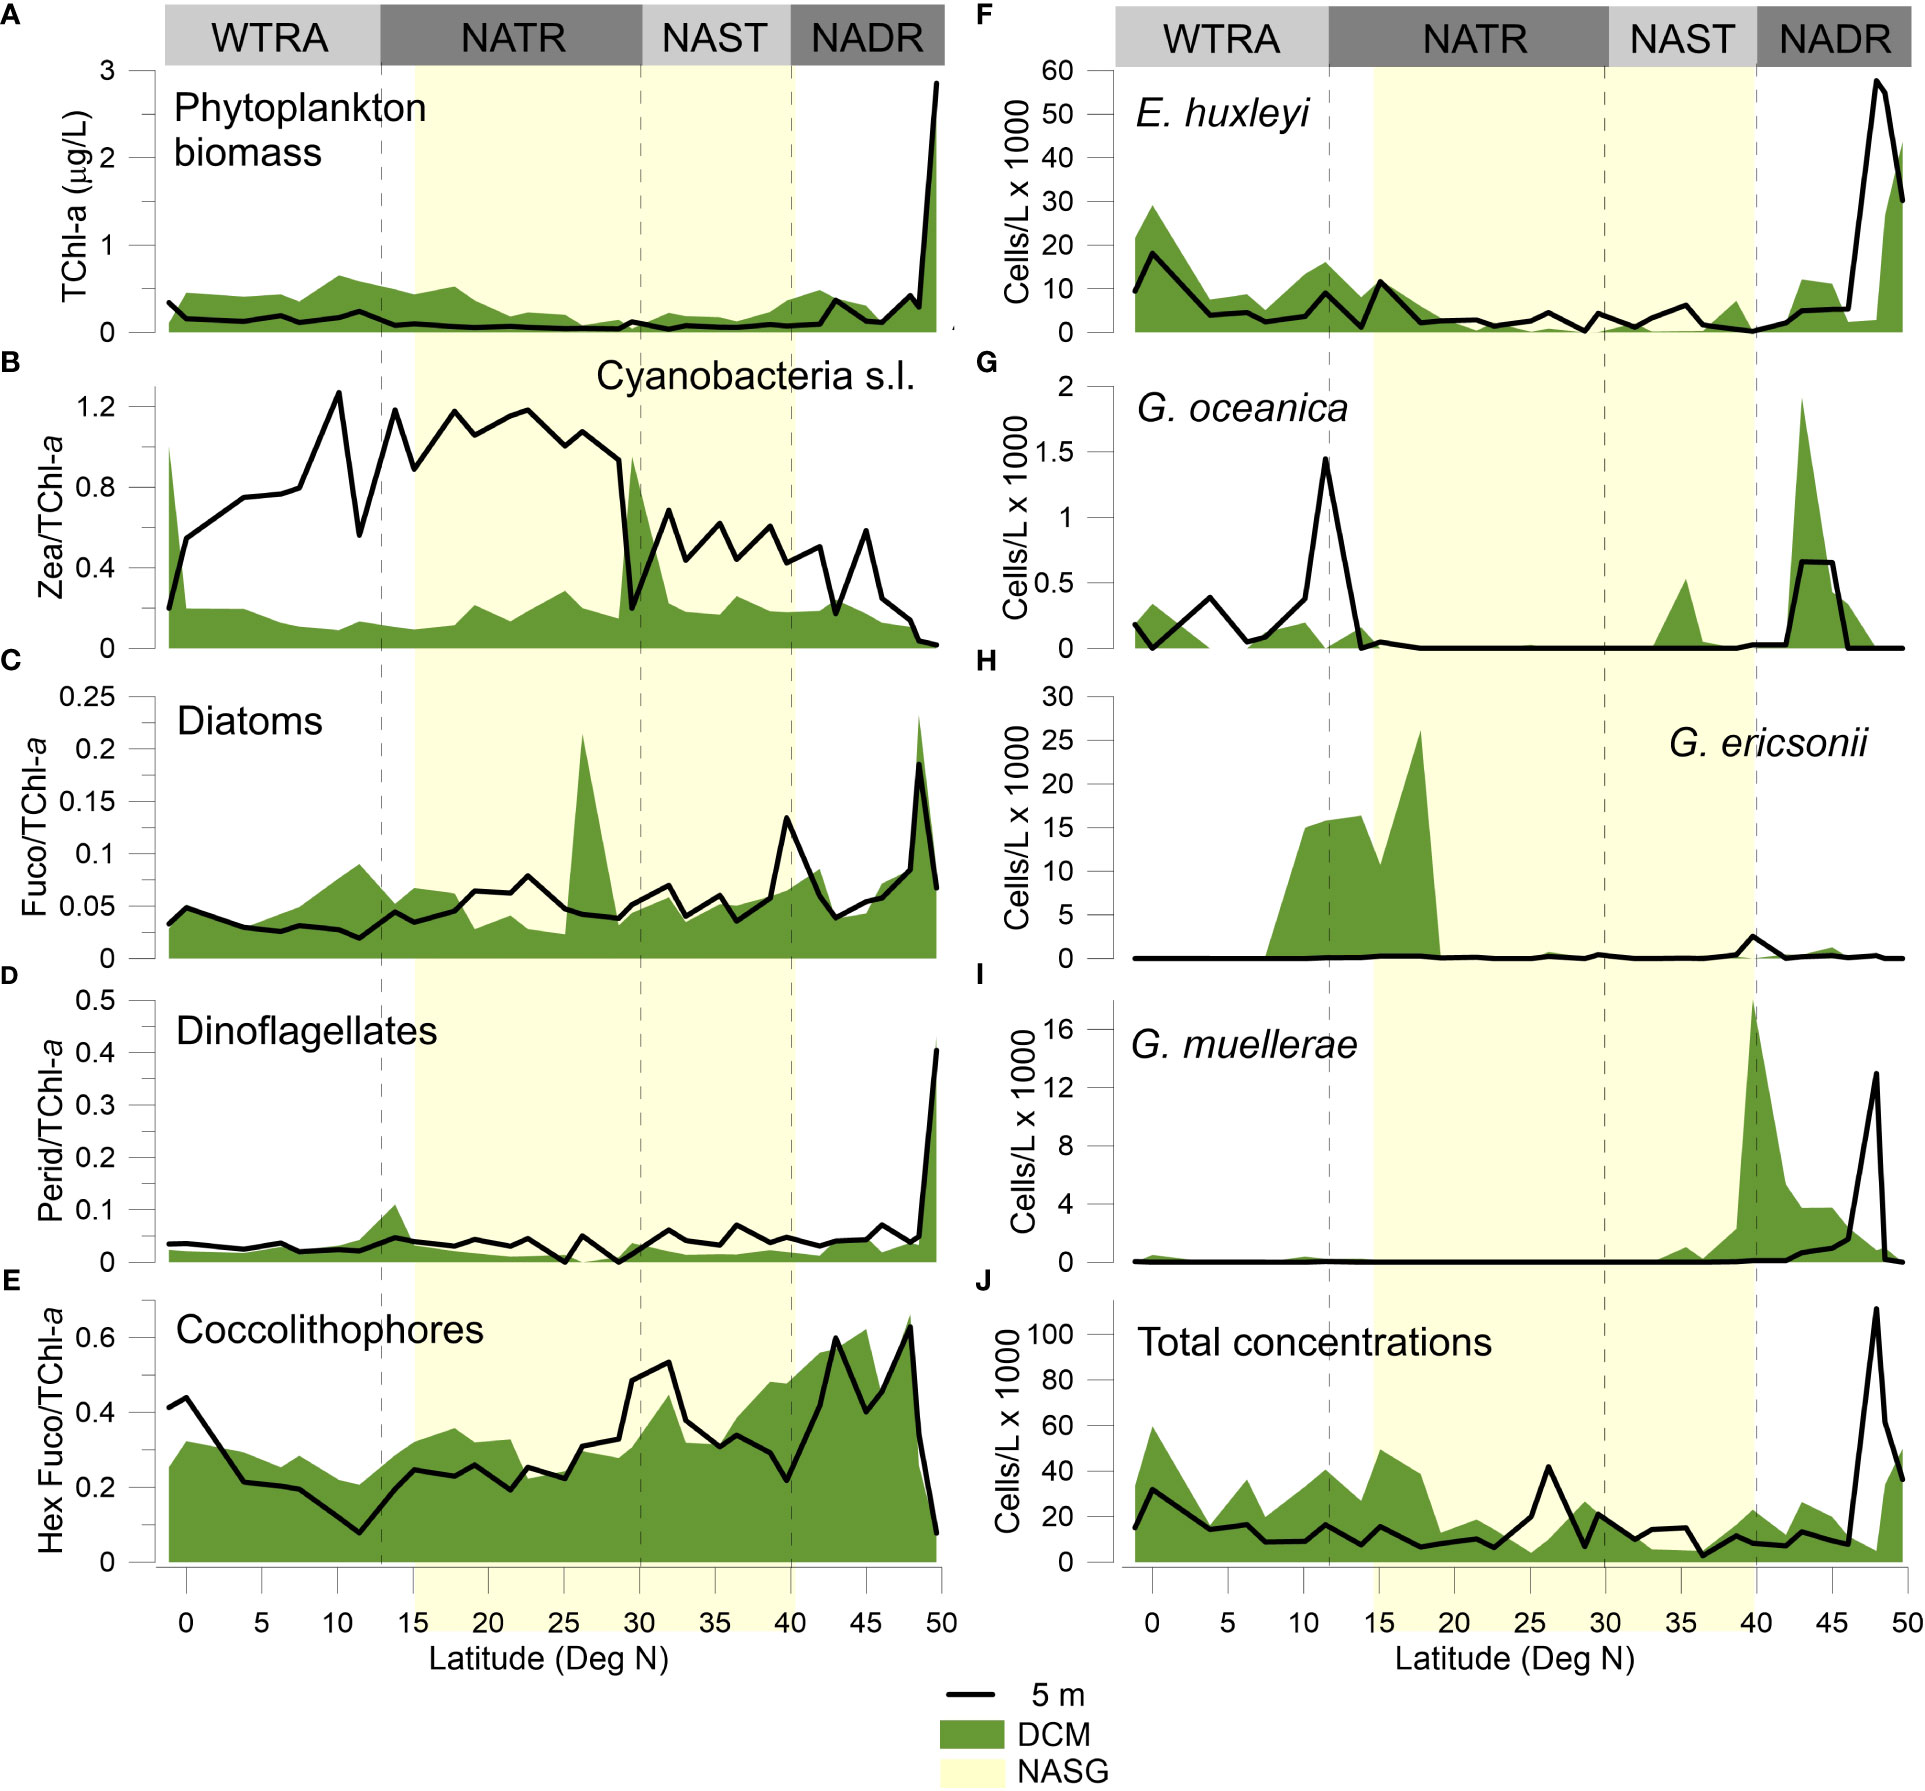
Figure 8 Meridional distribution of pigment-derived phytoplankton biomass and species groups measured at the surface and DCM: (A) TChl-a concentrations, (B) cyanobacteria s.l. (Zea/TChl-a), (C) diatoms (Fuco/TChl-a), (D) dinoflagellates (Perid/TChl-a), and (E) coccolithophores (HexFuco/TChl-a); and of (F) E. huxleyi, (G) G. oceanica, (H) G. ericsonii, (I) G. muellerae, and (J) total coccolithophore cell densities.
Cyanobacteria s.l. were most abundant at the surface along 30–5°N, but also peaking at the DCM in the gyre and near the Equator (Sites 14 and 31) (Figure 8B). Diatoms were more abundant in the NADR, both at the surface and DCM, with sporadic increases at the surface across the NADR-NAST transition (39°N, Site 8) and NATR (25–20°N); and at the DCM in the gyre central region and, to a lesser extent, across the NATR–WTRA transition (Figure 8C). Dinoflagellates strikingly peaked at the northernmost end of transect, both at the surface and DCM (Site 1 at 49°N), and slightly increased across the NATR-WTRA transition (Figure 8D). Finally, pigment-inferred coccolithophores biomass revealed similar range of values and meridional distributions at the surface and DCM, albeit more variable at the surface. HexFuco/TChl-a ratios were highest in NADR and northern part of NAST, occasionally increasing at ~30°N, at ~15°N, and at the Equator (Figure 8E). These findings are further exploited and discussed in Brotas et al. (this special issue).
The meridional distribution of HexFuco concentrations had a similar pattern to that of the mean cells abundances of placolith-bearing r-selected species, i.e., in the NADR, and to the south of 20°N, as shown in Figure 9. Lowest HexFuco concentrations in the gyre coincided with communities dominated by umbelliform and holococcolithophore taxa in the UPZ, and by floriform taxa in the LPZ. Similarly, coccolithophore cell densities and HexFuco/TChl-a ratios nicely and substantially co-increased at the surface of Sites 3 and 30, where E. huxleyi had maxima along the transect (Figures 8E, F, J). Both HexFuco and HexFuco/TChl-a increased along 21-10°N, roughly coinciding the increase of r-selected placolith-bearing taxa off NW Africa (Figures 8, 9).
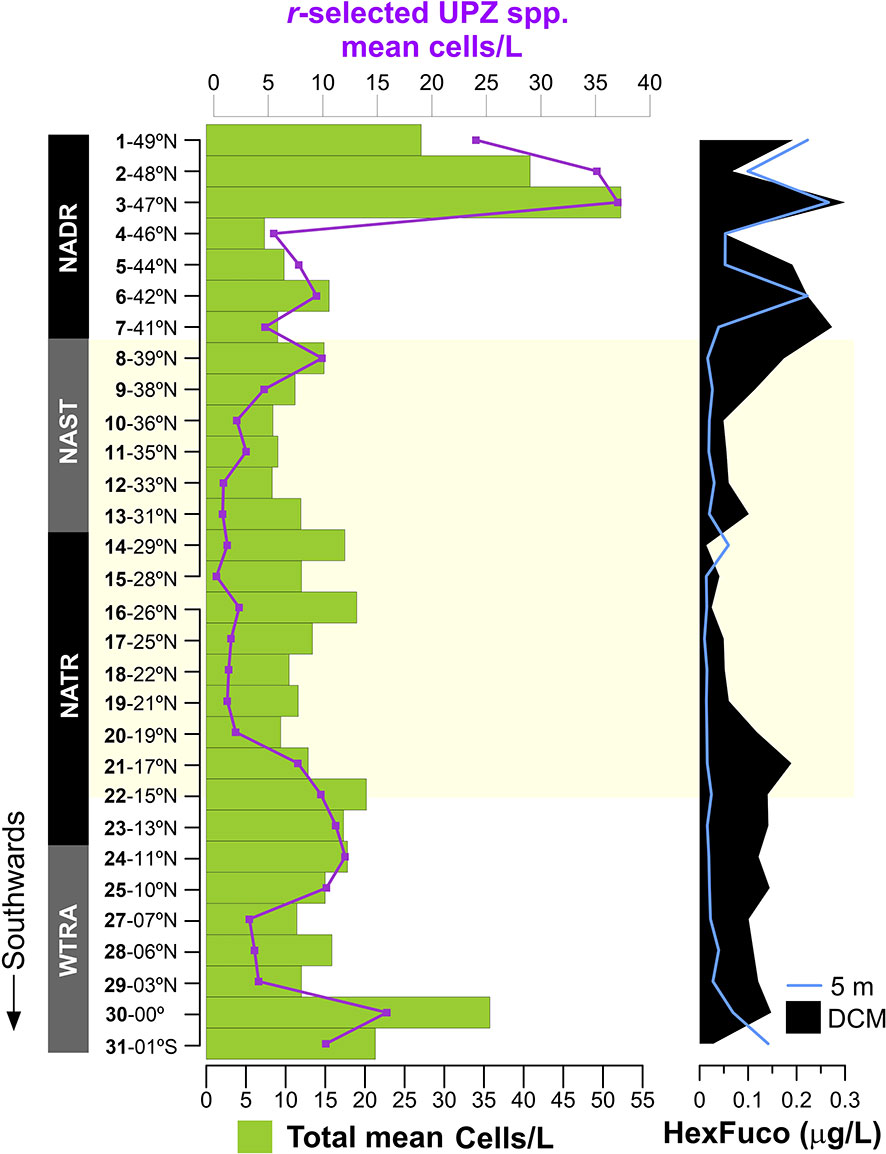
Figure 9 Meridional distribution of coccolithophore mean concentrations (cells/L) in the photic zone (green bars – total; purple line – r-selected UPZ species), and of 19’-Hexanoyloxyfucoxanthin concentration (HexFuco; µg/L) at the surface and DCM.
5 Discussion
Ecologically-relevant morphological differences among coccolithophore species at the ends of the ecological succession spectrum (e.g., r–K differentiation, Brand, 1994; Young, 1994; Balch, 2004) have long been considered to reflect evolutionary ecological adaptations to a broad range of environmental niches in the global ocean. This concept of morphologically distinct coccolithophore assemblages having different biogeographic distributions (Winter et al., 1994; Young, 1994) is well illustrated in our AMT28 data and is closely linked to large-scale hydrographic and atmospheric forcing across the North- and Equatorial Atlantic, as discussed in the following sections.
5.1 North Atlantic coccolithophore communities during boreal Autumn 2018
5.1.1 North Atlantic Drift Province
The NADR (60–40°N) was the province of highest production of coccolithophores and Chl-a, related to the dominance of more opportunistic species in more dynamic and seasonally nutrient-enriched mixed layer conditions, typical of high latitude regions. This is evidenced by the shallowest DCM (up to 12–30 m) and the highest UPZ/LPZ ratio across the transect (Figures 6A, B), reflecting a 77% of cells production contributed by r-selected placolith-bearing species (Table II – Supplementary Material). Higher productivity in colder and with deeper mixed layer conditions coupled to the windier atmospheric conditions at > 40°N (Figures 2A, C, D, 4C–E) reflects the role of the westerlies in inducing seasonal nutrient-enrichments through the mixing and cooling of the upper ocean. Given the shallow location of Sites 1 and 2 (sampled at 87 m and 147 bottom depths, respectively – Figure 1), high nutrient concentrations and enhanced productivity in this area were probably also related to intensified coastal-neritic oceanographic processes, including upwelling and lateral advection of nutrient-rich waters. Although the NADR featured the deepest MLDs during the expedition, it was only down to a maximum of 62 m (at Site 2) compared to the anomalous mixed layer deepening reported earlier by Longhurst (2007) (down to 300 m during autumn and winter). Therefore, the combination of moderate MLDs, nutrient-enrichment and favorable PAR levels in the NADR (Figures 4D, E, 10E, F) induced favorable conditions for coccolithophores to reach their highest productivity during the boreal autumn in this area. Highest proportion of pigments associated with diatoms and dinoflagellates in the northernmost part of the NADR (Figures 8C, D) is in line with AMT pigment studies from previous years (Brotas et al., 2022), and earlier descriptions of NADR as the region of highest productivity by all eukaryotic phytoplankton (Tarran et al., 2006). Our data confirm existing notions of larger cell-sized microphytoplankton being dominant at higher latitude regions (e.g., Marañón et al., 2000; Marañón et al., 2001; Marañón et al., 2003; Brotas et al., 2022), with which r-selected coccolithophores species are more likely to compete, reflecting their ability to thrive in light-nutrient conditions that are favourable for rapid population growth (e.g., Winter et al., 1994; Young, 1994; Baumann et al., 2000; Guerreiro et al., 2013; Poulton et al., 2017). This probably contributed to the high levels of oxygen concentrations found near the surface in this region (Figure 3D), in line with existing understanding on the importance of marine phytoplankton for oxygen production. The deepening of the MLD and the drop of PAR from Site 3 to Site 4 (Figure 10), in parallel with a drastic decrease in cell concentrations, Chl-a and pigments produced by microphytoplankton (Figure 8), suggests less favorable conditions for growth at these latitudes compared to further northeast.
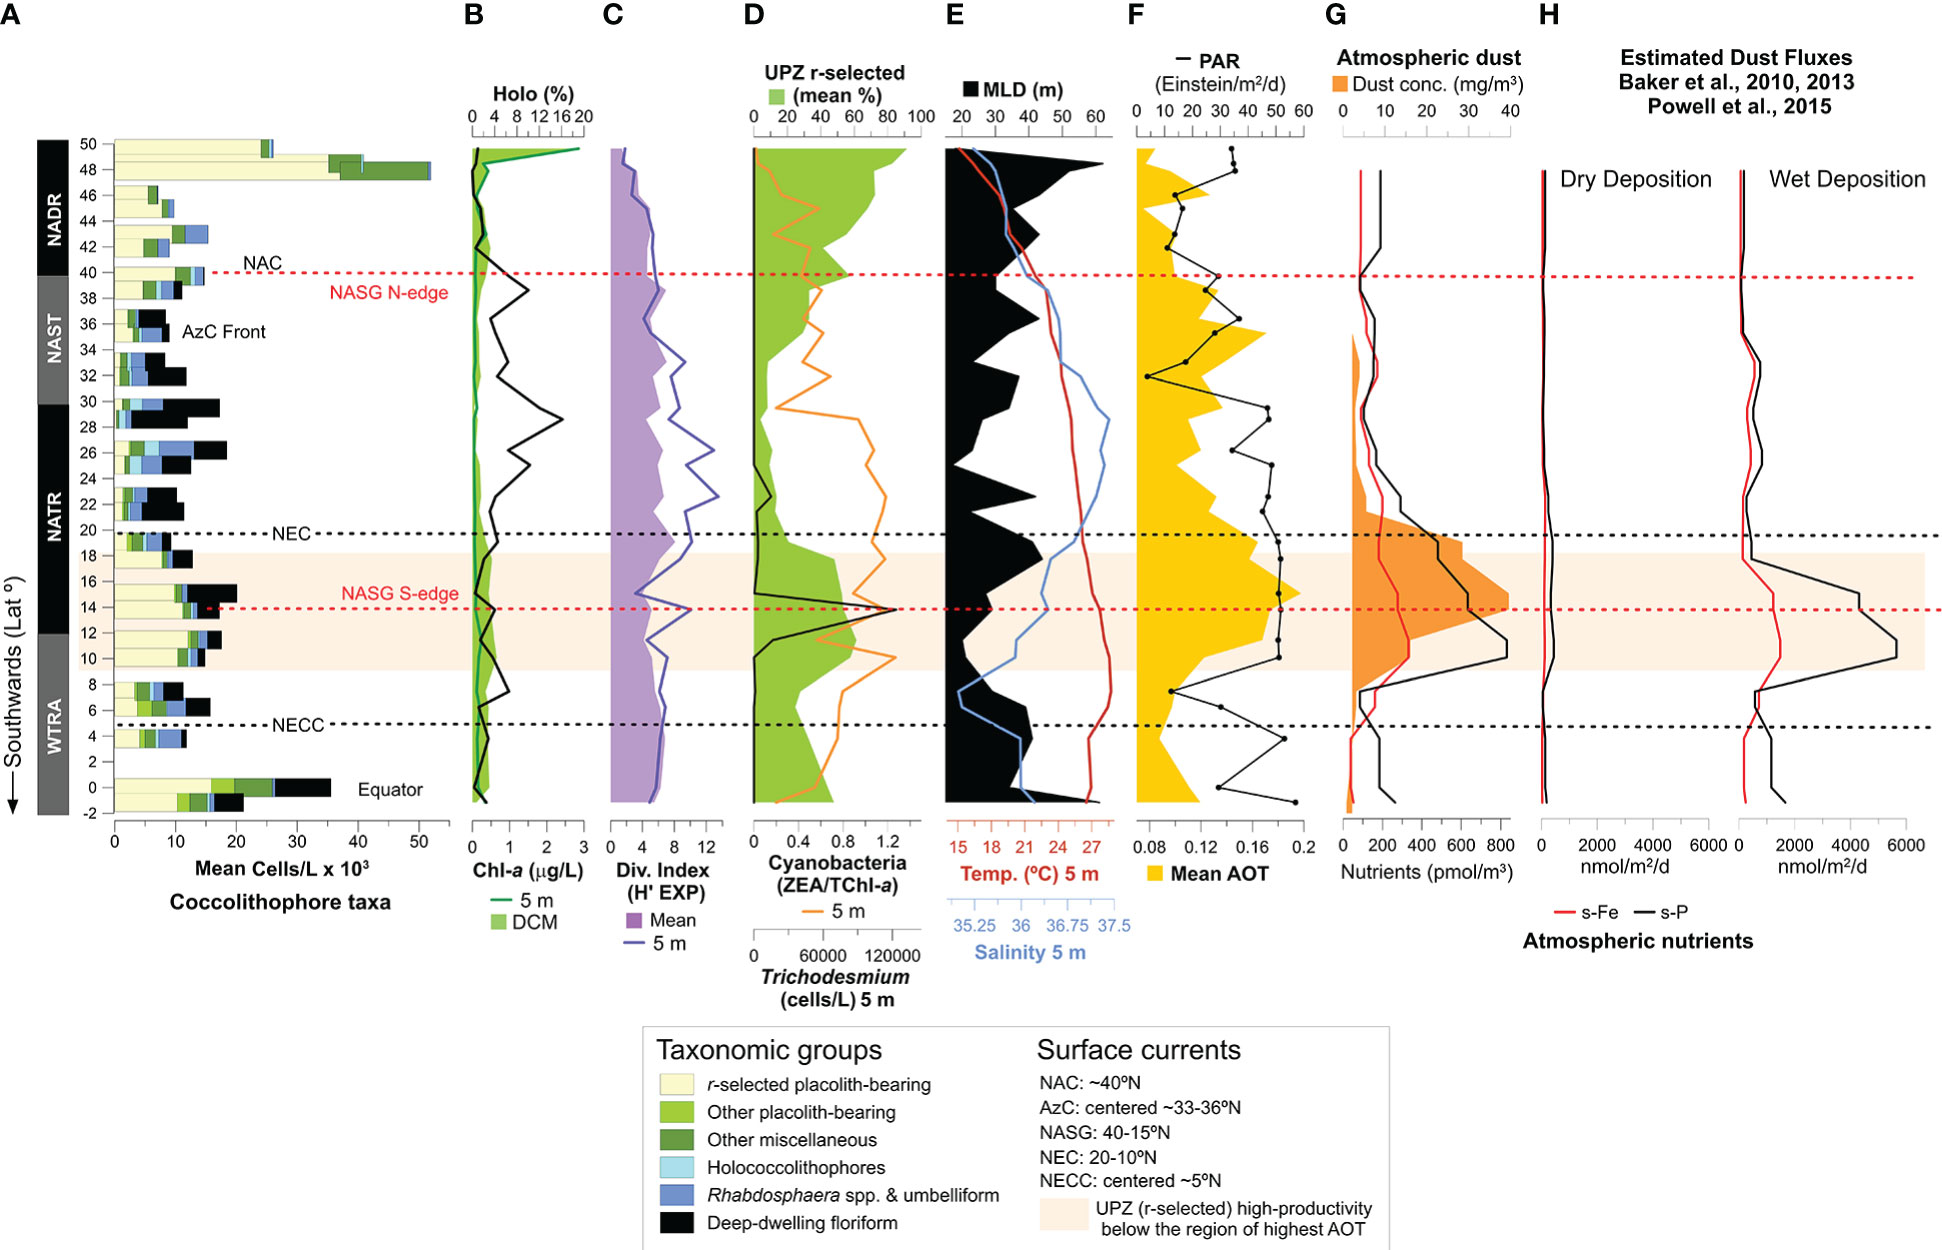
Figure 10 Meridional distribution of coccolithophore communities in relation to other phytoplankton groups and hydrological and atmospheric conditions: (A) mean cell concentrations of the main coccolithophore taxonomic groups determined from each site (adapted from Young, 1994); (B) holococcolithophore mean percentages (black line) and Chl-a concentration measured at the surface (light green) and DCM (dark green); (C) Shannon-Weaver diversity index (exp), averaged to the photic zone (light purple) and at the surface (dark purple); (D) mean percentages of by r-selected placolith-bearing coccolithophores (green), cell concentrations of N2-fixing Trichodesmium sp. at the surface (black line), and pigment-derived cyanobacteria s.l. (i.e., zea/TChl-a); (E) mixed layer depth (MLD – black), temperature (red line) and salinity (blue) at the surface; (F) photosynthetically available radiation (PAR – black line), and aerosol optical thickness (AOT – orange); (G) concentrations of dust (dark orange) and of atmospheric soluble Fe (red) and soluble P (black); (H) estimated fluxes of dry- and wet dust deposition, calculated according to Baker et al. (2010, 2013) and Powell et al. (2015). NAC=North Atlantic Current, AzC=Azores Current; NASG=North Atlantic Subtropical Gyre, NEC=North Equatorial Current, NECC=North Equatorial Counter-Current. Concerning the taxonomic groups, r-selected placolith-bearing taxa include E. huxleyi, G. oceanica, G. ericsonii, G. muellerae; other placolith-bearing taxa include C. leptoporus, Oolithotus spp. and Umbilicosphaera spp.; Umbelliform taxa include Umbellosphaera spp. and D. tubifera; deep-dwelling floriform taxa include F. profunda, G. flabellatus and A. robusta; miscellaneous taxa include R. sessilis, Calciosolenia spp., Acanthoica spp., Ophiaster spp., Michaelsarsia spp., Syracosphaera spp., S. pulchra, Coronosphaera spp., Helicosphaera spp. and other taxa with abundances < 5%. Orange band indicates the region of highest dust deposition during AMT28 (along ~18–10°N).
Our data support the notion of species producing robust and interlocking coccospheres made up of disc-shaped “placolith” coccoliths, and usually having higher cell division rates, as being faster at exploiting intermittent nutrient input in dynamic environments (Winter et al., 1994; Young, 1994). This is especially the case of E. huxleyi which was by far the most productive species in the NADR (Figure I - Supplementary Material), in line with its recognized capacity of growing rapidly in more dynamic mixed layer conditions (e.g., Andruleit and Rogalla, 2002; Sprengel et al., 2002; Andruleit, 2007; Guerreiro et al., 2013), and the most common bloom-forming coccolithophore in at higher latitudes (e.g., Holligan et al., 1993). Of the gephyrocapsid species, G. muellerae was the most abundant and geographically more restricted to the NADR, in line with previous studies describing it as a cold-water species that often dominates Gephyrocapsa assemblages in temperate latitude regions (Boeckel and Baumann, 2008; Guerreiro et al., 2013).
5.1.2 North Atlantic Subtropical Gyre Province
Towards the NAST (40–30°N), the gradual deepening of the nutricline and DCM induced a decrease of TChl-a, UPZ/LPZ ratios and of the total coccolithophore concentrations at the surface, in parallel with an increasingly diverse coccolithophore assemblage (Figures 4E, 6A, B, 10). Despite the westerly winds influencing this region, the weaker intensity at these latitudes resulted in shallower MLDs and, subsequently lower phytoplankton productivity (Longhurst, 2007; Aiken et al., 2017). Coccolithophore assemblages showed more marked vertical ecological gradients in this province, likely in response to the progressively higher thermal stratification towards the center of the gyre. Increasingly more abundant light-dependent Rhabdosphaera spp., umbelliform taxa and holococcolithophores in the UPZ, and nutrient-dependent floriform taxa along and below the DCM (Figures 7C, D) reflected such enhanced vertical niche partitioning in the gyre. The transition towards a more oligotrophic setting was also evidenced from a decrease in pigments produced by microphytoplankton, and concurrent increasing proportions of pigments by picophytoplankton (i.e., cyanobacteria s.l.) (Figure 8), in line with previous studies (Marañón et al., 2000; Marañón et al., 2001; Marañón et al., 2003; Tarran et al., 2006; Brotas et al., 2022).
Enhanced UPZ/LPZ ratios at 39–38°N (Sites 8–9), to which r-selected gephyrocapsid species largely contributed (Figures 6B, 7A; Figure II - Supplementary Material), are likely linked to the AzC Front. This is a region of reportedly locally enhanced productivity, to which enhanced vorticity driven by mesoscale eddies formed from the Gulf Stream and along the NAC is thought to contribute (Frazão et al., 2022 and refs. therein). G. muellerae was the most abundant r-selected species in this region, reaching up to 69% at Site 8 (20 m) (Figure II - Supplementary Material), suggesting a preference for more moderately nutritious transitional conditions where competition with E. huxleyi is lower (e.g., Giraudeau and Bayley, 1995; Boeckel et al., 2006; Guerreiro et al., 2013).
5.1.3 North Atlantic Tropical Gyre Province
The entire section that includes the southern part of the NAST and most of the NATR (30–12°N) was the region of lowest Chl-a concentrations, coccolithophore concentrations and UPZ/LPZ ratios at the surface, while the coccolithophore species diversity was highest (Figure 6). Our data are consistent with the uniformly oligotrophic and seasonally invariable mixed layer conditions described for “Typical Tropical Profile” settings (Aiken et al., 2017; Longhurst, 2007). Surface phytoplankton assemblages were similar to those of the southern NAST, i.e., dominated by cyanobacteria s.l., Rhabdosphaera spp., umbelliform species and holococcolithophores (Figures 7C, F, 8). Cyanobacteria in this region were mostly dominated by picoplankton as evidenced by cell counts obtained by flow cytometry and from microscope analysis (data not shown; see Brotas et al. this issue). This reflects the capacity of pico- and K-selected nannoplankton species to thrive in heavily stratified, well-illuminated and oligotrophic conditions, typical of the gyre (e.g., Marañón et al., 2000; Marañón et al., 2001; Marañón et al., 2003; Tarran et al., 2006; Brotas et al., 2022). Floriform taxa living along and below the DCM (down to a maximum of 135-200 m Site 15) were the dominant species within the coccolithophore community in this province (Figure 7D), confirming their ability to grow under the nutrient-enriched and low light conditions of the deep euphotic and subeuphotic zones of the ocean (Winter et al., 1994; Young, 1994; Poulton et al., 2017; Balch et al., 2019) (discussed in section 5.2).
The increase of more opportunistic coccolithophores and of pigment markers of microphytoplankton towards the gyre’s southern edge indicates a change towards more nutritious ocean conditions across the NATR–WTRA transition (Figures 7A, 8, 10). Locally enhanced productivity in the heavily stratified uppermost 20 m in this area appeared decoupled from productivity in the shallow DCM (40–50 m) underneath (Figures 3A, C, 4E), possibly reflecting the effects from distinct environmental drivers (discussed in section 5.4).
5.1.4 Western tropical Atlantic Province
The WTRA (12/14°N–5°S) was marked by a shallower DCM and nutricline (Figure 4E), and by less striking vertical ecological gradients compared to the gyre. Umbelliform and floriform species were inhabiting the regions of stronger stratification, while placolith-bearing species were more abundant in locally nutrient-enriched conditions at the Equator (Figures 7, 10), consistent with Poulton et al. (2017).
Enhanced SiO2 concentrations along the ITCZ-influenced region (Figure IV - Supplementary Material) were possibly linked to the warm water lens of low SSS and high Chl-a that was extending from the Amazon and Orinoco River mouths across the tropical North Atlantic (Figures 2A–C). Indeed, enhanced Chl-a production related to seasonal changes in the NEC and to nutrient-enriched Amazon and Orinoco water inflow into the eastward-flowing NECC have been previously reported (Longhurst, 1993; Signorini et al., 1999; Aiken et al., 2000; Signorini et al., 2015; Guerreiro et al., 2017). However, our in situ observations of low pigment-derived diatoms and dinoflagellates (Figures 8C, D), and the markedly oligotrophic coccolithophore signature along the NECC/ITCZ region (i.e., increase of umbelliform species at the surface; Figure 7C) point otherwise. This is in line with the generally oligotrophic conditions in the WTRA north of the Equator reported by Aiken et al. (2017). While the Amazon River plume has been recognized to fuel phytoplankton in the western tropical North Atlantic, including r-selected coccolithophores (Guerreiro et al., 2017; Korte et al., 2020), the low salinity plume was largely nutrient-depleted and unfavorable to clades of high nutrient requiring coccolithophore groups at the positions sampled during this study.
At the Equator, the shoaling of the DCM up to 60 m and the increase of the UPZ/LPZ ratios and of coccolithophore concentrations along the uppermost 75–100 m (Figures 6A, B) suggest the transition towards more nutritious conditions related to equatorial upwelling. The observed deepening of the MLD in the colder and denser surface waters in this area (Figures 3, 4C) supports a scenario of phytoplankton growth at the expense of nutrients supplied by enhanced vertical mixing driven by divergent upwelling. While lower coccolithophore production and diversity have been reported from equatorial divergence regions (O’Brien et al., 2016; Balch et al., 2019), the Equator was the second most productive region across the transect, with several taxa with distinct ecological preferences increased in this area. Despite the lower H’ (exp) at the surface compared to the heavily stratified gyre, both regions revealed similar H’(exp) averaged for the entire photic zone. This reflects the significant contribution by both r-selected species E. huxleyi and G. oceanica, but also by other placolith-bearing taxa, as well as deep-dwelling floriform species, and several taxa within the miscellaneous group (Figure V - Supplementary Material). Our data are consistent with Kinkel et al. (2000) who also reported enhanced coccolithophore productivity in the equatorial upwelling area, dominated by E. huxleyi. Our data suggest that coccolithophores with variable nutrient-requirements were being stimulated along the photic zone and/or that upwelling-related enhanced vertical mixing was weakening the vertical ecological partitioning in this area. While Chl-a concentrations were not high at the Equator during AMT28, coccolithophores are likely to have significantly contributed to phytoplankton biomass in this region, together with cyanobacteria s.l. (Figure 8) which were dominated by picoplankton (data not shown; see Brotas et al. this issue). Although seasonal changes in coccolithophore species composition across the North Atlantic have been reported to be stronger compared to inter-annual differences (Poulton et al., 2017 and refs. therein), differences between our observations and those of Balch et al. (2019) may reflect some degree of interannual variability in the equatorial upwelling region.
5.2 On the resilience of subtropical gyre coccolithophore communities
Highest coccolithophore species richness and diversity along the uppermost ~50 m of the gyre (comprising the NAST and the NATR) (Figures 6C), the region of highest environmental stability and stronger vertical ecological gradients across the transect, are in line with previous plankton studies (Winter et al., 1994; Cermeño et al., 2008; Charalampopoulou et al., 2011; O’Brien et al., 2016; Poulton et al., 2017). The negative relationship between species diversity and Chl-a in the oligotrophic and picoplankton cyanobacteria-enriched surface gyre region (Figure 8) probably reflects the greater ability of more coccolithophore species to successfully compete in regions where faster-growing microphytoplankton and r-selected coccolithophores are less abundant. O’Brien et al. (2016) reports this pattern to occur on a global scale, with several species having a more even biomass distribution and contributing more to the total phytoplankton community at low latitudes, to which light and temperature are suggested as the most important drivers. Poulton et al. (2017) highlights the combination of nutrient limitation and enhanced vertical ecological niche partitioning as crucially favouring coccolithophore diversity in the gyre compared to higher latitude regions. This pattern is also described for non-calcifying haptophytes (Liu et al., 2009), as well as other calcifying planktonic phyla (e.g., foraminifera) (Rutherford et al., 1999; Dolan et al., 2006), reportedly crucial for maintaining the ecosystem functioning and linked biogeochemical processes (Caron and Countway, 2009).
Highest abundances and diversity of holococcolithophores at the surface of the gyre confirm their K-selected ecological affinity (e.g., Kleijne, 1991; Kleijne, 1993; Houdan et al., 2006; Dimiza et al., 2008; Cros and Estrada, 2013; Godrijan et al., 2018). Our data support existing notions of coccolithophores’ heteromorphic life cycle (alternating between diploid and often non-mobile, i.e., without flagellates, to haploid mobile and flagellate) enhancing their ability of exploiting extreme ranges of light and nutrient ocean conditions. On one hand, the presence of flagella in holococcolithophores prevents the cell from sinking out of the photic zone within heavily stratified ocean conditions (Houdan et al., 2006). In addition, holococcoliths have a higher capacity to reflect UV light while minimizing the loss of photosynthetically active light, thereby protecting the cell from photodamage under the high surface light levels in the gyre (Monteiro et al., 2016 and refs. therein).
Umbelliform K-selected species also have lower nutrient requirements, as well as slower cell division rates, compared to r-selected coccolithophores. Their ability to produce large, low-density coccospheres around smaller organic cells is also thought to increase their resilience to the stable but difficult gyre conditions (Young, 1994). Several species reportedly form double-layered coccospheres, with which they trap a layer of seawater, thereby enhancing chemical buffering and nutrient absorption in highly oligotrophic conditions (Young, 1994). D. tubifera was particularly restricted to the UPZ in gyre region, suggesting a lower tolerance for colder and more dynamic mixed layer conditions compared to the more broadly distributed Umbellosphaera spp. and Rhabdosphaera spp. (Figure IV – Supplementary Material).
The gyre was also the region where floriform taxa reached their highest cell concentrations in the deep euphotic and subeuphotic zones of the ocean, down to 200 m at Sites 15–17 (Figure 7D), in line with previous studies (e.g., Poulton et al. (2017). These taxa typically produce small to medium size coccospheres built of distinctive blade-like coccoliths which, in the case of F. profunda, are organized in a “radar dish” coccosphere architecture. The latter is thought to funnel photons into the cell towards increasing light availability onto the chloroplasts to improve photosynthesis at very low light conditions (Young, 1994; Monteiro et al., 2016 and refs. therein). The absence of floriform species in the colder and more dynamic mixed layer conditions of the NADR reflects their dependency on thermal stratification and water column stability for light to penetrate deeper into the lower photic zone (e.g., Young, 1994; Aiken et al., 2017). G. flabellatus was the most meridionally confined to the gyre region and the most productive at greater depths, suggesting that F. profunda and A. robusta are comparably “ecologically broader”. Nevertheless, the observation that all three deep-dwelling species also increased at up to ~60 m in the Equator (Figure III – Supplementary Material) suggests a certain capacity to withstand some degree of turbulence and/or competition with other species in more mixed conditions.
In addition to the morphological/physiological advantages referred above, gyre coccolithophore communities are also likely to overcome the extreme vertical light/nutrient ranges in this stratified region through displaying nutritional strategies other than photosynthesis. Poulton et al. (2017) have argued that deep-dwelling coccolithophores probably present mixotrophy (i.e., physiological ability of combining autotrophy and heterotrophy – osmotrophy and/or phagotrophy), given that light conditions at <1% surface irradiance in the photic zone are not sufficient to support photosynthesis. They further hypothesize that mixotrophy may also be useful for umbelliform species living at the surface, where nutrient-depletion limits their growth. These hypotheses are supported by the very high coccolith export production by F. profunda and G. flabellatus in the western tropical North Atlantic, as reported from a recent transatlantic sediment trap study by Guerreiro et al. (2019). According to these authors, the two species contributed up to 3–5 times higher coccolith fluxes in this heavily and permanently stratified region compared to the easternmost traps, where the nutricline was geostrophically shoaled and ocean conditions are influenced by the Canary Current upwelling system (Guerreiro et al., 2019 and refs. therein). This testifies to the capacity of floriform taxa being highly productive in the LPZ of heavily stratified ocean conditions, typical of tropical and subtropical open ocean settings.
Additional arguments favoring mixotrophy as an alternative nutritional strategy in coccolithophores include the potential function of the haptonema (flagella) as a food gathering organelle (Billard and Inouye, 2004), and the existence of heterotrophic species in polar waters (Thomsen et al., 1991). Recent culture experiments report the ability of several species (including placolith-bearing E. huxleyi, G. oceanica and C. leptoporus) to use osmotrophy as a mode of mixotrophic acquisition of a wide array of carbon-enriched organic compounds in dark conditions (Godrijan et al., 2020; Godrijan et al., 2021). Avrahami and Frada (2020) also provided evidence of mixotrophy and phagotrophy (i.e., the ability to ingest prey) as nutritional strategies widespread in coccolithophores. Holococcolithophores are also thought to be more likely to use mixotrophy towards efficiently exploiting stable and oligotrophic niches (Worden et al., 2015; Caron, 2016).
Our data suggest that enhanced species diversity linked to a possibly broader range of nutritional strategies, and the ability of undergoing life cycle changes, are good indicators of gyre coccolithophore species having an ecological advantage in the context of ongoing gyre expansion due to ocean warming. Their resilience is well illustrated by the up to 28-41% contributions by floriform taxa, 17–20% by umbelliforms, and 6% by holococcolithophores, together contributing to mean total of 11–14×103 cells/L in the gyre (NAST and NATR), only slightly lower compared to mean total of 17.7×10³ cells/L produced by r-selected species in the highly productive NADR (Table II – Supplementary Material).
Our observations provide a snapshot perception on the importance of coccolithophore productivity in typical gyre conditions, considered as a modern analog for future productivity in the context of an increasingly stratified upper ocean. While this provides good perspectives for their survival in the face of ocean warming, a growing use of mixotrophy in detriment of autotrophy could significantly alter the role of coccolithophore communities in the organic and inorganic carbon pumps, with implications for both O2 production and atmospheric CO2 sequestration (e.g., Hutchins, 2011; Guerreiro et al., 2019; Godrijan et al., 2020; Guerreiro et al., 2021).
5.3 Coccolithophore production and HexFuco concentrations
Despite the diversity of the distribution of the currently known pigment markers among coccolithophore species, the carotenoid 19’-hexanoyloxyfucoxanthin (HexFuco) has been considered a straightforward marker for coccolithophore (Haptophytes Type 6) distribution in open coastal and oceanic settings (Van Lenning et al., 2004; Wright and Jeffrey, 2006). In this study, HexFuco concentrations were mostly coincident with the distribution of coccolithophores along the regions of higher cell concentrations, higher TChl-a and enhanced productivity by r-selected placolith-bearing coccolithophore species, i.e., in the NADR, in the AzC Front region, and to the south of 20°N. This is in line with reported species within the HexFuco-synthetizing genera, including C. pelagicus, E. huxleyi and G. oceanica, all characteristic of more open-ocean regions compared to diatoms, but also blooming in nutrient-enriched conditions (Kees Van Lenning et al., 2004). Our data are also consistent with Zapata et al. (2004) who reported 11 strains of E. huxleyi to have a high correlation to pigment Type 6 composition.
Our observations confirm that HexFuco may be produced towards maximizing the use of light in nutritious ocean conditions, both within well mixed- and heavily stratified surface ocean conditions, in line with its reported light-harvesting role (Siefermann-Harms, 1985; Zapata et al., 2004). This is supported by the fact that HexFuco concentrations were lowest in the gyre (near the detection limit; Figure 9), where coccolithophore populations were dominated by deep dwelling floriform taxa (Figure 7). Given that the gyre region was not light-limited, the observed meridional patterns suggest that the production of HexFuco is somehow used to maximizing photosynthesis in the presence of higher nutrient availability. Dandonneau et al. (2006) also reported slightly improved agreement between HexFuco and coccolithophore cell concentrations in regions/seasons of higher coccolithophore standing stocks in the North Atlantic (i.e., Gulf Stream province) and of populations dominated by G. oceanica (i.e., Pacific North Equatorial Current region). The same authors justify the observed poor agreement between total cell concentrations and HexFuco as probably reflecting changes in pigment ratios among distinct coccolithophore species and/or in other phytoplankton groups containing this carotenoid. This suggests that coccolithophore species composition should be considered when using HexFuco as a pigment marker of coccolithophores, consistent with our AMT28 observations. The fact that HexFuco was not correlated to the gyre coccolithophore communities could be related with their greater use of mixotrophy to survive within its extremely stratified ocean conditions (discussed in Section 5.2).
5.4 Enhanced r-selected productivity underneath the largest Saharan dust plume
Though Saharan dust fluxes during boreal autumn tend to be highest in the western tropical North Atlantic (e.g., Prospero et al., 2014) our data point to the occurrence of dust-born nutrient deposition in the eastern part of the ocean basin. In addition to being the region of highest and most persistent dust input during the expedition, the NATR-WTRA transition was also where high AOT values extended the most towards the west (Figures 2F, 4A, 10, 11), reflecting its location under the largest Saharan dust plume. Being adjacent to NW Africa, the tropical NE Atlantic is subjected to some of the highest inputs of atmospheric dust (Yu et al., 2019) which are yearlong transported by the westward-blowing trade winds (Duce et al., 1991; Chiapello et al., 1999; Prospero et al., 2002; Jickells et al., 2005; Scheuvens et al., 2013; van der Does et al., 2020). The striking increase in the concentrations of s-Fe and s-P in dust samples collected across the NATR-WTRA transition (Figures 4A, 10) is consistent with the notion of Saharan dust plumes acting as long-range vehicles for the transport of nutrient-enriched particles towards the Atlantic (Jickells et al., 2005).
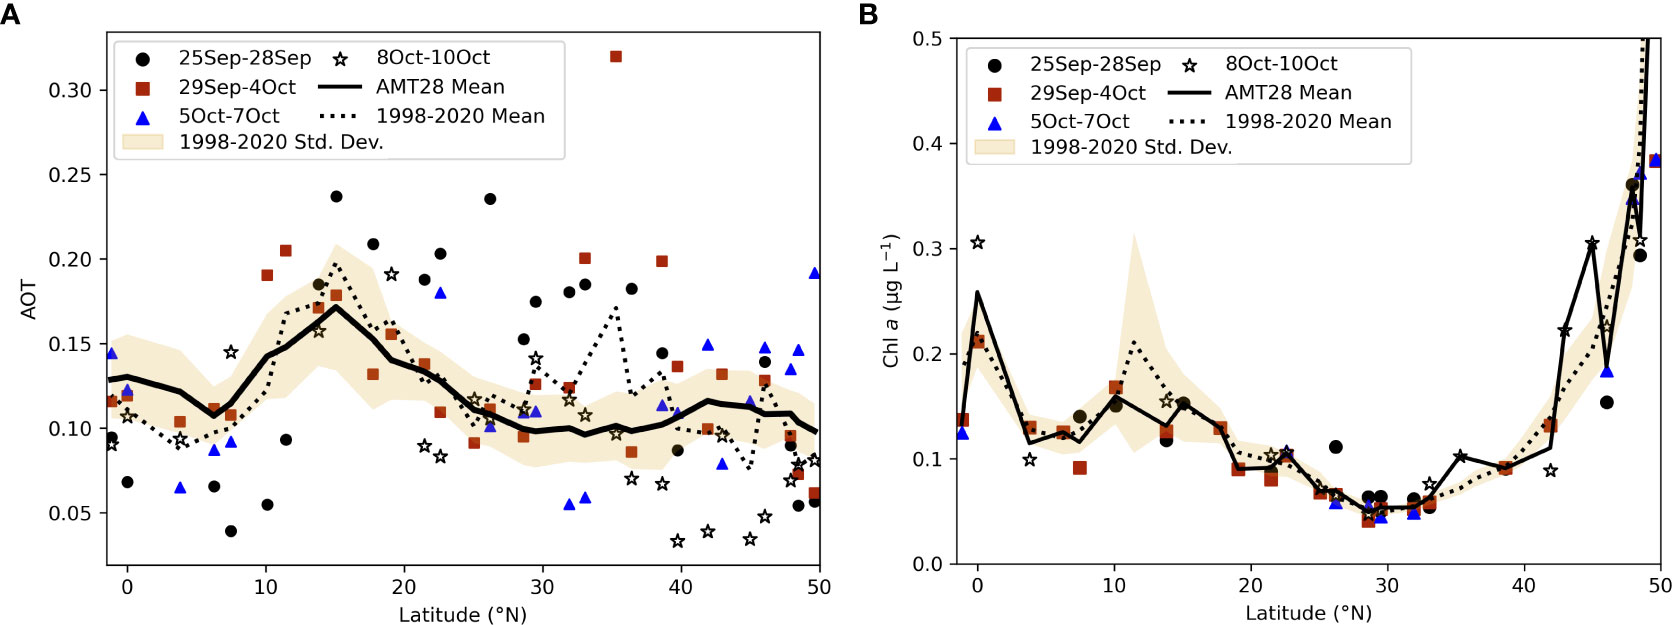
Figure 11 Aerosol optical depth (AOT; unitless) (A) and Chl-a concentrations (μg/L) (B) averaged for distinct time intervals across the studied meridional transect: 25-28 September, when the ship was crossing the high latitude regions in the NADR (sites 1-7, 50-40°N – grey circle); 29 September to 4 October, when the ship was crossing most of the gyre region, including the NAST and most of the NATR (sites 8-19, 39-21°N – purple square); 5-7 October, when the ship was crossing the region of highest and most persistent dust input during the expedition (sites 20-25, 20-10°N – green triangle); 8-10 October, when the ship was crossing the WTRA including the salinity minimum region influenced by the ITCZ and NECC, and the Equator (sites 27-31, 7°N-1°S – grey star); mean for the entire AMT28 sampling period (black line); mean and standard deviation for 1998-2020 (dashed line and yellow band, respectively).
The increase of s-Fe and s-P in dust samples strikingly coincided with the increase of cell concentrations by E. huxleyi and G. oceanica in the heavily stratified and oligotrophic uppermost 20 m of the ocean across the NATR-WTRA transition (Figure II – Supplementary Material), resulting in a significant increase of the UPZ/LPZ ratios at the surface (Figure 6B). Low concentrations of all macronutrients measured at the surface in this region (Figure 4D) suggest that dust-born nutrients were only enough to fuel fast-blooming species but not to change the nutrient stocks at the surface. E. huxleyi produced up to 9–16×103 cells/L at Site 24, only surpassed by densities recorded in the NADR (max. 58×103 cells/L at 5 m of Site 3) and in the Equator (total of 29×103 cells/L at 60 m of Site 30). G. oceanica had one of its maximum occurrences at Site 25 (3×10³ cells/L at 20 m) (Figure II – Supplementary Material). Despite being considered less productive compared to the opportunistic E. huxleyi, G. oceanica is often referred to as an upwelling indicator, based on its quick response to nutrient input (Winter et al., 1994; Giraudeau and Bayley, 1995; Broerse et al., 2000; Andruleit and Rogalla, 2002; Sprengel et al., 2002; Andruleit et al., 2003; Guerreiro et al., 2013). G. oceanica has also been reported to be faster and more efficient in responding to intermittent “bursts” of nutrient input compared to other gephyrocapsids (see Guerreiro et al., 2013; Guerreiro et al., 2017). Our data are consistent with previous sediment-trap observations of E. huxleyi and G. oceanica producing coccolith flux maxima during two events of enhanced Saharan dust deposition in 2013 in the open tropical North Atlantic (Guerreiro et al., 2017). According to this study, fluxes produced by these species in this highly stratified region were almost as high as those produced in the mesotrophic region off the coast of Mauritania for the same period. The resulting striking flux increase of POC and coccoliths was seen promoting a more efficient coccolith-ballasting and resulting in lower rain ratios (Korte et al., 2020; Guerreiro et al., 2021).
Enhanced cell concentrations produced by Trichodesmium spp. at 14°N (Figure 10) and increased proportions of pigments produced by cyanobacteria s.l. (i.e., including both smaller cell-sized picophytoplankton and filamentous N2-fixing species) along 29–10°N (Figure 8) also support the hypothesis of phytoplankton growth at the expense of Saharan dust-driven nutrients. Pigments produced by cyanobacteria s.l. show a meridional distribution at the surface that coincides remarkably with the region of highest dust-driven dFe and total dFe surface concentrations along 30–5°N recently reported by Shelley et al. (2017), and in line with previous studies (Bowie et al., 2002; Bergquist and Boyle, 2006; Measures et al., 2008; Ussher et al., 2013). The median N:P (67 mol/mol) and N:Fe (144 mol/mol) ratios of the deposition in the 30–5°N latitude band (Samples TM08-14) are both lower (and thus more favorable for N2-fixation) than in the samples outside of this band (medians 98 mol/mol and 317 mol/mol, respectively). This pattern is also present when considering the period of 1998-2020, during which the mean surface Chl-a concentrations were seen to increase in the region of highest mean AOT (at 15–10°N), much lower compared to Chl-a concentrations in the NADR, but comparable to those near the Equator (Figure 11). These results support existing notions of African dust acting to alleviate Fe- and P-imitation of N2-fixation by diazotrophic cyanobacteria, critical for stimulating the growth of other phytoplankton groups for which N2-limitation is relieved by diazotrophic N2-release (Moore et al., 2002; Pabortsava et al., 2017). Higher abundances of e.g., Trichodesmium spp. and associated P-depleted waters have been reported to be typically distributed in areas of higher dust input (Capone et al., 1997; Tyrrell et al., 2003; Schlosser et al., 2013) along a latitudinal gradient that nicely follows the seasonal migrations of the ITCZ (Prospero and Carlson, 1972; Doherty et al., 2012; Tsamalis et al., 2013; Doherty et al., 2014). As N2-fixation in the tropical North Atlantic is thought to fuel up to 50% of the export production (Mills et al., 2004 and refs. therein), highest soluble Fe- and P-inputs from Saharan aerosol inputs are likely crucial for stimulating primary production (Baker et al., 2003). However, the observation that coccolithophores living in the gyre were dominantly mostly K-selected (Figure 7C; discussed in section 5.2) suggests that dust-stimulated N2-fixation did not have a significant role in fueling r-selected coccolithophore productivity to the north of 18°N. This is consistent with previous sediment-trap observations reporting Umbellosphaera spp., F. profunda and G. flabellatus as apparently unaffected by dust deposition, suggesting that only opportunistic species are likely to benefit from pulsed dust-born nutrient-enrichment (Guerreiro et al., 2017).
The NATR-WTRA transition was also marked by rather striking hydrological gradients across the upper ocean, including the highest sub-surface macronutrient concentrations across the transect and the presence of a sub-surface OMZ (Figures 3D, 4E). While Saharan dust appears to have contributed to fuel productivity at the surface in this region, enhanced productivity in the shallow DCM underneath appears to have been stimulated by nutrients supplied from below. Indeed, the uplift of colder subsurface waters underneath this stratified surface region was signalling the geostrophic eastward shoaling of the thermocline/nutricline (positioned at up to ~40–50 m depth at 11–10°N) (Figures 3, 4) (see Merle, 1980a; Merle, 1980b; Katz, 1981; Guerreiro et al., 2019) (see Section 2). Unlike the intermittent nature of dust fertilization at the surface, the geostrophic shoaling of the nutricline is a permanent feature of the tropical NE Atlantic (Longhurst, 2007; Guerreiro et al., 2019) thereby acting to stimulate the phytoplankton community more sustainably across this region. This is evidenced by higher Chl-a concentrations and coccolithophore concentrations dominated by E. huxleyi and G. ericsonii at the DCM compared to the surface, to which higher proportions of diatoms and dinoflagellates (derived from marker-pigments for each group) also contributed (Figures 8, 10). This is in line with the increase of Chl-a concentrations and fluxes of biogenic silica and coccoliths produced by r-selected taxa from west to east at ~21–12°N reported by Guerreiro et al. (2019). While the shoaled nutricline is likely to be easily eroded during strong wind-forced mixing events, thereby fuelling phytoplankton along the entire photic zone, shallow and stratified mixed layer conditions at the surface (Figures 3, 4) suggest that wind was not strong enough to do so during AMT28. Therefore, our data suggests that enhanced productivity by opportunistic coccolithophore taxa, Trichodesmium spp. and cyanobacteria s.l. at the surface was, at least to some extent, decoupled from that occurring along/below the DCM.
While the geostrophic shoaling of the thermocline explains the shallow position of the nutricline in the NATR-WTRA transition, persistently enhanced dust inputs in this area probably contributed for the highest concentrations of all macronutrients to be observed here, along 18–7°N (Sites 21–27) (Figure 4E and Figure I – Supplementary Material). For example, high PO4 concentrations at 37–63 m depth in this region (up to 1.4 μmol/L at Site 24 and 1.3 μmol/L at Site 25, located at 11-10°N) are comparable to the maximum of 1.2 μmol/L at ~150 m near the Equator (Site 30), and higher than the maximum of 0.6 μmol/L at ~150 m in the NADR (Sites 2–3) (see Figure 4E). High macronutrient concentrations off NW Africa are consistent with the highest s-Fe and s-P found in our dust samples collected at the same latitudes (Figures 4B, C, 10). Previous studies also report highest s-P concentrations from Saharan dust input (Baker et al., 2003) and higher sub-surface s-Fe concentrations in the tropical NE Atlantic, with persistent maxima at 18–15°N (Measures et al., 2008; Fitzsimmons et al., 2013), and coinciding with the location of the OMZ of the tropical North Atlantic (Karstensen et al., 2008), in line with our data. According to Shelley et al. (2017 and refs. therein), the OMZ is sustained to a great extent by remineralization of high Fe:C organic matter produced by enhanced N2-fixation driven export from the overlying Fe-rich surface (Shelley et al., 2017 and refs. therein). A sub-surface plume of high dFe in the low oxygen/suboxic subsurface waters has been reported to extend from Mauritania into the center of the tropical upwelling region, fueled by high atmospheric deposition fluxes (Ussher et al., 2013 and refs. therein). Wind-forced vertical diffusive mixing in this region, in turn, is likely to provide an important source of dFe to the surface ocean, reportedly equal to, or even surpassing that of a major dust event. Relatively high phytoplankton biomass in tropical Atlantic waters have been reported to be sustained by such combination of transport of nutrient-rich water from below with atmospheric input from above (Rijkenberg et al., 2012), in line with our data. The resulting large amount of sinking organic detritus and its subsequent bacterial degradation are, in turn, thought to contribute to develop the OMZ.
Enhanced rain events in the NADR probably contributed to increase aerosol nutrient concentrations in the filters sampled in this region, which was more notably the case of atmospheric NO3 and NH4. Our data support Baker et al. (2006) reporting the occurrence of intermittent high concentrations of aerosol N in the northern part of the AMT section, largely originated from industrial and agricultural activities in the highly populated adjacent continental regions (e.g., fossil fuel combustion, biomass burning, intensive agriculture). While these authors also report Saharan dust aerosols as generally mixed with anthropogenic nitrates, in line with our atmospheric NO3 data across the NATR-WTRA (Figure 4A), they argue that such nitrates are more likely to be transported southwards within relatively N-polluted European air, into the desert region, just before being transported by the trades across the Atlantic. In any case, either when directly provided by anthropogenic activities surrounding the NADR, or when transported to the NATR-WTRA transition from more remote regions within African dust plumes, atmospheric nitrates are likely to have also contributed to increase primary productivity in these regions.
In summary, while the magnitude of phytoplankton response to dust-born nutrient input may be higher during strong dust outbreak events, dust-stimulated productivity may be a relatively pervasive feature of the tropical NE Atlantic, driven by geostrophic shoaling of the dust-fueled nutricline in the region of highest and yearlong dust fluxes across the Atlantic (Figure 12). In other words, in addition to directly fueling phytoplankton species at the surface, dust is also likely to feed into a sub-surface “nutrient depocenter” (both macro- and trace metals), to which reportedly enhanced biological recycling/export fueled by dust-driven N2-fixation likely contribute. Based on the deposition estimates presented here, wet deposition appears to be the dominant delivery mechanism of s-Fe and s-P (Figure 10), suggesting that the magnitude of coccolithophores’ ecological response is likely to be much higher when nutrients are delivered with rain compared to the studied sampling period. Our data support Guerreiro et al. (2021) arguing that Saharan dust deposition is likely to, at least partly, counterbalance the effects of climate-driven ocean stratification through stimulating r-selected and ballasting-efficient coccolithophore species.
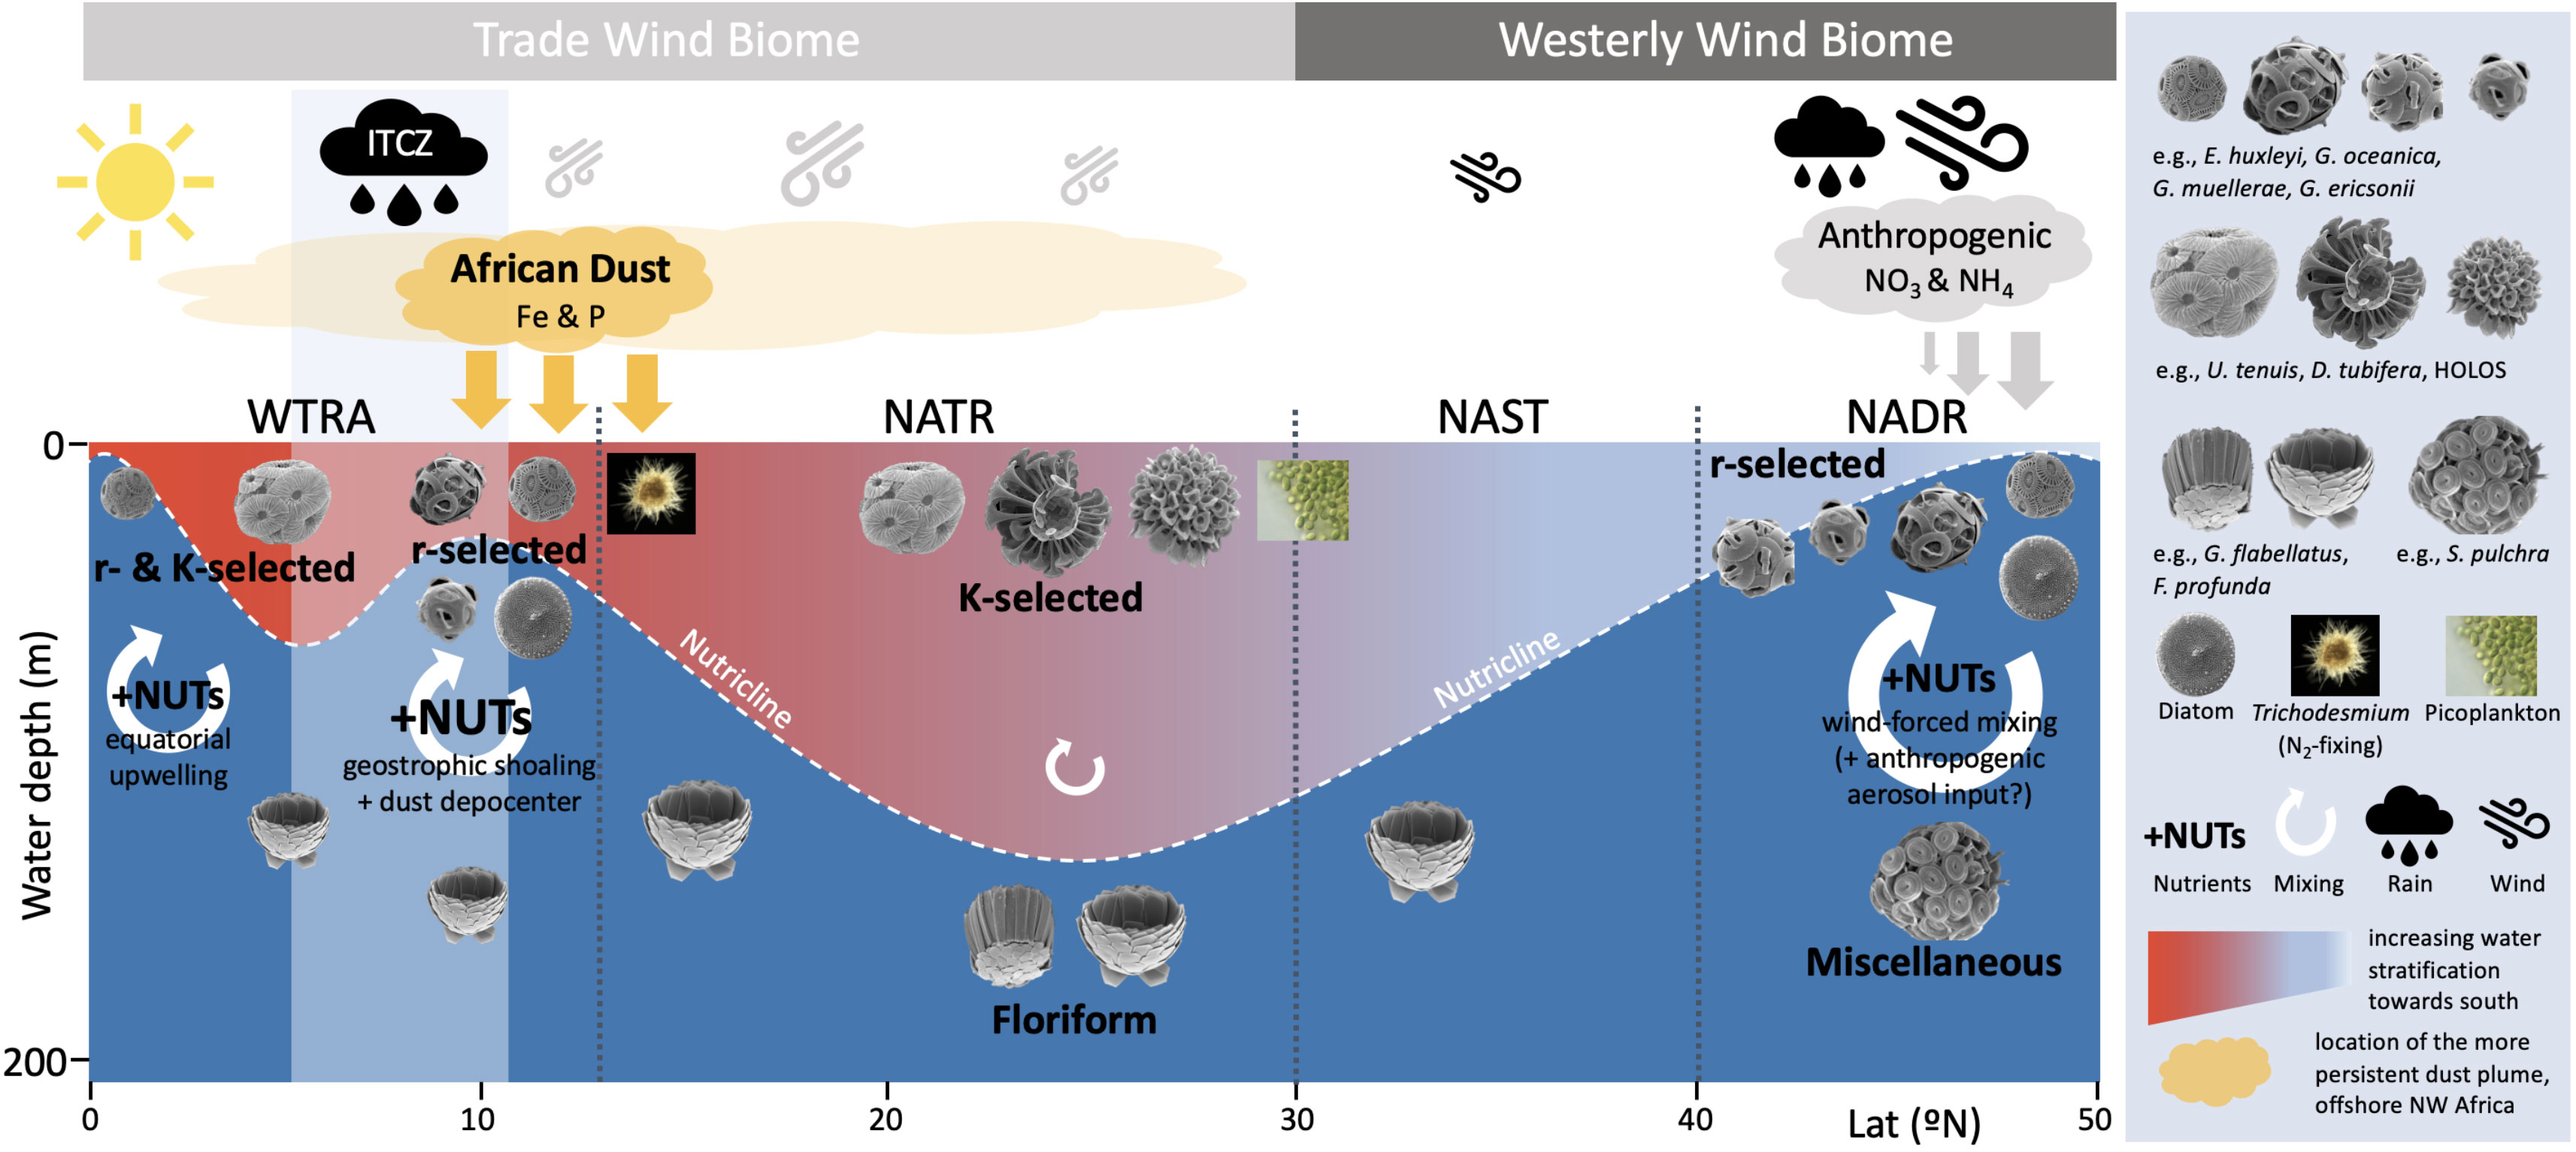
Figure 12 Schematic illustration of the environmental and ecological conditions across the North- and Equatorial North Atlantic during the boreal Autumn of 2018 (AMT28).
6 Conclusions
Our study provides important insights into the interplay of oceanographic and atmospheric processes modulating the meridional distribution of coccolithophore communities distributed across the North- and Equatorial Atlantic Ocean. This understanding is critical to gain improved perspectives on the response of this biogeochemically important group to ongoing climate change. The main findings from our AMT28 study are as follows:
1. The NADR (60–40°N) had the weakest vertical ecological gradients and the highest production by larger cell-sized microphytoplankton and of r-selected placolith-bearing species (E. huxleyi and gephyrocapsids), reflecting their ability to thrive and compete for nutrients in more dynamic and seasonally nutritious mixed layer conditions, typical of high-latitude regions and coastal areas.
2. The subtropical gyre region, comprising the NAST and the NATR (40–12°N), had the strongest vertical ecological gradients and the highest production by smaller cell-sized picophytoplankton and by K-selected umbelliform taxa and holococcolithophores living at the surface, and by deep-dwelling florifom living in the deep euphotic and subeuphotic zones of the ocean.
3. The WTRA (12°N–5°S) presented heavily stratified and oxygen-poor surface water conditions over a shallower nutricline, and a shallow DCM which was associated to the eastward geostrophic shoaling of the thermocline. Umbelliform and floriform species were inhabiting the regions of stronger stratification, while placolith-bearing species were more abundant in locally nutrient-enriched areas. The Equator region was the second most productive region across the transect, next to the NADR, with several ecologically distinct taxa (both r- and K-selected) increasing.
4. High coccolithophore species richness and diversity linked to a possibly broader range of nutritional strategies (e.g., mixotrophy), and the ability of undergoing life cycle changes, are good indicators of gyre coccolithophore communities being more resilient to climate-driven ongoing ocean warming. This is illustrated by mean concentrations of 11-14×103 cells/L contributed by floriform taxa, umbelliforms and holococcolithophores in the gyre, only slightly lower compared to 17.7×10³ mean cells/L dominated by r-selected species in the NADR.
5. Higher HexFuco concentrations along the regions of enhanced productivity by r-selected placolith-bearing coccolithophore species suggest that this pigment is produced towards maximizing the use of light in nutritious ocean conditions, and that species composition should be considered when using HexFuco as a pigment marker of coccolithophores.
6. The striking coincidence between the increase of atmospheric s-Fe and s-P across the NATR-WTRA transition, and the increase of cell concentrations by r-selected E. huxleyi and G. oceanica, and of the N2-fixing Thrichodesmium spp. in the stratified oligotrophic surface layer underneath, point to the occurrence of Saharan-dust fertilization at the surface of the ocean, off NW Africa. This process appeared decoupled from the enhanced productivity in the shallow DCM underneath, which was probably stimulated by nutrients supplied from below, linked to the geostrophic shoaling of the thermocline/nutricline (up to ~40–50 m depth at 11–10°N).
7. Persistently enhanced Saharan-dust inputs off NW Africa across the NATR-WTRA transition probably contributed for this region presenting the highest macronutrient sub-surface concentrations across the transect (along 18–7°N, Sites 21–27), consistent with the highest s-Fe and s-P found in dust samples collected at the same latitudes, and with previous studies.
8. While the magnitude of phytoplankton response to dust-born nutrient input at the surface might be higher during strong dust outbreak events, our data suggest that dust-stimulated productivity may be a relatively pervasive feature of the tropical NE Atlantic, driven by geostrophic shoaling of the dust-fueled shallow nutricline in the region of highest dust fluxes across the Atlantic.8.
Data availability statement
The original contributions presented in the study are included in the article/Supplementary Material. Further inquiries can be directed to the corresponding author.
Author contributions
CG was responsible for the conceptual development and writing of the manuscript, with contributions of all authors. CG and CP performed the coccolithophore light microscope analysis. CG was responsible for the SEM taxonomic analysis, with contributions from LC and TN. VV performed the microscope identification and enumeration of Trichodesmium spp. AT and AF performed all the in-situ sampling during AMT28. AT and VB performed the pigment analysis via High Performance Liquid Chromatography. AF performed the processing of all the satellite remote sensing. J-BS did the quantification of dust concentrations. AB was responsible for the quantification of atmospheric nutrients. All authors contributed to the article and approved the submitted version.
Funding
CG benefited from a Marie Sklodowska-Curie European Fellowship supported by the EU H2020-MSCA-IF-2017 (grant no. 796802) linked to project DUSTCO, and currently benefits from a research grant funded by FCT (contract CEECIND/00752/2018/CP1534/CT0011) linked to project CHASE (/www.chase-dust.com). This work also received funding from the European Union’s Horizon 2020 Research and Innovation Programme under grant agreement n° 810139 Project Portugal Twinning for Innovation and Excellence in Marine Science and Earth Observation – PORTWIMS; and from the UK Natural Environment Research Council under grant agreement n° NE/V001213/1. This is contribution number 361 of the AMT programme. The Atlantic Meridional Transect is funded by the UK Natural Environment Research Council through its National Capability Long-term Single Centre Science Programme, Climate Linked Atlantic Sector Science (grant number NE/R015953/1). This publication was financed under H2020 Research and Innovation Program LC-SPACE-04-EO-2019-2020: Copernicus evolution – Research activities in support of cross-cutting applications between Copernicus services – CERTO.
Acknowledgments
This study contributes to the international IMBeR project. We thank the officers and crew of the British Antarctic Survey vessel James Clark Ross. We also thank Susan Becker and John R. Ballard (UC San Diego/Scripps Institution of Oceanography) for the macronutrient collection and analysis; to Dominic Handscomb (University of East Anglia) for the aerosol nutrient analysis; and to Bror Jonsson (Plymouth Marine Laboratory) for the helpful discussion about the physical oceanographic processes at play in the tropical Atlantic. Quantification of dust concentrations was performed at the Royal Netherlands Institute for Sea Research, NL, and the quantification of atmospheric nutrients was performed at the University of East Anglia, UK. Lab preparation and polarizing-light microscope analysis of the coccolithophore samples were performed at the Laboratory of Calcareous Nannofossils, Instituto Dom Luiz (IDL-RG2/Uni-Lisbon); scanning electron microscope analysis, HPLC pigment analysis and the Thrichodesmium study were performed at MARE and Dep. Plant Biology, at the Faculty of Sciences of the University of Lisbon, Portugal.
Conflict of interest
The authors declare that the research was conducted in the absence of any commercial or financial relationships that could be construed as a potential conflict of interest
Publisher’s note
All claims expressed in this article are solely those of the authors and do not necessarily represent those of their affiliated organizations, or those of the publisher, the editors and the reviewers. Any product that may be evaluated in this article, or claim that may be made by its manufacturer, is not guaranteed or endorsed by the publisher.
Supplementary material
The Supplementary Material for this article can be found online at: https://www.frontiersin.org/articles/10.3389/fmars.2023.1119488/full#supplementary-material
Abbreviations
AOT, Aerosol Optical Thickness; AzC, Azores Current; TChl-a, Total Chlorophyl-a; DCM, Deep Chlorophyll Maximum; ENACW, Eastern North Atlantic Central Water; Fuco, Fucoxanthin; HexFuco, 19’Hexanoyloxyfucoxanthin; ITCZ, Intertropical Convergence Zone; LPZ, Lower Photic Zone; MLD, Mixed Layer Depth; NAC, North Atlantic Current; NADR, North Atlantic Drift Province; NAST, North Atlantic Subtropical Province; NATR, North Atlantic Tropical Province; NEC, North Equatorial Current; NECC, North Equatorial Counter Current; OMZ, Oxygen Minimum Zone; PAR, Photosynthetically Available Radiance; Perid, Peridinin; POC, Particulate Organic Carbon; SACW, South Atlantic Central Water; SSS, Sea Surface Salinity; SST, Sea Surface Temperature; TSW, Tropical Surface Water; UPZ, Upper Photic Zone; WTRA, Western Tropical Atlantic Province; Zea, Zeaxanthin.
References
Adams A. M., Prospero J. M., Zhang C. (2012). CALIPSO-derived three-dimensional structure of aerosol over the Atlantic basin and adjacent continents. J. Climate 25 (19), 6862–6879. doi: 10.1175/JCLI-D-11-00672.1
Aiken J., Brewin R. J. W., Dufois F., Polimene L., Hardman-Mountford N. J., Jackson T. (2017). A synthesis of the environmental response of the north and south Atlantic sub-tropical gyres during two decades of AMT. Prog. Oceanogr. 158, 236–254. doi: 10.1016/j.pocean.2016.08.004
Aiken J., Rees N., Hooker S., Holligan P., Bale A., Robins D., et al. (2000). The Atlantic meridional transect: overview and synthesis of data. Prog. Oceanogr. 45 (3–4), 257–312. doi: 10.1016/S0079-6611(00)00005-7
Andruleit H. (2007). Status of the Java upwelling area (Indian ocean) during the oligothrophic northern hemisphere winter monsoon season as revealed by coccolithophores. Mar. Micropaleontol. 64, 36–51. doi: 10.1016/j.marmicro.2007.02.001
Andruleit H., Rogalla U. (2002). Coccolithophores in surface sediments of the Arabian Sea in relation to environmental gradients in surface waters. Mar. Geol. 186, 505–526. doi: 10.1016/S0025-3227(02)00312-2
Andruleit H., Stager S., Rogalla U., Cepek P. (2003). Living coccolithophores in the northern Arabian Sea: ecological tolerances and environmental control. Mar. Micropaleontol. 49, 157–181. doi: 10.1016/S0377-8398(03)00049-5
Avrahami Y., Frada M. J. (2020). Detection of phagotrophy in the marine phytoplankton group of the coccolithophores (Calcihaptophycidae, haptophyta) during nutrient-replete and phosphate-limited growth. J. Phycol. 56 (4), 1103–1108. doi: 10.1111/jpy.12997
Baker A. R., Adams C., Bell T. G., Jickells T. D., Ganzeveld L. (2013). Estimation of atmospheric nutrient inputs to the Atlantic ocean from 50°N to 50°S based on large-scale field sampling: Iron and other dust-associated elements. Global Biogeochem. Cycles 27, 755–767. doi: 10.1002/gbc.20062
Baker A. R., Jickells T. D., Biswas K. F., Weston K., French M. (2006). Nutrients in atmospheric aerosol particles along the Atlantic meridional transect, deep-Sea res. Pt. II 53 1706– 1719, 2006. doi: 10.1016/j.dsr2.2006.05.012
Baker A. R., Kelly S. D., Biswas K. F., Witt M., Jickells T. D. (2003). Atmospheric deposition of nutrients to the Atlantic ocean, geophys. Res. Lett. 30 (24), 2296. doi: 10.1029/2003GL018518
Baker A. R., Lesworth T., Adams C., Jickells T. D., Ganzeveld L. (2010). Estimation of atmospheric nutrient inputs to the Atlantic ocean from 50°N to 50°S based on large-scale field sampling: Fixed nitrogen and dry deposition of phosphorus. Global Biogeochem. Cycles 24, GB3006. doi: 10.1029/2009GB003634
Baker A. R., Weston K., Kelly S. D., Voss M., Streu P., Cape J. N. (2007). Dry and wet deposition of nutrients from the tropical Atlantic atmosphere: links to primary productivity and nitrogen fixation. Deep Sea Res. Part I 54, 1704–1720. doi: 10.1016/j.dsr.2007.07.001
Balch W. M. (2004). “Re-evaluation of the physiological ecology of coccolithophores,” in Coccolithophores: From molecular processes to global impact. Eds. Thierstein H. R., Young J. R. (Berlin: Springer), 165–190.
Balch W. M. (2018). The ecology, biogeochemistry, and optical properties of coccolithophores. Annu. Rev. Mar. Sci. 10, 71–98. doi: 10.1146/annurev-marine-121916-063319
Balch W. M., Bowler B. C., Drapeau D. T., Lubelczyk L. C., Lyczkowski E., Mitchell C., et al. (2019). Coccolithophore distributions of the north and south Atlantic ocean. Deep Sea Res. Part I: Oceanogr. Res. Pap. 151, 103066. doi: 10.1016/j.dsr.2019.06.012
Basha G., Kishore P., Venkat Ratnamc M., Ouarda T. B. M. J., Velicogna I., Sutterley T. (2015). Vertical and latitudinal variation of the intertropical convergence zone derived using GPS radio occultation measurements. Remote Sens. Environ. 163, 262–269. doi: 10.1016/j.rse.2015.03.024
Baumann K.-H., Andruleit H. A., Samtleben C. (2000). Coccolithophores in the Nordic seas: comparison of living communities with surface sediment assemblages. Deep-Sea Res. II 47, 1743–1772. doi: 10.1016/S0967-0645(00)00005-9
Beaufort L., Lancelot Y., Camberlin P., Cayre O., Vincent E., Bassinot F., et al. (1997). Insolation cycles as a major control of equatorial Indian ocean primary production. Science 278, 1451–1454. doi: 10.1126/science.278.5342.1451
Becker S., Aoyama M., Woodward E. M. S., Bakker K., Coverly S., Mahaffey C., et al. (2020). GO-SHIP repeat hydrography nutrient manual: the precise and accurate determination of dissolved inorganic nutrients in seawater, using continuous flow analysis methods. Front. Mar. Sci. 7. doi: 10.3389/fmars.2020.581790
Behrenfeld M. J., O’Malley R. T., Siegel D. A., McClain C. R., Sarmiento J. L., Feldman G. C., et al. (2006). Climate-driven trends in contemporary ocean productivity. Nature 444, 752–755. doi: 10.1038/nature05317
Ben-Ami Y., Koren I., Altaratz O., Kostinski A., Lehahn Y. (2012). Discernible rhythm in the spatio/temporal distributions of transatlantic dust, atmos. Chem. Phys. 12, 2253–2262. doi: 10.5194/acp-12-2253-2012
Bergquist B. A., Boyle E. A. (2006). Dissolved iron in the tropical and subtropical Atlantic ocean. Global Biogeochem. Cycles 20, 1–14. doi: 10.1029/2005GB002505
Billard C., Inouye I. (2004). “What is new in coccolithophore biology?,” in Coccolithophores. Eds. Thierstein H. R., Young J. R. (Berlin, Heidelberg: Springer). doi: 10.1007/978-3-662-06278-4_1
Boeckel B., Baumann K.-H. (2008). Vertical and lateral variations in coccolithophore community structure across the subtropical frontal zone in the south Atlantic ocean. Mar. Micropaleontol. 76, 255–273. doi: 10.1016/j.marmicro.2008.01.014
Boeckel B., Baumann K.-H., Henrich R., Kinkel H. (2006). Coccolith distribution patterns in south Atlantic and southern ocean surface sediments in relation to environmental gradients. Deep-Sea Res. Pt. I 53, 1073–1099. doi: 10.1016/j.dsr.2005.11.006
Bowie A. R., Whitworth D. J., Achterberg E. P., Mantoura R. F. C., Worsfold P. J. (2002). Biogeochemistry of fe and other trace elements (Al, Co, Ni) in the upper Atlantic ocean. Deep Sea Res. Part I 49, 605–636. doi: 10.1016/S0967-0637(01)00061-9
Boyce D. G., Lewis M. R., Worm B. (2010). Global phytoplankton decline over the past century. Nature 466 (29), 591–596. doi: 10.1038/nature09268
Boyd P. W., Ellwood M. J. (2010). The biogeochemical cycle of iron in the ocean. Nat. Geosci. 3, 675–682. doi: 10.1038/ngeo964
Boyd P. W., Jickells T., Law C. S., Blain S., Boyle E. A., Buesseler K. O., et al. (2007). Mesoscale iron enrichment experiments 1993-2005: Synthesis and future directions. Science 315, 612–617. doi: 10.1126/science.1131669
Boyd P. W., Strzepek R., Fu F.-X., Hutchins D. A., Hutchins D. A., et al. (2010). Environmental control of open-ocean phytoplankton groups: now and in the future. Limn. Ocean. 55, 1353–1376. doi: 10.4319/lo.2010.55.3.1353
Brand L. E. (1994). “Physiological ecology of marine coccolithophores,” in Coccolithophores. Eds. Winter A., Siesser W. G. (Cambridge: Cambridge University Press), 39–49.
Brewer P. G., Riley J. P. (1965). The automatic determination of nitrate in sea water. Deep Sea Research and Oceanographic Abstracts 12 (6), 765–772.
Broerse A. T. C., Ziveri P., van Hinte J. E., Honjo S. (2000). Coccolithophore export pro- duction, species composition and coccolith- CaCO3 fluxes in the NE Atlantic (34°N 21°W and 48°N 21°W). Deep-Sea Res. Pt. II 47, 1877–1906. doi: 10.1016/S0967-0645(00)00010-2
Brotas V., Tarran G., Veloso V., Brewin R. J. W., Woodward E. M. S., Airs R., et al. (2022). Complementary approaches to assess phytoplankton groups and size classes on a long transect in the Atlantic ocean. Front. Mar. Sci. 8. doi: 10.3389/fmars.2021.682621
Buck C. S., Landing W. M., Resing J. A., Measures C. I. (2010). The solubility and deposition of aerosol fe and other trace elements in the north Atlantic ocean: observations from the A16N CLIVAR/CO2 repeat hydrography section. Mar. Chem. 120, 57–70. doi: 10.1016/j.marchem.2008.08.003
Capone D. G., Zehr J., Paerl H., Bergman B., Carpenter E. J. (1997). Trichodesmium: A globally significant marine cyanobacterium. Science 276, 1221–1229. doi: 10.1126/science.276.5316.1221
Caron D. A. (2016). Mixotrophy stirs up our understanding of marine food webs. Proc. Natl. Acad. Sci. U.S.A. 113, 2806–2808. doi: 10.1073/pnas.1600718113
Caron D. A., Countway P. D. (2009). Hypotheses on the role of protistan rare biosphere in a changing world. Aquat. Microb. Ecol. 57, 227–238. doi: 10.3354/ame01352
Cermeño P., Dutkiewicz S., Harris R. P., Follows M., Schofield O., Falkowski P. G. (2008). The role of nutricline depth in regulating the ocean carbon cycle. PNAS 105 (51), 20344–20349. doi: 10.1073/pnas.0811302106
Charalampopoulou A., Poulton A. J., Tyrrell T., Lucas M. I. (2011). Irradiance and pH affect coccolithophore community composition on a transect between the north Sea and the Arctic ocean. Mar. Ecol. Prog. Ser. 431, 25–43. doi: 10.3354/meps09140
Chiapello I., Prospero J. M., Herman J. R., Hsu N. C. (1999). Detection of mineral dust over the north Atlantic ocean and Africa with the nimbus 7 TOMS. J. Geophys. Res. 104, 9277–9291. doi: 10.1029/1998JD200083
Coale K. H., Johnson K. S., Fitzwater S. E., Gordon R. M., Tanner S., Chavez F. P. (1996). A massive phytoplankton bloom induced by an ecosystem-scale iron fertilization experiment in the equatorial pacific ocean. Nature 383, 495–501. doi: 10.1038/383495a0
Crawford D., Lipsen M. S., Purdie D. A., Lohan M. C., Statham P. J., Whitney F. A., et al. (2003). Influence of zn and fe enrichments on phytoplankton growth in the northeastern subarctic pacific. Limnol. Ocean. 48, 1583–1600. doi: 10.4319/lo.2003.48.4.1583
Cros L. (2001). Planktonic coccolithophores of the NW Mediterranean (Universitat de Barcelona: PhD Thesis), 181.
Cros L., Estrada M. (2013). Holo-heterococcolithophore life cycles: ecological implications. Mar. Ecol. Progr Ser. 492, 57–68. doi: 10.3354/meps10473
Cros L., Fortuño J.-M. (2000). Atlas of northwestern Mediterranean coccolithophores. Sci. Mar. 66, 7–182. doi: 10.3989/scimar.2002.66s11
Dandonneau Y., Montel Y., Blanchot J., Giraudeau J., Neveux J. (2006). Temporal variability in phytoplankton pigments, picoplankton and coccolithophores along a transect through the north Atlantic and tropical southwestern pacific. Deep Sea Res. Part I 53 (4), 689–712. doi: 10.1016/j.dsr.2006.01.002
Dimiza M. D., Triantaphyllou M. V., Dermitzakis M. D. (2008). Seasonality and ecology of living coccolithophores in e. Mediterranean coastal environments (Andros island, middle Aegean Sea). Micropaleontology 54 (1), 59–75.
Doherty O. M., Riemer N., Hameed S. (2012). Control of Saharan mineral dust transport to Barbados in winter by the intertropical convergence zone over West Africa. J. Geophys. Res. Atmos. 117, 1–13. doi: 10.1029/2012JD017767
Doherty O. M., Riemer N., Hameed S. (2014). Role of the convergence zone over West Africa in controlling Saharan mineral dust load and transport in the boreal summer. Tellus B 66, 23191. doi: 10.3402/tellusb.v66.23191
Dolan J. R., Lemée R., Gasparini S., Mousseau L., Heyndrickx C. (2006). Probing diversity in the plankton: using patterns in tintinnids (planktonic marine ciliates) to identify mechanisms. Hydrobiologia 555 (1), 143–157. doi: 10.1007/s10750-005-1112-6
Duce R. A., Liss P., Merrill J., Atlas E., Buat-Ménard P., Hicks B., et al. (1991). The atmospheric input of trace species to the world ocean. Global Biogeochem. Cycles 5, 193–259. doi: 10.1029/91GB01778
Dutkiewicz S., Scott J. R., Follows M. J. (2013). Winners and losers: Ecological and biogeochemical changes in a warming ocean. Global Biogeochem. Cycle. 27, 463–477. doi: 10.1002/gbc.20042
Emery W. J. (2001). “Water types and water masses,” in Encyclopedia of ocean sciences, 3rd ed. Eds. Cochran J.K., Bokuniewicz H. J., Yager P. L. (Elsevier: Academic Press), 169–179.
Emery W. J., Meincke J. (1986). Global water masses: Summary and review, oceanol. Acta 9, 383–391. 1986.
Fischer G., Romero O., Merkel U., Donner B., Iversen M., Nowald N., et al. (2016). Deep ocean mass fluxes in the coastal upwelling off Mauritania from 1988 to 2012: variability on seasonal to decadal time-scales. Biogeosciences 13, 3071–3090. doi: 10.5194/bg-13-3071-2016
Fitzsimmons J. N., Zhang R., Boyle E. A. (2013). Dissolved iron in the tropical north Atlantic ocean. Mar. Chem. 154, 87–99. doi: 10.1016/j.marchem.2013.05.009
Fomba K. W., Müller K., van Pinxteren D., Poulain L., van Pinxteren M., Herrmann H. (2014). Long-term chemical characterizationof tropical and marine aerosols at the cape Verde atmospheric observatory (CVAO) from 2007 to 2011. Atmospheric Chem. Phys. 14 (17), 8883–8904. doi: 10.5194/acp-14-8883-2014
Frada M., Young J., Cachão M., Lino S., Martins A., Narciso A., et al. (2010). A guide to extant coccolithophores (Calcihaptophycidae, haptophyta) using light microscopy. J. Nannoplankton Res. 31 (2), 58–112.
Frazão H. C., Prien R. D., Schulz-Bull D. E., Seidov D., Waniek J. J. (2022). The forgotten Azores current: A long-term perspective. Front. Mar. Sci. 9. doi: 10.3389/fmars.2022.842251
Giraudeau J., Bayley G. W. (1995). Spatial dynamics of coccolithophore communities during an upwelling event in the southern benguela system, cont. Shelf Res. 15, 1825–1852. doi: 10.1016/0278-4343(94)00095-5
Godrijan J., Drapeau D., Balch W. M. (2020). Mixotrophic uptake of organic compounds by coccolithophores. Limnol. Oceanogr. 65, 1410–1421. doi: 10.1002/lno.11396
Godrijan J., Drapeau D. T., Balch W. M. (2021). Osmotrophy of dissolved organic carbon by coccolithophores in darkness. New Phytol. 233, 781–794. doi: 10.1111/nph.17819
Godrijan J., Young J. R., Maric Pfannkuchen D., Precali R., Pfannkuchen M. (2018). Coastal zones as important habitats of coccolithophores: a study of species diversity, succession, and life-cycle phases. Limnol. Oceanogr. 63, 1692–1710. doi: 10.1002/lno.10801
Goudie A. S., Middleton N. J. (2001). Saharan Dust storms: nature and consequences, earth-sci. Rev. 56, 179–204.
Guerreiro C. V., Baumann K.-H., Brummer G.-J. A., Fischer G., Korte L. F., Merkel U. S. C., et al. (2017). Coccolithophore fluxes in the open tropical north Atlantic: influence of thermocline depth, Amazon water, and Saharan dust. Biogeosciences 14, 4577–4599. doi: 10.5194/bg-14-4577-2017
Guerreiro C. V., Baumann K.-H., Brummer G.-J. A., Fischer G., Korte L. F., Stuut J.-B. W. (2019). Wind-forced transatlantic gradients in coccolithophore species fluxes. Prog. Oceanogr. 176, 102140. doi: 10.1016/j.pocean.2019.102140
Guerreiro C. V., Baumann K.-H., Brummer G.-J. A., Valente A., Fischer G., Ziveri P., et al. (2021). Carbonate fluxes by coccolithophore species between NW Africa and the Caribbean: implications for the biological carbon pump. Limnol. Oceanogr. 9999, 1–19. doi: 10.1002/lno.11872
Guerreiro C., Oliveira A., Cachão M., de Stigter H., Sá C., Borges C., et al. (2013). Late winter coccolithophore bloom off central Portugal in response to river discharge and upwelling. Cont. Shelf Res. 59, 65–83. doi: 10.1016/j.csr.2013.04.016
Guieu C., Aumont O., Paytan A., Bopp L., Law C. S., Mahowald N., et al. (2014). The significance of the episodic nature of atmospheric deposition to low nutrient low chlorophyll regions. Global Biogeochem. Cy. 28, 1179–1198. doi: 10.1002/2014GB004852
Holligan P. M., Fernandez E., Aiken, et al. (1993). Biogeochemical study of the coccolithophore, emiliania huxleyi, in the north Atlantic. Global Biogeochem. Cycles 7, 879–900. doi: 10.1029/93GB01731
Houdan A., Billard C., Marie D., Not F., Sá A., Young J., et al. (2006). Holococcolithophore- heterococcolithophore (Haptophyta) life cycles: Flow cytometric analysis of relative ploidy levels. Syst. Biodivers. 1 (4), 453–465. doi: 10.1017/S1477200003001270
Irwin A. J., Finkel Z. V., Müller-Karger F. E., Ghinaglia L. T. (2015). Phytoplankton adapt to changing ocean environments. PNAS 112 (18), 5762–5766. doi: 10.1073/pnas.1414752112
Ito A., Ye Y., Baldo C., Shi Z. (2021). Ocean fertilization by pyrogenic aerosol iron. Climate Atmospheric Sci. 4 (30), 1–20. doi: 10.1038/s41612-021-00185-8
Jickells T. D., An Z. S., Andersen K. K., Baker A. R., Bergametti G., Brooks N., et al. (2005). Global iron connections between desert dust, ocean biogeochemistry, and climate. Science 308, 67–71. doi: 10.1126/science.1105959
Jordan R., Cros L., Young J. (2004). A revised classification scheme for living haptophytes. Micropaleontology 50 (1), 55–79. doi: 10.2113/50.Suppl_1.55
Karstensen J., Stramma L., Visbeck M. (2008). Oxygen minimum zones in the eastern tropical Atlantic and pacific oceans. Prog. Oceanogr. 77, 331–350. doi: 10.1016/j.pocean.2007.05.009
Katz E. J. (1981). Dynamic topography of the sea surface in the equatorial Atlantic. J. Mar. Res. 39, 53–63.
Kinkel H., Baumann K.-H., Cepek M. (2000). Coccolithophores in the equatorial Atlantic ocean: response to seasonal and late quaternary surface water variability. Mar. Micropaleontol. 39, 87–112. doi: 10.1016/S0377-8398(00)00016-5
Kirkwood D. S. (1989). Simultaneous determination of selected nutrients in seawater, ICES CM 1989/C (Washington, DC: ICES), 29.
Kleijne A. (1991). Holococcolithophorids from the Indian ocean, red Sea, Mediterranean Sea and north Atlantic ocean. Mar. Micropaleontol. 17 (1–2), 1–76. doi: 10.1016/0377-8398(91)90023-Y
Kleijne A. (1993). Morphology, taxonomy and distribution of extant coccolithophorids (calcareous nannoplankton) (Vrije Universiteit, Amsterdam: Ph.D. Thesis).
Knappertsbusch M., Brummer G.-J. A. (1995). A sediment trap investigation of sinking coccolithophores in the north Atlantic. Deep-Sea Res. I 42, 1083–1109. doi: 10.1016/0967-0637(95)00036-6
Korte L. F., Brummer G.-J., van der Does M., Guerreiro C. V., Mienis F., Munday C. I., et al. (2020). Multiple drivers of production and particle export in the western tropical north Atlantic. Limnol. Oceanogr. 9999, 1–17. doi: 10.1002/lno.11442
Krumhardt K. M., Lovenduski N. S., Freeman N. M., Bates N. R. (2016). Apparent increase in coccolithophore abundance in the subtropical north Atlantic from 1990 to 2014. Biogeosciences 13, 1163–1177. doi: 10.5194/bg-13-1163-2016
Krumhardt K. M., Lovenduski N. S., Long M. C., Lindsay K. (2017). Avoidable impacts of ocean warming on marine primary production: Insights from the CESM ensembles. Global Biogeochem. Cycl. 31, 114–133. doi: 10.1002/2016GB005528
Lancelot C. (2012). Marine nutrient cycling – how will the ocean’s capacity of biological carbon pumping change? PAGES News 20 (1), 16. doi: 10.22498/pages.20.1.16
Laufkötter C., Vogt M., Gruber N., Aita-Noguchi M., Aumont O., Bopp L., et al. (2015). Drivers and uncertainties of future global marine primary production in marine ecosystem models. Biogeosciences 12, 6955–6984. doi: 10.5194/bg-12-6955-2015,2015
Liu H., Probert I., Uitz J., Claustre H., Aris-Brosou S., Frada M., et al. (2009). Extreme diversity in noncalcifying haptophytes explains a major pigment paradox in open oceans. PNAS 106 (31), 12803–12808. doi: 10.1073/pnas.0905841106
Liu M., Tanhua T. (2021). Water masses in the Atlantic ocean: characteristics and distributions. Ocean Sci. 17, 463–486. doi: 10.5194/os-17-463-2021
Longhurst A. (1993). Seasonal cooling and blooming in tropical oceans. Deep-Sea Res. I 40, 2145–2165. doi: 10.1016/0967-0637(93)90095-K
Longhurst A. (2007). Ecological geography of the Sea. 2nd Ed (San Diego: Academic Press), ISBN: ISBN 978-0-12-455521-1.
Mahaffey C., Reynolds S., Davis C. E., Lohan M. C. (2014). Alkaline phosphatase activity in the subtropical ocean: Insights from nutrient, dust and trace metal addition experiments. Front. Mar. Sci. 1. doi: 10.3389/fmars.2014.00073
Mann K. H., Lazier J. R. (2006). Dynamics of marine ecosystems, biological-physical interactions in the oceans. 3rd ed. (Malden, MA, Oxford, UK: Black-well Publishing), 512.
Marañón E., Behrenfeld M. J., Gonzalez N., Mourino B., Zubkov M. V. (2003). High variability of primary production in oligotrophic waters of the Atlantic ocean: uncoupling from phytoplankton biomass and size structure. Mar. Ecol. Prog. Ser. 257, 1–11. doi: 10.3354/meps257001
Marañón E., Holligan P. M., Barciela R., Gonzalez N., Mourino B., Pazo M. J., et al. (2001). Patterns of phytoplankton size structure and productivity in contrasting open-ocean environments. Mar. Ecol. Prog. Ser. 216, 43–56. doi: 10.3354/meps216043
Marañón E., Holligan P. M., Varela M., Mourino B., Bale A. J. (2000). Basin-scale variability of phytoplankton biomass, production and growth in the Atlantic ocean. Deep-Sea Res. I 47, 825–857. doi: 10.1016/S0967-0637(99)00087-4
Margalef R. (1978). Life-forms of phytoplankton as survival alternatives in an unstable environment. Oceanol. Acta 1, 493–509.
Martin J. H. (1990). Glacial–interglacial CO2 change: The iron hypothesis. Paleoceanography 5, 1–13. doi: 10.1029/PA005i001p00001
Measures C. I., Landing W. M., Brown M. T., Buck C. S. (2008). High-resolution Al and fe data from the Atlantic ocean CLIVAR-CO2 repeat hydrography A16N transect: extensive linkages between dust and upper ocean geochemistry. Global Biogeochem. Cycles 22, 1–10. doi: 10.1029/2007GB003042
Merle J. (1980a). Seasonal heat budget in the equatorial Atlantic ocean. J. Phys. Oceanogr. 10, 464–469. doi: 10.1175/1520-0485(1980)010<0464:SHBITE>2.0.CO;2
Merle J. (1980b). Seasonal variation of heat storage in the tropical Atlantic ocean. Oceanol. Acta 3, 455463.
Mills M. M., Ridame C., Davey M., Roche J. L., Geider R. J. (2004). Iron and phosphorus co-limit nitrogen fixation in the eastern tropical north Atlantic. Nature 429, 292–294. doi: 10.1038/nature02550
Mirzabaev A., Wu J., Evans J., García-Oliva F., Hussein I. A. G., Iqbal M. H., et al (2019). “Desertification,” in Climate change and land: an IPCC special report on climate change, desertification, land degradation, sustainable land management, food security, and greenhouse gas fluxes in terrestrial ecosystems. Eds. Shukla P. R., Skea J., Calvo Buendia E., Masson-Delmotte V., Pörtner H.-O., Roberts D. C., Zhai P., Slade R., Connors S., van Diemen R., Ferrat M., Haughey E., Luz S., Neogi S., Pathak M., Petzold J., Portugal Pereira J., Vyas P., Huntley E., Kissick K., Belkacemi M., Malley J.
Molfino B., McIntyre A. (1990). Precessional forcing of nutricline dynamics in the equatorial Atlantic. Science 249, 766–769. doi: 10.1126/science.249.4970.766
Monteiro F. M., Bach L. T., Brownlee C., Bown P., Rickaby R. E. M., Poulton A. J., et al. (2016). Why marine phytoplankton calcify. Sci. Adv. 2, e1501822. doi: 10.1126/sciadv.1501822
Moore J. K., Doney S. C., Glover D. M., Fung I. Y. (2002). Iron cycling and nutrient-limitation patterns in surface waters of the world ocean. Deep Sea Res. Part II 49, 463–507. doi: 10.1016/S0967-0645(01)00109-6
Moore J. K., Fu W., Primeau F., Britten G. L., Lindsay K., Long M., et al. (2018). Sustained climate warming drives declining marine biological productivity. Science 359, 1139–1143. doi: 10.1126/science.aao6379
Moulin C., Chiapello I. (2006). Impact of human-induced desertification on the intensification of sahel dust emission and export over the last decades. Geophys. Res. Lett. 33, L18808. doi: 10.1029/2006GL025923. 2006.
O’Brien C. J., Vogt M., Gruber N. (2016). Global coccolithophore diversity: drivers and future change. Prog. Oceanogr. 140, 27–42. doi: 10.1016/j.pocean.2015.10.003
Oziel L., Baudena A., Ardyna M., Massicotte P., Randelhoff A., Sallée J.-B., et al. (2020). Faster Atlantic currents drive poleward expansion of temperate phytoplankton in the Arctic ocean. Nat. Commun. 11, 1705. doi: 10.1038/s41467-020-15485-5
Pabortsava K., Lampitt R. S., Benson J., Crowe C., McLachlan R., Le Moigne F. A. C., et al. (2017). Carbon sequestration in the deep Atlantic enhanced by Saharan dust. Nat. Geosci. 10, 189–194. doi: 10.1038/ngeo28997
Pelegrí J. L., Peña-Izquierdo J., Machín F., Meiners C., Presas-Navarro C. (2017). “Oceanography of the cape Verde basin and Mauritanian slope waters,” in Deep-Sea ecosystems off Mauritania, research of marine biodiversity and habitats in the Northwest African margin. Eds. Ramos A., Ramil F., Sanz J., 119–153.
Pienaar R. N. (1994). “Ultrastructure and calcification of coccolithophores,” in Coccolithophores. Eds. Winter A., Siesser W. G. (Cambridge, New York, Melbourne: Cambridge University Press), 63–82.
Pollard R. T., Griffiths M. J., Cunningham S. A., READ J. F., Perez F. F., Rios A. F. (1996). Vivaldi 1991 - a study of the formation, circulation and ventilation of Eastern north Atlantic central water. Prog. Oceanog. 37, 167–192. doi: 10.1016/S0079-6611(96)00008-0
Polovina J. J., Howell E. A., Abecassis M. (2008). Ocean’s least productive waters are expanding. Geophys. Res. Lett. 35, L03618. doi: 10.1029/2007GL031745
Poulton A. J., Holligan P. M., Charalampopoulou A., Adey T. R. (2017). Coccolithophore ecology in the tropical and subtropical Atlantic ocean: new perspectives from the Atlantic meridional transect (AMT) programme. Prog. Oceanogr 158, 150–170. doi: 10.1016/j.pocean.2017.01.003
Powell C. F., Baker A. R., Jickells T. D., Bange H. W., Chance R., Yodle C. (2015). Estimation of the atmospheric flux of nutrients and trace metals to the eastern tropical north Atlantic ocean. J. Atmospheric Sci. Am. Meteorol. Soc. 72, 4029–4045. doi: 10.1175/JAS-D-15-0011.1
Prospero J. M., Carlson T. N. (1972). Vertical and areal distribution of Saharan dust over the equatorial north Atlantic ocean. J. Geophys. Res. 77, 5255–5265. doi: 10.1029/JC077i027p05255
Prospero J., Collard F.-X., Molinié J., Jeannot A. (2014). Characterizing the annual cycle of African dust transport to the Caribbean basin and south America and its impact on the environment and air quality. Global Biogeochem. Cy. 29, 757–773. doi: 10.1002/2013GB004802
Prospero J. M., Ginoux P., Torres O., Nicholson S. E., Thomas T. E. (2002). Environmental characterization of global sources of atmospheric dust identified with the nimbus 7 total ozone mapping spectrometer (TOMS) absorbing aerosol product. Rev. Geophys. 40, 1–24. doi: 10.1029/2000RG000095
Reid J. L. (1994). On the total geostrophic circulation of the north Atlantic ocean: flow patterns, tracers, and transports. Prog. Oceanogr. 33, 1–92. doi: 10.1016/0079-6611(94)90014-0
Rickli J., Frank M., Baker A. R., Aciego S., de Souza G., Georg R. B., et al. (2010). Hafnium and neodymium isotope distribution in surface waters of the eastern Atlantic ocean: Implications for sources and inputs of trace metals to the ocean. Geochimica Cosmochimica Acta 74, 540–557. doi: 10.1016/j.gca.2009.10.006
Rijkenberg M. J. A., Steigenberger S., Powell C. F., van Haren H., Patey M. D., Baker A. R., et al. (2012). Fluxes and distribution of dissolved iron in the eastern (sub-) tropical north Atlantic ocean. Global Biogeochem. Cycles 26, 1–15. doi: 10.1029/2011gb004264
Rivero-Calle S., Gnanadesikan A., Del Castillo C. E., Balch W. M., Guikema S. D. (2015). Multidecadal increase in north Atlantic coccolithophores and the potential role of rising CO2. Science 350 (6267), 1533–1537. doi: 10.1126/science.aaa8026
Rost B., Riebesell U. (2004). “Coccolithophores and the biological pump: responses to environmental changes,” in Coccolithophores: From molecular processes to global impact. Eds. Thierstein H. R., Young J. R. (Berlin: Springer), 99–125.
Ruffault J., Curt T., Moron V., Trigo R. M., Mouillot F., Koutsias N. (2020). Increased likelihood of heat-induced large wildfires in the Mediterranean basin. Sci. Rep. 10, 13790. doi: 10.1038/s41598-020-70069-z
Rutherford S., D'Hondt S., Prell W. (1999). Environmental controls on the geographic distribution of zooplankton diversity. Nature 400 (6746), 749–753. doi: 10.1038/23449
Scheuvens D., Schütz L., Kandler K., Ebert M., Weinbruch S. (2013). Bulk composition of northern African dust and its source sediments–a compilation. Earth Sci. Rev. 116, 170–194. doi: 10.1016/j.earscirev.2012.08.005
Schlosser C., Klar J. K., Wake B., Snow J., Honey D., Woodward E. M. S., et al. (2013). Seasonal ITCZ migration dynamically controls the location of the (sub-)tropical Atlantic biogeochemical divide. Proc. Natl. Acad. Sci. U.S.A. 111, 1438–1442. doi: 10.1073/pnas.1318670111
Schulz K. G., Zondervan I., Gerringa L. J.A., Timmermans K. R., Veldhuis M. J.W., Riebesell U., et al. (2004). Effect of trace metal availability on coccolithophorid calcification. Nature 430, 673–676. doi: 10.1038/nature02631
Shelley R. U., Wyatt N. J., Tarran G. A., Rees A. P., Worsfold P. J., Lohan M. C. (2017). A tale of two gyres: Contrasting distributions of dissolved cobalt and iron in the Atlantic ocean during an Atlantic meridional transect (AMT-19). Prog. Oceanogr. 158, 52–64. doi: 10.1016/j.pocean.2016.10.013
Siefermann-Harms D. (1985). Carotenoids in photosynthesis. i. location in photosynthetic membranes and light-harvesting function. Biochim. Biophys. Acta 811, 325–355. doi: 10.1016/0304-4173(85)90006-0
Signorini S. R., Franz B. A., McClain C. R. (2015). Chlorophyll variability in the oligotrophic gyres: mechanisms, seasonality and trends. Front. Mar. Sci. 2. doi: 10.3389/fmars.2015.00001
Signorini S. R., Murtugudde R. G., McClain C. R., Christian J. R., Picaut J., Busalacchi A. J. (1999). Biological and physical signatures in the tropical and subtropical Atlantic. J. Geophys. Res.: Oceans 104, 18367–18382. doi: 10.1029/1999JC900134
Skonieczny C., Bory A., Bout-Roumazeilles V., Abouchami W., Galer S. J. G., Crosta X., et al. (2013). A three-year time series of mineral dust deposits on the West African margin: Sedimentological and geochemical signatures and implications for interpretation of marine paleo-dust records. Earth Planetary Sci. Lett. 364, 145–156. doi: 10.1016/j.epsl.2012.12.039
Souza M. S., Mendes C. R. B., Garcia V. M., Pollery R., Brotas V. (2011). Phytoplankton community during a coccolithophorid bloom in the Patagonian shelf: Microscopic and high-performance liquid chromatography pigment analyses. J. Mar. Biol. Assoc. United Kingdom 106 (92), 1–15. doi: 10.1017/S0025315411000439
Sprengel C., Baumann K.-H., Henderiks J., Henrich R., Neuer S. (2002). Modern coccolithophore and carbonate sedimentation along a productivity gradient in the canary islands region: Seasonal export production and surface accumulation rates. Deep-Sea Res. II 49, 3577–3598. doi: 10.1016/S0967-0645(02)00099-1
Stoll H. M., Arevalos A., Burke A., Ziveri P., Mortyn G., Shimizu N., et al. (2007). Seasonal cycles in biogenic production and export in northern bay of Bengal sediment traps. Deep-Sea Res. II 54, 558–580. doi: 10.1016/j.dsr2.2007.01.002
Stramma L., England M. (1999). On the water masses and mean circulation of the south Atlantic ocean. J. Geophys. Res. 104, 20863–20883. doi: 10.1029/1999JC900139
Stuut J. B., Zabel M., Ratmeyer V., Helmke P., Schefuss E., Lavik G., et al. (2005). Provenance of present-day eolian dust collected off NW Africa. J. Geophys. Res. 110, 1–14. doi: 10.1029/2004JD005161
Tarran G. (2018). “AMT 28 cruise report,” in RRS James Clark Ross (JR18-001) (Plymouth Marine Laboratory: Plimouth Marine Laboratory), 183. 23 September – 29 October 2018.
Tarran G. A., Heywood J. L., Zubkov M. V. (2006). Latitudinal changes in the standing stocks of nano- and picoeukaryotic phytoplankton in the Atlantic ocean. Deep Sea Res. II Top. Stud. Oceanogr. 53, 1516–1529. doi: 10.1016/j.dsr2.2006.05.004
Thomas M. K., Kremer C. T., Klausmeier C. A., Litchman E. (2012). A global pattern of thermal adaptation in marine phytoplankton. Science 338, 1085. doi: 10.1126/science.1224836
Thomsen H. A., Ostergaard J. B., Hansen L. E. (1991). Heteromorphic life histories in Arctic coccolithophorids (Prymnesiophyceae). J. Phycol. 27, 634–642. doi: 10.1111/j.0022-3646.1991.00634.x
Tsamalis C., Chedin A., Pelon J., Capelle V. (2013). The seasonal vertical distribution of the Saharan air layer and its modulation by the wind. Atmospheric Chem. Phys. 13 (22), 11,235–11,257. doi: 10.5194/acp-13-11235-2013
Tuomisto H. (2013). Defining, measuring, and partitioning species diversity. Encycloped. Biodivers. 2, 434–446. doi: 10.1016/B978-0-12-384719-5.00378-6
Turco M., Jerez S., Augusto S., Tarín-Carrasco P., Ratola N., Jiménez-Guerrero J., et al. (2019). Climate drivers of the 2017 devastating fires in Portugal. Sci. Rep. 9 (13886), 1–8. doi: 10.1038/s41598-019-50281-2
Tyrrell T., Marañón E., Poulton A. J., Bowie A. R., Harbour D. S., Woodward E. M. S. (2003). Large-Scale latitudinal distribution of trichodesmium spp. in the Atlantic ocean. J. Plankton Res. 25, 405–416. doi: 10.1093/plankt/25.4.405
Ussher S. J., Achterberg E. P., Powell C., Baker A. R., Jickells T. D., Torres R., et al. (2013). Impact of atmospheric deposition on the contrasting iron biogeochemistry of the north and south Atlantic ocean, global biogeochem. Cycles 27, 1096–1107. doi: 10.1002/gbc.20056
Utermöhl H. (1958). Zur vervolkommung der quantitativen phytoplankton: methodik. mitteilungen internationale vereinigung für theoretische und angewandte. Limnologie 9, 1–38. doi: 10.1080/05384680.1958.11904091
van der Does M., Brummer G.-J. A., Korte L. F., Stuut J.-B. W. (2021). Seasonality in Saharan dust across the Atlantic ocean: From atmospheric transport to seafloor deposition. J. Geophys. Res.: Atmospheres 126 (11), e2021JD034614. doi: 10.1029/2021JD034614
van der Does M., Brummer G.-J. A., van Crimpen F. C. J., Korte L. F., Mahowald N. M., Merkel U., et al. (2020). Tropical rains controlling deposition of Saharan dust across the north Atlantic ocean. Geophys. Res. Lett. 47 (5), e2019GL086867. doi: 10.1029/2019GL086867
van der Does M., Pourmand A., Sharifi A., Stuut J.-B. W. (2018). North African mineral dust across the tropical Atlantic ocean: Insights from dust particle size, radiogenic Sr-Nd-Hf isotopes and rare earth elements (REE). Aeolian Res. 33, 106–116. doi: 10.1016/j.aeolia.2018.06.001
van der Jagt H., Friese C., Stuut J.-B. W., Fischer G., Iversen M. H. (2018). The ballasting effect of Saharan dust deposition on aggregate dynamics and carbon export: aggregation, settling, and scavenging potential of marine snow. Limnol. Oceanogr. 106 (63), 3–9. doi: 10.1002/lno.10779
Van Lenning K., Probert I., Latasa M., Estrada M., Young J. (2004). “Pigment diversity of coccolithophores in relation to taxonomy, phylogeny, and ecological preferences,” in Coccolithophores: From molecular processes to global impact. Eds. Thierstein H. R., Young J. R. (Berlin: Springer), 51–73.
Winter A., Henderiks J., Beaufort L., Rickaby R., Brown C. (2013). Poleward expansion of the coccolithophore emiliania huxleyi. J. Plankton Res. 36 (2), 1–10. doi: 10.1093/plankt/fbt110
Winter A., Jordan R., Roth P. (1994). “Biogeography of living coccolithophores in ocean waters,” in Coccolithophores. Eds. Winter A., Siesser W. (Cambridge, New York, Melbourne: Cambridge Univ. Press), 161–177.
Worden A. Z., Follows M. J., Giovannoni S. J., Wilken S., Zimmerman A. E., Keeling P. J. (2015). Rethinking the marine carbon cycle: Factoring in the multifarious lifestyles of microbes. Science 347, 1257594. doi: 10.1126/science.1257594
Wright S. W., Jeffrey S. W. (2006). “Pigment markers for phytoplankton production,” in Hdb env chem 2, part n, 71–104.
Yodle C., Baker A. R. (2019). Influence of collection substrate and extraction method on the speciation of soluble iodine in atmospheric aerosols. Atmospheric Environment: X 1, 100009. doi: 10.1016/j.aeaoa.2019.100009
Young J. R., Bown P. R., Lees J. A. (2011). Nannotax website. international observations. Prog. Oceanogr. 26, 357–402.
Yu H., Tan Q., Chin M., Remer L. A., Kahn R. A., Bian H., et al. (2019). Estimates of African dust deposition along the trans-Atlantic transit using the decadelong record of aerosol measurements from CALIOP, MODIS, MISR, and IASI. J. Geophys. Res.: Atmospheres 124, 7975–7996. doi: 10.1029/2019JD030574
Zapata M., Jeffrey S. W., Wright S. W., Rodríguez F., Garrido J. L., Clementson L. (2004). Photosynthetic pigments in 37 species (65 strains) of haptophyta: Implications for oceanography and chemotaxonomy. Mar. Ecol. Prog. Ser. 270, 83–102. doi: 10.3354/meps270083
Zapata M., Rodriguez F., Garrido J. L. (2000). Separation of chlorophylls and carotenoids from 1 marine phytoplankton: A new HPLC method using a reversed phase C8 column and pyridine-2 containing mobile phases. Mar. Ecol. Prog. 195, 29–45. doi: 10.3354/meps195029
Ziveri P., de Bernardi B., Baumann K.-H., Stoll H. M., Mortyn P. G. (2007). Sinking of coccolith carbonate and potential contribution to organic carbon ballasting in the deep ocean. Deep-Sea Res. II 54, 659–675. doi: 10.1016/j.dsr2.2007.01.006
Appendix A
List of taxa identified by Light- and Scanning Electron Microscopy. Holococcolithophores (HOL) indicated in bold italics.
Acantoica acanthos
Acantoica quattrospina
Algirosphaera robusta
Alisphaera spp.
Alisphaera unicornis
Anacanthoica cidaris
Braarudosphaera bigelowii
Calcidiscus leptoporus
Calcidiscus leptoporus ssp. quadriperforatus HOL
Calciosolenia brasiliensis
Calciosolenia corsellii
Calciosolenia murrayi
Calyptrolithophora papillifera HOL
Calyptrosphaera cialdii HOL
Calyptrosphaera dentata HOL
Ceratolithus cristatus HET coccolithomorpha type
Cocccolithus pelagicus
Corisphaera sp. HOL
Coronosphaera binodata
Coronosphaera maxima
Coronosphaera mediterranea
Coronosphaera mediterranea HOL hellenica type
Coronosphaera sp. Y
Cyrtosphaera cf. aculeata
Discosphaera tubifera
Emiliania huxleyi type B
Emiliania huxleyi type O
Emiliania huxleyi var. corona
Florisphaera profunda
Gephyrocapsa ericsonii
Gephyrocapsa muellerae
Gephyrocapsa oceanica
Gephyrocapsa ornata
Gephyrocapsa parvula
Gladiolithus flabellatus
Gliscolithus amitakareniae HOL
Hayaster perplexus
Helicosphaera carteri
Helicosphaera carteri HOL solid (“Syracolithus catilliferus”)
Helicosphaera HOL catilliferus type
Helicosphaera hyalina
Helicosphaera wallichii
Helladosphaera cornifera HOL
Helladosphaera pienarii I HOL
Homozygosphaera spinosa HOL
Homozygosphaera triarcha HOL
Michaelsarsia adriaticus
Michaelsarsia elegans
Oolitothus antillarum
Oolitothus fragilis
Ophiaster formosus
Ophiaster hydroideus
Ophiaster reductus
Palusphaera probertii
Palusphaera vandelii
Papposphaera lepida
Polycrater sp.
Pontosphaera japonica
Pontosphaera multipora
Pontosphaera spp.
Poricalyptra isselii HOL
Poricalyptra magnaghii HOL
Poritectolithus maximus HOL
Rabdosphaera clavigera
Rabdosphaera stylifera
Rabdosphaera xiphos
Reticulofenestra sessilis
Scyphosphaera apsteinii
Syracolithus sp. type A HOL
Syracosphaera mediterranea HOL wettsteinii type
Syracosphaera anthos
Syracosphaera anthos HOL (“Periphyllophora mirabilis”
Syracosphaera aurisinae HOL
Syracosphaera bannockii
Syracosphaera bannockii HOL
Syracosphaera corolla (coccoliths)
Syracosphaera dilatata
Syracosphaera gaarderae
Syracosphaera gaarderae HOL
Syracosphaera halldalii
Syracosphaera histrica
Syracosphaera lamina
Syracosphaera mediterraea HOL gracillima type
Syracosphaera mediterranea HOL hellenica type
Syracosphaera molischii
Syracosphaera molischii type 3
Syracosphaera nana
Syracosphaera nodosa
Syracosphaera noroitica
Syracosphaera operculata
Syracosphaera ossa type 1BCs
Syracosphaera pirus
Syracosphaera prolongata
Syracosphaera protrudens
Syracosphaera pulchra
Syracosphaera pulchra HOL oblonga
Syracosphaera pulchra HOL pirus
Syracosphaera reniformis
Syracosphaera rotula
Syracosphaera sp. (C-D)
Syracosphaera sp. aff. S. nodosa
Syracosphaera sp. aff. to S. orbiculus (image B)
Syracosphaera sp. type J
Syracosphaera spp.
Syracosphaera tumularis
Turrilithus latericioides
Umbelosphaera irregularis
Umbelosphaera tenuis
Umbilicosphaera anulus
Umbilicosphaera foliosa
Umbilicosphaera hulburtiana
Umbilicosphaera sibogae
Zygosphaera amoena HOL
Zygosphaera cf. marsilii HOL
Zygosphaera marsilii HOL
Keywords: coccolithophores, phytoplankton, ecological gradients, nutricline, Westerly Wind Biome, Trade Wind Biome, Saharan dust, Atlantic Meridional Transect
Citation: Guerreiro CV, Ferreira A, Cros L, Stuut J-B, Baker A, Tracana A, Pinto C, Veloso V, Rees AP, Cachão MAP, Nunes T and Brotas V (2023) Response of coccolithophore communities to oceanographic and atmospheric processes across the North- and Equatorial Atlantic. Front. Mar. Sci. 10:1119488. doi: 10.3389/fmars.2023.1119488
Received: 08 December 2022; Accepted: 06 March 2023;
Published: 04 April 2023.
Edited by:
Gilles Reverdin, Centre National de la Recherche Scientifique (CNRS), FranceReviewed by:
Stella Psarra, Hellenic Centre for Marine Research (HCMR), GreeceAlex J. Poulton, Heriot-Watt University, United Kingdom
Copyright © 2023 Guerreiro, Ferreira, Cros, Stuut, Baker, Tracana, Pinto, Veloso, Rees, Cachão, Nunes and Brotas. This is an open-access article distributed under the terms of the Creative Commons Attribution License (CC BY). The use, distribution or reproduction in other forums is permitted, provided the original author(s) and the copyright owner(s) are credited and that the original publication in this journal is cited, in accordance with accepted academic practice. No use, distribution or reproduction is permitted which does not comply with these terms.
*Correspondence: Catarina V. Guerreiro, Y2F0YWd1ZXJyZWlyb0BmYy51bC5wdA==