 Xavier Sánchez-Artús1*
 Vicente Gracia1
 Manuel Espino1
 Joan Pau Sierra1
 Jordi Pinyol2
 Agustín Sánchez-Arcilla1
- 1Laboratori d’Enginyeria Marítima (LIM), Departament d’Enginyeria Civil i Ambiental (DECA), Universitat Politècnica de Catalunya (UPC), Barcelona, Spain
- 2Institut Cartogràfic i Geològic de Catalunya, Unitat de Processos Actius i Servei d’Informació de Riscos Geológics (SIRG), Barcelona, Spain
Coastal flooding and eros-ion caused by extreme events are the main factors responsible for beach hazards. This effect will be exacerbated by the sea level rise induced by climate change. The present work determines the vulnerability to erosion and flooding along 55 beaches grouped in different coastal archetypes, representative of the Catalan coast. The vulnerability assessment has been done through the numerical simulation of different combinations for projected waves and mean water levels under present conditions and the climate change scenarios RCP4.5 and RCP8.5 for the year 2100. A storm event approach has been used to determine coastal flooding and erosion with return periods of 50, 100, and 500 years using the XBeach numerical model. Results show that shoreline retreat is not the best proxy to characterize the erosion. The low-lying nature of the coast, the non-presence of well-developed berms, and the existence of river mouth and torrents govern the coastal flooding. The sea level rise appears to be a dominant variable in coastal hazards.
1 Introduction
Climate change and its associated sea level rise are expected to increase the risk of flooding in coastal regions (Zhang et al., 2004; Nicholls et al., 2007; Condon and Peter Sheng, 2012) where much of the population is concentrated (Nicholls and Misdorp, 1993; Small and Nicholls, 2003) and an important portion of the global gross domestic product is produced (Turner et al., 1996; Nordhaus, 2006). In Europe, about 13 million people would be threatened by coastal flooding (Nicholls and Klein, 2005). According to Hinkel et al. (2010), the Mediterranean coast appears to be one of the most vulnerable regions due to the rapid growth of the coastal population and the boom of tourism, which has become an important economic driver (P. B. UNEP and MAP, 2016). This surge in population is the primary cause of the coastal landscape reshaping, with the occupation of the first hundreds of meters in front of beaches by houses and associated transport infrastructures. In these areas, coastal flooding and erosion have significant economic consequences (Gracia and Jiménez, 2004; Sánchez-Arcilla et al., 2014; García-León et al., 2015) and beaches represent the last natural defense.
Coastal vulnerability at a regional scale, here understood as of hundreds of kilometers, is commonly assessed by the definition of vulnerability indices. Roukounis and Tsihrintzis (2022) present a critical review of such approach. The use of an index requires the simplification of the problem through the selection of few fundamental variables, which roughly reflects the specifications of the analyzed coastal stretch but permits a regional view of the hazard. Coastal flooding and erosion indices are typically parameterized by wave energy and run-up, mean water level, and the morphological characteristics of the area such as land elevation and emerged beach slope [ (Ozyurt et al., 2008; Bosom and Jiménez, 2011a; Yin et al., 2012; Tatui et al., 2019) among many others] The common metrics used are the shoreline retreat and the temporary inundated area (Ranasinghe, 2016a; Ranasinghe et al., 2021). However, the real detailed magnitude of such hazards depends not only on the existing hydrodynamic forcing but also on the interactions with the existing beach morphology, which are not usually reflected in the aggregated indices.
The development of numerical models has allowed us to obtain a detailed description of coastal flooding and erosion and has been applied at the local scale by many authors [e.g (Martinelli et al., 2010; Villatoro et al., 2014; Barnard et al., 2019; Orejarena-Rondon et al., 2019), among many others] There are few examples in which numerical models have been used on a regional scale or global scale (Athanasiou et al., 2019; Agulles et al., 2021). Ranasinghe (2016b) pointed out the inability of models to provide sufficient reliable predictions that integrate climate change effects. A solution for that conundrum is the characterization of the hazards induced by episodic events with a predefined time horizon (Li et al., 2014; Ranasinghe and Callaghan, 2017; Ranasinghe et al., 2021). However, the computational costs that such numerical approach requires when dealing with large coastal stretches have prevented them from being widely used. A simplification of such complexity is the use of the coastal archetype concept (Sánchez-Arcilla et al., 2016a; Haasnoot et al., 2019), i.e., a coastal stretch that shares some morphohydrodynamic and land use commonalities. The use of coastal archetypes allows researchers to catch the 2D effects over the hydrodynamics and morphodynamics by incorporating spatial changes in the bathymetry and topography.
The goal of this article is to determine the coastal vulnerability to flooding and erosion at a regional scale under extreme events with return periods of 50, 100, and 500 years for present, RCP4.5, and RCP8.5 scenarios (IPCC, 2022). The analysis is performed along the Catalan coast for a set of selected coastal archetypes representative of a highly urbanized littoral. The use of coastal archetypes permits the identification of coastal response patterns making the results much more extrapolated to other coastal stretches. This work is organized as follows: Section 2 presents the study area and presents hydrodynamic conditions, future climate for RCP8.5 scenarios, and the modeling framework. Section 3 shows the erosion and flooding results by extracting the coastal response patterns. Finally, Section 4 summarizes the main conclusions of the work.
2 Materials and methods
2.1 Study area
The Catalan coast, an autonomous region located at the northwestern Spanish Mediterranean, is about 920 km long. It comprises a wide variety of coastal types from sandy and gravel beaches, cliffs, to armored coastal stretches. During the last decades, it experienced an intense urban development (Jiménez et al., 2012; Jiménez et al., 2017). The present coastal socioeconomic activities in the area, similar to other Mediterranean highly developed regions, are mainly governed by commerce, tourism, agriculture, and residential housing (Sardà et al., 2005) that have shaped the current coastal landscape.
We select a series of beaches trying to fulfill the whole diversity of coastal archetypes, as described in (Sánchez-Arcilla et al., 2016b; Haasnoot et al., 2019), present at the Catalan region. They go from low-lying to high coasts and from semi-natural environments to urban beaches, where the vast majority of population and economic activities are situated. Moreover, we define the studied beaches following the criterion for the littoral cells described in (CIIRC, 2010). We group the beaches with this standard in nine different sections, covering the three littoral provinces of Catalonia (Tarragona, Girona and Barcelona). We split some of these sections in the simulation process to reduce computational time due to grid density, but to show the results in a graphical way, they were combined again. We use data from (CIIRC, 2010) to obtain the granulometry. A representative sample was taken at the center of each beach near the shoreline and subjected to analysis in a laboratory setting. The sediment was washed, dried, and then separated through a mechanical sieve. The granulometric parameters were obtained using the Gradistat software (Blott and Pye, 2001). Table 1 shows the basic characteristics of the analyzed beaches. We consider a total of about 58 km of coast covering 55 different beaches. We define the sediment as uniform and uni-layered since the entire area is occupied by sand with non-cohesive sediment observed.
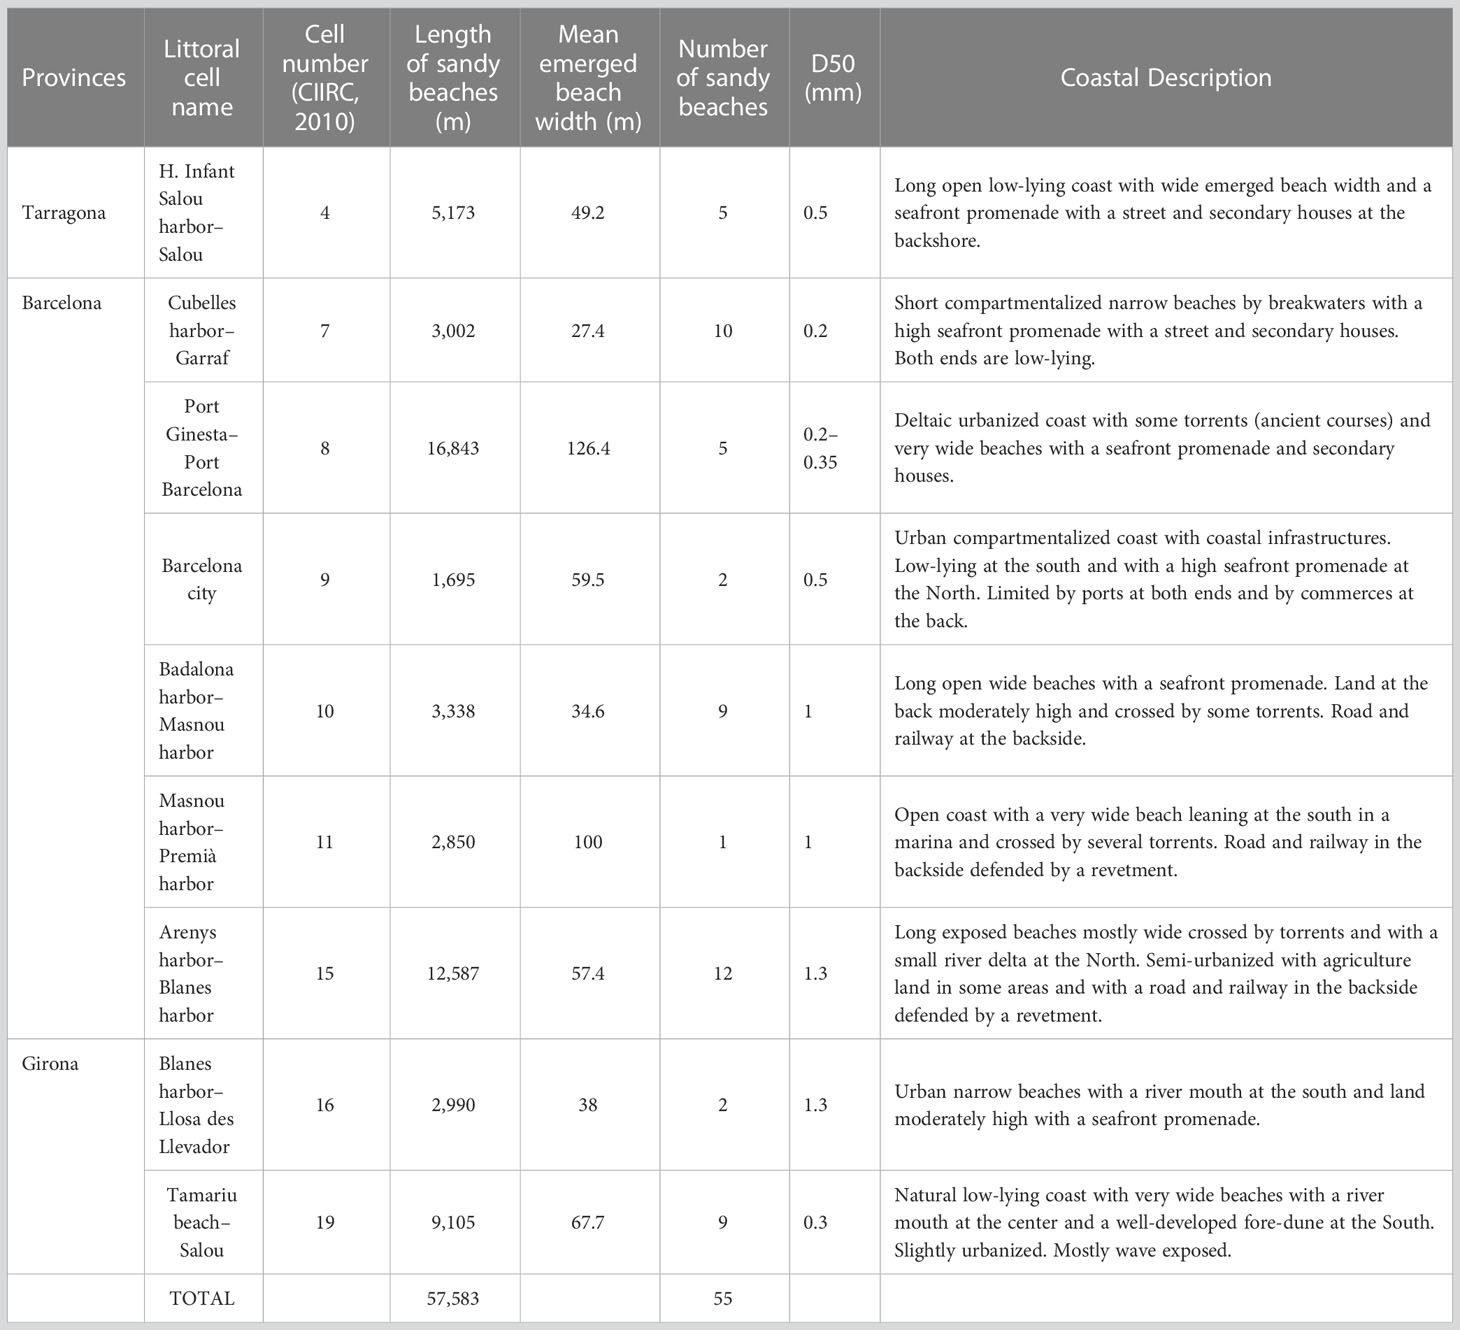
Table 1 Description of the studied units.
We denominate the units using the same criterion as (CIIRC, 2010) to make our results comparable and establish a correlation between both studies. Unit 4, at the south, corresponds to the coastal stretch from Vandellòs harbor to Hospitalet Infant-Salou. The main use is recreational tourism with a high-medium rate of occupation. It is surrounded by urban cores with some natural areas. The municipalities have reported some sediment loss problems and occasional damages on the promenade and the beach furniture associated with extreme events. Unit 7 includes some representative beaches of the Cubelles-Garraf littoral cell. It is mainly a recreational area with an intensive degree of occupation with the back beach covered by secondary houses, campsites, and some industrial areas. The reported problems are mainly related to the general loss of emerged beach surface, which has forced the administration to nourish some coastal sections when the emerged width is very narrow. Unit 8, from Ginesta harbor to Barcelona harbor, shares a recreational use with a semi-natural landscape with a low degree of occupation. Again, problems related to loss of sediments are reported added to some coastal flooding events during storms, especially at two active torrents. The emerged beach slope is gentle at the south of the unit with values ranging from 0.06 to 0.1 and steep values up to 0.2 at the north, which indicates a protection of the shoreline against energetic waves. At the south, the east–west shoreline orientation is less exposed to the most energetic wave conditions from the east whereas the northern sector with a northeast–southwest orientation is fully exposed to wave action. Unit 9 is an example of urban compartmentalized coast with coastal infrastructures (Barcelona). It is a low-lying coast at the south with a high seafront promenade at the north, limited by ports at both ends with commerces at the back. The area also presents high damages to the promenade and beach infrastructures when huge storm events appear. Unit 10 covers Badalona harbor to Masnou harbor. This is constituted by long open wide beaches with a seafront promenade. The land at the back is moderately high and the beaches are crossed by some torrents. A main road and railway are present next to the beach. The ministry has intervened occasionally in the area after the impact of severe storms; however, no coastal flooding events have been reported. A uniform emerged beach slope up to 0.25 exists together with a well-developed high berm. Unit 11, from Masnou harbor to Premià harbor, is represented by a single exposed beach, very wide, leaning at the south in a marina and crossed by several torrents. A road and a railway at the back is defended by a revetment. It presents steep slopes of 0.21–0.25 with a berm up to 1.51–2 m. This beach is fully recreational with an intense–moderate occupation and some problems of loss of beach width at the northern side. Unit 15 corresponds to Arenys harbor–Blanes harbor and is an example of long exposed beaches, mostly wide crossed by torrents and limited with a small river delta at the north. This is a semi-urbanized coast with agriculture land at the back and with a road and a railway defended by a revetment. This coastal stretch shows an intense degree of occupation sharing urban cores with industrial, agricultural, and natural areas. The emerged beach shows steep slopes up to 0.25 with again well high-developed berms indicating the existence of coarse sediment and important beach widths. No significant flooding events are reported. Unit 16, corresponding to Blanes harbor until Llosa des Llevadors, is an urban narrow coast with a river mouth at the south and moderately high lands at the north occupied by a seafront promenade. Severe coastal flooding episodes are reported at the north close to the Tordera river mouth (Gracia and Jiménez, 2004). Finally, Unit 19, from Tamariu beach to Escala harbor, is an example of a natural low-lying coast with very wide beaches and a river mouth at the center with a well-developed fore-dune at the south. The area is slightly urbanized and mostly exposed to wave action. The slope in this area is gentle, with values ranging from 0.05 to 0.1. Figure 1 shows the location of the analyzed units.
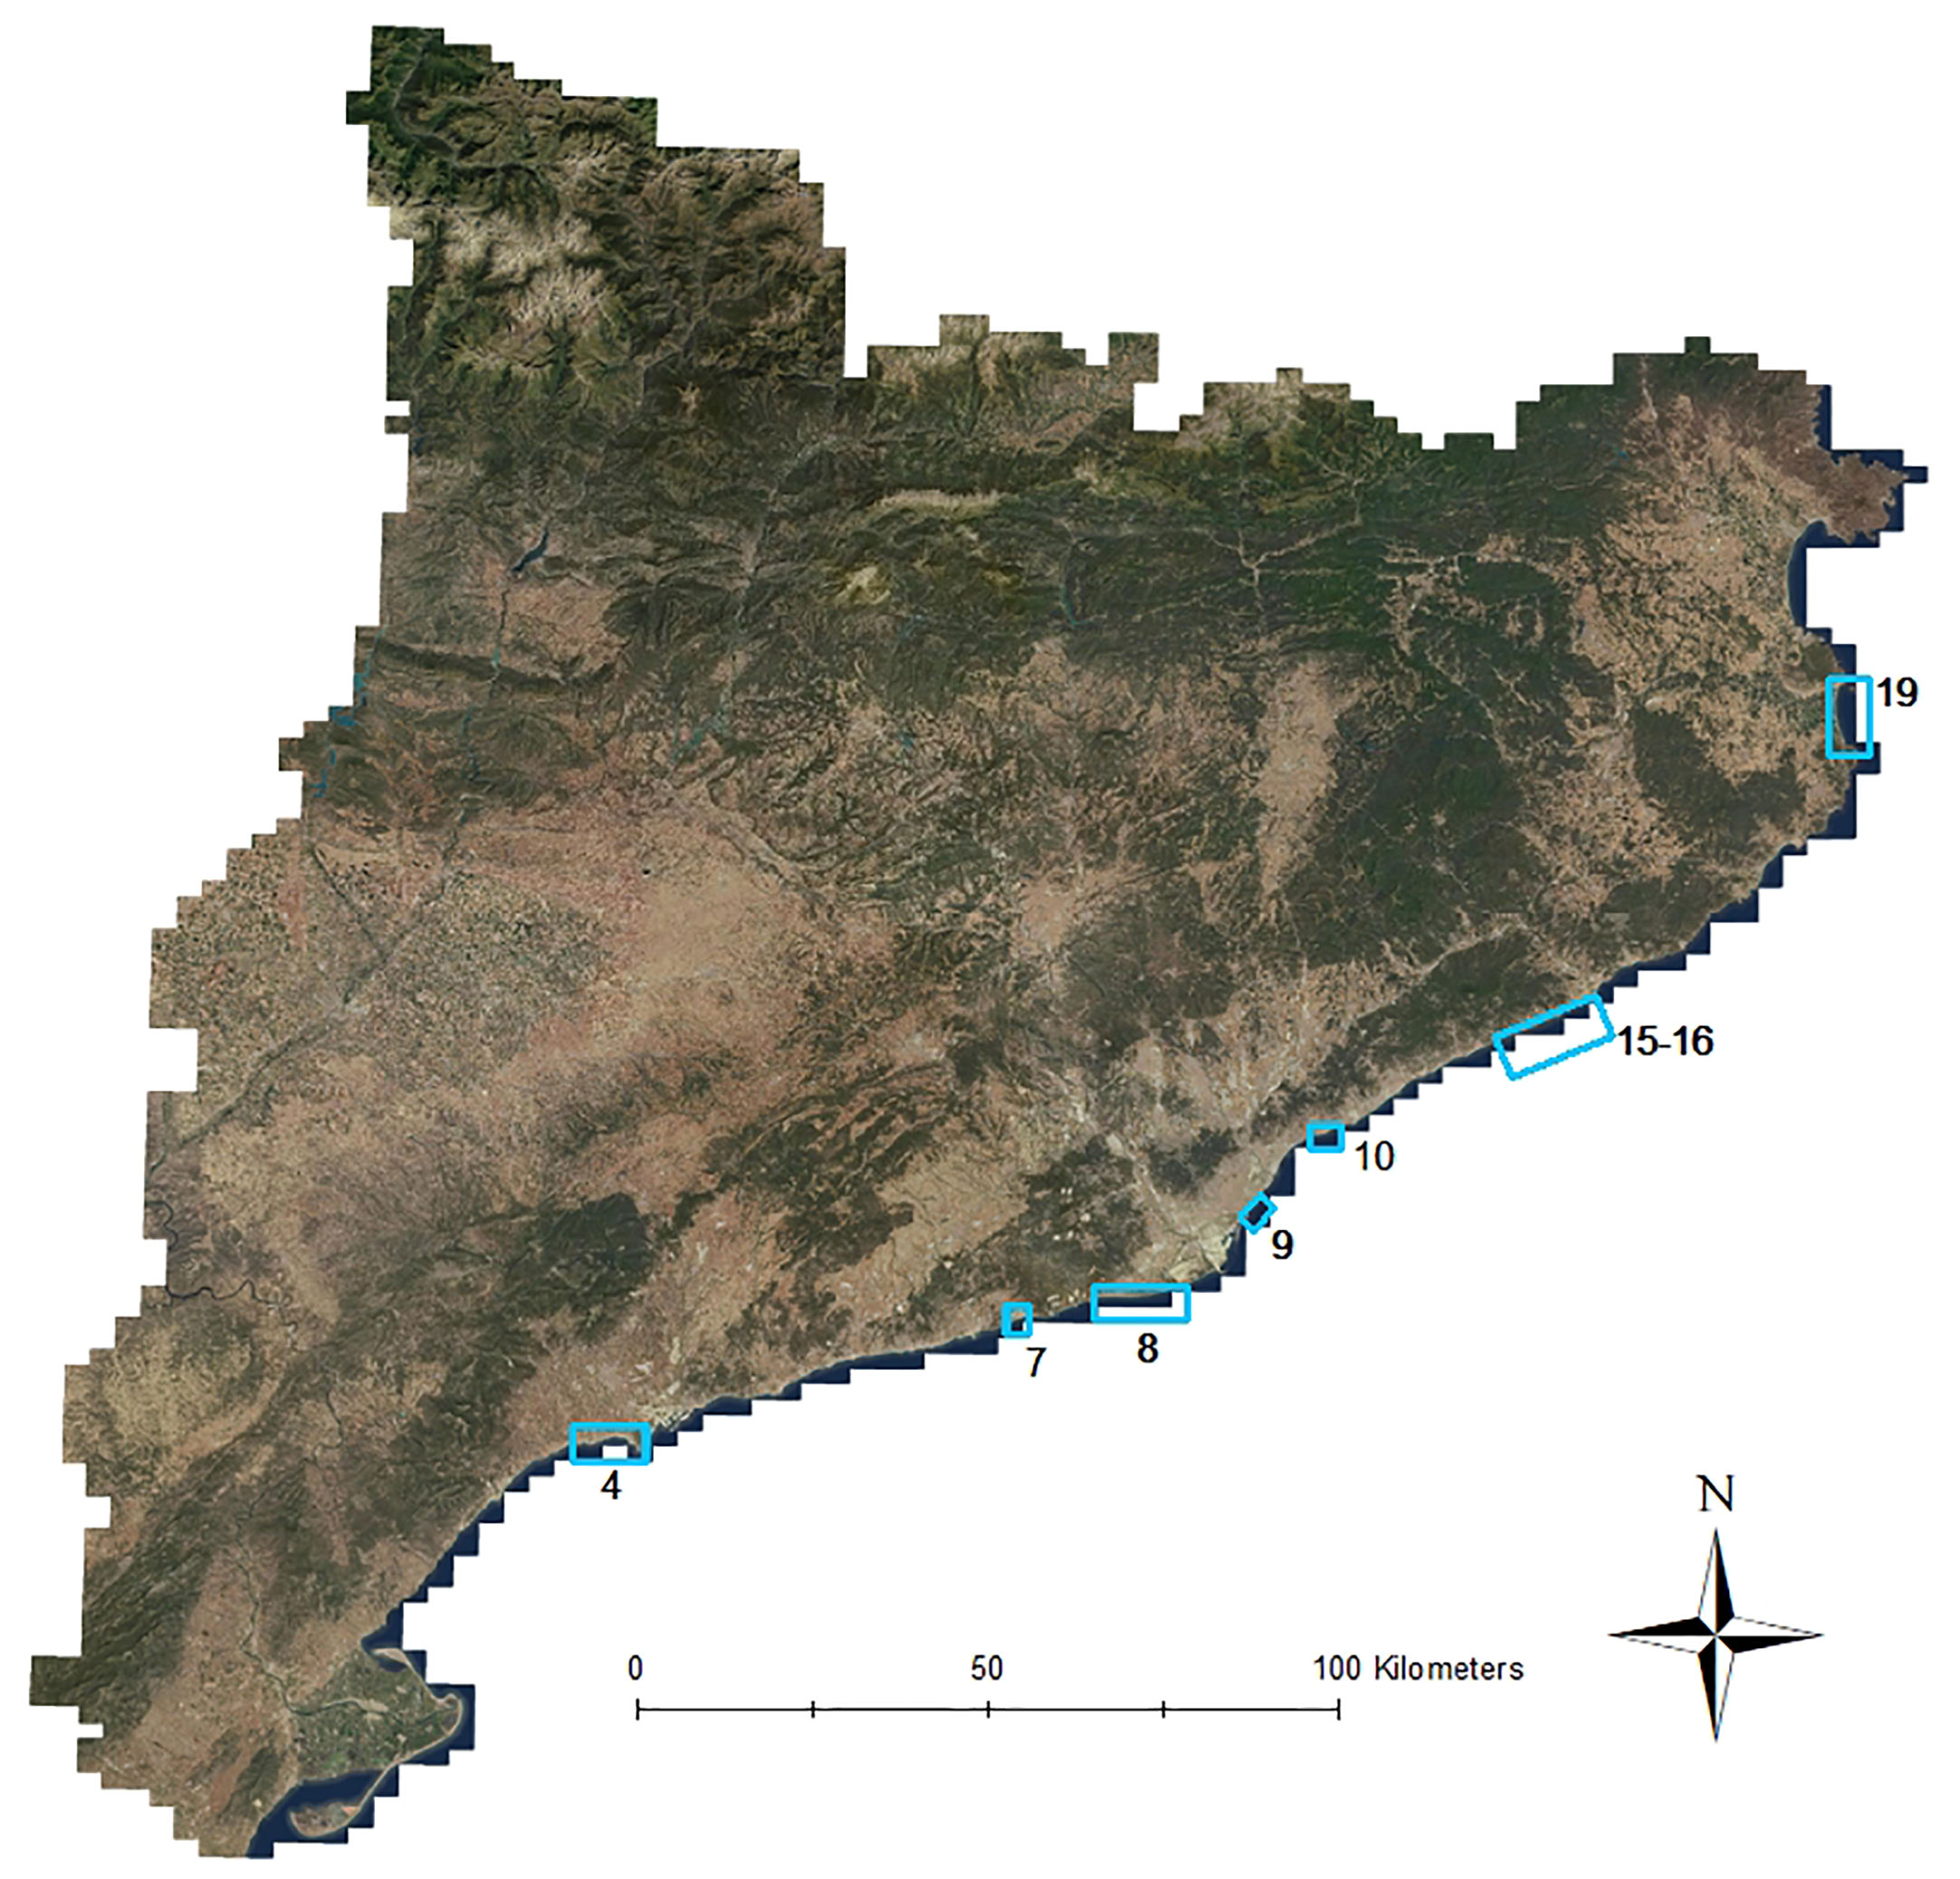
Figure 1 Map of Catalonia. Blue rectangles represent the different study units.
2.2 Present conditions and future climate
We aim to study the problems for both present and possible future climate change scenarios. To do so, we use the years 1985–2005 as reference for the actual state, defining the associate hydrodynamic conditions; meanwhile, in order to test climate change scenarios, we select the period from 2081 to 2100. This range represents long-term projections where we test different scenarios following Intergovernmental Panel on Climate Change (IPCC) predictions, which are called Representative Concentration Pathways (RCPs) (IPCC, 2022). First, we study RCP4.5, a scenario which establishes a stabilization of the greenhouse gases to 650 ppm at the second half of the century, among other variables (Thomson et al., 2011). Then, we also cover the worst and most aggressive predictions, which represent the RCP8.5. This scenario assumes that there will be a continuation in the use of fossil fuels, together with an increment of the greenhouse gas emissions without implementing mitigation actions (Schwalm et al., 2020).
The three selected scenarios (actual, RCP4.5, and RCP8.5) have been combined with the conditions of representative storms with associated return periods (hereinafter RP) of 50, 100, and 500 years resulting in nine different states for each study case. We define the storm wave regime using data developed by “Instituto de Hidráulica Ambiental de Cantabria” (IHC) in the framework of the project “Elaboración de la metodologia y bases de datos para la proyeccion de impactos de cambio climático a lo largo de la costa española” granted by Ministerio para la Transición Ecologica (MITECO) (IH Cantabria, 2019). It can be accessed via a server at http://thredds.ihcantabria.com/PRME/catalog.html. The wave data are organized into nodes spaced 0.08° apart, covering the entire study area. The selected hydrodynamic parameters, including significant wave height, peak period, and direction, are recorded hourly in the database and used to calculate the extreme regime of each node using the Peak Over Threshold (POT) method (Ferreira. and Soares, 1998) for both current and projected conditions, as derived from various climatic models.
To define when we consider that a storm starts, we select a threshold value of 2 m (Bosom and Jiménez, 2011b) for the wave height. Then, to guarantee that the event is a real storm, in some moment, the wave height has to reach 2.3 m, what we call minimum threshold for extreme events. Finally, to take only the storms that are considered extreme and that are important for our analysis, we define a threshold for extreme events, which in our case is 2.6 m. With the parameters corresponding to the data that meet these conditions, we fit a probability distribution using Weibull and Gumbel for the methods of maximum likelihood, momentum, and least squares (Goda, 1988; Castillo and Sarabia, 1994; Coles, 2001). To guarantee a minimum of values in the fit, we do not take into account the wave direction, following a scalar approach for the extreme analysis. Then, we define the coefficients of directionality to better reproduce the fit for these directions. In the next step, we select the central band of the fit to take the values of the wave height for the different RPs. Finally, we choose the best fits for each node and climate model, with the final values being representative of the ensemble of all values. We match the periods using an exponential fit of the form Tp = a*Hs*b, where Tp is the Peak Period and Hs is the Significant Wave Height. We pick the final conditions as the ones that follow the pattern of the highest Hs with the most perpendicular direction to the coast on deep waters.
For the definition of the mean water level (MWL), two processes have been considered: first, the meteorological tide or storm surge, which has been fixed to 0.3 m for all cases and scenarios since the analyzed conditions are storms and the local punctual increase of the level is considered invariable (Bolaños et al., 2009; Lin-Ye et al., 2020); second, the sea level rise (SLR), induced by climate change, that we set to 0.55 m (ranging from 0.39 to 0.72 m) for the RCP4.5 scenario and 0.84 m (ranging from 0.6 to 1.1 m) for the RCP8.5 scenario, following the recommendations proposed by the “Oficina Catalana del Canvi Climatic” (OCCC) (Generalitat de Catalunya, 2016; IPCC, 2022). The combination of both processes results in three different MWL conditions, which are 0.3 m for the present state, 0.85 m for the RCP4.5 scenario, and 1.14 m for the RCP8.5 scenario.
2.3 Modeling
The hydromorphodynamical model XBeach was selected for this study. It is a two-dimensional model that allows one to study wave propagation, sediment transport, and morphology changes on beaches, among others (Roelvink et al., 2010; McCall et al., 2014). For the study area of this work, the model has been previously validated in (Gracia et al., 2013; Sanuy and Jiménez, 2019; Grases et al., 2020). The needs of the model include information based on the topobathymetry of the study area as well as the wave characteristics of the simulated event. We generate the different grids using the same methodology for all the study cases, combining topography and bathymetry from different resources. For the topographies, Institut Cartogràfic i Geològic de Catalunya (ICGC) provides a 5 × 5-m-resolution Digital Elevation Model (DEM) while the bathymetries are generated from digitization of high-resolution screenshots taken from nautical charts of the web page “Navionics” using Geographic Information Systems (GIS) software. The combination of both derives in a 10 × 10-m-resolution grid whose resulting files are modified to have the correct XBeach formats. With these conditions, the final mesh begins at a depth of 30 m for the offshore limit, which is sufficient for the model to function optimally. We complete the model setup with the parameters extracted in Section 2.2, finally referencing the data in ETRS89 coordinate system to easily represent the results on the resources provided by ICGC.
For each study area, we simulate the nine different scenarios, one for each combination of 50, 100, and 500 years of RP and the mean water level corresponding to present or future conditions. The study considers storms as a 12-h duration event with constant characteristics, helping to reduce computational time while focusing on the peak of the storm, which corresponds to the point of highest impact (Mendoza and Jiménez, 2008; Mendoza et al., 2011). Since the increase of simulation velocity is a crucial factor, we use the Message Passing Interface (MPI) module from XBeach, which allows one to parallelize the code and simulate with simultaneous processors, which is four in our case (Clarke et al., 1994; Rautenbach et al., 2022). This strategy helps to speed up the process, resulting on an average computational time of 1 h per case, while if serial computing was used, the average time could go up to 5–6 h per case. We visually represent coastal flooding as polygons generated from the results of the model that contain the wet zones, i.e., the inundated areas, of the simulated domains during the event. The model sometimes classify low levels as flooded when it is not true due to errors on the definition of the output variables combined with the structure of the grid, so we decide to only count a point as wet when it surpasses 0.005 m of water level for the node. Moreover, to deem an area as inundated, we also determine that the point of the grid has to be considered wet by the model for more than 4 h over all the 12-h simulation as seen in Equation 1. This decision relies on the fact that once the model detects that the water touches a cell even if it is only a few centimeters, all the 10 × 10 m node is considered flooded. With this strategy, we expect to minimize these situations of false positives and only represent those areas that remain inundated for extended periods.
On the other hand, we represent erosion in terms of coastline retreat. Since we only study the storm event, for the present scenarios, we fix the reference level of the coastline to 0.3 m due to the storm surge effect. Then, for the simulations involving climate change scenarios, we redefine the coast baseline to reflect the levels associated with the SLR and the storm surge, which are 0.85 m and 1.14 m, respectively, for RCP4.5 and RCP8.5. The coastline retreat is characterized as the difference between this level and the final position of the same line at the end of the event. The comparison between final state coastlines between different simulated scenarios is also treated as changes in the coastline retreat.
Finally, we present the visualization of the results in a graphical way through a viewer developed by Institut Cartogràfic i Geològic de Catalunya (ICGC). The web viewer https://visors.icgc.cat/PIMA-AdaptaCostas/includes part of the vector information prepared for the PIMA Adapta Costas project. The objective of the web viewer is to make cartographic information available to the public about the impacts of coastal dynamics on the coast of Catalonia, including climate projections that take climate change into account. The information is organized in tabs, the content of which is internally structured in layers. Among other interesting information from other studies, the results obtained from this paper can be accessed through the “Escenarios” tab, going to “Inundación por oleaje” for the flooding results and “Línea de la costa final despues de un temporal de 12 horas” for the erosion. Then, all the combinations of scenarios presented in the study can be selected and visualized into the map. Background cartography, both topographic and hybrid orthophoto, are ICGC own products for Catalonia and OSM for the rest of the world.
3 Results and discussion
3.1 Flooding
Following the methodology described in Section 2.3, we perform an analysis of the inundation for all the nine different scenarios, combining storms and sea level rise, but to easily compare, define patterns, and better understand the figures, we decide to show only the results for the lowest and highest RPs (50 and 500 years) combined with the actual conditions and the worst scenario corresponding to RCP8.5. From now to the end of this section, the figures match the color light blue to actual conditions and 50 years of RP, dark blue to actual conditions and 500 years of RP, light lilac to RCP8.5 and 50 years of RP, and dark lilac to RCP8.5 and 500 years of RP. We classify the units depending on the impacts we observe, creating three different groups.
3.1.1 Low-flooded beaches
We consider in this group beaches that do not experience flooding impacts regardless of the scenario. Figure 2 corresponds to Unit 10 where we observe little changes depending on the scenario but none of them represents a serious risk of flooding. This matches with the expected results regarding the information provided in Section 2.1 where the coast is classified as high with steep slopes and a well-developed berm, and no episodes of flooding were reported. We can also observe a little bit of inconsistency on the matching between the coastline and the flooding polygons. This will happen through all the cases because the orthophoto was not taken at the same time as the topobathymetry. Moreover, it is highly difficult for the interpolation through the grid generation to fit perfectly with the baseline. In Figure 3, we observe Unit 11. As with the previous one, although some changes are observed, the areas of interest corresponding to the whole beach environment and the promenade are unaffected. Again, we detect consistency related to the description of the unit where a well-developed berm together with high slopes stops the water from inundating the area. Finally, in Figure 4, we see the section corresponding to Units 15 and 16, and in this case, although we divided this section into subsections to correctly generate hydrodynamic conditions and optimize computational time when simulating, we show the units together as they are correlated. We observe the same low impacts for the beach environment, and once more, these areas present well-developed berms and steep slopes that can reduce the energy of the waves and reduce the flooding hazards. Specifically for the northern part of Unit 16, which corresponds to the northern part of Figure 4, flooding areas can be observed as described in Section 2.1. We also find a pattern that will be consistent for all the sections with these characteristics. When a river mouth is present as in this case (corresponding to La Tordera), the sea water enters the river. As we increase the sea level, this effect becomes more relevant.

Figure 2 Flooding lines distribution of Unit 10. (A) General view of the unit. (B, C) Close-up view. Light blue = actual conditions, RP = 50 years; dark blue = actual conditions, RP = 500 years; light lilac = RCP8.5, RP = 50 years; and dark lilac = RCP8.5, RP = 500 years.

Figure 3 Flooding lines distribution of Unit 11. (A) General view of the unit. (B, C) Close-up view. Light blue = actual conditions, RP = 50 years; dark blue = actual conditions, RP = 500 years; light lilac = RCP8.5, RP = 50 years; and dark lilac = RCP8.5, RP = 500 years.

Figure 4 Flooding lines distribution of Units 15 and 16. (A) General view of the unit. (B, C) Close-up view. Light blue = actual conditions, RP = 50 years; dark blue = actual conditions, RP = 500 years; light lilac = RCP8.5, RP = 50 years; and dark lilac = RCP8.5, RP = 500 years.
Generally, in the presented units, the same pattern has been observed where all of them are high coasts, due to steep slopes and to well-developed berms preventing the water to enter many meters into the beaches. Moreover, and as it can also be observed in Table S1 of the Supplementary Materials, climate change has a higher flooding effect than the intensity of the storm for these areas.
3.1.2 Medium-flooded beaches
We consider in this group beaches that experience flooding impacts at the beach but the promenade remains intact or barely impacted. In Figure 5, we see Unit 8. With the present conditions, the impacts are not important, but when we simulate the climate change scenarios, practically all the beach is inundated, turning sea level rise as the main variable responsible for major flooding events in this region (see Table S1). We do not classify this unit as highly flooded because the water is unable to reach the promenade. As described in Section 2.1, some coastal flooding events were reported and the southern part presents gentler slopes than the northern part, matching with our observation of the simulations where we see less flooded area at the upper part. The presence of vegetated dunes at the back of the beach that can be easily visualized in Figure 5 produces changes on the topography that may lead to the stop of the water before the promenade. Also, in this section, we observe the pattern of the river mouth explained in Section 3.1.1 four more times. Figure 6 corresponds to Unit 4 and follows the same pattern with climate change having the highest impact on the flooded area as can be also observed in Table S1. The unit is characterized in Table 1 as low-lying; this has gentle slopes, and for this reason, both the storm event and even more the increase of the sea level affect a lot of the beaches. Furthermore, the northern part of the unit has a highly flooded area even entering the city for the worst scenarios. Checking the slopes published in (CIIRC, 2010),we observed that this is one of the beaches with less inclination on the unit, giving strength to the fact that it is the most affected.

Figure 5 Flooding lines distribution of Unit 8. (A.1, A.2) General views of the unit. (B) Close-up view. Light blue = actual conditions, RP = 50 years; dark blue = actual conditions, RP = 500 years; light lilac = RCP8.5, RP = 50 years; and dark lilac = RCP8.5, RP = 500 years.

Figure 6 Flooding lines distribution of Unit 4. (A) General view of the unit. (B, C) Close-up view. Light blue = actual conditions, RP = 50 years; dark blue = actual conditions, RP = 500 years; light lilac = RCP8.5, RP = 50 years; and dark lilac = RCP8.5, RP = 500 years.
3.1.3 Highly flooded beaches
We consider in this group beaches that experience flood impacts both at the beach itself and at the promenade or even inside the city or village. The Barceloneta beach, corresponding to Unit 9 (Figure 7), with present conditions experiences flooding during severe episodes as described in Section 2.1. This situation has also been reported for extreme events such as the Gloria storm (year 2020) (Sancho-Garcıa et al., 2020; De Alfonso et al., 2021). Its low-lying nature and the high level of urbanization imply that when climate change scenarios are simulated, the resulting flooding area is much higher due to the fact that the rigid bottom (the urban area) is reached, and there is less sediment available to create a submerged bar that would lessen the impact of incoming waves. Furthermore, the low elevation of the backshore makes it easier for water to advance, allowing the waves to reach the urban non-erodible bottom, inducing a much more inundated surface that can extend up to 200 m inland. When analyzing the flooding within the storm, it can be seen that sea water enters, as expected, through the lowest points of the emerged beach and backshore, finally resulting in a complete homogeneous inundated area. Table S1 supports these interpretations as it can be seen from the flooded area under the highly energetic storm in the unit, which reaches all the beach and even beyond for all scenarios. Additionally, it can be seen how the problem will worsen with the rise of MWL, and even less intense storms will cause more damage. Unit 19 (Figure 8) presents the highest impact of all the studied cases. In the present conditions, we do not observe heavy impacts, but when climate change conditions are induced, the low-slope component of the area, together with the absence of a high promenade or any barrier that would prevent water from entering the land, results in an intense flooding rate, as seen in Unit 9, but in this case, the flat backshore is due to the presence of campsites and farmlands (see Table S1). The unique area where no flooding is present corresponds to the southern part that coincides with the presence of a well-developed fore-dune as stated in Section 2.1. Moreover, the preferential path of the water through the mouth rivers is also observed in this unit. Finally, in Unit 7 (Figure 9), a great part of the area could be classified as medium-flooded since the water stops at the seafront and does not enter the city, which is consistent with the explanation given in Table 1, classifying the coast as narrow with high promenades. However, the description also states that the ends of the beaches are low-lying, and as we can see in Figure 9, one of these zones presents the highest inundated ratio, with the water entering the city. This situation led us to finally classify the unit as highly flooded beaches.
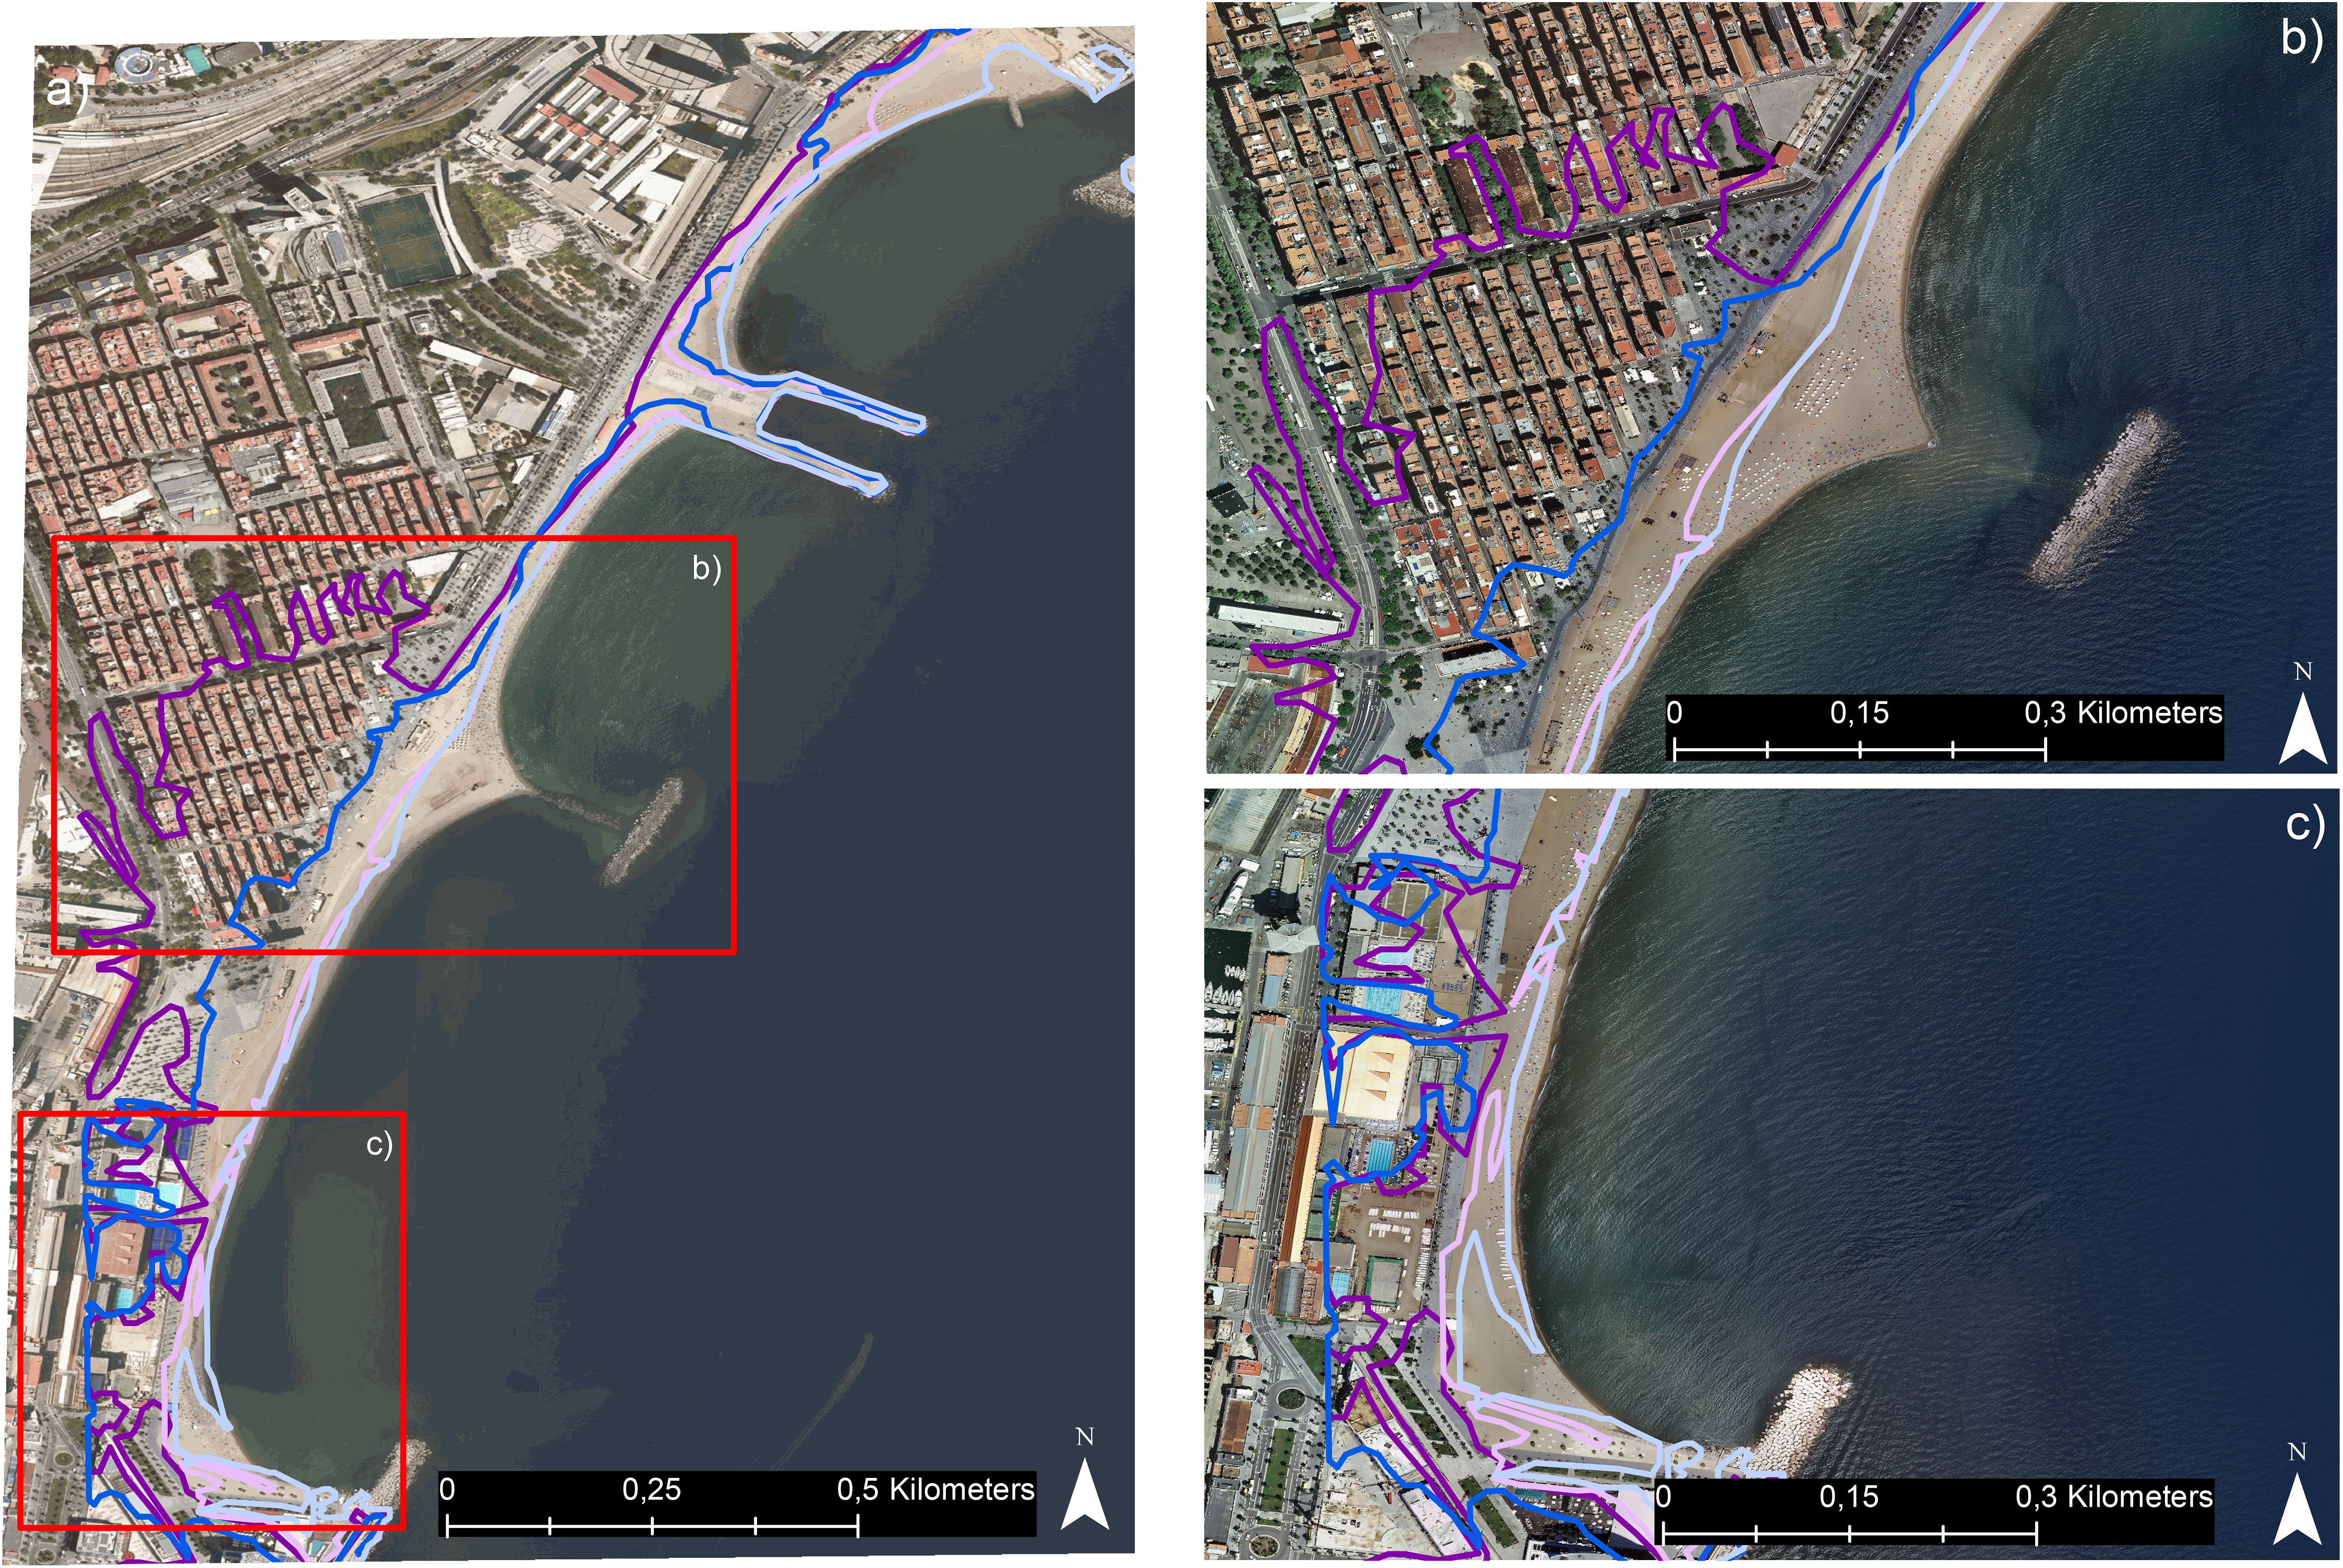
Figure 7 Flooding lines distribution of Unit 9. (A) General view of the unit. (B, C) Close-up view. Light blue = actual conditions, RP = 50 years; dark blue = actual conditions, RP = 500 years; light lilac = RCP8.5, RP = 50 years; and dark lilac = RCP8.5, RP = 500 years.
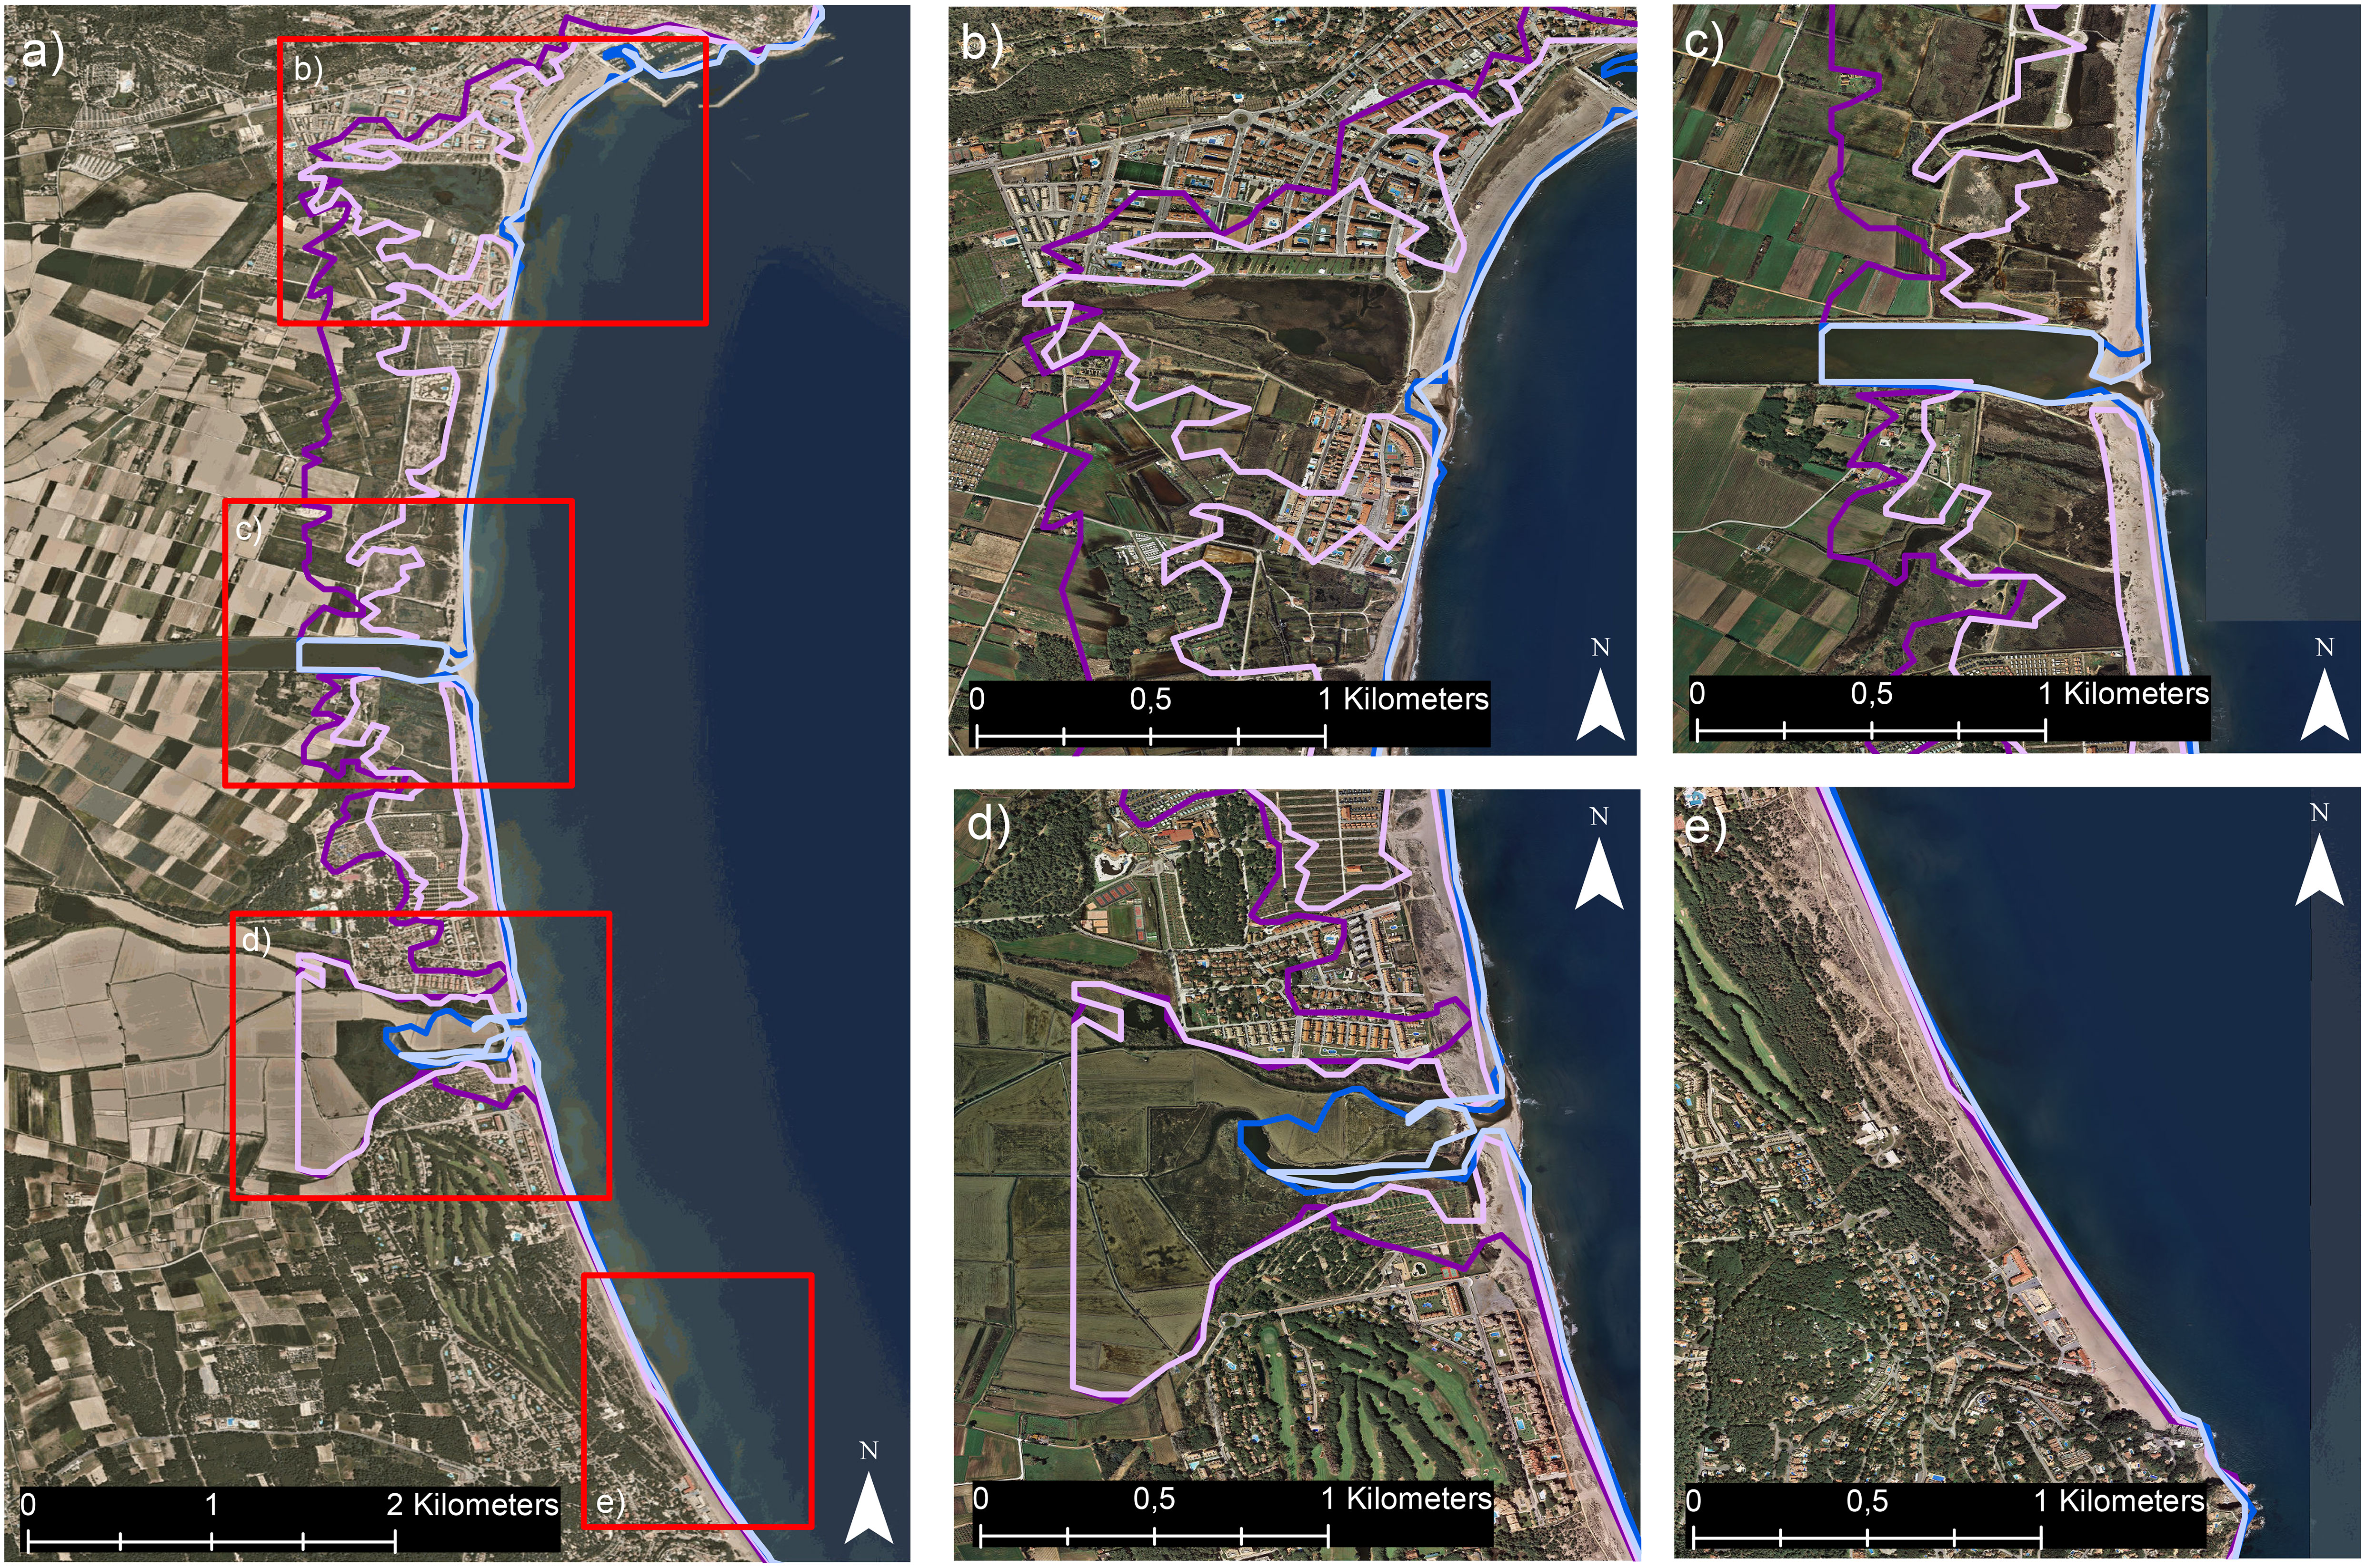
Figure 8 Flooding lines distribution of Unit 19. (A) General view of the unit. (B–E) Close-up view. Light blue = actual conditions, RP = 50 years; dark blue = actual conditions, RP = 500 years; light lilac = RCP8.5, RP = 50 years; and dark lilac = RCP8.5, RP = 500 years.
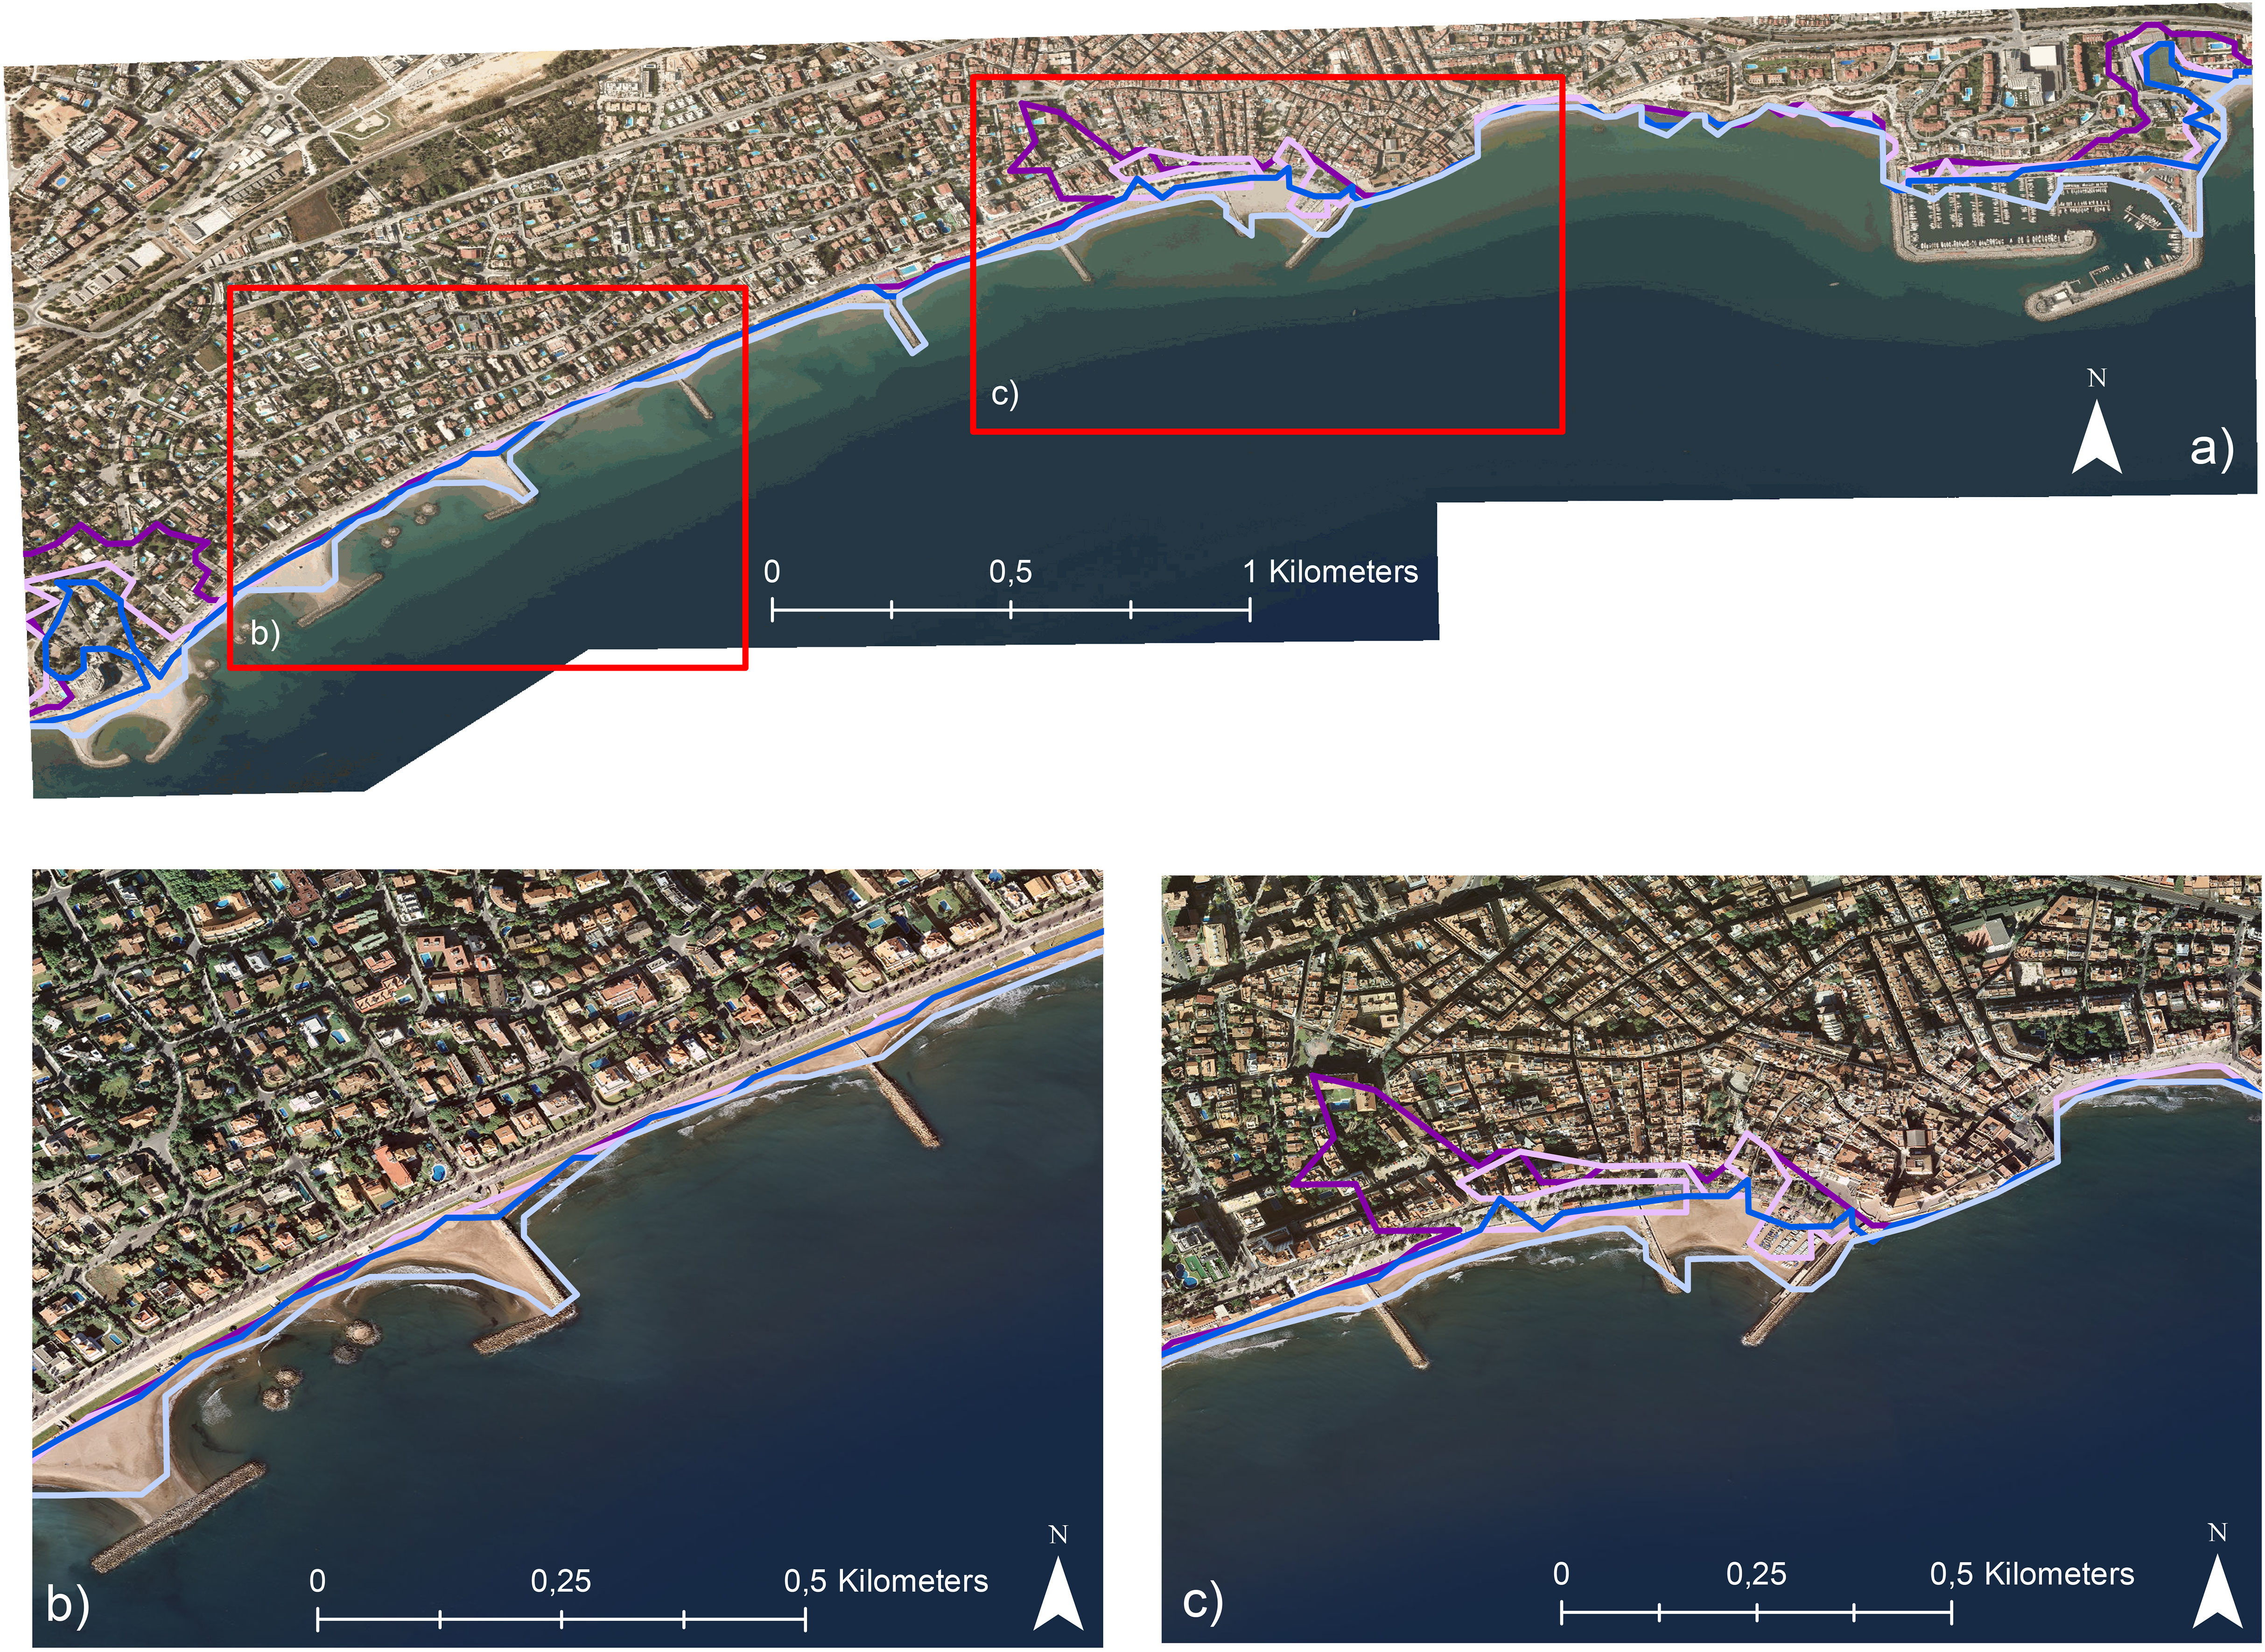
Figure 9 Flooding lines distribution of Unit 7. (A) General view of the unit. (B, C) Close-up view. Light blue = actual conditions, RP = 50 years; dark blue = actual conditions, RP = 500 years; light lilac = RCP8.5, RP = 50 years; and dark lilac = RCP8.5, RP = 500 years.
To summarize, the units categorized in this section are characterized by a low-lying coast with a flat backshore, which permits water to enter the land. These units lack any form of developed berm and feature gentle slopes. Despite the fact that the storms in the present state cause significant damages, the majority of the impacts are produced by the influence of climate change.
3.2 Erosion
As stated in Section 2.3, we study erosion using the retreat of the coastline as an indicator. After checking all the simulated cases, we find a common pattern for all the sections. First, and as we observe in Figure 10, selected arbitrarily to avoid preference, the retreat of the coastline derived from the storm is very low compared with the retreat due to the increasing of the mean water level. Furthermore, we have found that this increment is higher on low-steep beaches, as expected. In the specific case of Figure 10, the retreat after the pass of the RP 500 years’ storm in actual conditions is 3 m, while with the climate change conditions, it is nearly 30 m. This proportion has been observed in all the other cases. Although the retreat derived from the storms is not negligible when studying scenarios of high RPs, when graphed on a map, this change is barely visible, as we see in Figures 11, 12. We also find that while the increase on the mean water level causes the coastline to directly retreat, the erosion and sedimentation processes maintain its balance on the 0-m level. Since the equilibrium of the beach does not change between scenarios, the behavior is the same but with different intensities due to the quantity of water hitting the area. We propose that when using climate change scenarios and beaches in equilibrium for present conditions, some other modeling strategies could have been used in order to avoid changes in the 0-m baseline and more balances on the new water level (in these cases, 0.85 and 1.14 m). We have discussed the use of long simulations during the study, using the increase of the mean water level without storm conditions until the new equilibrium is reached and then the storm scenario is repeated, but this strategy was rejected because of computational constrains, lack of knowledge about the human interventions in the future, and specifications of the model.

Figure 10 Profile evolution corresponding to the middle of Unit 4. The top image shows the evolution in actual conditions and the bottom image shows that for the RCP8.5 scenario. The blue line shows the initial profile and the yellow line shows the final profile after the pass of an RP = 500 years’ storm. Vertical lines represent the initial coastline and the coastline retreat due to the storm pass. Dashed vertical lines help to compare between scenarios.
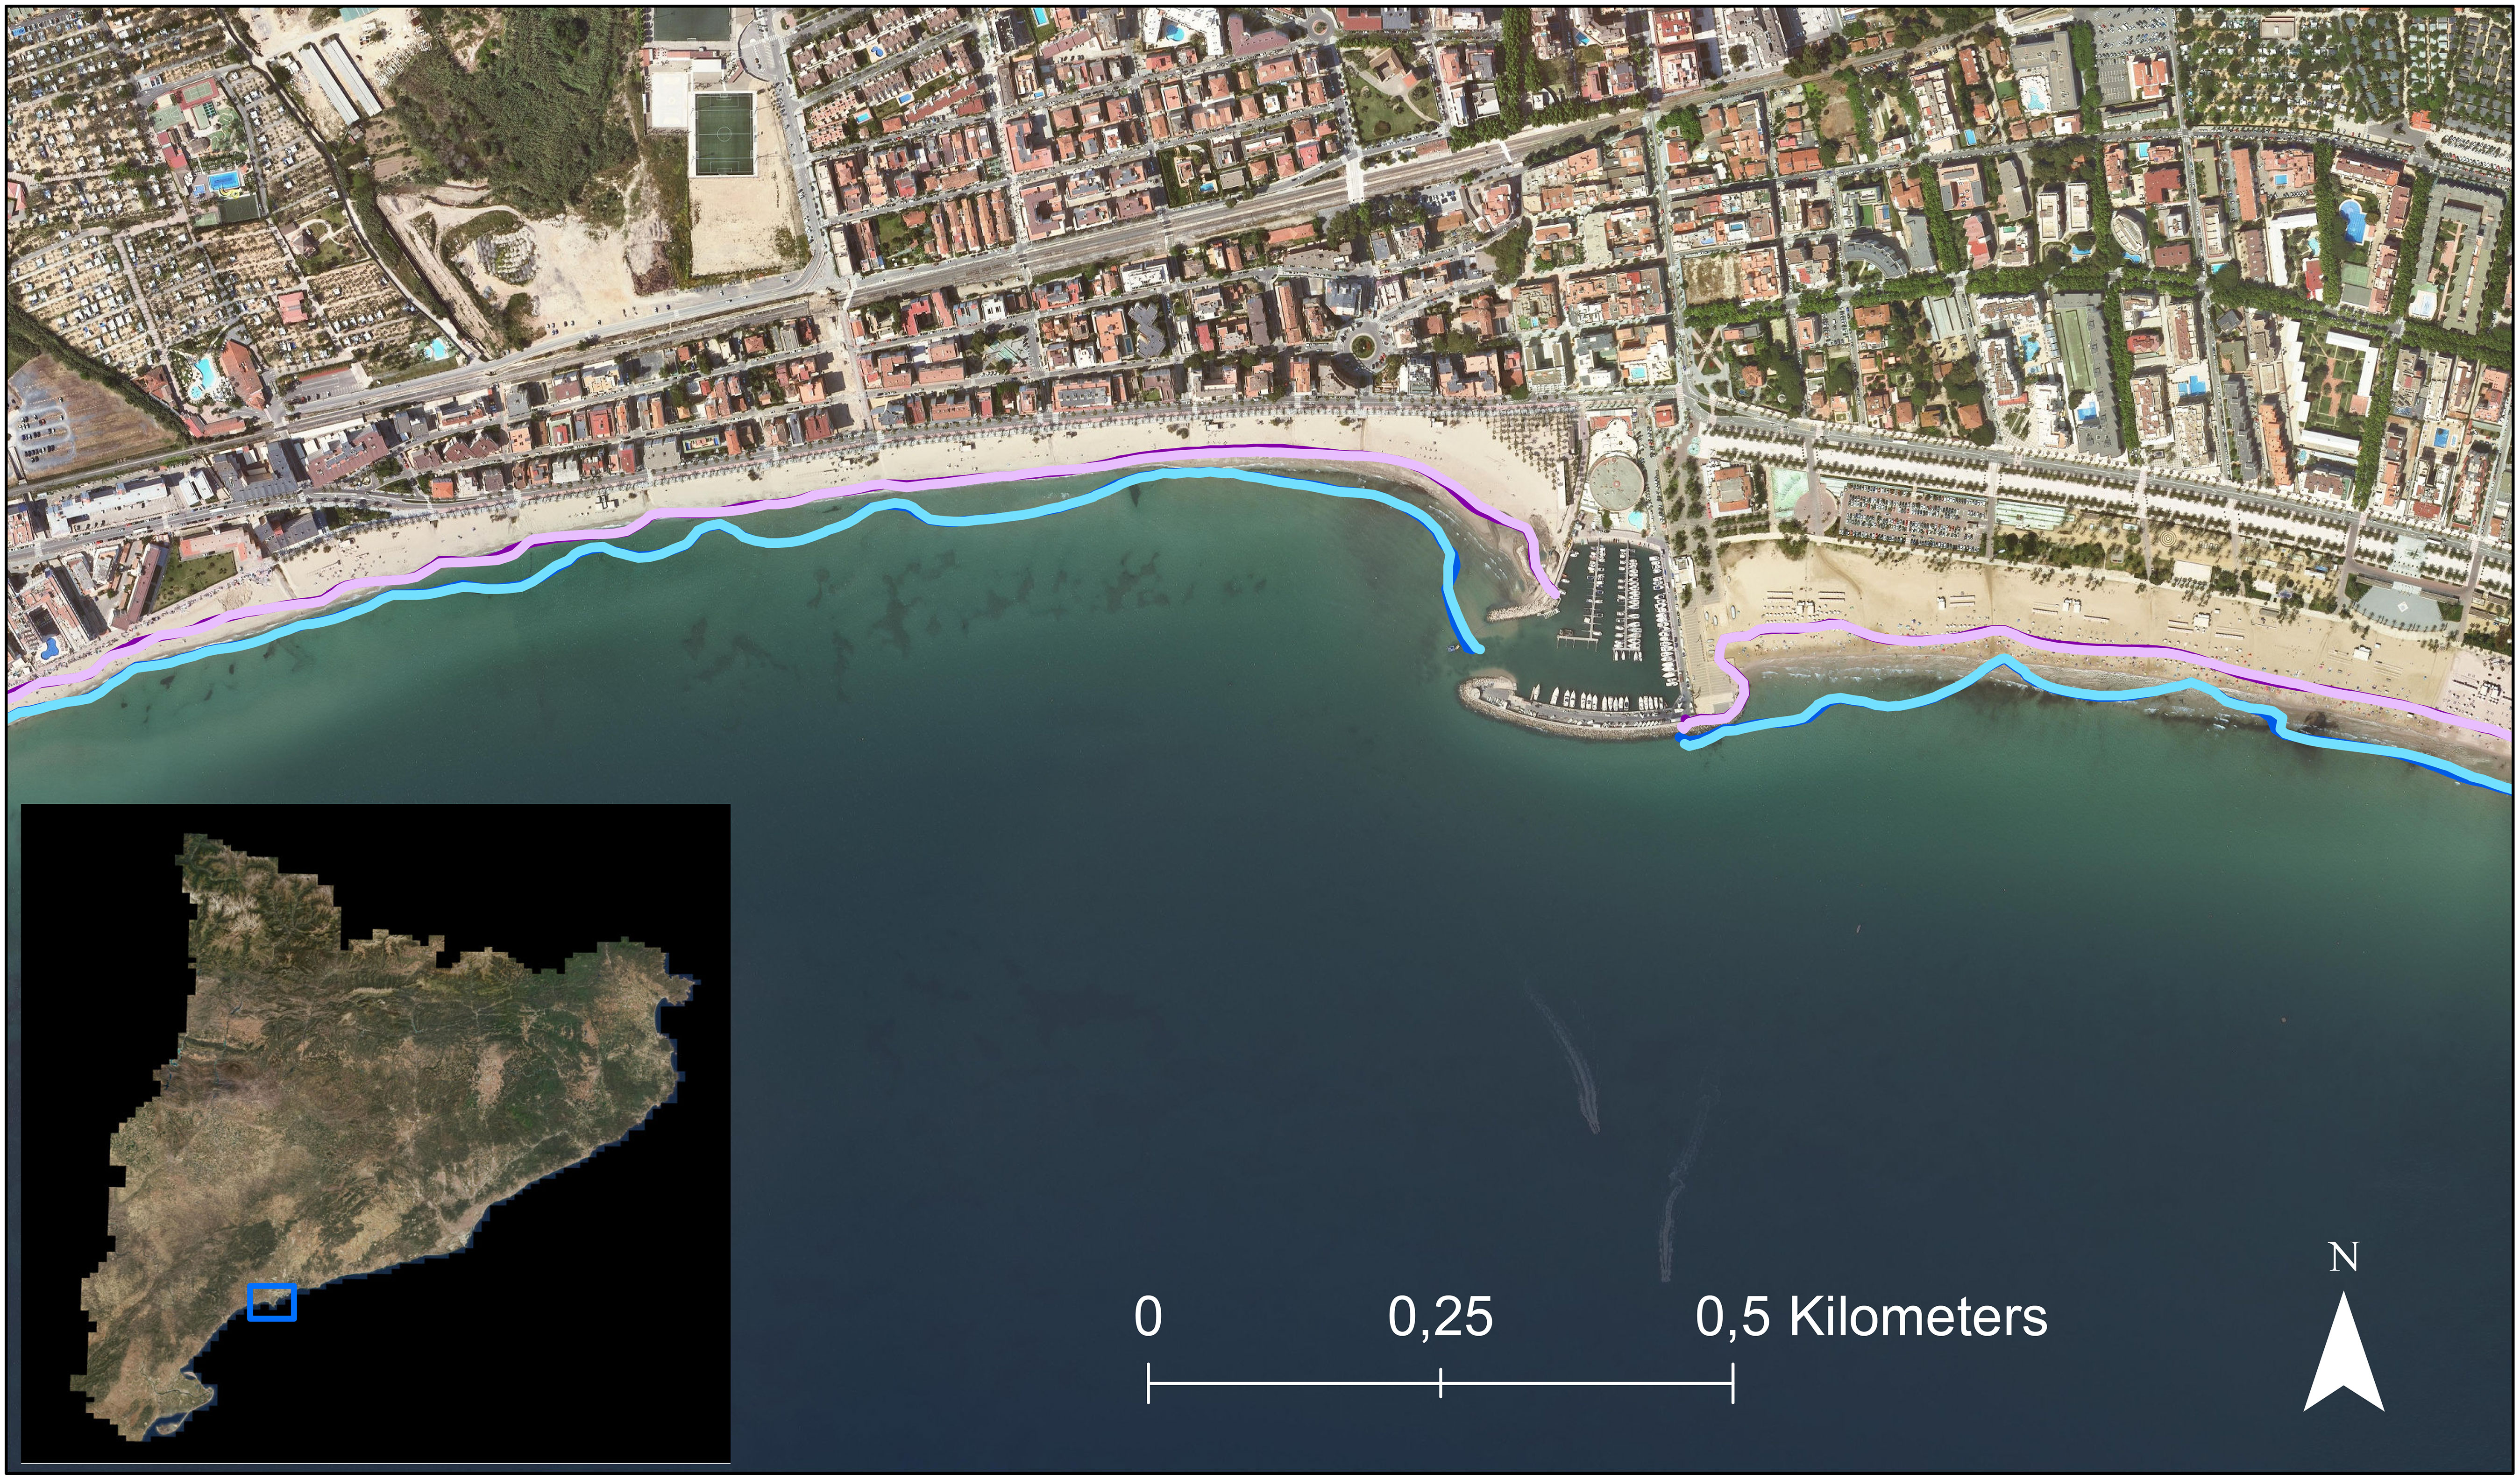
Figure 11 Map of Catalonia and close-up map of coastline retreat of Unit 4. Blue rectangle on the top map shows the position of the unit. Light blue = actual conditions, RP = 50 years; dark blue = actual conditions, RP = 500 years; light lilac = RCP8.5, RP = 50 years; and dark lilac = RCP8.5, RP = 500 years.
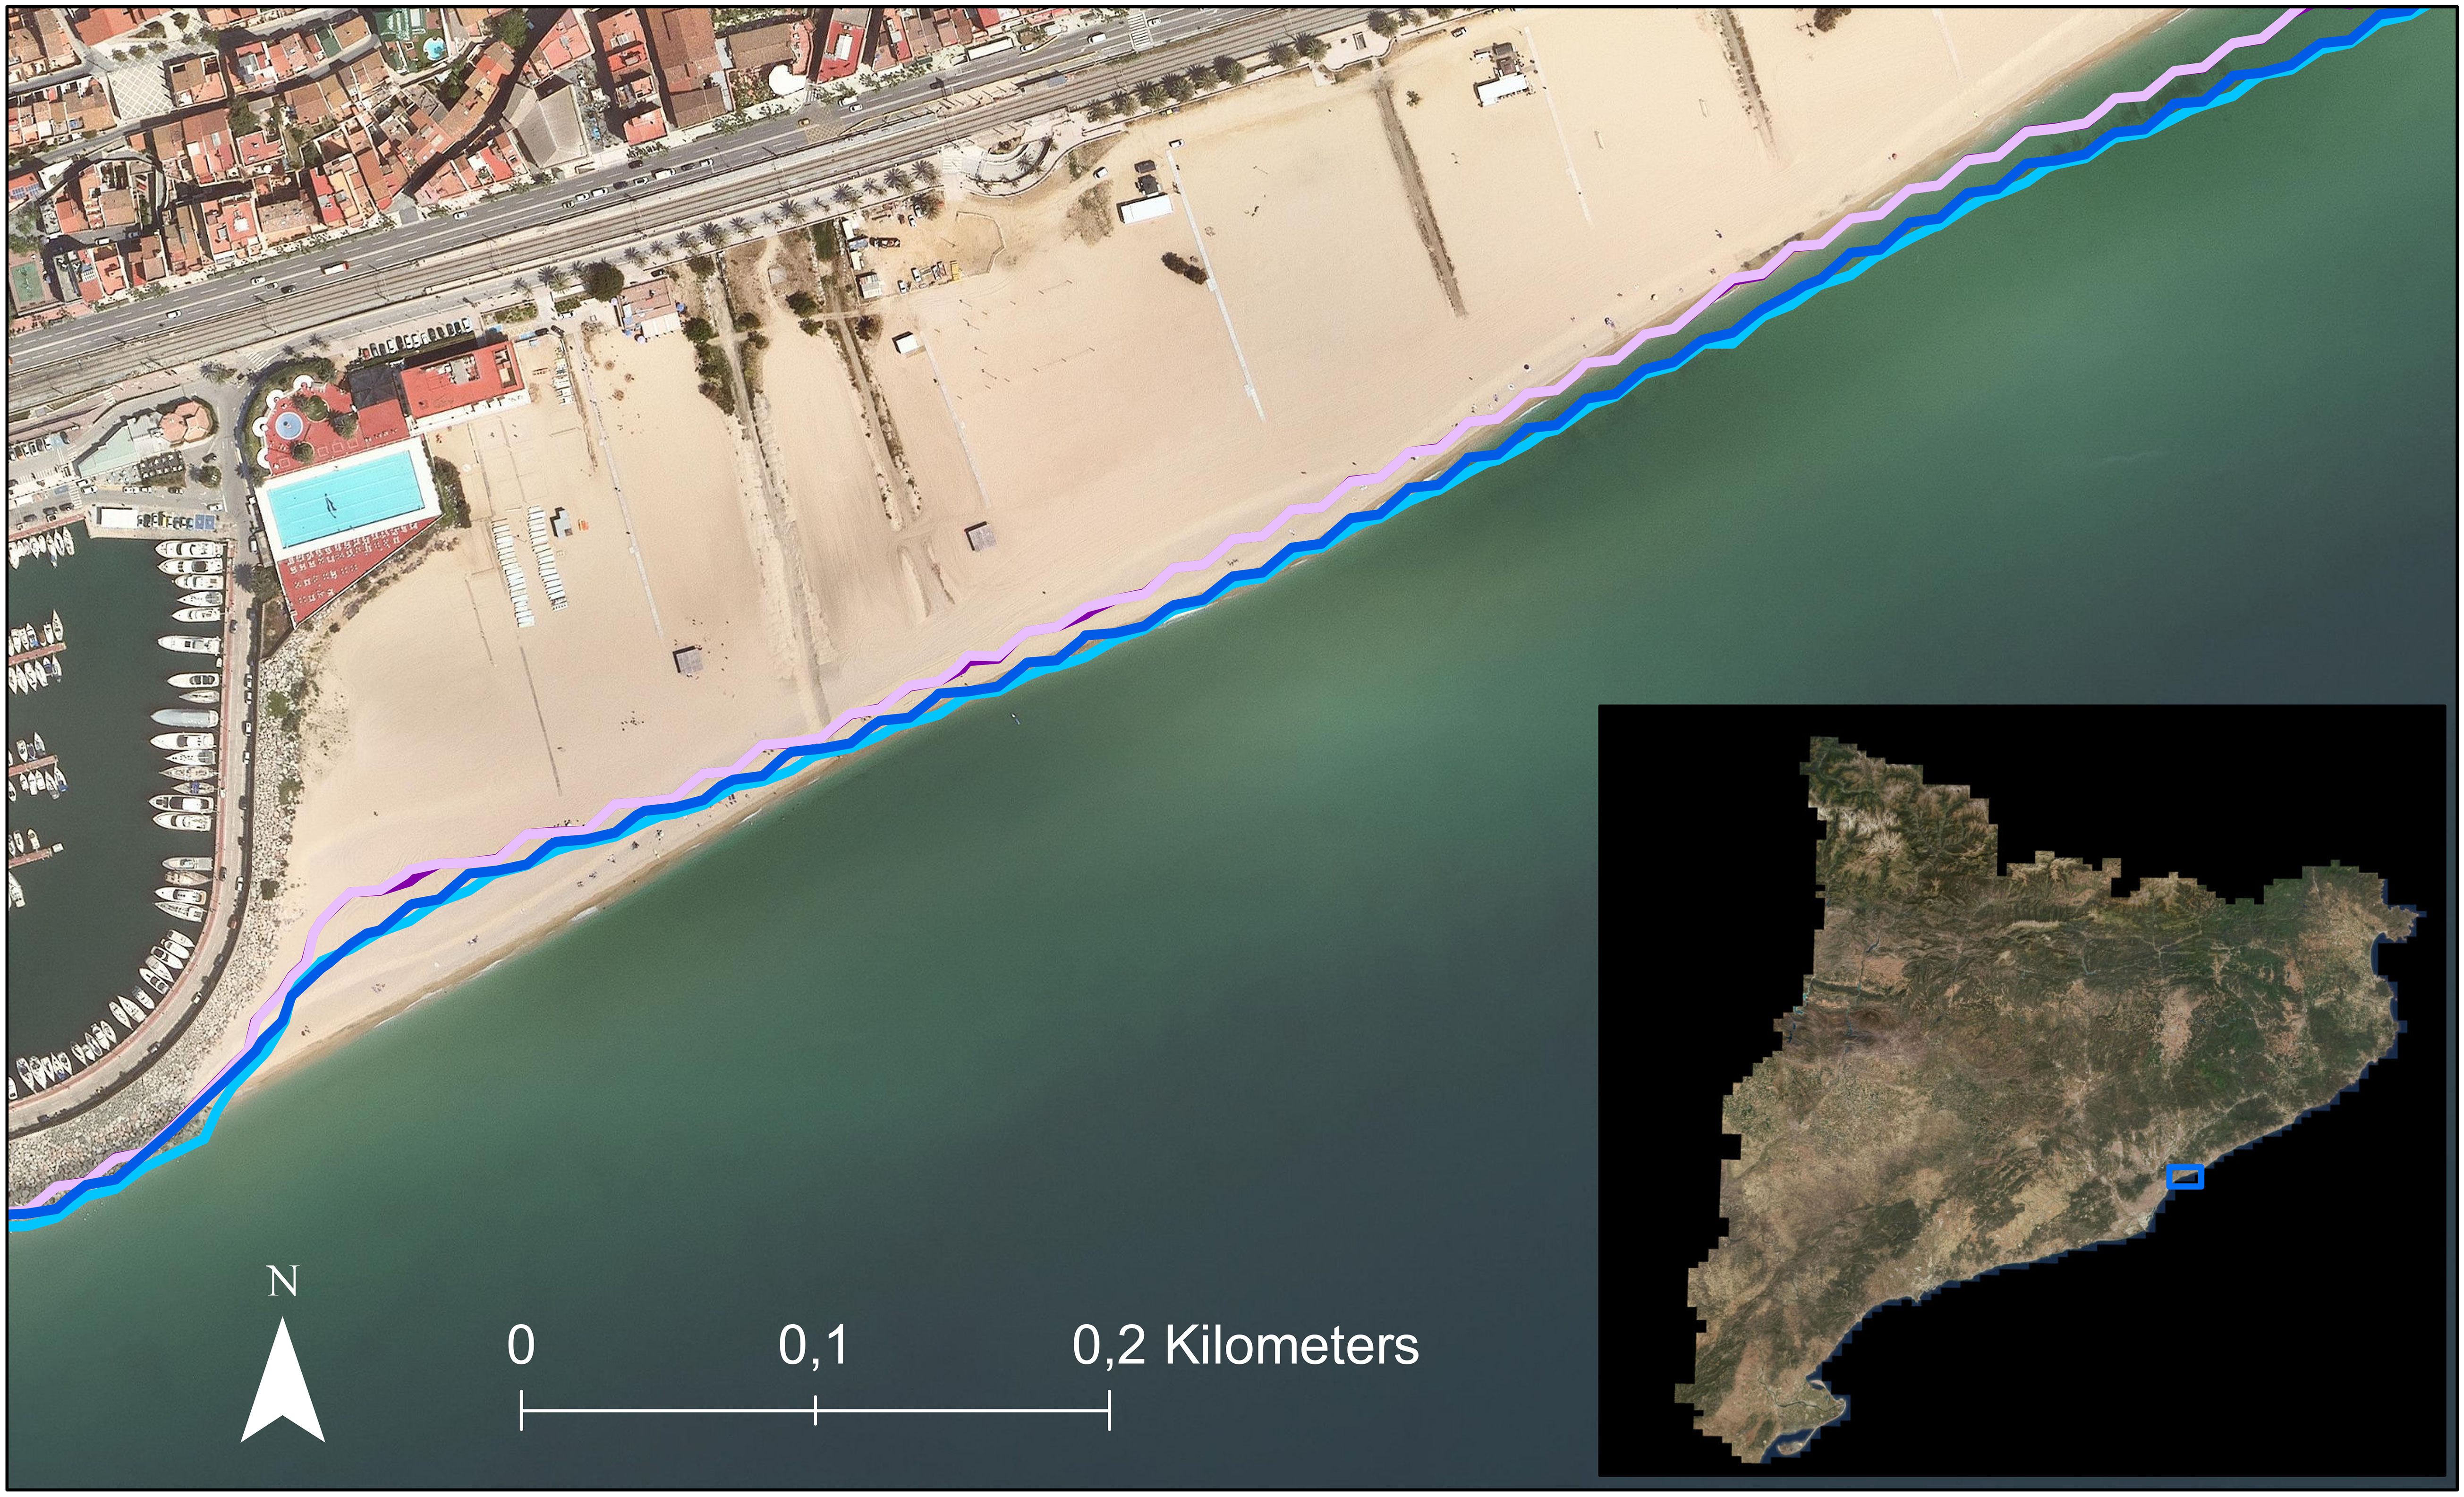
Figure 12 Map of Catalonia and close-up map of coastline retreat of Unit 11. Blue rectangle on the top map shows the position of the unit. Light blue = actual conditions, RP = 50 years; dark blue = actual conditions, RP = 500 years; light lilac = RCP8.5, RP = 50 years; and dark lilac = RCP8.5, RP = 500 years.
Figures 11, 12 show the explained behavior. The correlation of the modeled coastline with the one presented in the map is not exact because, again, the times when the topobathymetry and the orthophoto were taken are different and so the beach forms due to changes on the dynamics of the littoral cell. Furthermore, the importance lies in the magnitudes of coastline retreat where, on both figures, the retreat due to the storm pass is a lot less than for the mean water level introduction.
4 Summary and conclusion
The modeling approach has demonstrated its efficacy in describing the flooding and erosion impacts on the studied beaches caused by different storm scenarios and climate change conditions. A characterization of the most common and important archetypes of the Catalan coast has been done, finding that the low-lying coasts with gentle slopes are the most affected by, while the high coasts with well-developed berms are the most protected from, flooding events. We have achieved a good computational time from trial and error, taking into account the needs of the study since it is not time-limited. The MPI strategy gives a good performance and we do not expect that the incorporation of clustering computing can give us enough improvement to test it. Some trials done with interpolating grids with more resolution (5 × 5 m and 2 × 2 m) resulted in an increase of the computational time without improving the accuracy of the results, due to the limitation of the topobathymetry resolution. All these factors enhance the use of the selected strategy. The flooding rate, as expected, increases with the storm intensity for all the studied cases, as it could be seen in Table S1, while the archetype and characteristics of the beach, for example, the slopes, the presence of berms or dunes, and the existence of mitigation zones like vegetation or high promenades, define the final pattern of inundation. Nevertheless, climate change is the driving factor, with more affected areas in all the scenarios as the water level rises. We observe that the characterization of some parts of the Catalan coast using morphodynamical models results in an interesting tool to predict the possible consequences that could be seen in the future for the suggested predictions. The observed behavior for the different analyzed cases shows how low-lying coastal stretches are the most vulnerable to flooding. Furthermore, on low urban coasts, when the incident waves reach the non-erodible surface, the beach configuration is not enough to stop them and waves can penetrate more than 200 m inland. We conclude that the maintenance of an enough emerged beach width and the generation of a backshore coastal room are necessary strategies to cope with these effects. Another interesting process that has been observed relates to the streams and channels that connect the lagoons. These areas are not well characterized by the topobathymetric data and are classified as a low-lying dry region. Adding this to the fact that they present levees on both sides of the entrances makes them susceptible to flooding, especially in the face of climate change conditions. This behavior has been previously studied in the Ebro delta river mouth under different sea level rise scenarios, as described by Grases et al. (2020). Unit 8 also strengthens the arguments since a similar flooding pattern has been observed compared with the description of CIIRC (2010), which finds inundation in the torrents. Although the condition of dry rivers is not realistic at the present time, this may become a more plausible scenario under climate change conditions, with the region expected to experience a significant reduction in rainfall rates (Dore, 2005).
As regards the erosion impacts, we conclude that coastline retreat does not seem to be the best proxy. First, storm conditions surprisingly have a minimal effect due to redistribution processes. Even if there are huge changes in the sand position due to high-intensity storm events, the most common movements are the erosion of the part where the waves arrive, which normally corresponds to an area above the coastline. This sand then goes to the formation of a submerged bar as described in (Guillén and Palanques, 1993; Eichentopf et al., 2020), especially on dissipative beaches (Bowman and Goldsmith, 1983; Aagaard et al., 2013). This generates a scenario where the hypothetical 0-m baseline corresponding to the coastline remains invariable or barely changed but does not provide enough interesting information to the study. Moreover, SLR has a direct impact on the coastline retreat. As expected, the results show that gentle beach slopes, which correspond to fine sand fractions, are more sensitive to climate change, resulting in greater shoreline retreats, but the impacts derived from the combination of SLR and storms have to face the same problem described before. Additionally, the fact that the coastline directly changes its position even before the storm event starts if climate change scenarios are included makes it impossible to compare the present and future conditions. Finally, a proposal to modify the topobathymetry using long-term simulations to reach equilibrium with sea level rise conditions has been questioned due to concerns about its necessity during the study. However, this strategy was turned down for various reasons. Firstly, as stated by in (Simmons et al., 2017; Matheen et al., 2021), the model’s free parameters have a greater impact on the final results than the used profile. Secondly, updating the bathymetry would be highly computationally demanding, adding to the rejection of the proposed method. Last, the bathymetry projection for the year 2100 is highly uncertain and can only be evaluated with some confidence in the absence of human intervention. Currently, all of the analyzed scenarios are subject to management control, so the expected bathymetry for 2100 is unclear. This paper proposes a solution to this uncertainty by assuming that the present coastal layout will be maintained. The methodology used in this study presents how we can obtain high-resolution results of the impacts to define management policies on a large scale. It opens the door to implement operational strategies based on the shown concepts to prevent future impacts on the beaches along Catalonia. The work also defines common patterns that could be used to study other possible areas with the same patterns. The definition of the flooding impacts as polygons would help the administration to easily understand and situate the problem, facilitating the decision about which mitigation actions they have to implement; meanwhile, another strategy to characterize the erosion has to be defined since the coastline retreat is not a good proxy to mitigate the loss and accumulation of sediments on the beach and the promenade. A more detailed and updated version of the topographies and especially bathymetries on the Catalan coast would further improve the obtained results and performance. This, added to a constant flux of hydrodynamic data, would be the last step in creating a good early warning system to reduce the actual impacts and even prepare the affected areas for future problems.
Data availability statement
The original contributions presented in the study are included in the article/Supplementary Material, further inquiries can be directed to the corresponding author/s.
Author contributions
VG and XS-A led the manuscript drafting with the contribution of JP, JPS, ME, and AS-A. VG, AS-A, JPS, ME, and JP contributed to the organization of the study. JPS contributed to the generation of the hydrodynamic conditions. XS-A contributed to the modeling simulations and the generation of results. JP contributed to the implementation of the viewer and the supply of the topographies. All authors contributed to the article and approved the submitted version.
Funding
This project has received funding from the European Union’s Horizon 2020 research and innovation programme under grant agreement No. 101037097 (REST-COAST project).
Acknowledgments
The first author has the support of the Secretariat for Universities and Research of the Ministry of Business and Knowledge of the Government of Catalonia and the European Social Fund. We want to thank Realització d’escenaris d’inundació de costa i erosió de platges for the project PIMA ADAPTA COSTAS. Exped. S-689/20 (ICGC-2020-00045).
Conflict of interest
The authors declare that the research was conducted in the absence of any commercial or financial relationships that could be construed as a potential conflict of interest.
Publisher’s note
All claims expressed in this article are solely those of the authors and do not necessarily represent those of their affiliated organizations, or those of the publisher, the editors and the reviewers. Any product that may be evaluated in this article, or claim that may be made by its manufacturer, is not guaranteed or endorsed by the publisher.
Supplementary material
The Supplementary Material for this article can be found online at: https://www.frontiersin.org/articles/10.3389/fmars.2023.1125138/full#supplementary-material
References
Aagaard T., Greenwood B., Hughes M. (2013). Sediment transport on dissipative, intermediate and reflective beaches. Earth-Sci Rev. 124, 32–50. doi: 10.1016/j.earscirev.2013.05.002
Agulles M., Jordà G., Lionello P. (2021). Flooding of sandy beaches in a changing climate. The case of the Balearic Islands (NW Mediterranean). Front. Mar. Sci. 8. doi: 10.3389/fmars.2021.760725
Athanasiou P., Van Dongeren A., Giardino A., Vousdoukas M., Gaytan-Aguilar S., Ranasinghe R. (2019). Global distribution of nearshore slopes with implications for coastal retreat. Earth System Sci. Data 11, 1515–1529. doi: 10.5194/essd-11-1515-2019
Barnard P., Erikson L., Foxgrover A., Hart J., Limber P., Neil A. (2019). Dynamic flood modeling esential to assess the coastal impacts of climate change. Sci. Rep. 4309, 9. doi: 10.1038/s41598-019-40742-z
Blott S. J., Pye K. (2001). Gradistat: a grain size distribution and statistics package for the analysis of unconsolidated sediments. Earth surface processes Landforms 26 (11), 1237–1248. doi: 10.1002/esp.261
Bolaños R., Jordà G., Cateura J., Lopez J., Puigdefabregas J., Gómez J., et al. (2009). The xiom: 20 years of a regional coastal observatory in the spanish catalan coast. J. Mar. Syst. 77 (3), 237–260. doi: 10.1016/j.jmarsys.2007.12.018
Bosom E., Jiménez J. (2011a). Probabilistic coastal vulnerability assessment to storms at regional scale - application to catalan beaches (nw mediterranean). Natural Haz. Earth System Sci. 11 (1), 475–484. doi: 10.5194/nhess-11-475-2011
Bosom E., Jiménez J. (2011b). Probabilistic coastal vulnerability assessment to storms at regional scale– application to catalan beaches (nw mediterranean). Natural haz. Earth system Sci. 11 (2), 475–484. doi: 10.5194/nhess-11-475-2011
Bowman D., Goldsmith V. (1983). “Bar morphology of dissipative beaches: an empirical model,”. Mar. Geol. 51 (1-2), 15–33. doi: 10.1016/0025-3227(83)90086-5
Castillo E., Sarabia J. (1994). “Extreme value analysis of wave heights,”. J. OF Res. Natl. INSTITUTE OF STANDARDS AND Technol. 99, 445–445. doi: 10.6028/jres.099.042
CIIRC (2010). Estat de la zona costanera a catalunya (International Centre for Coastal Resources Research). Technical Report. Available at: https://territori.gencat.cat/ca/01_departament/documentacio/territori-i-urbanisme/ordenacio_territorial/llibre_verd_estat_de_la_zona_costanera/.
Clarke L., Glendinning I., Hempel R. (1994). “The MPI message passing interface standard,” in Programming Environments for Massively Parallel Distributed Systems: Working Conference of the IFIP WG 10.3, April 25–29, 1994 (Birkhäuser Basel: Springer), 213–218.
Coles S. (2001). An introduction to statistical modeling of extreme values, in: Springer Series in Statistics (London, UK: Springer). doi: 10.1007/978-1-4471-3675-0
Condon A. J., Peter Sheng Y. (2012). Evaluation of coastal inundation hazard for present and future climates. Natural haz. 62 (2), 345–373. doi: 10.1007/s11069-011-9996-0
De Alfonso M., Lin-Ye J., García-Valdecasas J. M., Perez-Rubio S., Luna M. Y., Santos-Muñoz D., et al. (2021). Storm gloria: sea state evolution based on in situ measurements and modeled data and its impact on extreme values. Front. Mar. Sci. 8,646873. doi: 10.3389/fmars.2021.646873
Dore M. H. (2005). “Climate change and changes in global precipitation patterns: what do we know?”. Environ. Int. 31 (8), 1167–1181. doi: 10.1016/j.envint.2005.03.004
Eichentopf S., van der Zanden J., Cáceres I., Baldock T. E., Alsina J. M. (2020). Influence of storm sequencing on breaker bar and shoreline evolution in large-scale experiments. Coast. Eng. 157, 103659. doi: 10.1016/j.coastaleng.2020.103659
Fereirra. J. A., Soares C. G. (1998). An application of the peaks over threshold method to predict extremes of significant wave height. J. Offshore Mechanics Arctic Eng. 120, 165–176. doi: 10.1115/1.2829537
García-León M., Gracia V., Robichaux L., Kroger A., Gault J., Sánchez-Arcilla A. (2015)Evaluation of transient defence measures against storms (Accessed Proceedings of the Coastal Sediments).
Generalitat de Catalunya. (2016). Tercer informe sobre el canvi climàtic a Catalunya. Institut d’Estudis Catalans i Generalitat de Catalunya. Available at: https://cads.gencat.cat/ca/detalls/detallarticle/Tercer-informe-sobre-el-canvi-climatic-a-Catalunya-00003.
Goda Y. (1988). “On the methodology of selecting design wave height,”. Coast. Eng. Proc., 67. doi: 10.9753/icce.v21.67
Gracia V., García M., Grifoll M., Sánchez-Arcilla A. (2013). “Breaching of a barrier under extreme events. the role of morphodynamic simulations”. J. Coast. Res. 65 (10065), 951–956. doi: 10.2112/SI65-161.1
Gracia V., Jiménez J. (2004)Unexpected response of infraestructures and beaches along the spanish mediterranean coast to the extreme storm of november of 2001 (Accessed Proceedings of the 29th International Conference on Coastal Engineering).
Grases A., Gracia V., García-León M., Lin-Ye J., Sierra J. P. (2020). “Coastal flooding and erosion under a changing climate: implications at a low-lying coast (ebro delta)”. Water 12 (2), 346. doi: 10.3390/w12020346
Guillén J., Palanques A. (1993). “Longshore bar and trough systems in a microtidal, storm-wave dominated coast: the ebro delta (northwestern mediterranean)”. Mar. Geol. 115 (3-4), 239–252. doi: 10.1016/0025-3227(93)90053-X
Haasnoot M., Brown S., Scussolini P., Jiménez J. A., Vafeidis A. T., Nicholls R. J. (2019). Generic adaptation pathways for coastal archetypes under uncertain sea-level rise. Environ. Res. Commun. 1 (7), 071006. doi: 10.1088/2515-7620/ab1871
Hinkel J., Nicholls R. J., Vafeidis A. T., Tol R. S., Avagianou T. (2010). Assessing risk of and adaptation to sea-level rise in the european union: an application of diva. Mitigation Adaptat. Strategies Global Change 15 (7), 703–719. doi: 10.1007/s11027-010-9237-y
IH Cantabria. (2019). Elaboración de la metodología y bases de datos para la proyección de impactos de cambio climático a lo largo de la costa española (Gobierno de España: Ministerio para la Transición Ecológica). Technical Report. Available at: https://adaptecca.es/sites/default/files/documentos/2019_metodologia_y_bbdd_proyeccion_impactos_de_cc_costa_espanola.pdf.
IPCC (2022). Climate change 2022: impacts, adaptation and vulnerability (Policymakers, Cambridge, UK and New York, USA: Cambridge University Press).
Jiménez J. A., Sancho-Garcıa A., Bosom E., Valdemoro H. I., Guillén J. (2012). Storm-induced damages along the catalan coast (nw mediterranean) during the period 1958–2008. Geomorphology 143, 24–33. doi: 10.1016/j.geomorph.2011.07.034
Jiménez J. A., Valdemoro H. I., Bosom E., Sánchez-Arcilla A., Nicholls R. J. (2017). Impacts of sea-level rise-induced erosion on the catalan coast. Regional Environ. Change 17 (2), 593–603. doi: 10.1007/s10113-016-1052-x
Li F., van Gelder P., Ranasinghe R., Callaghan D. (2014). Probabilistic modelling of extreme storms along the dutch coast. Coast. Eng. 86, 1–13. doi: 10.1016/j.coastaleng.2013.12.009
Lin-Ye J., García-León M., Gracia V., Ortego M. I., Lionello P., Conte D., Sánchez-Arcilla A., et al. (2020). “Modeling of future extreme storm surges at the nw mediterranean coast (spain),”. Water 12 (2), 472. doi: 10.3390/w12020472
Martinelli L., Zannuttigh B., Corbau C. (2010). Assessment of coastal flooding hazard along the emilia romagna littoral, it. Coast. Eng. 57 (11-12), 1042–1158. doi: 10.1016/j.coastaleng.2010.06.007
Matheen N., Harley M. D., Turner I. L., Splinter K. D., Simmons J. A., Thran M. C. (2021). Bathymetric data requirements for operational coastal erosion forecasting using xbeach. J. Mar. Sci. Eng. 9 (10), 1053. doi: 10.3390/jmse9101053
McCall R., Masselink G., Poate T., Roelvink J., Almeida L., Davidson M., et al. (2014). Modelling storm hydrodynamics on gravel beaches with xbeach-g. Coast. Eng. 91, 231–250. doi: 10.1016/j.coastaleng.2014.06.007
Mendoza E. T., Jiménez J. (2008). Clasificación de tormentas costeras para el litoral catalán (mediterráneo no). Ingeniería hidráulica en México 23 (2), 21–32.
Mendoza E., Jimenez J., Mateo J. (2011). “A coastal storms intensity scale for the catalan sea (nw mediterranean)”. Natural Haz. Earth System Sci. 11 (9), 2453–2462. doi: 10.5194/nhess-11-2453-2011
Nicholls R., Klein R. J. (2005). Climate change and coastal management on europe’s coast. Managing Eur. Coasts, 199–226. doi: 10.1007/3-540-27150-3_11
Nicholls R. J., Misdorp R. (1993). Synthesis of vulnerability analysis studies. In: Proceedings of WORLD COAST. (The Netherlands: Ministry of Transport, Public Works and Water Management) pp. 181–216.
Nicholls R., Tol R. S., Hall J. (2007). “Assessing impacts and responses to global-mean sea-level rise,” in Human-induced climate change: an interdisciplinary assessment (Cambridge University Press), 119–134. doi: 10.1017/CBO9780511619472.013
Nordhaus W. D. (2006). Geography and macroeconomics: new data and new findings. Proc. Natl. Acad. Sci. 103 (10), 3510–3517. doi: 10.1073/pnas.0509842103
Orejarena-Rondón A., Sayol J., Marcos M., Otero L., Restrepo J., Hernández-Carrasco I. (2019). Coastal impacts driven by sea-level rise in cartagena de indias. Front. Mar. Sci. 450, 6:614. doi: 10.3389/fmars.2019.00614
Ozyurt G., Ergin A., Esen M. (2008)Indicator based coastal vulnerability assessment model to sea level rise (Accessed Proceedings of the 7th International Conference on Coastal and Port Engineering in Developing Countries (COPEDEC)).
P. B. UNEP, MAP (2016). Tourism and sustainability in the Mediterranean: key facts and trends. Plan Blue. Regional Activity Centre, Valbonne.
Ranasinghe R. (2016a). Assessing climate change impacts on open sandy coasts: a review. Earth-science Rev. 160, 320–332. doi: 10.1016/j.earscirev.2016.07.011
Ranasinghe R. (2016b). On the need for a new generation of coastal change models for the 21st century. Sci. Rep. 10 (1), 1–6. doi: 10.1038/s41598-020-58376-x
Ranasinghe R., Callaghan D. (2017). “Assessing storm erosion hazards,”. Coast. storms: processes impacts, 241–256. doi: 10.1002/9781118937099.ch12
Ranasinghe R., Ruane A. C., Vautard R., Arnell N., Coppola E., Cruz F. A., et al. (2021). Climate change information for regional impact and for risk assessment. In: Climate Change 2021: The Physical Science Basis. Contribution of Working Group 1 to the Sixth Assessment Report of the Intergovernmental Panel on Climate Change. (Cambridge: Cambridge University Press), pp. 1767–1926.
Rautenbach C., Trenham C., Benn D., Hoeke R., Bosserelle C. (2022). Computing efficiency of xbeach hydro-and wave dynamics on graphics processing units (gpus). Environ. Model. Software 157, 105532. doi: 10.1016/j.envsoft.2022.105532
Roelvink D., Reniers A., Van Dongeren A., Van Thiel de Vries J., Lescinski J., McCall R. (2010). “XBeach model description and manual,” in Unesco-IHE institute for water education. (Deltares and Delft University of Tecnhology), 21.
Roukounis C. N., Tsihrintzis V. A. (2022). Indices of coastal vulnerability to climate change: a review. Environ. Processes 9 (2), 1–25. doi: 10.1007/s40710-022-00577-9
Sánchez-Arcilla A., García M., Gracia V., Devoy R., Stanica A., Gault J. (2016a). Managing coastal environments under climate change: pathways to adaptation. Sci. Total Environ. 572, 1336–1352. doi: 10.1016/j.scitotenv.2016.01.124
Sánchez-Arcilla A., García-León M., Gracia V., Devoy R., Stanica A., Gault J. (2016b). Managing coastal environments under climate change: pathways to adaptation. Sci. total Environ. 572, 1336–1352. doi: 10.1016/j.scitotenv.2016.01.124
Sánchez-Arcilla A., Gómez M., Gracia V., Gironella X., García-León M. (2014). Reliability analysis of beaches as defenses against storm impacts under a climate change scenario (Accessed Proceedings of the 35th International Conference on Coastal Engineering).
Sancho-García A., Guillén J., Rubio-Nicolás B. (2020). “Coastal damages caused by an extreme storm (gloria event) along the spanish mediterranean coast”.
Sanuy M., Jiménez J. A. (2019). “Sensitivity of storm-induced hazards in a highly curvilinear coastline to changing storm directions. the tordera delta case (nw mediterranean)”. Water 11 (4), 747. doi: 10.3390/w11040747
Sardà R., Ávila C., Mora J. (2005). A methodological approach to be used in integrated coastal zone management processes: the case of the catalan coast (catalonia, spain). Estuarine Coast. Shelf Sci. 62 (3), 427–439. doi: 10.1016/j.ecss.2004.09.028
Schwalm C. R., Glendon S., Duffy P. B. (2020). “Rcp8.5 tracks cumulative co2 emissions,”. Proc. Natl. Acad. Sci. 117 (3), 19656–19657. doi: 10.1073/pnas.2007117117
Simmons J. A., Harley M. D., Marshall L. A., Turner I. L., Splinter K. D., Cox R. J. (2017). Calibrating and assessing uncertainty in coastal numerical models. Coast. Eng. 125, 28–41. doi: 10.1016/j.coastaleng.2017.04.005
Small C., Nicholls R. J. (2003). A global analysis of human settlement in coastal zones. J. Coast. Res. 19 (3), 584–599. Available at: http://www.jstor.org/stable/4299200.
Tâtui F., Pırvan M., Popa M., Aydogan B., Ayat B., Görmüs T., et al. (2019). “The black sea coastline erosion: index-based sensitivity assessment and management-related issues”. Ocean Coast. Manage. 182, 104949. doi: 10.1016/j.ocecoaman.2019.104949
Thomson A. M., Calvin K. V., Smith S. J., Kyle G. P., Volke A., Patel P., et al. (2011). “Rcp4.5: a pathway for stabilization of radiative forcing by 2100”. Climatic Change 109, 77–94. doi: 10.1007/s10584-011-0151-4
Turner R. K., Subak S., Adger W. N. (1996). Pressures, trends, and impacts in coastal zones: interactions between socioeconomic and natural systems. Environ. Manage. 20, no. 2, 159–173. doi: 10.1007/BF01204001
Villatoro M., Silva R., Mendez F., Zanuttigh B., Pan S. (2014). And E.E.A. Trifonov, “An approach to assess flooding and erosion risk for open beaches in a changing climate”. Coast. Eng. 87 (1), 50–76. doi: 10.1016/j.coastaleng.2013.11.009
Yin J., Yin Z., Wang J., Xu S. (2012). National assessment of coastal vulnerability to sea-level rise for the chinese coast. J. Coast. Conserv. 16 (1), 123–133. doi: 10.1007/s11852-012-0180-9
Keywords: climate change, XBeach, flooding, erosion, sea level, modeling, sandy beaches
Citation: Sánchez-Artús X, Gracia V, Espino M, Sierra JP, Pinyol J and Sánchez-Arcilla A (2023) Present and future flooding and erosion along the NW Spanish Mediterranean Coast. Front. Mar. Sci. 10:1125138. doi: 10.3389/fmars.2023.1125138
Received: 15 December 2022; Accepted: 29 May 2023;
Published: 07 July 2023.
Edited by:
Joanna Staneva, Institute of Coastal Systems Helmholtz Centre Hereon, GermanyReviewed by:
Miguel Ortega-Sánchez, University of Granada, SpainGiovanni Besio, University of Genoa, Italy
Copyright © 2023 Sánchez-Artús, Gracia, Espino, Sierra, Pinyol and Sánchez-Arcilla. This is an open-access article distributed under the terms of the Creative Commons Attribution License (CC BY). The use, distribution or reproduction in other forums is permitted, provided the original author(s) and the copyright owner(s) are credited and that the original publication in this journal is cited, in accordance with accepted academic practice. No use, distribution or reproduction is permitted which does not comply with these terms.
*Correspondence: Xavier Sánchez-Artús, eHNhbmNoZXphcnR1c0BnbWFpbC5jb20=