 Natalie Chernihovsky
 Adi Torfstein
 Ahuva Almogi-Labin3
- 1The Fredy & Nadine Herrmann Institute of Earth Sciences, The Hebrew University of Jerusalem, Jerusalem, Israel
- 2The Interuniversity Institute for Marine Sciences, Eilat, Israel
- 3Geological Survey of Israel, Jerusalem, Israel
Planktonic foraminifera (PF) shells comprise a significant fraction of the global oceanic carbonate flux and serve as a primary archive of the history of the oceans. Yet, a limited understanding of their life cycles dynamics and biological rhythms, hampers their application as palaeoceanographic proxies. Here, we present the flux of ten PF species and their shell-size distributions at a daily timescale resolution in the Gulf of Aqaba (GOA), northern Red Sea. We report diameter measurements of ~13,500 shells, associated with ten PF species, retrieved using an automated time-series sediment trap deployed at a water depth of ~410 m (seafloor depth 610 m) throughout more than a full annual cycle between 2015 and 2016. Most of the PF species display a wide intraspecific shell-size distribution among adult PF, while six abundant species (G. ruber, G. rubescens + G. tenellus, G. glutinata, G. calida and G. siphonifera) display significantly smaller shell-sizes compared with corresponding specimens from sediment traps and seafloor sediments across other tropical, subtropical and upwelling regions. The results indicate that PF generation cycles can be classified according to three patterns: (1) Quiescent: minimal shell-size and extended life cycles due to unfavorable conditions and food scarcity when the water column is stratified and oligotrophic, (2) Transient: the gradual increase of Chlorophyll-a (Chl-a) concentrations and food availability enhance shorter life-cycles, although PF do not necessarily reach maximal shell-sizes, (3) Successive: PF fluxes and Chl-a concentrations are maximal, the generation time is extended and individuals might display growth to maximal shell-sizes.
1 Introduction
Planktonic foraminifera (PF) shells are significant components of the global particulate inorganic carbonate flux to the deep ocean, consisting of ~23-55% of the total pelagic calcite production and ~32-80% of deep-sea carbonate sediments (Schiebel, 2002; Schiebel and Hemleben, 2005). Accordingly, many field campaigns and laboratory studies have been devoted to investigating the life cycles of modern PF (e.g., Bé, 1977; Hemleben et al., 1989; Ortiz et al., 1995; Schiebel and Hemleben, 2017 and references therein).
The variability and dynamics of exported PF shell fluxes are influenced by seasonal and inter-annual changes in water temperatures. Previously, Sea Surface Temperature (SST) was suggested to be the primary factor affecting PF assemblage compositions, diversity, abundances, and shell-sizes (Bé, 1977; Wefer et al., 1999; Schmidt et al., 2004; Kucera, 2007). However, additional environmental parameters effect PF abundances such as primary productivity and food availability (Schiebel and Hemleben, 2005; Pados and Spielhagen, 2014) and water column stability (Žaric et al., 2005; Salmon et al., 2014; Chernihovsky et al., 2018). Yet, obtaining extended and continuous documentation of PF life cycles in the oceans is extremely challenging. Indeed, the evolution of an individual PF from its juvenile stage to adulthood is not well understood and despite efforts to study this cycle, several fundamental knowledge gaps regarding their lifespan and reproductive strategies under different oceanographic conditions, remain largely unresolved, particularly in open oligotrophic oceans.
Closing these knowledge gaps and understanding PF life cycles and their exported (carbonate) shell flux to the seafloor is essential in terms of the marine carbon cycle, particularly in light of anthropogenic ocean acidification (de Moel et al., 2009; Moy et al., 2009; Fox et al., 2020). Laboratory experiments have greatly contributed to the understanding of PF ontogenetic development (e.g., Schiebel and Hemleben, 2017) and the revealing of PF asexual reproduction (Davis et al., 2020; Takagi et al., 2020; Meilland et al., 2023), yet, such experiments have so far not been able to successfully produce a (sexually-) second generation or complete a sexually produced- life cycle. Therefore, in situ field investigations are needed for a better understanding and characterization of PF species life cycles and their controlling factors.
1.1 PF shell-size and reproduction
Planktonic foraminifera calcify shells that serve (among other traits) to protect from predation, pathogens and parasites (Grigoratou et al., 2019). Since the PF shell encloses the entire cell, its size is a good proxy for its body size. The shell size is suggested as a “master” trait, impacting many physiological and ecological aspects such as metabolic rates (e.g., growth), diet, abundance, biomass and reproduction (Schmidt et al., 2006; Grigoratou et al., 2019), as bigger adult individuals release more gametes (Hemleben et al., 1989). The ontogenetic development of PF is divided into five stages (Reviewed by Schiebel and Hemleben, 2017): prolocular (shell-size of ~10 μm), juvenile, neanic, adult (~>100 μm, able to perform gametogenesis) and a final terminal stage for some species (shell-size can reach >1000 μm; Brummer et al., 1987; Schmidt et al., 2004). During the neanic stage, chambers become increasingly globular in Globigerinoides species, and elongate radially in Globigerinella species, moreover, at each successive addition of a new chamber, additional layers of calcite are deposited on the former chambers and alter the thickness and morphology of the early chambers (Schiebel and Hemleben, 2017; Burke et al., 2020). Asexually produced PF offsprings can host symbiotic algae (vertically transmitted from the parent cell) and are assumed to be faster growing than the sexually produced offsprings (Davis et al., 2020; Takagi et al., 2020).
Calcification rates, which determine the eventual shell sizes, vary between environments, and might be used as an indicator for optimal growth conditions (e.g., Caron et al., 1982; Schmidt et al., 2004; Weinkauf et al., 2016; Grigoratou et al., 2019; Burke et al., 2020). For example, Bé et al. (1982) and Takagi et al. (2018) experimentally showed increased shell-size of a symbiont-bearing species when enhanced symbiotic activity occurred. Furthermore, a higher feeding frequency (i.e., increased food availability) leads to faster growth and larger final shell-size, but it also induces an earlier gametogenesis (i.e., shorter lifespan; Bé et al., 1981). Controlling factors affecting PF shell sizes can also vary between different ontogenetic stages (Schiebel and Hemleben, 2017; Burke et al., 2020). The models by Grigoratou et al. (2019) demonstrated for non-spinose PF species that while the shell-size of young stages is affected primarily by water temperature, the adult shell-size is more strongly affected by resource competition, particularly in oligotrophic environments where food is scarce, though comparable data regarding PF spinose species is still lacking (Grigoratou et al., 2019).
1.2 PF timing of reproduction
Marine organisms exhibit a variety of biological rhythms, ranging from circadian and circatidal rhythms to circalunar and seasonal rhythms. Species involved in reproductive events such as mass synchronous spawning (releasing the gonadal products of each individual into the open water) rely on external fertilization and prominently reproduce in accordance with a circalunar or semi-lunar rhythm (Tessmar-Raible et al., 2011).
The timing of some PF species reproduction has been suggested to be synchronized with the lunar phase (Almogi-Labin, 1984; Bijma et al., 1990; Erez et al., 1991; Jonkers et al., 2015). Full moon synchronized reproduction has been documented for the species Hastigerina pelagica both in cultured and field studies (Spindler et al., 1979; Lončarić et al., 2005). Importantly however, it was not observed for the other 27 PF species examined at those studies (Bé and Anderson, 1976; Lončarić et al., 2005). Jonkers et al. (2015) demonstrated that for some PF species in the Gulf of Mexico, lunar synchronized periodicity in the shell flux was detectable mostly for the larger size fractions. Meilland et al. (2021) revealed that more than half of the PF population (of the four studied species) in the tropical Atlantic do not take part in synchronized reproduction. Lin et al. (2022) showed that the shell-fluxes of four PF species (>212 µm) were characterized by some degree of lunar periodicity but longer cycles (34-48 days) during three months of peak shell-fluxes in the Northern South China Sea. Similar periodicities were reported in southwest Taiwan waters by Lin (2014) as Trilobatus sacculifer shell abundances and size increased from the lowest in the new moon to their maximum before the full moon. Jonkers et al. (2010) documented the annual shell fluxes of the species Turborotalita quinqueloba coupled with oxygen isotopic measurements at the NW Atlantic, and suggested that dormant noncalcifying PF individuals may survive for several months under unfavorable conditions and will reproduce only upon improving conditions. Previous studies from the Gulf of Aqaba (GOA) by Bijma et al. (1990) and Almogi-Labin (1984) suggested synchronized reproductive strategy for T. sacculifer, though more recently, Chernihovsky et al. (2020) showed that a daily timescale -resolved record of PF shell sedimentation fluxes in the GOA, yields species flux patterns with no lunar (or semi-lunar) periodicity, challenging this long-standing paradigm (see also Meilland et al., 2021).
Asexual reproduction was documented for the first time in 2006 in the species Neogloboquadrina pachyderma by Kimoto and Tsuchiya (2006). More recently, Davis et al. (2020); Takagi et al. (2020) and Meilland et al. (2023) reported asexual reproduction in the cold-water species N. pachyderma and Globigerinita uvula.
Clearly, some of the above inconsistencies regarding the PF life cycles may be attributed to low temporal resolution or non-continuous sampling. Nevertheless, the collective observations highlight several fundamental questions that remain unresolved: does lunar synchronized reproduction occur only when environmental conditions are beneficial? By contrast, do alternative traits (e.g., maturity for reproduction, food availability, predation risk) become more dominant in controlling the reproduction timing under, perhaps, less favorable conditions (e.g., oligotrophic)?
1.3 Study outline and objectives
Here, we report a continuous time-series of shell sedimentation fluxes and size distributions (> 63 µm) for ten PF species in the GOA, northern Red Sea, between March 2015 and May 2016 at a typical contiguous sampling resolution of ~1-3 days per sample. The observations are coupled with daily SST and surface Chl-a concentrations (as well as monthly deep vertical profiles) that are used to investigate the daily- to inter-annual timescale controls over shell-size variations and study the life cycles of adult planktonic foraminifera species.
This study aims to examine the periodicities of shell flux time-series of different size-fractions (of each PF species), to evaluate growth and reproduction cycles alongside changes in shell-size with time.
A common approach to understand PF life cycles is the investigation of repeated periodicity in shell fluxes. While the seasonal changes in PF shell fluxes in the GOA are well documented (Chernihovsky et al., 2018; Chernihovsky et al., 2020), no correspondence between the total shell fluxes (of each PF species) to lunar cyclicity has been identified (Chernihovsky et al., 2020). Jonkers et al. (2015) demonstrated that for some PF species in the Gulf of Mexico, lunar periodicity in the shell flux was size-differentiated and thus, we expand our efforts and investigate sub-seasonal periodicities (including tidal, semi-lunar and lunar) in PF shell fluxes of designated size-fractions.
Finally, we compare PF shell-sizes from the GOA with corresponding specimens from across other tropical, subtropical and upwelling regions, and use the findings to evaluate the interplay between oceanic oligotrophic conditions and PF shell sizes.
2 Background
2.1 Study area and oceanographic setting
The oceanographic and geologic configurations of the GOA render it a uniquely accessible “natural marine laboratory”, and hence, it is a well-studied and characterized oceanic basin (e.g., Kimor and Golandsky, 1977; Hottinger et al., 1993; Labiosa et al., 2003; Lazar et al., 2008; Meeder et al., 2012; Torfstein et al., 2020) that provides the opportunity to study fundamental oceanic processes, including the PF life cycles (Reiss and Halicz, 1976; Almogi-Labin, 1984; Bijma et al., 1990; Erez et al., 1991), at high spatial and temporal resolution, in a quasi-open, oligotrophic ocean environment.
The GOA is a deep, elongated and narrow (average depth of 800 m and maximum depth of 1830 m, 177 km in length and 14-25 km in width) water body, located at the northern edge of the Red Sea, about 2000 km away from its connection to the open ocean, and is surrounded by the hyper-arid Sahara-Arabia Deserts (Figure 1).
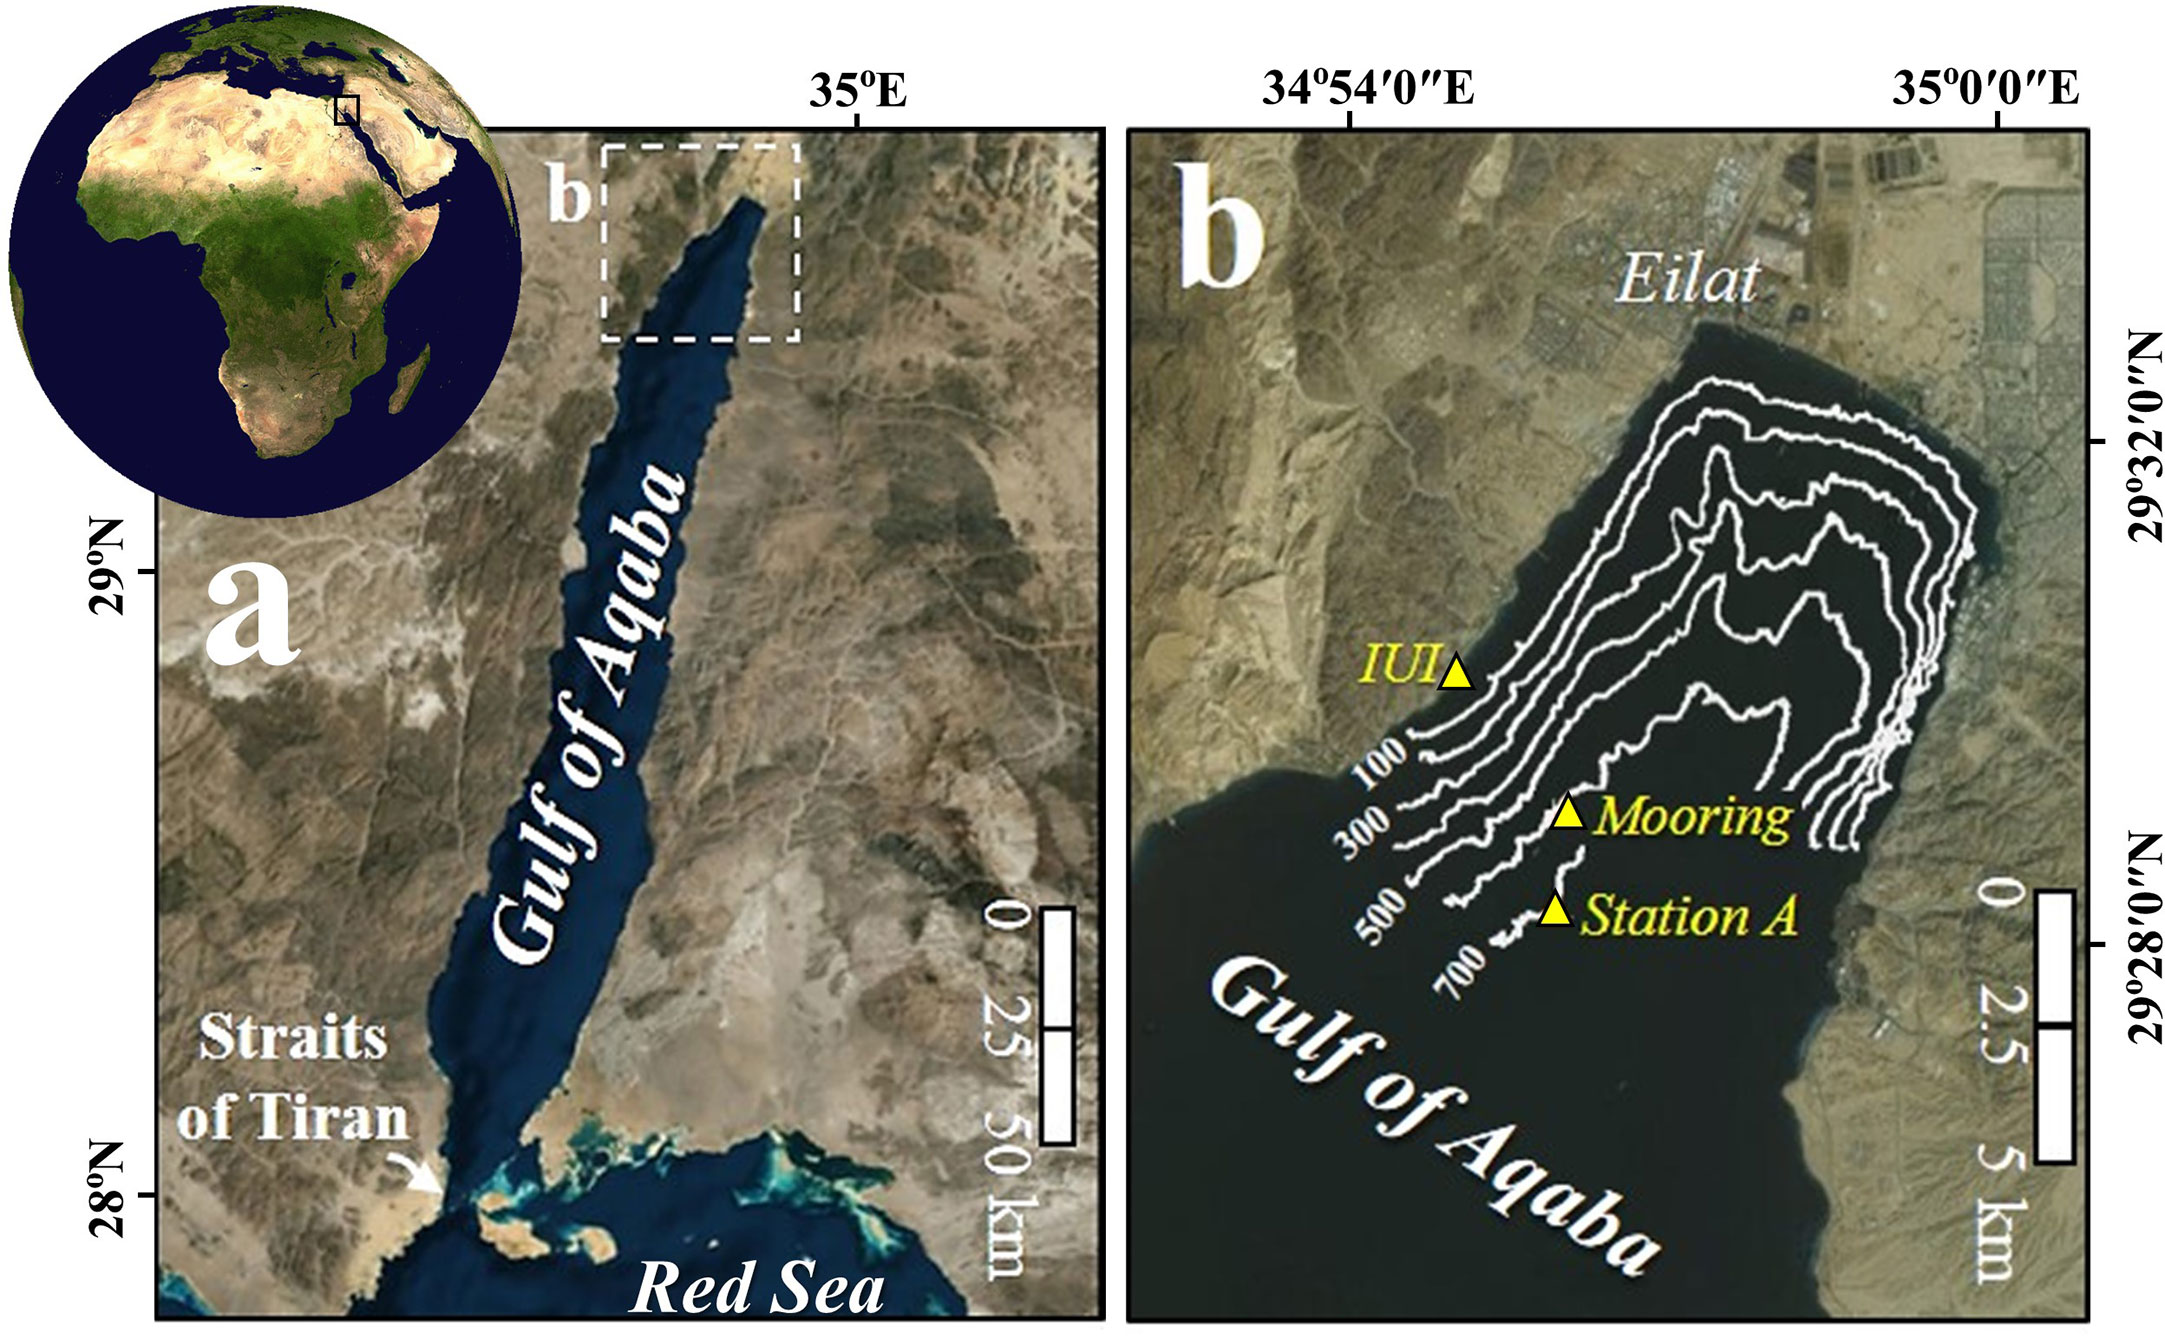
Figure 1 Location map. (A) Gulf of Aqaba. (B) Locations of the sediment traps mooring site, Station A and the Interuniversity Institute (IUI) in the northern Gulf of Aqaba.
The oligotrophic water column at the GOA is warm throughout the year with seasonal fluctuations in mixed layer water temperature (20.5-28.6°C), salinity (40.3-41.6), surface chlorophyll-a (0.03-1.95 µg L-1), primary production (0.1-1.9 mg C m-2 d-1) and oxygen saturation, which is close to 100% across the entire water column (Kimor and Golandsky, 1977; Shaked and Genin, 2017) (Figure 2).
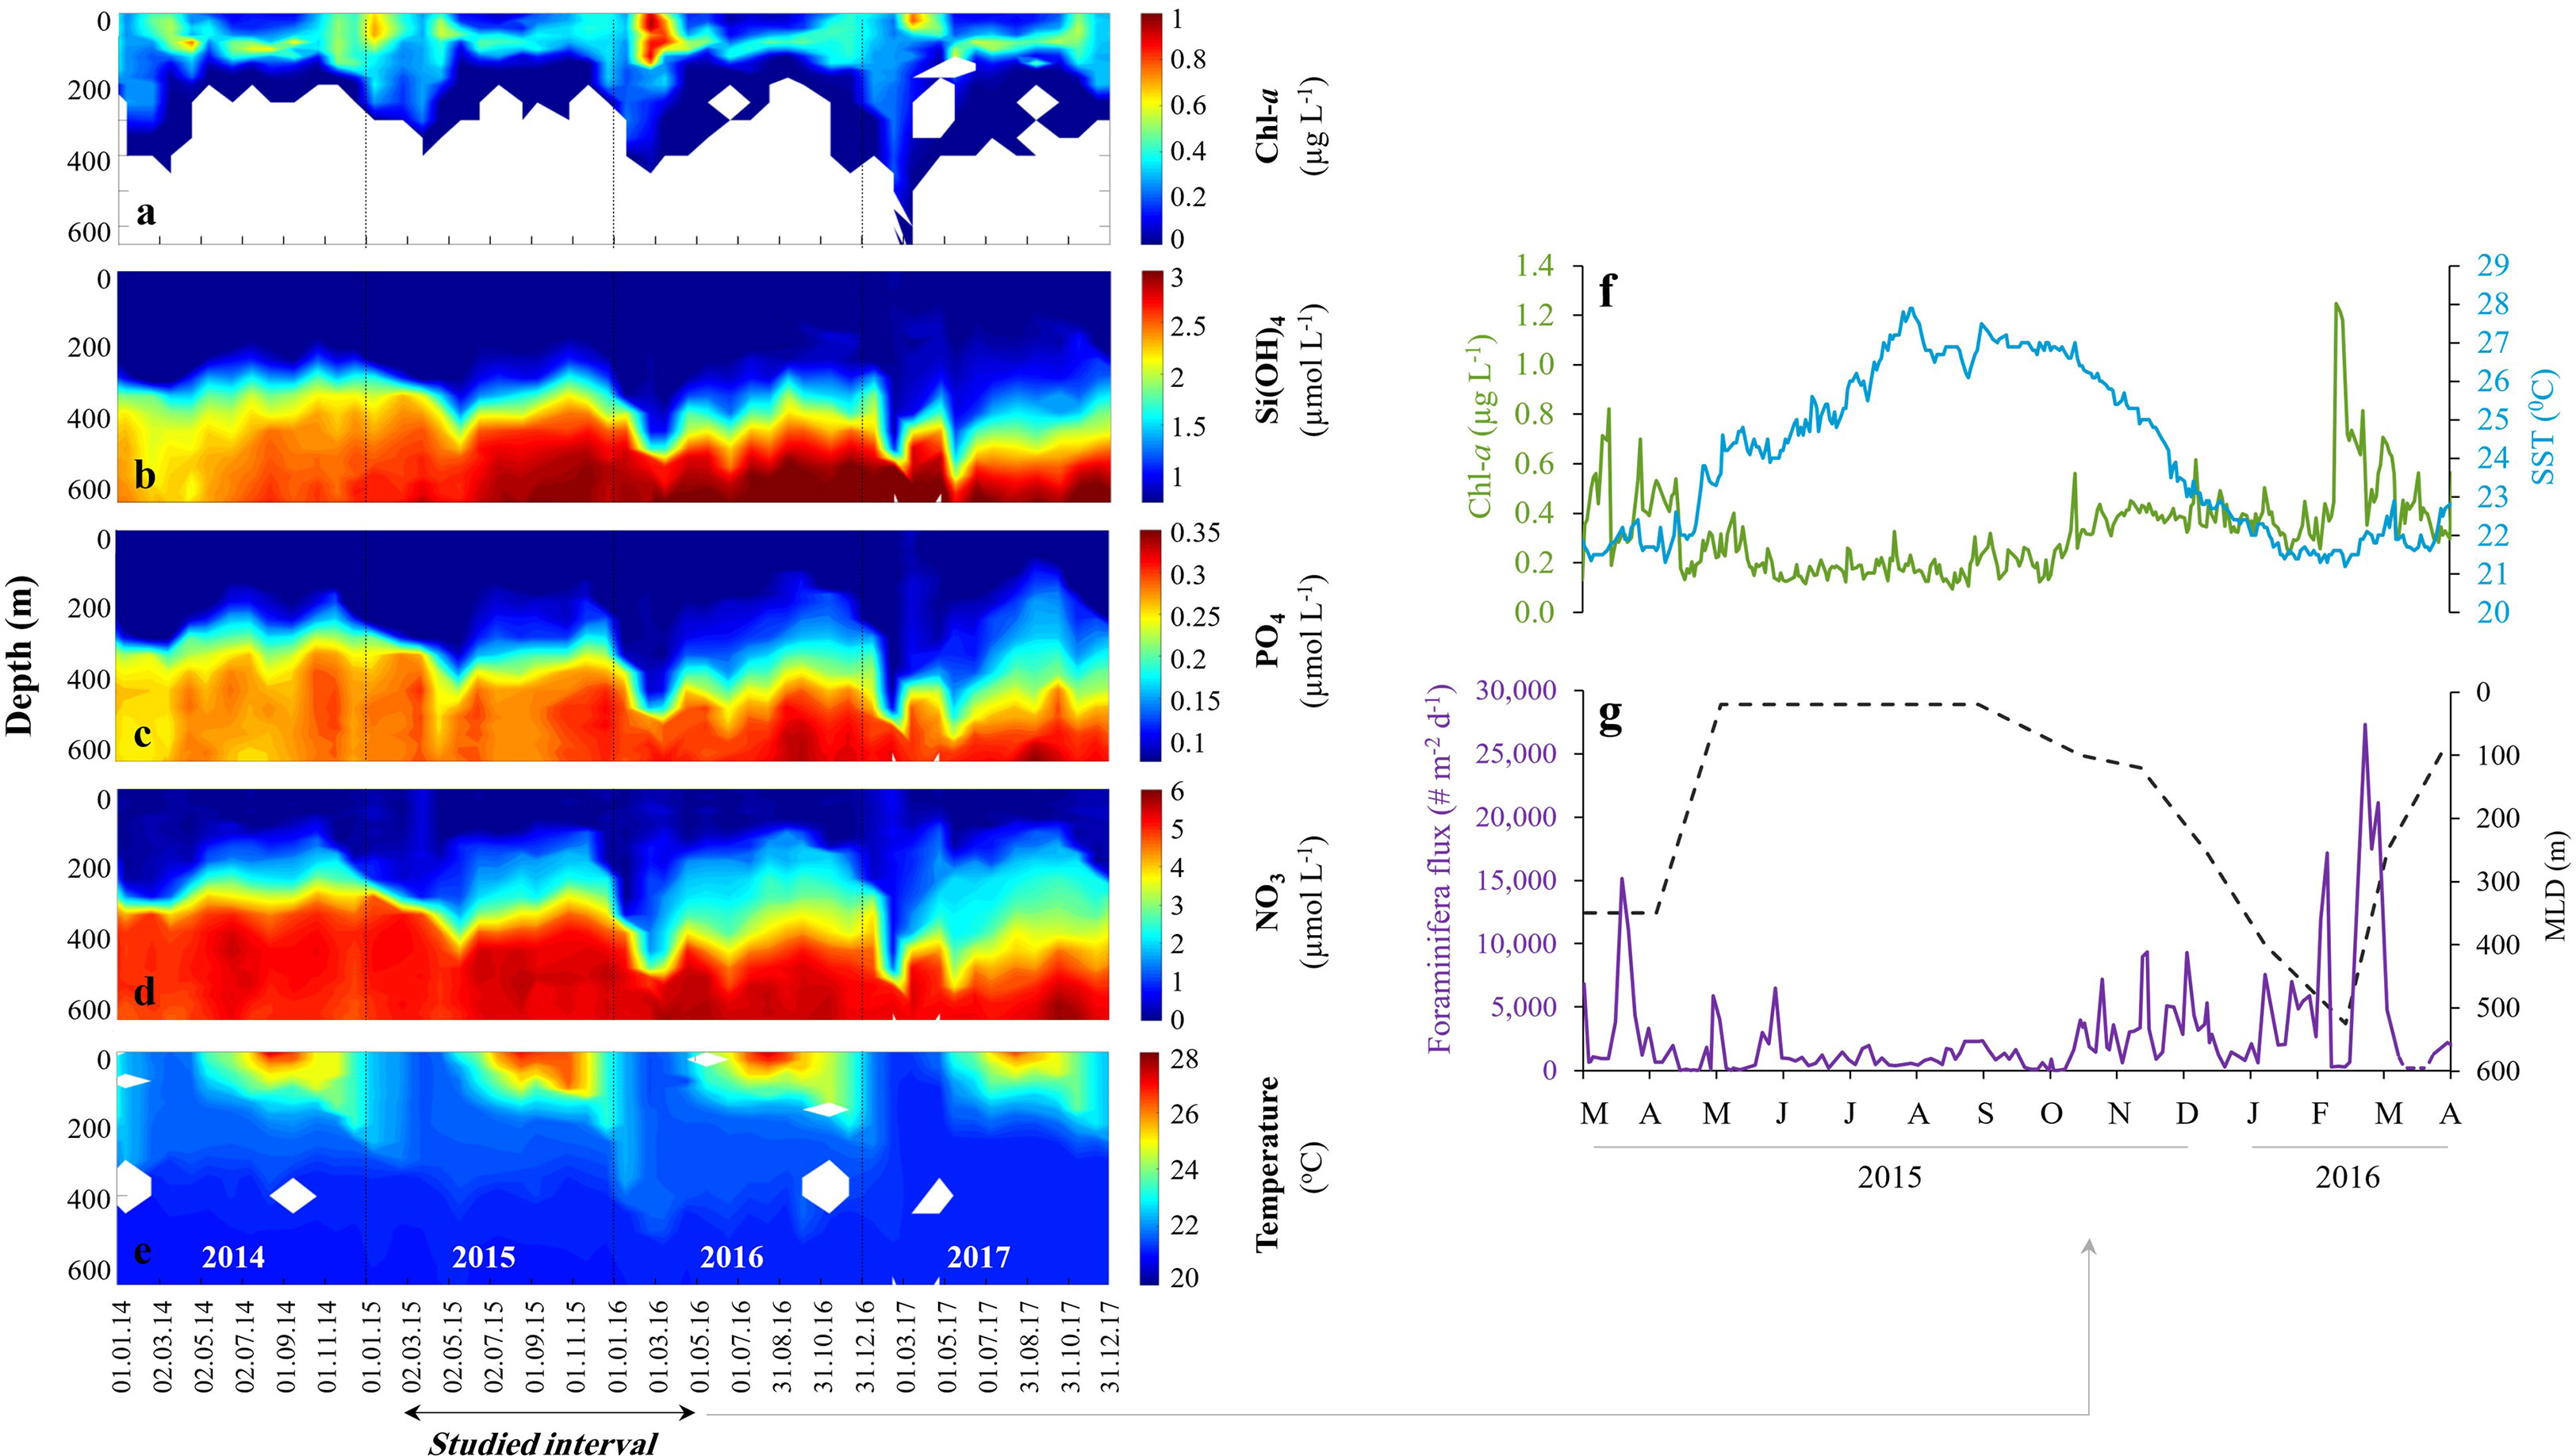
Figure 2 Gulf of Aqaba (GOA) oceanographic configuration. Chl-a concentrations (A), macro nutrients Si(OH)4 (B), PO4 (C), NO3 (D) and Temperature (E) in the GOA during 2014-2017. Data provided by the National Monitoring Program (Shaked and Genin, 2017). Planktonic foraminifera dynamics between March 2015 and April 2016: (F) Daily surface Chl-a concentrations (green) and Sea Surface Temperatures (blue). (G) Daily timescale fluxes of planktonic foraminifera (purple) and mixed layer depth (meters, black). The deepening of the mixed layer depth admixes subsurface nutrient-rich waters to the euphotic- surface zone. White areas in (A) mark no measurable Chl-a, and in (E) no sampling.
Water circulation in the GOA is primarily driven by northerly winds and advective heat fluxes (Biton and Gildor, 2011) that support surface evaporation. The latter is compensated by water advection from the south, mainly between April and August, through the shallow Straits of Tiran, with only negligible contributions from precipitation (<30 mm yr-1) (Labiosa et al., 2003; Biton and Gildor, 2011). During late-spring and summer (April-August), the water column is stratified, and the surface water layers are nutrient-depleted. During late autumn, winter and early spring months however, the thermocline gradually deepens, and deep convective mixing persists for several months, often reaching 600 m or more, enriching the surface water with deep, nutrient-rich waters (Lazar et al., 2008). Accordingly, the depth of mixing modulates the seasonal particulate flux, nutrient concentrations and primary production (Figure 2; Levanon-Spanier et al., 1979; Labiosa et al., 2003; Meeder et al., 2012; Torfstein et al., 2020). These in turn, control the dynamics of the phytoplankton community, which is dominated (>95%) by ultraphytoplankton (<8 µm) including Synechococcus and Prochlorococcus species and eukaryotes cells (dinoflagellates, diatoms, coccolithophores, Winter et al., 1979; Lindell and Post, 1995), as well as secondary (zooplankton) production (Kimor and Golandsky, 1977; Sommer, 2000). The GOA can therefore generally be considered as a ‘‘bottom-up’’ (nutrient controlled) rather than a ‘‘top-down’’ (grazing controlled) system (Levanon-Spanier et al., 1979; Sommer, 2000).
2.2 Gulf of Aqaba planktonic foraminifera species assemblages
The PF communities in the GOA have been investigated using plankton net tows (Almogi-Labin, 1984; Bijma et al., 1990; Erez et al., 1991), sediment traps (Chernihovsky et al., 2018; Chernihovsky et al., 2020) and in the sedimentary record (Reiss et al., 1974; Reiss and Halicz, 1976; Almogi-Labin, 1984; Steiner et al., 2017).
The three most abundant PF species in the modern GOA waters are Turborotalita clarkei, Globigerinoides ruber (white) and Turborotalita quinqueloba, comprising 60, 11 and 10% of the total PF assemblages, respectively (Chernihovsky et al., 2020). Additional species include Globigerinita glutinata, Dentigloborotalia anfracta, Globigerinella calida, Globigerinella siphonifera, Orbulina universa, as well as small shells of Globoturborotalita rubescens and Globigerinoides tenellus.
While T. sacculifer was the most dominant species during the early 1970’s (Almogi-Labin, 1984), its abundances gradually decreased thereafter until their complete disappearance in the early 1990s (Hastings et al., 1996; Steiner et al., 2017).
3 Methods
3.1 Sample collection and processing
An automated time-series sediment trap (McLane PARFLUX-II, aperture area 0.5 m2) was deployed continuously between March 2015 and May 2016 (Table S1) at the northern GOA (29° 28.95’ N, 34° 56.22’ E, water depth ~605 m) at a depth of ~410 meters, proximal to station A (Figure 1). The sediment trap is deployed along the same mooring described by Torfstein et al. (2020) and Chernihovsky et al. (2018); Chernihovsky et al. (2020), who provide a detailed description of the sample processing procedures. In brief, twenty-one bottom cups were filled with a saturated NaCl brine poisoned to ~150 mg/l HgCl2 in order to minimize sample degradation. The cups were rotated approximately every 1-3 days and mooring retrieval and redeployment was performed approximately every month (Table S1). Planktonic foraminifera (>63 µm fraction) were picked from 141 sediment trap samples and were identified to the species level using a stereo-microscope (Leica, M205 C). The length of the longest shell-axis (maximal Feret diameter is the longest distance between any two points along the silhouette area of individual shells) was manually recorded for each (adult) shell and will hereafter be referred to as shell diameter/size, using the Leica stereo-microscope software. Species identification followed Brummer and Kroon (1988); Hottinger et al. (1993) and Schiebel and Hemleben (2017). Shell fluxes are reported exclusively for intact adult individuals that presented the “adult stage” number of chambers at the last whorl or “terminal stage” (‘bulla-like’ final chamber and secondary apertures). Small shells of the species Globoturborotalita rubescens and Globigerinoides tenellus were not distinguishable to the species level, thus both species shells were classified under the name “G. rubescens + G. tenellus”. Few shells of the species Globigerinoides elongatus were lumped together with the species G. ruber (morphospecies of Globigerinoides; Morard et al., 2019). Very small shells of juveniles and neanic stages were unidentifiable to the species level and together with a few broken shells (containing >50% shell and proloculus), were classified as “Unidentified shells” (Table S1). Only very few spine-containing PF shells were observed, though these and reworked shells (shells that were resuspended in the water column, those are not pristine, but display opacity and eroded surface) were not included into the flux calculations.
3.2 Oceanographic data
Chl-a concentrations and sea surface temperatures (SST) were measured daily by the Israel National Monitoring Program (http://www.iuieilat.ac.il/Research/NMPmeteodata.aspx) at the pier of the Interuniversity Institute (IUI) for Marine Sciences at Eilat (Figure 1) and have been shown to be consistent with coeval values at Station A (29° 28.22’ N, 34° 55.50’ E; Figure 1B; Shaked and Genin, 2017), proximal to our study site. The mixed layer depth (MLD) was calculated using the variable sigma-t criterion equivalent to a 0.2 °C temperature change (Sprintall and Tomczak, 1992).
3.3 Statistical data evaluation
Spectral analyses were performed on the raw flux data of PF species and their size-fractions, based on the Lomb-Scargle power spectral density (PSD) that estimates periodicities in unevenly spaced time series (Trauth, 2007). For comparison, the observations were interpolated to values at a daily resolution and reanalyzed again for their spectral distribution, yielding similar results, except for a minor peak of G. ruber ca. 30 days. We consider this result and the differences between the two data sets (raw and interpolated) to represent artifacts stemming from the interpolation procedure. These analyses were replicated after seasonal de-trending, again with only minor differences. Our discussion therefore refers to the spectral analyses of the raw data.
PF shell size changes along the different seasons were tested by One-way ANOVA (R Core Team, 2020; ‘car’ package, Fox and Weisberg, 2019) or Welch test for unequal variance samples (‘agricolae’ package, de Mendiburu, 2020). This was followed by post-hoc multiple-comparison adjusted Tukey test (‘lsmeans’ package, Lenth, 2016; ‘agricolae’ package, de Mendiburu, 2020). Here, we defined the seasonal intervals as: Spring 2015 (March 17th - May 31st), Summer 2015 (June 1st - August 31st), Fall 2015 (September 1st - November 30th), Winter 2015-2016 (December 1st - February 29th) and spring 2016 (March 1st - May 18th). Shell diameters of species that contained <30 specimens (at least at one season) were tested by the non-parametric Kruskal-Wallis test (‘agricolae’ package, de Mendiburu, 2020) followed by the post-hoc multiple comparisons Dunn test (‘FSA’ package, Ogle et al., 2020). Statistical analysis was not performed for the shell sizes of the species O. universa due to insufficient number of specimens.
To compare PF shell-size globally, the shell-size of six abundant species in the GOA (G. ruber, G. glutinata, G. rubescens + G. tenellus, G. calida, G. siphonifera and O. universa) were compared to corresponding shells collected from surface sediment samples in subtropical and tropical regions (Rillo et al., 2020) and sediment trap samples from an upwelling area (Cape Blanc, Kiss et al., 2021). For consistency, only PF shell-sizes larger than 150 µm from the GOA were considered for this comparison (Table S2, third column). Analyses of normality, variances and means were performed using R (R Core Team, 2020) as described in the previous paragraph.
4 Results
4.1 Flux patterns
The total PF shell fluxes display a distinct seasonal pattern with low baseline values of < 2000 individuals m-2 d-1 during the summer and early-fall months (June to October), gradually increasing during late-fall and winter (coeval with decreasing SSTs) to intermediate values of < 10,000 ind. m-2 d-1 (November to January). Peak fluxes (>15,000 ind. m-2 d-1) are observed during late-winter and early-spring (February to April) in association with peak Chl-a surface concentrations (Figure 2; Chernihovsky et al., 2020). These patterns were similarly expressed at the species level, where most of the species fluxes increase gradually during the winter, reaching their annual peak value during spring, coeval with maximal Chl-a concentrations i.e. T. clarkei, T. quinqueloba, G. rubescens + G. tenellus and G. calida (Figures 3, S1, S2, S5). Among this group, some species display peak fluxes only during the spring bloom i.e. G. glutinata, G. siphonifera and O. universa (Figures S3, S6, S7). Other species, however, exhibit an early increase in fluxes during the fall i.e. G. ruber (Figure 3) and D. anfracta (Figure S4).
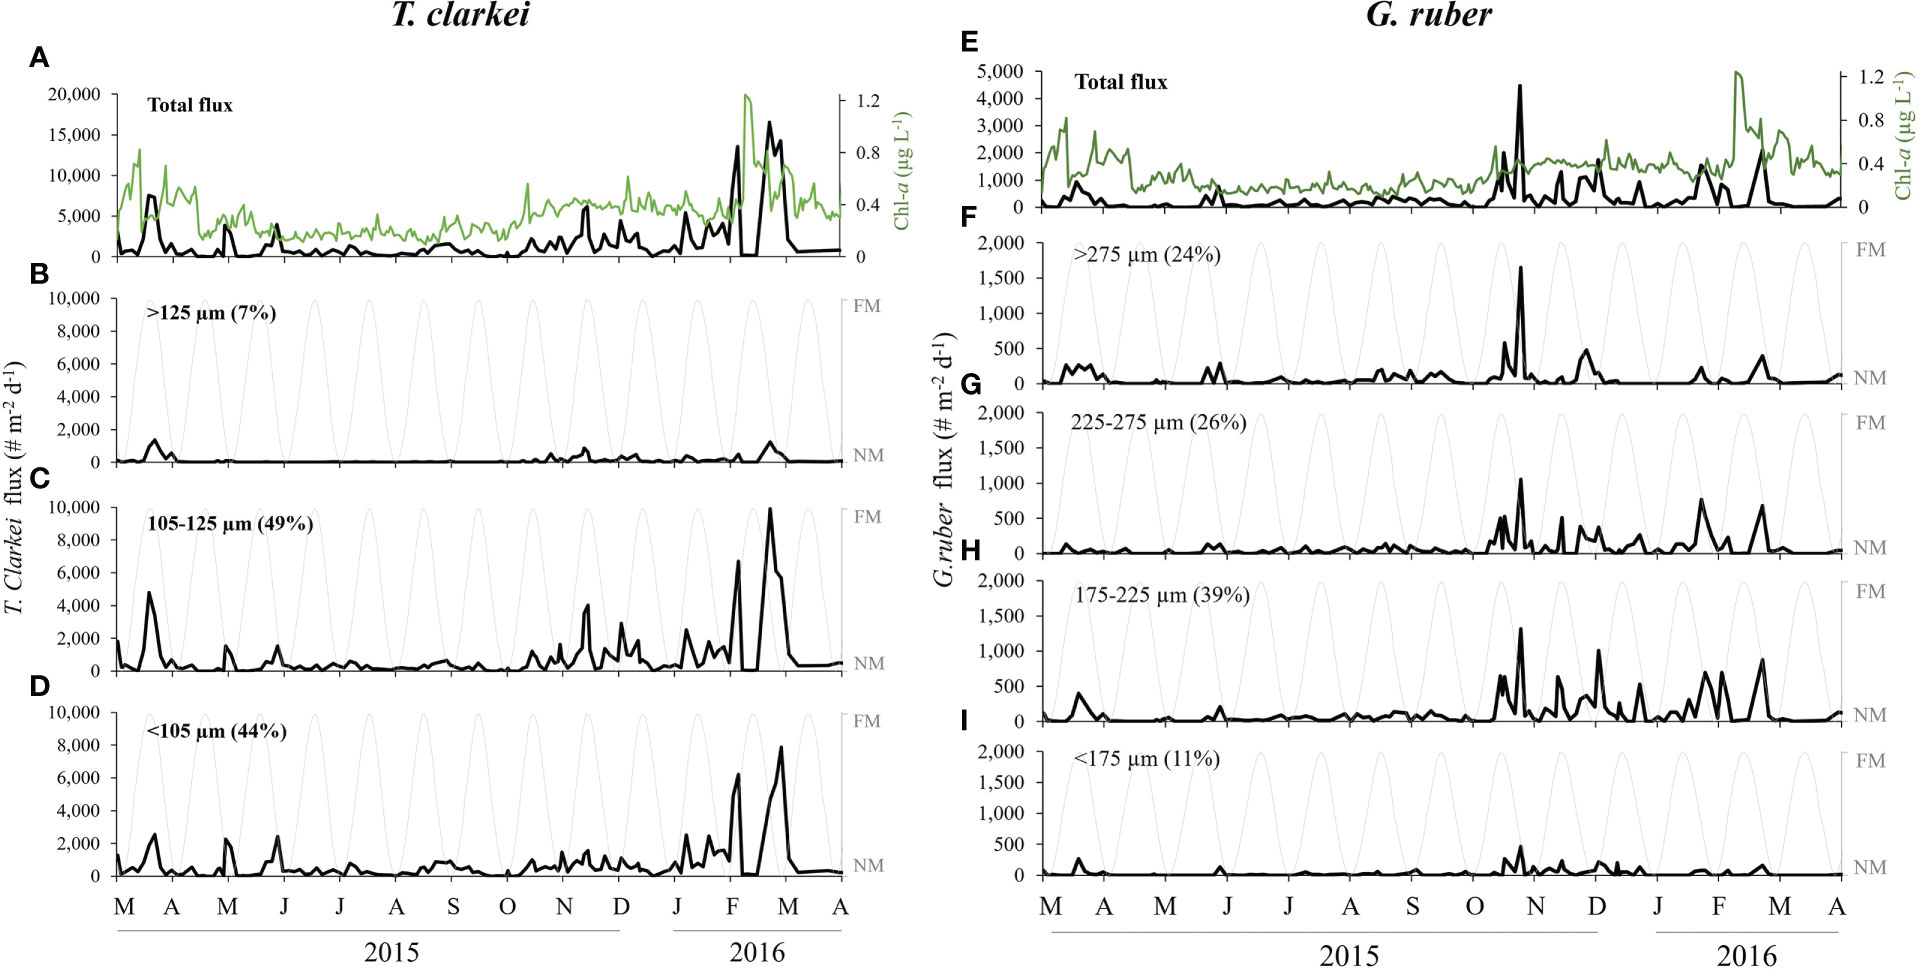
Figure 3 T. clarkei (left panel) and G. ruber (right panel) fluxes between March 2015 and April 2016. (A) Total daily shell flux of T. clarkei (# m-2 d-1, black) and surface Chl-a concentrations (green). (B–D) Moon illumination (%, gray) and T. clarkei fluxes of size-fractions. (E) Total daily shell flux of G. ruber (# m-2 d-1, black) and surface Chl-a concentrations (green). (F–I) Moon illumination (%, gray) and G. ruber fluxes of size-fractions. Brackets present the relative percentage of the denoted flux from the total flux.
Of the PF species studied, T. clarkei and G. ruber serve as representative species of two ecological niches end-members (Chernihovsky et al., 2020):
T. clarkei. A relatively small, symbiont-barren deep dwelling species (>200 m depth, Chernihovsky et al., 2018). Shell fluxes of the two smallest size fractions, <105 (44% of the total species shells) and 105-125 µm (49%) have similar annual patterns (Figure 3), while the largest size fraction (>125 µm) exhibited significantly lower fluxes, negligible during most of the summer and fall, with relatively low peaks during spring blooms.
G. ruber. A relatively large, symbiont-bearing, surface dwelling species. All size fractions demonstrate similar patterns of maximum fluxes during the fall, with relatively simultaneous peak values throughout the winter and spring (Figure 3). The 175-225 µm size fraction is predominant, consisting 39% of the total annual flux, while the highest flux value was observed in the largest size fraction of >275 µm (24%) during the fall.
In both springs of 2015 and 2016, PF fluxes exhibit a precursor peak (e.g., February 15th, 2016), prior to the annual Chl-a peak (e.g., February 19th, 2016), constituted from the shell flux of the species: T. clarkei, T. quinqueloba, G. rubescens + G. tenellus and G. calida (Figures 3, S1, S2, S5).
Both species fluxes and temporal size variability do not exhibit significant periodicity (e.g. tidal, semi-lunar or lunar) (Figure 4). Results for the remaining species: T. quinqueloba, G. rubescens + G. tenellus, G. calida, G. glutinata, D. anfracta, G. siphonifera and O. universa - are provided in the Supplementary Materials (Figure S8, Supplementary Results A). In order to further explore possible lifespans of PF, we identified local peaks in each of the PF species fluxes. These peaks were defined as those that are higher than the fluxes observed during the 5 days before and after the sampling (Figures 5, S9, S10). We further recorded the number of days elapsed from the previous local peak (e.g., left y-axis in Figures 5A, B). The fluxes of seven species (T. clarkei, G. ruber, G. rubescens + G. tenellus, G. glutinata, D. anfracta and G. calida) demonstrate relatively more frequent local peaks between mid-fall and mid-winter, after the first annual peak of Chl-a (25.10.2015), coeval with a drop in SSTs and deepening of the MLD (marked by grey rectangle in Figures 5, S9, S10). For example, T. clarkei fluxes exhibit an average peak recurrence time of 10 ± 3 days during November and December 2015, coeval with a drop in SSTs and deepening of the MLD, compared with 16 ± 4 days during the rest of the studied period, while elongated periods of > 3 weeks in-between peaks occurred during the summer (e.g., May-June and July-August, Figure 5A). The shell fluxes of the species G. ruber demonstrated a similar pattern; an average peak recurrence time of 9 ± 4 days during November 2015, immediately after the first annual peak of Chl-a, compared with 15 ± 7 days during the rest of the studied period (Figure 5B).
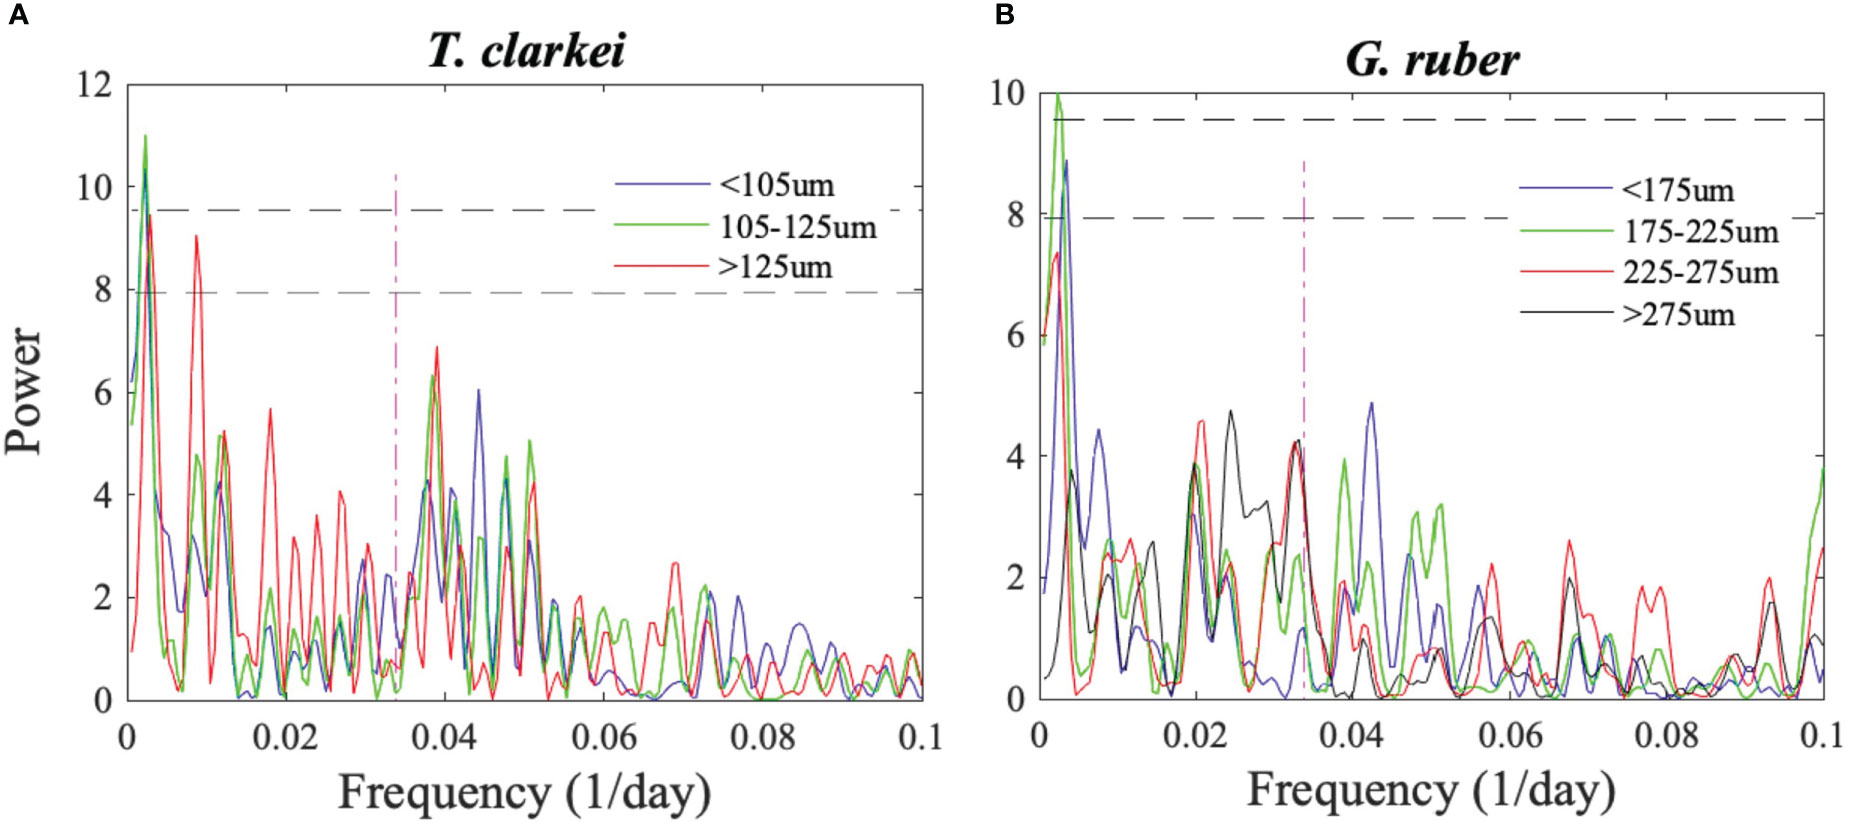
Figure 4 Lomb-Scargle periodograms of (A) T. clarkei and (B) G. ruber shell fluxes of different size-fractions. The two horizontal lower and upper dashed curves mark a 95% and 99% detection probability, respectively. The red vertical curve denotes a 29.5-day cycle that corresponds to lunar periodicity.
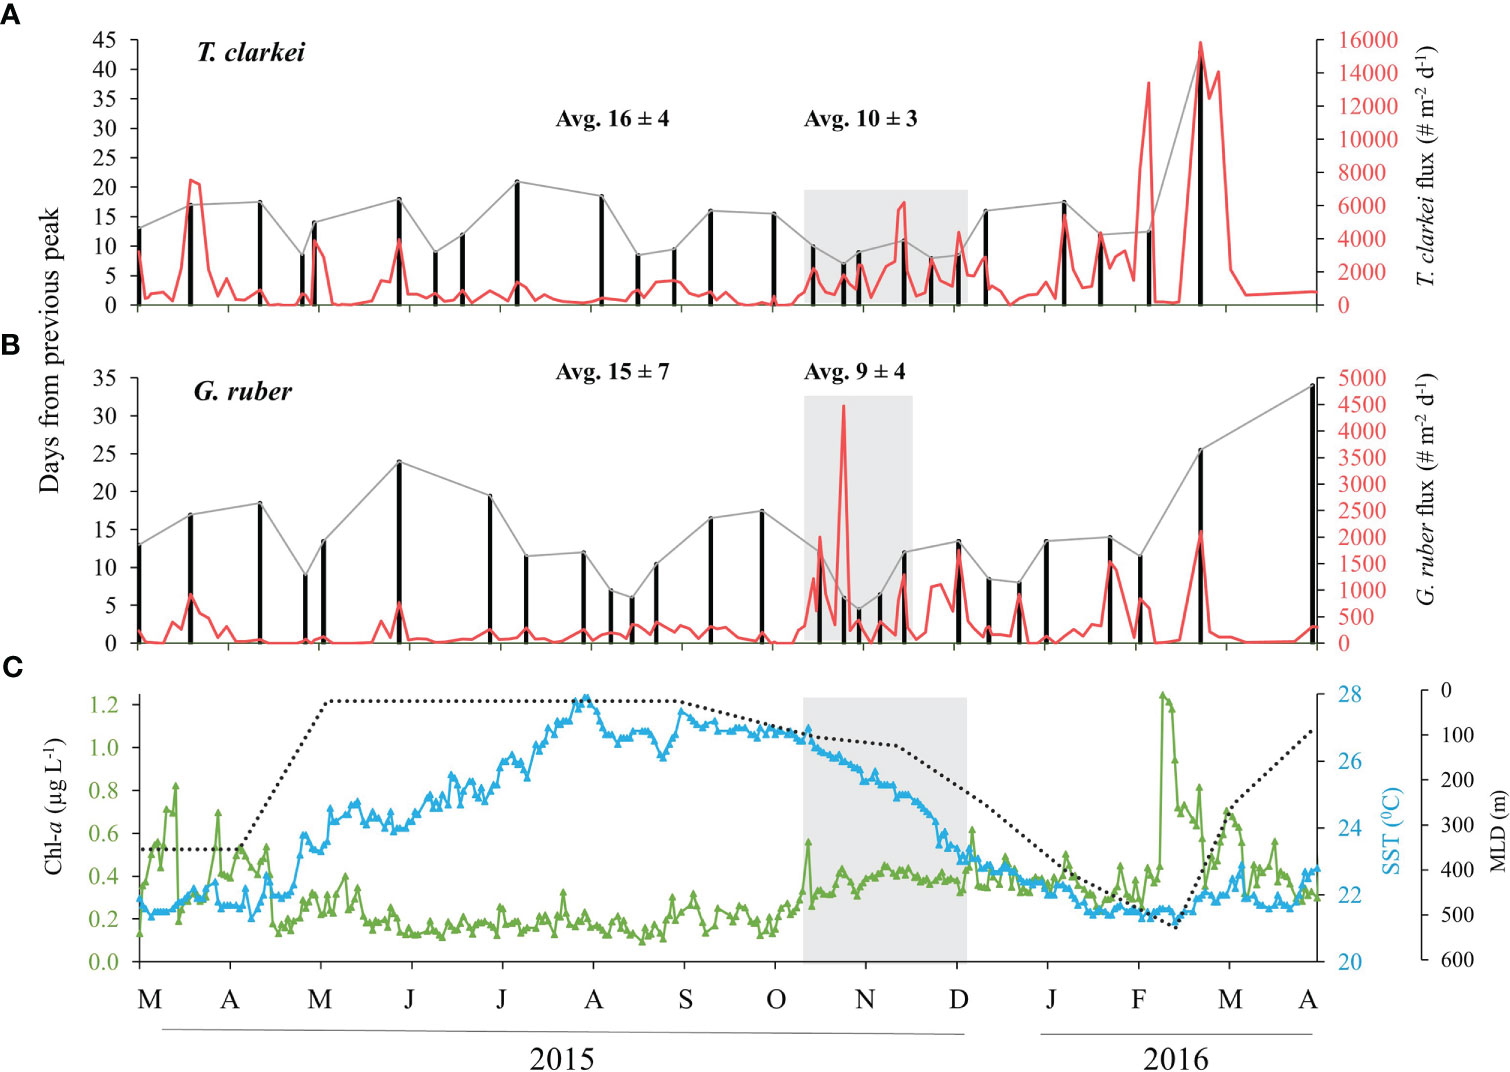
Figure 5 Local maxima (peaks) flux for the species T. clarkei (A) and G. ruber (B) between March 2015 and April 2016. Left axis denotes to # days from the previous maxima peak (black bars and dashed gray line) and right axis denotes to flux (# shells m-2 d-1, red). Gray rectangles represent shorter time-intervals between flux maxima with indicative average ± SD for this period. Additional average ± SD is calculated for the rest of the studied period. (C) presents the related Chl-a concentrations (green), sea surface temperatures (blue) and mixed layer depth (black). Gray rectangle in (C) represent the transition from stratified to vertically mixed water column. See more details in text.
4.2 Shell-size distributions
Considering the entire set of PF shells, 69% are smaller than 125 µm and 81% smaller than 150 µm (Figure 6; Table S2). Three characteristic shell-size groups can be defined: the smallest- shell species include T. clarkei, D. anfracta and T. quinqueloba whose average shell does not exceed 125 µm. Of these, T. clarkei exhibits the minimal adult shell-size (60 µm, Figures 6, 7; Table S2). Medium- shell species: G. rubescens + G. tenellus, G. glutinata, G. calida and G. ruber, whose size ranges between 125 and 250 µm. The largest- shell species, G. siphonifera and O. universa, whose average shell is larger than 400 µm (Figure 6; Table S2). The largest individual shell that we observed belongs to G. siphonifera (809 µm).
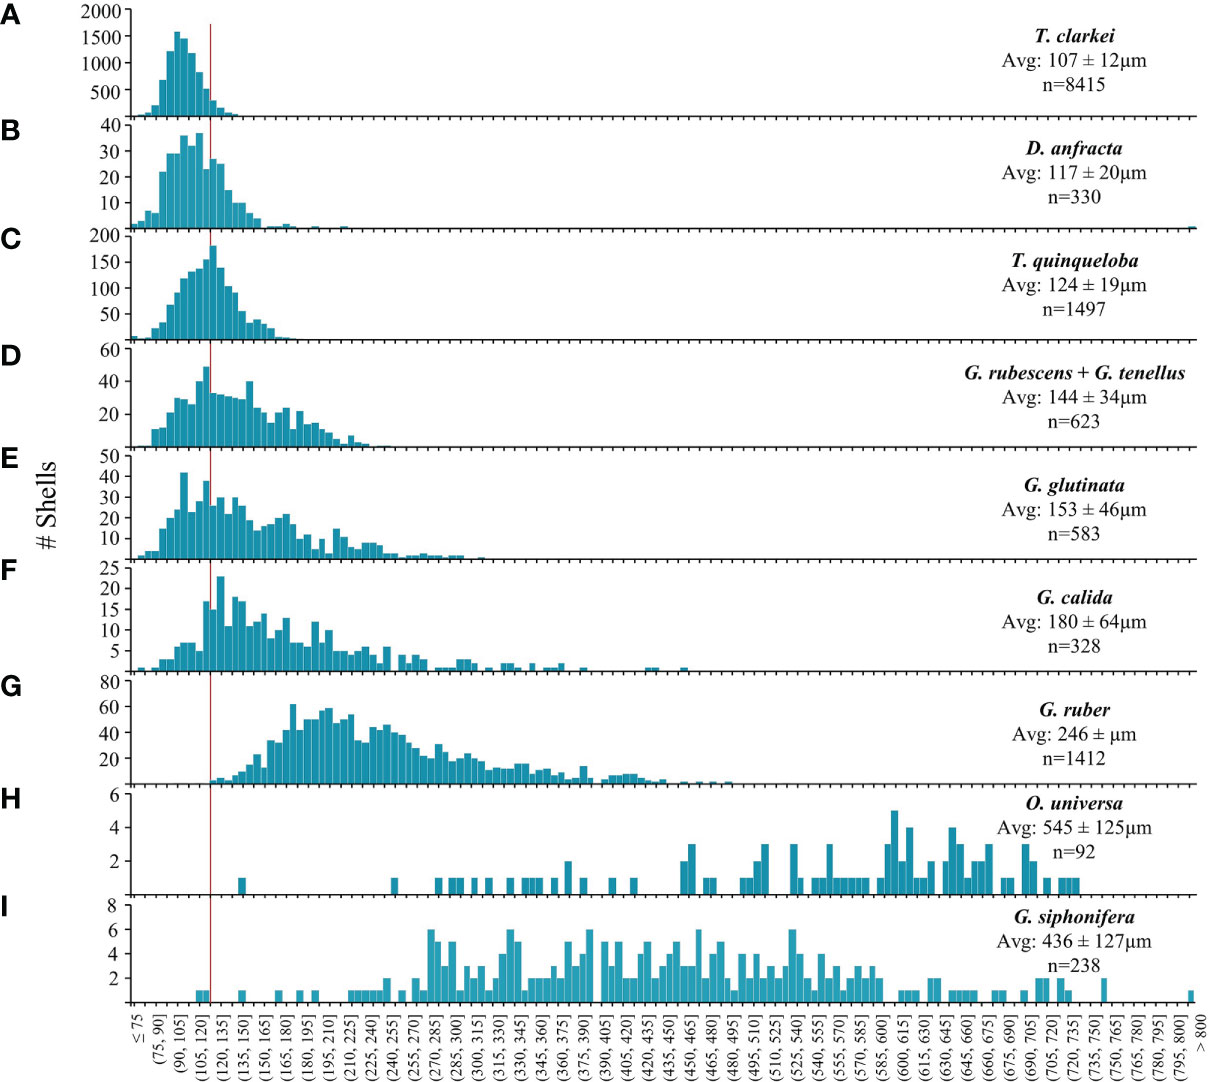
Figure 6 PF species shell-size (µm) distribution histograms: (A) T. clarkei, (B) D. anfracta, (C) T. quinqueloba, (D) G. rubescens + G. tenellus, (E) G. glutinata, (F) G. calida, (G) G. ruber, (H) O. universa and (I) G. siphonifera. Red vertical line denotes 125 µm. Avg.= average shell-size ± standard deviation, n = sample size.
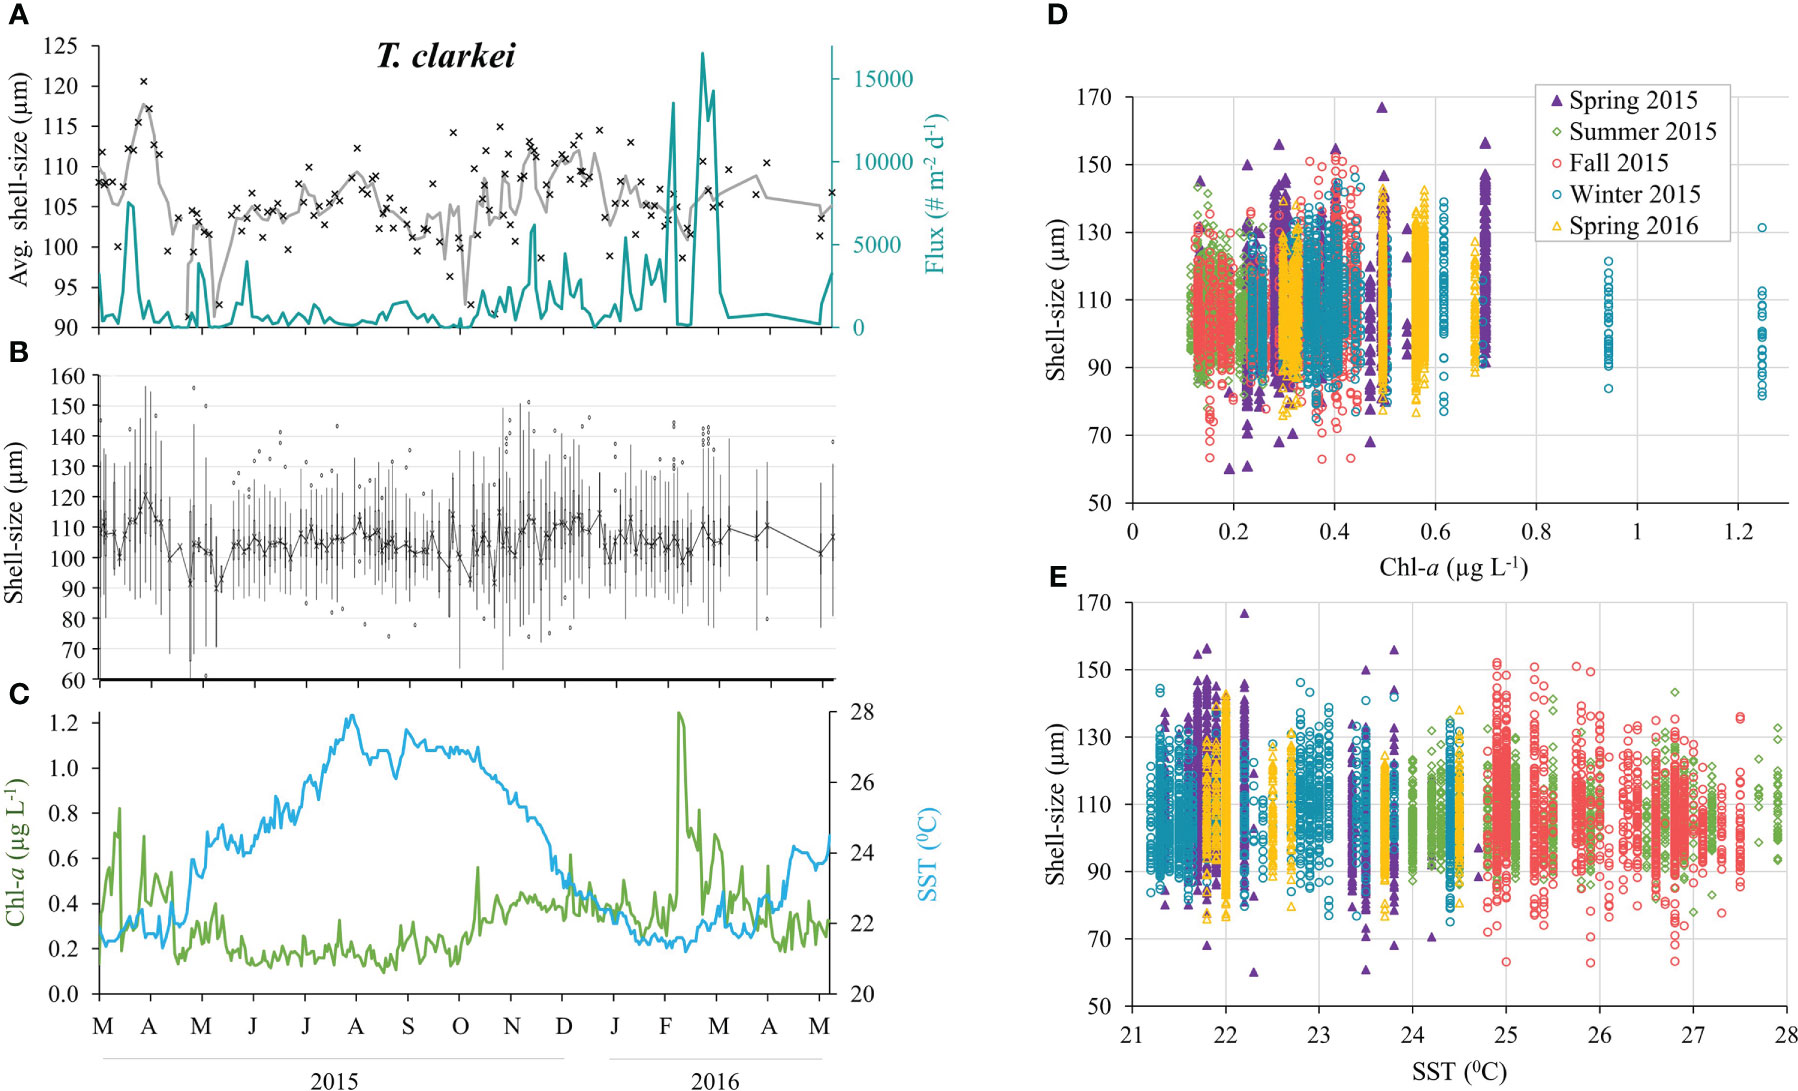
Figure 7 T. clarkei shell-size distributions between March 2015 and April 2016 (n = 8,415). (A) Average shell-size and 3-point running average (black cross and gray curve, respectively), and total shell flux (turquoise line). (B) Shell-size distribution: mean values (black cross), upper and lower whiskers indicate max. and min. values, respectively. Box max. line = 75th percentile, middle line = median and lower line = 25th percentile. Outliers (dots). (C) Sea surface Chlorophyll-a concentrations (green) and temperatures (blue). Shell-size classification according to seasons versus surface Chl-a concentrations (D) and SSTs (E).
While the shell-size of the small species (T. clarkei, D. anfracta and T. quinqueloba) display quasi-symmetrical unimodal distributions, the medium species (G. rubescens + G. tenellus, G. glutinata, G. calida and G. ruber) demonstrate a right-tail skewed distribution towards the larger size (Figure 6). The largest species, G. siphonifera and O. universa demonstrate very widespread and non-uniform distribution that might be due to their small sample size (238 and 92 shells, respectively).
All PF species display seasonal changes of the average shell-size, with the largest mean size and widest distribution occurring during spring 2015 (albeit not statistically significant for G. calida, G. siphonifera and O. universa, Figures 7, 8; Table S3). Size differences however, between the winter of 2015 and the spring of 2016 were small (Figure 8; Table S3). In general, all PF species (except to G. ruber) exhibit increased sizes during the 1-2 weeks following the spring Chl-a peak of 2015 (Figures 7, S11-S18), though this is not observed during the following spring of 2016. Additionally, five species demonstrated a sharp increase in shell-sizes following the first Chl-a peak at 25.10.2015 (T. clarkei, T. quinqueloba, G. rubescens + G. tenellus, G. glutinata and G. calida, Figures 7A, S12-S14, S16). T. clarkei shell-size decreased from maximal values during the spring of 2015 to minimal values during the following summer, while sizes during the rest of the year displayed intermediate values (Figures 7, 8; Table S3). G. ruber shell-size exhibited minimal values during the winter of 2015-2016 (albeit not statistically significant, Figures 8, S11; Table S3). Results for the remaining PF species are reported in the Supplementary Materials (Supplementary Results A).
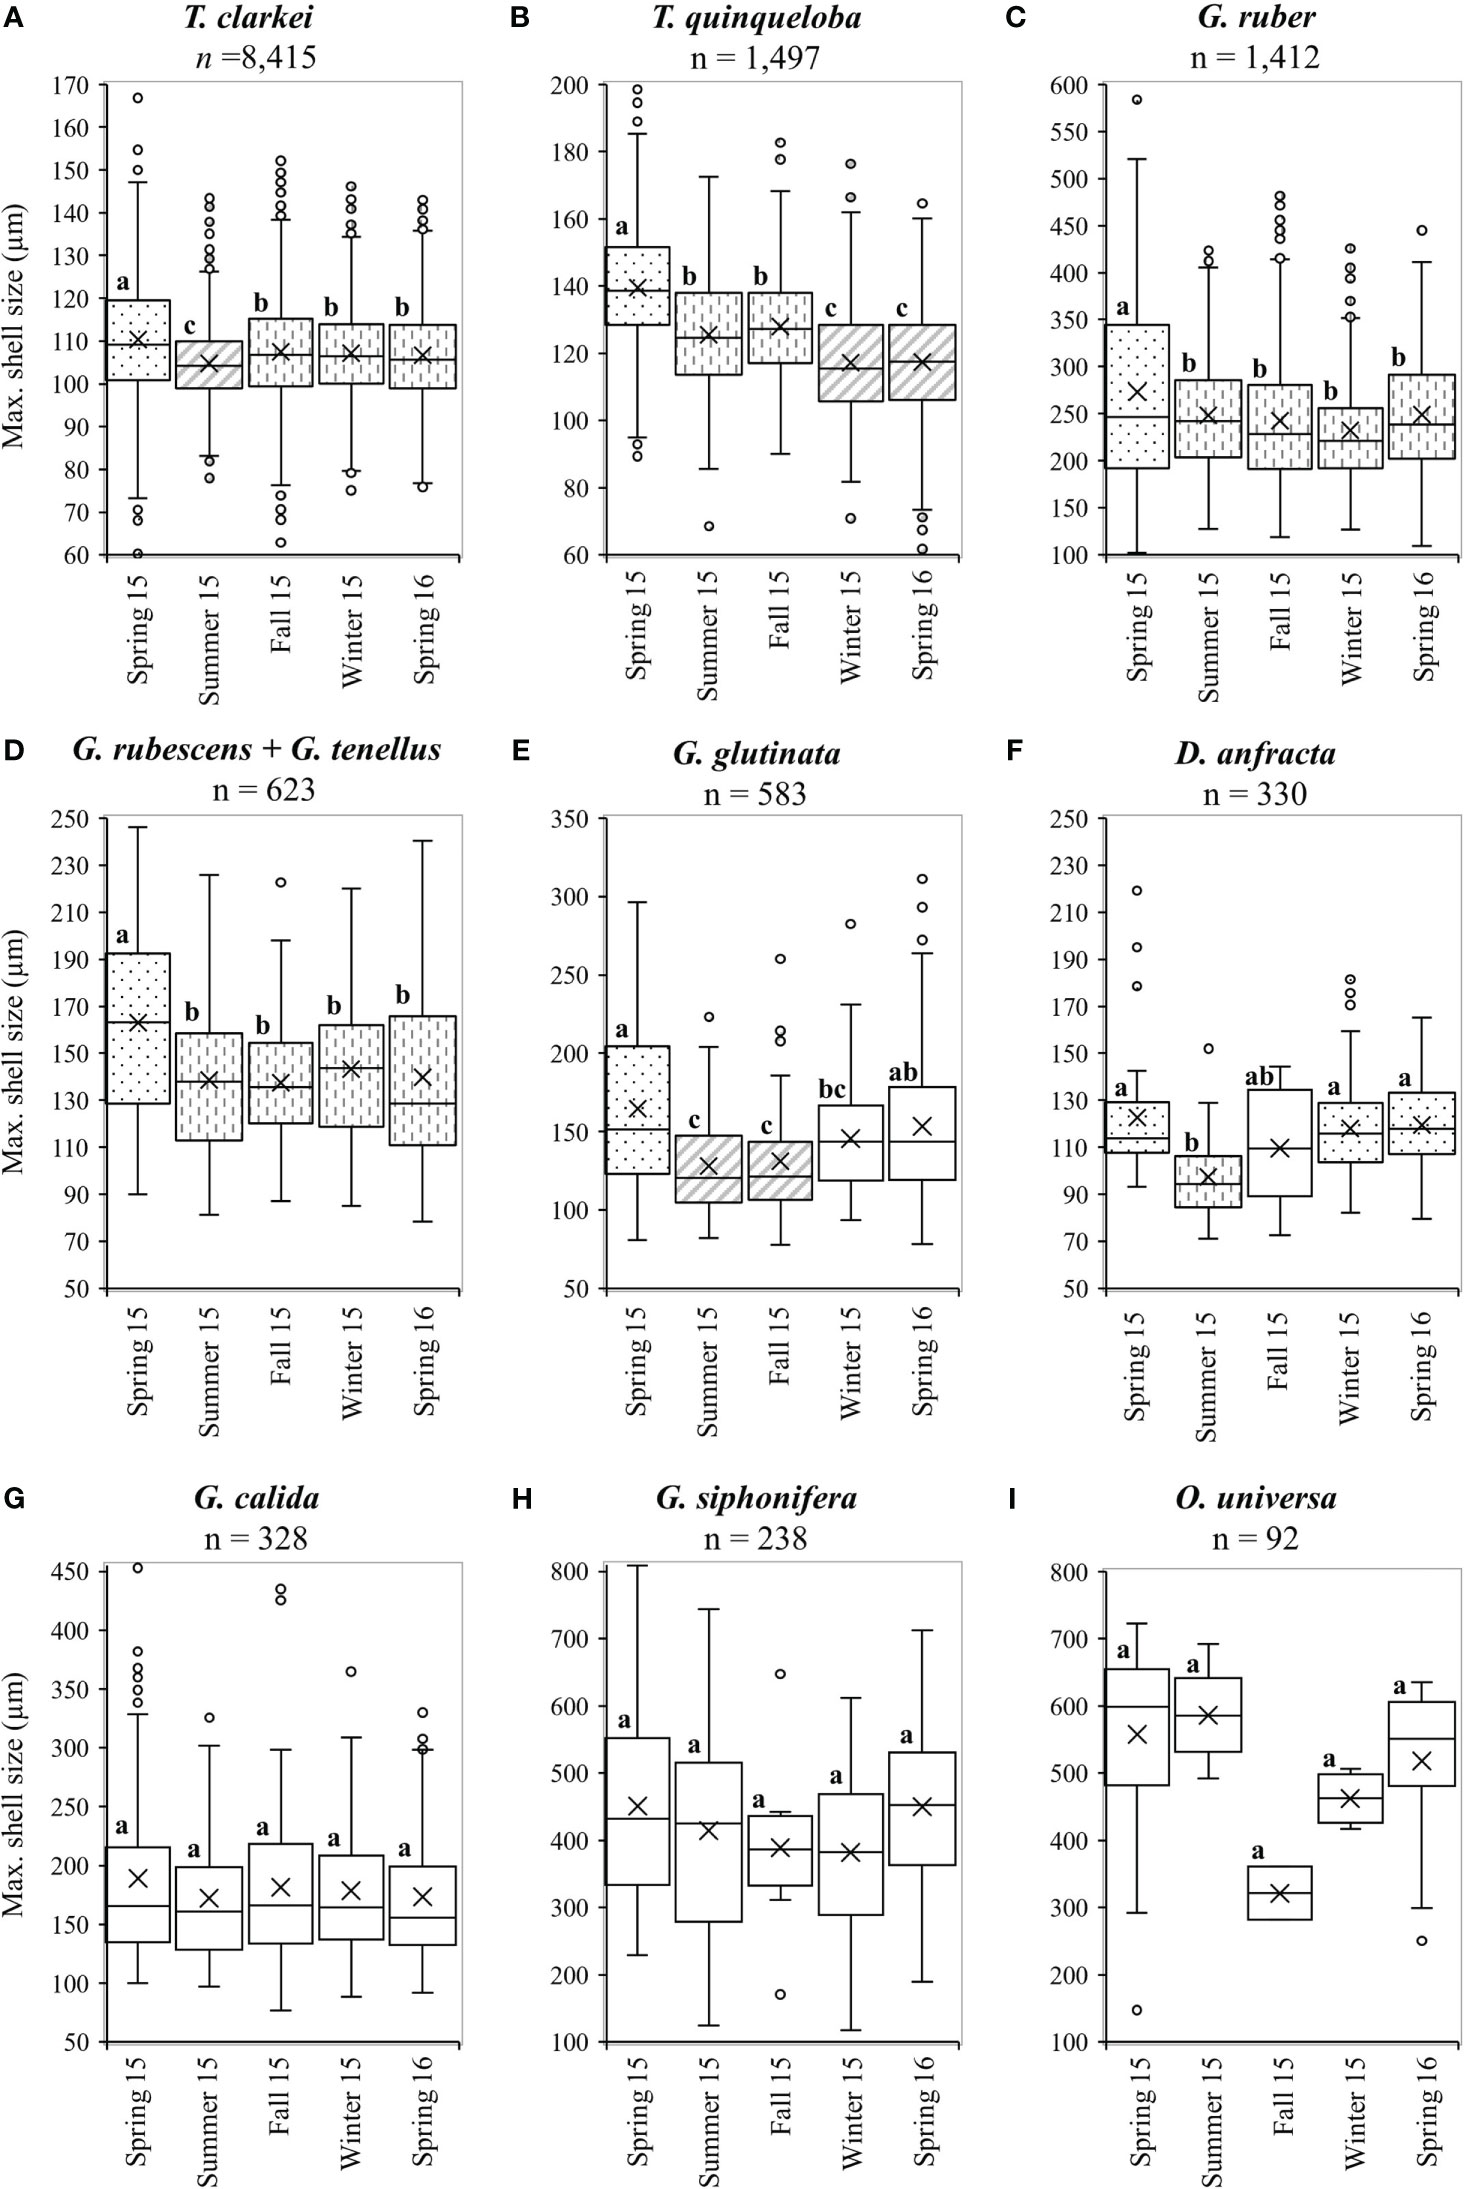
Figure 8 Average seasonal shell-size (µm) distributions for different species: (A) T. clarkei, (B) T. quinqueloba, (C) G. ruber, (D) G. rubescens + G. tenellus, (E) G. glutinata, (F) D. anfracta, (G) G. calida, (H) G. siphonifera and (I) O. universa. Different fill patterns and letters refer to statistically significant (p value < 0.05) different shell-size groups. Dots fill represents the largest size (group a), vertical-bars fill represents middle size (group b) and diagonal-lines fill represent the smallest size (group C). Blank boxes = not significant. For more details see Table S3.
5 Discussion
5.1 PF flux patterns and timing of generation turnover
To a first order, all size fractions of most of the studied species demonstrate similar flux pattern dynamics and co-occurring short-term peaks (Figures 3, S3, S5-S7). This indicates that adult individual PF respond, regardless of their shell size, to a common signal of beneficial conditions (such as food supply) and might undergo reproduction (Figures 3, S1-S7). Nevertheless, the fluxes of four PF species (T. quinqueloba, G. rubescens + G. tenellus and D. anfracta) demonstrate flux pattern offsets between different size-fractions. For example, during the 2015 spring, T. quinqueloba (>125 µm) and G. rubescens + G. tenellus (>175 µm) display peak flux values, which are not expressed by the two other smaller size fractions (Figures S1, S2).
A precursor peak of PF fluxes was exhibited (in both springs of 2015 and 2016) prior to the annual Chl-a peak (Figures 3, S1, S2, S5). This PF peak is considered to be part of the sequence of intermediate winter PF flux peaks, suggesting that this is part of a systematic pattern. We postulate this peak is associated with short-term mortality due to predation by different succession peaks of larger zooplankton in the water column (for further details, see Chernihovsky et al., 2020).
The largest PF mean shell size and widest distribution occurred during the prolonged spring of 2015 (Figure 8; Table S3). It has been shown that PF growth is stimulated by redistribution of Chl-a and entrainment of nutrient-enriched waters into the mixed layer (e.g., Schiebel et al., 2001), and that well-nourished PF yield relatively larger final shell size with greater number of chambers (e.g., Takagi et al., 2018). Thus, it is possible that the prolonged vertical mixing period of 2014-2015 enabled most individuals to reach a maximal shell-size. Importantly, except for a broad seasonal cycle, spectral analyses of each of the size-fractions do not reveal distinct shorter-term (tidal, semi-lunar or lunar) PF life cycles (Figures 4, S8).
Observations from the 1970’s and 1980’s in the GOA and Red Sea have suggested that the species T. sacculifer, G. ruber and G. siphonifera follow lunar synchronized reproduction (Almogi-Labin, 1984; Bijma et al., 1990; Erez et al., 1991). This periodicity, however, is not identified in any of the size-fractions of species discussed here from the GOA (Figures 4, S8), despite significantly higher temporal resolution and continuity of the record. This result implies one of three possibilities. The first, is that despite previous suggestions, PF life cycles are not paced by lunar phases, or that the lunar phasing modulation is very minor compared to the impacts of seasonal variations in SST, water column mixing and primary production. Such a case study was demonstrated by Meilland et al. (2021) who reported that up to 70% of G. glutinata and G. ruber in the tropical Atlantic do not appear to take part in synchronized reproduction. The second, is that lunar phasing modulation is significantly weaker today relative to several decades ago due to a change in environmental conditions. For example, an increase in light pollution in the GOA, having gradually increased over the past few decades (Tamir et al., 2017), could have suppressed the impact of lunar synchronization. We note however, that the sampling site, at a water depth of ~610 m, and located several km away from a largely deserted shore-line, with the closest cities (Eilat and Aqaba) located some 10 km to the north, is not likely to be strongly influenced by anthropogenic light pollution. By contrast, a comparison between the modern spawning intensity of corals in the GOA and records of spawning from the 1980s led Shlesinger and Loya (2019) to conclude that local corals had lost their reproductive synchrony, probably due to changing temperatures regimes rather than light pollution. The third possibility could be facultative asexual reproduction (Davis et al., 2020; Takagi et al., 2020; Meilland et al., 2023), which does not require synchronization. Nevertheless, the role of asexual reproduction on PF population dynamics is still unknown. To date, none of the PF species in the GOA was evidenced to reproduce asexually. Thus, regardless of the reasons for the lack of lunar synchronization in PF life cycles in the GOA, it is noted that such periodicity cannot be a-priori assumed to exist and requires robust confirmation.
Invalidation of clear fixed sub-annual life cycles enforced the investigation of adaptable and more flexible cycles. Between the period of minimal food availability (i.e., summer and early-fall) and the spring bloom (i.e., late-winter and spring), most species (T. clarkei, G. ruber, G. rubescens + G. tenellus, G. glutinata, D. anfracta and G. calida) demonstrate more frequent local peaks between mid-fall and mid-winter, coeval with the gradual increase of Chl-a concentrations (Figures 5, S9, S10). We interpret these patterns of changing recurrence times in peak fluxes as reflecting a transition phase of PF life cycles triggered by the improved conditions during winter (i.e., deepening of the mixed layer and redistribution of deep, nutrient replete waters to shallow depths, leading to increased productivity; Lindell and Post, 1995; Labiosa et al., 2003; Chernihovsky et al., 2018; Chernihovsky et al., 2020). These findings correspond with previous suggestions, e.g., Takagi et al. (2018) who documented that frequent feeding of PF (i.e., increased food availability) leads to a larger final shell-size, more chambers (compared to non-fed specimens) and a higher ratio of gametogenesis. Furthermore, experiments by Bé et al. (1981) and Caron et al. (1982) demonstrated that daily fed individuals of T. sacculifer underwent gametogenesis every 10 days on average, while those fed every 3 or 7 days lived as long as 14 and 23 days, respectively. The average life span of non-fed individuals, undoubtedly acquiring some nutrition from their symbionts, was 31 days. Bijma (unpublished data, cited from Hemleben et al., 1989, p. 160) observed that specimens of T. sacculifer and G. ruber from the Red Sea that were transferred into the laboratory, underwent gametogenesis each day, in tune with feeding rather than an external cue (e.g., lunar signal). Jonkers et al. (2010) suggest that dormant non-calcifying PF individuals from the seasonally mixed NW Atlantic Ocean may survive for several months under unfavorable conditions and will reproduce only upon improved conditions. In the lab, Spindler et al. (1979) observed that some cultured specimens of H. pelagica skipped a reproductive cycle and reproduced at the next one, i.e., lifespan of approximately two months.
5.2 Shell-sizes and seasonal changes
The PF species assemblage in the GOA is characterized by relatively small shell-size species, dominated by T. clarkei. Its average shell-size (107 ± 12 µm) renders it as one of the smallest modern PF species identified worldwide (Rögl and Bolli, 1973; Boltovskoy, 1991). In general, maximum shell sizes are observed for most species during spring (Figure 8), when surface Chl-a concentrations are maximal (Figure 2). This shift in sizes could be associated with two processes: (a) increased food availability, which leads to higher PF growth rate and larger final shell-sizes (Bé et al., 1981; Takagi et al., 2018; Burke et al., 2020), (b) enhanced algal-symbiont activity that is related to increased shell-sizes of symbiont-bearing PF species (Bé et al., 1982).
During the 2015 spring, Chl-a surface concentrations were lower and the MLD was shallower relative to the 2016 spring (Figure 2). Yet, shell-sizes were relatively larger than during the 2016 spring (Figure 8). This is probably related to the duration of the vertical mixing. During 2015 the MLD was greater than 300 m for more than four months (January-April 2015; Figure 2), but only two months during the corresponding period in 2016 (January-February 2016, Figure 2). An extended duration of vertical nutrient redistribution enables prolonged primary production and food availability, hence, PF growth to larger shell-sizes. An additional explanation is that the relatively deeper vertical mixing during 2016 (MLD >500 m, Figure 2) was likely associated with stronger mechanical mixing processes, which could have limited shell growth, as indicated by the relatively small shell sizes documented in physically perturbed water masses such as frontal and upwelling areas (Ortiz et al., 1995; Schmidt et al., 2004).
5.3 Inferred PF life cycles at the GOA
Integrating the different PF species fluxes and shell-size distributions over a full annual cycle allows us to suggest three characteristic rhythmic patterns (Table 1):
1. Quiescent: minimal shell-size and extended life cycles due to unfavorable conditions and food scarcity during the summer, when the water column is stratified and oligotrophic.
2. Transient: during late-fall and winter, upon improvement of conditions, the gradual increase of Chl-a concentrations and food availability trigger PF turnover cycles and shorter life cycles during which PF individuals reproduce more frequently but do not necessarily reach maximal shell-sizes. This stage is characterized by intermediate shell-fluxes and frequent peaks.
3. Successive: during the spring blooms (late-winter and spring), when PF fluxes and Chl-a surface concentrations display peak values, the generation time is extended and individuals might exhibit growth to maximal size, except for G. ruber whose annual maxima flux is observed during the early-mid fall. This pattern is observed during both springs of 2015 and 2016, and interpreted to reflect PF utilization of beneficial conditions resulting in growth to maximum sizes, which results in longer life cycles as well as intervals of minimal downward fluxes of PF shells (Chernihovsky et al., 2020).
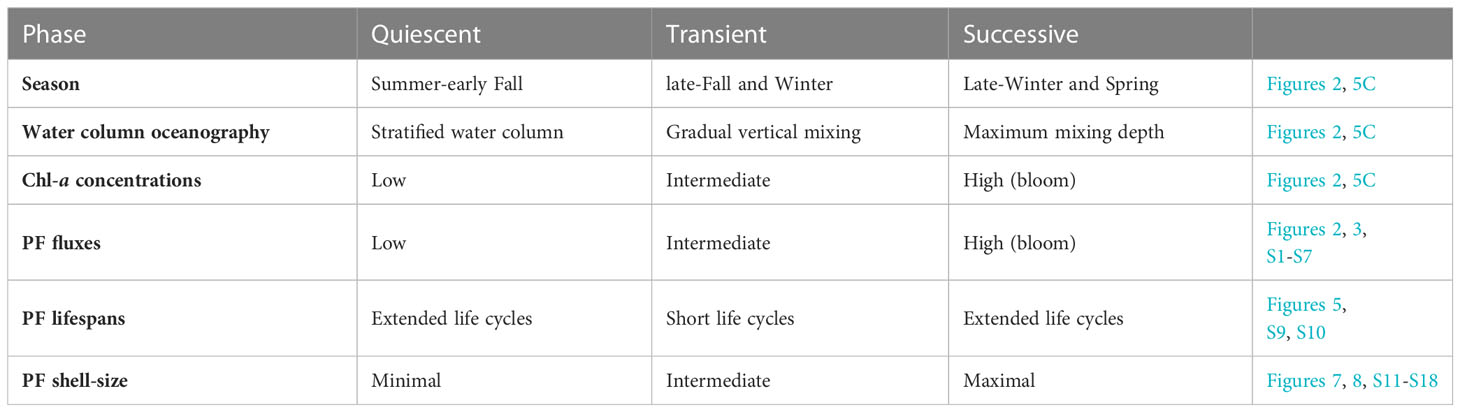
Table 1 Summary of PF life cycles phases: quiescent, transient and successive for the species T. clarkei, G. ruber, G. rubescens + G. tenellus, G. glutinata, D. anfracta and G. calida.
Considering the flexibility of the PF lifespan duration, it is difficult to determine the range of lifespan for each species, for example, the lifespan of T. clarkei can be assessed to range between 10 to 16 days (i.e., the interval between two sequential maxima flux peaks, Figure 5A), nevertheless, its lifespan could be also longer and range between 20 to 32/48/64 days (i.e., the interval between three or more maxima flux peaks, Figure 5A).
Our results can be explained by one of two hypotheses. The first - “Fixed life spans” - is based on fixed PF lifespans (each individual lives X days and reproduces, its survived offsprings will also live X days and so on throughout the full annual cycle), while the shell flux variability is determined by the differential mortality of the juveniles. In such a case, adults shell flux will exhibit a clear periodicity, and during periods of low primary productivity, juvenile mortality will be greatly exceeded (Bé et al., 1985; Schiebel et al., 1997; Peeters et al., 1999). The second hypothesis - “Adaptable lifespans” - is based on flexible PF lifespans, whereby if conditions are beneficial, individuals can live for X days and reproduce, otherwise, a given individual can live in a “Quiescent” stage for another Y days, prolonging its lifespan until improved conditions will trigger its reproduction, as suggested for T. quinqueloba in the NW Atlantic Ocean (Jonkers et al., 2010). According to this hypothesis the parent cell maximizes the survivability of its forthcoming juveniles and hence, the shell flux variability is determined by reproduction rates of adults (with no distinct periodicity), low shell fluxes of juveniles and no consistent temporal trends in the shell fluxes. The results of the current study correspond with the “Adaptable lifespans” hypothesis.
5.4 Assemblage shell-size global comparison
The average shell-size of G. ruber, G. glutinata, G. rubescens + G. tenellus and G. calida are significantly smaller than those from subtropical and tropical surface sediments and in the West Africa upwelling area (Rillo et al., 2020; Kiss et al., 2021, Figure 9; Table S4). The shell-size of G. siphonifera is generally smaller than those from subtropical and tropical surface sediments and significantly smaller than in sediments from the upwelling area (Figure 9; Table S4). Similarly, the GOA average PF shell-sizes are smaller than plankton tow specimens from the Caribbean and North Atlantic (Takahashi and Bé, 1984; Table S2) and smaller than PF sampled from sediment traps at the Sargasso Sea (Deuser et al., 1981). Nevertheless, the GOA PF shell-sizes are similar to specimens from surface sediments in the oligotrophic eastern Mediterranean (Zarkogiannis et al., 2020) (Table S2).
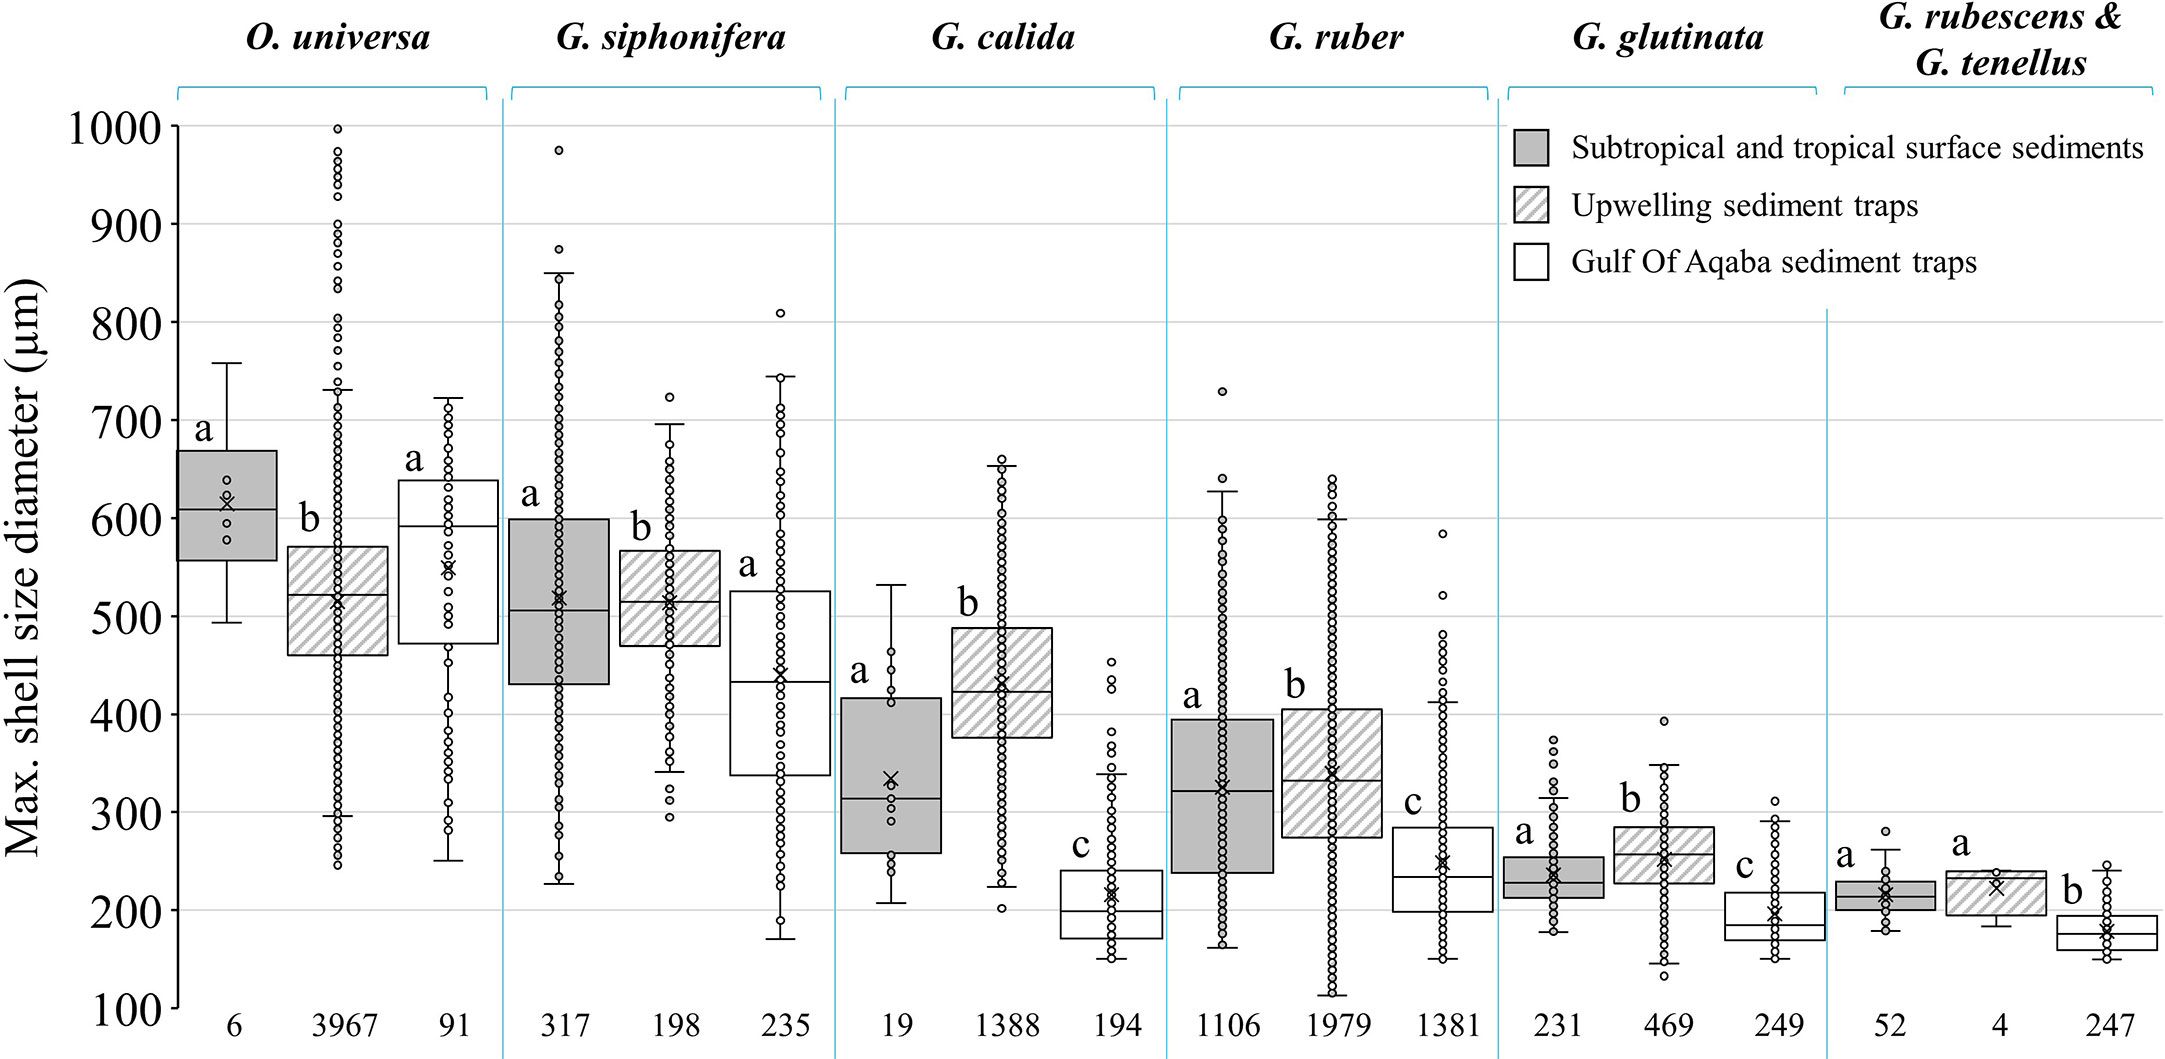
Figure 9 Comparison between PF species shell sizes in surface sediments from subtropic and tropic regions (Rillo et al., 2020, gray fill), sediment traps from upwelling area (Cape Blanc, Kiss et al., 2021, diagonal lines) and sediment traps from the oligotrophic GOA (current study, blank). For consistency all the data has been filtered to show only shells larger than 150 µm. Sample size (n) appears below the boxplots. Different letters refer to statistically significant (p value < 0.05) different shell-size groups: group a- largest size, group b- middle size and group c- smallest size. For more details see Table S4.
The oligotrophic GOA is generally considered as a nutrient controlled (“bottom-up”) system, in which nutrient limitation might lead to the dominance of small-sized phytoplankton cells (Levanon-Spanier et al., 1979; Sommer, 2000). As nutrient availability increases (seasonally), phytoplankton size diversifies, followed by a similar pattern of zooplankton size variations (Grigoratou et al., 2019 and references therein). Thus, smaller PF shell-sizes in the oligotrophic GOA might be the result of energetic budget redirection to reproduction rather than to calcification and shell growth (current study; Grigoratou et al., 2019).
Previous studies argued that mean shell-size in PF assemblages is mainly influenced by SSTs (Schmidt et al., 2004; Schmidt et al., 2006). However, the average PF shell-size of the GOA assemblage is smaller (256 ± 112 µm) than predicted assemblages from subtropical and tropical zones (range between 294 and 334 µm, respectively; Schmidt et al., 2004; Schmidt et al., 2006). This, together with large intraspecific shell-size variability in the GOA (Figure 6), suggests that factors other than temperatures, such as primary productivity probably exert more influence on shell-size in smaller spatial scales (Caron et al., 1982; Schmidt et al., 2004; Weinkauf et al., 2016; Rillo et al., 2020; Zarkogiannis et al., 2020). Burke et al. (2020) studied PF ontogenetic growth trajectories using high-resolution three-dimensional imaging techniques and discovered that the level of intraspecific variation of growth through ontogeny was sometimes as great, or greater than that interspecies variability.
Our results of wide intraspecific size distributions agree with those of Rillo et al. (2020) and Zarkogiannis et al. (2020), indicating that the relationship between PF shell-sizes and fluxes to SST, is weaker than previously suggested (Schmidt et al., 2004; Schmidt et al., 2006).
6 Conclusions
High temporal resolution time-series of ten planktonic foraminifera species sedimentation fluxes and shell-size distributions (>63 µm) were studied in the northern GOA, using an automated sediment trap deployed continuously over more than a full annual cycle between 2015 and 2016. The main findings of this work are:
1. The different size fractions of individual PF species display, to a first order, coeval daily flux patterns. This observation indicates that adults of varying shell-sizes respond simultaneously to a common cue such as food supply, and reproduce even before reaching a maximal shell size.
2. We did not identify distinct sub-seasonal (e.g., semi-lunar or lunar) periodicities for any of the species. Examination of local maxima (peak) fluxes variability across the annual cycle, with more frequent peaks appearing when food availability gradually increases with the seasonal temperature decrease between mid-fall and mid-winter, enhancing PF life-cycles turnover.
3. We defined three characteristic life cycle patterns: quiescent (minimal shell-size and extended life cycles), transient (intermediate shell-sizes and short life cycles) and successive (potential maximal shell-size and extended life cycles). Accordingly, the PF in the GOA correspond with the “Adaptable lifespans” hypothesis, where PF life spans change with time, modulated by the changing environmental conditions.
4. The GOA PF assemblage is composed primarily of small shell-size species, dominated by T. clarkei, the smallest PF species to be documented up to date. Most of the adult PF shell flux (69%) in the GOA is contributed by the <125 µm size-fraction, that has been scarcely studied so far and was assumed to be composed of young PF. This finding emphasizes the importance of collecting smaller sized PF, at least in regions that are prone to small shell-sizes (e.g., oligotrophic) or in studies of species that exhibit a wide shell-size distribution.
5. Compared with other subtropical, tropical and upwelling oceanic regions, PF shell sizes are generally smaller and species diversity is lower in the GOA, emphasizing the impact of extreme oligotrophic conditions on PF ecology, and possibly serving as an analogue for future oceanic conditions.
Data availability statement
The original contributions presented in the study are included in the article/Supplementary Material. Further inquiries can be directed to the corresponding author.
Author contributions
NC and AT participated together in marine work and sampling. NC performed the sample processing and foraminifera picking. NC and AAL conducted the species identification. NC and AT conducted the statistical analysis. All authors contributed to the interpretation of the data and writing the final manuscript.
Funding
This study was funded by the Israel Science Foundation grant #834/19 (to AT).
Acknowledgments
We thank B. Yarden for assistance in sample handling and acknowledge the efforts and dedication of the IUI marine crew: A. Rivlin, S. Isaacs, S. Baruch, I. Daskal, O. Ben-Shaprut, E. Sestieri, and M. Ohavia. Y. Shaked and the National Monitoring Program are thanked for their support and sharing results. A. Mor and J. Tynyakov-Shashar are acknowledged for their assistance in statistical analyses. We thank reviewers: A. Sánchez-González, J. Meilland and S. D. Zarkogiannis for their constructive comments that helped to significantly improve this paper.
Conflict of interest
The authors declare that the research was conducted in the absence of any commercial or financial relationships that could be construed as a potential conflict of interest.
Publisher’s note
All claims expressed in this article are solely those of the authors and do not necessarily represent those of their affiliated organizations, or those of the publisher, the editors and the reviewers. Any product that may be evaluated in this article, or claim that may be made by its manufacturer, is not guaranteed or endorsed by the publisher.
Supplementary material
The Supplementary Material for this article can be found online at: https://www.frontiersin.org/articles/10.3389/fmars.2023.1126398/full#supplementary-material
References
Almogi-Labin A. (1984). Population dynamics of planktic foraminifera and pteropoda - gulf of Eilat/Aqaba, red Sea. Proc. R. Neth. Acad. Sci. B 87), 481–511.
Bé A. W. H. (1977). An ecological, zoogeographic and taxonomic review of recent planktonic foraminifera. Oceanic Micropaleontology 1, 1–100.
Bé A. W. H., Anderson O. R. (1976). Gametogenesis in planktonic foraminifera. Science 192 (4242), 890–892. doi: 10.1126/science.946914
Bé A. W. H., Bishop J. K., Sverdlove M. S., Gardner W. D. (1985). Standing stock, vertical distribution and flux of planktonic foraminifera in the Panama basin. Mar. Micropaleontology 9 (4), 307–333. doi: 10.1016/0377-8398(85)90002-7
Bé A. W. H., Caron D. A., Anderson O. R. (1981). Effects of feeding frequency on life processes of the planktonic foraminifer Globigerinoides sacculifer in laboratory culture. J. Mar. Biol. Assoc. U.K. 61 (1), 257–277. doi: 10.1017/S002531540004604X
Bé A. W. H., Spero H. J., Anderson O. R. (1982). Effects of symbiont elimination and reinfection on the life processes of the planktonic foraminifer Globigerinoides sacculifer. Mar. Biol. 70, 73–86. doi: 10.1007/BF00397298
Bijma J., Erez J., Hemleben C. (1990). Lunar and semi-lunar reproductive cycles in some spinose planktonic foraminifers. J. Foraminiferal Res. 20 (2), 117–127. doi: 10.2113/gsjfr.20.2.117
Biton E., Gildor H. (2011). The general circulation of the gulf of aqaba (Gulf of eilat) revisited: the interplay between the exchange flow through the straits of tiran and surface fluxes. J. Geophys. Res. 116, C08020. doi: 10.1029/2010JC006860
Boltovskoy E. (1991). Globigerinita clarkei (Rögl & Bolli) — an unfairly ignored small planktic foraminifer. Boreas 20(2), 151–154. doi: 10.1111/j.1502-3885.1991.tb00303.x
Brummer G. J. A., Hemleben C., Spindler M. (1987). Ontogeny of extant spinose planktonic foraminifera (Globigerinidae): a concept exemplified by Globigerinoides sacculifer (Brady) and G. ruber (d'Orbigny). Mar. Micropaleontology 12, 357–381. doi: 10.1016/0377-8398(87)90028-4
Brummer G. J. A., Kroon D., (eds). (1988). Planktonic foraminifers as tracers of ocean-climate history: ontogeny, relationships and preservation of modern species and stable isotopes, phenotypes and assemblage distribution in different water masses. (Amsterdam: Free University Press, VU Uitgeverij), 293–298.
Burke J. E., Renema W., Schiebel R., Hull P. M. (2020). Three-dimensional analysis of inter-and intraspecific variation in ontogenetic growth trajectories of planktonic foraminifera. Mar. Micropaleontology 155, 101794. doi: 10.1016/j.marmicro.2019.101794
Caron D. A., Bé A. W. H., Anderson O. R. (1982). Effects of variations in light intensity on life processes of the planktonic foraminifer Globigerinoides sacculifer in laboratory culture. J. Mar. Biol. Assoc. U.K. 62, 435–452. doi: 10.1017/S0025315400057374
Chernihovsky N., Almogi-Labin A., Kienast S. S., Torfstein A. (2020). The daily resolved temperature dependence and structure of planktonic foraminifera blooms. Sci. Rep. 10, 17456. doi: 10.1038/s41598-020-74342-z
Chernihovsky N., Torfstein A., Almogi-Labin A. (2018). Seasonal flux patterns of planktonic foraminifera in a deep, oligotrophic, marginal sea: sediment trap time series from the gulf of aqaba, northern red Sea. Deep-Sea Res. Part I: Oceanographic Res. Papers 140, 78–94. doi: 10.1016/j.dsr.2018.08.003
Davis C. V., Livsey C. M., Palmer H. M., Hull P. M., Thomas E., Hill T. M., et al. (2020). Extensive morphological variability in asexually produced planktic foraminifera. Sci. Adv. 6 (28), eabb8930. doi: 10.1126/sciadv.abb8930
de Mendiburu F. (2020) Agricolae: statistical procedures for agricultural research. r package version 1.3-2. Available at: https://CRAN.R-project.org/package=agricolae.
de Moel H., Ganssen G. M., Peeters F. J. C., Jung S. J. A., Kroon D., Brummer G. J. A., et al. (2009). Planktic foraminiferal shell thinning in the Arabian Sea due to anthropogenic ocean acidification? Biogeosciences 6 (9), 1917–1925. doi: 10.5194/bg-6-1917-2009
Deuser W. G., Ross E. H., Hemleben C., Spindler M. (1981). Seasonal changes in species composition, numbers, mass, size, and isotopic composition of planktonic foraminifera settling into the deep Sargasso Sea. Palaeogeography Palaeoclimatology Palaeoecol. 33 (1), 103–127. doi: 10.1016/0031-0182(81)90034-1
Erez J., Almogi-Labin A., Avraham S. (1991). Comparison on the life history of planktonic foraminifera: lunar reproduction cycle in Globigerinoides sacculifer (Brady). Paleoceanography 6 (3), 295–306. doi: 10.1029/90PA02731
Fox L., Stukins S., Hill T., Miller C. G. (2020). Quantifying the effect of anthropogenic climate change on calcifying plankton. Sci. Rep. 10, 1620. doi: 10.1038/s41598-020-58501-w
Fox J., Weisberg S. (2019). An {R} companion to applied regression. 3rd ed. (Thousand Oaks CA: Sage). Available at: https://socialsciences.mcmaster.ca/jfox/Books/Companion/.
Grigoratou M., Monteiro F. M., Schmidt D. N., Wilson J. D., Ward B. A., Ridgwell A. (2019). A trait-based modelling approach to planktonic ecology. Biogeosciences 16 (7), 1469–1492. doi: 10.5194/bg-16-1469-2019
Hastings D. W., Emerson S. R., Erez J., Nelson B. K. (1996). Vanadium in foraminiferal calcite: evaluation of a method to determine paleo-seawater vanadium concentrations. Geochimica cosmochimica Acta 60 (19), 3701–3715. doi: 10.1016/0016-7037(96)00196-2
Hemleben C., Spindler M., Anderson O. R. (1989). Modern planktonic foraminifera (Berlin Heidelberg New York: Springer-Verlag), 1–363.
Hottinger L., Halicz E., Reiss Z. (1993). Recent foraminiferida from the gulf of aqaba, red Sea (Ljubljana, Slovenia: Opera Sazu).
Jonkers L., Brummer G. J. A., Peeters F. J., van Aken H. M., De Jong M. F. (2010). Seasonal stratification, shell flux, and oxygen isotope dynamics of left-coiling N. pachyderma and T. quinqueloba in the western subpolar north Atlantic. Paleoceanography 25, PA2204. doi: 10.1029/2009PA001849
Jonkers L., Reynolds C. E., Richey J., Hall I. R. (2015). Lunar periodicity in the shell flux of planktonic foraminifera in the gulf of Mexico. Biogeosciences 12 (10), 3061–3070. doi: 10.5194/bg-12-3061-2015
Kimor B., Golandsky B. (1977). Microplankton of the gulf of elat: aspects of seasonal and bathymetric distribution. Mar. Biol. 42 (1), 55–67. doi: 10.1007/BF00392014
Kimoto K., Tsuchiya M. (2006). The “unusual” reproduction of planktic foraminifera: an asexual reproductive phase of Neogloboquadrina pachyderma (Ehrenberg). Anuário do Instituto Geosciências UFRJ 29, 461.
Kiss P., Jonkers L., Hudáčková N., Reuter R. T., Donner B., Fischer G., et al. (2021). Determinants of planktonic foraminifera calcite flux: implications for the prediction of intra-and inter-annual pelagic carbonate budgets. Global Biogeochemical Cycles 35 (9). doi: 10.1029/2020GB006748
Kucera M. (2007). Planktonic foraminifera as tracers of past oceanic environments. Developments Mar. Geology 1), 213–262. doi: 10.1016/S1572-5480(07)01011-1
Labiosa R. G., Arrigo K. R., Genin A., Monismith S. G., van Dijken G. (2003). The interplay between upwelling and deep convective mixing in determining the seasonal phytoplankton dynamics in the gulf of aqaba: evidence from SeaWiFS and MODIS. Limnol. Oceanogr. 48 (6), 2355–2368. doi: 10.4319/lo.2003.48.6.2355
Lazar B., Silverman J., Rivlin T., Rivlin A., Dray M., Iluz D. (2008). Recent environmental changes in the chemical-biological oceanography of the gulf of aqaba (Eilat). Aqaba-eilat, the improbable gulf. environment, biodiversity and preservation (Jerusalem: Magnes Press), 49–61.
Lenth R. (2016). Least-squares means: the r package lsmeans. J. Stat. Software 69 (1), 1–33. doi: 10.18637/jss.v069.i01
Levanon-Spanier I., Padan E., Reiss Z. (1979). Primary production in a desert-enclosed sea- the gulf of elat (Aqaba), red Sea. Deep Sea Res. Part A. Oceanographic Res. Papers 26 (6), 673–685. doi: 10.1016/0198-0149(79)90040-2
Lin H. L. (2014). The seasonal succession of modern planktonic foraminifera: sediment traps observations from southwest Taiwan waters. Continental Shelf Res. 84, 13–22. doi: 10.1016/j.csr.2014.04.020
Lin H. L., Lui H. K., Lin T. C., Wang Y. L. (2022). Response of planktonic foraminifera to seasonal and interannual hydrographic changes: sediment trap record from the northern south China Sea. Front. Earth Sci. 10. doi: 10.3389/feart.2022.928115
Lindell D., Post A. F. (1995). Ultraphytoplankton succession is triggered by deep winter mixing in the gulf of aqaba (Eilat), red Sea. Limnol. Oceanogr. 40 (6), 1130–1141. doi: 10.4319/lo.1995.40.6.1130
Lončarić N., Brummer G. J. A., Kroon D. (2005). Lunar cycles and seasonal variations in deposition fluxes of planktic foraminiferal shell carbonate to the deep south Atlantic (central Walvis ridge). Deep-Sea Res. Pt. I 52, 1178–1188. doi: 10.1016/j.dsr.2005.02.003
Meeder E., Mackey K. R., Paytan A., Shaked Y., Iluz D., Stambler N., et al. (2012). Nitrite dynamics in the open ocean - clues from seasonal and diurnal variations. Mar. Ecol. Prog. Ser. 453, 11–26. doi: 10.3354/meps09525
Meilland J., Ezat M. M., WestgÅrd A., Manno C., Morard R., Siccha M., et al. (2023). Rare but persistent asexual reproduction explains the success of planktonic foraminifera in polar oceans. J. Plankton Res. 45 (1), 15–32. doi: 10.1093/plankt/fbac069
Meilland J., Siccha M., Kaffenberger M., Bijma J., Kucera M. (2021). Population dynamics and reproduction strategies of planktonic foraminifera in the open ocean. Biogeosciences 18 (20), 5789–5809. doi: 10.5194/bg-18-5789-2021
Morard R., Füllberg A., Brummer G. J. A., Greco M., Jonkers L., Wizemann A., et al. (2019). Genetic and morphological divergence in the warm-water planktonic foraminifera genus globigerinoides. PloS One 14 (12), e0225246. doi: 10.1371/journal.pone.0225246
Moy A. D., Howard W. R., Bray S. G., Trull T. W. (2009). Reduced calcification in modern southern ocean planktonic foraminifera. Nat. Geosci. 2 (4), 276–280. doi: 10.1038/ngeo460
Ogle D. H., Wheeler P., Dinno A. (2020) FSA: Fisheries stock analysis. r package version 0.8.30. Available at: https://github.com/droglenc/FSA.
Ortiz J. D., Mix A. C., Collier R. W. (1995). Environmental control of living symbiotic and asymbiotic foraminifera of the California current. Paleoceanography 10 (6), 987–1009. doi: 10.1029/95PA02088
Pados T., Spielhagen R. F. (2014). Species distribution and depth habitat of recent planktic foraminifera in fram strait, Arctic ocean. Polar Res. 33 (1), 22483. doi: 10.3402/polar.v33.22483
Peeters F., Ivanova E., Conan S., Brummer G. J., Ganssen G., Troelstra S., et al. (1999). A size analysis of planktic foraminifera from the Arabian Sea. Mar. Micropaleontology 36 (1), 31–63. doi: 10.1016/S0377-8398(98)00026-7
R Core Team. (2020). R: a language and environment for statistical computing (Vienna, Austria: R Foundation for Statistical Computing). Available at: https://www.R-project.org/.
Reiss Z., Halicz E. (1976). Phenotopy in planktonic foraminiferida from the gulf of elat. Israel J. Earth Sci. 25, 27–39.
Reiss Z., Halicz E., Perelis L. (1974). Planktonic foraminiferida from recent sediments in the gulf of elat. Israel J. Earth-Sci 23, 69–105.
Rillo M. C., Miller C. G., Kucera M., Ezard T. H. (2020). Intraspecific size variation in planktonic foraminifera cannot be consistently predicted by the environment. Ecol. Evol. 00, 1–12. doi: 10.1002/ece3.6792
Rögl F., Bolli H. M. (1973). Holocene To pleistocene planktonic foraminifera of leg 15. in site 147 (Cariaco basin (Trench), Caribbean Sea) and their climatic interpretation. Initial Rep. DSDP 15, 553–615. doi: 10.2973/dsdp.proc.15.113.1973
Salmon K. H., Anand P., Sexton P. F., Conte M. (2014). Upper ocean mixing controls the seasonality of planktonic foraminifer fluxes and associated strength of the carbonate pump in the oligotrophic north Atlantic. Biogeosciences Discussions 11 (8), 12223–12254. doi: 10.5194/bg-12-223-2015
Schiebel R. (2002). Planktic foraminiferal sedimentation and the marine calcite budget. Global Biogeochemical Cycles 16 (4), 3–1. doi: 10.1029/2001gb001459
Schiebel R., Bijma J., Hemleben C. (1997). Population dynamics of the planktic foraminifer Globigerina bulloides from the eastern north Atlantic. Deep Sea Res. Part I: Oceanographic Res. Papers 44 (9-10), 1701–1713. doi: 10.1016/S0967-0637(97)00036-8
Schiebel R., Hemleben C. (2005). Modern planktic foraminifera. Paläontologische Zeitschrift 79 (1), 135–148. doi: 10.1007/BF03021758
Schiebel R., Hemleben C. (2017). Planktic foraminifers in the modern ocean (Berlin Heidelberg: Springer-Verlag), 1–358.
Schiebel R., Waniek J., Bork M., Hemleben C. (2001). Planktic foraminiferal production stimulated by chlorophyll redistribution and entrainment of nutrients. Deep Sea Res. Part I: Oceanographic Res. Papers 48 (3), 721–740. doi: 10.1016/S0967-0637(00)00065-0
Schmidt D. N., Lazarus D., Young J. R., Kucera M. (2006). Biogeography and evolution of body size in marine plankton. Earth-Science Rev. 78 (3-4), 239–266. doi: 10.1016/j.earscirev.2006.05.004
Schmidt D. N., Renaud S., Bollmann J., Schiebel R., Thierstein H. R. (2004). Size distribution of Holocene planktic foraminifer assemblages: biogeography, ecology and adaptation. Mar. Micropaleontology 50 (3), 319–338. doi: 10.1016/S0377-8398(03)00098-7
Shaked Y., Genin A. (2017). The Israel national monitoring program in the northern gulf of Eilat/Aqaba. Sci. Rep. 181.
Shlesinger T., Loya Y. (2019). Breakdown in spawning synchrony: a silent threat to coral persistence. Science 365 (6457), 1002–1007. doi: 10.1126/science.aax0110
Sommer U. (2000). Scarcity of medium-sized phytoplankton in the northern red Sea explained by strong bottom-up and weak top-down control. Mar. Ecol. Prog. Ser. 197, 19–25. doi: 10.3354/MEPS197019
Spindler M., Hemleben C., Bayer U., Bé A. W. H., Anderson O. R. (1979). Lunar periodicity of reproduction in the planktonic foraminifer Hastigerina pelagica. Mar. Ecol. Prog. Ser. 30, 61–64.
Sprintall J., Tomczak M. (1992). Evidence of the barrier layer in the surface layer of the tropics. J. Geophysical Research: Oceans 97 (C5), 7305–7316. doi: 10.1029/92JC00407
Steiner Z., Lazar B., Torfstein A., Erez J. (2017). Testing the utility of geochemical proxies for paleoproductivity in oxic sedimentary marine settings of the gulf of aqaba, red Sea. Chem. Geology 473), 40–79. doi: 10.1016/j.chemgeo.2017.10.012
Takagi H., Kimoto K., Fujiki T., Moriya K. (2018). Effect of nutritional condition on photosymbiotic consortium of cultured Globigerinoides sacculifer (Rhizaria, foraminifera). Symbiosis 76 (1), 25–39. doi: 10.1007/s13199-017-0530-3
Takagi H., Kurasawa A., Kimoto K. (2020). Observation of asexual reproduction with symbiont transmission in planktonic foraminifera. J. Plankton Res. 42 (4), 403–410. doi: 10.1093/plankt/fbaa033
Takahashi K., Bé A. W. H. (1984). Planktonic foraminifera: factors controlling sinking speeds. Deep Sea Res. Part A. Oceanographic Res. Papers 31 (12), 1477–1500. doi: 10.1016/0198-0149(84)90083-9
Tamir R., Lerner A., Haspel C., Dubinsky Z., Iluz D. (2017). The spectral and spatial distribution of light pollution in the waters of the northern gulf of aqaba (Eilat). Sci. Rep. 7, 42329. doi: 10.1038/srep42329
Tessmar-Raible K., Raible F., Arboleda E. (2011). Another place, another timer: marine species and the rhythms of life. Bioessays 33 (3), 165–172. doi: 10.1002/bies.201000096
Torfstein A., Kienast S. S., Yarden B., Rivlin A., Isaacs S., Shaked Y. (2020). Bulk and export production fluxes in the gulf of aqaba, northern red Sea. ACS Earth Space Chem. 4(8), 1461–1479. doi: 10.1021/acsearthspacechem.0c00079
Trauth M. H. (2007). MATLAB recipes for earth sciences: Second edition. MATLAB® Recipes for Earth Sciences (Second Edition) (Berlin: Springer) Vol. 34. doi: 10.1007/978-3-540-72749-1
Wefer G., Berger W. H., Bijma J., Fischer G. (1999). “Clues to ocean history: a brief overview of proxies,” in Use of proxies in paleoceanography: examples from the south Atlantic. Eds. Fischer G., Wefer G. (Springer Berlin Heidelberg), 1–68. doi: 10.1007/978-3-642-58646-0_1
Weinkauf M. F., Kunze J. G., Waniek J. J., Kucera M. (2016). Seasonal variation in shell calcification of planktonic foraminifera in the NE Atlantic reveals species-specific response to temperature, productivity, and optimum growth conditions. PloS One 11 (2), e0148363. doi: 10.1371/journal.pone.0148363
Winter A., Reiss Z., Luz B. (1979). Distribution of living coccolithophorid assemblages in the gulf of elat (‘Aqaba). Mar. Micropaleontology 4, 197–223. doi: 10.1016/0377-8398(79)90017-3
Žaric S., Donner B., Fischer G., Mulitza S., Wefer G. (2005). Sensitivity of planktic foraminifera to sea surface temperature and export production as derived from sediment trap data. Mar. Micropaleontology 55 (1), 75–105. doi: 10.1016/j.marmicro.2005.01.002
Keywords: planktonic foraminifera, shell-size distribution, life cycles, biological rhythms, sediment traps, oligotrophic sea, Gulf of Aqaba, Red Sea
Citation: Chernihovsky N, Torfstein A and Almogi-Labin A (2023) Daily timescale dynamics of planktonic foraminifera shell-size distributions. Front. Mar. Sci. 10:1126398. doi: 10.3389/fmars.2023.1126398
Received: 17 December 2022; Accepted: 24 April 2023;
Published: 18 May 2023.
Edited by:
Xiaolong Gao, Xiamen University, ChinaReviewed by:
Alberto Sánchez-González, National Polytechnic Institute (IPN), MexicoJulie Meilland, University of Bremen, Germany
Stergios D. Zarkogiannis, University of Oxford, United Kingdom
Copyright © 2023 Chernihovsky, Torfstein and Almogi-Labin. This is an open-access article distributed under the terms of the Creative Commons Attribution License (CC BY). The use, distribution or reproduction in other forums is permitted, provided the original author(s) and the copyright owner(s) are credited and that the original publication in this journal is cited, in accordance with accepted academic practice. No use, distribution or reproduction is permitted which does not comply with these terms.
*Correspondence: Natalie Chernihovsky, bmF0YWxpZS5jaGVybmlob3Zza0BtYWlsLmh1amkuYWMuaWw=