 Heejun Han
 Hyung Bo Kim
 Jeonghyun Kim
 Guebuem Kim
 Jeomshik Hwang
 SungHyun Nam
- 1School of Earth and Environmental Sciences/Research Institute of Oceanography, Seoul National University, Seoul, Republic of Korea
- 2Department of Earth and Marine Sciences, College of Ocean Science, Jeju National University, Jeju, Republic of Korea
Dissolved organic carbon (DOC) and the optical properties of dissolved organic matter (chromophoric- and fluorescent dissolved organic matter; CDOM and FDOM) were measured to determine the distributions and drivers of DOM in the northwestern Pacific marginal seas, including the East China Sea, the Yellow Sea, and the East/Japan Sea, in August 2020. In this study, the concentrations of DOC and CDOM/FDOM in surface water showed good correlations with salinity, indicating a predominant contribution from the Changjiang River. However, significantly high concentrations of DOC and FDOM were also observed in the central Yellow Sea region, which seems to be produced mainly from the continental shelf-water and enriched over the water residence time of the Yellow Sea, while the lowest concentrations of DOC and CDOM/FDOM were found in high-salinity waters near the southern sea of Korea. In addition, the East/Japan Sea showed relatively low DOC concentrations and high FDOM values. To distinguish the physical mixing and biogeochemical processes of DOM, we estimated the water mass fractions using an optimum multi-parameter analysis with hydrological and DOM parameters of the major water masses in this region. Our results showed that five primary external drivers of DOM distribution were intrusions of (1) the Changjiang diluted water and (2) the Kuroshio Current water in the surface water, the mixing of (3) the Yellow Sea bottom cold water and (4) the Kuroshio sub-surface water in the bottom layer, and (5) upwelling of the East/Japan Sea water. We conclude that the distribution of DOM is significantly influenced by the mixing of multiple water masses, and the optical signature of DOM can be an effective proxy for tracing the origins and characteristics of DOM in this region.
1 Introduction
Dissolved organic matter (DOM), mostly composed of dissolved organic carbon (DOC), is one of the largest reservoirs of reduced carbon on Earth and is the most dynamic organic carbon pool linked with other materials in marine ecosystems (Carlson and Hansell, 2015). The optically sensitive fractions of DOM, which are characterized by light absorption and fluorescence, are termed chromophoric-DOM (CDOM) and fluorescent-DOM (FDOM), respectively (Stedmon and Nelson, 2015). CDOM is the light-absorbing fraction of DOM, and a fraction of CDOM that fluoresces after absorbing light at a certain wavelength is called FDOM. In general, CDOM accounts for approximately 20–70% of the marine DOC in coastal regions, while it contributes only a minor portion in the open ocean (Coble, 2007). The spectral properties of CDOM and FDOM have been used to decipher the behavior of marine DOM, including its origin, molecular weight, and aromaticity (Coble, 2007; Hansen et al., 2016).
The northwestern Pacific marginal seas, including the East China Sea (ECS), the Yellow Sea (YS), and the East/Japan Sea (EJS), contain one of the largest continental shelves in the world, around the Korean Peninsula, the Japanese archipelago, and the Chinese continent. The productive semi-enclosed shallow water in the northern part is called the YS, while in the southern part, a branch of the Kuroshio Current transports relatively saline, warm, and oligotrophic water into this region (Kim et al., 2004). The EJS resembles the global ocean in terms of its own deep-water circulation (Kim and Kim, 1996). The Changjiang River (also known as the Yangtze River) discharges large amounts of freshwater and terrestrial materials (~80%), contributing significantly to the biogeochemical cycles in this region (Ichikawa and Beardsley, 2002; Wang et al., 2012). Due to the large tidal range, significant contributions of chemical substances were found to originate from organic-rich shelf sediments in the water column (Kim et al., 2015; Kim et al., 2018). In addition, diffusive fluxes from the submarine groundwater discharge (Kim et al., 2015; Kim et al., 2018) and atmospheric fluxes (Yu et al., 2018; Ren et al., 2022) to marginal seas play an important role in material budgets in this region. Therefore, the northwestern Pacific marginal seas have complex marine systems. However, a poor understanding of the inflow of multiple external water masses and internal biogeochemical processes still induces less understood behaviors of organic matter in this region.
Recently, the origins and characteristics of DOM have been extensively studied in the northwestern Pacific marginal seas (Ogawa et al., 2003; Bai et al., 2013; Kim et al., 2018; Zhang et al., 2019; Kim et al., 2020; Yamashita et al., 2020; Han et al., 2022). Based on the significant correlation between humic-like FDOM (FDOMH) and radium isotope and dual carbon isotopic compositions (δ13C and Δ14C) of shelf-water, this continental margin has been recognized as an important source of both FDOMH and DOC (Kim et al., 2018; Han et al., 2022). These studies further suggested that the shelf-water fluxes of FDOMH and DOC were almost equivalent to 30–40% and comparable to that from the riverine discharge, respectively (Kim et al., 2018; Han et al., 2022). Also, Kim et al. (2020) reported the existence of a ‘DOC pulse’ in the lower salinity range (24–35) due to the enhanced microbial metabolism in this region. Because of these unique DOM characteristics and behaviors, various approaches to DOM research have been applied in these productive marginal seas.
The purpose of this study was to characterize the distribution of various DOM parameters and to assess the potential of CDOM and FDOM as tracers of water-mass mixing in the northwestern Pacific marginal seas. Here, we hypothesized that DOM properties, including unique absorption and fluorescent properties, are conservative within the source water types (SWTs), which is the intrinsic water mass term of each different property, during the water residence time of the northwestern Pacific marginal seas. Thus, the optical properties of DOM can be used to trace water-mass mixing patterns along the entire marginal area to understand the biogeochemical drivers and physical mixing of complex DOM dynamics.
2 Materials and methods
2.1 Sampling and hydrographic properties
Sampling was conducted during the summer from August 11 to 21, 2020 aboard the R/V Onnuri of the Korea Institute of Ocean Science and Technology (KIOST). Seawater samples were collected by using the 10 L Niskin bottles at 21 sampling stations in the northwestern Pacific marginal seas (Figure 1). The hydrographic properties, including temperature and salinity were measured using a CTD device (SBE911-plus, Sea-Bird Electronics Inc., WA, USA) attached to a rosette sampler.
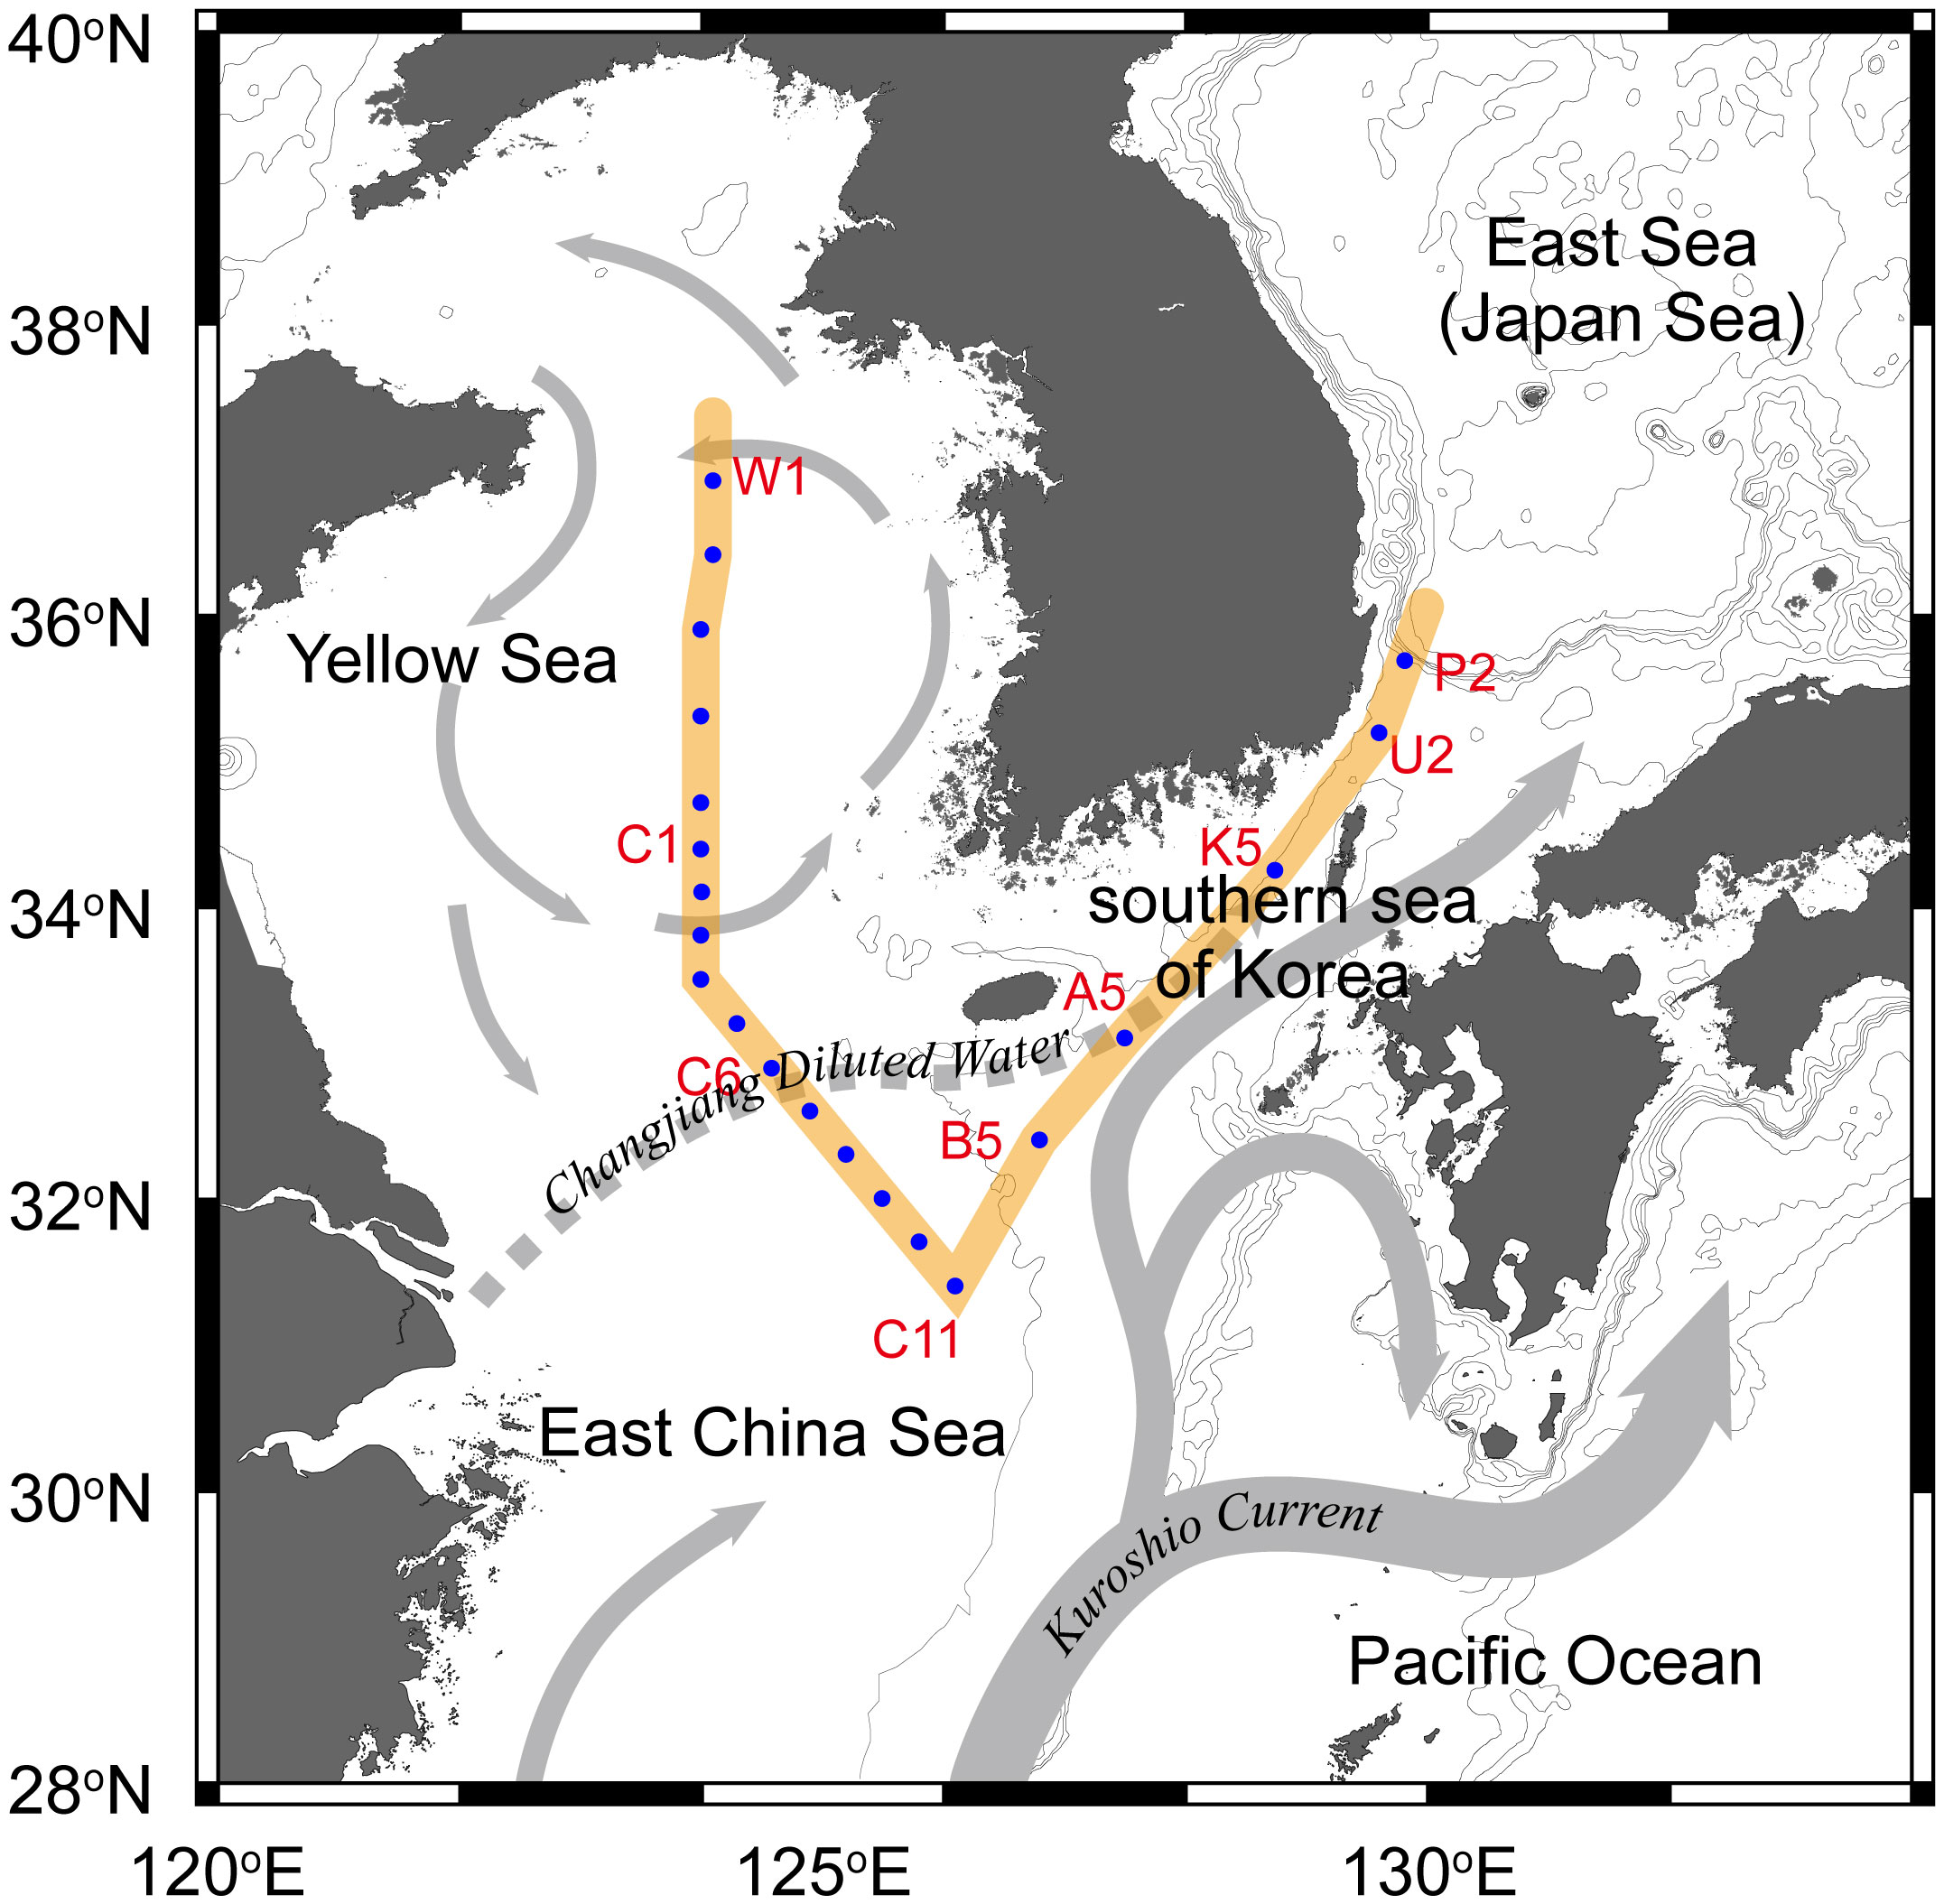
Figure 1 Map of the sampling stations, bottom topography, and simple schematic patterns of surface currents in the northwestern Pacific marginal seas. The bold color line in yellow indicates the transect used in this study. The arrows indicate the current systems in operation during the sampling periods.
2.2 Analysis of DOC
Seawater samples for DOC analysis were vacuum filtered through pre-combusted GF/F glass microfiber filters (500°C for 5 h; pore size: 0.7 μm; Whatman Inc., Maidstone, UK). The filtrate was acidified (pH ~2) using 6 M hydrochloric acid (Sigma-Aldrich, MO, USA) to prevent microbial degradation and stored in pre-combusted (500°C for 5 h) glass ampoules (Fisher Scientific, NH, USA) at room temperature in a dark cabinet. All samples were measured within two months. The DOC concentration was measured via a high-temperature catalytic oxidation method using a TOC analyzer (TOC-L, Shimadzu, Japan). Prior to the sample analysis, the system blank was reduced until the signal from the DOC-free distilled water showed consistent values with the limit of detection (< 2 μM for DOC) to achieve high accuracy. In addition, the accuracy of the DOC concentration was verified with every sample batch run using deep-sea reference material (DSR: 41–44 μM) obtained from the University of Miami (Hansell, 2005). The precision of these DSR measurements was in good agreement with the consensus values within 2%.
2.3 Analysis of CDOM and FDOM
Samples for CDOM and FDOM analysis were filtered with the DOC samples and stored in a dark amber vial (Wheaton, NJ, USA) at 4°C. All samples were measured within two weeks. Absorbance spectra and fluorescence excitation-emission matrices (EEMs) were measured by using a spectrofluorometer (Aqualog, HORIBA Jobin Yvon, MA, USA). The CDOM absorbance was blank-corrected, and then a baseline correction was applied at 600 nm, assuming that there is negligible CDOM absorption at that certain wavelength. The CDOM absorbance at 350 nm was converted into the Napierian absorption coefficient (a350, unit: m-1). The spectral slope coefficients between 275 and 295 nm (S275–295, unit: nm-1) and between 350 and 400 nm (S350–400, unit: nm-1) were calculated as the linear regression slope of the log-transformed absorption data of the samples (Helms et al., 2008). The spectral slope ratio (SR) was determined as the ratio of the slope of the shorter wavelength (S275–295) relative to that of the longer wavelength (S350–400) (Helms et al., 2008). The specific UV absorbance (SUVA350, unit: L mg C-1 m-1) was derived from the UV absorbance at 350 nm and normalized to the DOC concentration (Helms et al., 2008).
The fluorescence analysis was performed using scanning emission wavelengths of 211.2–617.4 nm in 3.2-nm increments and excitation wavelengths of 240–600 nm in 5-nm increments with an integration time of 3 s. All EEM processing and parallel factor analysis (PARAFAC) modeling were carried out using the MATLAB software R2021a (The MathWorks, MA, USA) with the drEEM toolbox (Murphy et al., 2013). The inner filter effect was corrected using the UV absorbance values of each sample. The non-negativity constraint was applied to all three modes. The fluorescence intensities of the samples were normalized daily to the Raman peak area of ultrapure Milli-Q water at an excitation wavelength of 350 nm, and these values were stated as Raman Units (R.U.) (Lawaetz and Stedmon, 2009).
2.4 Optimum multi-parameter analysis
The optimum multi-parameter (OMP) analysis (Tomczak and Large, 1989) was conducted to determine the fractional contributions of different water masses present in this region. The OMP analysis assumes that the observed water masses can be represented as a mixture of source water types (SWTs). Then, the relative contribution of an SWT to the observed water masses can be determined from the following linear system of equations:
where G is the SWT matrix (Table 1), x is the unknown solution vector (water mass fraction of the SWT), d is the vector of the observational data, and R is the residual vector.
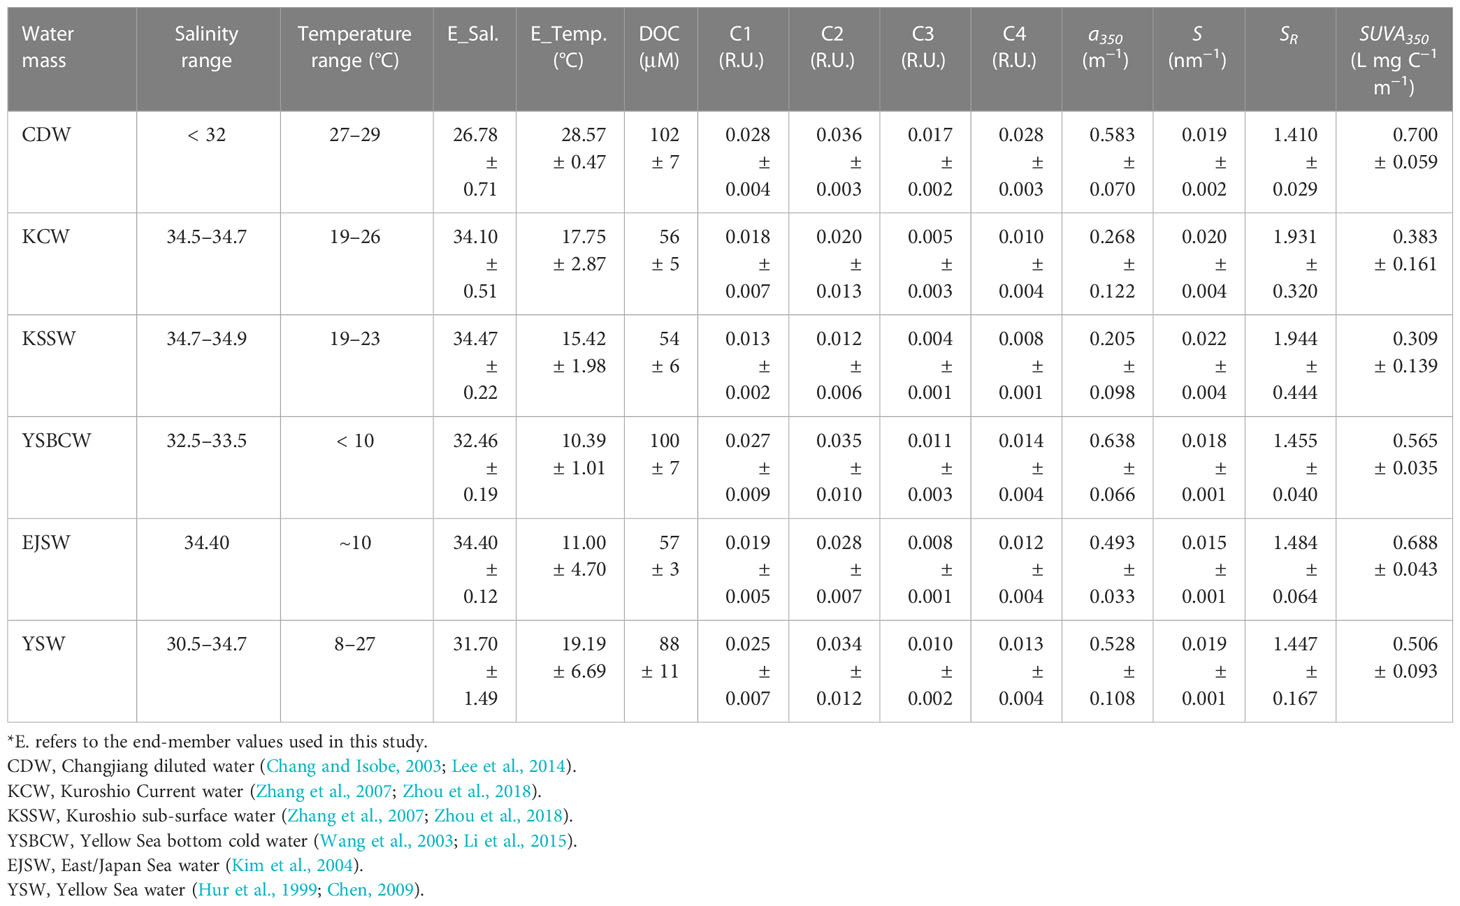
Table 1 Source water types and their specific hydrological (salinity and temperature) and DOM properties (DOC, FDOM components, and CDOM parameters) considered in the OMP analysis.
The system is solved by a least square method to minimize the residuals:
where W is the weighting matrix, and WT and RT are the transposes of the matrices W and R, respectively.
3 Results
3.1 Source water types
The salinity and temperature ranged from 26.77 to 34.57 (Avg. 32.34 ± 1.68) and from 4.41 to 29.46°C (Avg. 19.41 ± 6.17°C), respectively, in the entire study region (Figures 2, 3A). The temperature and salinity were found to be strongly stratified in the water column during the sampling campaign (Figure 3A). In this region, the water masses include the Changjiang diluted water (CDW), the Kuroshio Current water (KCW), the Kuroshio sub-surface water (KSSW), the Yellow Sea bottom cold water (YSBCW), and the East/Japan Sea water (EJSW) as previously documented (Hur et al., 1999; Ichikawa and Beardsley, 2002; Chang and Isobe, 2003; Chen, 2009; Wang et al., 2014; Lee et al., 2016; Lee et al., 2020) (Figure 2). The SWTs, which are the specific properties characterizing the different water masses, were defined based on the temperature versus salinity (T–S) distributions and the literature values (Hur et al., 1999; Ichikawa and Beardsley, 2002; Chang and Isobe, 2003; Chen, 2009; Lee et al., 2014) (Figure 2). The SWT definitions and their specific properties considered in this study are summarized in Table 1.
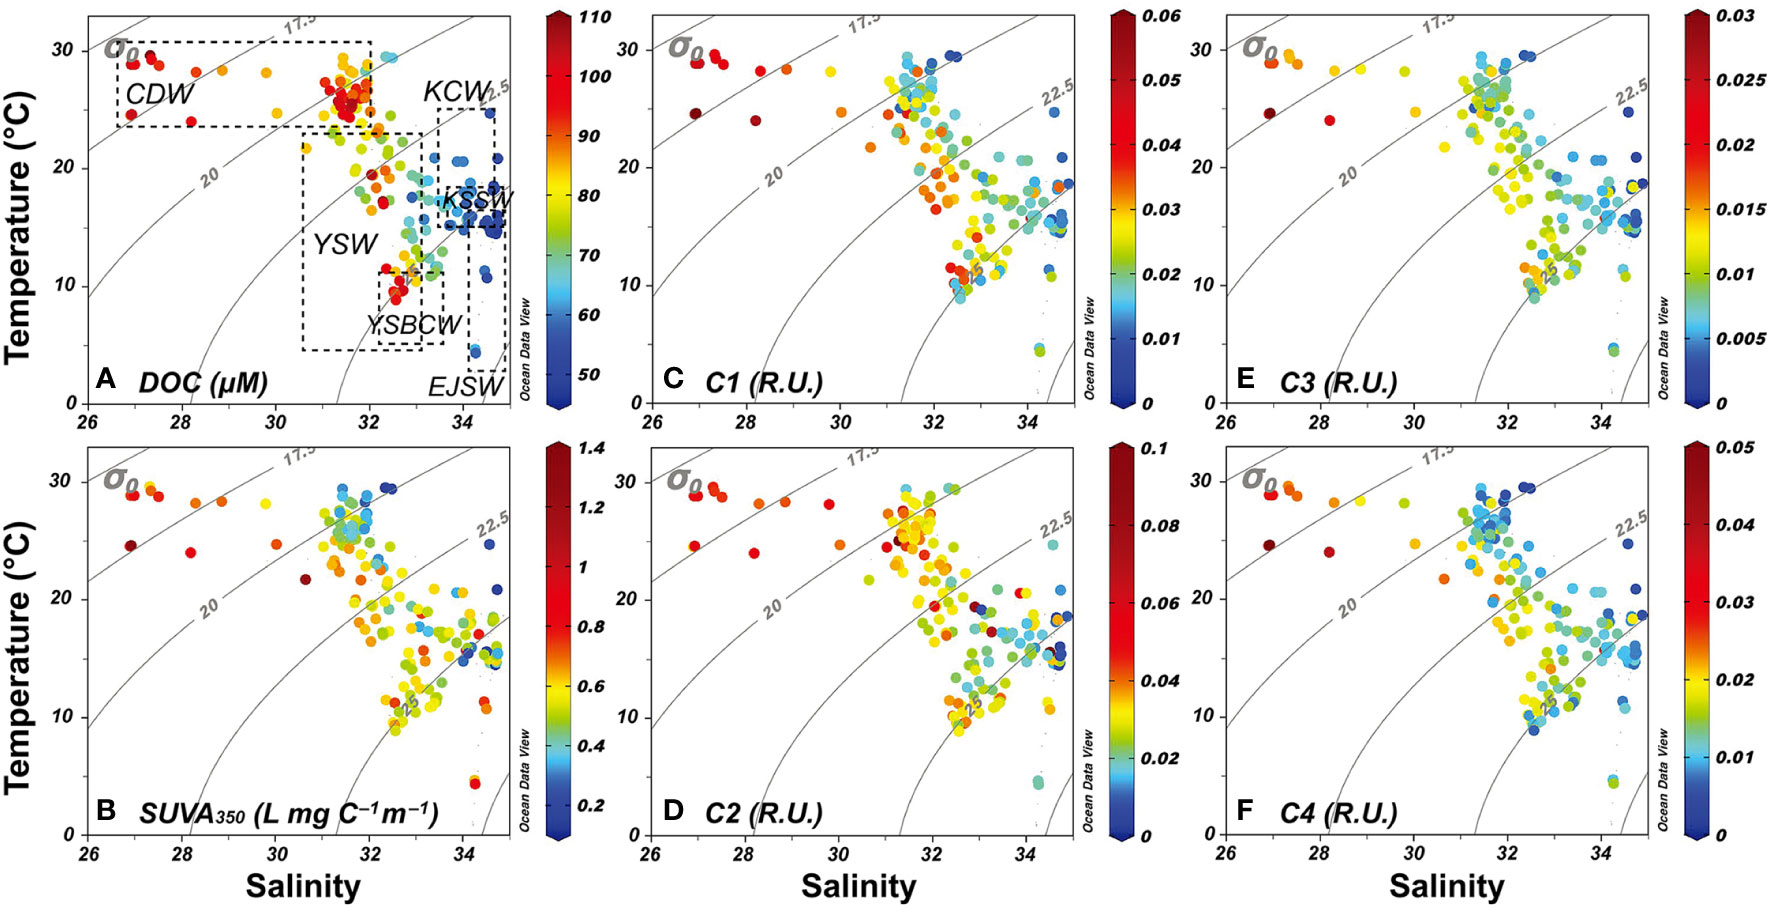
Figure 2 T-S diagrams of DOC concentrations (A), SUVA350 (B), and FDOM components (C–F). Each dashed box in (A) indicates different water masses in this region: the Changjiang diluted water (CDW), the Kuroshio Current water (KCW), the Kuroshio sub-surface water (KSSW), the Yellow Sea water (YSW), the Yellow Sea bottom cold water (YSBCW), and the East/Japan Sea water (EJSW).
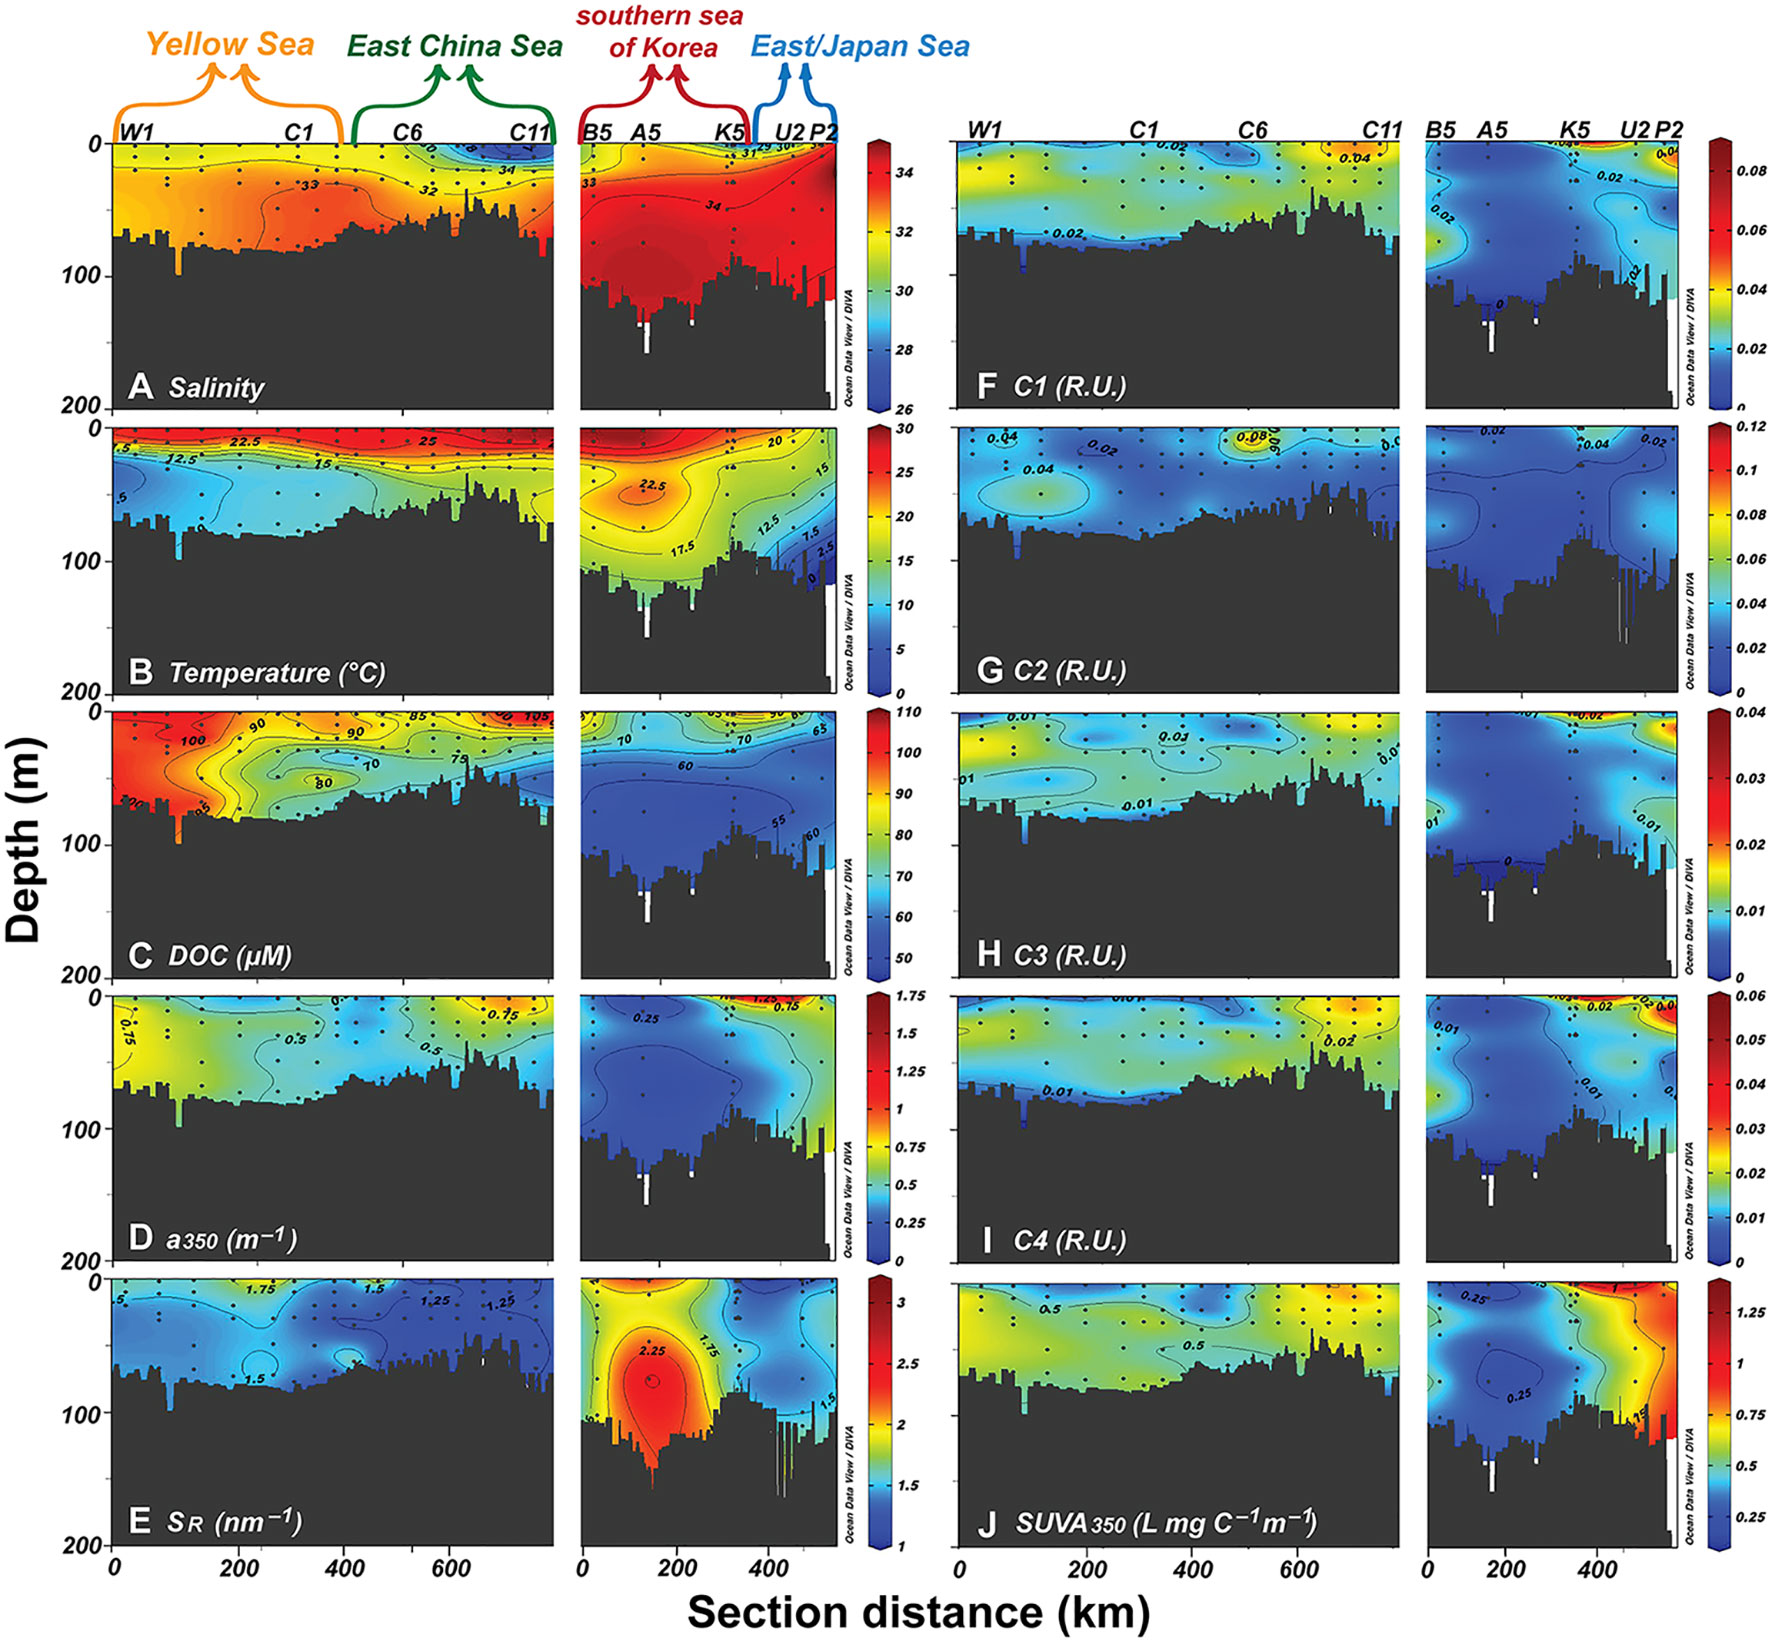
Figure 3 Sectional distributions of salinity (A), temperature (B), DOC concentrations (C), a350 (D), SR (E), FDOM components (F–I), and SUVA350 (J) along the transect shown in Figure 1.
The CDW is characterized by low salinity (< 31) with high temperatures (> 27°C) in the surface layer (Chang and Isobe, 2003; Lee et al., 2014) (Table 1 and Figure 2). The CDW transports low-salinity water from the river mouth to the EJS through the surface layer during the summer in this region (Chang and Isobe, 2003). The KCW is a western Pacific boundary current, one of the major ocean currents characterized by high water temperature (19–26°C) and high salinity (34.5–34.7) (Ichikawa and Beardsley, 2002) (Figures 3A, B). Below the surface layer of the KCW, the KSSW displays little variation in its temperature (slightly lower than KCW; 19–23°C) with slightly higher salinity (34.7–34.9) than the KCW (Zhou et al., 2018) (Figures 3A, B).
The YS shows relatively large variations in salinity (30.5–34.7) and temperature (8–27°C) with varying contributions of other water masses (the YSBCW, the KCW, and the CDW). In this region, the YSBCW is differentiated from the YS water (YSW) by salinity between 32.5 and 33.5 and temperature near 10°C at depths greater than 50 m (Chen, 2009; Wang et al., 2014; Lee et al., 2016) (Table 1 and Figure 2). Since the water residence time of the YSW is about five years, the biogeochemical characteristics of the YS are significantly altered during its residence time in this region (Nozaki et al., 1991; Hur et al., 1999; Kim et al., 2005; Chen, 2009) (Figure 2). However, the YSW was not considered individually in the water mass mixing model since the hydrographic characteristics of the YS water were determined by mixing between the YSBCW and the CDW.
The EJSW is characterized by a low water temperature (< 10°C) and relatively high salinity (> 34.40), which flows across the Korean strait into the EJS (Kim et al., 2004) (Table 1 and Figure 2). The EJS is a semi-enclosed marginal sea with a maximum depth of over 3500 m. In the EJS, the Changjiang River is known as the major source of DOM in the surface water (Kim and Kim, 2015).
3.2 FDOM components
In this study, four FDOM components were determined using the PARAFAC model (Figure S1). To characterize the properties and the origins of each FDOM component, the fluorescence spectra were compared with the OpenFluor database (Murphy et al., 2014). The C1, C2, C3, and C4 components yielded statistical matches with FDOM components from a total of 21, 9, 5, and 6 previous studies, respectively (Table S1). The C1, C3, and C4 components presented similar fluorescent spectra at relatively longer wavelength ranges to the FDOMH component. The maximum peak location of the C1 component (Maxex/em = 320/398.4 nm) was similar to that of the marine humic-like component, identified as the M peak (Coble, 2007). The C2 component (Maxex/em = 290/323.3 nm) was a relatively sharp spectrum located at a shorter wavelength, described as a protein-like (tryptophan-like) component associated with autochthonous organic substances (Coble, 2007). The C3 component (Maxex/em = 305(425)/517.4 nm) seemed to be a mixture of two humic-like components, peaks A and C, which are classified as having terrestrial origins (Coble, 2007). However, both components have also been reported in deep-ocean and porewater samples (Burdige et al., 2004; Kim and Kim, 2016). The C4 component (Maxex/em = 365/444.4 nm) was also observed at relatively longer wavelengths. Based on the results from the OpenFluor database, the C4 component was characterized as the terrestrial source and the best predictor of lignin phenol concentration by Walker et al. (2013).
3.3 Distributions of DOC, FDOM, and CDOM
The concentrations of DOC showed a wide range from 47 to 109 μM (Avg. 77 ± 16 μM) with a good negative correlation with salinity (r2 = 0.55; p<0.05) (Figure 4A). Higher DOC values (> 100 μM) were observed where the CDW (Avg. 102 ± 7 μM) and the YSBCW (Avg. 100 ± 7 μM) were present with different salinity ranges, while the lower values (~55 μM) were observed where the KCW (Avg. 56 ± 5 μM) and the EJSW (Avg. 57 ± 3 μM) are present (Figure 3C). The lowest concentrations of DOC were found at station A near the southern sea of Korea region (Figure 3C). The absorption coefficient, a350, which is an indicator of the CDOM content in DOM, ranged from 0.085 to 1.62 m−1 (Avg. 0.48 ± 0.20 m−1) (Figure 3D). The S275–295, which is related to the molecular weight of DOM and generally increases with irradiation, ranged from 0.013 to 0.027 nm−1 (Avg. 0.019 ± 0.002 nm−1), whereas the SR value, generally related to DOM molecular weight and solar irradiation, ranged from 1.054 to 2.570 (Avg. 1.517 ± 0.278) (Figure 3E). The marine humic-like component C1 ranged from 0.009 to 0.082 R.U. (Avg. 0.023 ± 0.010 R.U.) (Figure 3F). The protein-like component C2 ranged from 0.006 to 0.116 R.U. (Avg. 0.030 ± 0.014 R.U.) (Figure 3G). The terrestrial humic-like components C3 and C4 ranged from 0.002 to 0.037 R.U. (Avg. 0.009 ± 0.004 R.U.) and 0.004 to 0.058 R.U. (Avg. 0.013 ± 0.007 R.U.), respectively (Figures 3H, I). All components were negatively correlated with the salinity. The distribution of FDOMH components (C1 and C3) showed higher concentrations in the CDW (Avg. 0.028 ± 0.004 R.U. and 0.017 ± 0.002 R.U.) and the YSBCW (Avg. 0.027 ± 0.009 R.U. and 0.011 ± 0.003 R.U.) and lower concentrations in the KCW (Avg. 0.018 ± 0.007 R.U. and 0.005 ± 0.003 R.U.) and the EJSW (Avg. 0.019 ± 0.005 R.U. and 0.008 ± 0.001 R.U.), respectively (Figures 3F–I, 4B, C). The SUVA350 index, indicating the aromatic contents of DOM and/or humic fraction of DOC (Helms et al., 2008; Butman et al., 2012; Hansen et al., 2016), ranged from 0.14 to 1.31 L mg C−1 m−1 (Avg. 0.522 ± 0.168 L mg C−1 m−1) (Figures 3J, 4D). Similarly, both CDOM (a350, S275–295, SR, and SUVA350) and FDOM (C1, C2, C3, and C4) parameters showed representative values (higher values in the CDW and the YSBCW and lower values in the KCW and the EJSW) for each different water mass (Table 1).
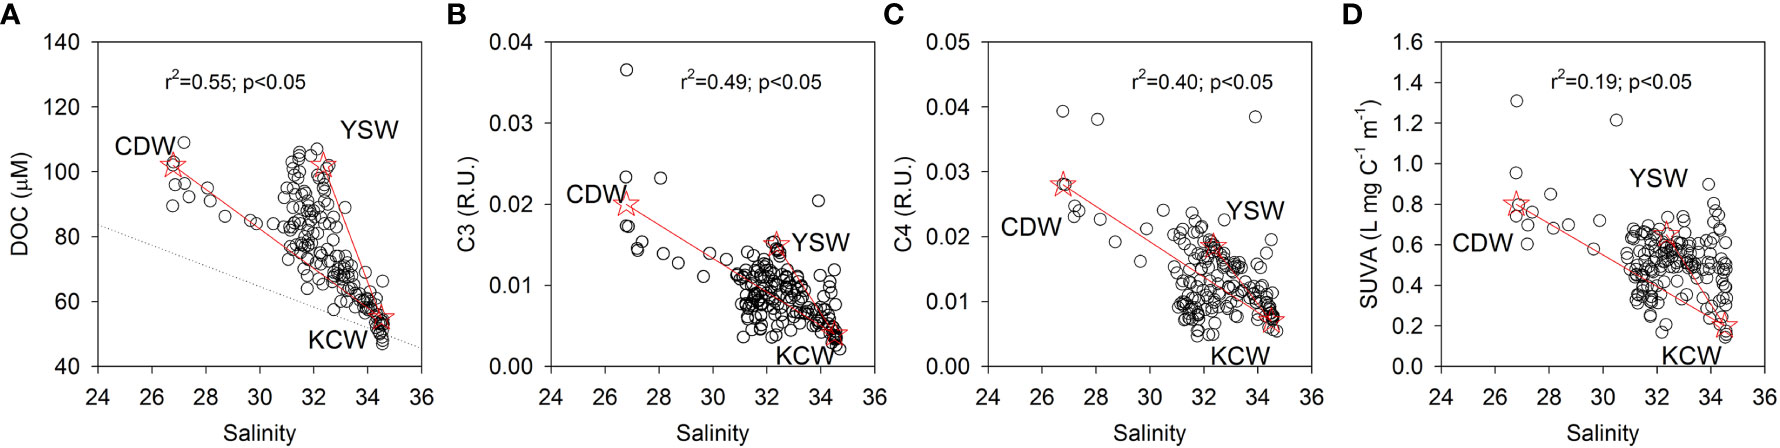
Figure 4 Correlations between the salinity and the concentrations of DOC (A), C3 (B), C4 (C), and SUVA350 (D). Red stars and solid lines indicate the endmember values of each parameter and theoretical mixing line, respectively. The dotted line indicates the end-member mixing line.
4 Discussion
4.1 Distributions and origins of DOM
In this study, the concentrations of DOC and FDOM showed good negative correlations with salinity, indicating the predominant contribution of the Changjiang River (Figures 2, 4). However, there was an enhanced concentration of DOC found above the end-member (the Changjiang River source) mixing line, which is marked as the CDW source in Figure 4A. This additional input of DOC has been attributed to the microbial activity in the water column near the estuarine mixing zone (Kim et al., 2020). Also, almost similar or even higher concentrations of DOC than those of the CDW were found in the YSW (Figure 4A). In this region, this additional DOC source was suggested to be produced from the shelf-water based on the dual carbon isotope analysis (marine δ13C signature and young 14C age) (Kim et al., 2018; Han et al., 2022). These enhanced concentrations and distributions of DOC were found to be highly dependent on the age of the shelf-water, which is also consistent with those of enhanced FDOMH concentrations in the shelf region (Kim et al., 2018; Han et al., 2022). Although photochemical degradation is one of the major removal mechanisms of FDOM in the surface layer of aquatic environments (Coble, 2007), the C3 (r2 = 0.49; p<0.05) and C4 (r2 = 0.40; p<0.05) components showed good correlations with salinity in this study (Figures 4B, C). Such a negative correlation may suggest that the water mixing process is more distinct than the other processes, perhaps owing to a lower degree of photochemical degradation of DOM than the water mass mixing during the long-range transport in this region (Kim et al., 2018; Kim et al., 2020). In the YSW, both DOC and FDOM concentrations showed similar mixing patterns, and the water masses were mainly consisted of the CDW and the YSBCW (Figure 2). The KCW was differentiated by the lowest concentrations of DOC and FDOM in the high-salinity waters (Figures 2, 4). However, the EJSW showed low concentrations of DOC with high concentrations of FDOM in high-salinity waters compared with that of the KCW (Figure 2). This high concentration of FDOM could be caused by microbial activity in the ocean interior (> 200 m) and transported to the surface layer by own circulation system and upwelling (Kim and Kim, 2015).
4.2 Evaluation of DOM parameters for OMP analysis
The multiple water masses can be clearly differentiated based on three end-member models using the classical T–S method: the CDW, the YSW, and the KCW. However, it is difficult to estimate the distributions and proportions of water masses where various water masses (more than three) are present, with varying contributions. Thus, in this study, the OMP analysis was applied together with various DOM parameters (DOC, C3, C4, and SUVA350) to determine the relative mixing fractions of the different water masses and to determine the driving force of the distributions of DOM parameters in this shelf region.
There could be several limitations with applying DOM parameters to the OMP model in the shallow marginal seas. In general, the OMP method is not applicable in such productive marginal seas, where the oxygen and nutrients are not conservative (Chen, 1988; Zhou et al., 2018). However, these methods using radium isotope and dissolved inorganic iodine have been successfully applied as conservative tracers to determine the distribution of different water masses in the ECS shelf region in previous studies (Zhang et al., 2007; Zhou et al., 2018).
In addition, some chemical parameters such as oxygen, nutrients, and isotope values may not be useful for water source discrimination due to their large involvement in the air-sea exchange and biological activities (Chen, 1988; Zhang et al., 2007; Amaral et al., 2020). In particular, Amaral et al. (2020) suggested that the distribution of DOC was not dependent on the water mass mixing due to its multiple sources and complicated biogeochemical processes. However, DOM parameters used in this study, including DOC (r2 = 0.55; p<0.05), C3 (r2 = 0.49; p<0.05), C4 (r2 = 0.40; p<0.05), and SUVA350 (r2 = 0.19; p<0.05) (Figure 4), showed no remarkable internal changes during the water mass mixing in this region. This indicates that the water mass mixing is a more dominant process than the other biogeochemical processes and/or external source inputs in this region.
Both CDOM and FDOM are known as reliable proxies for DOM, and the correlations between CDOM/FDOM and salinity showed consistent behavior with those of DOC. Although DOM components (DOC, FDOM, and CDOM) showed good correlations with salinity, each component had a different slope in this study, indicating the different end-member values and mixing processes of each water mass in this region (Figure 4). This shows the individual characteristics of SWTs and validates whether these DOM parameters can be used as conservative tracers for each water mass in this region. However, although FDOM is a powerful tracer for determining the DOM origins in the ocean, different FDOM components can be selectively degraded during their transport and/or mixing (Romera-Castillo et al., 2011). In this study, the C1 component was classified as the marine humic-like M peak, which could be preferentially degraded by marine bacteria, and the terrestrial humic-like peaks seem more resistant to bioavailable degradation (Romera-Castillo et al., 2011). Thus, the C3 and C4 components (terrestrial humic-like peaks) that showed consistent behavior with salinity were applied to the OMP analysis (Figures 4B, C). The optical signature of DOM, including FDOM, a350, and SUVA350, showed distinct characteristics in each water mass because different external origins contributed to the unique DOM behaviors in the water masses in this region (Figure 3D–J). For example, SUVA350 is known to be highly associated with the molecular weight and aromaticity of DOM (Helms et al., 2008). In this study, SUVA350 showed no remarkable internal variations during the water mass mixing and the concentrations of DOC and a350 values also showed a positive correlation (r2 = 0.40; p<0.05) among different water masses (Figures 4D, S2), which may derive such a conservative mixing pattern from the source to the receptor region, which is similar to other DOM parameters used in this study. Thus, SUVA350 may allow us to identify different aromatic-biased carbon contents over the overall organic carbon content in the water masses (Figures 3, 4D). These characteristics may also allow for the use of DOM parameters as conservative tracers in this region.
4.3 Distributions of SWTs
Based on the OMP calculation, we determined the mixing proportions of five different water masses in this region: the CDW, the YSBCW, the KCW, the KSSW, and the EJSW (Figure 5). The shelf-water, which flows in the YS and the ECS regions, was mainly consisted of the CDW (10–90%), the YSBCW (40–70%), and the KCW (10–40%), which is also consistent with previous studies (Chen, 2009; Zhou et al., 2018) (Figure 5). As expected, the contribution of the YSBCW was up to 70% of the total water in the YS region (Figure 5). The contribution of the CDW was greater in the surface layer near the discharge region and gradually decreased with increasing distance from the river mouth (Figure 4). The contributions of the KCW (~80%) and the KSSW (~90%) were greater near the southern sea of Korea where the Kuroshio Current mainly passes through (Figure 5). The contribution of the EJSW was significant only at the stations near the EJS area (Figure 5).
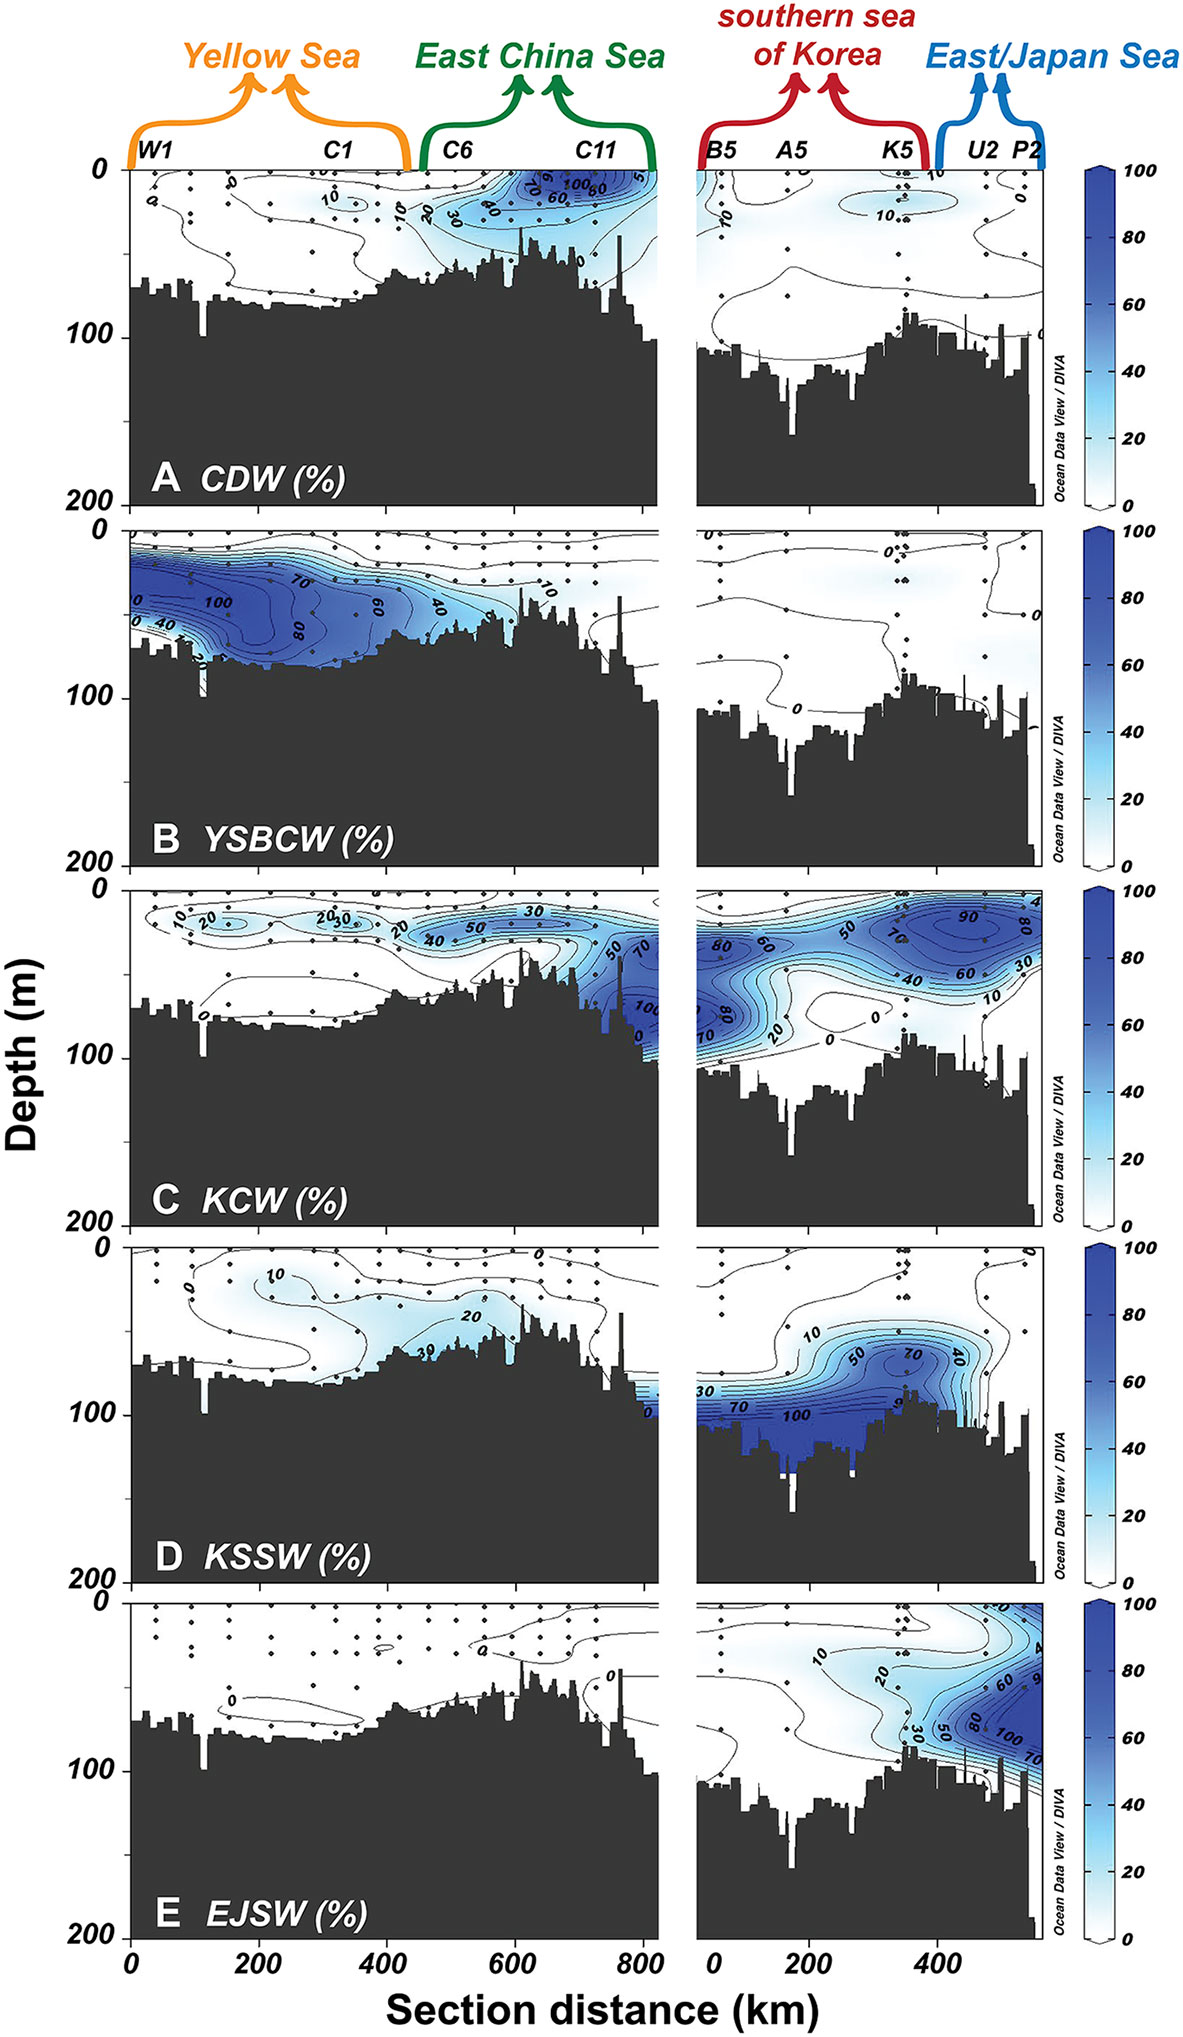
Figure 5 Distributions of SWTs in the northwestern Pacific marginal seas revealed by the OMP analysis along the transect shown in Figure 1: CDW (A), YSBCW (B), KCW (C), KSSW (D), and EJSW (E).
Since the water masses flow from the innermost region of the YS to the EJS passing the ECS and the southern sea of Korea following the pathway of the water current, the water mass distributions with the mixing proportions found from the OMP analysis clearly reflected the pattern of the water current in this region (Figure 5). In this study, the YSBCW and the KCW showed the most abundant distributions, with the average contributions of 61 ± 18% and 54 ± 30%, respectively. The contribution of the CDW was estimated to be approximately 41 ± 32% in the surface water of the shelf region. These results were also consistent with the previous studies in this region (Zhang et al., 2007; Lee et al., 2014; Zhou et al., 2018). Lee et al. (2014) reported that the contributions of the YSW, the KCW, and the CDW were approximately 30–50 ± 4%, 65 ± 15%, and 30 ± 7%, respectively. On the other hand, Zhang et al. (2007) summarized that the water mass contributions were about 14% from the KSW, 43% from the KSSW, 22% from the CDW, and 22% from the Taiwan Strait Warm Water (TSWW) in this region. Zhou et al. (2018) also found that the surface water in the ECS is mainly mixed by the CDW, the KCW, and TSWW, and the contribution of each water mass was approximately 30–90%, 50%, and 70%, respectively. Some discrepancies or large ranges could be found due to the spatial and interannual variabilities among different studies.
In addition, the relationships between the value calculated by the OMP analysis versus the observed values of DOC (r2 = 0.63; p < 0.01), FDOMH (r2 = 0.52; p < 0.01), and SUVA350 (r2 = 0.54; p < 0.01) showed good correlations. Although the coefficients of determination were not significantly high (close to 1), this also suggests a possibility and more evidence for using DOM parameters with this model in such productive marginal seas. In a previous study, the results of the OMP analysis were inconclusive in ocean systems with multiple sources and complicated internal biogeochemical cycles (Amaral et al., 2020). Although our study region has a complex mixing trend between various water masses, the optical properties of DOM in the water masses were distinct and influenced by the conservative mixing in the entire northwestern Pacific marginal seas. Also, CDOM and FDOM, which is the sufficiently easy and simple methods of estimating DOM, could be more applicable and efficient in such productive marginal seas. A large deviation or scatter found from the linear regression may be associated with the additional inputs (atmospheric depositions and diffusive groundwater fluxes) and outputs or internal cycles (biogeochemical processes, biodegradation, and photodegradation) during water mixing.
4.4 Contributions of SWTs
To investigate the DOM drivers and their relationship to water mass mixing in this region, we compared the water mass fractions (f) of the SWTs together with the DOM parameters using the Pearson correlation coefficient value (Table 2). Here, the positive regression coefficient (r) values between the f value and DOM parameters indicate the production and/or input of DOM by the water mass f, while the negative values would indicate the dilution effect and/or degradation process by the additional water mass inputs (Table 2).
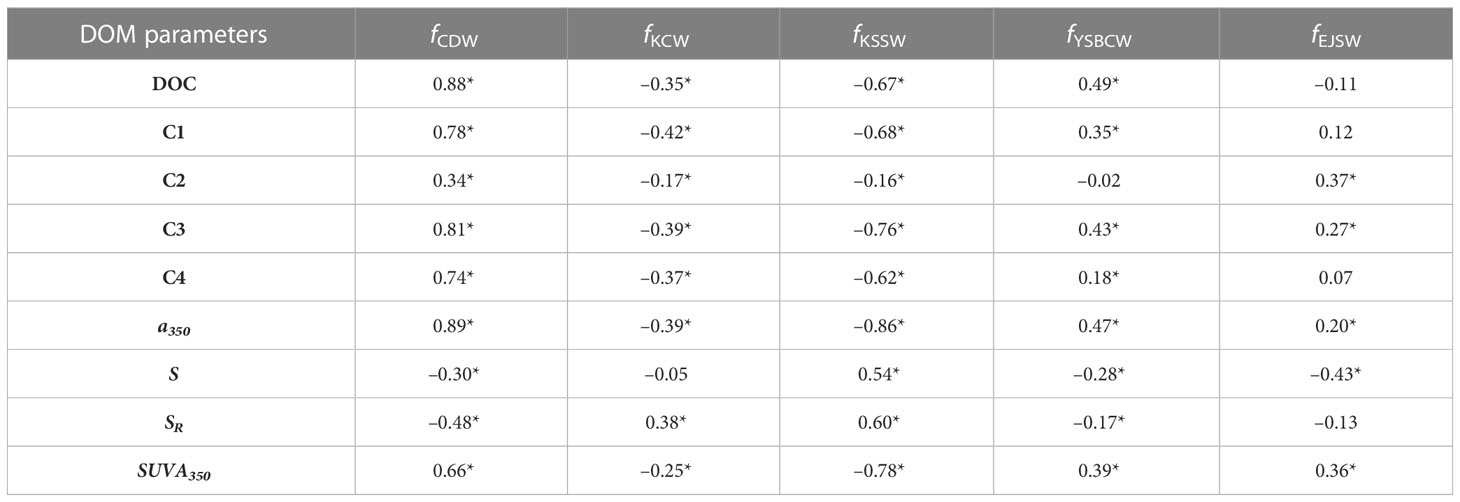
Table 2 The correlation coefficient values of the water mass fraction (f) of different water masses versus DOM parameters (* indicates p < 0.05).
The fraction of the CDW (fCDW) was significantly correlated with the concentrations of DOC (r=0.88), C1 (r=0.78), C3 (r=0.81), C4 (r=0.74), and a350 (r=0.89) (Table 2). This indicates that the Changjiang River primarily contributes to the DOM budget, which mostly contains humic organic matter in this region. This is supported by the fact that the Changjiang River is one of the largest rivers in the world and discharges approximately 80% of the freshwater and terrestrial materials in the northwestern Pacific marginal seas (Wang et al., 2012). The river-driven DOC budget is believed to be produced by direct discharge from the land and indirect biogeochemical processes in the estuary mixing zone in this region (Kim et al., 2020). The negative r value of SR (r= −0.48) with high positive r value of SUVA350 (r= 0.66) values may represent more aromatic and less irradiated DOM originating from the CDW. This was attributed to the fact that river water contains a significant amount of aromatic terrestrial organic matter from the soils and sediments (Hopkinson et al., 1998; Miller et al., 2009).
The fraction of the YSBCW (fYSBCW) also showed relatively high coefficient values for DOC (r=0.49), C3 (r=0.43), and a350 (r=0.47) (Table 2). As mentioned above, higher concentrations of DOC and FDOM were found in the YS region (high salinity water) than those in the CDW (low salinity water). It seems once the river-driven DOC is enriched in the estuarine mixing zone (Kim et al., 2020), transported to the shelf region, and continuously accumulated in the shelf-water over the residence time as previously documented (Han et al., 2022) (Figure 4A). Here, the source of DOC in the YS shelf-water was found to be from the fresh marine DOM sources based on the dual carbon isotopic compositions (marine δ13C signature and young 14C age) (Han et al., 2022). Similarly, Kim et al. (2018) suggested that FDOMH (both M peak and C peak) was mainly produced in the bottom sediment in the central YS region and enriched over the residence time (~5 years) in the shelf-water, as previously explained. In this study, the C1 component slightly increased in the central YSW (Figure 3F) and correlated with DOC concentrations (r2 = 0.24; p<0.05) (Figure S3), which can be also evidenced by the enhanced marine origin DOM in the shelf waters. Also, lower SUVA350 values in the YSBCW than that in the CDW were obtained from the lower a350 values caused by the aged water mass (~5 years) found in the deep water of the YS region. Thus, the fresh DOM source or DOM production seems to be mainly contributed by the CDW and the YSBCW in the YS region (Figure 5).
In the case of the KCW (fKCW) and the KSSW (fKSSW) fractions, the DOM parameters showed negative coefficient values, indicating a dilution effect of those DOM parameters by these water masses. However, the fKCW and the fKSSW showed negative correlation values with absorbance measurements including, a350 (a proxy of the abundance of CDOM) (r=−0.39 and r=−0.86) and SR (r=0.38 and r=0.60) (Table 2). This indicates that these water masses were mainly dependent on the input of the highly irradiated DOM (high SR value) with a low absorptivity and less aromatic content derived from the old Pacific Ocean water. The distinct characteristics of the CDOM parameters (a350, SR, and SUVA350) showed that these parameters were mainly derived from the river water source, whose coefficient values were positive (Figures 3D, E, J). Thus, the Kuroshio-derived water masses (the KCW and the KSSW) were characterized by low biological productivity and a relatively old Pacific Ocean water that intrudes into the continental shelf area (Chen et al., 2021) (Figure 3).
The fraction of the EJSW (fEJSW) showed a significant relationship with S (r=−0.43) and SUVA350 (r=0.36). Although the fEJSW showed weak coefficient values compared with other water masses, the fEJSW also showed significantly different characteristics from the EJSW itself due to its own deep-water circulation system (Kim and Kim, 1996) (Table 2). The concentration of DOC showed relatively low values with a negative r value (r=−0.11), while the FDOM components showed positive r values (Table 2). In previous studies, FDOMH in the deep layer was found to be produced mainly by the degradation of sinking organic particles (Nelson and Siegel, 2013; Kim and Kim, 2016).
Thus, it seems that the distributions of DOM production and degradation showed a similar pattern to the water mass mixing pattern in this region (Figure 5). Our results suggest that the distributions of DOM parameters are significantly influenced by the mixing of multiple water masses in the northwestern Pacific marginal seas (Figure 6). In Figure 5, the area where the contribution of each SWT is over 50% was considered to be fully composed of that particular SWT, while the area where the contribution of each SWT is less than 50% was considered to be a mixed area with various water masses. In the YS region, the water masses were mostly composed of the YSBCW (Figure 6). In the ECS area, the surface water (< 25 m) was mainly contributed by the CDW, whereas the bottom water was mostly contributed by the KCW (Figure 6). In the southern sea of Korea, the water masses were mainly mixed by the KCW and the KSSW (Figure 6). The EJSW enters to the southern sea area as upwelling water from the EJS coastal region (Figure 6). Because the spatial distribution of dominant SWTs was appropriate, the optical properties of DOM can be used as a powerful proxy for the origins and characteristics of DOM and water-mass distributions in this region.
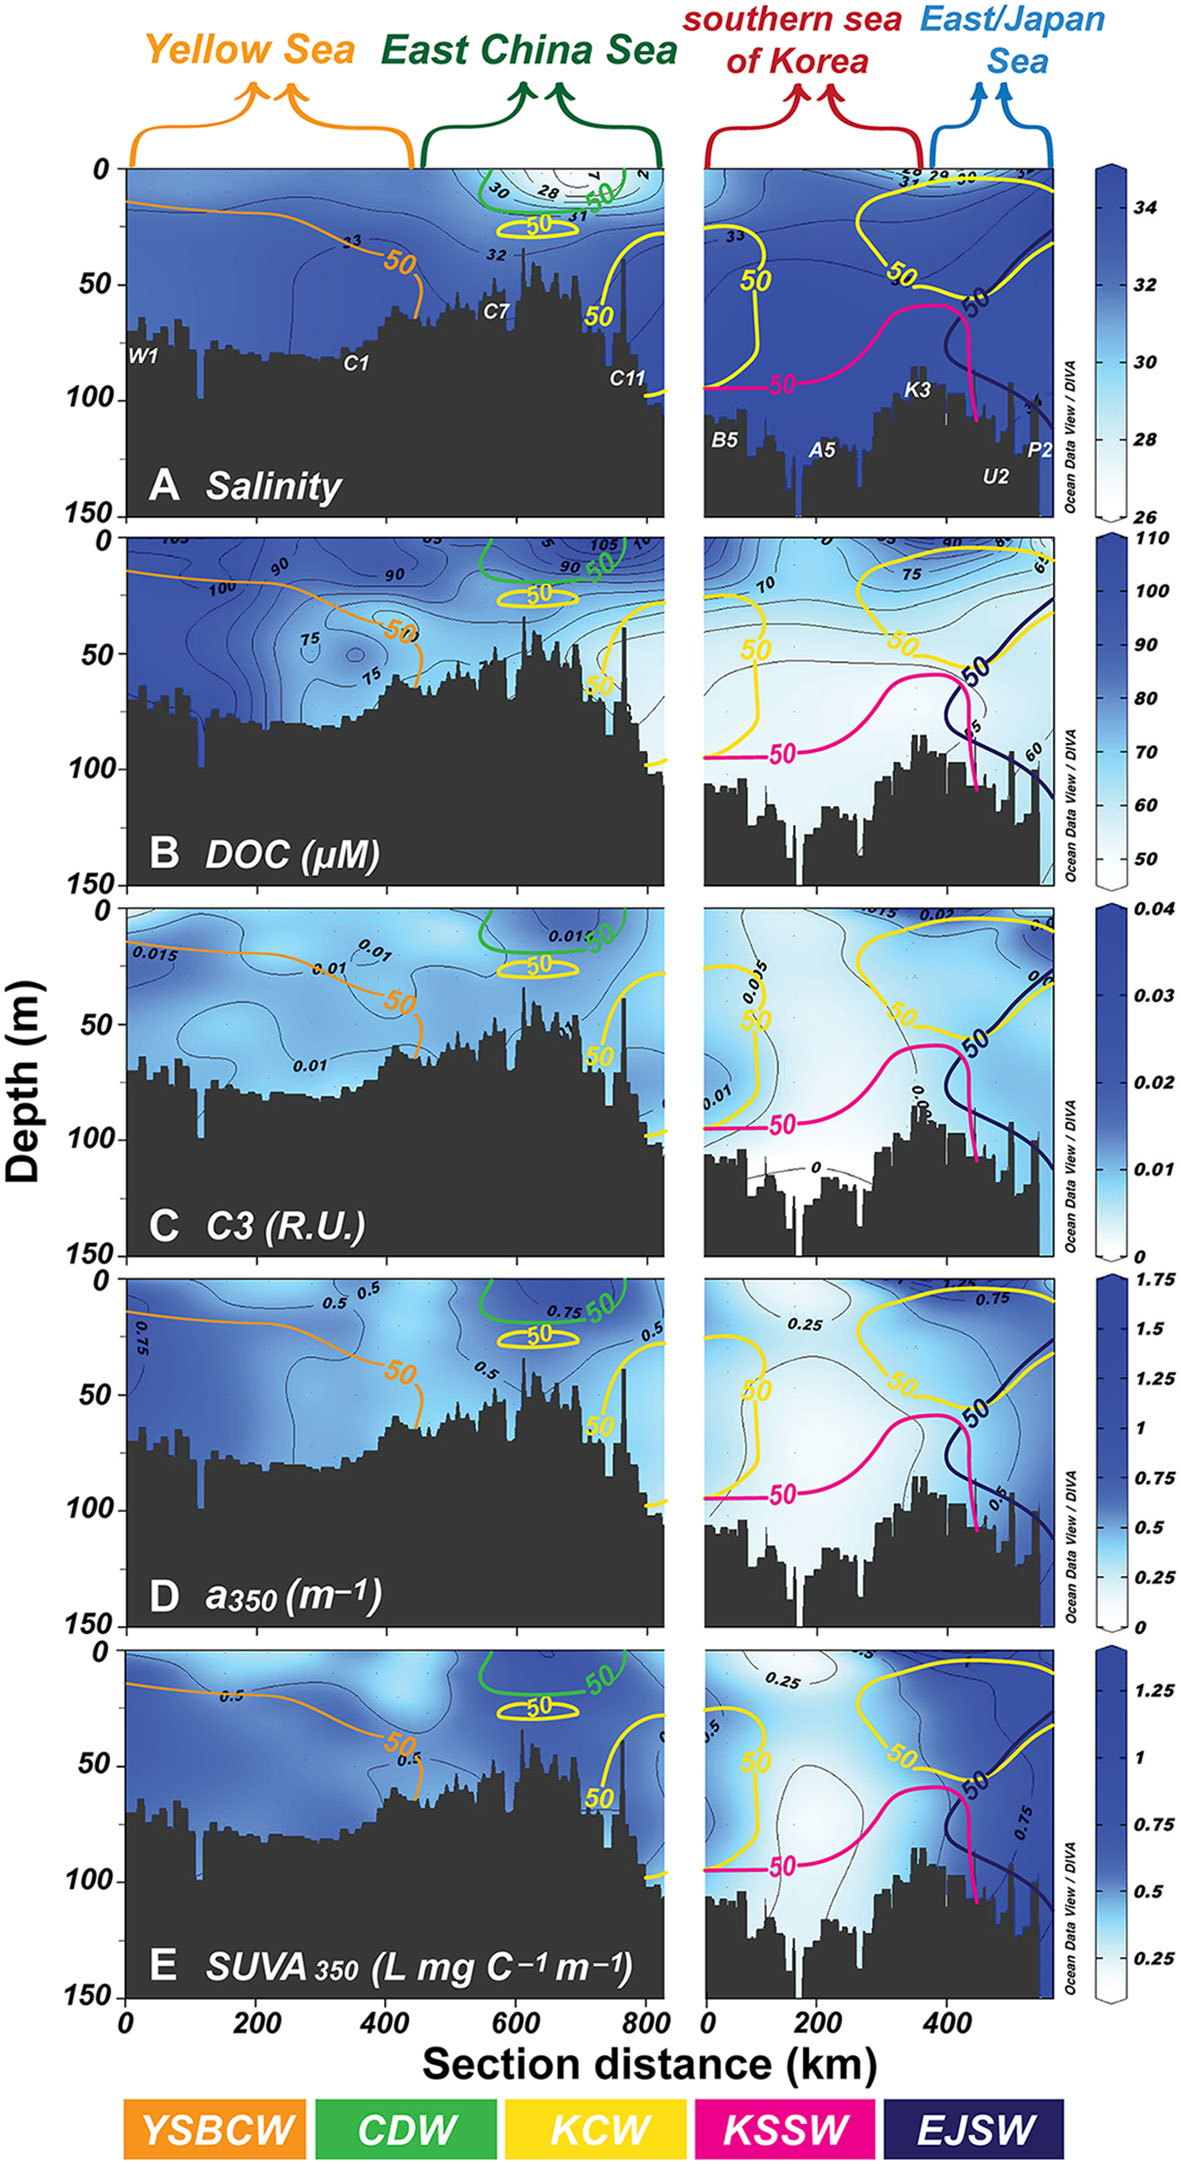
Figure 6 Sectional distributions of salinity (A), DOC concentrations (B), C3 component (C), a350 (D), and SUVA350 (E) together with the SWTs along the transect shown in Figure 1. The colored line indicates the 50% of the water mass mixing fraction value calculated by the OMP analysis.
5 Conclusions
The different distributions of water masses and DOM components (DOC, FDOM, and CDOM) were determined based on field observations and OMP analysis in the northwestern Pacific marginal seas in August 2020. This study aims to solve the complex mixing processes and detailed proportions of various water masses in productive marginal seas. Thus, a new approach was applied to determine the driving force of the distributions of various DOM parameters by using an OMP analysis with DOM parameters in these productive marginal seas and to validate whether these DOM parameters could be an effective proxy for the water mass tracers. In this region, five different water masses were found, including the CDW, the YSBCW, the KCW, the KSSW, and the EJSW, with varying contributions and mixing proportions. In the surface layer, the external drivers of DOM distribution were observed to be intrusions of (1) the CDW and (2) the KCW, while in the bottom layer, the seawater was mainly contributed by the mixing of (3) the YSBCW and (4) the KSSW together with (5) an upwelling of the EJSW. Our results showed that fresh DOM was mainly derived from the CDW and the YSBCW, while the old DOM was mainly derived from the KCW and the KSSW in this region. In addition, the distributions of the optical properties of DOM were significantly influenced by the mixing of multiple water masses. Our results suggest that the optical signature of DOM can be a good proxy for tracing the origins, characteristics, and distribution of DOM in the northwestern Pacific marginal seas. Further studies are required to investigate the seasonal and interannual variability of the DOM parameters and water masses mixings in this region.
Data availability statement
The raw data supporting the conclusions of this article will be made available by the authors, without undue reservation.
Author contributions
JK and HH conceived and designed the study. HH collected the samples and performed the sample analyses. HK performed the OMP and water mass analyses. JK and HH conducted the statistical data analyses. HH and JK wrote the manuscript. GK, JH, and SN reviewed and commented on the manuscript. All authors contributed to the article and approved the submitted version.
Funding
This research was supported by Korea Institute of Marine Science and Technology Promotion (KIMST) funded by the Ministry of Oceans and Fisheries (20220533). This work was also supported by the National Research Foundation of Korea (NRF) funded by the Korean government (NRF-2021R1C1C1004733). HH was partially supported by Basic Science Research Program through the NRF funded by the Ministry of Education (2021R1A6A3A01086864).
Acknowledgments
We would like to thank all crew members of R/V Onnuri of KIOST for helping in undertaking the field sampling.
Conflict of interest
The authors declare that the research was conducted in the absence of any commercial or financial relationships that could be construed as a potential conflict of interest.
Publisher’s note
All claims expressed in this article are solely those of the authors and do not necessarily represent those of their affiliated organizations, or those of the publisher, the editors and the reviewers. Any product that may be evaluated in this article, or claim that may be made by its manufacturer, is not guaranteed or endorsed by the publisher.
Supplementary material
The Supplementary Material for this article can be found online at: https://www.frontiersin.org/articles/10.3389/fmars.2023.1127803/full#supplementary-material
References
Amaral V., Romera-Castillo C., Forja J. (2020). Dissolved organic matter in the gulf of cádiz: Distribution and drivers of chromophoric and fluorescent properties. Front. Mar. Sci. 7, 126. doi: 10.3389/fmars.2020.00126
Bai Y., Pan D., Cai W.-J., He X., Wang D., Tao B., et al. (2013). Remote sensing of salinity from satellite-derived CDOM in the Changjiang river dominated East China Sea. J. Geophysical Research: Oceans 118, 227–243. doi: 10.1029/2012JC008467
Burdige D. J., Kline S. W., Chen W. (2004). Fluorescent dissolved organic matter in marine sediment pore waters. Mar. Chem. 89, 289–311. doi: 10.1016/j.marchem.2004.02.015
Butman D., Raymond P. A., Butler K., Aiken G. (2012). Relationships between Δ14C and the molecular quality of dissolved organic carbon in rivers draining to the coast from the conterminous United States. Glob. Biogeochem. Cycles 26 (4). doi: 10.1029/2012GB004361
Carlson C. A., Hansell D. A. (2015). “DOM sources, sinks, reactivity, and budgets,” in Biogeochemistry of marine dissolved organic matter, 2nd ed. Eds. Hansell D. A., Carlson C. A. (Boston: Academic Press), 65–126.
Chang P. H., Isobe A. (2003). A numerical study on the Changjiang diluted water in the Yellow and East China Seas. J. Geophys. Res. C: Oceans 108, 15–11. doi: 10.1029/2002JC001749
Chen C.-T. A. (1988). Summer-winter comparisons of oxygen, nutrients and carbonates in the polar Seas. La mer 26, 1–11.
Chen C.-T. A. (2009). Chemical and physical fronts in the Bohai, Yellow and East China Seas. J. Mar. Syst. 78, 394–410. doi: 10.1016/j.jmarsys.2008.11.016
Chen C.-T. A., Huang T.-H., Wu C.-H., Yang H., Guo X. (2021). Variability of the nutrient stream near kuroshio’s origin. Sci. Rep. 11, 5080. doi: 10.1038/s41598-021-84420-5
Coble P. G. (2007). Marine optical biogeochemistry: the chemistry of ocean color. Chem. Rev. 107, 402–418. doi: 10.1021/cr050350+
Han H., Na T., Cho H.-M., Kim G., Hwang J. (2022). Large Fluxes of continental-shelf-borne dissolved organic carbon in the East China Sea and the Yellow Sea. Mar. Chem. 240, 104097. doi: 10.1016/j.marchem.2022.104097
Hansell D. A. (2005). Dissolved organic carbon reference material program. Eos Trans. Am. Geophysical Union 86, 318–318. doi: 10.1029/2005EO350003
Hansen A. M., Kraus T. E. C., Pellerin B. A., Fleck J. A., Downing B. D., Bergamaschi B. A. (2016). Optical properties of dissolved organic matter (DOM): Effects of biological and photolytic degradation. Limnology Oceanography 61, 1015–1032. doi: 10.1002/lno.10270
Helms J. R., Stubbins A., Ritchie J. D., Minor E. C., Kieber D. J., Mopper K. (2008). Absorption spectral slopes and slope ratios as indicators of molecular weight, source, and photobleaching of chromophoric dissolved organic matter. Limnology Oceanography 53, 955–969. doi: 10.4319/lo.2008.53.3.0955
Hopkinson C. S., Buffam I., Hobbie J., Vallino J., Perdue M., Eversmeyer B., et al. (1998). Terrestrial inputs of organic matter to coastal ecosystems: An intercomparison of chemical characteristics and bioavailability. Biogeochemistry 43, 211–234. doi: 10.1023/A:1006016030299
Hur H. B., Jacobs G. A., Teague W. J. (1999). Monthly variations of water masses in the Yellow and East China Seas, November 6, 1998. J. Oceanography 55, 171–184. doi: 10.1023/A:1007885828278
Ichikawa H., Beardsley R. C. (2002). The current system in the Yellow and East China Seas. J. Oceanography 58, 77–92. doi: 10.1023/A:1015876701363
Kim J., Cho H.-M., Kim G. (2015). 228Ra flux in the northwestern Pacific marginal Seas: Implications for disproportionally large submarine groundwater discharge. Ocean Sci. J. 50, 195–202. doi: 10.1007/s12601-015-0015-3
Kim J., Cho H.-M., Kim G. (2018). Significant production of humic fluorescent dissolved organic matter in the continental shelf waters of the northwestern Pacific Ocean. Sci. Rep. 8, 4887. doi: 10.1038/s41598-018-23299-1
Kim K.-R., Kim K. (1996). What is happening in the East Sea (Japan sea)?: recent chemical observations during CREAMS 93-96. J. Korean Soc. Oceanography 31, 164–172.
Kim J., Kim G. (2015). Importance of colored dissolved organic matter (CDOM) inputs from the deep sea to the euphotic zone: results from the East (Japan) Sea. Mar. Chem. 169, 33–40. doi: 10.1016/j.marchem.2014.12.010
Kim J., Kim G. (2016). Significant anaerobic production of fluorescent dissolved organic matter in the deep East Sea (Sea of Japan). Geophysical Res. Lett. 43, 7609–7617. doi: 10.1002/2016GL069335
Kim K., Kim K.-R., Kim Y.-G., Cho Y.-K., Kang D.-J., Takematsu M., et al. (2004). Water masses and decadal variability in the East Sea (Sea of Japan). Prog. Oceanography 61, 157–174. doi: 10.1016/j.pocean.2004.06.003
Kim J., Kim T.-H., Park S. R., Lee H. J., Kim J. K. (2020). Factors controlling the distributions of dissolved organic matter in the East China Sea during summer. Sci. Rep. 10, 11854. doi: 10.1038/s41598-020-68863-w
Kim G., Ryu J.-W., Yang H.-S., Yun S.-T. (2005). Submarine groundwater discharge (SGD) into the Yellow Sea revealed by 228Ra and 226Ra isotopes: Implications for global silicate fluxes. Earth Planetary Sci. Lett. 237, 156–166. doi: 10.1016/j.epsl.2005.06.011
Lawaetz A. J., Stedmon C. A. (2009). Fluorescence intensity calibration using the raman scatter peak of water. Appl. Spectrosc. 63, 936–940. doi: 10.1366/000370209788964548
Lee S. A., Kim T. H., Kim G. (2020). Tracing terrestrial versus marine sources of dissolved organic carbon in a coastal bay using stable carbon isotopes. Biogeosciences 17, 135–144. doi: 10.5194/bg-17-135-2020
Lee H., Kim G., Kim J., Park G., Song K.-H. (2014). Tracing the flow rate and mixing ratio of the Changjiang diluted water in the northwestern Pacific marginal seas using radium isotopes. Geophysical Res. Lett. 41, 2014GL060230. doi: 10.1002/2014GL060230
Lee J.-H., Pang I.-C., Jae-Hong M. (2016). Contribution of the Yellow Sea Bottom Cold Water to the abnormal cooling of sea surface temperature in the summer of 2011. J. Geophys. Res.: Oceans 121, 3777–3789. doi: 10.1002/2016JC011658
Li X., Wang X., Chu P. C., Zhao D. (2015). Low-frequency variability of the Yellow Sea cold water mass identified from the China coastal waters and adjacent Seas reanalysis. Adv. Meteorology 2015, 269859. doi: 10.1155/2015/269859
Miller M. P., Mcknight D. M., Chapra S. C., Williams M. W. (2009). A model of degradation and production of three pools of dissolved organic matter in an alpine lake. Limnology Oceanography 54, 2213–2227. doi: 10.4319/lo.2009.54.6.2213
Murphy K. R., Stedmon C. A., Graeber D., Bro R. (2013). Fluorescence spectroscopy and multi-way techniques. PARAFAC. Analytical Methods 5, 6557–6566. doi: 10.1039/c3ay41160e
Murphy K. R., Stedmon C. A., Wenig P., Bro R. (2014). OpenFluor- an online spectral library of auto-fluorescence by organic compounds in the environment. Analytical Methods 6, 658–661. doi: 10.1039/C3AY41935E
Nelson N. B., Siegel D. A. (2013). The global distribution and dynamics of chromophoric dissolved organic matter. Annu. Rev. Mar. Sci. 5, 447–476. doi: 10.1146/annurev-marine-120710-100751
Nozaki Y., Tsubota H., Kasemsupaya V., Yashima M., Naoko I. (1991). Residence times of surface water and particle-reactive 210Pb and 210Po in the East China and Yellow Seas. Geochimica Cosmochimica Acta 55, 1265–1272. doi: 10.1016/0016-7037(91)90305-O
Ogawa H., Usui T., Koike I. (2003). Distribution of dissolved organic carbon in the East China Sea. Deep Sea Res. Part II: Topical Stud. Oceanography 50, 353–366. doi: 10.1016/S0967-0645(02)00459-9
Ren P., Luo C., Zhang H., Schiebel H., Hastings M. G., Wang X. (2022). Atmospheric particles are major sources of aged anthropogenic organic carbon in marginal Seas. Environ. Sci. Technol. 56, 14198–14207. doi: 10.1021/acs.est.2c06321
Romera-Castillo C., Sarmento H., Álvarez-Salgado X. A., Gasol J. M., Marrasé C. (2011). Net production and consumption of fluorescent colored dissolved organic matter by natural bacterial assemblages growing on marine phytoplankton exudates. Appl. Environ. Microbiol. 77, 7490–7498. doi: 10.1128/AEM.00200-11
Stedmon C. A., Nelson N. B. (2015). “The optical properties of DOM in the ocean,” in Biogeochemistry of marine dissolved organic matter, 2nd ed. Eds. Hansell D. A., Carlson C. A. (Boston: Academic Press), 481–508.
Tomczak M., Large D. G. B. (1989). Optimum multiparameter analysis of mixing in the thermocline of the eastern Indian ocean. J. Geophys. Res. 94, 16141–16149. doi: 10.1029/JC094iC11p16141
Walker S. A., Amon R. M. W., Stedmon C. A. (2013). Variations in high-latitude riverine fluorescent dissolved organic matter: A comparison of large Arctic rivers. J. Geophys. Res.: Biogeosci. 118, 1689–1702. doi: 10.1002/2013JG002320
Wang B., Hirose N., Kang B., Takayama K. (2014). Seasonal migration of the Yellow Sea Bottom Cold Water. J. Geophysical Research: Oceans 119, 4430–4443. doi: 10.1002/2014JC009873
Wang X., Ma H., Li R., Song Z., Wu J. (2012). Seasonal fluxes and source variation of organic carbon transported by two major Chinese rivers: The Yellow river and Changjiang (Yangtze) river. Global Biogeochemical Cycles 26, GB2025. doi: 10.1029/2011GB004130
Wang R., Zuo T., Wang K. (2003). The Yellow Sea Cold Bottom Water–an oversummering site for calanus sinicus (Copepoda, Crustacea). J. Plankton Res. 25, 169–183. doi: 10.1093/plankt/25.2.169
Yamashita Y., Tosaka T., Bamba R., Kamezaki R., Goto S., Nishioka J., et al. (2020). Widespread distribution of allochthonous fluorescent dissolved organic matter in the intermediate water of the North Pacific. Prog. Oceanography 191, 102510. doi: 10.1016/j.pocean.2020.102510
Yu M., Guo Z., Wang X., Eglinton T. I., Yuan Z., Xing L., et al. (2018). Sources and radiocarbon ages of aerosol organic carbon along the east coast of China and implications for atmospheric fossil carbon contributions to China marginal Seas. Sci. Total Environ. 619-620, 957–965. doi: 10.1016/j.scitotenv.2017.11.201
Zhang L., Liu Z., Zhang J., Hong G. H., Park Y., Zhang H. F. (2007). Reevaluation of mixing among multiple water masses in the shelf: An example from the East China Sea. Continental Shelf Res. 27, 1969–1979. doi: 10.1016/j.csr.2007.04.002
Zhang X., Sun Z., Fan D., Xu C., Wang L., Zhang X., et al. (2019). Compositional characteristics and sources of DIC and DOC in seawater of the Okinawa trough, East China Sea. Continental Shelf Res. 174, 108–117. doi: 10.1016/j.csr.2018.12.014
Keywords: dissolved organic matter (DOM), chromophoric dissolved organic matter (CDOM), fluorescent dissolved organic matter (FDOM), parallel factor analysis (PARAFAC), marginal seas, optimum multi-parameter analysis
Citation: Han H, Kim HB, Kim J, Kim G, Hwang J and Nam S (2023) Dissolved organic matter in the northwestern Pacific marginal seas: Insight into the distribution of its optical properties. Front. Mar. Sci. 10:1127803. doi: 10.3389/fmars.2023.1127803
Received: 20 December 2022; Accepted: 09 February 2023;
Published: 09 March 2023.
Edited by:
Liyang Yang, Fuzhou University, ChinaCopyright © 2023 Han, Kim, Kim, Kim, Hwang and Nam. This is an open-access article distributed under the terms of the Creative Commons Attribution License (CC BY). The use, distribution or reproduction in other forums is permitted, provided the original author(s) and the copyright owner(s) are credited and that the original publication in this journal is cited, in accordance with accepted academic practice. No use, distribution or reproduction is permitted which does not comply with these terms.
*Correspondence: Jeonghyun Kim, ZTkyNzkxM0BnbWFpbC5jb20=