 Julika Voß1*
 Armin Rose1
 Vladislav Kosarev1Raúl Vílela1
 Ilse Catharina van Opzeeland2,3†
 Ansgar Diederichs1†
- 1BioConsult SH GmbH & Co. KG, Husum, Germany
- 2Ocean Acoustics Group, Alfred Wegener Institute Helmholtz Centre for Polar and Marine Research, Bremerhaven, Germany
- 3Helmholtz Institute for Functional Marine Biodiversity, Carl Von Ossietzky University Oldenburg, Oldenburg, Germany
Before piling of offshore wind farm foundations, acoustic harassment devices (AHDs) are used to drive harbor porpoises out of the area where they could suffer injuries. Until 2017, a combination of pingers and seal scarer devices (usually SPL = 174-193 dB re 1 μPa (rms) @ 1m at 1 to 20 kHz depending on the device) was prescribed for mitigation purposes in Germany. However, seal scarers led to decreased porpoise detection rates in much larger distances than intended, when 750 m is usually rendered sufficient to avoid injuries. Therefore, devices specifically designed for mitigation purposes were developed and are prescribed since then. These acoustic porpoise deterrents (APDs; e.g. FaunaGuard Porpoise Module; SPL = 172 dB re 1 μPa (rms) @ 1m at 60 to 150 kHz) aim to keep the animals away from offshore construction sites but should not lead to large-scale disturbance as caused by a seal scarer. Although project-specific evaluations indicated that APDs are effective, a cross-project analysis and a comparison with data from previous piling procedures employing seal scarers were still pending. The present study aimed to fill this gap. Between March 2018 and April 2019, harbor porpoise detection rates were monitored acoustically in four offshore wind farm projects using CPODs before, during and after piling at different distances up to 10 km from piling. APD operation led to a significant decrease in detection rates in the vicinity of the device, indicating the displacement of the animals from a small-scale area. Depending on the wind farm, detection rates during APD operation decreased by 30 to 100% at 750 m distance compared to 6 hours before APD operation. Furthermore, reduced detection rates during APD operation were only observed up to about 2.5 km distance even when the APD was switched on for over 40 minutes. Given that the extent of disturbance to harbor porpoises is lower when using an acoustic porpoise deterrent compared to the seal scarer, we consider that preferential use of an acoustic porpoise deterrent is an improvement to mitigation strategies and an important step forward to a less harmful piling procedure.
1 Introduction
The harbor porpoise (Phocoena phocoena L., 1758) is the most common cetacean in the continental shelf waters of north-western Europe (Hammond et al., 2013; Hammond et al., 2017). An estimated 345,000 animals live in the North Sea (Hammond et al., 2017). The German Bight, where all offshore wind farms considered in this study are located, is known to be a region of relatively high porpoise density (Gilles et al., 2009; Peschko et al., 2016).
Underwater noise in general can affect the individual fitness and structure of ecological communities (Southall et al., 2007; Southall et al., 2019). At sites with strong ambient noise from shipping or high wind speeds, operating offshore wind turbines generate noise that is significantly below the ambient level, except in the immediate vicinity of the individual turbines (Tougaard et al., 2020). The piling of this foundation into the seabed, however, can generate considerable noise during construction. Even though marine mammals show an individual response with respect to noise, harbor porpoises generally move away from loud construction activities at offshore wind farms (Johnston, 2002; Olesiuk et al., 2002; Brandt et al., 2013b). Apart from the influence on behavior, pile driving can emit such high sound source levels that the animals may suffer from temporary hearing-threshold shifts (TTS), permanent hearing-threshold shifts (PTS), or even death if present in the immediate vicinity of the sound source (Tougaard et al., 2015; Tougaard et al., 2022).
To minimize the effects of noise emissions, compliance with a dual noise protection criterion is mandatory in Germany (Bundesministerium für Umwelt, Naturschutz und Reaktorsicherheit, 2013): In Germany, the sound exposure level (SEL05) must stay below 160 dB re 1 µPa² s, and the peak level (LPeak) below 190 dB re 1 µPa at a distance of 750 m from piling locations. Due to the ongoing development of noise abatement systems (NAS), many construction projects now comply with these limits.
Additional to noise reduction at the source, the German Federal Maritime and Hydrographic Agency demands a standardized deterrence procedure before the start of pile driving, to scare harbor porpoises away from the immediate range of the source where the animals could suffer TTS or PTS. For this purpose, acoustic harassment devices (AHDs) are used, which emit acoustic signals 30 to 60 minutes before construction works begin.
Until 2017, the “seal scarer” was mandated as the preferred AHD for mitigation purposes in Germany. Depending on the device, this kind of AHD usually emits acoustic signals with a sound pressure level (SPL) between 174 and 193 dB re 1 μPa (rms) @ 1m in a frequency range between 1 and 20 kHz (e. g. Kastelein et al., 2015; Götz and Janik, 2016). Seal scarers were primarily developed to reduce economic losses at fish farms due to seal predation (Fjälling et al., 2006; Graham et al., 2009; Harris et al., 2014). However, seal scarers were also shown to affect harbor porpoises and were therefore used to deter these animals from the immediate area before piling begins (Brandt et al., 2013a).
Studies have shown that when using a seal scarer, sighting rates of harbor porpoises within 1 km distance from the device decreased significantly to only 1% of pre-exposure sighting rates, but acoustic detections even showed a significant deterrent effect up to 7.5 km away and thus over a much larger range than intended (Brandt et al., 2013a; Brandt et al., 2013b). The seal scarer also appears to have the potential to induce a TTS, so it became questionable whether its application was appropriate for noise mitigation (Schaffeld et al., 2019).
Due to this adverse characteristic of the seal scarer, devices specifically designed for mitigation purposes, such as the FaunaGuard Porpoise module (van der Meij et al., 2015), were developed and have been recommended for deterrence purposes in Germany since then. These acoustic porpoise deterrents (APDs) aim to safely and temporarily deter all harbor porpoises from a radius of 750 m around the piling location before the start of noise-intensive pile driving, but were intended not to lead to large-scale disturbance as produced by the seal scarer.
APDs emit acoustic signals at higher frequencies (e.g. FaunaGuard Porpoise Module; SPL = 172 dB re 1 μPa (rms) @ 1m at 60 to 150 kHz) than a seal scarer. In this frequency range, harbor porpoises are most sensitive, so that a relatively low sound intensity suffices for deterrence (van der Meij et al., 2015). Accordingly, a porpoise response threshold of 86 dB re 1 μPa was observed for acoustic signals from the FaunaGuard Porpoise Module (Kastelein et al., 2017). At this or a higher SPL, the distance of harbor porpoises from the APD was significantly larger than without AHD operation, and the porpoises thus appeared to have left the immediate vicinity of the source. Furthermore, due to stronger propagation loss of high-frequency signals, the spatial range of the deterrent effect should be significantly shorter than that of a seal scarer (Erbe et al., 2022). By using a “ramp-up” function, the source amplitude is gradually increased in the first five minutes after onset of the signal to avoid a sudden exposure to the full volume (van der Meij et al., 2015). In addition, the FaunaGuard Porpoise module uses eight different complex signal sequences to minimise potential habituation effects.
This study is the first cross-project analysis on how harbor porpoises respond to APDs and subsequent piling during the construction of offshore wind farms in the North Sea at distances up to 10 km, in comparison to effects of the seal scarer as AHD.
2 Materials and methods
2.1 Study area
This study is based on data collected at four offshore wind farms (OWFs) constructed in 2018 and 2019 under operation of an APD as AHD in the German Bight, North Sea. For these OWFs, 207 monopiles, serving as foundations for the offshore wind turbines, were piled into the seabed.
Data were collected at the OWFs Borkum Riffgrund 2, Deutsche Bucht, EnBW Hohe See and Albatros, as well as Trianel Windpark Borkum Phase 2 (geographic positions in Figure 1).
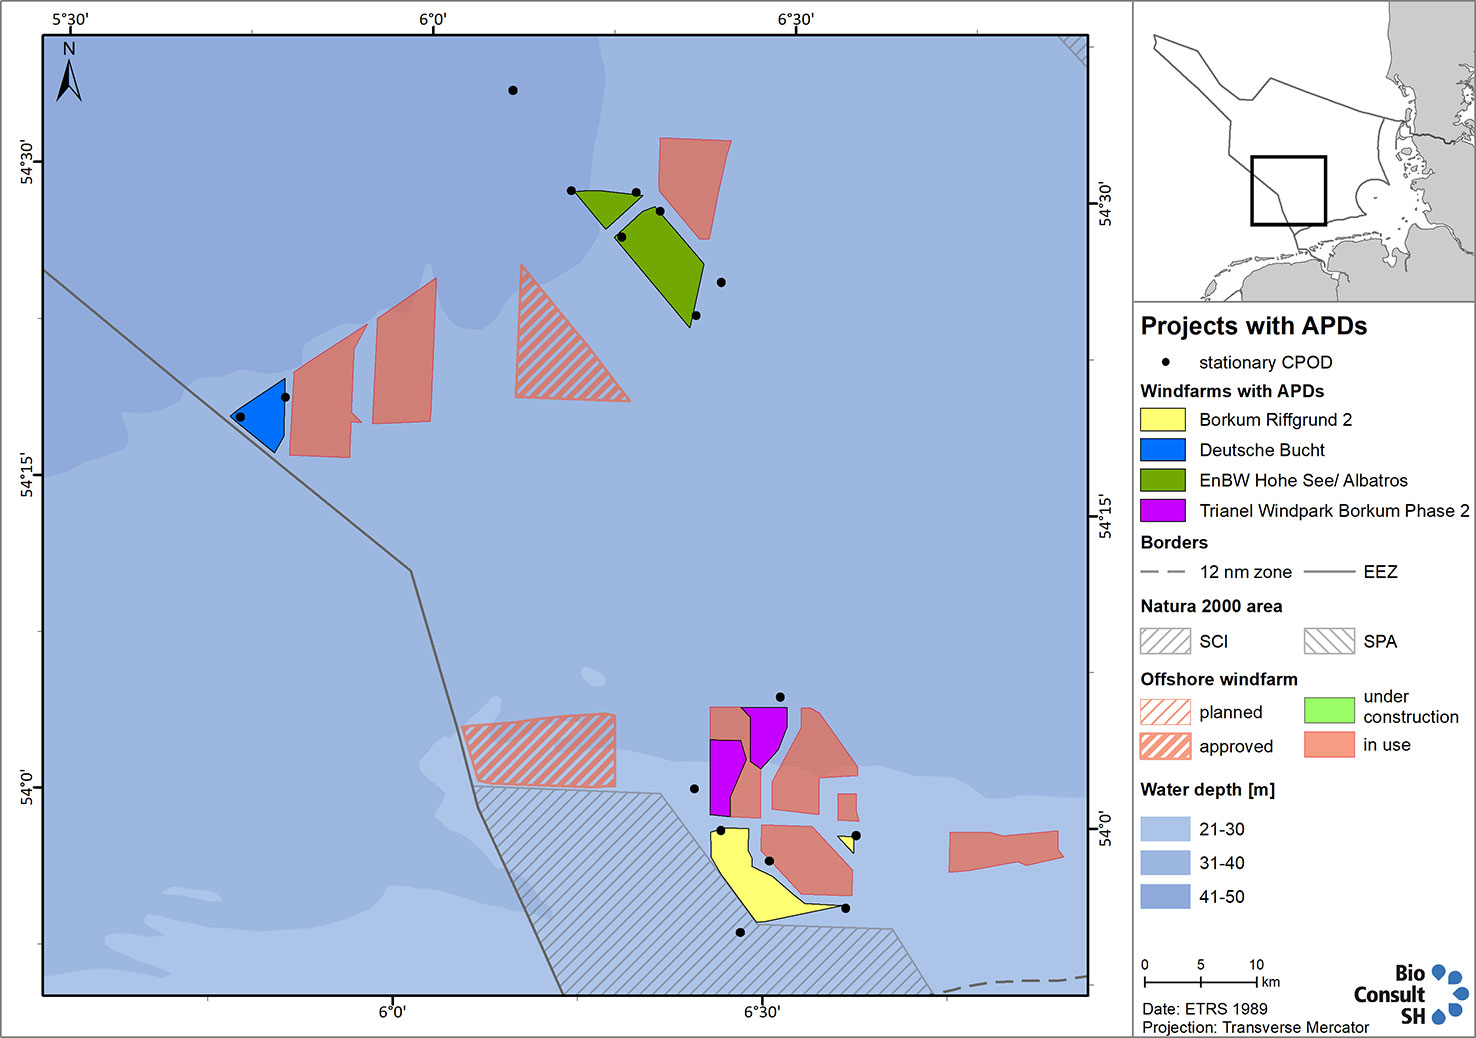
Figure 1 Map of the German Bight showing the locations of the investigated offshore wind farms in the coloured wind farm areas. Positions of stationary CPODs are shown as black dots. Additionally, during pile-driving for 187 of the 207 monopiles, mobile CPODs were deployed at fixed distances of 750 m and 1500 m to the piling location. APDs were always deployed directly at the piling location.
2.2 Acoustic data collection
Data on harbor porpoise acoustic presence at distances up to 10 km around piling sites were collected using CPODs (Chelonia Limited, 2023b). CPODs are able to register porpoise echolocation clicks up to a maximum detection range of 400 m (Chelonia Limited, 2023b), but the mean distance of detected harbor porpoise clicks is assumed to be within the range of 100 to 200 m (N. Tregenza, personal communication, November 28, 2022). Clausen et al. (2019) measured very low false-positive rates. Since porpoises use their echolocation system almost continuously (Akamatsu et al., 2007; Wisniewska et al., 2016), satellite telemetry was found to be adequate to provide comparable information on the relative distribution patterns of harbor porpoises as a network of CPODs, even for areas of low density (Mikkelsen et al., 2016). Also, visual observations showed that there was a strong correlation between CPOD detection rates and harbor porpoise density (Koschinski et al., 2003; Kyhn et al., 2012; Williamson et al., 2016). During seal scarer operation and subsequent piling, harbor porpoises are not expected to change their vocal behavior, but to be displaced (Brandt et al., 2013b; Haelters et al., 2015). Captive harbor porpoises did not change their vocal behavior when different high-frequency sounds were played back, except for the first exposure (Teilmann et al., 2006), and wild harbor porpoises in Canada even increased echolocation activity when wind turbine sounds were played (Koschinski et al., 2003). For the APD as the AHD, harbor porpoises also do not seem to change their vocal behavior (Kastelein et al., 2017). Therefore, acoustic detections were considered to be a good indication of harbor porpoise presence.
During the construction monitoring, a total of 16 stations at the borders of the wind farms were continuously equipped with CPODs at distances up to 10 km around piling sites from at least 4 days before the first piling until 1 day after the last piling (Figure 1). For these stationary CPODs, the scan limit was set at 4,096 clicks per minute to prevent the SD card memory from filling up with background noise before the next service took place. Once this value was reached, the stationary CPODs did not record any subsequent clicks in the remaining seconds of this minute and started again to register clicks in the next minute.
Additionally, during pile-driving for 187 of 207 monopiles, mobile CPODs were deployed from a few hours before to a few hours after each piling at fixed distances of 750 m and 1500 m to the construction sites to monitor the effectiveness of the deterrent measures. For these mobile CPODs, no scan limit was set as they were deployed only for a few hours with the intention to record all sounds during this period. For 8.3% of mobile CPOD data, the number of clicks per minute thus exceeded 4096.
All CPODs were anchored to the seabed with a mooring system and maintained in the water column by a buoy. The devices were operating at a depth of 5 to 10 m above the seafloor. To obtain equal sensitivity thresholds between CPODs, all instruments were calibrated by the manufacturer prior to their first deployment (Chelonia Limited, 2023a). Therefore, CPODs were rotated in a hypo-echoic temperature-controlled underground test tank to measure radial uniformity and to set each unit to the same standard sensitivity. Calibration was conducted using the main frequency of harbor porpoise click sounds (calibration at 125 kHz, CPOD sensitivity thresholds ± 3 dB).
2.3 Statistical analyses
When processing the CPOD memory card, the software CPOD.exe (version 2.045) with the algorithm “KERNO classifier” was used to detect clicks from harbor porpoises. Only clicks that were clearly classified as originating from harbor porpoises, those with the quality “high” or “moderate”, were included into the analyses.
Statistical analyses were conducted using the software R version 4.0.1 (R Core Team, 2020). To obtain a homogeneous data set, we excluded from the analyses: (1) eleven pilings from different wind farms that exceeded the dual noise protection criterion in Germany; (2) three piling operations with seal scarer as AHD from the OWF Trianel Windpark Borkum Phase 2 (only considered for the effectiveness comparisons between APD and seal scarer). In this way, data sets were kept consistent and not influenced by outliers.
2.3.1 Detection parameters
The response parameter used in the analysis was the number of minutes with porpoise click trains (“Detection Positive Minutes”, DPM). Because the duration of the APD and piling phases differed, detection rates were standardized to %DPM/phase for each phase. This variable was computed by dividing the sum of DPM per phase by the duration of the phase in minutes and multiplying by 100 to get the percentage. Minutes during which the scan limit was reached were excluded from analyses to consider only complete minutes.
2.3.2 Piling phase classification
Five piling phases were defined in order to assess differences in harbor porpoise detections rates %DPM/phase among different periods of the construction process: The period after deploying the mobile CPODs and before the start of the APD was defined as Phase 1 (before APD operation). It covered on average 6 hours. Based on the availability of mobile CPODs and to make data comparable, Phase 1 of stationary CPODs was also defined as ranging until 6 hours before the start of the APD. Phase 2 was defined as the time between the start of the APD until the start of the piling, while Phase 3 was the actual pile driving time. Phase 4 was defined as the time after the piling activity and before recovering the device, covering on average 3 hours for mobile CPODs. Accordingly, Phase 4 for stationary CPODs was defined as lasting until 3 hours after piling. In addition, a reference phase for stationary CPODs was considered, combining the periods from 48 to 72 hours after last piling (condition: at least 24 hours before deterrence of the next piling within a 10 km range) as well as 48 to 24 hours before deterrence of the next piling (condition: at least 48 hours after last piling within a 10 km range).
2.3.3 Evaluation of short-range effects
For evaluating short-range effects, Bayesian proportion tests were conducted, and Boosted Regression Tree (BRT) models were created.
Bayesian proportion tests were performed to analyze whether detection rates differed significantly among the phases for all OWFs combined as well as the individual wind farms. This statistical test was chosen as (1) neither the user nor the test makes any prior assumptions about the distribution of the data, (2) multiple testing does not lead to significances by chance (false positives) instead of actual significances, and (3) not only medians or mean values and standard deviations are compared, but Bayesian proportion tests look for the probability that the median of one phase is within the 95% confidence interval of another phase (Makowski et al., 2019; Sjölander and Vansteelandt, 2019). In all cases, the null hypothesis was rejected for p-values less than 0.05 and a post-hoc analysis was conducted. A significant difference was observed between two phases if the probability of the median of one phase being within the 95% confidence interval of another phase was below 5% (Kruschke, 2011).
BRT models were created to investigate when detections occurred during APD operation at a short range (R code in Data Sheet 1). This kind of modeling is stochastic which improved prediction performance (Elith et al., 2008). For creating the BRT models, three distance classes were studied (0-750 m, 751-1,500 m, 1,501-2,500 m). %DPM/phase served as response variable describing whether or not a porpoise detection occurred within one minute (Supplemental Table 1). For a reliable sample size, data were only analyzed if at least 20 minutes of the response variable Minutes_after_onset_of_APD were recorded for the corresponding distance class. In this way, we ensured that the data originated from different wind farms and not only from one wind farm where the APD was generally switched on for the longest time. The bag fraction was set to 0.5 and the learning rate was set to 0.01. Tree complexity was set to 5 since the probability of detection was considerably lower than the probability of no detection. Models were equipped with at least 1000 trees. The results for each distance class were presented in Partial Dependence Plots. These indicated changes in the predicted mean value if one parameter, in this case Minutes_after_onset_of_APD, varied while the other parameters remained constant. The variable Minutes_after_onset_of_APD described the minute of APD deployment ranging from the start of the APD (minute +1 on the x axis) until the start of piling, or until the end of APD operation if the APD was switched off before piling started. The mean value of the data distribution was always centered at zero. Positive values on the y-axis therefore indicated that the detection rates increased compared to the mean value. Negative values indicated a decrease in detection rates. In addition, the relative contribution of each variable (explained in Supplemental Table 1) to the BRT was shown for each distance class in order to be able to assess the relative influence of the variable Minutes_after_onset_of_APD on the model.
2.3.4 Evaluation of long-range effects
For evaluating the long-range effects, we explored how %DPM/phase differed between the phases at the following distance classes: 0-2,500 m, 2,501-5,000 m, 5,001-7,500 m, and 7,501-10,000 m. Effects were assessed for all OWFs combined.
In addition to evaluating the raw data, a Generalized Additive Model (GAM) was conducted in order to analyze the overall effect range of the APD. This type of model was chosen because GAMs do not require a normal distribution of data points and no parametric form of the function has to be specified (Wood, 2017). Since the data sets were large, the bam() function of the R package mgcv (Wood, 2015) was used.
DPM served as the response variable (Supplemental Table 1). Explanatory variables of primary interest were the tensor product of the variables Minutes_after_onset_of_APD and Distance_to_APD, the latter describing the distance to the APD.
The GAM included the combined data of all wind farms. Only distances up to 10 km were considered here as data became sparser and environmental heterogeneity more and more an issue at larger distances. Besides, a time frame of minute +1 to +43 was considered, as only for this range sufficient data were available. No further models were created for individual wind farms due to the limited amount of data for each.
Different piling- and noise-related, time-related, environmental, as well as CPOD-related variables were available for the GAM (Supplemental Table 1). The environmental variables were modeled on the surface. Environmental variables on a time-related basis were excluded, as the data set was on a minutely basis and the variables were on an hourly basis or more.
Collinearity between variables can greatly distort model estimates (Dormann et al., 2013). For variables with collinearity above 0.5, the biologically more reasonable variable was retained and the other eliminated. In the case of sand eels, the average value of four different species was considered first and then the best model was used to evaluate whether a single species rather than the average would fit better.
In addition to collinearity between variables, GAMs must also be tested for multicollinearity as this can negatively affect the estimated coefficients in multiple regression analyses (Mansfield and Helms, 1982). Multicollinearity can be estimated by computing the variance inflation factor (VIF) (Mansfield and Helms, 1982). All parameters included in the model after correlation analysis had a VIF of 1.15 or less. Other indicators of multicollinearity such as very high standard errors for regression coefficients or an overall significant model with no single significant coefficient were also examined. Overall, none of the analyses indicated a serious effect of multicollinearity in the GAMs.
GAMs assume that errors are identical and independently distributed. This assumption does not apply to time-series regression because current time series values are often strongly correlated with past values, so that model errors are also correlated (so-called temporal autocorrelation) (Pinheiro and Bates, 2000). In order to reduce autocorrelation, the variable DPMt, which equaled DPM in the previous minute, was added to the model as a proxy for autocorrelation.
Furthermore, random effects were included into the models: (1) the name of the wind farm (variable project), (2) the name of the CPOD station (variable station; only one dataset per station and minute was included in the analysis) – this variable was just defined for the stationary CPOD data, and (3) the ID of the pile (variable pile). In this way, it was corrected for effect differences due to factors like geographical location or specific characteristics of a piling. However, since a GAM is often faster and more reliable when the number of random effects is modest, only one random effect per GAM was used, and it was tested which random effect was most suitable (Wood, 2017).
To reduce the chance of overfitting, the smooths were modified to shrink to the zero function by using the select argument. The gamma value was set to 1.4, as recommended in literature (Wood, 2017).
At the beginning, a GAM was created using all parameters that were not highly correlated. Then, the parameter with the highest p-value was removed from the analysis step by step. The AIC value of the new model was compared with the AIC value of the previous model. If the AIC value of the new model was lower, the parameter with the highest p-value in the new model was removed. This process was repeated until the AIC value of the new model was higher than that of the previous model. The model with the lowest AIC value was considered to be the best explanatory model (Wood, 2017). However, the inclusion of additional parameters had to result in an AIC difference of more than two, otherwise the inclusion was considered poorly justified. The GAM with the best explanatory power used the same parameters as the BRT models.
2.3.5 AHD deployment trial
At the wind farm Trianel Windpark Borkum Phase 2, the APD did not work properly during three pilings, so that a seal scarer had to be used for deterrence. Although these pilings were necessarily excluded from all other analyses, they were of special interest here because they provided the chance to compare the effects of an APD to those of a seal scarer within the current study. As the data were collected at the same wind farm and over a similar period, piling conditions and construction processes were similar as well as most environmental parameters. Differences of %DPM/phase between the APD and the seal scarer dataset at distances of 5 to 10 km from the construction sites were explored.
3 Results
3.1 Short-range effects
At a short range (distances 750 m resp. 1,500 m), the detection rate %DPM/phase was low in general, mostly highest during Phase 1 (before APD operation) and lowest for Phase 2 (during APD operation) (Figure 2). Depending on the wind farm, detection rates decreased by 30 to 100% at 750 m distance and by 25 to 60% at 1,500 m distance when the APD was switched on. This decrease was significant in 750 m and 1,500 m distance for all wind farms except for EnBW Hohe See/Albatross at 750 m distance and Trianel Windpark Borkum Phase 2 at 1,500 m distance. During Phase 3 (during piling), detection rates inclined again, and increased further during Phase 4 (after piling). Depending on the wind farm, detection rates during Phase 4 increased again to 75 to 125% of the level of Phase 1 at 750 m distance and 89 to 107% at 1,500 m distance (exception: 0%DPM/phase in Phase 4 at wind farm Trianel Windpark Borkum Phase 2 at 1,500 m distance).
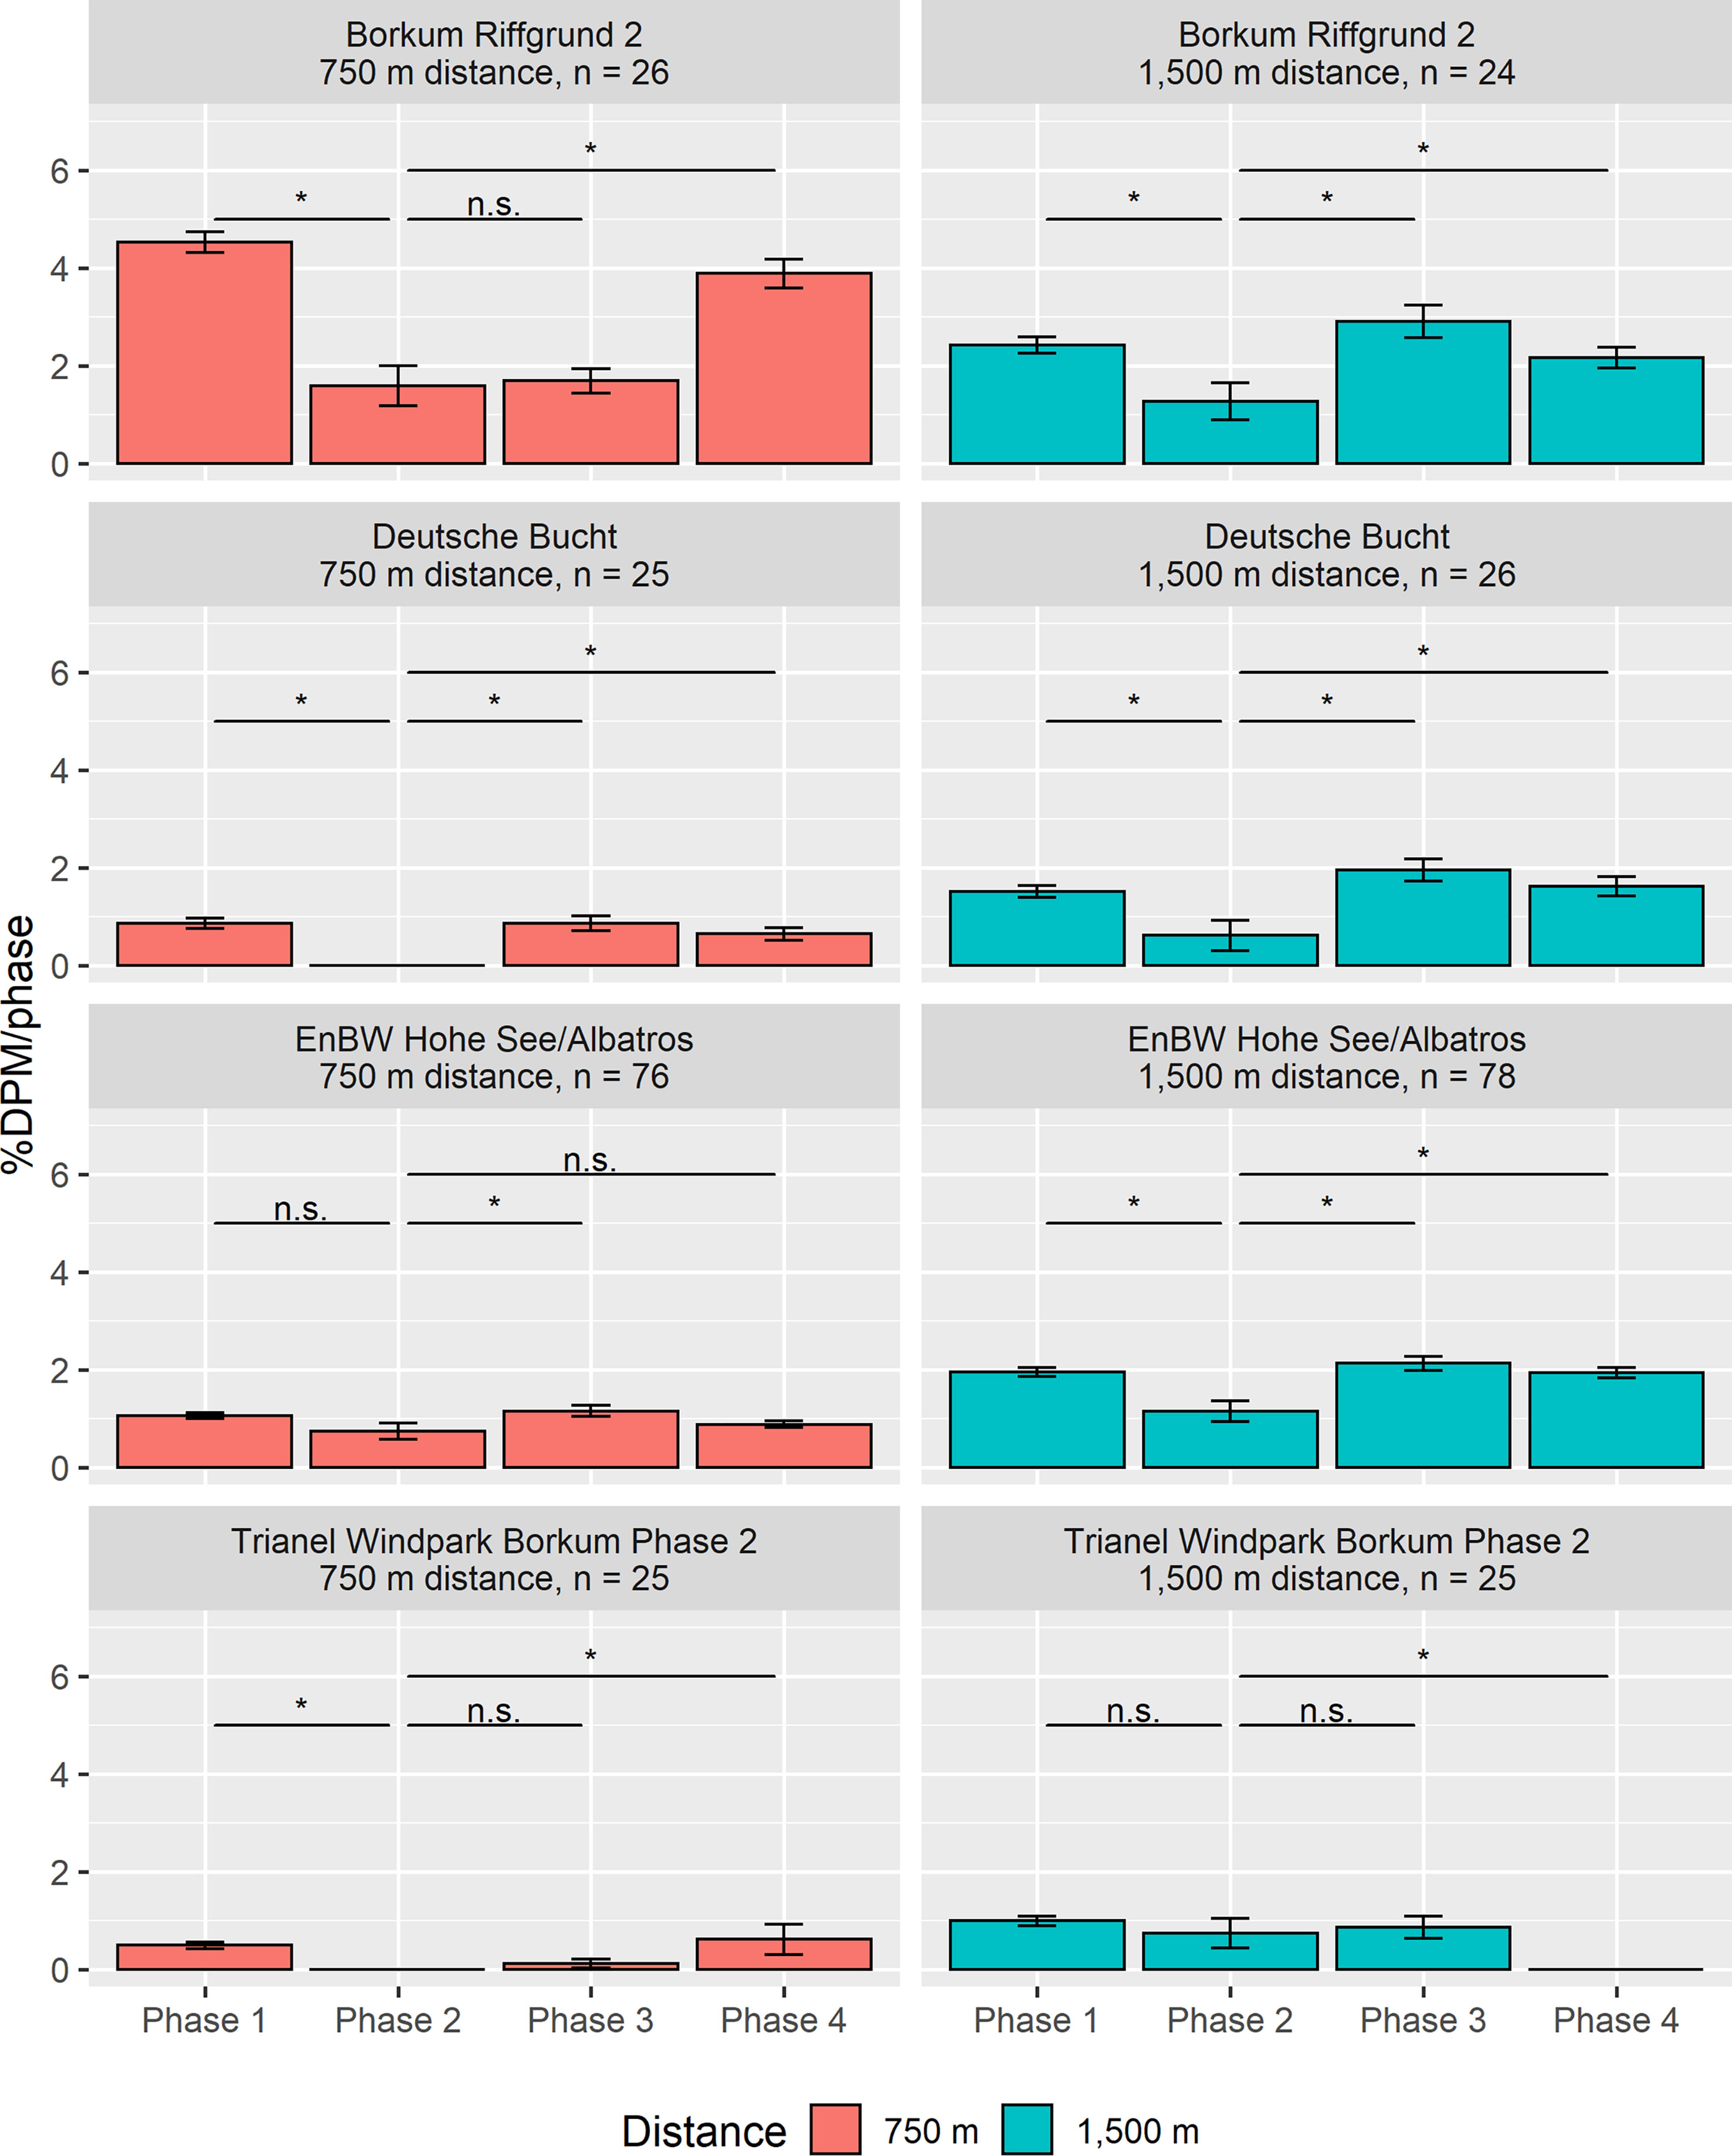
Figure 2 Mean and standard error of %DPM/phase of the individual OWF during the investigated phases at distances of 750 m respectively 1,500 km to the construction sites (some outliers not shown here); black rhombuses show mean values, n is the number of analyzed POD/pile combinations, and raw data are in Supplemental Table 3. A Bayesian proportion test showed a significant difference between the individual phases (test statistics in Supplemental Table 2); in this figure, the significance of the p-value between Phase 2 and the other phases is shown (Significance codes: [0] * [0.05] n. s. [0]).
Moreover, mean detection rates were higher at 1,500 m than at 750 m distance during most phases. Differences between both distance categories were strongest during Phase 3.
Regarding porpoise reactions during APD operation, both the raw data plot (Figure 3) and the Partial Dependence Plot (Figure 4) showed low detection rates in general. For the closest range (0 to 750 m distance), the detection rate declined until the APD was switched on for about 22 minutes. From minute 23 onwards until piling, the detection rate barely changed, i. e. harbor porpoise clicks were detected only sporadically, and the detection rate thus remained close to zero. Again, detection rates at these short distances were – though not at zero – already rather low when the APD was switched on, namely the detection rate decreased from about 1%DPM/phase to 0.
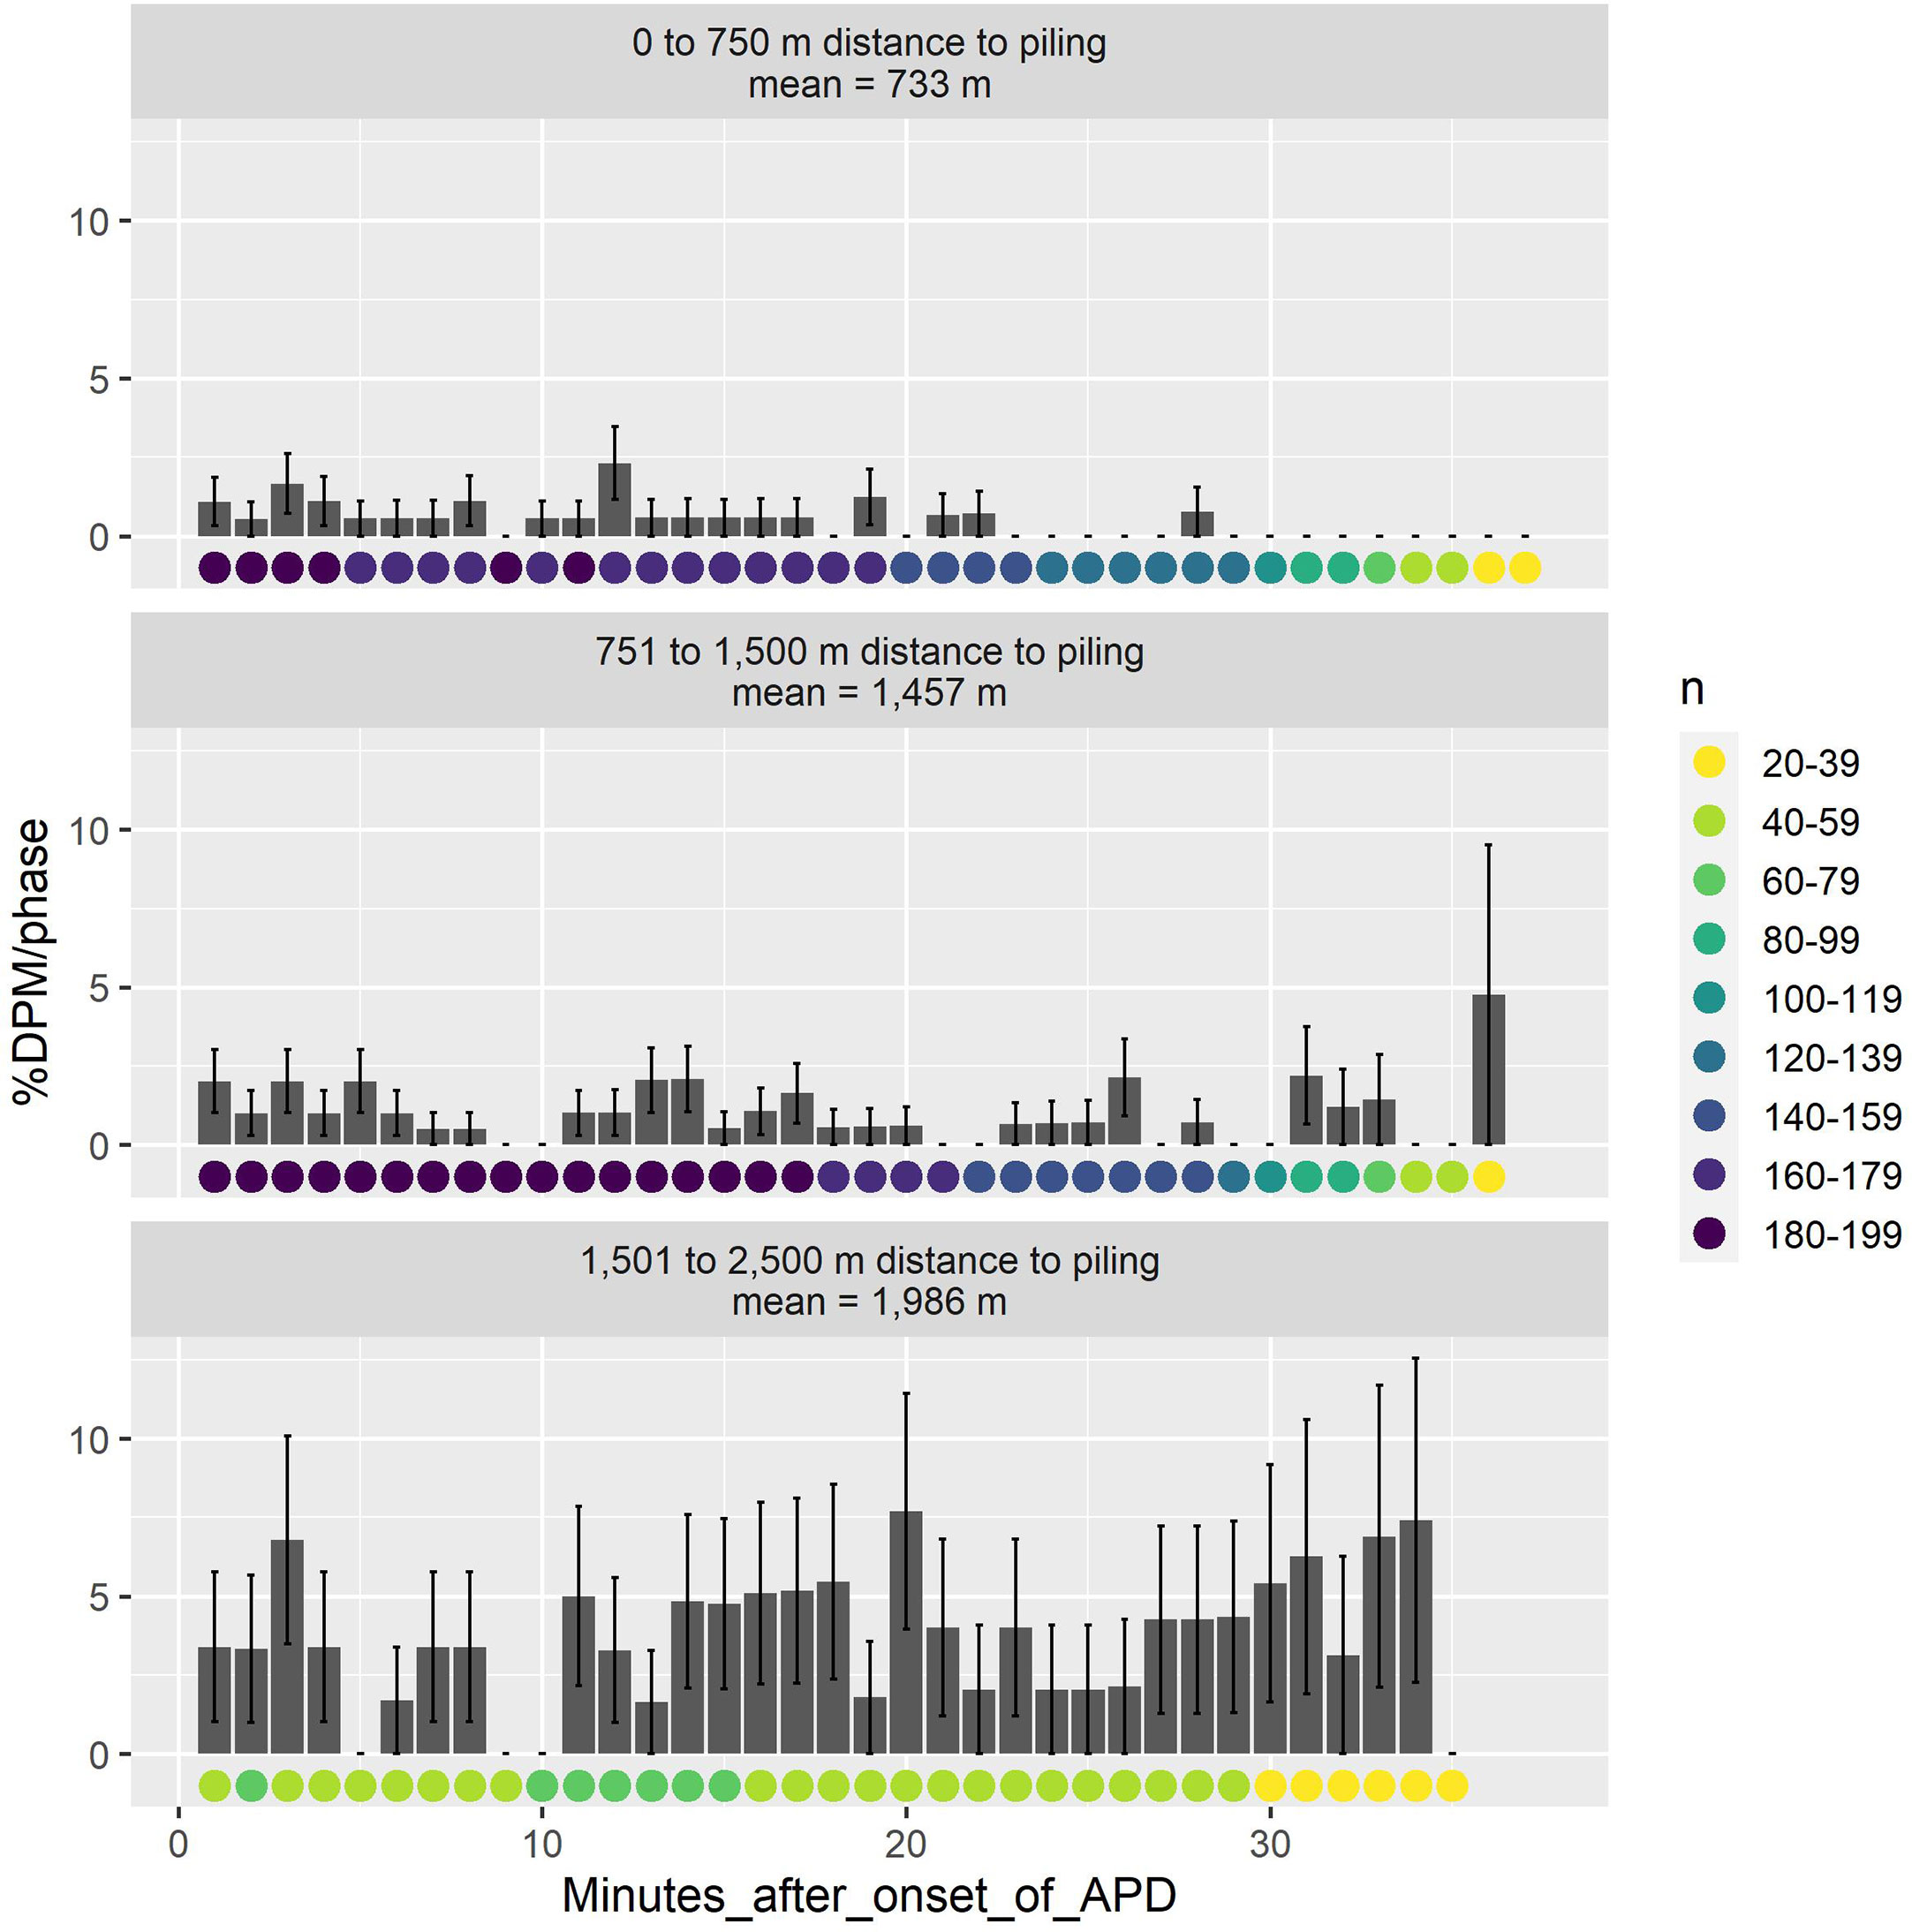
Figure 3 Development of %DPM/phase (mean and standard error) with ongoing APD operation in minutes (Minutes_after_onset_of_APD) at the distance classes 0-750, 751-1,500 and 1,501-2,500 m. The sample size n strongly decreases for minutes above 30, so data after this minute must be treated cautiously. Raw data are in Supplemental Table 4.
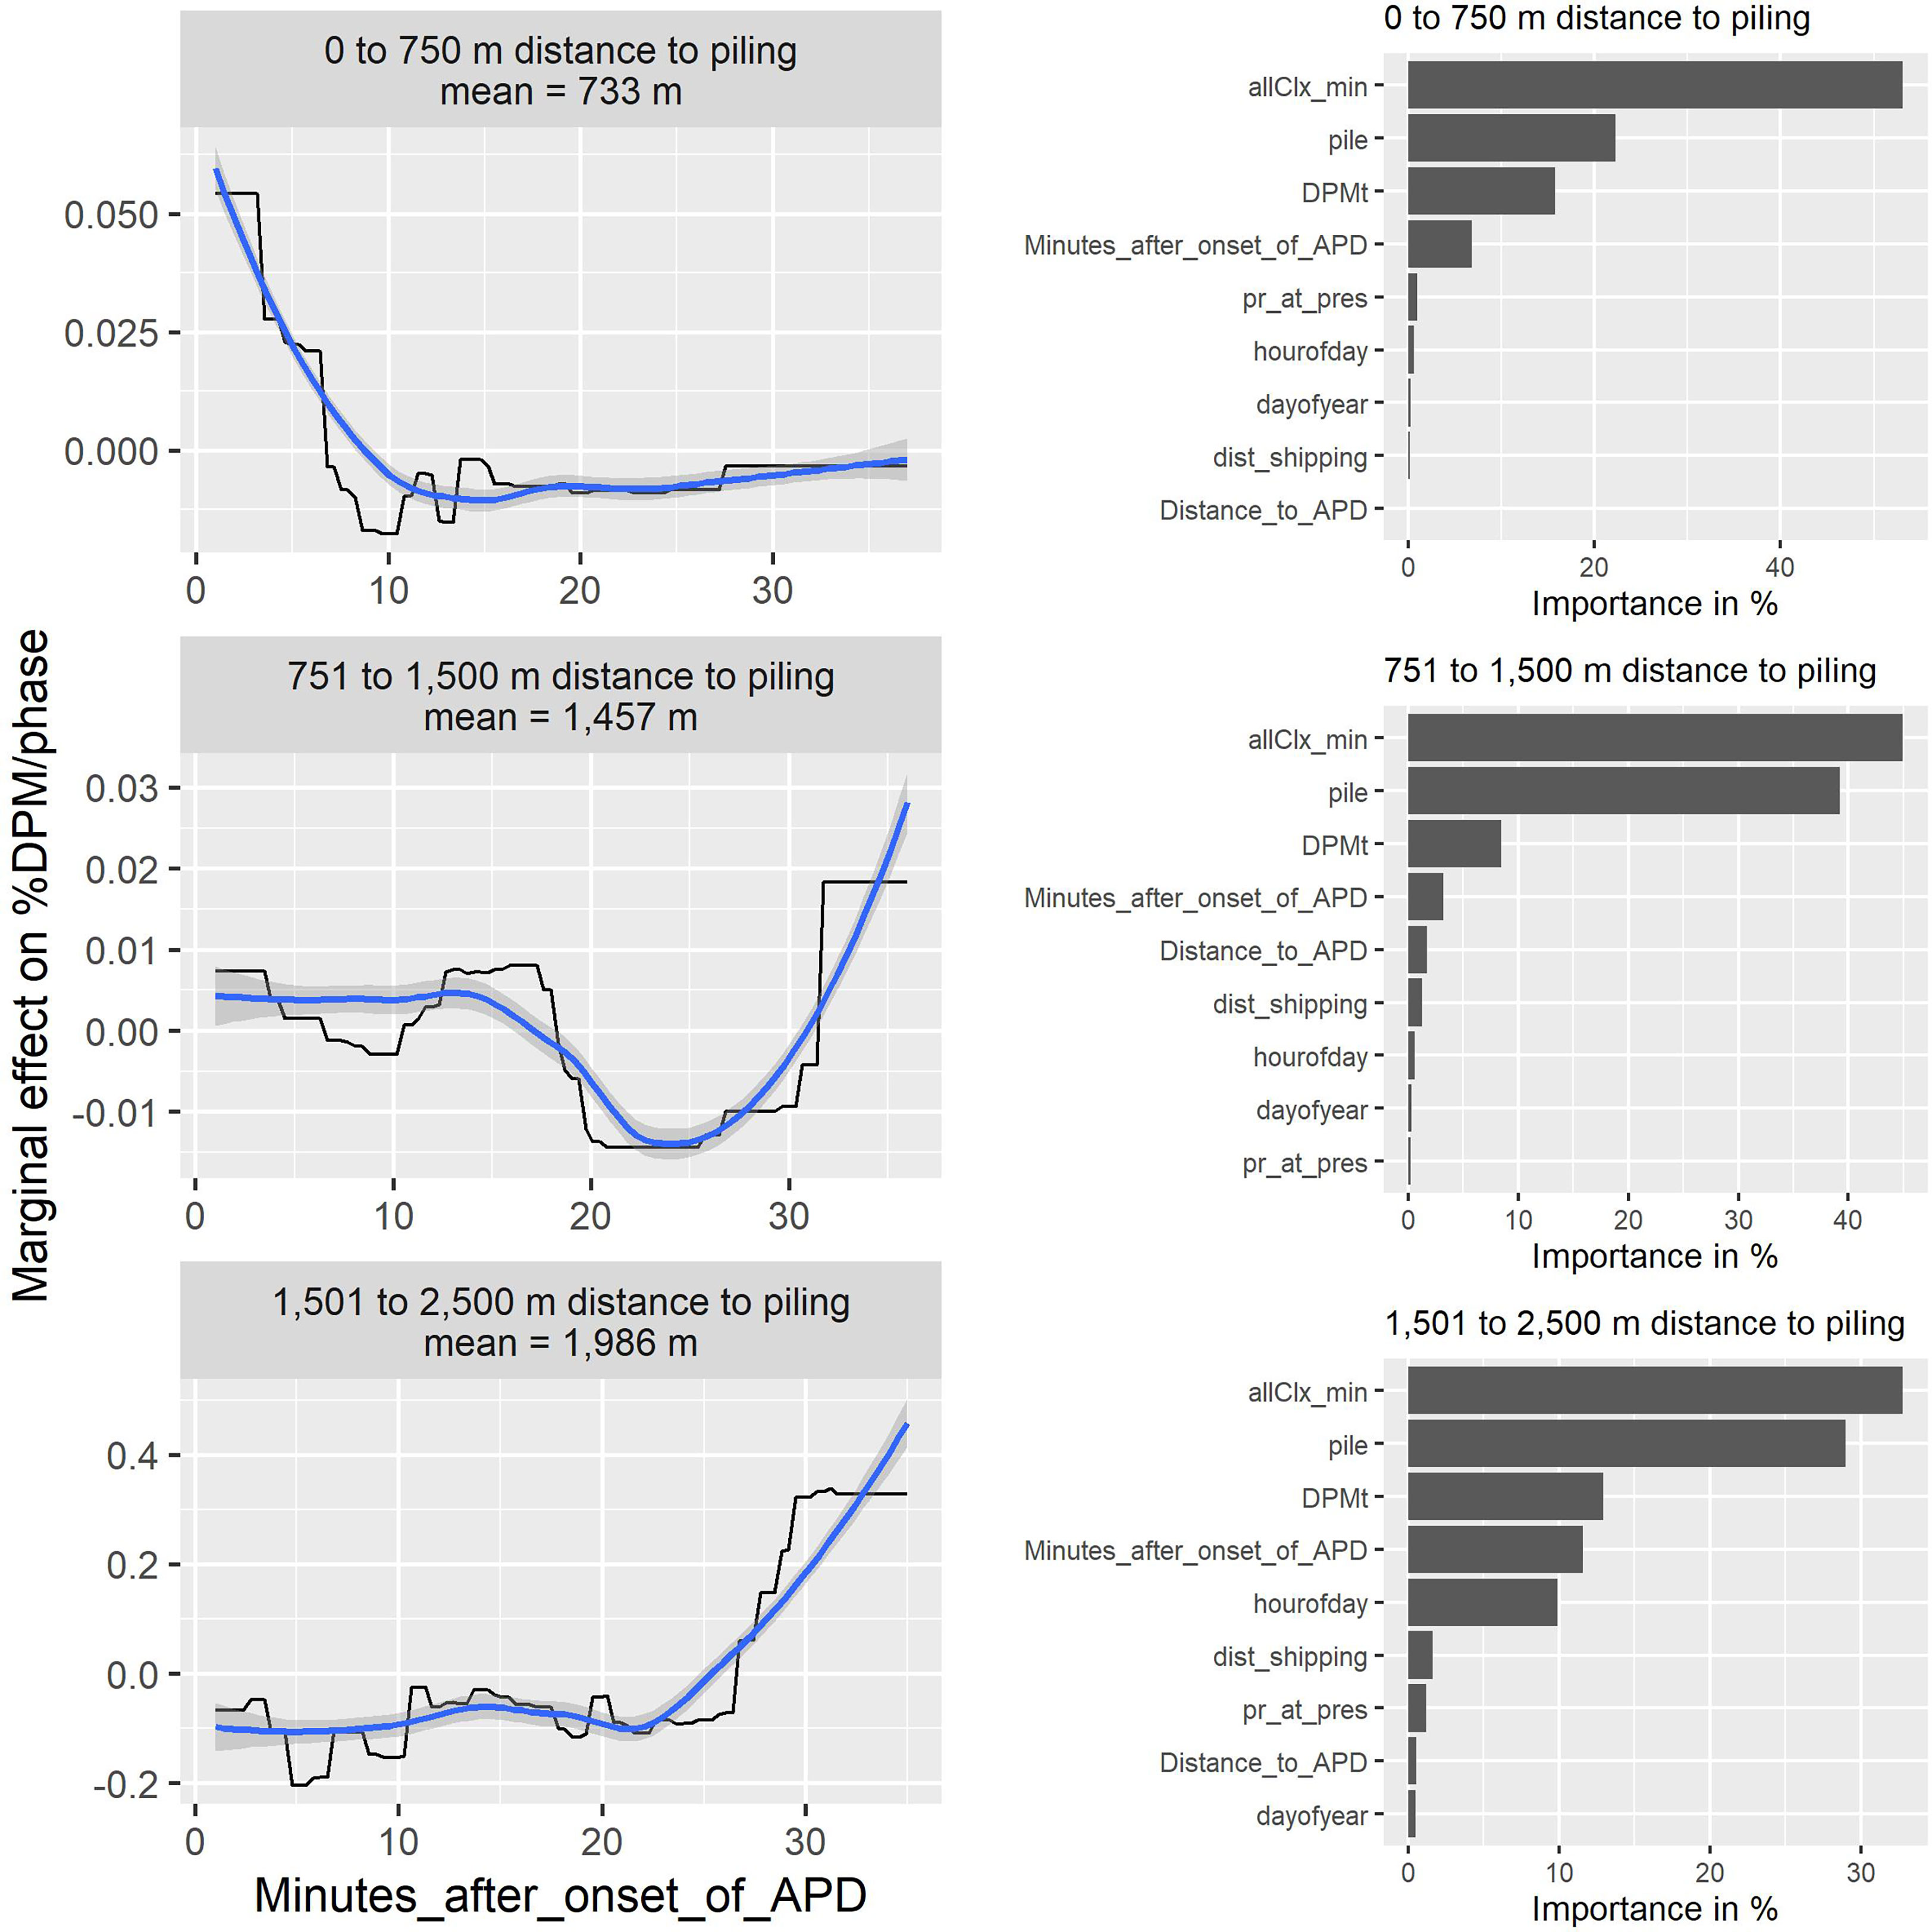
Figure 4 Left panels: Partial Dependence Plots (PDPs) of Boosted Regression Tree (BRT) models with covariates; response variable: %DPM/phase with ongoing APD operation in minutes (Minutes_after_onset_of_APD) for the distance classes 0-750, 751-1,500 and 1,50-2,500 m; y-axis: marginal effect of Minutes_after_onset_of_APD on %DPM/phase. Mean is the mean distance per distance class; the sample size n strongly decreases for minutes above 30, so data after this minute must be treated cautiously. Right panels: relative contribution of the considered variables to the respective boosted regression trees. Explanatory variables: allClx_min (number of all clicks within a minute), DPMt (DPM in previous minute), hourofday (hour of the day), dayofyear (day of the year), dist_shipping (distance to the next major shipping lane), and pr_at_pres (probability of presence of sand eel Ammodytes tobianus per station) and pile (ID of pile). Further explanations of these variables in Supplemental Table 1.
For distances between 751 and 2,500 m, detection rates started at higher levels (Figure 3). At the distance class 751 to 1,500 m, no trend during APD operation became visible in the raw data plot, and the Partial Dependence Plot showed that %DPM/phase decreased until about 25 minutes of APD operation and then started to increase (Figure 4). At the distance class 1,501 to 2,500 m, the detection rate was rather constant until about minute 24, after which it started to increase. For all distance classes, however, the duration of APD operation (Minutes_after_onset_of_APD) was ranked at position 4 of the variables considered in the BRT model, so that other variables such as the number of clicks per minute (allClx_min), the ID of the pile (pile) or the information if there was a detection in the previous minute (DPMt) had a stronger effect on the detection rate in the model than the duration of APD operation. Besides, the sample size n strongly decreased for minutes above 30, so data after this minute must be treated cautiously. When excluding minutes above 30, the Partial Dependence Plots looked similar.
3.2 Long-range effects
At distances up to 2,500 m from piling locations, values of %DPM/phase were highest during the phase Reference and lowest during Phase 2 (Figure 5). Namely, detection rates decreased by 52% from phase Reference to Phase 1 and by a further 40% from Phase 1 to Phase 2. In contrast, at distances from 2,501 to 5,000 m, detection rates were similar among the individual phases and no significant difference was observed between Phase 2 and Reference. At distances between 5,001 and 7,500 m, in contrast, the detection rate was significantly lower in Phase 2 compared to Reference. At distances between 7,501 and 10,000 m, the detection rate was significantly higher in Phase 2 compared to Reference.

Figure 5 Mean and standard error of %DPM/phase during the different phases at different distance classes relative to construction sites; black rhombuses show mean values, n is the number of analyzed POD/pile combinations, mean is the mean distance per distance class, and raw data are in Supplemental Table 5. A Bayesian proportion test showed a significant difference between the individual phases (test statistics in Supplemental Table 2); in this figure, the significance of the p-value between Phase 2 and the other phases is shown (Significance codes: [0] * [0.05] n. s. [0]).
Furthermore, the GAM model uncovered that within the available range of APD operation times (1st to 43rd minute; variable Minutes_after_onset_of_APD) the detection rates were reduced up to distances of 1.5 to 2.5 km from piling locations (Figure 6). The effect range differed with respect to duration, with effect ranges being farther-reaching with ongoing APD operation. In 2.5 to 10 km distance, detection rates were higher than at close range, and within these larger distances they stayed on a similar level over the whole range of APD operation times, providing evidence that APD effects were not reaching farther than 2.5 km from construction sites.
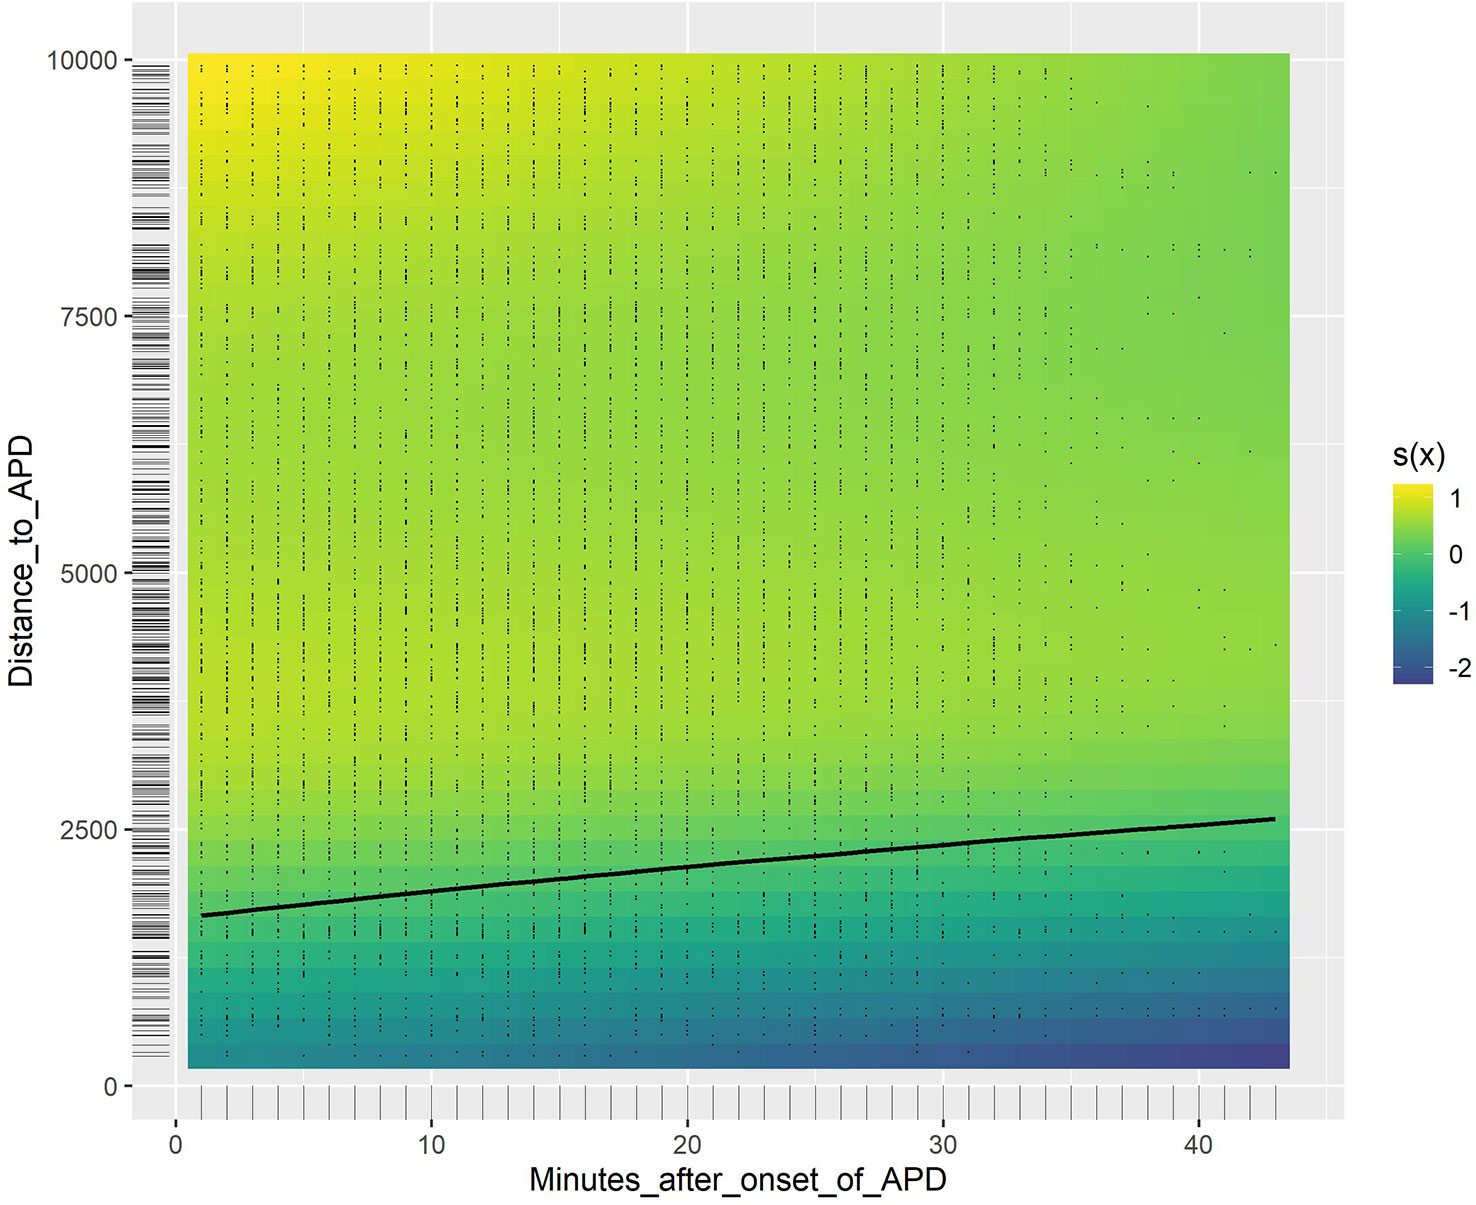
Figure 6 GAM with covariates: effects of distance and the duration of APD operation in minutes (Minutes_after_onset_of_APD) on harbor porpoise detections (DPM). The variable Distance_to_APD is the measured distance to the APD in metres; the variable Minutes_after_onset_of_APD denotes the minute of APD deployment ranging from the start of the APD until the start of piling or, if the APD was switched off before, until the end of the APD, hence an x-value of 1 means the first minute of APD operation. The black line is the model zero line showing the minimum effect range. The black dots mark data points. s(x) as marginal effect on the detection rate: Positive values indicated that the detection rates increased compared to the mean value, negative values indicated a decrease in detection rates. Explanatory variables: allClx_min (number of all clicks within a minute), DPMt (DPM in previous minute), hourofday (hour of the day), dayofyear (day of the year), dist_shipping (distance to the next major shipping lane), and pr_at_pres (probability of presence of sand eel Ammodytes tobianus per station) and pile (ID of pile). p-values for these variables and GAM statistics in Supplemental Table 6.
3.3 AHD methods comparison
When using an APD as AHD, %DPM/phase was quite similar for all phases (Phase 1: before AHD; Phase 2: during AHD; Phase 3: during piling; Phase 4: after piling; Phase Reference) in 5 to 10 km distance (mean of available distances: ~ 8 km): However, when using a seal scarer as the AHD, %DPM/phase was considerably lower in Phase 2, i.e. during the operation of the seal scarer, compared to all other phases (Figure 7). Namely, the detection rates during APD operation decreased by only 12% compared to the detection rates in the six hours before, but by 94% when using a seal scarer. This indicated that the effects of the seal scarer were farther-reaching than those of the APD. However, the number of observations was relatively low and analyses were conducted on an exploratory level, which restricted inference. Differences at other distance classes could not be investigated as seal scarer data were available only for this distance class.
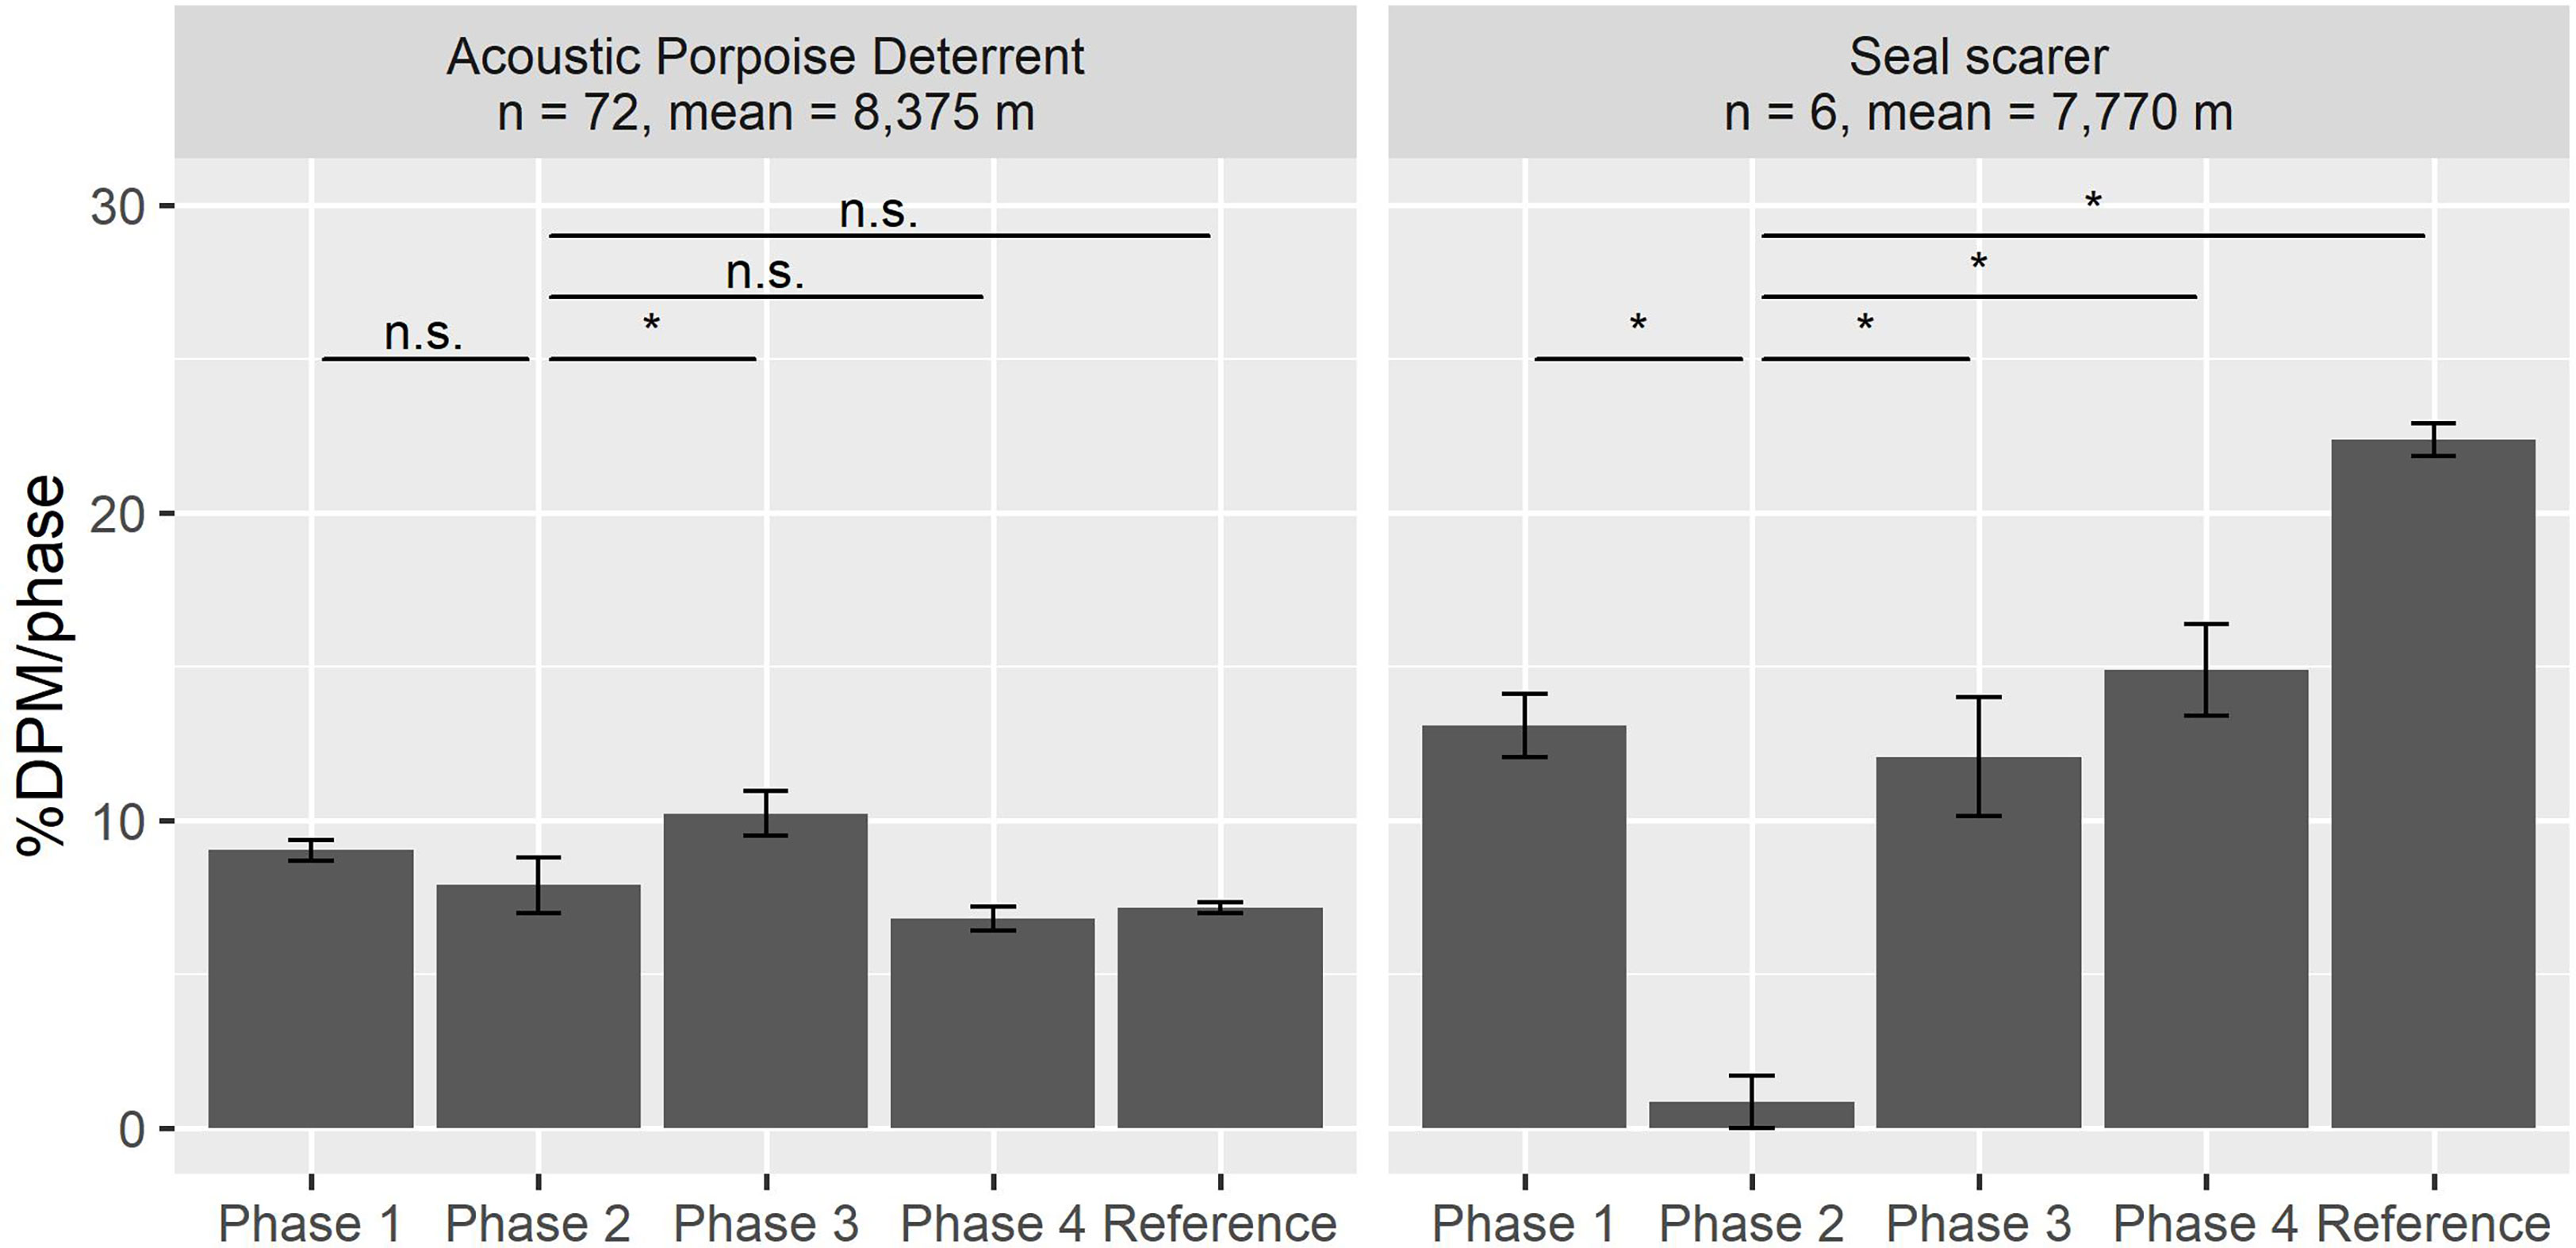
Figure 7 Comparison of effects during APD and seal scarer operation in the wind farm Trianel Windpark Borkum Phase 2 (mean and standard error of %DPM/phase in 5 to 10 km distance from pilings; n: number of analyzed POD/pile combinations). Black rhombuses show mean values, n is the number of analyzed POD/pile combinations, mean is the mean distance per distance class, and raw data are in Supplemental Table 7. A Bayesian proportion test showed a significant difference between the individual phases (test statistics in Supplemental Table 2); in this figure, the significance of the p-value between Phase 2 and the other phases is shown (Significance codes: [0] * [0.05] n. s. [0]).
4 Discussion
Underwater noise can generally affect the individual fitness and structure of ecological communities, including marine mammals (Southall et al., 2007; Southall et al., 2019). The response of marine mammals to underwater noise depends on three components: the source, the path and the receiver (Erbe et al., 2016). For the source, in this case the AHD, factors such as the source level, frequency and temporal characteristics like the duration and number of operations within a short period of time are crucial. Whether noise is more likely to be absorbed or reflected depends on the path and related environmental factors such as sediment, bathymetry, temperature, salinity and pressure (Farcas et al., 2016). For the receiver, in other words the behavioral response of the animal, factors such as hearing ability, the behavioral context, distance to the source, previous exposure, demographics and food availability are decisive (Erbe et al., 2016). For example, displacement of harbor porpoises may be more likely if there is suitable food supply in other areas without noise (Carlström et al., 2002). Accordingly, each marine mammal reacts in its individual context to acoustic signals. Nevertheless, AHDs such as the APD aim to deter all harbor porpoises out of the immediate vicinity within any region, without leading to large-scale disturbance as caused by the seal scarer. This study is the first cross-project analysis answering the question of how harbor porpoises actually respond to APDs and subsequent piling, which was specifically investigated at the construction of several offshore wind farms in the North Sea at distances up to 10 km, the effects being compared to those of a seal scarer as AHD.
4.1 Short-range effects
To avoid TTS or PTS during pile driving, all harbor porpoises should be deterred to an area where the noise levels fall below 160 dB re 1 µPa² s SEL05, which should be the case at a distance of 750 m if the German dual noise protection criterion is met. In this study, even though detection rates were low in general, the detection rates of harbor porpoises significantly decreased by 30 to 100% during the deployment of an APD at 750 m distance, compared to the preceding six hours. APDs are thus effective in reducing the detection rates of harbor porpoises in the vicinity of piling locations. When using a seal scarer as AHD, detection rates were shown to decrease by 52 to 95% within 750 m (Brandt et al., 2013b). Therefore, the APD was likely as effective as the seal scarer up to a distance of 750 m.
The decrease in porpoise clicks when using the seal scarer as the AHD and during subsequent piling is not due to a change in echolocation activity but to a displacement of the animals (Brandt et al., 2013b; Haelters et al., 2015). For the APD as the AHD, harbor porpoises seem to react similarly (Kastelein et al., 2017). Therefore, acoustic detections were considered to be a good indication of harbor porpoise presence.
Our results furthermore suggest that harbor porpoises are displaced by APDs. Raw data and a BRT model showed that porpoise detections were more likely to occur at the beginning of the APD operation up to 750 m distance and declined until about minute 22 of APD operation, with a detection rate level staying close to zero from minute 23 until piling. In the distance class 1,501 to 2,500 m, in contrast, the harbor porpoise detection rate was rather constant until about minute 24, after which it started to increase. This increase might have been related to the decrease in 0 to 750 m distance indicating a displacement of the animals to areas further away from the APD location. Porpoises have to swim for some minutes to cover this distance explaining the time lag between the decrease and increase.
The relative decrease of detection rates caused by the APD would probably have been even higher if compared to a true reference, because we could only consider the six hours prior to APD operation as a baseline, and the decrease during the operation of the APD had to be compared to this period due to constraints of the data set. However, during the few hours preceding the operation of the APD, vessel traffic for preparing the NAS and the upcoming pile driving already increased and probably affected porpoise detection rates. Hence, Phase 1 could not be considered a true undisturbed reference, as the presence of marine mammals and especially harbor porpoises might have been reduced by construction-related vessel traffic (Culloch et al., 2016; Nehls et al., 2016). The animals may either react directly to this type of noise, or associate it with subsequent piling noise in which case animals may exhibit a conditioned response (Hermannsen et al., 2014; Dyndo et al., 2015; Oakley et al., 2017). Harbor porpoises may respond to vessel noise by altered diving and echolocation behavior as well as by displacement (Wisniewska et al., 2018). The fact that Phase 1 was not a true baseline, was also supported by the results in up to 2.5 km distance from pile-driving sites: In the six hours before using the APD, detection rates were already reduced by 52% compared to a true reference phase more than one day before and two days after piling times. However, even though detection rates had already declined in the hours before the APD was activated, the detection rate decreased by a further 40% during the operation of the APD (relative to six hours before using the APD), stressing its separate effect.
The close-range effects of the APD shown in this study were even stronger than piling effects (with applied NAS) and thus, sound emissions from noise-reduced pile driving seem less harassing to the animals than the APD or seal scarer operations. Nevertheless, no long-term deterrence occurred in the close range up to 2.5 km distance as detection rates in the six hours before APD operation were only about 12% higher than those three hours after piling.
APDs increase their SPL during the first five minutes of operation in order to prevent a startling behavior, but rather to gradually deter porpoises from piling locations (van der Meij et al., 2015). Accordingly, a raw data plot and a BRT model showed that porpoise detections were more likely to occur at the beginning of APD operation up to 750 m distance when the full volume was not yet reached. The minute of APD operation, however, was only ranked at position 4 of the variables considered in the BRT model, so other variables had a stronger effect on the detection rate during APD operation. Nevertheless, these results as well as those from the GAM indicate that it would be sufficient for the APD to be switched on for about 20 to 25 minutes, as after this time effectively no detections were registered within this radius anymore. Thus, we assume that the APD deterred nearly all harbor porpoises from the primary exposure area before the start of the noise-intensive piling. The GAM also indicated that longer operation times led to a moderate extension of the effect range, with a maximum of 2.5 km effect range for the longest available operation times (35-40 minutes). To minimize potential habituation of harbor porpoise to the APD signals, it is recommended that the device should be active for around 25 minutes and no more than 30 minutes.
Generally, individuals react to noise in different ways, depending on e. g. habitat conditions (van Beest et al., 2018). For example, displacement may be more likely if there is suitable food supply in other areas without noise (Carlström et al., 2002). Even though the studied OWFs were positioned in different areas, the detection rates in all wind farms decreased by 30% to 100% during the deployment of an APD at 750 m distance of it, compared to the six hours before APD operation. During the three hours after piling, detection rates increased again to 75 to 125% of the level during the six hours before the deployment of the APD. Hence, deploying the APD as the AHD seemed to lead to a significant short-term decrease in detection rates and thus displacement at shorter distances, irrespective of wind farm location. This lends support for effective use of APDs in the different regions of the North Sea for scaring harbor porpoises away around pile-driving sites.
4.2 Long-range effects
APDs were developed with the intention of avoiding large-scale disturbance as produced by the seal scarer (Brandt et al., 2013b). In fact, the results from the GAM demonstrate reduced detection rates only up to a distance of about 2.5 km during APD operation, even if the APD was switched on for over 40 minutes. Indeed, raw data from a distance of 5,001 to 7,500 m from the pile driving sites showed a significant decrease in detection rates during APD operation compared to a reference phase, but this was probably due to the fact that %DPM/phase of the phase of APD operation had a larger standard error than the other phases. That the APD did not cause a far-reaching disturbance was also supported by the raw data from 2,501 to 5,000 m distance which showed no effect during APD operation. APD effects are probably not reaching far as its high-frequency signal is absorbed more rapidly in the water column and is less audible at greater distances especially amidst background noise (Erbe et al., 2022). In contrast, lower frequency signals from vessel traffic, seal scarer signals or pile driving are absorbed to a lesser extent and therefore transmitted over larger distances (Kastelein et al., 2015).
The present dataset offers a very good opportunity for a direct comparison of long-range effects on harbor porpoises of the APD with those of the seal scarer. Using both AHDs in the same wind farm provided the chance to directly compare the effects of the APD and the seal scarer under similar conditions, however, with a small sample. It turned out that in 5 to 10 km distance (mean of available distances: ~ 8 km) the seal scarer led to a much stronger response of harbor porpoises than the APD. The detection rates during APD operation decreased by only 12% compared to the detection rates in the six hours before, but by 94% when using a seal scarer. Even though the seal scarer was only used in July and the APD was used between June and November, harbor porpoise densities in summer and autumn are known to be generally rather similar in this area (Gilles et al., 2011). Seal scarers have been modeled to be audible for harbor porpoises up to 37 km when considering high background noise levels (Todd et al., 2019) and observed to lead to deterrence of more than 7 km (Brandt et al., 2013b; Dähne et al., 2017). Due to stronger propagation loss of high-frequency signals, the spatial range of the deterrent effect of APDs should be significantly shorter than that of a seal scarer (Erbe et al., 2022). This provided further evidence supporting our former findings that APDs lead to a significant decrease in detection rates only up to a distance of 2.5 km, whereas a far-reaching deterrence, as observed for the seal scarer here and in other studies on the subject (Brandt et al., 2013b; Dähne et al., 2017), is unlikely.
This study showed that APDs are effective in reducing the detection rates of harbor porpoises in the vicinity of piling locations, but that on the other hand disturbance effects are neither ranging farther nor lasting longer than necessary. As NAS have become more effective over recent years, pile-driving noise levels up to 750 m distance are greatly reduced and mostly meet the dual noise protection criterion in Germany (Bundesministerium für Umwelt, Naturschutz und Reaktorsicherheit, 2013). On the other hand, improved NAS technology causes increased vessel traffic a few hours before pile driving, and overly effective deterrence has become an issue in recent years. Therefore, a trade-off will have to be made in future regarding the most effective strategy to protect harbor porpoises from noise, which balances the magnitude and duration of disturbance impacts in the context of longer-term fitness and population consequences. Whereas the role of vessel noise is still under discussion, the seal scarer might well have been the weakest link in the recent past. Given that the range and duration of disturbance of harbor porpoises is lower when using the APD compared to the seal scarer, we consider that APDs should be used instead of seal scarers in future, assuming there is no habituation effect. Although this study only covers projects in the North Sea, we suggest that APDs will also work in areas of similar oceanographic conditions. Due to lower salinity, the APD signals would likely be farther-reaching in the Baltic Sea, probably resulting in a slightly extended range of audibility (Francois and Garrison, 1982).
The preferential use of the APD is expected to be an improvement of mitigation strategies and an important step forward to a piling procedure that is less harmful to harbor porpoises in the North Sea and areas of similar oceanographic conditions. With the FaunaGuard porpoise module and similarly working devices, suitable mitigation tools have been developed to further approach this goal.
Data availability statement
The data analyzed in this study is subject to the following licenses/restrictions: The data originate from the construction monitoring of wind farms and may therefore not be forwarded without consent. Requests to access these datasets should be directed to JV,ai52b3NzQGJpb2NvbnN1bHQtc2guZGU=.
Ethics statement
Ethical review and approval was not required for the animal study because of the local legislation and institutional requirements. This study is based on Passive Acoustic Monitoring (PAM) of harbor porpoises and thus a non-invasive technique that neither modifies the environment, nor disturbs animals. Therefore, ethical review and approval were not required according to the German law.
Author contributions
All authors designed the study; JV performed the data analyses and led the writing of the manuscript. All authors contributed to the article and approved the submitted version.
Funding
This study was funded by the German Federal Maritime and Hydrographic Agency (BSH), Order No. 10045837.
Acknowledgments
The authors would like to thank the German Federal Maritime and Hydrographic Agency for funding. Special thanks to the technicians who collected and processed the data. Besides, we are grateful to Kelly Macleod and the two reviewers whose comments considerably helped to improve this manuscript. Parts of this manuscript has been released as a technical report on behalf of the Federal Maritime and Hydrographic Agency (BSH) at https://marinears.bsh.de and https://bioconsult-sh.de/, (Voß et al., 2021), but has not been peer-reviewed, and the authors retain the copyright.
Conflict of interest
Authors JV, AR, VK, RV, and AD were employed by BioConsult SH GmbH & Co. KG.
The remaining authors declare that the research was conducted in the absence of any commercial or financial relationships that could be construed as a potential conflict of interest.
Publisher’s note
All claims expressed in this article are solely those of the authors and do not necessarily represent those of their affiliated organizations, or those of the publisher, the editors and the reviewers. Any product that may be evaluated in this article, or claim that may be made by its manufacturer, is not guaranteed or endorsed by the publisher.
Supplementary material
The Supplementary Material for this article can be found online at: https://www.frontiersin.org/articles/10.3389/fmars.2023.1128322/full#supplementary-material
References
Akamatsu T., Teilmann J., Miller L. A., Tougaard J., Dietz R., Wang D., et al. (2007). Comparison of echolocation behaviour between coastal and riverine porpoises. Deep Sea Res. Part II 54, 290–297. doi: 10.1016/j.dsr2.2006.11.006
Brandt M. J., Höschle C., Diederichs A., Betke K., Matuschek R., Nehls G. (2013a). Seal scarers as a tool to deter harbour porpoises from offshore construction sites. Mar. Ecol. Prog. Ser. 475, 291–302. doi: 10.3354/meps10100
Brandt M. J., Höschle C., Diederichs A., Betke K., Matuschek R., Witte S., et al. (2013b). Far-reaching effects of a seal scarer on harbour porpoises, Phocoena phocoena. Aquat. Conservation: Mar. Freshw. Ecosyst. 23, 222–232. doi: 10.1002/aqc.2311
Bundesministerium für Umwelt, Naturschutz und Reaktorsicherheit (2013). Konzept für den schutz der schweinswale vor schallbelastungen bei der errichtung von offshore-windparks in der deutschen nordsee (Schallschutzkonzept).
Carlström J., Berggren P., Dinnétz F., Börjesson P. (2002). A field experiment using acoustic alarms (pingers) to reduce harbour porpoise by-catch in bottom-set gillnets. ICES J. Mar. Sci. 59, 816–824. doi: 10.1006/jmsc.2002.1214
Chelonia Limited (2023a). Standardisation. Available at: https://www.chelonia.co.uk/standardisation.htm (Accessed March 8, 2023).
Chelonia Limited (2023b). The c-POD. Available at: https://www.chelonia.co.uk/cpod_home_page.htm (Accessed March 8, 2023).
Clausen K. T., Tougaard J., Carstensen J., Delefosse M., Teilmann J. (2019). Noise affects porpoise click detections – the magnitude of the effect depends on logger type and detection filter settings. Bioacoustics 28, 443–458. doi: 10.1080/09524622.2018.1477071
Culloch R. M., Anderwald P., Brandecker A., Haberlin D., McGovern B., Pinfield R., et al. (2016). Effect of construction-related activities and vessel traffic on marine mammals. Mar. Ecol. Prog. Ser. 549, 231–242. doi: 10.3354/meps11686
Dähne M., Tougaard J., Carstensen J., Rose A., Nabe-Nielsen J. (2017). Bubble curtains attenuate noise from offshore wind farm construction and reduce temporary habitat loss for harbour porpoises. Mar. Ecol. Prog. Ser. 580, 221–237. doi: 10.3354/meps12257
Dormann C. F., Elith J., Bacher S., Buchmann C., Carl G., Carré G., et al. (2013). Collinearity: a review of methods to deal with it and a simulation study evaluating their performance. Ecography 36, 27–46. doi: 10.1111/j.1600-0587.2012.07348.x
Dyndo M., Wiśniewska D. M., Rojano-Doñate L., Madsen P. T. (2015). Harbour porpoises react to low levels of high frequency vessel noise. Sci. Rep. 5, 1–9. doi: 10.1038/srep11083
Elith J., Leathwick J. R., Hastie T. (2008). A working guide to boosted regression trees. J. Anim. Ecol. 77, 802–813. doi: 10.1111/j.1365-2656.2008.01390.x
Erbe C., Duncan A., Vigness-Raposa K. J. (2022). “Introduction to sound propagation under water,” in Exploring animal behavior through sound: Volume 1. Eds. Erbe C., Thomas J. A. (Cham.: Springer), 185–216. doi: 10.1007/978-3-030-97540-1_6
Erbe C., Reichmuth C., Cunningham K., Lucke K., Dooling R. (2016). Communication masking in marine mammals: A review and research strategy. Mar. pollut. Bull. 103, 15–38. doi: 10.1016/j.marpolbul.2015.12.007
Farcas A., Thompson P. M., Merchant N. D. (2016). Underwater noise modelling for environmental impact assessment. Environ. Impact Assess. Rev. 57, 114–122. doi: 10.1016/j.eiar.2015.11.012
Fjälling A., Wahlberg M., Westerberg H. (2006). Acoustic harassment devices reduce seal interaction in the Baltic salmon-trap, net fishery. ICES J. Mar. Sci. 63, 1751–1758. doi: 10.1016/j.icesjms.2006.06.015
Francois R. E., Garrison G. R. (1982). Sound absorption based on ocean measurements. part II: Boric acid contribution and equation for total absorption. J. Acoustical Soc. America 72. doi: 10.1121/1.388673
Gilles A., Adler S., Kaschner K., Scheidat M., Siebert U. (2011). Modelling harbour porpoise seasonal density as a function of the German bight environment: implications for management. Endangered Species Res. 14, 157–169. doi: 10.3354/esr00344
Gilles A., Scheidat M., Siebert U. (2009). Seasonal distribution of harbour porpoises and possible interference of offshore wind farms in the German north Sea. Mar. Ecol. Prog. Ser. 383, 295–307. doi: 10.3354/meps08020
Götz T., Janik V. M. (2016). Non-lethal management of carnivore predation: long-term tests with a startle reflex-based deterrence system on a fish farm. Anim. Conserv. 19, 212–221. doi: 10.1111/acv.12248
Graham I. M., Harris R. N., Denny B., Fowden D., Pullan D. (2009). Testing the effectiveness of an acoustic deterrent device for excluding seals from Atlantic salmon rivers in Scotland. ICES J. Mar. Sci. 66 (5), 860–864. doi: 10.1093/icesjms/fsp111
Haelters J., Dulière V., Vigin L., Degraer S. (2015). Towards a numerical model to simulate the observed displacement of harbour porpoises Phocoena phocoena due to pile driving in Belgian waters. Hydrobiologia 756, 105–116. doi: 10.1007/s10750-014-2138-4
Hammond P. S., Lacey C., Gilles A., Viquerat S., Börjesson P., Herr H., et al. (2017). Estimates of cetacean abundance in European Atlantic waters in summer 2016 from the SCANS-III aerial and shipboard surveys.
Hammond P. S., Macleod K., Berggren P., Borchers D. L., Burt L., Cañadas A., et al. (2013). Cetacean abundance and distribution in European Atlantic shelf waters to inform conservation and management. Biol. Cons. 164, 107–122. doi: 10.1016/j.biocon.2013.04.010
Harris R. N., Harris C. M., Duck C. D., Boyd I. L. (2014). The effectiveness of a seal scarer at a wild salmon net fishery. ICES J. Mar. Sci. 71, 1913–1920. doi: 10.1093/icesjms/fst216
Hermannsen L., Beedholm K., Tougaard J., Madsen P. T. (2014). High frequency components of ship noise in shallow water with a discussion of implications for harbor porpoises (Phocoena phocoena). J. Acoustical Soc. America 136, 1640–1653. doi: 10.1121/1.4893908
Johnston D. W. (2002). The effect of acoustic harassment devices on harbour porpoises (Phocoena phocoena) in the bay of fundy, Canada. Biol. Conserv. 108, 113–118. doi: 10.1016/S0006-3207(02)00099-X
Kastelein R. A., Hoek L., Gransier R., de Jong C. A. F., Terhune J. M., Jennings N. (2015). Hearing thresholds of a harbor porpoise (Phocoena phocoena) for playbacks of seal scarer signals, and effects of the signals on behavior. Hydrobiologia 756, 89–103. doi: 10.1007/s10750-014-2035-x
Kastelein R. A., Huybrechts J., Covi J., Helder-Hoek L. (2017). Behavioral responses of a harbor porpoise (Phocoena phocoena) to sounds from an acoustic porpoise deterrent. Aquat. Mammals 43, 233–244. doi: 10.1578/AM.43.3.2017.233
Koschinski S., Culik B. M., Damsgaard Henriksen O., Tregenza N., Ellis G., Jansen C., et al. (2003). Behavioural reactions of free-ranging porpoises and seals to the noise of a simulated 2 MW windpower generator. Mar. Ecol. Prog. Ser. 265, 263–273. doi: 10.3354/meps265263
Kruschke J. K. (2011). Bayesian Assessment of null values via parameter estimation and model comparison. Perspect. psychol. Sci. 6, 299–312. doi: 10.1177/1745691611406925
Kyhn L. A., Tougaard J., Thomas L., Duve L. R., Stenback J., Amundin M., et al. (2012). From echolocation clicks to animal density–acoustic sampling of harbor porpoises with static dataloggers. J. Acoustical Soc. America 131, 550–560. doi: 10.1121/1.3662070
Makowski D., Ben-Shachar M. S., Chen S. H. A., Lüdecke D. (2019). Indices of effect existence and significance in the bayesian framework. Front. Psychol. 10, 2767. doi: 10.3389/fpsyg.2019.02767
Mikkelsen L., Rigét F. F., Kyhn L. A., Sveegaard S., Dietz R., Tougaard J., et al. (2016). Comparing distribution of harbour porpoises (Phocoena phocoena) derived from satellite telemetry and passive acoustic monitoring. PloS One 11, e0158788. doi: 10.1371/journal.pone.0158788
Nehls G., Rose A., Diederichs A., Bellmann M., Pehlke H. (2016). “Noise mitigation during pile driving efficiently reduces disturbance of marine mammals,” in The effects of noise on aquatic life II (New York, NY: Springer New York), 755–762.
Oakley J. A., Williams A. T., Thomas T. (2017). Reactions of harbour porpoise (Phocoena phocoena) to vessel traffic in the coastal waters of south West Wales, UK. Ocean Coast. Manage. 138, 158–169. doi: 10.1016/j.ocecoaman.2017.01.003
Olesiuk P. F., Nichol L. M., Sowden M. J., Ford J. K. B. (2002). Effect of the sound generated by an acoustic harassment device on the relative abundance and distribution of harbor porpoises (Phocoena phocoena) in retreat passage, British Columbia. Mar. Mammal Sci. 18, 843–862. doi: 10.1111/j.1748-7692.2002.tb01077.x
Peschko V., Ronnenberg K., Siebert U., Gilles A. (2016). Trends of harbour porpoise (Phocoena phocoena) density in the southern north Sea. Ecol. Indic. 60, 174–183. doi: 10.1016/j.ecolind.2015.06.030
R Core Team. (2020). R: A language and environment for statistical computing (Vienna, Austria: R Foundation for Statistical Computing). Available at: https://www.R-project.org/.
Schaffeld T., Ruser A., Woelfing B., Baltzer J., Kristensen J. H., Larsson J., et al. (2019). The use of seal scarers as a protective mitigation measure can induce hearing impairment in harbour porpoises. J. Acoustical Soc. America 146, 4288–4298. doi: 10.1121/1.5135303
Sjölander A., Vansteelandt S. (2019). Frequentist versus Bayesian approaches to multiple testing. Eur. J. Epidemiol. 34, 809–821. doi: 10.1007/s10654-019-00517-2
Southall B. L., Bowles A. E., Ellison W. T., Finneran J. J., Gentry R. L., Greene C. R., et al. (2007). Marine mammal noise exposure criteria: Initial scientific recommendations. Aquat. Mammals 33, 411–521. doi: 10.1578/AM.33.4.2007.411
Southall B. L., Finneran J. J., Reichmuth C., Nachtigall P. E., Ketten D. R., Bowles A. E., et al. (2019). Marine mammal noise exposure criteria: Updated scientific recommendations for residual hearing effects. Aquat. Mammals 45, 125–232. doi: 10.1578/AM.45.2.2019.125
Teilmann J., Tougaard J., Miller L. A., Kirketerp T., Hansen K., Brando S. (2006). Reactions of captive harbor porpoises (Phocoena phocoena) to pinger-like sounds. Mar. Mammal Sci. 22, 240–260. doi: 10.1111/j.1748-7692.2006.00031.x
Todd V. L. G., Jiang J., Ruffert M. (2019). Potential audibility of three acoustic harassment devices (AHDs) to marine mammals in Scotland, UK. Int. J. Acoustics Vibration 24, 792–800. doi: 10.20855/ijav.2019.24.41528
Tougaard J., Beedholm K., Madsen P. T. (2022). Thresholds for noise induced hearing loss in harbor porpoises and phocid seals. J. Acoustical Soc. America 151, 4252–4263. doi: 10.1121/10.0011560
Tougaard J., Hermannsen L., Madsen P. T. (2020). How loud is the underwater noise from operating offshore wind turbines? J. Acoustical Soc. America 148, 2885–2893. doi: 10.1121/10.0002453
Tougaard J., Wright A. J., Madsen P. T. (2015). Cetacean noise criteria revisited in the light of proposed exposure limits for harbour porpoises. Mar. Pollut. Bull. 90, 196–208. doi: 10.1016/j.marpolbul.2014.10.051
van Beest F. M., Teilmann J., Hermannsen L., Galatius A., Mikkelsen L., Sveegaard S., et al. (2018). Fine-scale movement responses of free-ranging harbour porpoises to capture, tagging and short-term noise pulses from a single airgun. R. Soc. Open Sci. 5, 170110. doi: 10.1098/rsos.170110
van der Meij H., Kastelein R., van Eekelen E., van Konigsveld M. (2015). FaunaGuard: A scientific method for deterring marine fauna. Terra Aqua 138, 17–24.
Voß J., Rose A., Kosarev V., Vílela R., Diederichs A. (2021). Cross-project evaluation of FaunaGuard operation before pile driving for German offshore wind farms part 2: Effects on harbour porpoises (Husum (DEU: BioConsult SH).
Williamson L. D., Brookes K. L., Scott B. E., Graham I. M., Bradbury G., Hammond P. S., et al. (2016). Echolocation detections and digital video surveys provide reliable estimates of the relative density of harbour porpoises. Methods Ecol. Evol. 7, 762–769. doi: 10.1111/2041-210X.12538
Wisniewska D. M., Johnson M., Teilmann J., Rojano-Doñate L., Shearer J., Sveegaard S., et al. (2016). Ultra-high foraging rates of harbor porpoises make them vulnerable to anthropogenic disturbance. Curr. Biol. 26, 1441–1446. doi: 10.1016/j.cub.2016.03.069
Wisniewska D. M., Johnson M., Teilmann J., Siebert U., Galatius A., Dietz R., et al. (2018). High rates of vessel noise disrupt foraging in wild harbour porpoises (Phocoena phocoena). Proc. R. Soc. B: Biol. Sci. 285, 20172314. doi: 10.1098/rspb.2017.2314
Keywords: Phocoena phocoena, German North Sea, offshore wind farm, Passive Acoustic Monitoring, deterrence, behavior, pile driving, marine mammal
Citation: Voß J, Rose A, Kosarev V, Vílela R, van Opzeeland IC and Diederichs A (2023) Response of harbor porpoises (Phocoena phocoena) to different types of acoustic harassment devices and subsequent piling during the construction of offshore wind farms. Front. Mar. Sci. 10:1128322. doi: 10.3389/fmars.2023.1128322
Received: 20 December 2022; Accepted: 08 March 2023;
Published: 22 March 2023.
Edited by:
Salvatore Siciliano, Fundação Oswaldo Cruz (Fiocruz), BrazilReviewed by:
Jonas Teilmann, Aarhus University, DenmarkUrsula Siebert, University of Veterinary Medicine Hannover, Germany
Copyright © 2023 Voß, Rose, Kosarev, Vílela, van Opzeeland and Diederichs. This is an open-access article distributed under the terms of the Creative Commons Attribution License (CC BY). The use, distribution or reproduction in other forums is permitted, provided the original author(s) and the copyright owner(s) are credited and that the original publication in this journal is cited, in accordance with accepted academic practice. No use, distribution or reproduction is permitted which does not comply with these terms.
*Correspondence: Julika Voß, ai52b3NzQGJpb2NvbnN1bHQtc2guZGU=
†These authors have contributed equally to this work and share last authorship