 Jinpei Li
 Jianing Ren
 Xun Ma1
 Guangnian Xiao
- 1School of Economics and Management, Beijing University of Chemical Technology, Beijing, China
- 2School of Economics and Management, Shanghai Maritime University, Shanghai, China
In 2020, China proposed the country’s dual carbon goals of peaking carbon emissions by 2030 and achieving carbon neutrality by 2060. Under the dual carbon goals, the low-carbon transformation has become an important development direction for Chinese ports. Taking eight ports in China’s Bohai-rim port group as an example, this study adopts the Slacks-Based Measure (SBM) model to evaluate the port efficiency considering the environmental factor of carbon dioxide (CO2) emissions. The results show that the average scale environmental efficiency of the eight ports during 2005-2020 is the highest, followed by local pure technical environmental efficiency and global technical environmental efficiency. The efficiency values of each port under different environmental efficiency categories vary greatly. Overall, each port is in a state of environmental inefficiency. From port technology, input-output optimization, supervision, and management of relevant departments, recommendations for improving the environmental efficiency of ports under the dual carbon goals are put forward.
1 Introduction
Under a series of social challenges, including environmental pollution, the World Commission on Environment and Development proposed the concept of sustainable development in 1987. Since then, sustainable development has become a common goal of the world (Huang, 2022). In order to achieve the goal of sustainable development, China has formulated many strategies and measures to improve the environment. Currently, the most extensive strategy implemented by China is the dual carbon goals of peaking carbon emissions by 2030 and achieving carbon neutrality by 2060. China has made great efforts to save energy and reduce carbon emissions in recent years. For example, starting from the “Twelfth Five-Year Plan” period, China has incorporated the reduction of carbon intensity into the national economic and social development planning outline as a binding goal. World Bank data shows that since 2005, China’s cumulative energy savings have accounted for more than 50% of the world’s. In 2020, China’s carbon intensity dropped by 48.4% compared to 2005, exceeding the goal that China promised to the international community to reduce its carbon intensity by 40% to 45% by 2020.
In economic globalization, trade exchanges between countries have increased rapidly, and China’s trade has been in line with world trade. Since 2005, China has ranked among the top three world trading countries. And since 2017, China has been the world’s largest trading country, and the total import and export commodities in 2021 have reached about 6.05 trillion US dollars. As a critical node for import and export, the vital role of the port is self-evident. According to the Outline of the Eighth Five-Year Plan for National Economic and Social Development of the People’s Republic of China to the Outline of the Fourteenth Five-Year Plan for National Economic and Social Development of the People’s Republic of China, China’s support policy for the port industry has transformed from “strengthening the construction of coastal ports” to “optimizing and upgrading key port clusters,” and then to “accelerating the construction of a transportation power.” Moreover, with the advancement of the One Belt and One Road policy, Chinese ports have been extensively developed.
Ports should take responsibility for their interests, implement national requirements, and enjoy national policy dividends. In 2019, the Ministry of Transport of China issued the Guiding Opinions on Building World-Class Ports, emphasizing that by 2025, meaningful progress will be made in constructing world-class ports, and significant breakthroughs will be made in the green, intelligent and safe development of major ports. Compared with developed countries, the construction of China’s green ports is lagging, and multiple problems such as waste of resources and high pollution have emerged, especially China’s dual carbon goals have set new targets for energy conservation and emission reduction of ports. In order to improve port efficiency, it is necessary to clarify its influencing factors. The evaluation study of the environmental efficiency of the port can quantitatively identify the redundancy and shortage of the port in terms of input and output. However, existing studies on port efficiency do not pay enough attention to direct energy input and carbon emissions, and cannot objectively identify the green development level of ports under the dual carbon goals. Therefore, the primary purpose of this study is to evaluate port efficiency considering energy input and carbon emissions under the double carbon goals.
The possible contribution of this study is reflected in two aspects. First, the existing port efficiency evaluation research generally selects port infrastructure as an input factor, and seldom considers energy consumption. This study takes port energy consumption as one of the input variables, which can better reflect the greenness of port development. Second, this study takes the CO2 emissions of the port as an undesirable output, which is more in line with the development direction of ports under China’s dual carbon goals, and has practical significance for the sustainable development of the port.
The remainder of this study is structured as follows. Section 2 reviews the relevant literature. Section 3 describes the methodology, selected indicators, samples, and data used in our study. Section 4 presents the results and discussion. Section 5 provides the conclusion and policy implications.
2 Literature review
2.1 Port efficiency evaluation method
In terms of efficiency evaluation, data envelopment analysis (DEA) is a well-known method, and transportation is one of the most widely used industries (Liu et al., 2013). The DEA model is a non-parametric production frontier approach. It assumes that inputs and outputs change proportionally to each other, so it is considered to evaluate the relative efficiency of a group of decision-making units. The Charnes-Cooper-Rhodes (CCR) model is one of the most basic DEA models proposed by Charnes et al. (1978), and has been widely used. Tongzon (2001) analyzed a sample of Australian and other international ports using the CCR model and demonstrated that DEA provides a viable means of assessing relative port efficiency. Birgun and Akten (2005) adopted the CCR model to measure the relative efficiency of the ports and illustrate the managers of the ports. The CCR model is built on the assumption of constant returns to the scale of activities. As a representative extension of the CCR model, the Banker-Charnes-Cooper (BCC) model assumes variable returns to scale and has been further applied. For example, Shen (2021) used the BCC model to calculate the green efficiency of four port groups in China. Moreover, some scholars combine multiple types of the DEA model. da Costa et al. (2021) used the traditional two models of DEA to analyze the efficiency of major container terminals in northern Brazil. Barros (2012) applied the Luenberger DEA model and the Malmquist index to analyze the productivity change of African seaports. Baran and Górecka (2015) used CCR and BCC model and applied the Malmquist Productivity Index to evaluate the global technical efficiency, pure technical efficiency, and scale efficiency of container ports and to analyze changes in seaport productivity. In addition, some scholars use the DEA model in combination with other econometric models. For instance, Nikolaou and Dimitriou (2021) used a multi-period DEA-Tobit model to estimate the efficiency of the world’s top 50 container port terminals serving the global freight supply chain over five years.
In recent years, the world has paid more and more attention to environmental issues. The marine environment has thus become one of the areas that scholars focus on, such as inland shipping pollution (Xu et al., 2022a), marine sustainable development (Xu et al., 2022b), port pollutant emission (Xiao et al., 2023), and carbon emission reduction technology for shipping companies (Xiao and Cui, 2023). The port is an essential part of the marine environment, and its environmental issues have become the primary concern for ports (Yu et al., 2022). Thus, evaluating port efficiency has gradually introduced undesired environmental outputs, such as pollutant emissions. In this regard, some scholars have further expanded the port efficiency evaluation model, which has undesired output variables, among which the slacks-based measure (SBM) model is widely used. The SBM model is an effective method of efficiency in DEA. On the one hand, the SBM model overcomes the condition that the traditional DEA model assumes that all inputs and outputs change proportionally, and is more in line with the real-world situation. On the other hand, the SBM model can measure the efficiency of decision-making units that consider both desirable and undesirable outputs (Cooper et al., 2007), and the SBM model is proved to be more discriminative among various non-parametric methods for assessing environmental performance method (Zhou et al., 2008). Moreover, the SBM model has good compatibility with other measures of efficiency (Tone, 2001). Lee et al. (2014) used the SBM model to evaluate the environmental efficiency of the port cities. They found that Tianjin is the least environmentally efficient port city compared to other cities such as Singapore, Busan, and New York. Elsayed and Khalil (2017) used two traditional DEA models and the SBM model to evaluate and analyze the factors affecting the efficiency level of Safaga port in Egypt. They found that the more strategically located DP World Sokhna port has higher efficiency than the Safaga port. In addition, Tovar and Wall (2019) used a directional distance function approach (DEA-DDF model) to evaluate environmental and technical efficiency for a cross-section of 28 Spanish Port Authorities. They found that when the output elements are different, the degree of optimal reduction of CO2 emissions is different when the environmental efficiency of the port is effective.
2.2 The input-output elements of port efficiency
In the selection of input-output elements for port efficiency evaluation, most studies select input elements from port infrastructure or equipment approximating the capital level (Bonilla et al., 2004; Birgun and Akten, 2005; Wiegmans and Witte, 2017; Chang et al., 2021), such as berth length or depth, number or intensity of cranes; output elements mostly select container throughput or cargo throughput (Cullinane and Wang, 2006; Chang et al., 2021), only a tiny number of scholars regard passengers as an output factor (Simões and Marques, 2010; Tovar and Wall, 2019); at the same time, some scholars also examine non-desired output factors, such as carbon dioxide emissions (Na et al., 2017; Dong et al., 2019).
However, the existing research on port efficiency evaluation has not reached a consensus on constructing the input-output index system. For example, Na et al. (2017) used berth length, port area, number of quay cranes, and yard cranes as input variables, container throughput of the port as the output variable, and the CO2 emission amount of each port as an undesirable output variable. Elsayed and Khalil (2017) adopted water area, storage, terminal, depth of berth passenger station, and labor as input variables, cargo, number of the berth, berth length, land area, fixed cranes, and yard cranes as output variables. Dong et al. (2019) evaluated the environmental performance of container ports along the Maritime Silk Road (MSR) using the number of berths, quay cranes, and berth length as input variables, throughput as desirable output variable, and carbon dioxide emissions as undesirable output variable. Liu et al. (2022) evaluated the efficiency of the primary container terminals in Hong Kong, Guangzhou, and Shenzhen from 2018 to 2019, using gross crane productivity, crane intensity, berth length, and berth depth as input variables, calls and moves as desirable output variables, and finish as undesirable output variable.
3 Methodology
3.1 Sample selection and data
Due to the availability of data and the representativeness of samples, this study selects eight ports in the Bohai-rim port group as the research objects. The eight ports are Dalian Port, Yingkou Port, Qingdao Port, Rizhao Port, Yantai Port, Tianjin Port, Tangshan Port, and Qinhuangdao Port. On the one hand, the data of these eight ports in the Bohai-rim port group are relatively complete, while other Chinese ports lack data on one or more input-output variables. On the other hand, as the center of the three-dimensional transportation network of the Bohai Rim region in the core area of the Northeast Asian economic circle, the ports of the Bohai Rim port group not only play an important role in the economic and social development of China’s three northeastern provinces, but also have outstanding representative value for the development of Chinese ports. Specifically, the coastline of the Bohai Sea is 5,800 kilometers, and the Bohai-rim port group is one of the five major port groups in China. The ports in Tianjin, Hebei, Liaoning, and Shandong in the Bohai-rim region are all coastal ports with superior geographical locations (see Figure A.1 for details). In the past ten years, the cargo throughput of coastal ports in the Bohai-rim region has accounted for more than 40% of all coastal ports and about 30% of the national ports. It is worth noting that the cargo throughput of the sample ports selected in this study accounted for more than 80% of all ports in the Bohai-rim region and more than 20% of the national ports (see Table 1 for details). Additionally, in terms of foreign trade throughput, ports in the Bohai-rim region accounted for 42% of the national ports in 2020. The sample ports selected in this study accounted for 92% of the total in the Bohai-rim region.
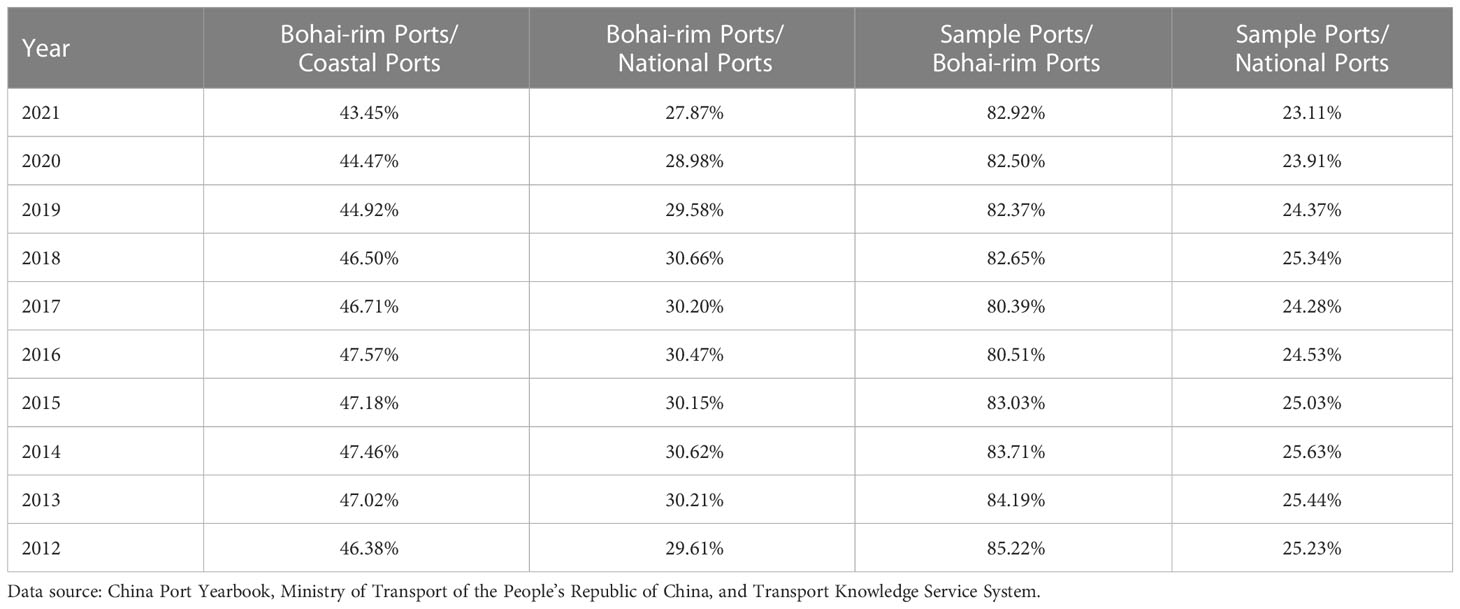
Table 1 Comparison of port cargo throughput.
The data used in this study mainly come from official statistics from 2005 to 2020, including the China Port Yearbook, the Provincial and Municipal Statistical Yearbook, and the official website of the National Bureau of Statistics. In addition, the data of some indicators come from the China Stock Market and Accounting Research (CSMAR) database. CSMAR is a comprehensive research database developed based on the needs of academic research, which simultaneously meets international professional standards and adapts to China’s features.
3.2 Variable selection
For the application of the SBM model, the selection of input and output variables is crucial (Cooper et al., 2007). Referring to existing literature and based on data availability, this study selects the number of berths used in port production, the length of the dock for production, and energy consumption as input variables, and selects cargo throughput, container throughput, and passenger throughput as desirable output variables. At the same time, based on the strategic background of China’s realization of the dual carbon goals, this study selects CO2 emissions as an undesirable output variable. The input and output variables are shown in Table 2.
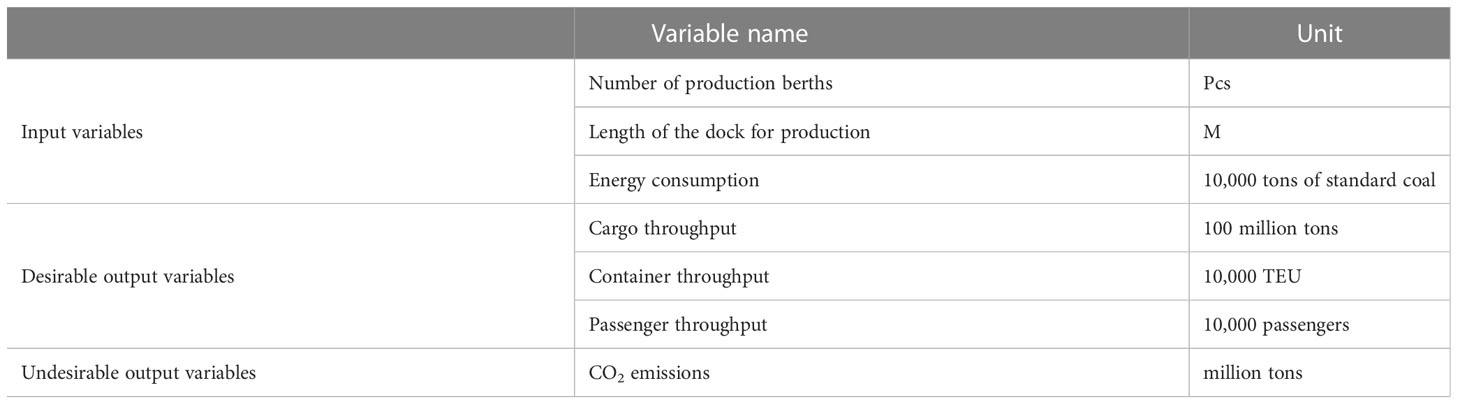
Table 2 Input and Output Variables.
Note that the Ministry of Transport of China began to monitor port energy consumption in 2011, while our research period is from 2005 to 2020, and there is a significant gap in the statistical time of data. To ensure the consistency of data sources and statistical caliber, this study uses the measurement method proposed by Ge and Wang (2021) to calculate energy consumption and carbon dioxide emissions. The formula for calculating the energy consumption of the port is as follows:
where represents the cargo throughput of the port. means the cargo throughput of all ports in the province where the port is situated. represents the waterway freight volume of the province where the port is located. represents the total freight volume of the province where the port is located. represents the total energy consumption of transportation, warehousing, and postal industry in the province where the port is located. The data for these indicators come from the Statistical Yearbook of the relevant provinces and the China Port Yearbook. For several missing data, the interpolation method is used to make up.
Furthermore, the formula for calculating the CO2 emissions of the port is as follows:
where is the CO2 emissions of the port, and is the CO2 emission coefficient. According to the carbon emission coefficient of 1t standard coal () recommended by the Chinese National Development and Reform Commission, the conversion coefficiecnt between carbon emissions and CO2 emissions is 3.6667, and the CO2 emission coefficient can be calculated as .
Table 3 presents the summary statistics for the input and output variables in this study. Whether it is input variables or output variables, there are significant differences between different DMUs. In particular, the minimum value of CO2 emissions is 1.98, and the maximum value is 1621.76, so if the undesirable output of CO2 emissions is ignored, it may lead to bias in the evaluation of the environmental efficiency of the port, especially in the context of dual carbon goals.
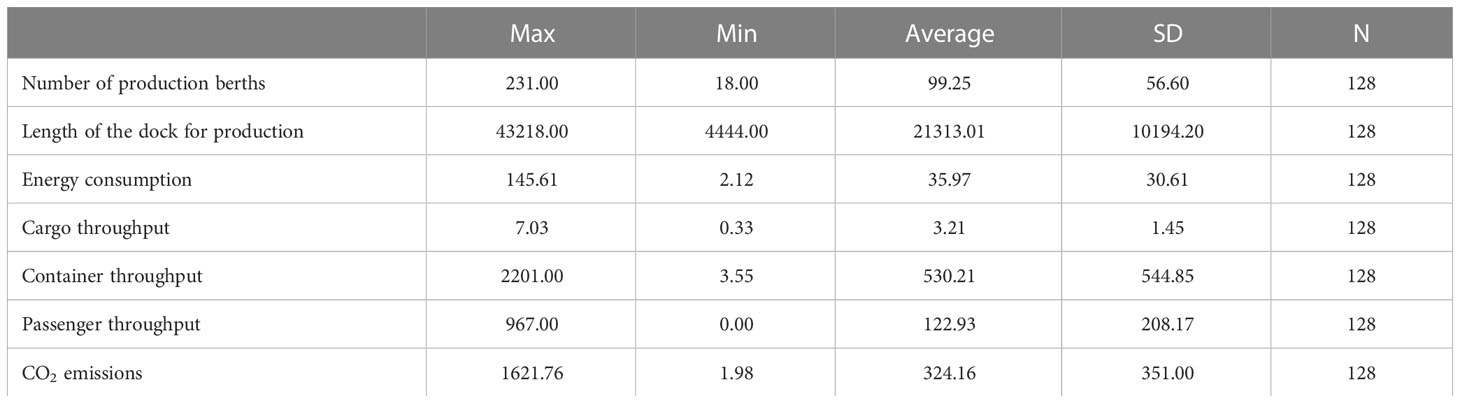
Table 3 Summary Statistics.
3.3 Methods
To explore the environmental efficiency of ports, this study draws on the research methods of the existing literature (Lee et al., 2014; Elsayed and Khalil, 2017), and adopts the SBM model. The SBM model is a non-radial and non-angular DEA model proposed by Tone (2001), which overcomes the problem of the overestimate of the efficiency value of the decision-making unit (DMU) by the radial DEA when there is a non-zero slack in inputs or outputs, and the angular DEA must choose between inputs (assuming that outputs are unchanged) or outputs (assuming that inputs are unchanged). The unit of analysis in this study is the port, which is called a DMU in the SBM model. Generally speaking, a basic rule for the successful application of a SBM model is that the number of DMUs exceeds the total number of input and output variables by at least three times (Cooper et al., 2007). According to the sample selection and input and output variables mentioned above, the number of DMUs in this study is 128, while the combined number of input-output items is 7. Given that the number of DMUs is more than 18 times the total amount of input and output variables, the SBM model is desirable for this study.
Given the data, this study measures the environmental efficiency of each port once and hence needs optimaizations, one for each DMU to be evaluated (Cooper et al., 2007). Suppose that there are DMUs, each of which contains input variable , desirable output variable , and undesirable output variable . The numbers of inputs, desirable outputs, and undesirable outputs are represented by , , and , respectively. The input data matrix , the desirable output data matrix , and the undesirable output matrix can be arranged as follows:
where , , . The production possibility set is defined by
wherein, the intensity vector is represented by .
Further, in order to estimate the environmental efficiency of a DMU (), the following fractional program is formulated:
In this model, and represent the excesses in inputs and undesirable outputs, respectively. expresses shortages in desirable outputs. The objective function value is the environmental efficiency value of the DMU, which satisfies . If the value of is equal to 1, it means that the environmental efficiency of a DMU is efficient, and , , and . Otherwise, the DMU is inefficient and can be improved by removing excess inputs and undesirable outputs, and increasing desirable outputs. Note that convexity constraint means the assumption of VRS; however, the efficiency under the assumption of CRS needs to remove the convexity constraint.
4 Results and discussion
4.1 Overview of the evaluation results of port environmental efficiency
Based on the SBM model described in Section 3.3, 128 DMUs are used to construct the production possibility set, and the software of DEA-Solver Pro13.1 is used to measure the environmental efficiency of the port. In order to comprehensively evaluate the environmental efficiency of the port, this study estimates the global technical environmental efficiency, local pure technical environmental efficiency, and scale environmental efficiency of the port based on the analysis of returns to scale. A comparative study of these three types of environmental efficiencies helps to understand the sources of inefficiency that a DMU may have, that is, whether the inefficiency is caused by the inefficient operation of the DMU itself or by the unfavorable conditions in which the DMU operates. According to Cooper et al. (2007), the evaluation result under the assumption of CRS is global technical environmental efficiency, the evaluation result under the assumption of VRS is local pure technical environmental efficiency, and the scale environmental efficiency is defined by the ratio of these two efficiencies. That is, the scale environmental efficiency = global technical environmental efficiency/local pure technical environmental efficiency. Further, if a DMU is fully efficient in both the global technical environmental efficiency and local pure technical environmental efficiency, it is operating in the most productive scale size. If a DMU has full local pure technical environmental efficiency but a low global technical environmental efficiency, then it is operating locally efficiently but not globally efficiently due to the scale size of the DMU. It should be noted that the value of scale environmental efficiency is equal to 1 in the most productive scale size and is not greater than 1 (Cooper et al., 2007). The evaluation results of global technical environmental efficiency, local pure technical environmental efficiency, and scale environmental efficiency of the eight ports from 2005 to 2020 are shown in Tables A.1–A.3, respectively.
The results in Tables A.1, A.2 show that during the study period from 2005 to 2020, there are 18 DMUs with a global technical environmental efficiency value equal to 1.0000, accounting for 14.06% of all DMUs, and 26 DMUs with a local pure technical environmental efficiency value equal to 1.0000, accounting for 20.31% of all DMUs. Moreover, the results of scale environmental efficiency in Table A.3 show that there are 18 DMUs with a scale environmental efficiency value of 1.0000, which means that these 18 DMUs are operating at the most productive scale size. And, combining the results of Tables A.1, A.2, the global technical environmental efficiency and local pure technical environmental efficiency of these 18 DMUs are also 1.0000. Therefore, these 18 DMUs are both scale and technically efficient for the assumptions of CRS and VRS. In addition, the remaining 85.94% of all DMUs have a scale environmental efficiency of less than 1.0000, among which 8 DMUs have full local pure technical environmental efficiency but a low global technical environmental efficiency. Thus, the overall inefficiency of these 8 DMUs is caused by their failure to achieve scale inefficiency. At the same time, the local pure technical environmental efficiency and scale environmental efficiency of the 102 DMUs are all inefficient. In other words, the overall inefficiency of these 102 DMUs is not only caused by their technical inefficient operation, but also caused by their disadvantageous scale conditions.
In addition, in order to gain a deeper understanding of the port’s environmental efficiency under the dual carbon goals, we also evaluate the port’s efficiency without considering carbon emissions. Tables A.5–A.7 in the appendix present the evaluation results of port efficiency without considering carbon emissions. Since carbon emissions are undesirable outputs, the SBM model without undesirable output is used for port efficiency evaluation, and Formula A.1 is shown in the appendix. During the study period from 2005 to 2020, there are 11 DMUs with a global technical efficiency value of 1.0000 for ports that do consider carbon emissions, accounting for 8.59% of all DMUs, which is 5.47 percentage points lower than those considering carbon emissions. Moreover, there are 14 DMUs with a local pure technical efficiency value of 1.0000, accounting for 10.94% of all DMUs, which is 9.37 percentage points lower than those considering carbon emissions, and 11 DMUs with a scale efficiency value of 1.0000, which is 5.47 percentage points lower than those considering carbon emissions. Therefore, under the requirement of realizing the dual carbon goals, it is necessary to include carbon emission elements in the evaluation system of port efficiency; otherwise, it will lead to biased evaluation results, which is not conducive to the green and sustainable development of ports.
4.2 Longitudinal comparative analysis of port environmental efficiency
In order to discuss the environmental efficiency trends, we averaged the three types of environmental efficiency for all ports year by year, and the results are shown in Figure 1. From 2005 to 2020, the global technical environmental efficiency showed a clear trend of fluctuation. Specifically, global technical environmental efficiency showed an upward trend from 2005 to 2007, declined in 2008, began to recover rapidly after 2009, and reached the highest level in 2013. However, it then began to show a downward trend and reached its lowest level in the entire study period in 2017. From 2018 to 2020, the global technical environmental efficiency showed a dynamic of “rise-fall-rise,” and the unstable state was more prominent. Furthermore, from 2005 to 2007, the changing trend of local pure technical and global technical environmental efficiency is the opposite. Specifically, pure technical environmental efficiency shows a downward trend, while global technical environmental efficiency shows an upward trend. From 2008 to 2020, the dynamics of local pure technical efficiency and global technical environmental efficiency are similar. Especially from 2008 to 2016, the values of these two types of efficiency are very close. In addition, the average values of local pure technical efficiency are always greater than global technical environmental efficiency, which conforms to the above definition. That is, scale environmental efficiency is equal to 1 in the most productive scale size and is not greater than 1, where scale environmental efficiency is the ratio of local pure technical efficiency to global technical environmental efficiency (Cooper et al., 2007).
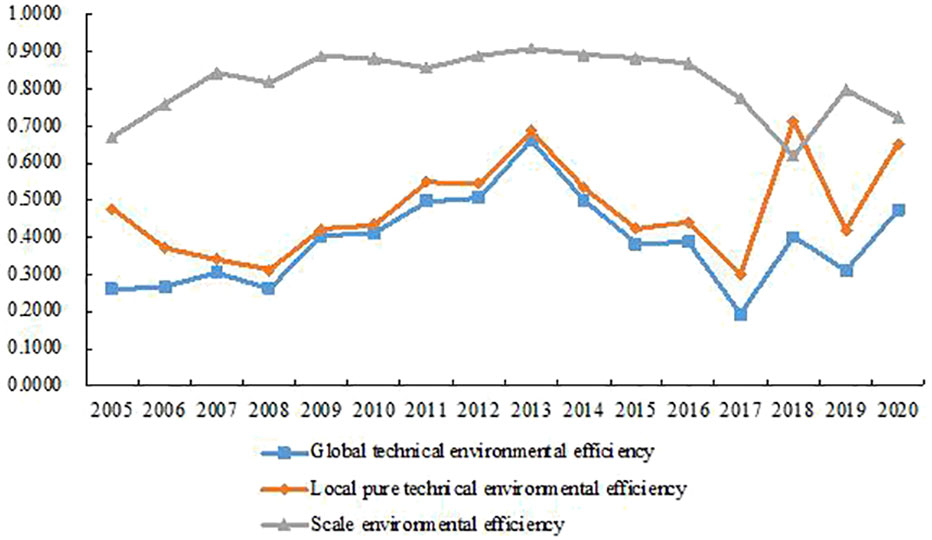
Figure 1 The annual average environmental efficiency of the eight ports.
Further, the changing trend of scale environmental efficiency is closely related to local pure technical efficiency and global technical environmental efficiency, as shown in Figure 1. From 2005 to 2009, the changing trend of scale environmental efficiency and global technical environmental efficiency is consistent, indicating that the change of scale efficiency during this period is the main reason for the change of global technical environmental efficiency. The possible explanation is that before 2007, the Bohai-rim region mainly relied on the extensive economic development mode that invested heavily in production factors, and the ecological environment governance did not receive sufficient attention. In this context, as an essential port group for economic development in the Bohai-rim region, the eight representative sample ports have invested heavily in the number of productive berths, the length of productive docks, and energy, which meet the requirements of increasing revenue and expanding scale. But carbon dioxide emissions are poorly controlled, and the utilization of inputs is low. Therefore, the port development during this period has a noticeable shortage of desirable output and redundant undesirable output. Moreover, the global financial crisis occurred in 2008, which greatly affected international trade and seriously impacted port development, resulting in a further decline in the environmental efficiency of ports. Subsequently, in response to the global financial crisis, China implemented stimulus policies, such as increasing investment, stimulating consumption, and increasing exports, and the port development gradually improved. At the same time, new achievements have been made in technological innovation, energy conservation, and emission reduction. The scale environmental efficiency of ports has been stable from 2009 to 2016, and the efficiency value is at a relatively high level. It is worth noting that in 2013, the global technical environmental efficiency increased significantly, which may be due to the gradual improvement of the ecological level of the Bohai Rim region under the influence of the requirements of China’s “Twelfth Five-Year Plan.” At the same time, the Ministry of Transport has carried out pilot projects for the regionalization and thematic management of special funds for transportation energy conservation and emission reduction, which not only boosted the confidence of ports in energy conservation and emission reduction, but also provided particular financial support for ports. Through the analysis of ports with high environmental efficiency values, we found that these ports have reached the highest level in terms of local pure technical environmental efficiency and scale environmental efficiency (see Tables A.1–A.3 in the appendix for details), which is closely related to the scientific allocation of resources, development of science and technology, and optimization of port energy utilization structure.
After 2016, the scale environmental efficiency has a clear fluctuation trend, which is related to the extensive fluctuation range of local pure technical efficiency and global technical environmental efficiency. In 2017, the world economy had not yet completely shaken off the profound impact of the financial crisis, and the international trade and investment situation is still idle. However, the ports in the Bohai-rim port group have begun to significantly increase inputs, resulting in a sharp decline in environmental efficiency. Then, in order to quickly improve the air quality, China issued the “Three-Year Action Plan for Atmospheric Cleanliness” in 2018, which proposed to optimize and adjust the cargo transportation structure, requiring bulk cargo to be mainly transported by rail or water in principle. At the same time, it emphasized accelerating the upgrading of vehicle and ship structures, requiring clean energy vehicles to be used for newly added or replaced operating vehicles in ports. As a result, the environmental efficiency of the port has been rapidly improved. However, in 2019, China’s foreign trade environment was affected by the Sino-US trade friction and the COVID-19 pandemic. Compared with 2018, the desirable output of ports decreased significantly, resulting in a decline in global technical environmental efficiency and local pure technical of ports. As China proposes to build a new development pattern in 2020 with the domestic cycle as the main body and the domestic and international dual cycles promoting each other, the port has gained new development opportunities. Under the new development pattern, the integration of port resources and the construction of management systems have been promoted. Thus, local pure technical environmental efficiency and global technical environmental efficiency of ports have been improved. The annual average environmental efficiency of the eight ports from 2005 to 2020 is listed in the appendix (Table A.4).
4.3 Horizontal comparative analysis of port environmental efficiency
Table 4 reports the average value and rank of the three environmental efficiencies of the eight ports during the sample period from 2005 to 2020. The differences between the three types of environmental efficiency values in different ports are shown in Figure 2. The results show that under the assumption of CRS, the average value of the eight ports’ global technical environmental efficiency is 0.3896, which is at a relatively low level. Among all the sample ports, Tangshan Port has the highest global technical environmental efficiency of 0.7176, followed by Yantai Port, with a global technical environmental efficiency of 0.6251. In contrast, Yingkou Port has the lowest efficiency of only 0.1072. Under the assumption of VRS, the average local pure technical environmental efficiency of the eight ports is 0.4767, which is greater than the global technical environmental efficiency, but still at a low level. Moreover, compared with the global technical environmental efficiency, the average local pure technical environmental efficiency of each port is also more significant. In addition, the rankings of Rizhao Port and Qinhuangdao Port have been reversed, while the rankings of other ports have not changed. Specifically, Tangshan Port ranks first, followed by Yantai Port, while Yingkou Port is still in last place.
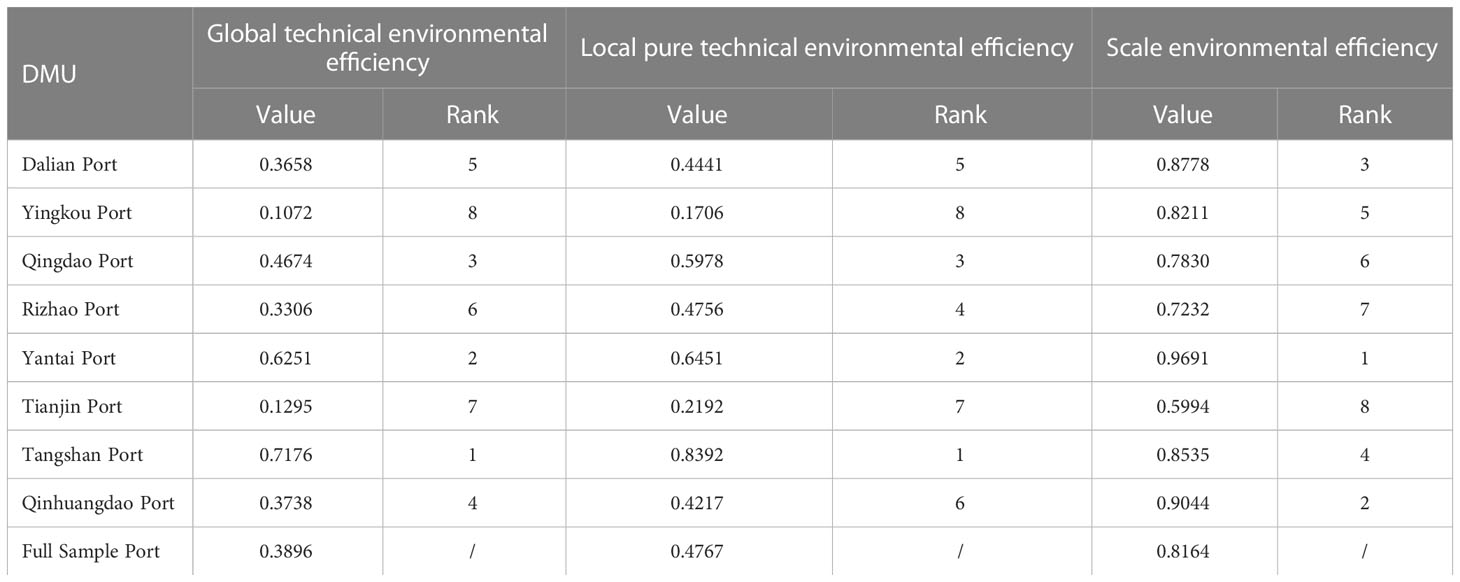
Table 4 The average value and rank of the environmental efficiency of the eight ports from 2005 to 2020.
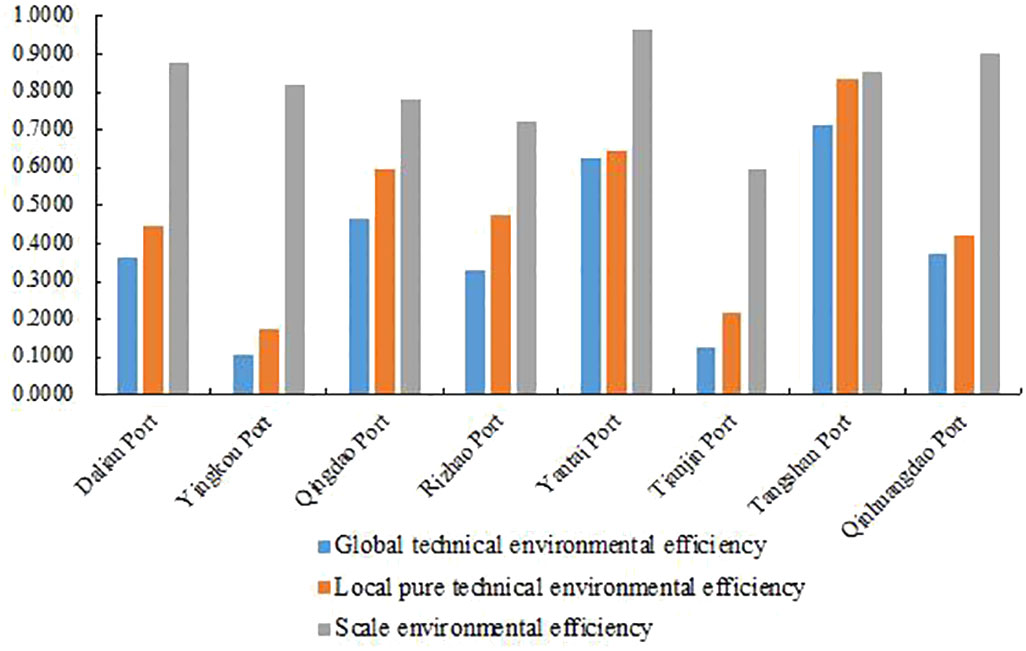
Figure 2 The annual average environmental efficiency of the eight ports.
Unlike global technical environmental efficiency and local pure technical environmental efficiency, the ranking of scale environmental efficiency varies significantly across ports. During the study period, Yantai Port ranked first in scale environmental efficiency, followed by Qinhuangdao Port, and Tianjin Port ranked last. However, Qinhuangdao Port, which ranks first in both global technical and local pure technical environmental efficiency, has dropped to fourth in scale environmental efficiency. In addition, it should be noted that whether it is global technical environmental efficiency, local pure technical environmental efficiency, or scale environmental efficiency, there are significant differences in the efficiency values of various ports. Generally, if the local pure technical environmental efficiency is relatively low, port operators can improve efficiency by adjusting inputs. If the scale environmental efficiency is relatively low, it can be improved by adjusting the size of the port. Taking Tianjin Port as an example, its scale environmental efficiency value is the smallest (0.5994), indicating that Tianjin Port needs to control the scale growth rate. Not only that, but the local pure environmental efficiency of Tianjin Port is also at an extremely low level (0.2192) and ranks second to last, indicating apparent input redundancy. Therefore, Tianjin Port urgently needs to optimize resource allocation. As a port with a large scale and high throughput, the environmental efficiency of Tianjin Port is lower than other ports. The reason may be that the port is located in the Beijing-Tianjin-Hebei region, and the excessive competition between different areas has brought enormous pressure to port operations and restricted the development of the port. Moreover, Tianjin Port, as a port that was put into operation earlier, has a particular gap with the requirements of the city’s rapid development in terms of infrastructure and operating systems, which further leads to a decline in the environmental efficiency of the port.
Overall, the main reason for the low environmental efficiency of the eight ports in the Bohai-rim port group is that they have not reached the optimal input-output level. And their scales have not reached the ideal state, especially Qingdao Port, Rizhao Port, and Tianjin Port. Proper sizing is an urgent need for these ports to become more environmentally efficient. In addition, as the only port without a passenger transport function, the global technical and local pure technical environmental efficiency of Tangshan Port are higher than that of other ports. Thus, the passenger transport function is an essential output in the evaluation system of port environmental efficiency. If the output factor of the passenger transport function is ignored, evaluating port environmental efficiency will not be objective and accurate.
5 Conclusion and policy implications
In implementing China’s dual carbon goals, ports must establish a green transportation development model to promote the intensive use of resources and contribute to emission reduction and carbon reduction. The traditional evaluation of port efficiency does not fully consider energy consumption and carbon emissions. It cannot provide a practical reference for the current low-carbon transformation of Chinese ports. In this study, taking eight ports in the Bohai-rim port group as examples, the SBM model is employed to evaluate the port efficiency considering the environmental factors of carbon dioxide emissions and energy consumption. First, we estimate the global technical environmental efficiency, local pure technical environmental efficiency, and scale environmental efficiency of eight representative ports in the Bohai-rim port group from 2005 to 2020. Secondly, through longitudinal comparative analysis, the changing trends of the three environmental efficiencies of ports during the study period are discussed. Finally, through horizontal comparative analysis, the differences between the three environmental efficiencies among the eight ports are discussed.
The study finds that the environmental efficiency of ports is at a low level from 2005 to 2020. Across all DMUs, only 14.06% of the global technical environmental efficiency is effective, as is the scale environmental efficiency, and only 20.31% of the DMUs have effective local pure technical environmental efficiency. From the perspective of changing trends, the global technical environmental efficiency and local pure technical efficiency of ports fluctuate significantly. After 2007 their changing trends are consistent and relatively close, while the scale environmental efficiency is relatively stable. However, the gap between global technical environmental efficiency and local pure technical efficiency has gradually increased since 2017. The scale environmental efficiency has also shown a clear fluctuation trend since then. From the perspective of the development of each port, the average local pure technical environmental efficiency of each port is greater than the global technical environmental efficiency, and the ranking of ports changes little. In contrast, the ranking of the scale environmental efficiency is entirely different from the ranking of the other two environmental efficiencies. Moreover, the efficiency values of various ports are pretty different in terms of different environmental efficiencies.
Based on the findings, ports should pay more attention to improving local pure technical environmental efficiency. Global technical environmental efficiency consists of local pure technical and scale environmental efficiency. This study finds that the local pure technical environmental efficiency of the port is significantly lower than the scale environmental efficiency. Therefore, when port operators are making management decisions, it is necessary to spend more funds on technological innovation or improvement. Technological innovation and progress can effectively reduce pollutant emissions and maximize the use of equipment, facilities, resources, etc., reducing redundancy and shortage, and promoting the advancement of port environmental efficiency. In addition, the environmental efficiency of ports has fluctuated significantly in recent years, and port operators must adjust the size of ports promptly. For example, increase cooperation with other ports by integrating resources, or take measures to optimize the size of the port itself. From the perspective of environmental governance, since the environmental efficiency of ports has been at a low level, the government should strengthen supervision and encourage ports to actively adopt operational optimization strategies for energy conservation and emission reduction. For instance, the government regulatory department can publish the environmental monitoring data of each port in real-time, and subsidize or support ports accordingly, thereby incentivizing ports to fulfill their environmental protection responsibilities, such as taking environmental factors as an important indicator of port performance, and accelerating the realization of low-carbon transformation of ports.
Although the SBM model is a well-established efficiency evaluation model and is widely used, it does not have the desirable characteristics to distinguish efficient DMUs with the same efficiency score equal to 1, resulting in limited analysis depth of port environmental efficiency. Therefore, it is necessary to further study the environmental efficiency of ports from the perspective of model improvement. Furthermore, the Bohai-rim ports around the Bohai Sea are coastal ports, so the results have limited applicability to other ports, such as river ports. Future research must focus on the environmental efficiency of non-coastal ports when data are available. In addition, optimizing input-output elements can improve the competitiveness of ports (Xu et al., 2022c). Future research may discuss how to improve port competitiveness under the dual carbon goals from the perspective of enhancing port environmental efficiency.
Data availability statement
The original contributions presented in the study are included in the article/Supplementary Material. Further inquiries can be directed to the corresponding author.
Author contributions
JL, conceptualization, writing - review and editing. JR, conceptualization, investigation, and writing - original draft. XM, methodology, formal analysis, and investigation. GX, supervision. All authors contributed to the article and approved the submitted version.
Funding
This study was supported by the Fundamental Research Funds for the Central Universities (Grant No. ZY2206), National Natural Science Foundation of China (No. 52002243), Fund of Hubei Key Laboratory of Inland Shipping Technology (No. NHHY2021002), the Shanghai Committee of Science and Technology, China (No. 23010502000).
Conflict of interest
The authors declare that the research was conducted in the absence of any commercial or financial relationships that could be construed as a potential conflict of interest.
Publisher’s note
All claims expressed in this article are solely those of the authors and do not necessarily represent those of their affiliated organizations, or those of the publisher, the editors and the reviewers. Any product that may be evaluated in this article, or claim that may be made by its manufacturer, is not guaranteed or endorsed by the publisher.
Supplementary material
The Supplementary Material for this article can be found online at: https://www.frontiersin.org/articles/10.3389/fmars.2023.1129659/full#supplementary-material
References
Baran J., Górecka A. (2015). Seaport efficiency and productivity based on data envelopment analysis and malmquist productivity index. Logistics Sustain. Transport 6 (1), 25–33. doi: 10.1515/jlst-2015-0008
Barros C. P. (2012). Productivity assessment of African seaports. Afr. Dev. Rev. 24 (1), 67–78. doi: 10.1111/j.1467-8268.2011.00305.x
Birgun S., Akten N. (2005). Relative efficiencies of seaport container terminals: A DEA perspective. Int. J. Integrated Supply Manage. 1 (4), 442–456. doi: 10.1504/IJISM.2005.006305
Bonilla M., Casarús S. R., Medal A. (2004). An efficiency analysis with tolerance of the Spanish port system. Int. J. transport economics: Rivista internazionale di economia dei trasporti 3, 1000–1022. doi: 10.1400/16923
Chang Y. T., Jo A., Choi K. S., Lee S. (2021). Port efficiency and international trade in China. Transportmetrica A: Transport Sci. 17 (4), 801–823. doi: 10.1080/23249935.2020.1817169
Charnes A., Cooper W. W., Rhodes E. (1978). Measuring the efficiency of decision making units. Eur. J. Oper. Res. 2 (6), 429–444. doi: 10.1016/0377-2217(78)90138-8
Cooper W. W., Seiford L. M., Tone K. (2007). Data envelopment analysis: a comprehensive text with models, applications, references and DEA-solver software Vol. 2 (New York: Springer).
Cullinane K. P., Wang T. F. (2006). The efficiency of European container ports: A cross-sectional data envelopment analysis. Int. J. Logistics: Res. Appl. 9 (1), 19–31. doi: 10.1080/13675560500322417
da Costa D. S., de Assis M. V. G. S., de Figueiredo N. M., de Moraes H. B., Ferreira R. C. B. (2021). The efficiency of container terminals in the northern region of Brazil. Util. Policy 72, 101278. doi: 10.1016/j.jup.2021.101278
Dong G., Zhu J., Li J., Wang H., Gajpal Y. (2019). Evaluating the environmental performance and operational efficiency of container ports: An application to the maritime silk road. Int. J. Environ. Res. Public Health 16 (12), 2226. doi: 10.3390/ijerph16122226
Elsayed A., Khalil N. S. (2017). Evaluate and analysis efficiency of safaga port using DEA-CCR, BCC and SBM models–comparison with DP world sokhna. IOP Conf. Series: Materials Sci. Eng. 245 (4), 42033. doi: 10.1088/1757-899X/245/4/042033
Ge Y. Y., Wang S. S. (2021). Total factor productivity and influencing factors analysis for ports considering carbon emissions. J. Transp. Syst. Eng. Inf. Technol. 21 (2), 22. doi: 10.16097/j.cnki.1009-6744.2021.02.004
Huang R. (2022). The road to china’s sustainable development. Sustain. Horizons 1, 100004. doi: 10.1016/j.horiz.2021.100004
Lee T., Yeo G. T., Thai V. V. (2014). Environmental efficiency analysis of port cities: Slacks-based measure data envelopment analysis approach. Transport Policy 33, 82–88. doi: 10.1016/j.tranpol.2014.02.009
Liu J. S., Lu L. Y., Lu W. M., Lin B. J. (2013). A survey of DEA applications. Omega 41 (5), 893–902. doi: 10.1016/j.omega.2012.11.004
Liu S., Park S. H., Choi Y. S., Yeo G. T. (2022). Efficiency evaluation of major container terminals in the top three cities of the pearl river delta using SBM-DEA and undesirable DEA. Asian J. Shipping Logistics 38 (2), 99–106. doi: 10.1016/j.ajsl.2022.03.001
Na J. H., Choi A. Y., Ji J., Zhang D. (2017). Environmental efficiency analysis of Chinese container ports with CO2 emissions: An inseparable input-output SBM model. J. Transport Geogr. 65, 13–24. doi: 10.1016/j.jtrangeo.2017.10.001
Nikolaou P., Dimitriou L. (2021). Lessons to be learned from top-50 global container port terminals efficiencies: A multi-period DEA-tobit approach. Maritime Transport Res. 2, 100032. doi: 10.1016/j.martra.2021.100032
Shen Q. (2021). “Evaluation of china’s green port development performance based on DEA,” in Proceedings of 2nd International Symposium on Frontiers of Economics and Management Science (FEMS 2021). (Wuhan Zhicheng Times Cultural Development Co., Ltd.), 141–150. doi: 10.26914/c.cnkihy.2021.005801
Simões P., Marques R. C. (2010). Influence of congestion efficiency on the European seaports performance: does it matter? Transport Rev. 30 (4), 517–539. doi: 10.1080/01441640903175592
Tone K. (2001). A slacks-based measure of efficiency in data envelopment analysis. Eur. J. Oper. Res. 130 (3), 498–509. doi: 10.1016/S0377-2217(99)00407-5
Tongzon J. (2001). Efficiency measurement of selected Australian and other international ports using data envelopment analysis. Transportation Res. Part A: Policy Pract. 35 (2), 107–122. doi: 10.1016/S0965-8564(99)00049-X
Tovar B., Wall A. (2019). Environmental efficiency for a cross-section of Spanish port authorities. Transportation Res. Part D: Transport Environ. 75, 170–178. doi: 10.1016/j.trd.2019.08.024
Wiegmans B., Witte P. (2017). Efficiency of inland waterway container terminals: Stochastic frontier and data envelopment analysis to analyze the capacity design-and throughput efficiency. Transportation Res. Part A: Policy Pract. 106, 12–21. doi: 10.1016/j.tra.2017.09.007
Xiao G., Cui W. (2023). Evolutionary game between government and shipping companies based on shipping cycle and carbon quota. Front. Mar. Sci. 10. doi: 10.3389/fmars.2023.1132174
Xiao G., Wang T., Luo Y., Yang D. (2023). Analysis of port pollutant emission characteristics in united states based on multiscale geographically weighted regression. Front. Mar. Sci. 10. doi: 10.3389/fmars.2023.1131948
Xu L., Di Z., Chen J. (2022a). Evolutionary game of inland shipping pollution control under government co-supervision. Mar. Pollut. Bull. 171, 112730. doi: 10.1016/j.marpolbul.2021.112730
Xu L., Xie F., Wang C. (2022c). Passive or proactive capacity sharing? a perspective of cooperation and competition between two regional ports. Maritime Policy Manage. 49 (4), 492–509. doi: 10.1080/03088839.2021.1876938
Xu L., Zhao X. Y., Chen J. H. (2022b). Exploring the governance dilemma of nuclear wastewater in fukushima: A tripartite evolutionary game model. Ocean Coast. Manage. 225, 106220. doi: 10.1016/j.ocecoaman.2022.106220
Yu Y., Sun R., Sun Y., Shu Y. (2022). Integrated carbon emission estimation method and energy conservation analysis: The port of Los angles case study. J. Mar. Sci. Eng. 10 (6), 717. doi: 10.3390/jmse10060717
Keywords: environmental efficiency, carbon emissions, China’s Bohai-rim ports, SBM model, dual carbon goals
Citation: Li J, Ren J, Ma X and Xiao G (2023) Environmental efficiency of ports under the dual carbon goals: Taking China’s Bohai-rim ports as an example. Front. Mar. Sci. 10:1129659. doi: 10.3389/fmars.2023.1129659
Received: 22 December 2022; Accepted: 13 March 2023;
Published: 06 April 2023.
Edited by:
Jihong Chen, Shenzhen University, ChinaReviewed by:
Dongwei He, Shanghai Normal University, ChinaFan Jiaojiao, Zhejiang University of Technology, China
Copyright © 2023 Li, Ren, Ma and Xiao. This is an open-access article distributed under the terms of the Creative Commons Attribution License (CC BY). The use, distribution or reproduction in other forums is permitted, provided the original author(s) and the copyright owner(s) are credited and that the original publication in this journal is cited, in accordance with accepted academic practice. No use, distribution or reproduction is permitted which does not comply with these terms.
*Correspondence: Guangnian Xiao, Z254aWFvQHNobXR1LmVkdS5jbg==