 Ercan Avsar
 Jordan P. Feekings
 Ludvig Ahm Krag1
- 1Technical University of Denmark, Institute of Aquatic Resources, Section for Fisheries Technology, Hirtshals, Denmark
- 2Computer Engineering Department, Dokuz Eylul University, Izmir, Türkiye
Demersal trawling is largely a blind process where information on catch rates and compositions is only available once the catch is taken onboard the vessel. Obtaining quantitative information on catch rates of target species while fishing can improve a fisheries economic and environmental performance as fishers would be able to use this information to make informed decisions during fishing. Despite there are real-time underwater monitoring systems developed for this purpose, the video data produced by these systems is not analyzed in near real-time. In other words, the user is expected to watch the video feed continuously to evaluate catch rates and composition. This is obviously a demanding process in which quantification of the fish counts will be of a qualitative nature. In this study, underwater footages collected using an in-trawl video recording system were processed to detect, track, and count the number of individuals of the target species, Nephrops norvegicus, entering the trawl in real-time. The detection was accomplished using a You Only Look Once v4 (YOLOv4) algorithm. Two other variants of the YOLOv4 algorithm (tiny and scaled) were included in the study to compare their effects on the accuracy of the subsequent steps and overall speed of the processing. SORT algorithm was used as the tracker and any Nephrops that cross the horizontal level at 4/5 of the frame height were counted as catch. The detection performance of the YOLOv4 model provided a mean average precision (mAP@50) value of 97.82%, which is higher than the other two variants. However, the average processing speed of the tiny model is the highest with 253.51 frames per second. A correct count rate of 80.73% was achieved by YOLOv4 when the total number of Nephrops are considered in all the test videos. In conclusion, this approach was successful in processing underwater images in real time to determine the catch rates of the target species. The approach has great potential to process multiple species simultaneously in order to provide quantitative information not only on the target species but also bycatch and unwanted species to provide a comprehensive picture of the catch composition.
Introduction
Demersal trawling is an effective way of catching various species. However, usage of demersal trawls is challenged by several factors such as high bycatch rates and negative effects on the biomass and biodiversity (Eigaard et al., 2017). In addition, disturbance of the seabed by bottom trawls results in aqueous CO2 emissions which may inhibit marine carbon cycling after years of continuous trawling (Sala et al., 2021). Despite the presence of such concerns, demersal trawling is critical for catching economically valuable commercial species like shrimp, whitefish, and Nephrops.
Nephrops excavate burrows in mud or mud/sand substrates and emerge at specific times to feed, mate and maintain their burrows, among others (Tully and Hillis, 1995; Aguzzi and Sardà, 2008; Feekings et al., 2015). Their behavior is influential on catch rates when trawling as they need to be outside of the burrows to be caught (Main and Sangster, 1985). Besides, Nephrops-directed bottom trawling is known to have high discard rate which eventually causes not only economic loss but also loss of undersized individuals (Bergmann et al., 2002). In addition to these issues, is demersal trawling a blind process, meaning that the catch and size composition is unknown until the trawl is taken onboard after hours of trawling.
Advancements in underwater camera technologies may provide solutions to some limitations in demersal trawling. In particular, such cameras allow for recognition, counting and measurement of the individuals making it possible to understand the catch rates of Nephrops and unwanted species. Even though there are different tasks such as species identification and length measurement (Underwood et al., 2014; Underwood et al., 2018; Allken et al., 2021), and segmentation of the fish from the background (Prados et al., 2017) accomplished using in-trawl camera systems, they do not concern determining the catch composition in real time. The real-time processing of video footage collected by underwater in-trawl cameras is important to quantify catch rates of the target species. This information is valuable for the fishermen as it provides insight about the ongoing fishing process and further enable active search for better catch rates during the fishing operation. Deep learning-based methods enable automated extraction of such information. In fisheries research, deep learning is mostly used for processing visual data collected either onboard or by using underwater cameras. However, the main issue related with deep learning methods is the substantiality of the associated computation amount which brings about drawbacks like latency in processing and requirement of hardware with sufficient computational capacity. To address this issue, various deep learning models with different sizes have been developed, and they can be applied to different problems. A review of related literature is provided in Section 2. There are deep learning-based methods available that are applicable to underwater videos collected by in-trawl cameras for real-time detection and counting of Nephrops. A fast and accurate video processing system in Nephrops fisheries is useful for generating the spatial distribution of catch items as well as determining the number of Nephrops caught.
In this study, a real-time processing pipeline for underwater videos to determine the number of Nephrops caught during demersal trawling is proposed as such information will provide a strong decision tool for fishers to optimize their catching operation. The processed video footages were collected by an in-trawl camera developed earlier (Sokolova et al., 2021b). The algorithm for Nephrops counting has three major steps that are i) Nephrops detection, ii) tracking of the detected Nephrops, and iii) determining the true tracks accounted for Nephrops catches. The accurate detection of Nephrops in the video frames is important as the subsequent steps rely on the detected Nephrops. The detection has been accomplished using You Only Look Once v4 (YOLOv4) model which is known to be a fast deep learning model for object detection operating at high frames-per-second (FPS) values. In addition, two variants of YOLOv4, namely, YOLOv4-Tiny and YOLOv4-Scaled are used separately for Nephrops detection, and their effects on the tracking, counting, and the overall processing speed are observed and compared. The second step, tracking detections, is necessary for making association between the detections in the consecutive video frames. Simple Online Realtime Tracking (SORT) algorithm is used as the object tracker. For benchmarking purposes, the tracking performance of SORT is compared with two other object tracking algorithms, those being Minimum Output Sum of Squared Error (MOSSE) and DeepSORT. Finally, tracked objects satisfying some predefined conditions are considered as a Nephrops catch. These steps are illustrated in Figure 1. In this study we address the following research questions:
● How do the different YOLO-based object detection methods affect the overall speed and accuracy of the counting process?
● What is the range of the processing speed of the proposed algorithm, and can it be considered as real-time under different circumstances?
● Is it possible to provide simple decision parameters for the fishers during trawling operation?
● What is the relation between the precision of the object detection and rate of correct Nephrops counts?
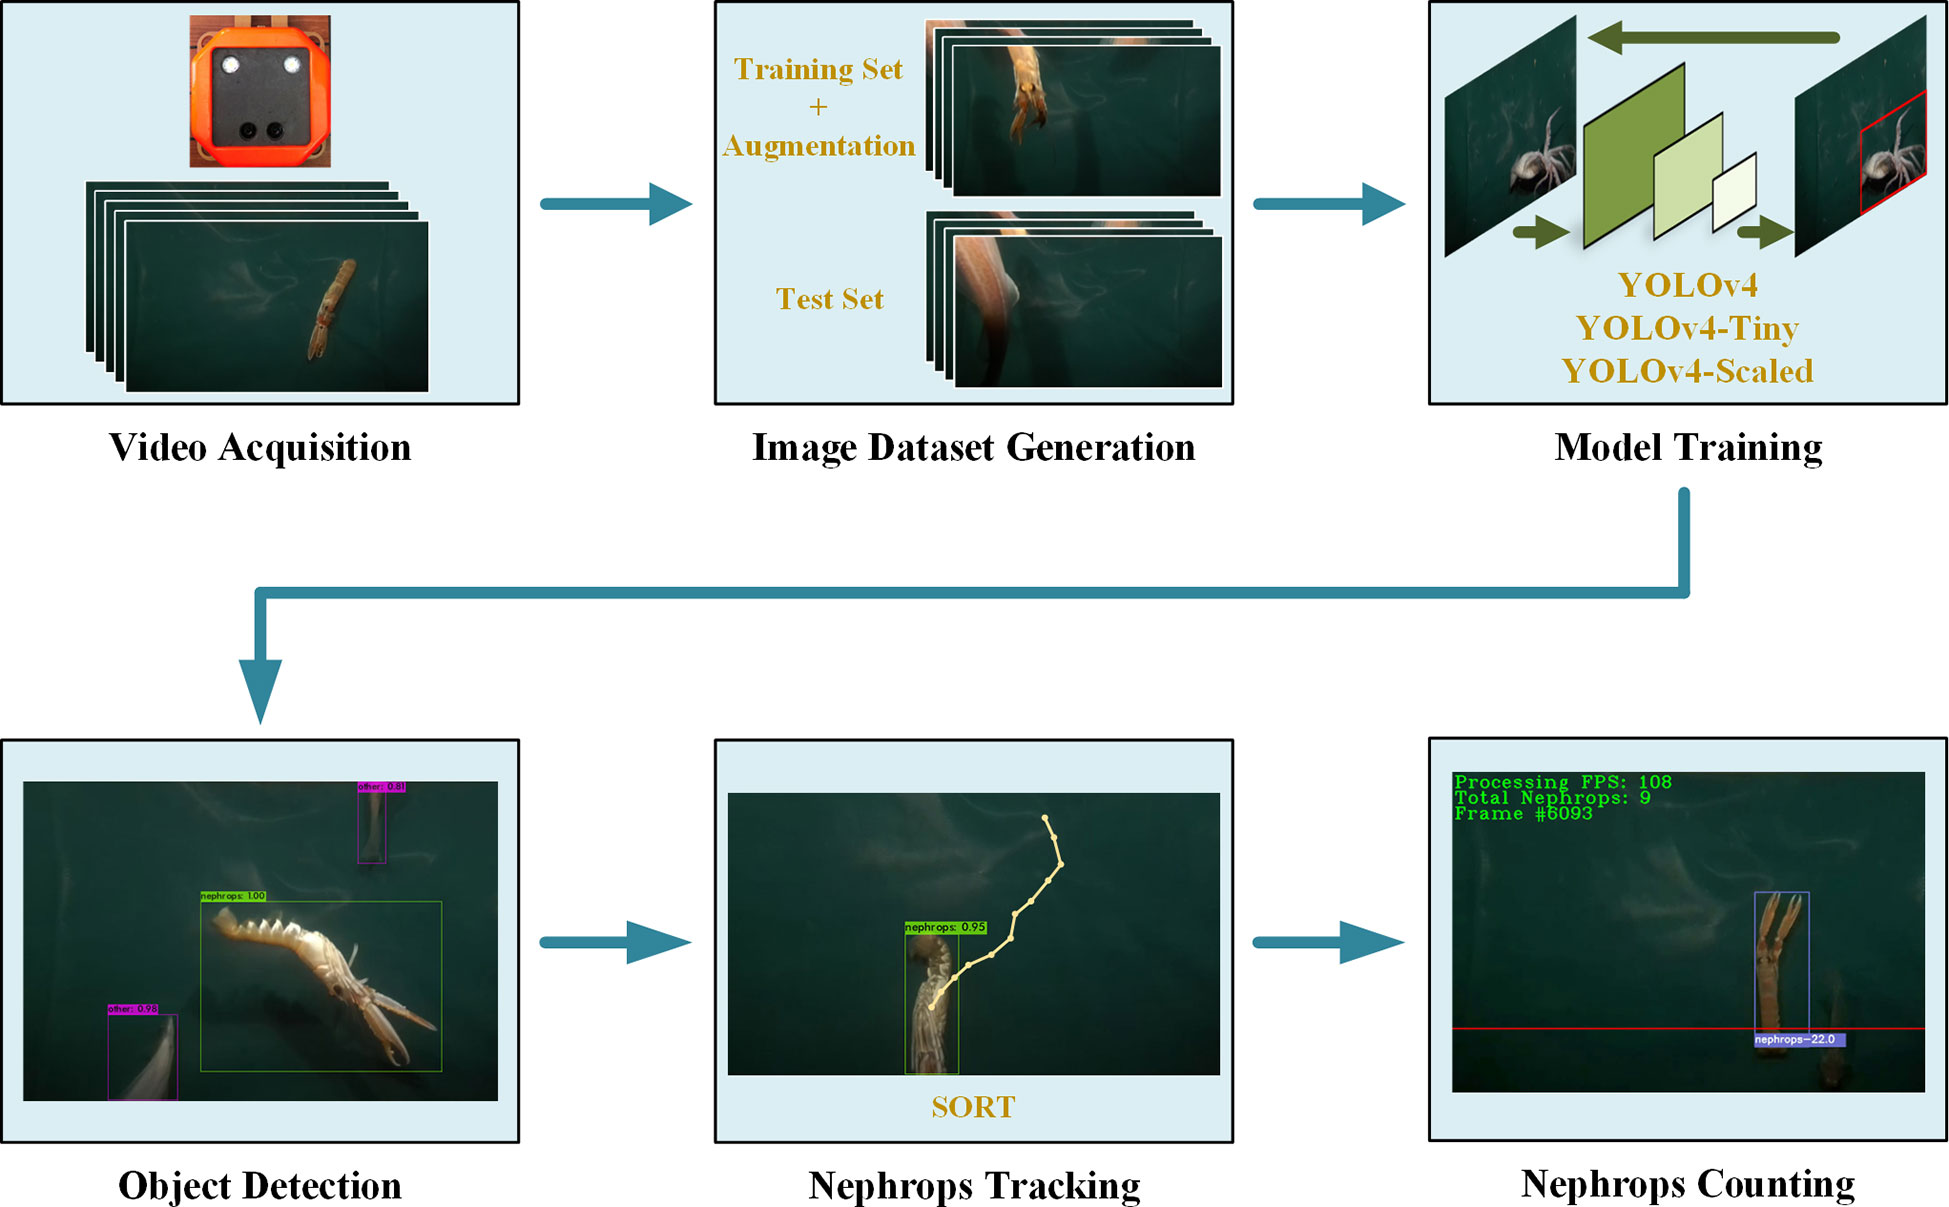
Figure 1 Overview of the algorithm steps.
Related work
Utilization of deep learning methods in computer vision applications has become widespread in recent years due to their major advantage of automated feature extraction. However, the deep learning models typically possess many computational layers with high numbers of parameters. Performing all the calculations throughout all layers of the network takes time and hence the latency becomes an issue when the input data needs to be processed in real time.
Depending on the type of the problem (e.g. image classification, object detection, instance segmentation), there are various techniques to reduce the computational cost of the deep learning models while keeping the model performance as high as possible. For instance, MobileNets are efficient models developed to be used in hardware with limited computational resources (Howard et al., 2017) and can be used as a standalone classifier for animal classification in underwater images (Liu et al., 2019). Together with two other improved versions (Sandler et al., 2018; Howard et al., 2019) and single shot object detectors (SSD), they have more diverse applications such as detection of sea cucumbers (Yao et al., 2019), underwater objects with different scales (Zhang et al., 2021; Wang et al., 2022b), and Nephrops burrows (Naseer et al., 2020).
Another object detection method with many versions is YOLO, which is known for being very fast and accurate at the same time (Redmon et al., 2015). It can predict the bounding box coordinates and the corresponding confidence scores with one single network. There are numerous YOLO versions dedicated to operating on underwater images for detection of various objects such as starfish, shrimp, crab, scallop, and waterweed (Liu et al., 2020; Zhao et al., 2022). Among these models, the recently proposed model, YOLO-fish was designed for fish detection and is reported to be performing close to YOLOv4 model on two different public datasets (Muksit et al., 2022). Even though it is claimed to be a lightweight model the associated number of parameters and the detection time are between those of YOLOv3 and YOLOv4 (Muksit et al., 2022). In another study, an underwater imaging system to develop and test a lightweight YOLO model for automated fish behavior analysis was introduced (Hu et al., 2021). In that study, a modified version of YOLOv3-Lite model was proposed, and its detection performance as well as the prediction speed were compared with other state of the art models. It was shown that the proposed model works at 240 FPS processing speed while detecting the fish with higher precision and recall values.
Changing the detection scale, increasing the number of anchor boxes, or defining a new loss function are some of the modifications that can be done in the YOLO network structure (Raza and Hong, 2020). Moreover, combining the output of the YOLO model with other information sources such as optical flow and Gaussian mixture models is another strategy to obtain an improved detection in underwater images (Jalal et al., 2020).
In addition to underwater image and video processing methods, there are different applications to identify fish types on the vessel. Such studies involve usage of image classifiers based on convolutional neural networks (CNN) (Zheng et al., 2018) or instance segmentation networks such as Mask R-CNN (French et al., 2020; Tseng et al., 2020). Such segmentation operations are also useful in making morphological measurements on underwater fish images (Petrellis, 2021). This approach may be practical when the aim is to get an estimate of the individual fish sizes and weights in the catch.
The existing studies focus on either improving the detection performance, the computational load in individual images or application of the deep learning models to a new problem domain. In particular, object detection and tracking are widely studied today in various problem domains such as face recognition (Vijaya Kumar and Mahammad Shafi, 2022), processing of aerial images (ElTantawy and Shehata, 2020; Wu et al., 2022), and maritime surveillance (Jin et al., 2020). Despite the presence of many studies with different purposes and strategies, the number of studies concerning the real-time processing while tracking and counting the detected fish is very limited. In a study that is aimed to serve as a precursor to fish counting tasks, deep learning was used to classify the environmental conditions (Soom et al., 2022). According to the detected conditions, some traditional image processing methods were applied to the image to detect the presence/absence of fish. Even though no object detection and tracking were involved, the processing speed and power consumption of the proposed algorithm was evaluated on different hardware with various specifications.
On the other hand, there exists tracking algorithms developed for underwater objects like fish schools (Liu et al., 2022). In that work, a ResNet50 model was used as the feature extractor and an amendment detection module was proposed to improve the object detection and hence the performance of the tracking. The proposed model was compared with four different tracking algorithms, and it was shown that it outperforms the others in three out of four metrics. In two other studies, an experimental setup was prepared for collecting video footage using a web cam placed above a small fish tank. The fish in the tank were detected by YOLOv3-Tiny model that is trained on the specific dataset. Next, the tracking of the detections was accomplished by optical flow (Mohamed et al., 2020) or Euclidean distance (Wageeh et al., 2021). In these studies, tracking performances are provided poorly with no clear definition of a fish count and a correct track. In another study about fish tracking, an end-to-end model was proposed to detect and track the fish in a tank and determine the abnormal behaviors (Wang et al., 2022a). For the detection task, a modified version of YOLOv5 was used and the tracking was accomplished by SiamRPN++. The proposed model was shown to be operating at 84 FPS with higher detection performance than the other object detectors.
As can be understood from the existing studies, there are many efforts for object detection and tracking in underwater videos. However, the number of applications aimed at counting specific individuals by tracking them is very limited. One example can be the method based on Mask R-CNN to detect and count the catch items during trawling (Sokolova et al., 2021a). In that study, the detections and catch counts were collected under four classes, namely, Nephrops, round fish, flat fish, and other. The study involves detailed experiments about different data augmentation methods together with tracking and counting of the catch belonging to the specified classes. Though, it focuses on improvement of the object detection performance, overlooking the detection speed of the algorithm.
Current study differs from previous studies in i) counting of Nephrops in real-time by detecting and tracking them in underwater videos, ii) comparing the effects of three different YOLO models to the performances at every stage of the algorithm as well as the overall processing speed, and iii) showing the possibility of real-time monitoring and automated description of the catch items during trawling.
Materials and methods
The video dataset
The dataset used in this study consists of five videos collected using an underwater image acquisition system mounted at the codend entrance of a demersal trawl that allows in-trawl observation during fishing (Sokolova et al., 2021b). The videos were recorded on June 27, 2020, in Skagerrak on commercial Nephrops grounds where the catch in each haul were length measured to provide size and count for all caught species The footages have different durations and Nephrops ground truth counts. The object densities in the videos are different and such a diversity allows for better performance estimation for real-world applications. The details about the videos are provided in Table 1. The stereo camera of the image acquisition system was set to record videos with a resolution of 1280 × 720 pixels at 60 frames per second (FPS). Only the videos from the right camera were used for processing the frames as the entire data output from the stereo camera is useful for generating depth maps which is not within the scope of this study.
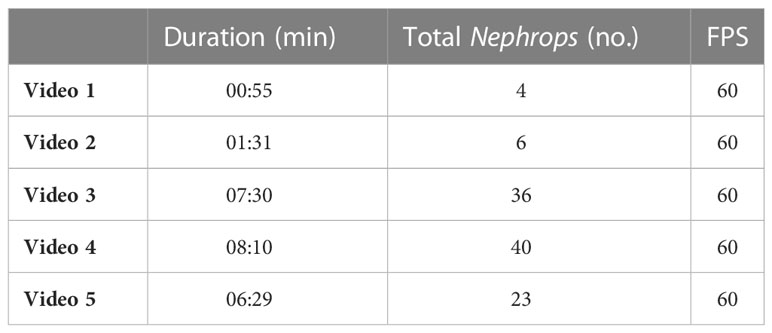
Table 1 Details of the video footages.
Nephrops detection models
Among various versions of YOLO, the fourth version (YOLOv4) is efficient and stable with various applications in different domains (Bochkovskiy et al., 2020). The object detection task is considered as a regression problem by YOLOv4, and it eliminates the necessity of using large mini-batches during training. It optimizes the trade-off between the detection speed and accuracy, which means that it is possible to obtain accurate detections at high FPS values. Therefore, YOLOv4 has been selected as the primary model for Nephrops detection in this study. In addition, two variants of this model, YOLOv4-Tiny and YOLOv4-Scaled, are used to compare their performances.
YOLOv4 uses a CSPDarknet53 model as the feature extractor backbone. It contains 29 convolutional layers and has advantages like high receptive field and a large number of parameters that are required for an accurate object detection (Bochkovskiy et al., 2020). The output feature maps of the CSPDarknet53 are passed through a multi-scale max-pooling operation. This operation is implemented by a spatial pyramid pooling (SPP) layer where outputs of four max-pooling operations with kernel sizes 1x1, 5x5, 9x9, and 13x13 are concatenated. Processing with the SPP layer is important for increasing the receptive field and separate the contextual features. YOLOv4 also uses features at different levels of the feature extractor backbone. To accomplish this, feature maps from three layers of the CSPDarknet53 model are input to the path aggregation network (PANet) in which the features are fused both in top-down and bottom-up directions. Such an aggregation allows for simultaneous utilization of localization information present in the lower level features and semantic information in the higher level features. The extracted features with this structure are then passed through a YOLOv3 head to predict bounding box locations and the corresponding confidence scores. To improve generalization and reduce the risk of overfitting, two new methods are introduced in the algorithm: Mosaic and Self-Adversarial Training (SAT). In addition, a continuously differentiable and smooth function Mish is used as the activation between the layers of the network.
YOLOv4-Tiny is a lightweight version of the original YOLOv4 architecture. The major differences are in the numbers of anchor boxes and the convolutional layers in the backbone. Specifically, the tiny model has six anchor boxes while the original version has nine. Also, the number of YOLO prediction layers was reduced from three to two, which allows higher prediction speed while performing poor on the small objects. The scaled version of YOLOv4 (YOLOv4-Scaled) introduces modifications in the backbone and neck structures of the YOLOv4 architecture (Wang et al., 2020). In particular, the first CSP layer in the CSPDarknet53 backbone was replaced by a Darknet residual layer. In addition, up and down feature scaling operations in the PANet and pooling operations in the SPP module are enhanced by CSP blocks that ultimately may decrease the computation cost by 40%.
Tracking and counting of the detected nephrops
Since the main goal of the study is to automatically count the number Nephrops entering the trawl, the detected Nephrops should be tracked as they appear in the frames. To accomplish this, an algorithm to make association between the detections in the consecutive frames should be implemented. This is done by object tracking algorithms that are particularly useful when the object of interest is occluded or not detected for a certain number of frames.
Simple Online and Real-time Tracking (SORT) is the object tracking method used in this study (Bewley et al., 2016). SORT uses 2D motion information for modeling the state (i.e. bounding box location, area, and aspect ratio) of each track in the video. Kalman filter with a linear velocity model predicts the state of the tracks for the next frame (Kalman, 1960). The association between the detections and the predicted tracks is accomplished by applying the Hungarian algorithm (Kuhn, 1955) on the cost matrix whose entries are the IoU values between the detections and predictions. In order to highlight the suitability of the SORT algorithm for real time Nephrops tracking, the performance of two other tracking methods, MOSSE and DeepSORT, are tested as well. Details of this comparison are given in Section 4.4.
Due to occlusions or inaccuracy of the object detector model, the target objects may not be detected in all frames when they are in the field of view of the camera. These discontinuities in the detection constitute a challenge for the tracking process. SORT algorithm is capable of predicting the bounding box coordinates in case of such discontinuities. However, if a track is not associated with a detection for 30 consecutive frames, then this track is considered finished. This means that the finished track will not be considered for association with the new detections anymore.
In order to determine the count for the Nephrops catches, the tracks output by the SORT tracker are checked. This is done with the help of a horizontal level defined at the top 4/5 of the frame height. When the Nephrops are leaving the frame from the bottom, they are partly visible, and this may cause the object tracker to assign different identities to the same Nephrops as they are about to disappear. Such an identity switch may generate false positive counts if the horizontal threshold is set to be the bottom of the frame. This is the reason for selecting a level different than the bottom of the frame.
In particular, any track satisfying at least one of the following conditions increases the counter by one:
i. The track with the lower level of the associated bounding box crosses the horizontal level. When the Nephrops is tracked successfully with no occlusions or distortions, this condition is easily satisfied. This is the most common condition.
ii. The track with the center of the associated bounding box crosses the horizontal level. Due to occlusions, tracking of some Nephrops are initialized after the lower level of their bounding box is below the horizontal level. This condition is useful for counting such Nephrops.
iii. The track with the height of the associated bounding box is greater than 2/3 of the frame height. Some Nephrops pass very close to the camera causing them to appear very large and in small number of frames. In such cases, the first two conditions cannot be satisfied. So this condition allows for detecting these Nephrops.
One sample counting instance for each condition are given in Figure 2.
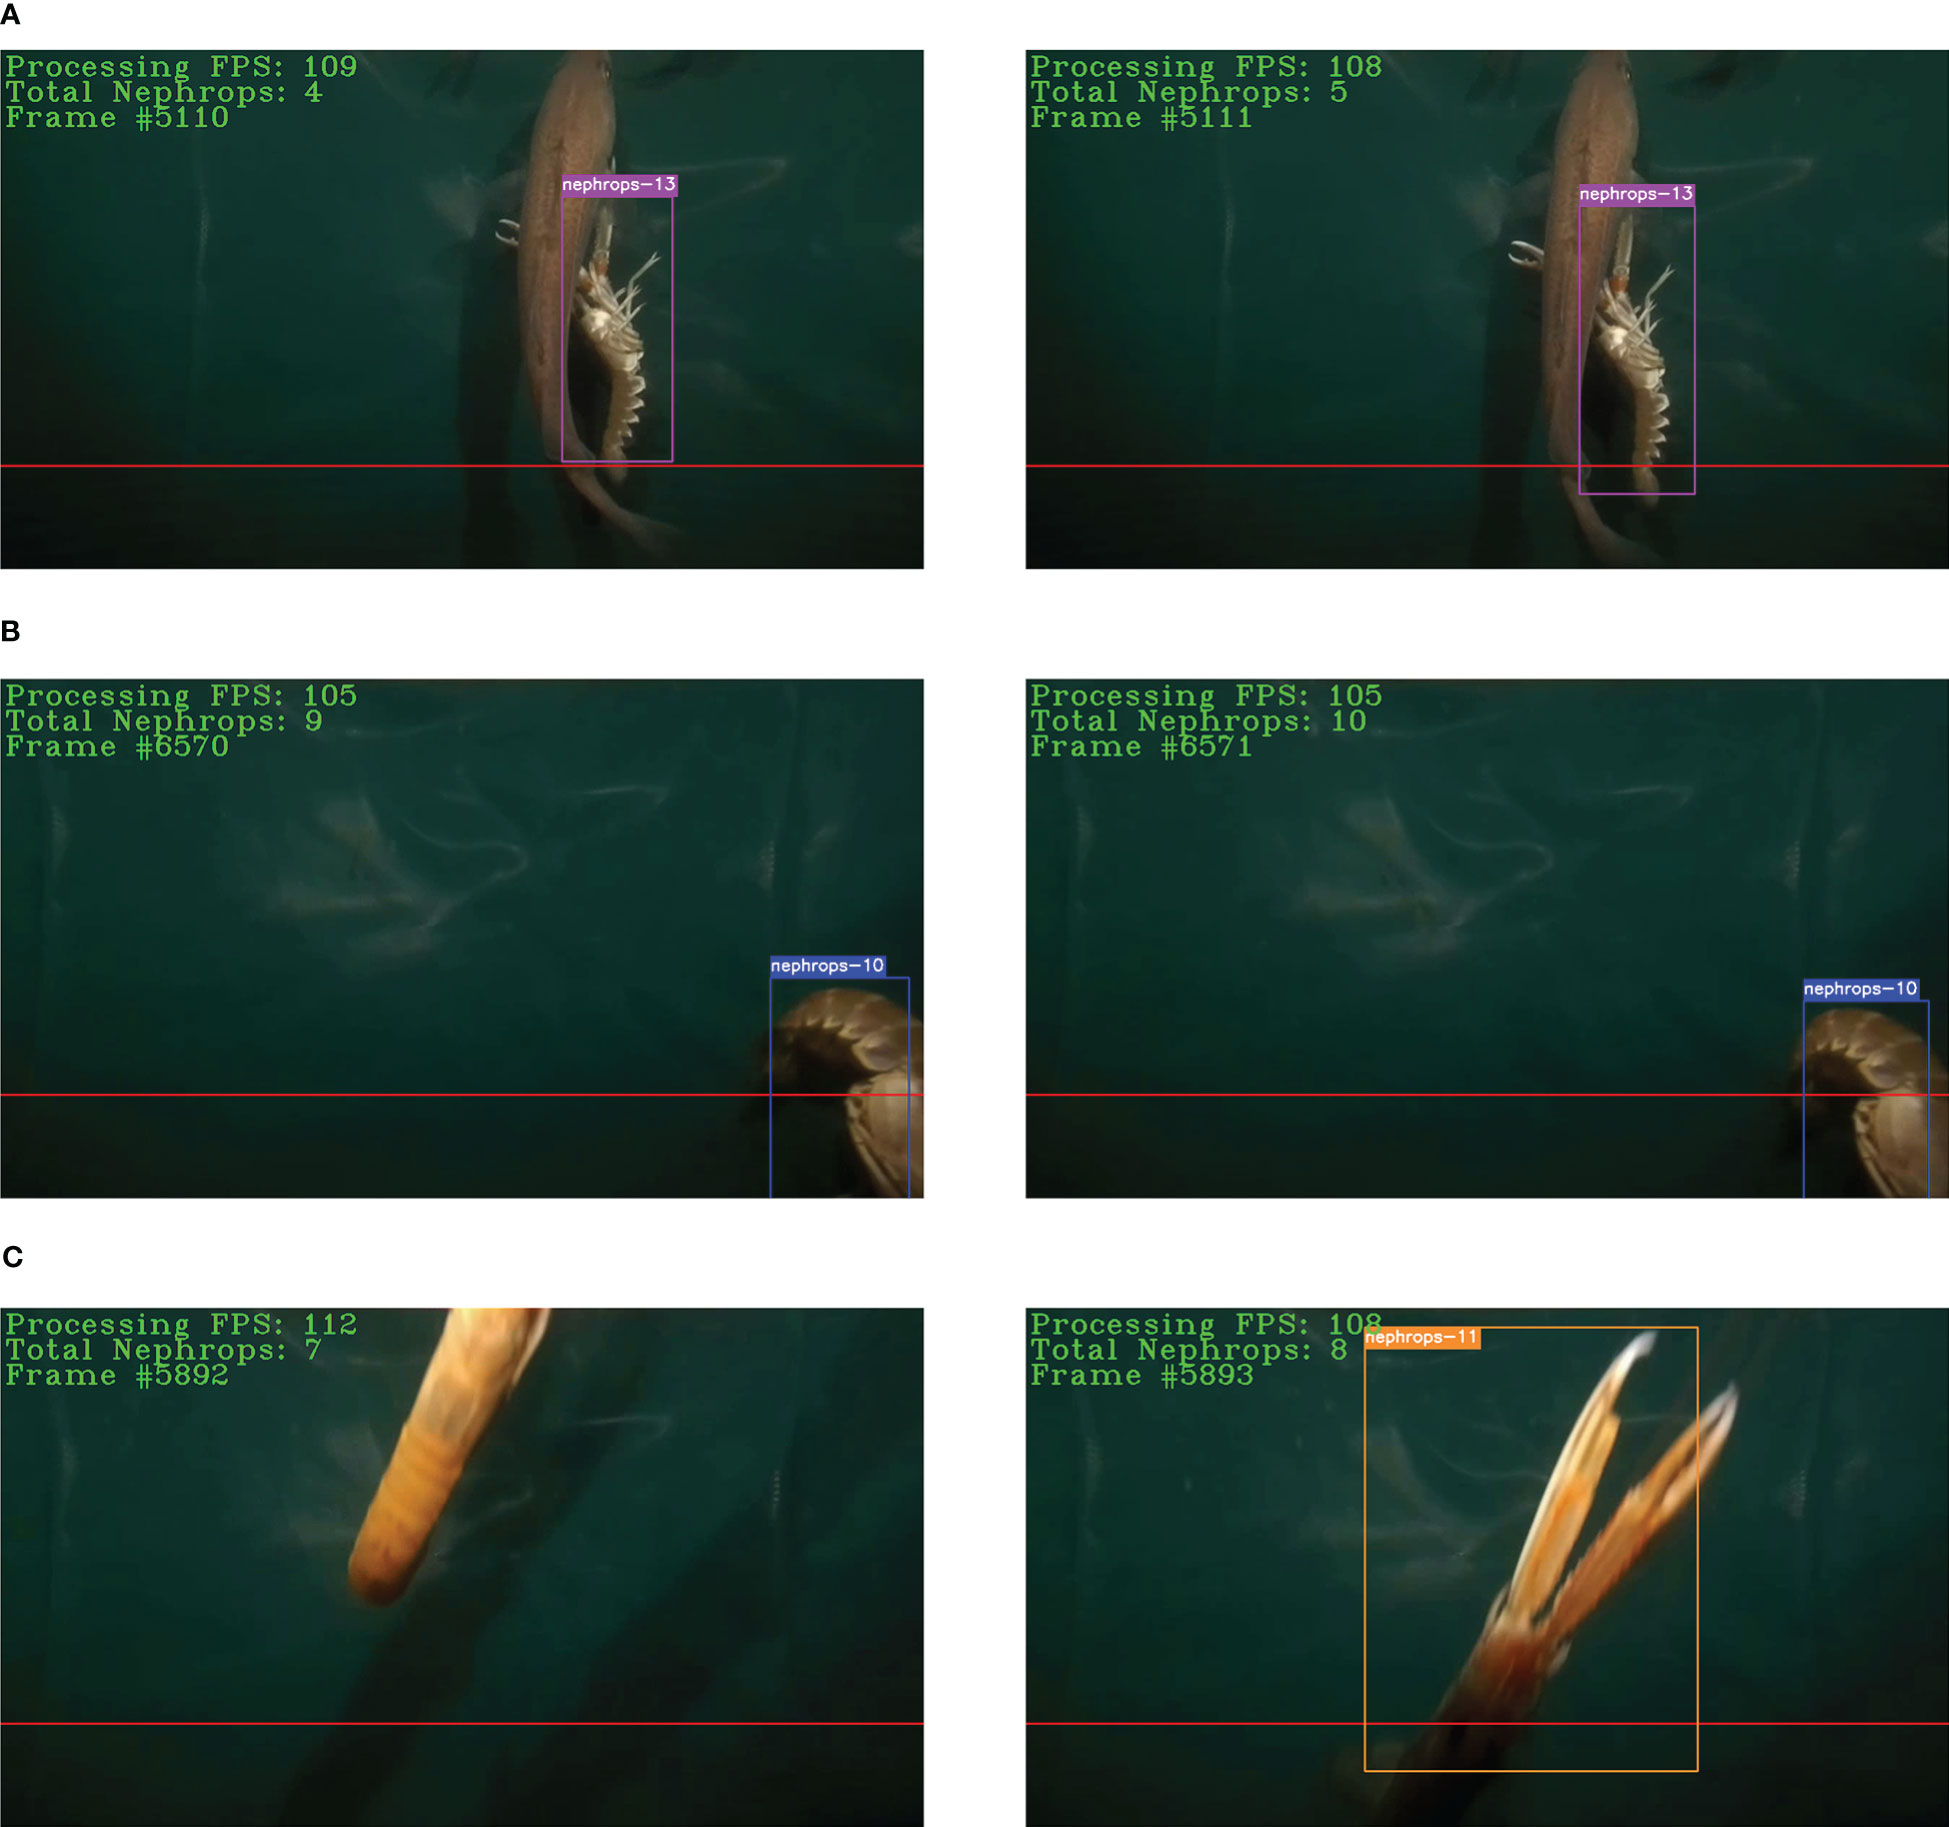
Figure 2 Illustration of the counting conditions. Two consecutive frames in the columns. (A–C) correspond to the conditions i, ii, iii, respectively.
Model training
The models mentioned in Section 3.2 are trained using an image dataset generated by the frames extracted from the videos included in this study. The majority of the frames in the videos do not contain any objects and are consequently not useful for the training process. Therefore, a manual selection of the frames with some objects is required. A total number of 4044 images were selected according to the presence of Nephrops, fish, or others. After the selection of frames, the bounding boxes for the objects in all the frames were manually labeled using the VIA annotation tool (Dutta and Zisserman, 2019). Since the aim is to count the number of Nephrops entering the gear, any object other than Nephrops was labeled as other. Therefore, the object detection step is considered as a binary detection problem.
The dataset was randomly divided into training and test sets with proportions of 87.5% and 12.5%, respectively. Next, 1000 images were generated using the Copy-Paste (CP) augmentation method and added to the training set (Ghiasi et al., 2021). When performing the CP augmentation, pixel values corresponding to the masks of the objects in the source images were pasted onto the destination images. To improve the diversity in the augmented images, some geometric transformations were applied to the images as explained in (Sokolova et al., 2021a). The details, like number of images and the object instances in the image dataset after the augmentation are given in Table 2, and three sample images are provided in Figure 3.
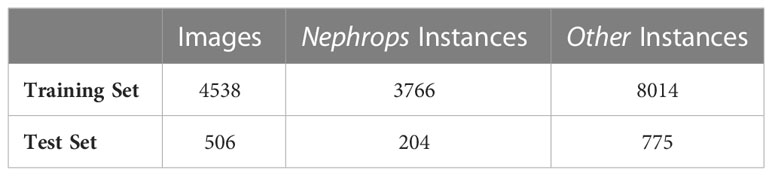
Table 2 Numbers of images and instances from both classes in the training and test sets used in the object detection step.
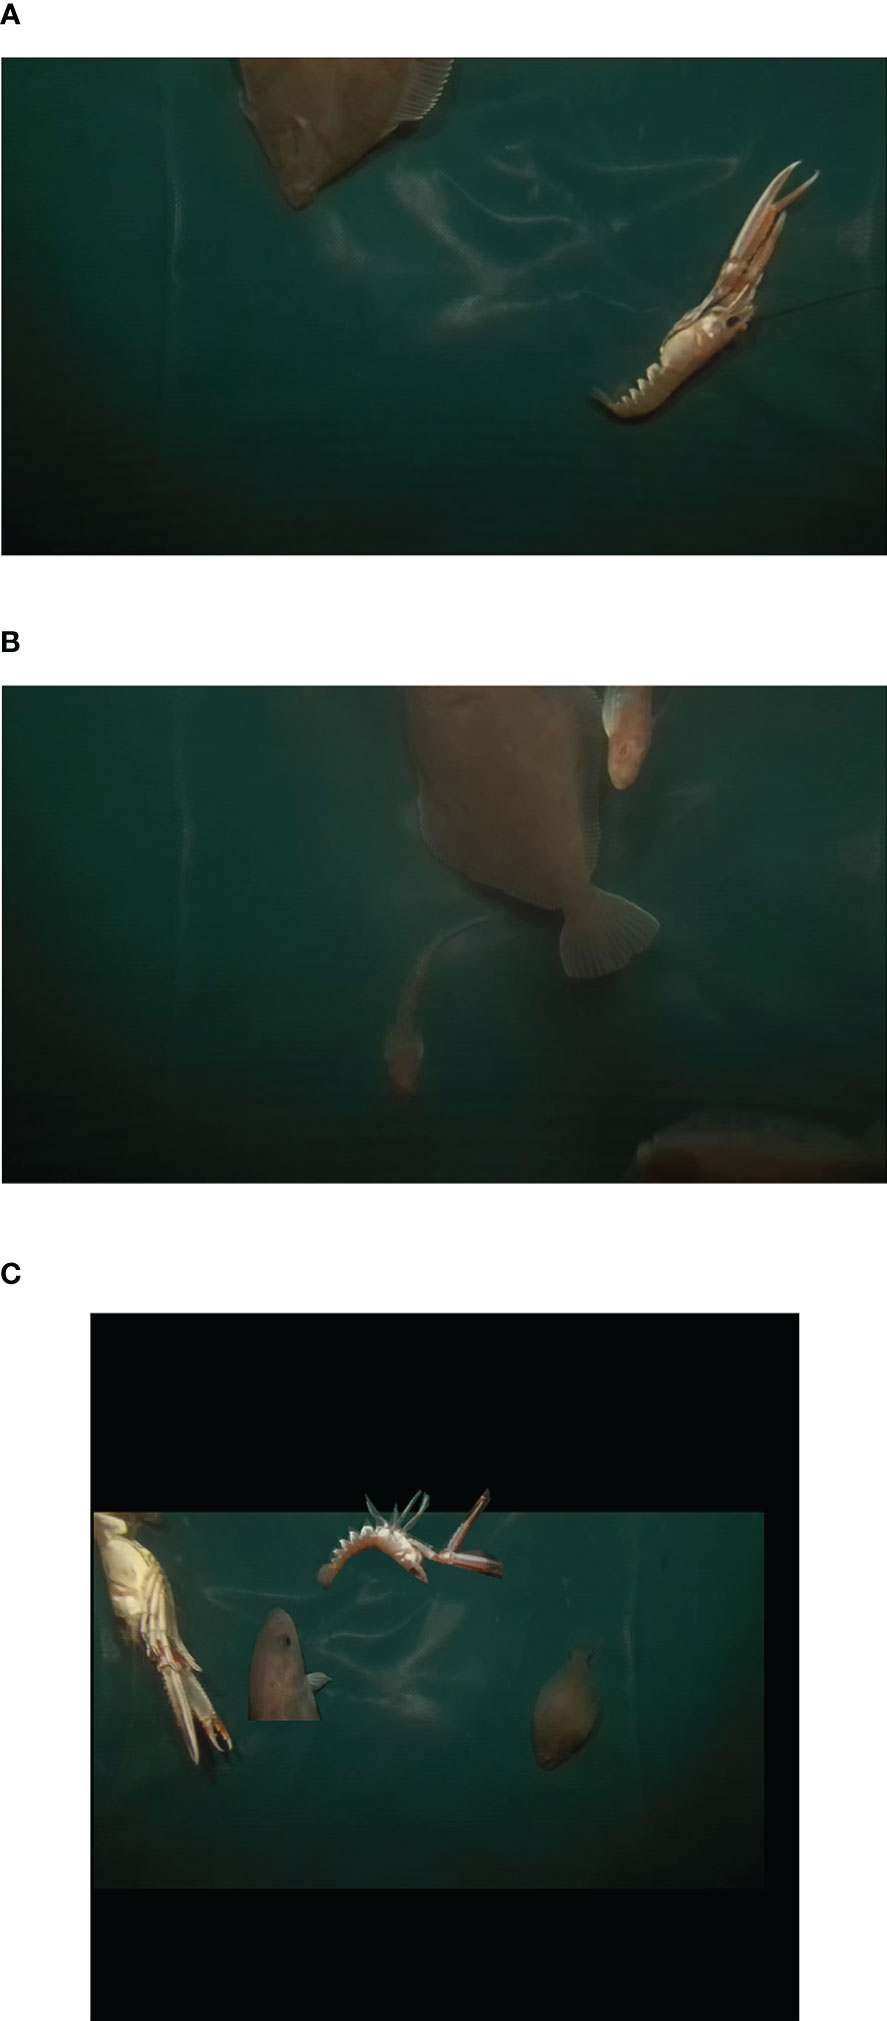
Figure 3 Samples from the image dataset. (A) An image with a Nephrops instance. (B) An image with some other instances. (C) An image with copy-paste augmentation.
The darknet framework was used for the training of the models (Redmon, 2016). The training and testing were performed on a Tesla A100 GPU with 40 GB RAM, CUDA 11.1, and cudnn v8.0.4.30. All the coding was done with Python v3.9.12 following the instructions and model configuration files made available at (Bochkovskiy, 2022). Some of the hyperparameters regarding the models and their training are listed in Table 3. Note that all the models were trained for 6000 iterations and the weights yielding the best detection performance were used in the subsequent steps.
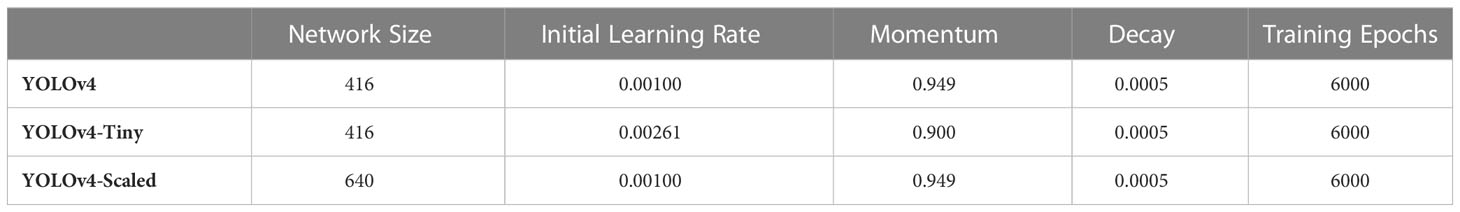
Table 3 Summary of the model settings.
Performance evaluation metrics
The performances of each step in the study are evaluated and reported separately in Section 4. To evaluate the object detection performance, different mAP values are calculated for each of the models using the test set. mAP is a quantification of the detection performance by comparing the amount of overlap between the ground truth and predicted bounding boxes. It is a widely used metric and has good representation of the detection performance as it considers both the prediction confidence score and the intersection over union (IoU) values. First, the confidence scores for the bounding boxes are converted into class labels for different threshold values. This allows to obtain a confusion matrix for each threshold and hence calculate the precision and recall values using the True Positive (TP), False Positive (FP), and False Negative (FN) in each matrix given by the following equations.
Here the subscript n represents different confidence score thresholds. The multiple (recall, precision) points correspond to a curve in 2D space (precision-recall curve), and the average precision (AP) value is the weighted mean of the precisions with the weights being the changes in the recall values.
This AP calculation procedure is repeated for all classes separately in the dataset. The average of all the AP values is defined as the mAP which can be obtained by
where c represents the number of classes in the dataset and APi is the AP value for the ith class.
The mAP value can be computed for different IoU thresholds that affects the shape of the precision-recall curves. As a convention, the mAP value is calculated for IoU = 0.50 (mAP@.50). However, for benchmarking purposes, mAP values at different IoU thresholds are calculated and averaged as well. In this study, three mAP values are provided as the detection performance of the models: mAP@.50, mAP@.75, and mAP@.50:.05:.95 (mAP values averaged for the thresholds from 0.50 to 0.95 with steps of 0.05). In addition, since the purpose is to track and count the Nephrops only, the AP values belonging to Nephrops class (APnep) are also given for the same IoU thresholds.
Having obtained the tracks as the algorithm output as explained in Section 3.3, the tracking performance metrics were calculated. Among the calculated metrics, multi-object tracking accuracy (MOTA) is a combination of three error types namely, number of misses, false positives, and mismatches. It is obtained by normalizing the total of these three errors by the number of ground truth tracks. In calculation of MOTA, only the track locations are used. In other words, no bounding box information is considered in MOTA. To overcome this situation, another metric called multi-object tracking precision (MOTP) is defined. MOTP is the average overlap between the bounding boxes of predictions and ground truths. Mostly tracked (MT) and mostly lost (ML) are two quality measures that consider the ratio of successfully tracked frames for an object. A track is MT if it is tracked for at least 80% of its life span. If the tracking ratio is less than 20%, then is called ML. Within the context of object tracking, it is also desirable to obtain tracks preserving their identities with small numbers of untracked frames. Therefore, it is possible to mention two more metrics here. Identity switch (ID-Sw) is the total number of tracks changing their identity for the same ground truth object. Fragmentation is the number of interruptions in the track where no tracking is made. Finally, higher order tracking accuracy (HOTA) combines errors originating from both association and detection (Luiten et al., 2021). Specifically, it is the geometric mean of association accuracy and detection accuracy.
Results
Detection performance of the models
The mAP and APnep values for different IoU thresholds for all three models are given in Table 4. These values are obtained by passing the test set samples in the image dataset introduced in Section 3.1 through the trained models. Note that the best weights determined during the training phase are used for prediction on the test set which can be considered as a regularization step to avoid overfitting. In other words, the weights calculated in the subsequent iterations are not considered for Nephrops detection. The best weights are obtained at iterations 4962, 5245, and 4113 for YOLOv4, YOLOv4-Tiny, and YOLOv4-Scaled, respectively.
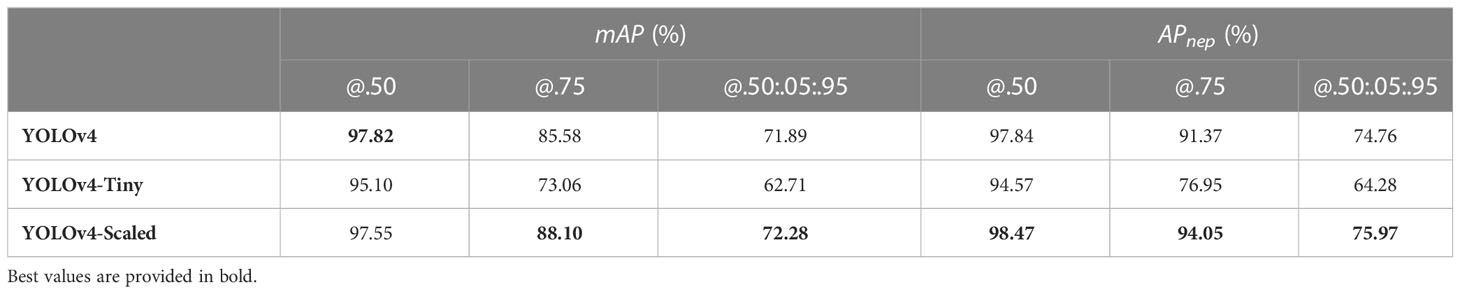
Table 4 Performance comparison of the detector models.
In most of the performance metrics, YOLOv4-Scaled outperforms the other two models. Nevertheless, the differences between YOLOv4 and YOLOv4-Scaled are minor which precludes suggesting the best model for all cases. For the threshold IoU = 0.5, the scaled version is slightly better at detection of the Nephrops, but when the AP values for both classes are considered, YOLOv4 has a higher mAP value. This means that YOLOv4-Scaled is not as precise as YOLOv4 when detecting the objects from the other class. On the other hand, the difference between the performances of YOLOv4-Tiny and the other two models is smaller when IoU = 0.5. This indicates that the tiny version is capable of detecting the bounding boxes but not with as high IoU values as those obtained by the other models.
Tracking and counting performance of the models
Note that only the tracks satisfying the count conditions were involved in the tracking performance calculation because these are the tracks used in counting performance calculation as well. In addition, the tracking metrics were obtained for all five videos separately, but their average values are provided here as one single clustered column chart (Figure 4). The MOTA, MOTP, and HOTA values are given as percentages (Figure 4A) and the rest are number of tracks (Figure 4B).
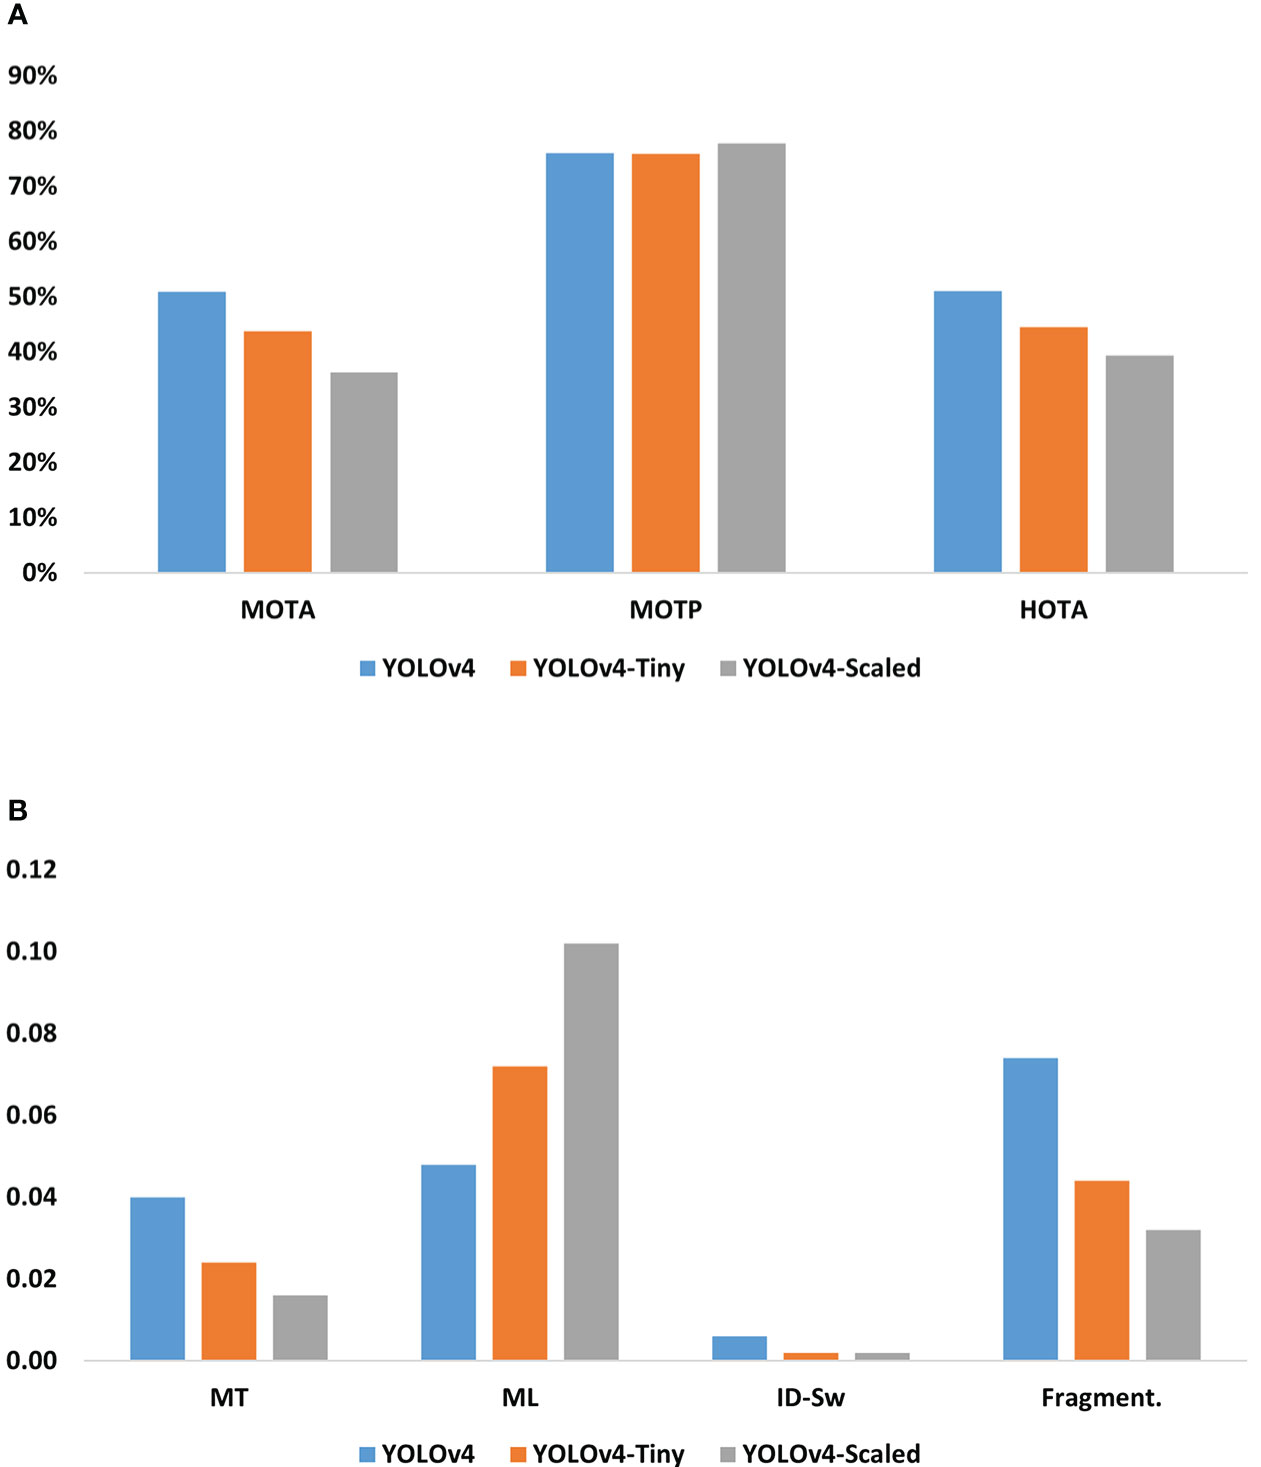
Figure 4 Tracking performances associated with the detectors. (A) Percentage values for MOTA, MOTP, and HOTA, (B) MT, ML, ID-Sw, and Fragmentation numbers averaged over the test videos.
The Nephrops counts output by the algorithm associated with the tracks are given in Table 5. The numbers of true positive counts are reported together with the numbers of false positive and false negative counts together with the correct count rates for each individual video. The lowest total number of false positives is achieved by YOLOv4-Scaled which has the highest false negative tracks as well. Therefore, it is possible to explain the low false positive rate by its inefficiency in generating tracks satisfying the count conditions. The lowest amount of false tracks are achieved by YOLOv4 which also has the highest true positives. Specifically, the related F-scores calculated on the total counts for YOLOv4, Tiny, and Scaled versions are 85.44%, 80.21%, and 74.44%, respectively.
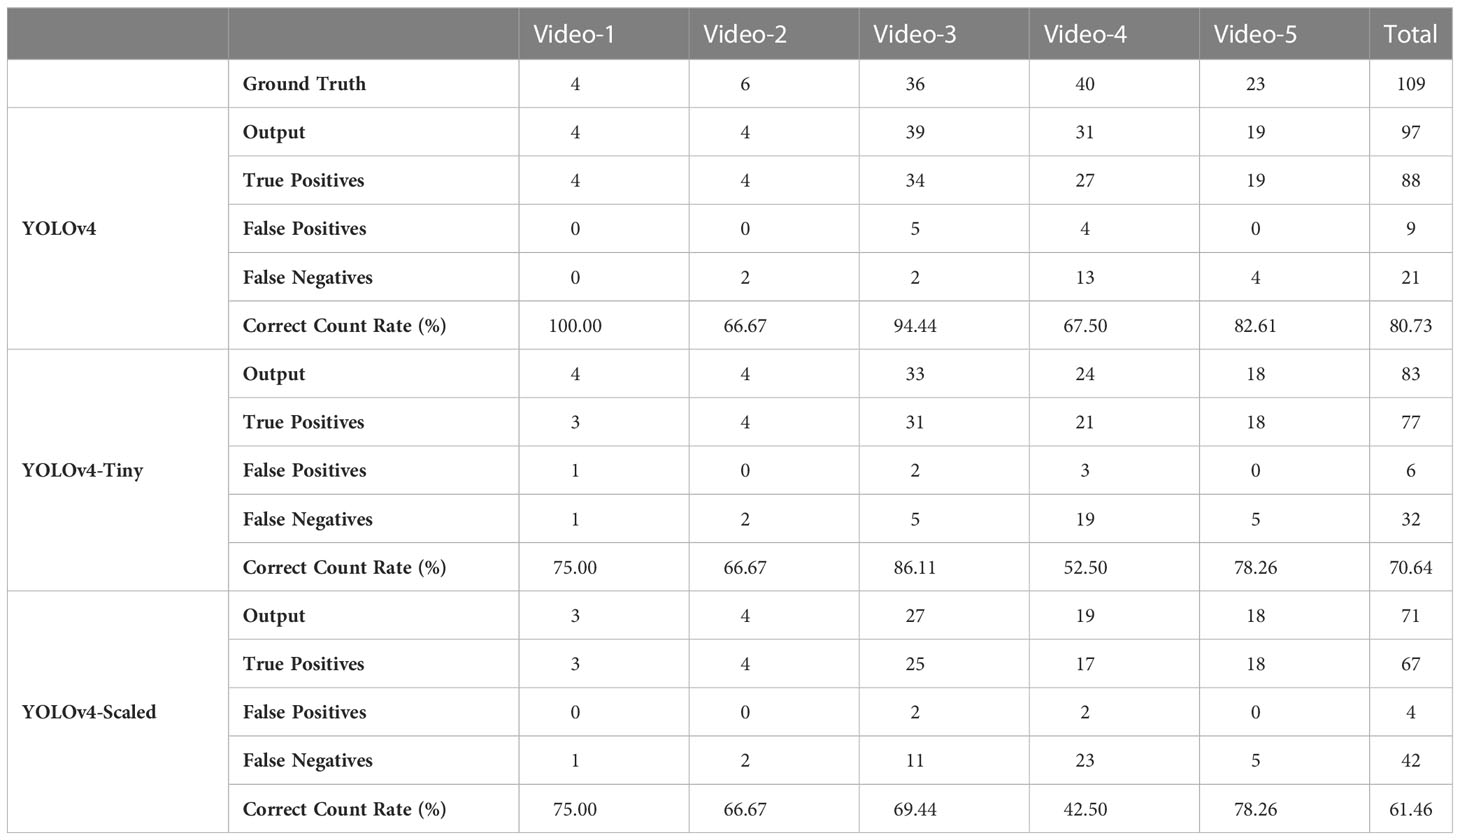
Table 5 Detailed numbers of counts obtained by the detection models.
Processing speed comparison of the models
The required amount of calculations in the model and the hardware specifications are the two major factors affecting the processing speed. The calculation amounts are determined at the design stage of the models, and this can be adjusted to some degree by changing the input image sizes which is also named as network size (see Table 3). Typically, a larger network size in the model yields better object detection, sacrificing the processing speed and vice versa. The input image size for the YOLOv4-Scaled model was adjusted to be higher than the other two models to improve its detection accuracy. Such an adjustment allowed for obtaining a similar accuracy with YOLOv4 model and hence benchmarking their tracking, counting and speed performances.
The FPS values for each model and video are summarized in Table 6. As expected, the YOLOv4-Tiny model is the fastest in all the videos because it has a reduced number of computational layers to enhance its speed. The slowest model is YOLOv4-Scaled. The reason for its lower FPS values is related with its larger network size. However, a smaller network size for this model would cause lower detection and tracking performances eventually yielding a lower number of true positive counts.
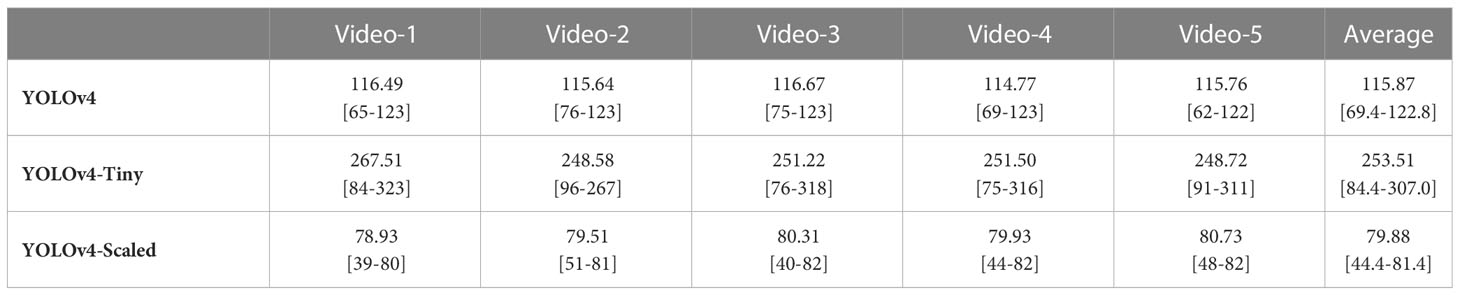
Table 6 Comparison of image processing speed between models in frames per second (mean [min-max]).
Benchmarking with other trackers
To evaluate the suitability of SORT, two other object tracking algorithms were tested on the same dataset. One of these methods is based on a correlation filter, namely, Minimum Output Sum of Squared Error (MOSSE) filter (Bolme et al., 2010). The reason for selecting this object tracker is that its processing speed is claimed to reach 669 FPS (Bolme et al., 2010). In addition, usage of MOSSE was shown to be one of the effective trackers tested in underwater videos (Lopez-Marcano et al., 2021). The MOSSE algorithm initializes a correlation filter based on a detected object in a frame. Next, in the subsequent frames, the algorithm looks for a location having the highest correlation with the initially detected object. Due to the changes in appearance of the same Nephrops instances throughout the video, the Nephrops detection used for generating the correlation filter is updated every fifth frame. This approach was implemented earlier for tracking of yellowfin bream in underwater videos (Lopez-Marcano et al., 2021).
The other tracker evaluated is DeepSORT, an improved version of the SORT algorithm (Wojke et al., 2017). DeepSORT uses the appearance information of the detected objects together with their motion information in 2D. The motion information is quantified by the Mahalanobis distance between the detected bounding box centroids and the Kalman filter predictions under a constant velocity model. On the other hand, the appearance features for each detection are obtained by passing the bounding box region through a pre-trained CNN containing two convolutional and six residual layers. The minimum cosine distance between the appearance features of the detections and the last 100 features of each track is determined as the second metric used by DeepSORT. For the benchmarking experiments, the resources and the instructions made available in the official repository of DeepSORT are utilized (Wojke, 2019).
Instead of reporting the full detailed results for benchmarking trackers, only MOTA, HOTA, correct count rate, average FPS values, and F-scores for YOLOv4 model are provided (Figure 5). Evaluation of these metrics is sufficient for comparing the trackers by understanding their overall performance.
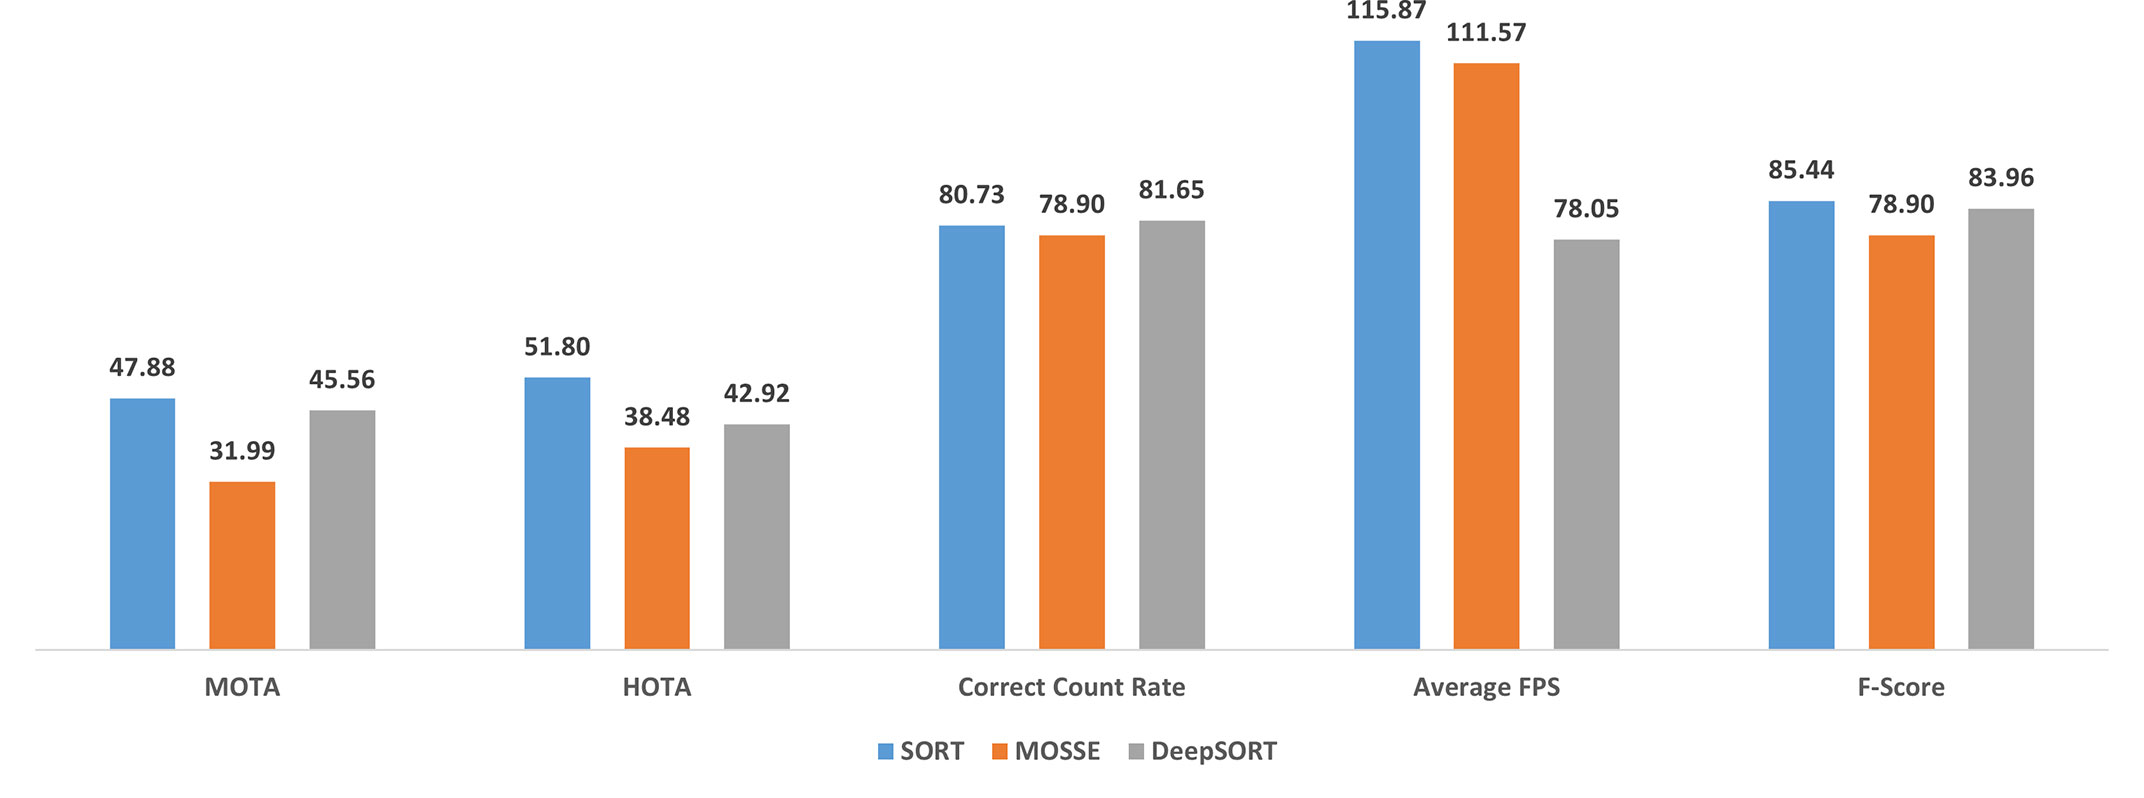
Figure 5 Some performance metrics obtained by three different object tracking algorithms.
Discussion
A major challenge in demersal trawling is the lack of information about the catch entering the gear during fishing. This study demonstrates a full pipeline to acquire, process and display catch information for Nephrops, in close to real-time, to act as a decision tool for the fisher during the fishing operation. The applicability of such tools in commercial trawling and their potential improvements is discussed below.
One advantage of the proposed algorithm is the powerful image acquisition system that provides mostly sediment-free clear videos for being processed in the subsequent steps (Sokolova et al., 2021b; Sokolova et al., 2022). In the existing literature for underwater image processing, there are some papers where the effects of preprocessing on underwater images are analyzed for improving the detection performance (Han et al., 2020; Zhou et al., 2022). But the preprocessing requires some time, degrading the overall processing speed. In addition, there are different types of degradations such as low contrast and color distortion present in the underwater images (An et al., 2021). Our method does not require any preprocessing to enhance the detection accuracy because the image acquisition system is robust and capable of capturing clear videos with adjustable illumination (Sokolova et al., 2021b).
Evaluation of the algorithm steps
Since the followed strategy is tracking-by-detection, successful Nephrops detection is expected to imply more accurate tracking which eventually may result in better Nephrops counts. Hence, achieving high mAP is critical at the object detection step. The performances of object detector models may be considered as sufficiently successful for an accurate tracking and counting task because all three models have mAP @.50 values above 95% (Table 4). In addition, the Nephrops detection performance, APnep value, associated with YOLOv4-Scaled model is the highest indicating a better detection capability of Nephrops. However, this situation is in connection with the increased size of the YOLOv4-Scaled model which slows down its respective detection speed (Table 6).
In the literature, there are numerous metrics defined for evaluating the performance of an object tracking algorithm. For simplicity, only those metrics commonly mentioned in the object tracking literature are provided in this paper. Among the three models, YOLOv4 model has the best values for MOTA, MT, ML, and HOTA. For a detection model, having higher MT and lower ML track count means that their associated successive detections are good enough to attain a valid track. This idea is also supported by the high accuracy values in MOTA and HOTA. On the other hand, an identity switch can be the source of a false positive count provided that the switching happens somewhere close to the horizontal level defined for counting conditions. As for the MOTP, it is very close for three of the models. This means that they have nearly the same level of success in bounding box localization throughout the tracks and cannot be used as a distinguishing factor for commenting on the counting performance.
Finally, it is possible to mention the performance for total Nephrops counts and the processing speeds of the method. Checking only the total counts at the end of the video may be misleading since some Nephrops are not counted while there may be multiple counts for some others. Therefore, checking the false positive and false negative counts together with the true positives gives better insight about the counting performance. The quantification of these three types of tracks is done by calculating the F-scores for each detector model. In addition, the rates for correct counts in each video are provided. At this point, it is notable that the correct count rates for Video-4 are relatively low when compared to the other four videos. The reason for such a remarkable difference is that Video-4 has some sediments degrading the visibility of the objects in the video. This situation highlights the importance of sediment-free video acquisition. Furthermore, when Tables 4, 5 are considered together, it is possible to conclude that high performance at the object detection step does not always imply better correct count rates. This is apparent for the YOLOv4-Scaled model which has a very high detection rate but fails to achieve good count performance.
As for the processing speed, it is measured in terms of FPS. It is the type of the detector model that has a major impact on the overall duration of processing a frame. In addition, updating the object tracks by the SORT algorithm takes some time. During the experiments on the videos, it was observed that, on average, 1.6% of the total processing duration of the frames are used by SORT tracking algorithm when YOLOv4 is used as the object detector. However, tracking is effective only when there is a tracked object in the frame. Nevertheless, the maximum processing speed related with three of the models is higher than the FPS value of the input video (Table 6). This means that the detectors are capable of running at real-time processing speed, but this speed may be reduced when there is a tracked object in the video. On average, the processing speeds of YOLOv4-Scaled is slightly below the real time threshold while the other two models are fast enough to be considered real-time.
The benchmarking results of SORT with MOSSE and DeepSORT trackers revealed that SORT is a better tracker for this application in terms of tracking accuracy, Nephrops counting, and processing speed. The major problem with the MOSSE tracker is the requirement for updating the correlation filters frequently. This process slows down the procedure considerably. On the other hand, tracking without any correlation filter update step, MOSSE is quite inefficient for this problem because the Nephrops individuals float and rotate under the influence of water flow causing their appearance to be changed as they are in the field of view of the camera. As for DeepSORT, it is more accurate than MOSSE in terms of counting performance. However, the CNN-based feature extraction step slows down the overall tracking speed and eventually causes the slowest processing.
Implications for the nephrops fishing
Demersal trawling is a blind process today, which means that fishers do not know if they are catching the target species during trawling operation. This study constitutes a basis for addressing this problem by outputting the target catch count with a real-time speed. In other words, it demonstrates the possibility of providing the Nephrops catch amount throughout the trawling operation. Such information is useful for not only improving the catch rates of the target species but also reducing the bycatch amounts, oil and energy consumption, and ultimately improve the economic, environmental, and social sustainability of the fishery.
Further development
The first step for further improvement of the proposed method is to run it on an edge device with limited computational power. Note that the reported results in this study were obtained using a powerful processing unit (Section 3.4). In real world applications, it may not be practical to access such a computer. Therefore, experimentation with an edge device, which is more accessible onboard commercial fishing vessels, is one of the improvement plans with high priority. The change of the processing platform may not affect the correct count rates, but will have an influence on the overall processing speed. Nevertheless, the achieved speed with YOLOv4-Tiny model is promising and it may still perform sufficiently fast on an edge device.
When there is a tracked object in the video, the tracking speed drops considerably. In other words, tracking step is a bottleneck in the procedure. However, SORT is known to be one of the fast tracking algorithms in the literature, which is also supported by the benchmarking results. In case of requiring higher speed, skipping some intermediate frames may be helpful at cost of degradation in the count accuracy. This may contribute to the compensation of the speed loss due to the edge device. Besides, even if there is a small delay, the achieved processing speed may be considered as a significant improvement when compared to hours of delay associated with the current situation, where information on catch rates and compositions is only available once the catch is taken onboard the vessel.
In the longer term, the method may be extended to detect and count more species and contribute to a larger scale in fisheries. However, this requires generation of a larger video dataset containing more diverse species. In addition, the edge processing unit may be connected to the stereo camera directly by integrating them inside the underwater camera box. This may be coupled with a wireless transceiver device that transmits the count information, e.g. acoustically to a screen onboard. This key information is sufficient for the fisher to decide whether to continue fishing in the same area.
Conclusion
This study demonstrates the possibility of using state-of-the-art deep learning methods to develop real-time decision tools for the trawl fisheries demonstrated here as a Nephrops counter. In particular, the experiments are carried out with three different object detector models on underwater videos collected by an in-trawl camera. The detection, tracking, and counting performances as well as the processing speeds associated with these models are calculated. According to the obtained results, it is possible to conclude that such a system is promising for improving the sustainability of trawl fisheries.
Data availability statement
Publicly available datasets were analyzed in this study. This data can be found here: https://doi.org/10.11583/DTU.21769442.
Ethics statement
Ethical review and approval was not required for the animal study because all data collection was conducted during trawl fishing at sea which do not require an ethical permit or animal welfare approval.
Author contributions
EA: methodology, coding, manuscript writing. JF: conceptualization, supervision, manuscript writing and editing. LK: funding acquisition, conceptualization, supervision, manuscript writing and editing. All authors contributed to the article and approved the submitted version.
Funding
This work has received funding from the European Maritime and Fisheries Fund (EMFF), the Ministry of Food, Agriculture and Fisheries of Denmark, and the European Union’s Horizon 2020 research and innovation program as part of the projects: Development of a real-time catch monitoring system with automatic detection of the catch composition to minimize catch of unwanted species and sizes [AutoCatch (33112-P-18-051)], Udvikling af SELEKTive redskaber og teknologier til kommercielle fiskerier [SELEKT (33113-I-22-187)], and Smart fisheries technologies for an efficient, compliant and environmentally friendly fishing sector [SMARTFISH (agreement no: 7553521)].
Acknowledgments
The authors thank the skipper and the crew on DTU’s research vessel RV Havfisken for assistance in data collection at sea.
Conflict of interest
The authors declare that the research was conducted in the absence of any commercial or financial relationships that could be construed as a potential conflict of interest.
Publisher’s note
All claims expressed in this article are solely those of the authors and do not necessarily represent those of their affiliated organizations, or those of the publisher, the editors and the reviewers. Any product that may be evaluated in this article, or claim that may be made by its manufacturer, is not guaranteed or endorsed by the publisher.
References
Aguzzi J., Sardà F. (2008). A history of recent advancements on nephrops norvegicus behavioral and physiological rhythms. Rev. Fish Biol. Fish 18, 235–248. doi: 10.1007/S11160-007-9071-9/FIGURES/6
Allken V., Rosen S., Handegard N. O., Malde K. (2021). A deep learning-based method to identify and count pelagic and mesopelagic fishes from trawl camera images. ICES J. Mar. Sci. 78, 3780–3792. doi: 10.1093/ICESJMS/FSAB227
An D., Hao J., Wei Y., Wang Y., Yu X. (2021). Application of computer vision in fish intelligent feeding system–a review. Aquac Res. 52, 423–437. doi: 10.1111/ARE.14907
Bergmann M., Wieczorek S. K., Moore P. G., Atkinson R. J. A. (2002). Discard composition of the nephrops fishery in the Clyde Sea area, Scotland. Fish Res. 57, 169–183. doi: 10.1016/S0165-7836(01)00345-9
Bewley A., Ge Z., Ott L., Ramos F., Upcroft B. (2016). “Simple online and realtime tracking,” in Proceedings - International Conference on Image Processing, ICIP, , 2016-August. 3464–3468. doi: 10.1109/ICIP.2016.7533003
Bochkovskiy A. (2022) GitHub - AlexeyAB/darknet: YOLOv4 / scaled-YOLOv4 / YOLO - neural networks for object detection (Windows and Linux version of darknet ). Available at: https://github.com/AlexeyAB/darknet (Accessed November 14, 2022).
Bochkovskiy A., Wang C.-Y., Liao H.-Y. M. (2020). YOLOv4: Optimal speed and accuracy of object detection. doi: 10.48550/arxiv.2004.10934
Bolme D. S., Beveridge J. R., Draper B. A., Lui Y. M. (2010). “Visual object tracking using adaptive correlation filters,” in Proceedings of the IEEE Computer Society Conference on Computer Vision and Pattern Recognition. 2544–2550. doi: 10.1109/CVPR.2010.5539960
Dutta A., Zisserman A. (2019). “The VIA annotation software for images, audio and video,” in Proceedings of the 27th ACM International Conference on Multimedia MM ’19, New York, NY, USA. 2276–2279 (Association for Computing Machinery). doi: 10.1145/3343031.3350535
Eigaard O. R., Bastardie F., Hintzen N. T., Buhl-Mortensen L., Buhl-Mortensen P., Catarino R., et al. (2017). The footprint of bottom trawling in European waters: distribution, intensity, and seabed integrity. ICES J. Mar. Sci. 74, 847–865. doi: 10.1093/ICESJMS/FSW194
ElTantawy A., Shehata M. S. (2020). Local null space pursuit for real-time moving object detection in aerial surveillance. Signal Image Video Process 14, 87–95. doi: 10.1007/S11760-019-01528-Y/FIGURES/3
Feekings J., Christensen A., Jonsson P., Frandsen R., Ulmestrand M., Munch-Petersen S., et al. (2015). The use of at-sea-sampling data to dissociate environmental variability in Norway lobster (Nephrops norvegicus) catches to improve resource exploitation efficiency within the Skagerrak/Kattegat trawl fishery. Fish Oceanogr 24, 383–392. doi: 10.1111/FOG.12116
French G., Mackiewicz M., Fisher M., Holah H., Kilburn R., Campbell N., et al. (2020). Deep neural networks for analysis of fisheries surveillance video and automated monitoring of fish discards. ICES J. Mar. Sci. 77, 1340–1353. doi: 10.1093/ICESJMS/FSZ149
Ghiasi G., Cui Y., Srinivas A., Qian R., Lin T.-Y., Cubuk E. D., et al. (2021). “Simple copy-paste is a strong data augmentation method for instance segmentation,” in Proceedings of the IEEE/CVF Conference on Computer Vision and Pattern Recognition (CVPR). 2918–2928. doi: 10.48550/arXiv.2012.07177
Han F., Yao J., Zhu H., Wang C. (2020). Underwater image processing and object detection based on deep CNN method. J. Sens 2020, 1–20. doi: 10.1155/2020/6707328
Howard A., Sandler M., Chu G., Chen L.-C., Chen B., Tan M., et al. (2019). Searching for MobileNetV3. doi: 10.48550/arxiv.1905.02244
Howard A. G., Zhu M., Chen B., Kalenichenko D., Wang W., Weyand T., et al. (2017). MobileNets: Efficient convolutional neural networks for mobile vision applications. doi: 10.48550/arxiv.1704.04861
Hu J., Zhao D., Zhang Y., Zhou C., Chen W. (2021). Real-time nondestructive fish behavior detecting in mixed polyculture system using deep-learning and low-cost devices. Expert Syst. Appl. 178, 115051. doi: 10.1016/J.ESWA.2021.115051
Jalal A., Salman A., Mian A., Shortis M., Shafait F. (2020). Fish detection and species classification in underwater environments using deep learning with temporal information. Ecol. Inform 57, 101088. doi: 10.1016/J.ECOINF.2020.101088
Jin J., Zhang J., Liu D., Shi J., Wang D., Li F. (2020). Vision-based target tracking for unmanned surface vehicle considering its motion features. IEEE Access 8, 132655–132664. doi: 10.1109/ACCESS.2020.3010327
Kalman R. E. (1960). A new approach to linear filtering and prediction problems. J. Basic Eng. 82, 35–45. doi: 10.1115/1.3662552
Kuhn H. W. (1955). The Hungarian method for the assignment problem. Naval Res. Logistics Q. 2, 83–97. doi: 10.1002/NAV.3800020109
Liu T., He S., Liu H., Gu Y., Li P. (2022). A robust underwater multiclass fish-school tracking algorithm. Remote Sens. 14, 4106. doi: 10.3390/RS14164106
Liu X., Jia Z., Hou X., Fu M., Ma L., Sun Q. (2019). “Real-time marine animal images classification by embedded system based on mobilenet and transfer learning,” in OCEANS 2019 - Marseille. 1–5. doi: 10.1109/OCEANSE.2019.8867190
Liu H., Song P., Ding R. (2020). “Towards domain generalization in underwater object detection,” in 2020 IEEE International Conference on Image Processing (ICIP). 1971–1975. doi: 10.1109/ICIP40778.2020.9191364
Lopez-Marcano S., Jinks L., Buelow C. A., Brown C. J., Wang D., Kusy B., et al. (2021). Automatic detection of fish and tracking of movement for ecology. Ecol. Evol. 11, 8254–8263. doi: 10.1002/ECE3.7656
Luiten J., Ošep A., Dendorfer P., Torr P., Geiger A., Leal-Taixé L., et al. (2021). HOTA: A higher order metric for evaluating multi-object tracking. Int. J. Comput. Vis. 129, 548–578. doi: 10.1007/S11263-020-01375-2/FIGURES/18
Main J., Sangster G. I. (1985). “The behaviour of the Norway lobster, nephrops norvegicus (L.), during trawling,” in Scottish Fisheries research report, vol. 43. (Aberdeen: Department of Agriculture and Fisheries for Scotland), 1–23.
Mohamed H. E. D., Fadl A., Anas O., Wageeh Y., Elmasry N., Nabil A., et al. (2020). MSR-YOLO: Method to enhance fish detection and tracking in fish farms. Proc. Comput. Sci. 170, 539–546. doi: 10.1016/J.PROCS.2020.03.123
Muksit A., Hasan F., Hasan Bhuiyan Emon M. F., Haque M. R., Anwary A. R., Shatabda S. (2022). YOLO-fish: A robust fish detection model to detect fish in realistic underwater environment. Ecol. Inform 72, 101847. doi: 10.1016/J.ECOINF.2022.101847
Naseer A., Baro E. N., Khan S. D., Gordillo Y. V. (2020). “Automatic detection of nephrops norvegicus burrows in underwater images using deep learning,” in 2020 Global Conference on Wireless and Optical Technologies (GCWOT). 1–6. doi: 10.1109/GCWOT49901.2020.9391590
Petrellis N. (2021). Measurement of fish morphological features through image processing and deep learning techniques. Appl. Sci. 11, 4416. doi: 10.3390/APP11104416
Prados R., Garcia R., Gracias N., Neumann L., Vagstol H. (2017). “Real-time fish detection in trawl nets,” in OCEANS 2017, Aberdeen, 2017-October. 1–5. doi: 10.1109/OCEANSE.2017.8084760
Raza K., Hong S. (2020). Fast and accurate fish detection design with improved YOLO-v3 model and transfer learning. Int. J. Advanced Comput. Sci. Appl. 11, 7–16. doi: 10.14569/IJACSA.2020.0110202
Redmon J. (2016) Darknet: Open source neural networks in c. Available at: https://pjreddie.com/darknet/ (Accessed November 14, 2022).
Redmon J., Divvala S., Girshick R., Farhadi A. (2015). You only look once: Unified, real-time object detection. doi: 10.48550/arxiv.1506.02640
Sala E., Mayorga J., Bradley D., Cabral R. B., Atwood T. B., Auber A., et al. (2021). Protecting the global ocean for biodiversity, food and climate. Nature 592, 397–402. doi: 10.1038/s41586-021-03371-z
Sandler M., Howard A., Zhu M., Zhmoginov A., Chen L.-C. (2018). MobileNetV2: Inverted residuals and linear bottlenecks. doi: 10.48550/arxiv.1801.04381
Sokolova M., Mompó Alepuz A., Thompson F., Mariani P., Galeazzi R., Krag L. A. (2021a). A deep learning approach to assist sustainability of demersal trawling operations. Sustainability 13, 12362. doi: 10.3390/SU132212362
Sokolova M., O’Neill F. G., Savina E., Krag L. A. (2022). Test and development of a sediment suppressing system for catch monitoring in demersal trawls. Fish Res. 251, 106323. doi: 10.1016/J.FISHRES.2022.106323
Sokolova M., Thompson F., Mariani P., Krag L. A. (2021b). Towards sustainable demersal fisheries: NepCon image acquisition system for automatic nephrops norvegicus detection. PloS One 16, e0252824. doi: 10.1371/JOURNAL.PONE.0252824
Soom J., Pattanaik V., Leier M., Tuhtan J. A. (2022). Environmentally adaptive fish or no-fish classification for river video fish counters using high-performance desktop and embedded hardware. Ecol. Inform 72, 101817. doi: 10.1016/J.ECOINF.2022.101817
Tseng C.-H., Kuo Y.-F., Tseng C.-H., Kuo Y.-F. (2020). Detecting and counting harvested fish and identifying fish types in electronic monitoring system videos using deep convolutional neural networks. ICES J. Mar. Sci. 77, 1367–1378. doi: 10.1093/ICESJMS/FSAA076
Tully O., Hillis J. P. (1995). Causes and spatial scales of variability in population structure of nephrops norvegicus (L.) in the Irish Sea. Fish Res. 21, 329–347. doi: 10.1016/0165-7836(94)00303-E
Underwood M. J., Rosen S., Engas A., Eriksen E. (2014). Deep vision: An in-trawl stereo camera makes a step forward in monitoring the pelagic community. PloS One 9, e112304. doi: 10.1371/JOURNAL.PONE.0112304
Underwood M. J., Rosen S., Engås A., Jorgensen T., Fernö A. (2018). Species-specific residence times in the aft part of a pelagic survey trawl: implications for inference of pre-capture spatial distribution using the deep vision system. ICES J. Mar. Sci. 75, 1393–1404. doi: 10.1093/ICESJMS/FSX233
Vijaya Kumar D. T. T., Mahammad Shafi R. (2022). A fast feature selection technique for real-time face detection using hybrid optimized region based convolutional neural network. Multimed Tools Appl., 1–14. doi: 10.1007/S11042-022-13728-9
Wageeh Y., Mohamed H. E. D., Fadl A., Anas O., ElMasry N., Nabil A., et al. (2021). YOLO fish detection with euclidean tracking in fish farms. J. Ambient Intell. Humaniz Comput. 12, 5–12. doi: 10.1007/S12652-020-02847-6/FIGURES/6
Wang C. Y., Bochkovskiy A., Liao H. Y. M. (2020). “Scaled-YOLOv4: Scaling cross stage partial network,” in Proceedings of the IEEE Computer Society Conference on Computer Vision and Pattern Recognition. 13024–13033. doi: 10.48550/arxiv.2011.08036
Wang J., He X., Shao F., Lu G., Jiang Q., Hu R., et al. (2022b). A novel attention-based lightweight network for multiscale object detection in underwater images. J. Sens 2022, 2582687. doi: 10.1155/2022/2582687
Wang H., Zhang S., Zhao S., Wang Q., Li D., Zhao R. (2022a). Real-time detection and tracking of fish abnormal behavior based on improved YOLOV5 and SiamRPN++. Comput. Electron Agric. 192, 106512. doi: 10.1016/J.COMPAG.2021.106512
Wojke N. (2019) GitHub - nwojke/deep_sort: Simple online realtime tracking with a deep association metric. Available at: https://github.com/nwojke/deep_sort (Accessed November 14, 2022).
Wojke N., Bewley A., Paulus D. (2017). “Simple online and realtime tracking with a deep association metric,” in Proceedings - International Conference on Image Processing, ICIP, , 2017-September. 3645–3649. doi: 10.48550/arxiv.1703.07402
Wu X., Li W., Hong D., Tao R., Du Q. (2022). Deep learning for unmanned aerial vehicle-based object detection and tracking: A survey. IEEE Geosci Remote Sens Mag 10, 91–124. doi: 10.1109/MGRS.2021.3115137
Yao Y., Qiu Z., Zhong M. (2019). “Application of improved MobileNet-SSD on underwater sea cucumber detection robot,” in 2019 IEEE 4th Advanced Information Technology, Electronic and Automation Control Conference (IAEAC). 402–407. doi: 10.1109/IAEAC47372.2019.8997970
Zhang M., Xu S., Song W., He Q., Wei Q. (2021). Lightweight underwater object detection based on YOLO v4 and multi-scale attentional feature fusion. Remote Sens (Basel) 13, 1–22. doi: 10.3390/rs13224706
Zhao S., Zheng J., Sun S., Zhang L. (2022). An improved YOLO algorithm for fast and accurate underwater object detection. Symmetry (Basel) 14, 1–16. doi: 10.3390/sym14081669
Zheng Z., Guo C., Zheng X., Yu Z., Wang W., Zheng H., et al. (2018). “Fish recognition from a vessel camera using deep convolutional neural network and data augmentation,” in 2018 OCEANS - MTS/IEEE Kobe Techno-Oceans, OCEANS - Kobe 2018. doi: 10.1109/OCEANSKOBE.2018.8559314
Keywords: demersal trawling, Nephrops counting, object detection, object tracking, sort, underwater video processing, YOLO
Citation: Avsar E, Feekings JP and Krag LA (2023) Estimating catch rates in real time: Development of a deep learning based Nephrops (Nephrops norvegicus) counter for demersal trawl fisheries. Front. Mar. Sci. 10:1129852. doi: 10.3389/fmars.2023.1129852
Received: 22 December 2022; Accepted: 14 February 2023;
Published: 27 February 2023.
Edited by:
Hongsheng Bi, University of Maryland, College Park, United StatesReviewed by:
Nikos Petrellis, University of Peloponnese, GreeceAmaya Alvarez, Mediterranean Institute for Advanced Studies (CSIC), Spain
Copyright © 2023 Avsar, Feekings and Krag. This is an open-access article distributed under the terms of the Creative Commons Attribution License (CC BY). The use, distribution or reproduction in other forums is permitted, provided the original author(s) and the copyright owner(s) are credited and that the original publication in this journal is cited, in accordance with accepted academic practice. No use, distribution or reproduction is permitted which does not comply with these terms.
*Correspondence: Ercan Avsar, ZXJjYUBhcXVhLmR0dS5kaw==