 Adam S. Candy1*†
 Shannara K. Taylor Parkins2*†
 Fleur C. Van Duyl1
 Benjamin Mueller3,4,5
 Milou G. I. Arts1Will Barnes1
 Marie Carstensen6
 Yun J. H. Scholten1,7Yusuf C. El-Khaled6,8
 Christian Wild6
 Linda Wegley Kelly9
 Craig E. Nelson3
 Stuart A. Sandin9
 Mark J. A. Vermeij4,5Forest L. Rohwer10Cristian Picioreanu11Paolo Stocchi1,12†
 Andreas F. Haas1,10*†
- 1NIOZ Royal Netherlands Institute for Sea Research, Texel, Netherlands
- 2The Novo Nordisk Foundation Center for Biosustainability, Technical University of Denmark, Lyngby, Denmark
- 3Department of Oceanography and Sea Grant College Program, School of Ocean and Earth Science and Technology, University of Hawaiʻi of Mānoa, Honolulu, HI, United States
- 4Department for Freshwater and Marine Ecology, University of Amsterdam, Amsterdam, Netherlands
- 5CARMABI Foundation, Willemstad, Curaçao
- 6Marine Ecology Department, Faculty of Biology and Chemistry, University of Bremen, Bremen, Germany
- 7Rijksuniversiteit Groningen, Groningen, Netherlands
- 8Red Sea Research Center (RSRC), Division of Biological and Environmental Science and Engineering (BESE), King Abdullah University of Science and Technology (KAUST), Thuwal, Saudi Arabia
- 9Scripps Institution of Oceanography, University of California San Diego, La Jolla, CA, United States
- 10Department of Biology, San Diego State University, San Diego, CA, United States
- 11Water Desalination and Reuse Center (WDRC), Division of Biological and Environmental Science and Engineering (BESE), King Abdullah University of Science and Technology (KAUST), Thuwal, Saudi Arabia
- 12I4CCS Institute for Climate Change Solutions, Urbino, Italy
One mechanism giving fleshy algae a competitive advantage over corals during reef degradation is algal-induced and microbially-mediated hypoxia (typically less than 69.5 µmol oxygen L−1). During hypoxic conditions oxygen availability becomes insufficient to sustain aerobic respiration in most metazoans. Algae are more tolerant of low oxygen conditions and may outcompete corals weakened by hypoxia. A key question on the ecological importance of this mechanism remains unanswered: How extensive are local hypoxic zones in highly turbulent aquatic environments, continuously flushed by currents and wave surge? To better understand the concert of biological, chemical, and physical factors that determine the abundance and distribution of oxygen in this environment, we combined 3D imagery, flow measurements, macro- and micro-organismal abundance estimates, and experimentally determined biogenic oxygen and carbon fluxes as input values for a 3D bio-physical model. The model was first developed and verified for controlled flume experiments containing coral and algal colonies in direct interaction. We then developed a three-dimensional numerical model of an existing coral reef plot off the coast of Curaçao where oxygen concentrations for comparison were collected in a small-scale grid using fiberoptic oxygen optodes. Oxygen distribution patterns given by the model were a good predictor for in situ concentrations and indicate widespread localized differences exceeding 50 µmol L-1 over distances less than a decimeter. This suggests that small-scale hypoxic zones can persist for an extended period of time in the turbulent environment of a wave- and surge- exposed coral reef. This work highlights how the combination of three-dimensional imagery, biogenic fluxes, and fluid dynamic modeling can provide a powerful tool to illustrate and predict the distribution of analytes (e.g., oxygen or other bioactive substances) in a highly complex system.
1 Introduction
Many coral reefs around the world and specifically in the Caribbean have changed dramatically over the last half century (Hoegh-Guldberg, 1999; Gardner et al., 2003; Jackson et al., 2014; De Bakker et al., 2017; Reverter et al., 2022). In areas of limited management, the benthic community has been observed to transition from calcifying primary producers (including hermatypic corals and coralline algae) to fleshy and eroding organisms (Hughes, 1994; Smith et al., 2016). This change affects a variety of biological, chemical, and physical system parameters. The immense diversity and biomass of multicellular organisms like fish or invertebrates gives way to opportunistic, fast growing and resource-consuming microbes (McDole et al., 2012; Haas et al., 2016). Coral-derived organic matter that supports nutrient acquisition and recycling in the system is replaced by dissolved, labile and nutrient-poor algal exudates (Wild et al., 2004; Haas et al., 2011; Kelly et al., 2022). The complex reef structure constantly maintained and expanded by calcifying organisms ceases to grow, and dissolves as it is eaten away by decreased seawater pH and eroding organisms (Pandolfi et al., 2005).
The triggers for such dramatic changes are mostly well established. For example, loss of grazers caused by overfishing, increased perturbation through tourism or boating, as well as eutrophication and pollution resulting from runoff and under-managed/overpopulated coastlines are the most pronounced reasons on a local scale (e.g., Bellwood et al., 2004; Mumby, 2006; Mora, 2008). On a global scale anthropogenically induced warming and acidification of the oceans further add to the pressure on coral reef ecosystems (Hoegh-Guldberg et al., 2007; Pandolfi et al., 2011). While in some cases the causality of reef degradation is obvious (e.g., algal growth through eutrophication and reduced herbivory or coral bleaching through high seawater temperatures), there are other cases where the immediate mechanisms are not clear. More intricate feedback mechanisms are in place that also prevent coral reef systems re-establishing themselves after the initial perturbations are alleviated (Barott and Rohwer, 2012).
Oxygen as one of the major structuring factors has moved more and more to the center of attention over the last years. There are a multitude of studies showing the pivotal importance of oxygen in organismal interactions (e.g., Barott et al., 2009; Wangpraseurt et al., 2012), in reef resistance and resilience (e.g., Altieri et al., 2017; Johnson et al., 2021; Jorissen and Nugues, 2021), even suggesting that oxygen is the universal currency for life on coral reefs (Nelson and Altieri, 2019). Not all species are equally sensitive to hypoxia (Altieri et al., 2017) and many marine metazoans cannot tolerate hypoxic conditions (DO concentrations below 62.5 µmol L-1, Vaquer-Sunyer and Duarte, 2008). Corals are especially sensitive to hypoxic stress (Haas et al., 2014). Smith et al., 2006 proposed a mechanism whereby algal dissolved organic carbon (DOC) increases the microbial oxygen consumption in the coral-algal interface/interaction zone in such a way that it leads to hypoxia that kills corals in direct vicinity.
Larger scale hypoxic regions have been identified on coral reefs across multiple ocean systems (e.g., on the Mexican coast (Haas et al., 2010), Panama (Altieri et al., 2017; Johnson et al., 2021) and the Red Sea (Wild et al., 2010)). However, while small scale, algae-mediated, microbe-induced hypoxia was verified in ex situ experiments (Smith et al., 2006; Haas et al., 2013a; Jorissen et al., 2016), it remains debatable whether such conditions could persist in highly turbulent aquatic environments that are exposed to currents and wave surge (Wangpraseurt et al., 2012). The influence of local fluid dynamics on coral reef community structuring has been discussed in the context of metabolism, survivorship and reproduction (Lenihan et al., 2015; Viehman et al., 2018; Levenstein et al., 2022), but the spatio-temporal extent of hypoxic conditions are largely unexplored. The extent of hypoxia on coral reefs is, for one, determined by the abundance of oxygen consuming and producing organisms like macroalgae, and the bacterial community fostered by their exudates (Haas et al., 2016). The release and consumption of oxygen by different primary producers and their respective microbial communities has been studied extensively (e.g., Haas et al., 2013a; Haas et al., 2013b; Roach et al., 2017; Silveira et al., 2019). However, the local and temporal extent of high or low oxygen zones is also - or maybe even more - governed by the diffusion (at small scale) and dispersal (at large scale) of DO in this turbulent environment. Dispersion processes are determined by fluid dynamics, in the aquatic environment understood as hydrodynamics. In all marine ecosystems, hydrodynamics affects numerous ecological functions and interactions across all spatial scales. Local hydrodynamics (“water movement”) results from a combination of factors including tides or wind, as well as the geometry of the benthic structures over which the water moves (Lowe et al., 2005; Monismith, 2007; Hench et al., 2008; Rogers et al., 2018). Due to the complexity of coral reef systems and the plethora of relevant factors, hydrodynamics has barely been considered in previous research on the spatio-temporal extent of hypoxic conditions.
Complex structures can funnel the flow, create vortices, or result in regions with recirculating flow and surprisingly low velocities and refreshment (Monismith et al., 2015; Yu et al., 2018). Moreover, accurate hydrodynamics is extremely difficult to measure directly in these complex environments in close proximity to the benthos. At these small scales and with intricate geometries, standard measurement equipment for capturing physical characteristics of oceanic environments does not perform well. Acoustic point sensors, such as acoustic Doppler current profilers (ADCPs) and velocity meters (ADVs), are too bulky to measure close enough, risk modifying the flow field and do not reliably function near hard surfaces. Pressure sensors and tilt meters have similar issues and also lack a resolution fine enough to capture these small-scale (mm to decimeter) dynamics.
Recent advances in reconstructing three-dimensional renderings of existing aquatic environments based on photographic data, e.g. Structure-from-Motion (SfM, Westoby et al., 2012; Burns and Delparte, 2017; Bayley and Mogg, 2020), combined with more flexible Computational Fluid Dynamics (CFD) and mass transport models utilizing boundary-conforming discretizations such as finite-element and finite-volume components, open up new possibilities to determine fluxes and dispersal of matter throughout marine ecosystems that are nearly impossible to study in situ.
To describe the spatial and temporal extent of organism-induced alterations in oxygen concentrations we therefore use a combination of in situ data, controlled flume experiments and bio-physical computational modeling. Here, the three-dimensional water flow and oxygen distribution in the water column were numerically simulated for an existing coral reef in the Caribbean Sea, off the coast of Curaçao. The simulated coral reef plot contained the original seabed topography and several organisms (sand, macroalgae, corals and microbes) to include the effects of hydrodynamics, macro- and microorganisms. Numerical simulations using the in situ coral reef structure and water column were performed to aid the general understanding of hypoxia in coral reef ecosystems and to possibly predict the location of hypoxic regions
2 Methods
2.1 Flume experiments
Oxygen distribution patterns facilitated by coral and algal samples were assessed under different flow conditions using custom-built flow chambers in the aquarium facilities at Scripps Institution of Oceanography, UC San Diego. USA. Planar optode sheets placed centrally aligned with the flow were used in all flow chambers to visualize oxygen concentration patterns facilitated by different organisms in a two-dimensional plane parallel to the flow, as described in detail in (Haas et al., 2013a).
2.2 In situ experiments
All in situ measurements and three-dimensional reef imagery were conducted at the CARMABI Research Station in Curaçao over three field campaigns on 8-11 September 2020, 21-25 November 2020, and 3-6 November 2021. The selection criteria for the reef site that served as input for the model plot was that it required: three-dimensional structure, presence of both coral and algae, absence of large structures that could significantly influence flow in their immediate vicinity, and a close proximity to the CARMABI Research Station to facilitate easy access for SCUBA divers, during both day and night. The plot chosen is on the fringing reef close to Piscadera Bay on Curaçao (12°12′ N, 68°97′ W) at 5 m water depth, containing multiple corals surrounded by macroalgae (Figure 1).
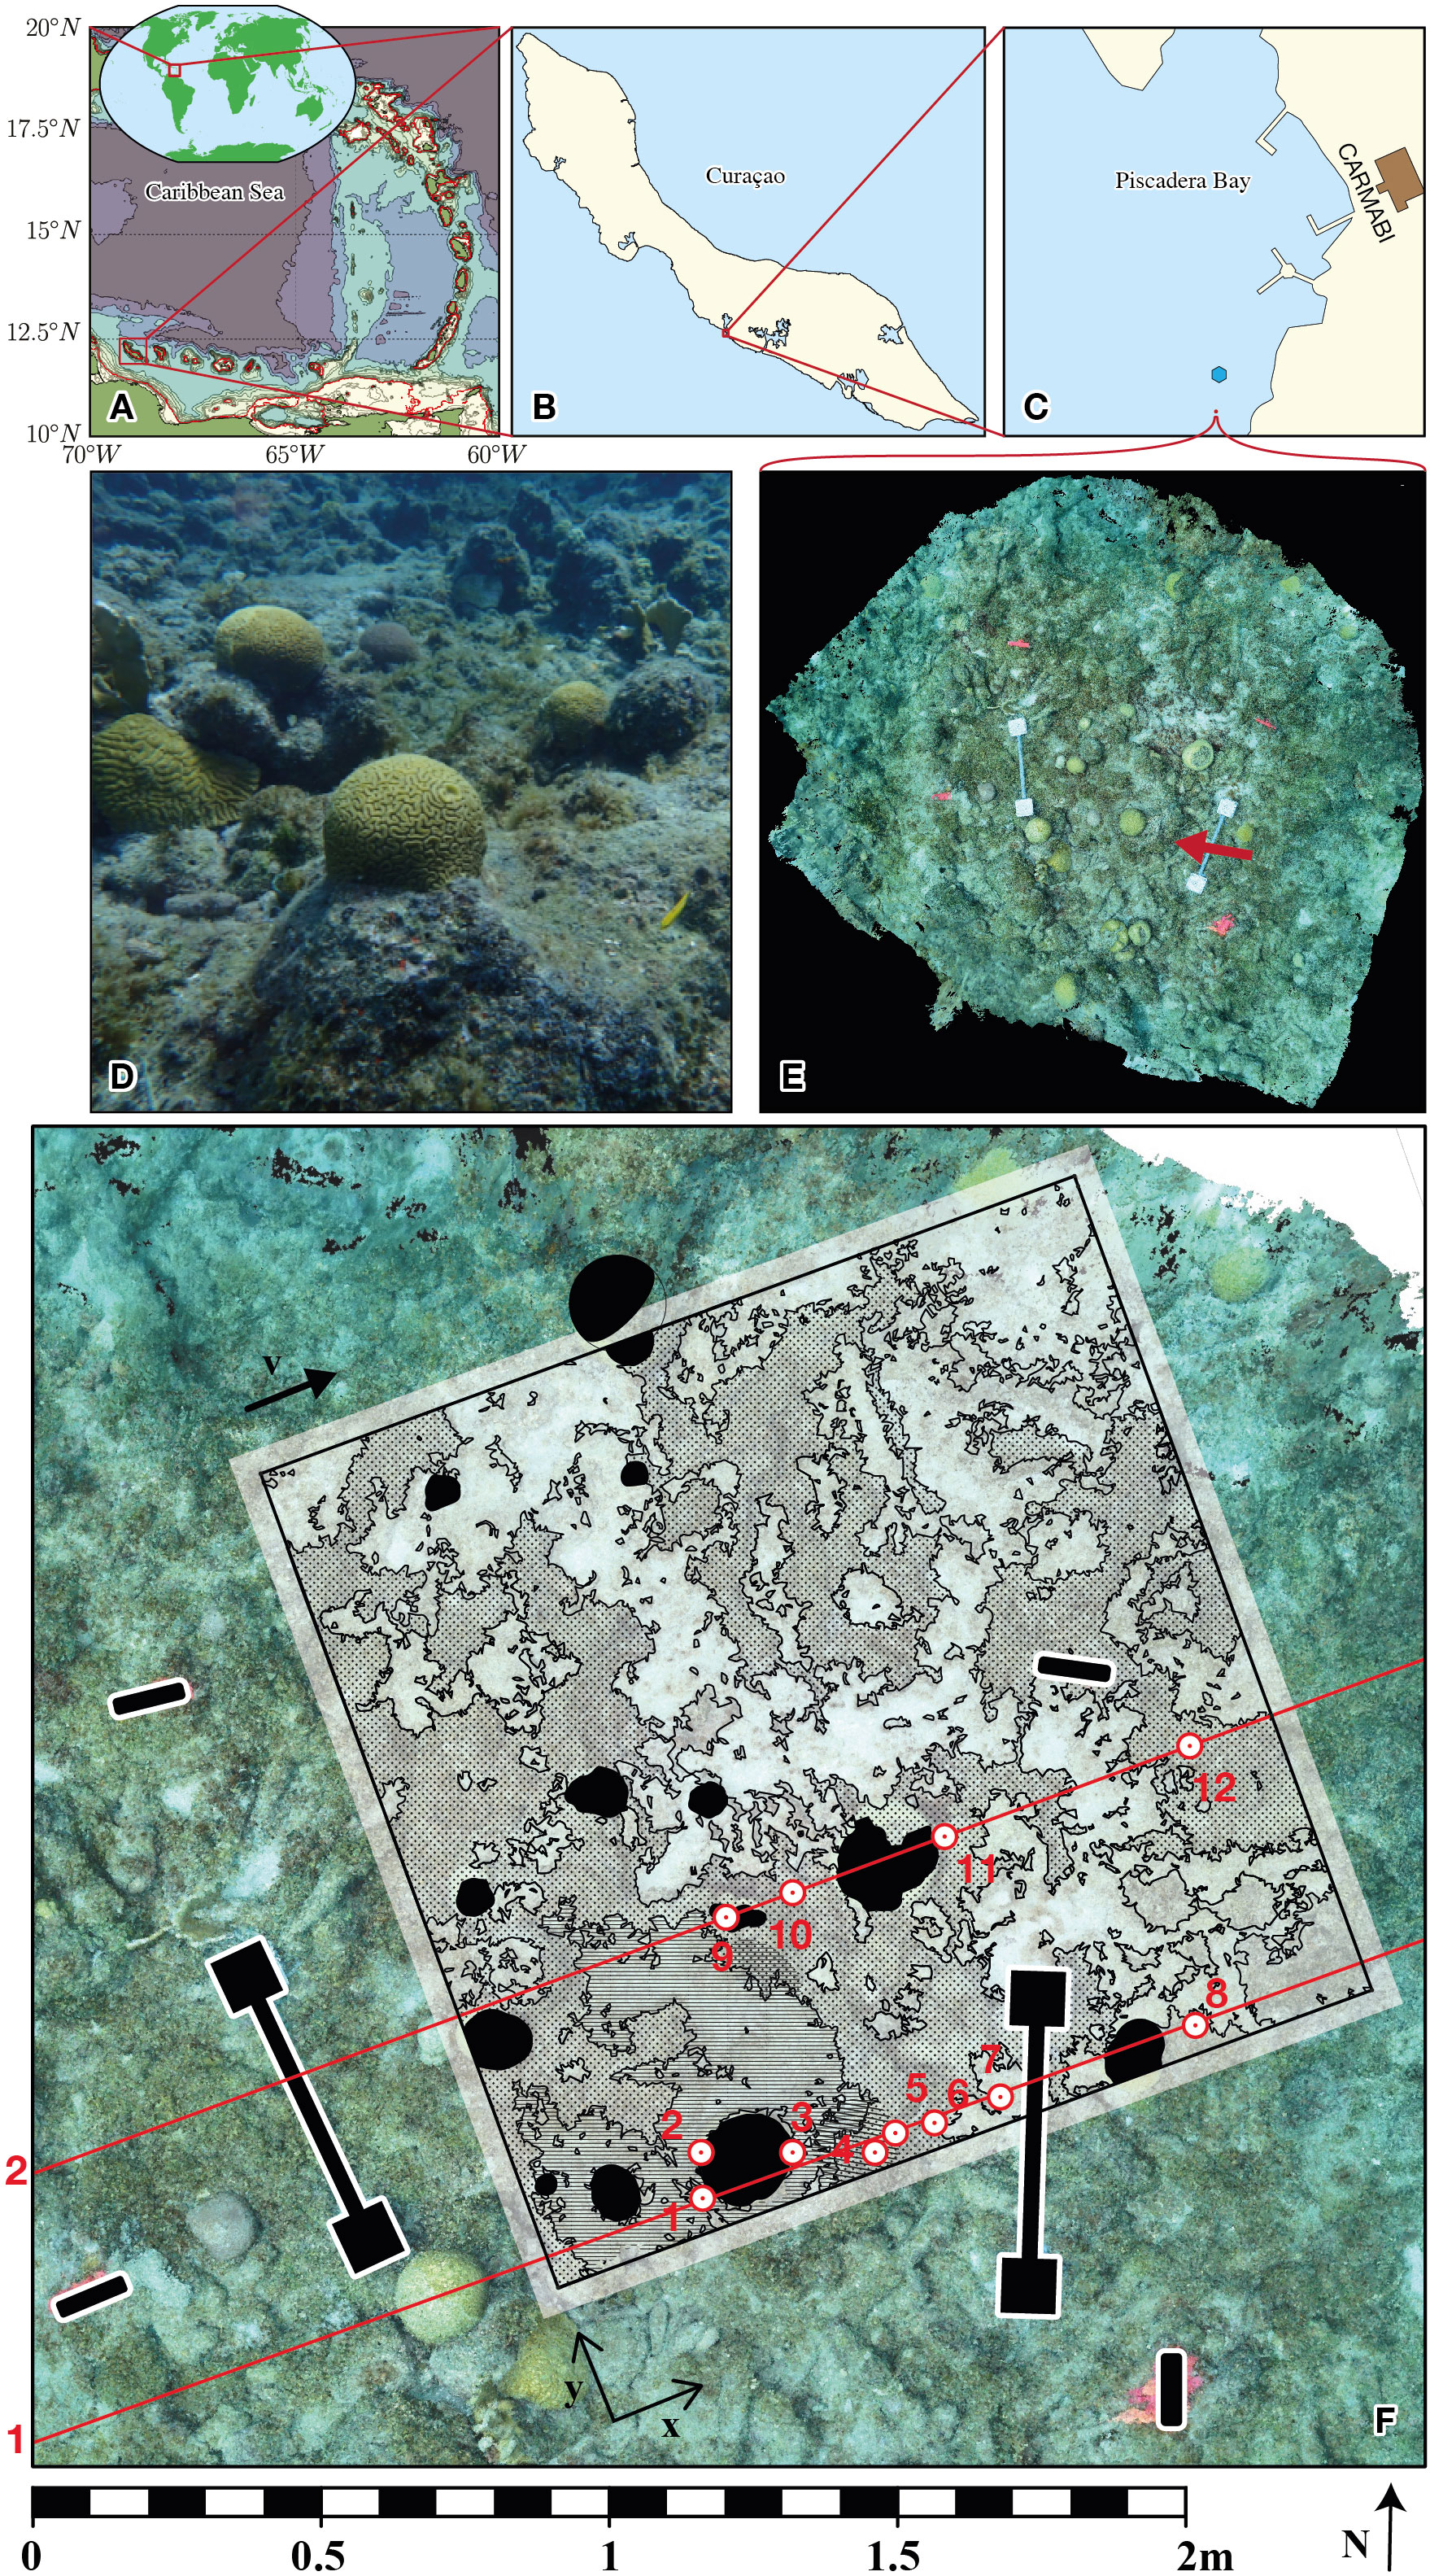
Figure 1 The chosen study site located in the south of the Caribbean Sea (A) close to the southern coast of Curaçao (B) in Piscadera Bay (C), where it is marked in red. The plot and surrounding region is shown in (E) generated through a Structure from Motion method. A red arrow marks the central raised part of the reef mounted by an elevated Diploria labyrinthiformis brain coral, which is positioned at 12°7′14.6”N 68°58′11.5”W (12.120722°, −68.969861°). (D) A photograph from the position highlighted by the red arrow, showing multiple corals surrounded by areas of sand and macroalgae. A combination of GEBCO, GSHHS, OpenStreetMap and Google Aerial imagery was used to generate the maps (A–C). (F) The 1.5m square quadrant study site with underwater identifying markers, sampling lines and points shown. During surveys a version of this map printed on waterproof paper was used as a reference underwater.
2.2.1 Bathymetry reconstruction through structure from motion
To assess and accurately represent the topology of the coral reef ecosystem, capturing its rugosity, low-frequency undulating shape and high-frequency features in the corals themselves, a three-dimensional reconstruction of the reefscape was created by structure from motion imagery, following the approach described in (Sandin et al., 2020). The resulting detailed map of the quadrant also provide the volumetric abundance of the specific functional primary producer groups. In combination with the topology this serves as input for the multiphysics and biological model.
Approximately 2700 two-dimensional photographs taken from largely a nadir direction supplemented by multiple perspectives were therefore processed using the image software Agisoft Metashape (v1.8.4, Agisoft LLC, St. Petersburg, Russia) to recreate three-dimensional landscapes, a technique called Structure from Motion (SfM). SfM compares multiple camera views to estimate the three-dimensional geometry of an object in the form of a point cloud (Westoby et al., 2012; Sandin et al., 2020). In this case 16-megapixel (3264×4928) photos were taken with a Nikon D7000 SLR camera with a Nikon AF-S DX VR 18-55mm f/3.5-5.6G II lens in an Ikelite Dome waterproof casing. In total the 23 GB of photo data were processed into a point cloud data set of size 4.14 GB, containing 1.53×10⁸ points with spatial three-dimensional coordinates and RGB channels for color, bounded by a box of size 3.89 m × 4.07 m horizontally and 0.81 m vertically.
2.2.2 Oxygen measurements
Dissolved oxygen (DO) concentrations were assessed over multiple days and nights every 10 cm along line transects randomly placed across the plot (see Figure 1F) at a distance of 3 mm above the benthos. DO measurements were conducted with a FireSting®-GO2 probe in a custom-built underwater case, equipped with a fiberoptic oxygen sensor (Robust Oxygen Probe OXROB10, Ø 3mm).
2.2.3 Water flow measurements
In order to provide fluid flux boundary conditions for the model, an assessment of flow in situ was required. To assess this bulk fluid flow in the region of the quadrant, outside boundary layer processes close to the reef, neutrally buoyant tracer particles (ping-pong balls filled with saline water solution) were released above the reef. After the particles had been advected away from the region of interest, all were collected to be reused in later studies. Video footage from different perspectives with key markers identified was then analyzed both manually and using the video analysis and modeling tool Tracker (https://physlets.org/tracker/). This was further supported by follow up measurements using an in situ ADCP for a time series of the larger-scale flow, and is described in (Holzhauser, 2022). Bottom pressure recorders were used to measure tides, atmospheric pressure, and ocean waves. The latter provided an indirect estimate of the orbital bottom velocities and of the Stokes drift. Also, numerical hydrodynamic simulations were performed by forcing a nested regional- to local-scale Delft-3D model with astronomical tide and wind. The results compare with the observed bottom velocities on the quadrant.
2.3 Model setup
A three-dimensional numerical model of an in situ coral reef plot was developed to investigate the extent of hypoxia in the reef ecosystem. Model results have been compared with the in situ oxygen measurements to evaluate the potential of the model to predict the location of hypoxic regions.
2.3.1 Key model components
In order to represent spatial oxygen patterns and understand how dissolved oxygen behaves in the system, a numerical model coupled the flow of sea water with the mass transport of dissolved oxygen (DO), dissolved organic carbon (DOC) and of microbes. The model was implemented in COMSOL Multiphysics (v5.4, COMSOL inc., Burlington, MA, USA). The water flow was represented by a time-averaged static vector field of water velocity, while the solutes and microbes were described by time-varying fields of concentration. Given the very irregular nature of the bottom reef surface geometry, a water flow model that includes fine scale is required. Ideally, hydrodynamics should operate over multiple scales, such that a coarse resolution is used for the bulk open-water flow and a much finer resolution is set in the proximity of the reef surface. At the large scale the water flow is expected to be turbulent (e.g., Stocking et al., 2018), while in the vicinity of the reef surface the slower flow may be in the laminar regime. The mass transfer of DO and DOC is linked to the different sources and sinks, for example, various primary producer holobionts and the respective planktonic microbial community. These organismal DO and DOC fluxes, along with the underlying microbial dynamics and metabolic rates were estimated in multiple studies previously conducted by our team, and parameters are listed in Table S1. DOC was included in the model to link the microbial metabolism to that of the coral and macroalgae. The growth of microorganisms can be limited by the abundance of DO and DOC. The coral and macroalgae, which exist on the bottom seabed boundary in the model, interact with the system through bottom surface fluxes.
2.3.2 Model geometry
The model domain contains the lower section of a water column bounded by a horizontal quadrant of the seabed 1.5 × 1.5 m in size and extending vertically up from a zero height reference (the mean of bathymetric displacements), as outlined in Figure 1F.
The model seabed boundary was generated from the point cloud bathymetric measurements (section 2.2.1) through a bilinear interpolation followed by a transformation to a parametric surface. This data processing had the aim of filtering noise in the SfM-generated point cloud and smoothing the surface to regularize the smallest feature scale in the computational boundary. The interpolation and geometry construction were performed in COMSOL. The resulting domain extended upwards from the depth elevation map of the seabed is presented in Figure 2B. The smallest spatial scale resolved in the model was ~0.02 m. The three-dimensional fluid flow and mass transport with reactions were solved in COMSOL, on a tetrahedral finite-element mesh.
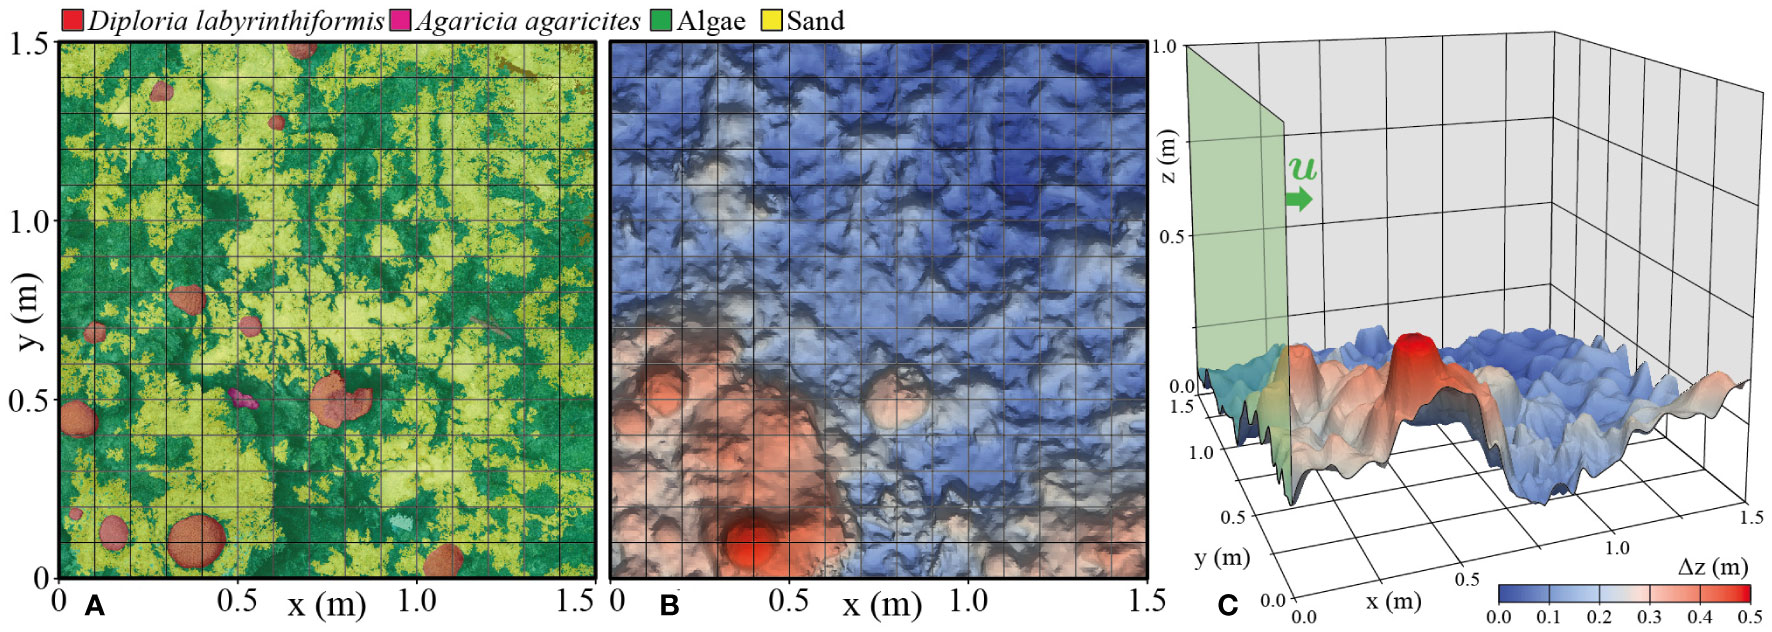
Figure 2 (A) Annotation of functional surface types in the reef ecosystem domain. (B) Bathymetry generated through the Structure from Motion method. (C) Domain geometry and the inflow boundary.
2.3.3 Annotation
Describing the interaction of corals and macroalgae on the reef with the water column, through the transfer of DO and DOC, required an accurate map of seabed coverage – created by a process called annotation. The interfaces between different surface types (algae, coral, sand, etc.) are intricate (Figures 1D–F). A segmentation of the full 3D point cloud (recently pursued in e.g. Runyan et al., 2022) was not required since this study is limited to a 2D discretization of the seabed. The measured point cloud was first transformed to an ortho-photomosaic (a mosaic of square images) to give a flat image of the quadrant. For the segmentation of this orthophotomosaic, an automated approach (e.g., Alonso et al., 2019) using a SEEDS algorithm (Van den Bergh et al., 2012) did not perform well in this particularly complex environment. Therefore, we applied a manually guided marker-based watershed algorithm (Beucher, 1982) from the OpenCV software suite of image segmentation tools (https://www.opencv.org). The resulting segmentation of this bottom boundary is shown in Figure 2A.
The seabed surface was annotated with different colors for the three components: sand, macroalgae or coral. Next, the two-dimensional annotation was mapped on the three-dimensional seabed surface used by the model by interpolation and the colors were matched by the corresponding day or night fluxes of DO and DOC, through a computational routine in MATLAB (MathWorks Inc., Natick, MA, USA). The original annotation and the mapped fluxes on the seabed are presented in Figure 2.
2.3.4 Fluid flow
The scope of this study is limited to the calculation of a steady-state water flow that supports the convective transport of dissolved species and microbes. The hydrodynamic model was based on the standard incompressible Navier-Stokes equations, with a realizable k-ϵ turbulence model (Shih et al., 1995). The k-ϵ model was chosen for its capacity to describe recirculating flows, for good performance in capturing the mean flow around complex structures, and because it is one of the most commonly applied and validated turbulence models in environmental systems.
The physical properties (water density and viscosity) were assumed constant, uninfluenced by local changes in water temperature, salinity, DO, DOC or the presence of microbes. With these assumptions, the flow equations were solved in the 3D model system for the velocity vector u, the pressure p, the turbulent kinetic energy k and the rate of dissipation of turbulent kinetic energy ϵ.
2.3.5 Solutes and microbes transport
Three transport equations were set for the components i = DO (dissolved oxygen), DOC (dissolved organic carbon) and X (microbes), which are passively transported by the flow of water. Time-dependent transport equations were needed to capture changes and responses through day and night, and these included convection, diffusion and reaction rates:
with ci denoting the concentration of each species, Di the diffusion coefficient and Ri the total reaction rate. The steady-state flow velocity u (Section 2.3.4) was used as a static vector field input to drive the convective transport.
The reaction rates reflect the DOC and DO links between the heterotrophic microbial metabolism and the coral and macroalgae metabolism. The DO and DOC concentrations (cDO and cDOC) limit the microbial growth rate RX, through the commonly assumed Monod factors:
Similarly, the net consumption reaction rates for DO and DOC, RDO and RDOC, are linked to growth of heterotrophic microbes in concentration cX:
In the rate expressions, µmax is the maximum growth rate of the microbes, Ki,X is the half-saturation (Monod) coefficient and fi,X is a stoichiometric yield (values in SI Table 1).
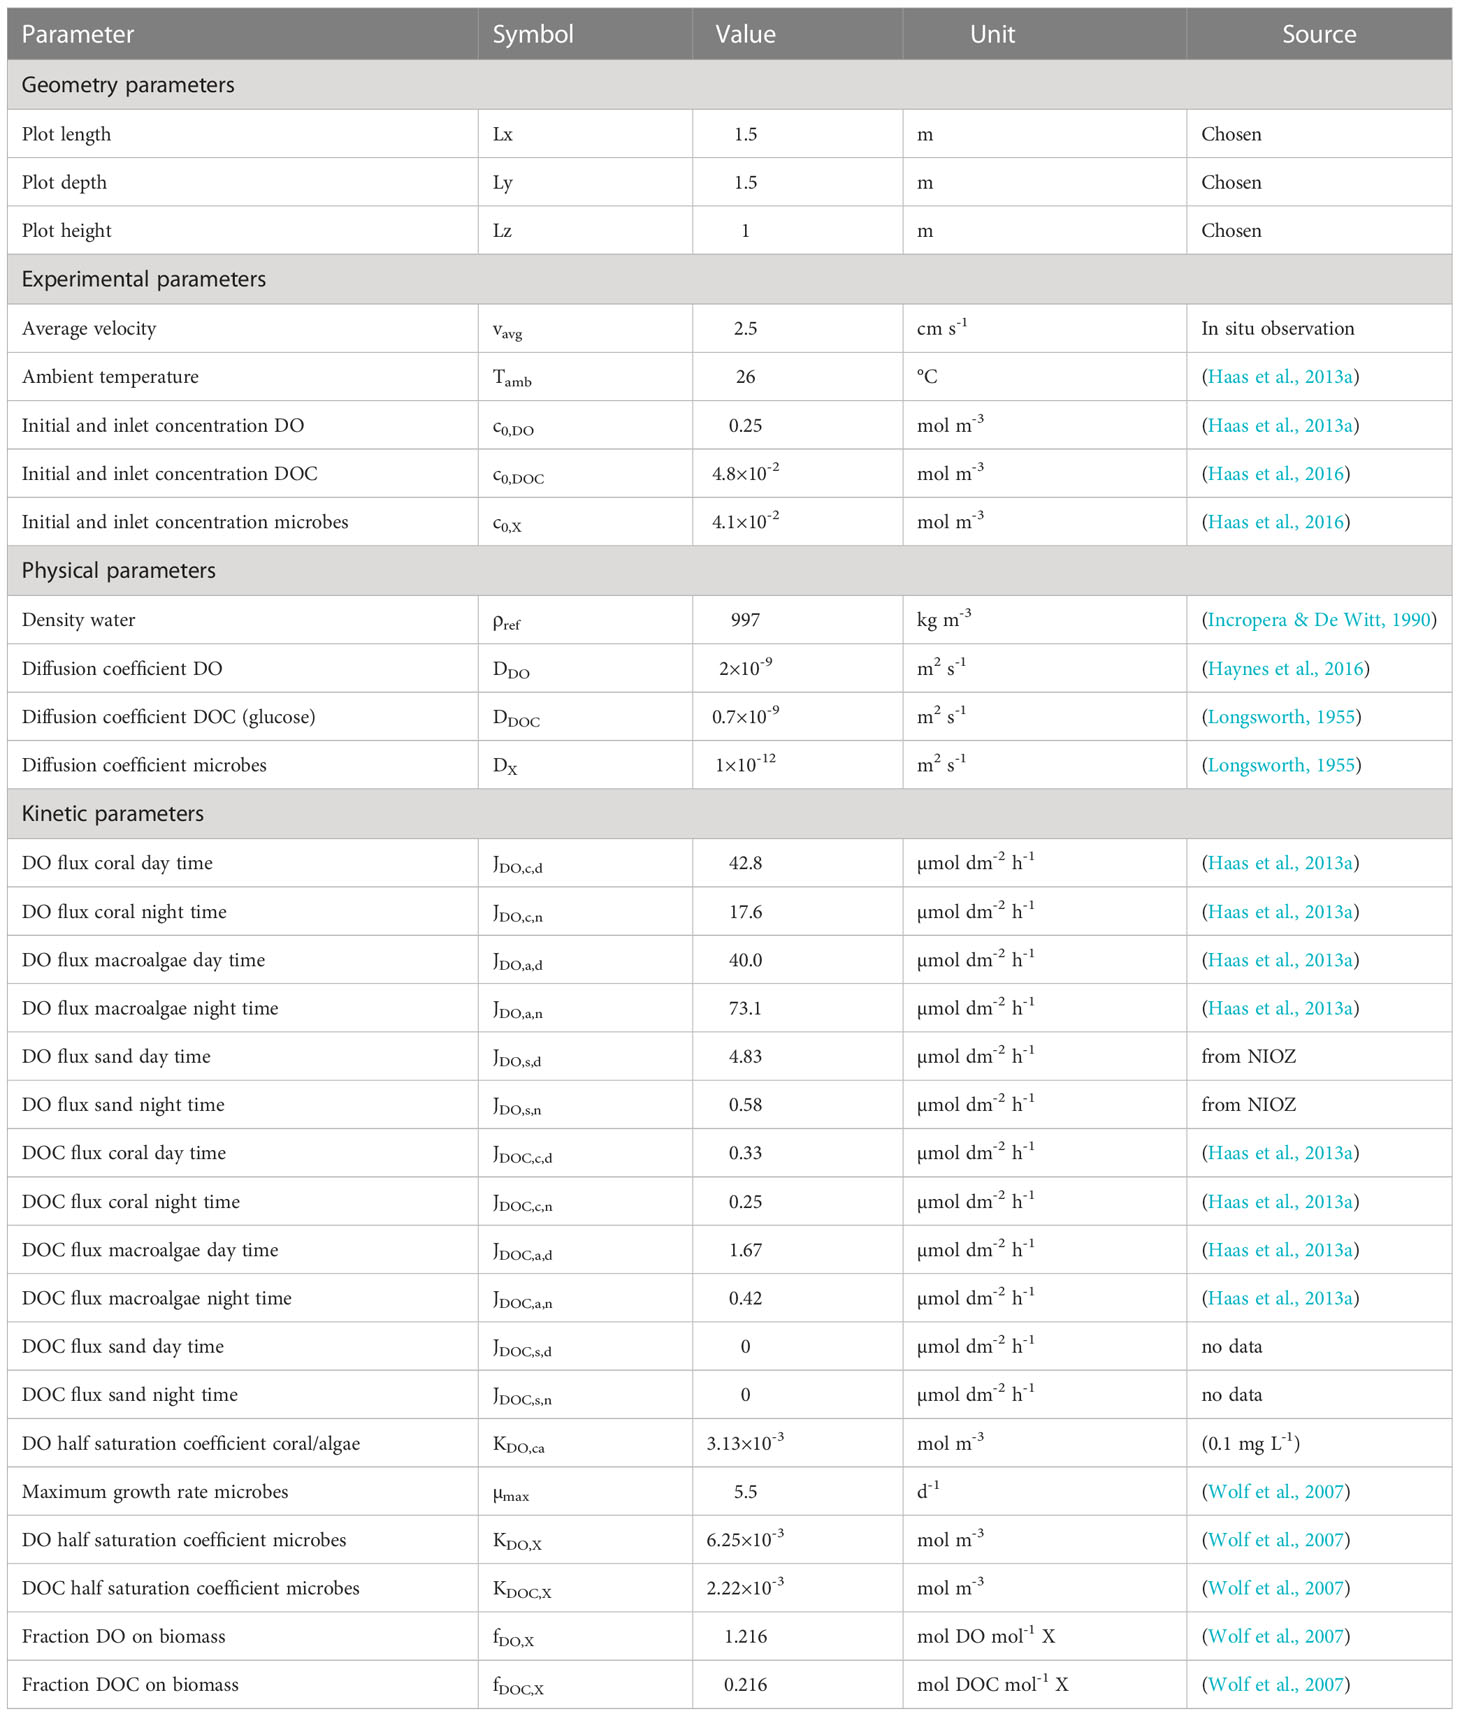
Table 1 Model parameters including geometry, experimental conditions and kinetics.
In contrast with the volumetric microbial rates, the coral and macroalgae consumption and production were measured experimentally as surface fluxes and thus incorporated as a surface reaction on the annotated bottom boundary. Both DO and DOC fluxes at the seabed, FDO and FDOC, were varied to mimic the day and night cycles. The DO consumption flux of the seabed during nighttime was also limited with a Monod factor. The fluxes are introduced as the surface reaction term:
where J is the experimentally inferred surface flux and KDO,ca is the DO half-saturation coefficient for coral and algae combined (values in SI Table 1).
2.3.6 Boundary conditions
The interactions between the system and its outer environment are represented by the boundary conditions defined in the model. A water inflow in fully-developed turbulent condition with average velocity vavg was applied at the south-westerly edge of the quadrant. Correspondingly, a fixed pressure condition was imposed on the opposite outflow boundary. The seabed was assigned with a zero flow (no-slip) to represent the friction with a solid surface. Flow symmetry conditions was applied to all other boundaries, illustrated in Figures 1D–F.
In agreement with the water flow boundary conditions, a constant concentration of mobile components was imposed in the inflow (ci = c0,i) with DO at full saturation and convection-only was set in the outflow. Surface reactions were assigned to the seabed, according to the day/night fluxes Ji of DO and DOC, caused by the presence of holobionts. Symmetry condition was applied to all other boundaries.
3 Results and discussion
When the forces of the ocean meet the shoreline, the somewhat predictable water movement of ocean currents and waves becomes turbulent (Lewis, 1968; Carter, 2013) and seemingly erratic. Even more so if these forces hit land surrounded by the complex and intricate structures built by the myriads of small coral polyps that create the vast coral reef systems that line many tropical shores (Rogers et al., 2013; Yu et al., 2022). However, these water movements play a pivotal role in the ecology of nearshore systems. Not only do they affect the concentrations and dispersal of land-derived substances (Li et al., 1999), which, in the Anthropocene, are mostly pollutants or other agents harmful to the environment (e.g., DeGeorges et al., 2010; Macías-Zamora, 2011; Prouty et al., 2017), they also affect metabolism or interactions of virtually all reef denizens (e.g., Koehl, 1982; Abelson and Denny, 1997; Mass et al., 2010; Lenihan et al., 2015; Nelson et al., 2022). But these turbulent water movements close to the reef framework are hard to measure or to predict (Nowell and Jumars, 1984). To get a better understanding of the small-scale distribution of dissolved substances like DO or DOC that play a pivotal role for most organisms in the ecosystem (Barott and Rohwer, 2012), we used previously established organismal abundances and metabolic rates to perform simulations with a three-dimensional numerical model of a reef plot representing a typical benthic community in a Caribbean coral reef.
Initially, flume experiments helped to set and verify the model parameters. We compared sections of the three-dimensional numerically calculated oxygen patterns caused by coral, algae and their associated microbial communities against the measured oxygen distribution in the flume, two-dimensionally visualized with planar optodes (Haas et al., 2013a). An example of these comparison is shown in Figure S1. Numerical models were able to recreate the small scale DO patterns around coral/algae consortia measured along the optode sheets in the flume experiment, with the same plume tail shape in both day and night. Moreover, the oxygen concentrations within the plume are in the same ranges, at 200-300 µmol L−1 during the day and 0-200 µmol L−1 at night. Discrepancies between simulated and experimental DO distribution patterns may be the result of several reasons, such as deviations in the shapes representing the coral and/or algae or because optode sheets can also cause a smearing effect influencing the determined two-dimensional DO patterns. Despite inherent deviations from the measurements, the computational models provided important cues on and a good representation of the measured oxygen distribution patterns. At this point the models where thus then a good basis for the following in-situ applications.
To apply the model to three-dimensional representations of real coral reef environments we used the functional surfaces from the boundary topography, and the passively transported additional effects of the DOC dependent microbial metabolism. The larger water flow patterns above the coral reef were determined, considering tidal patterns, wind and wave motion, and the data derived from a side view video recording of small neutrally buoyant objects floating in the water column above the coral reef plot. The combination of these assessments yielded an average water velocity of 2.5 cm s−1 above the reef plot during the sampling time. Although there are various other factors (e.g., tides) influencing the spatio temporal variability of current speed and direction, we assumed a constant current speed and direction representing the conditions when the particle tracking experiments were carried out at the reef plot.
DO distribution patterns above the seabed were simulated through a 24 hour day-night cycle. They reached minimum concentrations by midnight (t = 00:00) and stayed at these concentrations until the onset of photosynthesis (around 05:45). Midday (t = 12:00) represented the maximum concentrations of DO in the DO distribution patterns. Since the DO concentrations at other times during the cycle were always between the minimum and maximum, only midnight (t = 00:00) and midday (t = 12:00) are shown in this model (Figure 3). As expected, DO concentrations above the seabed compared to the bulk were lower during night time due to respiration and higher during daytime due to photosynthesis. The simulation results are comparable to in situ measurements from experiments elsewhere in the Caribbean Sea (Haas et al., 2010), which reported a minimum and maximum of approximately 140 µmol L−1 and 250 µmol L−1, respectively. During the night a locally confined discernible hypoxic region (DO concentration< 69.5 µmol L−1) was predicted by the model (Figure 4). Within this experimental plot none of the corals experienced hypoxia (Figures 3, 4). The hypoxic conditions were typically located downstream of a more pronounced structure likely resulting from a circulating flow and extended water residence time caused by the structure. This suggests that alterations in water movement resulting from structural complexity could constitute a key factor in the occurrence of in situ extreme DO concentrations (Figures 3A–G). The tracked water particle paths in Figure 4, marked by white lines, highlight the recirculation gyre that is also seen in the vertical slices in Figures 3E–H, that entraps regions of local highs and lows of DO during the day and night, respectively. This build up of changes in the oxygen concentrations within this gyre can been structurally in Figure S2, and dynamically over the day-night cycle in the connected Video S4. The paths in Figure 4 also show cross-lateral movement of water and across the region perpendicular the forced flow direction, indicating connections over the reef are complex, even in the relatively simple flow regime modelled here.
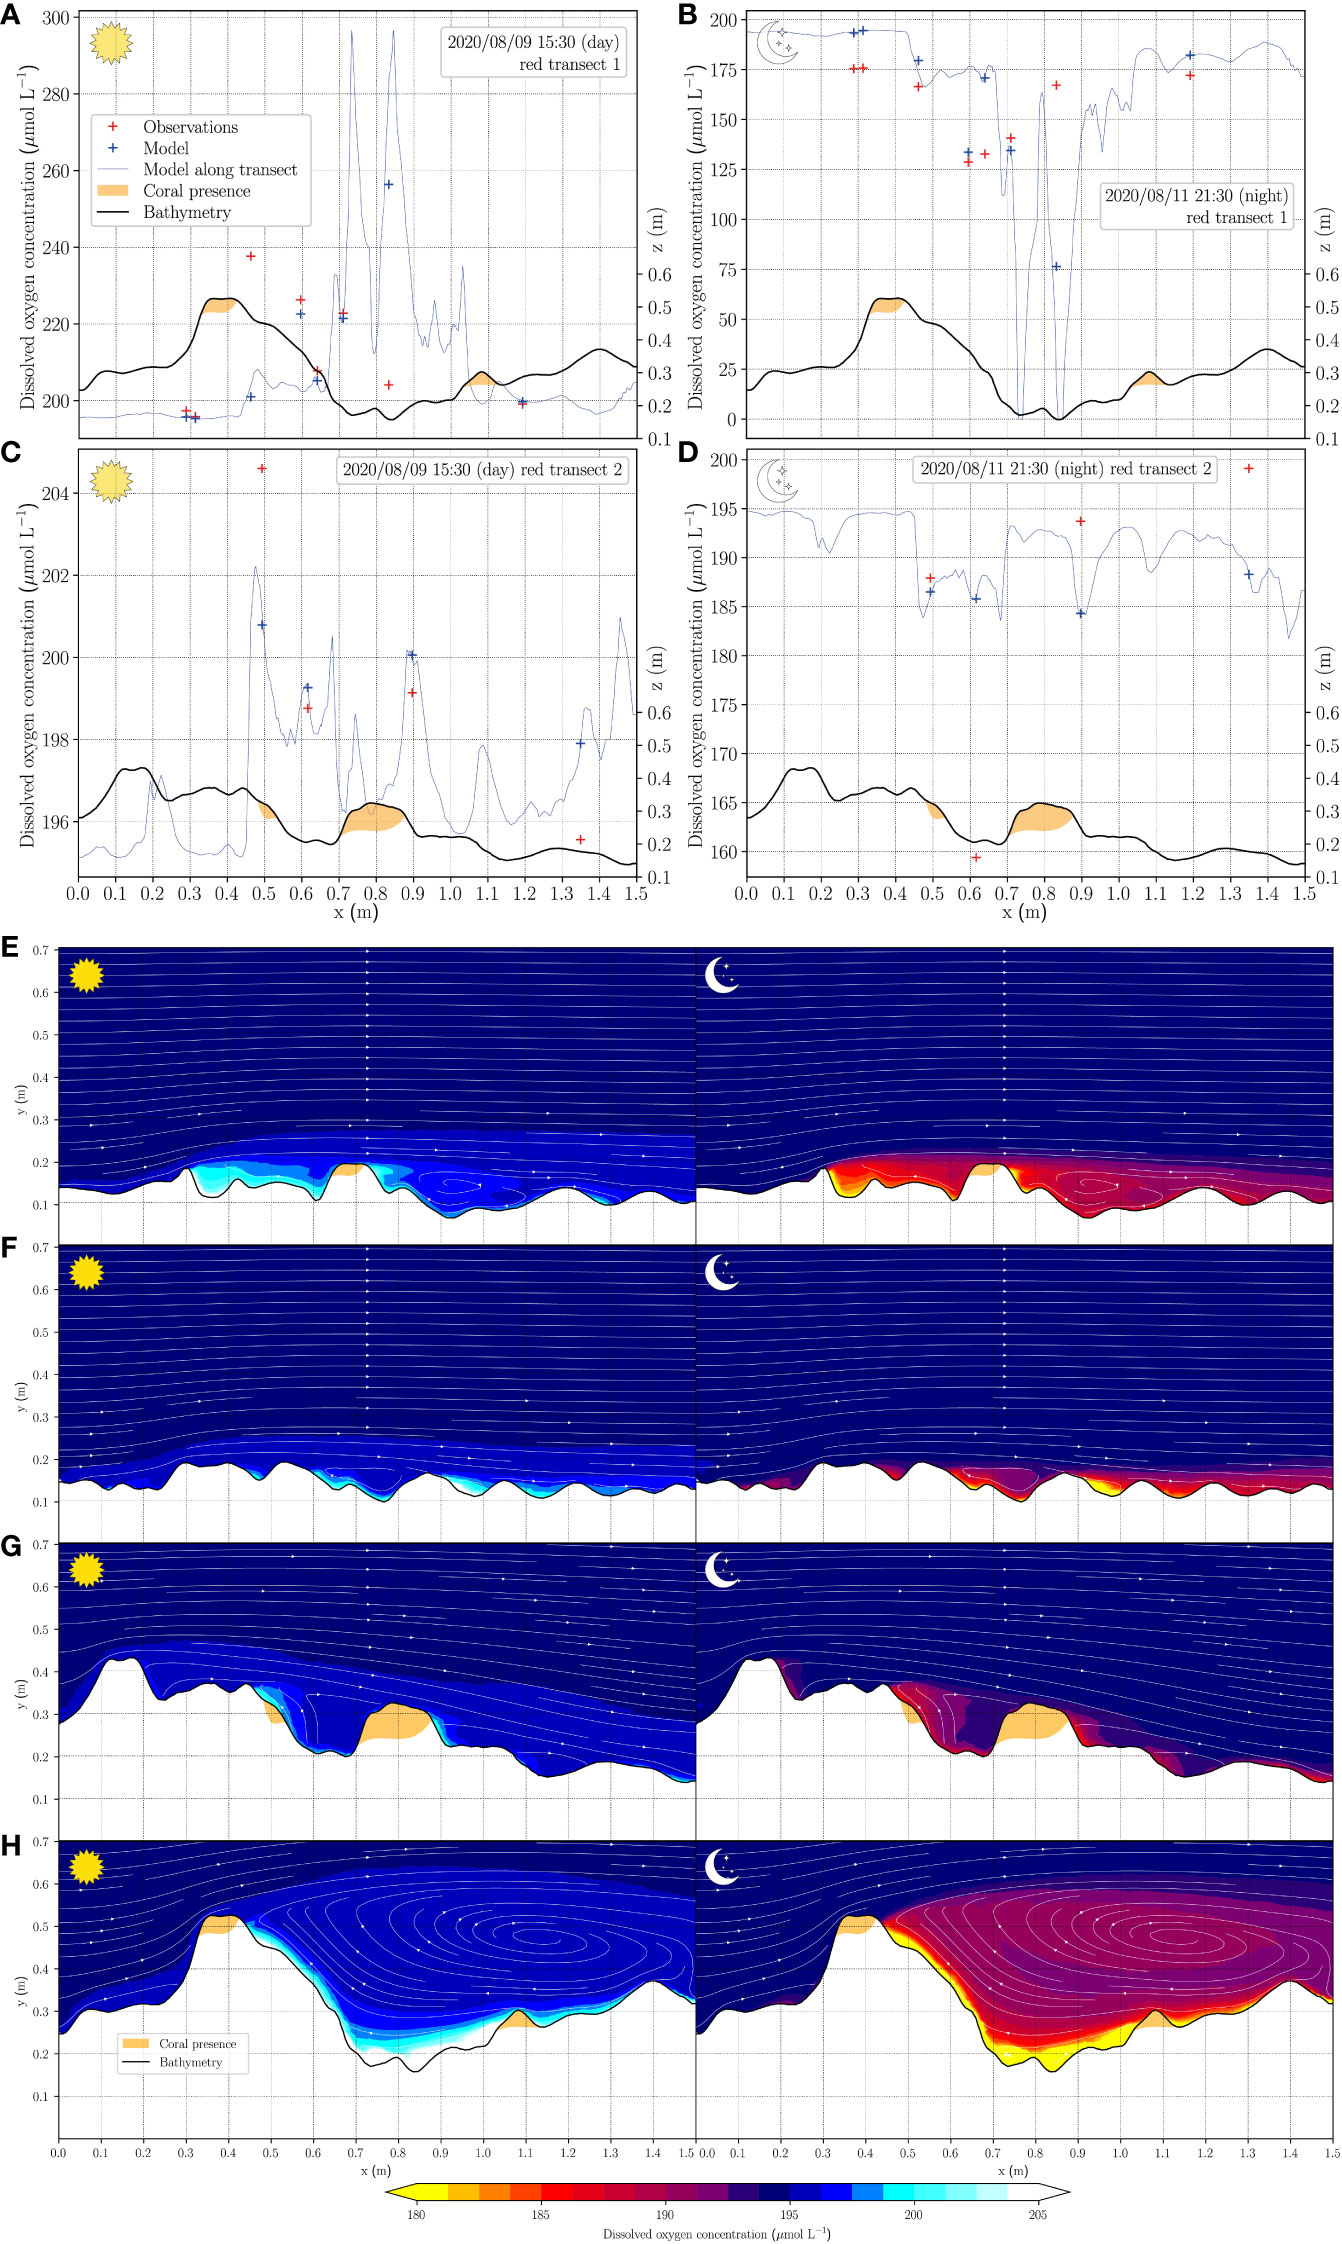
Figure 3 (top) Observed oxygen concentrations compared to simulated, at (A) transect line 1 during the day at 15:30 local time, (B) transect line 1 during the night at 21:30, (C) transect line 2 during the day at 15:30 local time, (D) transect line 2 during the night at 21:30, respectively, as shown in Figure 2. (bottom) Two-dimensional oxygen distribution patterns in the water column during day and nighttime. The left and right column represent day and night time, respectively. The white arrows indicate the velocity field in the water column and the positions of corals are indicated in yellow in the seabed topography. A vertical slice of oxygen distribution patterns along transect line 4 is shown in (E), with transect line in (F) and lines 2 and 1 in (G, H), respectively.
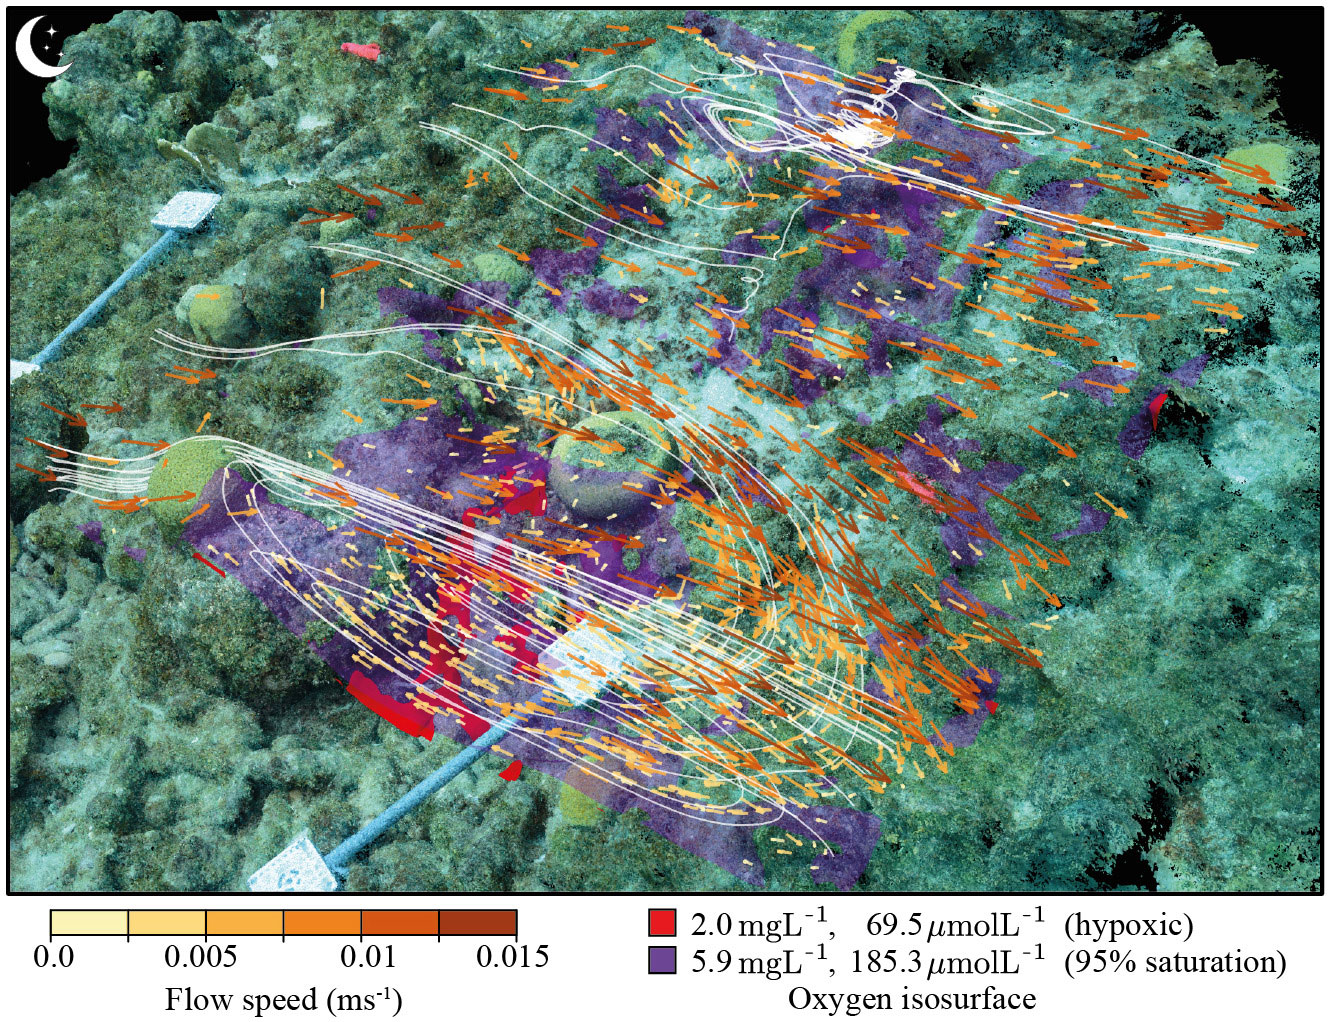
Figure 4 Calculated flow vectors across the imaged reef plot colored by speed. The red and purple areas identify isosurfaces where DO concentrations are at 95% saturation (purple, 185.3 µmol L-1) and below the hypoxia threshold (red, 69.5 µmol L-1). To give an indication of example flow paths, a Runge-Kutta particle tracking algorithm was implemented to track water parcels as they move over and in the reef plot. The smaller-scale features resolved in the model can be seen further in the two zoomed-in sections of the above visualization provided in Figure S3.
The heterogeneity of DO concentrations has already been shown previously in controlled flume experiments (Haas et al., 2013a). Results of the present study corroborate these findings and show that concentrations of the assessed water column parameters (here only visualized for DO) are likely governed by the water movement that, at these small scales near the benthos, is significantly influenced by the three-dimensional reef structure. The heterogeneity at these scales, where solute concentrations differ by almost 100% over a distance of less than 10 cm, may pose implications for a variety of near benthos water parameter assessments. How the local topography shapes the water flow above structurally complex benthos should be considered when investigating dissolved substances in coral reef ecosystems. To measure the conditions within an ecosystem, integrated samples from multiple sampling locations are likely necessary to represent the system-wide parameters. Single point measurements or logger data from one randomly chosen spot in a coastal ecosystem will run the risk of capturing conditions within a non-representative water movement location and thus drastically misrepresent the system wide dynamics of the assessed parameter.
Our results further highlight the importance of previously described positive feedback loops that may be created during phase-shifts from coral- to algal-dominance on reefs (Smith et al., 2006; Barott and Rohwer, 2012). Initial increases in algal biomass or productivity (due to natural and/or anthropogenic stressors) results in an increase and a compositional change of dissolved organic compounds released in the water column (Kelly et al., 2022; Nelson et al., 2022). These compounds promote increased microbial activity and a change towards more copiotrophic and pathogenic communities resulting in a higher prevalence of diseases and local hypoxic zones that can rapidly stress or even kill corals giving algae a competitive advantage. The relative importance of these mechanisms across broad spatial and temporal scales is still under debate and it is still questioned if these small-scale hypoxic zones may have any ecological significance in reef environments that are constantly exposed to water movement and thus exchange of solutes. While the here presented results are by far not representative of all the different conditions coral reefs are exposed to, they do suggest that local small-scale hypoxic zones can persist in the turbulent environment of a nearshore coral reef for an extended period of time.
Surely, the results of this study are affected by a series of limitations. The impact of metabolism on the formation of hypoxic regions could be underestimated in this model, since the used fluxes for organismal metabolism were mostly derived from incubation experiments. In situ metabolic fluxes are known to differ based on various parameters like flow regime or benthic community composition (e.g., Wangpraseurt et al., 2012; Brown and Carpenter, 2013; Smith et al., 2013). The model could further be improved by using metabolic fluxes established for the specific coral and algae taxa as well as the microbial community at the respective reef site. Moreover, velocity fields including the effects of tides, wind and waves instead of an average velocity could be used to estimate the water flow above the coral reef more accurately. These velocity fields could be derived from large-scale simulations of ocean currents since it is difficult to experimentally measure in situ average velocities, let alone velocity fields.
4 Outlook
There is a historic gap between the investigation of physical, chemical, and biological drivers in coastal ecosystem functioning, and even more so in a coral reef system. This gap was most likely the result of the discrepancies in temporal and spatial scales that were in the focus of the respective disciplines. Our current work is an attempt to bridge this gap by bringing together at an organism relevant scale the organism spatial distribution and their basic metabolism, the changes in water chemistry, and the physical forces that govern the variations across a coral reef environment. This novel approach is based on a three-dimensional numerical evaluation of fluid dynamics and oxygen distribution patterns in a virtual reef environment generated from an existing in situ coral reef. The model and the subsequent assessment of the model predictions at the in situ location showed that there is a noticeable heterogeneity in the distribution of solutes near the benthos. This heterogeneity is based on biological processes as well as on alterations of water movement by local topography.
Although incipient, the presented numerical models provide a good base for the development of more elaborate models in the future. Furthermore, the combination of measurements and modeling techniques should be continued to achieve the more quantitative approach required for research on coral reef functioning. Parameters obtained from measurements could feed into the numerical multiphysics models which in turn would guide the measurements, resulting in an efficient process loop. Overall, numerical multiphysics modeling provides a new perspective on coral reef functioning and will aid improvement in our ability to preserve coral reef ecosystems.
Data availability statement
The original contributions presented in the study are included in the article/Supplementary Material. Further inquiries can be directed to the corresponding authors.
Author contributions
AC, ST, and AH conducted and analyzed the experiments and spearheaded the writing process. FvD, BM, MA, WB, MC, YS, YE-K, CW, LK, CN, SS, MV, FR, and CP, collected data helped with the writing and coding process, improved the model and contributed their expertise to this study. PS and AH helped during the data collection, analysis and modeling phase and conceptualized the study. All authors contributed to the article and approved the submitted version.
Funding
This research received funding from the Dutch Research Council (NWO) in the Call Caribbean Research: a multidisciplinary approach. CP acknowledges support and access to computational resources offered by the KAUST Computing Center and AC would like to thank SURF (www.surf.nl) for the support in using the National Supercomputer Snellius, under grant EINF-3105. CN was supported by the US National Science Foundation (Grant OCE 2023298) and by the US National Oceanic and Atmospheric Administration Project A/AS-1 sponsored by the University of Hawaii Sea Grant College Program under Institutional Grant No. NA18OAR4170076 from NOAA Office of Sea Grant, Department of Commerce. The views expressed herein are those of the author(s) and do not necessarily reflect the views of NOAA or any of its subagencies. This is University of Hawai'i School of Ocean and Earth Science and Technology (SOEST) publication number 11646 and Hawai'i Sea Grant publication UNIHI-SEAGRANT-JC-21-51.
Acknowledgments
We would like to thank the staff of CARMABI research station.
Conflict of interest
The authors declare that the research was conducted in the absence of any commercial or financial relationships that could be construed as a potential conflict of interest.
Publisher’s note
All claims expressed in this article are solely those of the authors and do not necessarily represent those of their affiliated organizations, or those of the publisher, the editors and the reviewers. Any product that may be evaluated in this article, or claim that may be made by its manufacturer, is not guaranteed or endorsed by the publisher.
Supplementary material
The Supplementary Material for this article can be found online at: https://www.frontiersin.org/articles/10.3389/fmars.2023.1135686/full#supplementary-material
Supplementary Figure 1 | Two-dimensional oxygen distribution patterns of algae under forced-flow conditions during day and night time. All experimental images (A–D) are from Haas, Gregg et al. (2013). Simulation images (E, F) are steady state modelling calculations. Arrows indicate direction of water movement, forced at an average speed of 5 cm s-1. Experimental oxygen distribution patterns are shown in (A) for the day time and in (B) for the night. (C, D) show the calibrated oxygen levels following the image analysis procedure described in Haas, Gregg et al. (2013) for (A, B), respectively. (E, F) show the steady state simulation output for day and night, respectively.
Supplementary Figure 2 | Three-dimensional oxygen distribution patterns under forced-flow conditions during day and night time. The oxygen legend refers to the oxygen concentration at the seabed, overlaid with volumetric isocontours in the body of water above: a yellow isocontour at 180 µmolL−1 and light blue one at 205 µmolL−1 (matching the legend coloring). As well as the low-oxygen zone appearing in the recirculation eddy following the raised outcrop, there are also plumes of oxygen seen. An animated version of the full day-night cycle can be seen in Video S4 provided in the Supplementary materials accompanying this manuscript.
Supplementary Figure 3 | Zoomed-in regions of to indicate the level of complexity and small-scale features included in the simulation model.
References
Abelson A., Denny M. (1997). Settlement of marine organisms in flow. Annu. Rev. Ecol. Systematics 28, 317–339. doi: 10.1146/annurev.ecolsys.28.1.317
Alonso I., Yuval M., Eyal G., Treibitz T., Murillo A. C. (2019). CoralSeg: Learning coral segmentation from sparse annotations. J. Field Robotics 36, 1456–1477. doi: 10.1002/rob.21915
Altieri A. H., Harrison S. B., Seemann J., Collin R., Diaz R. J., Knowlton N. (2017). Tropical dead zones and mass mortalities on coral reefs. Proc. Natl. Acad. Sci. 114, 3660–3665. doi: 10.1073/pnas.1621517114
Barott K. L., Rohwer F. L. (2012). Unseen players shape benthic competition on coral reefs. Trends Microbiol. 20, 621–628. doi: 10.1016/j.tim.2012.08.004
Barott K., Smith J., Dinsdale E., Hatay M., Sandin S., Rohwer F. (2009). Hyperspectral and physiological analyses of coral-algal interactions. PloS One 4, e8043. doi: 10.1371/journal.pone.0008043
Bayley D. T., Mogg A. O. (2020). A protocol for the large-scale analysis of reefs using structure from motion photogrammetry. Methods Ecol. Evol. 11, 1410–1420. doi: 10.1111/2041-210X.13476
Bellwood D. R., Hughes T. P., Folke C., Nyström M. (2004). Confronting the coral reef crisis. Nature 429, 827–833. doi: 10.1038/nature02691
Beucher S. (1982). “Watersheds of functions and picture segmentation,” in ICASSP’82 IEEE International Conference on Acoustics, Speech, and Signal Processing (IEEE). 1928–1931.
Brown A. L., Carpenter R. C. (2013). Water-flow mediated oxygen dynamics within massive porites-algal turf interactions. Mar. Ecol. Prog. Ser. 490, 1–10. doi: 10.3354/meps10467
Burns J. H. R., Delparte D. (2017). Comparison of commercial structure-from-motion photogrammety software used for underwater three-dimensional modeling of coral reef environments. Int. Arch. Photogrammetry Remote Sens. Spatial Inf. Sci. 42, 127. doi: 10.5194/isprs-archives-XLII-2-W3-127-2017
Carter R. W. G. (2013). Coastal environments: An introduction to the physical, ecological, and cultural systems of coastlines (Elsevier).
De Bakker D. M., Van Duyl F. C., Bak R. P., Nugues M. M., Nieuwland G., Meesters E. H. (2017). 40 years of benthic community change on the Caribbean reefs of curaçao and bonaire: The rise of slimy cyanobacterial mats. Coral Reefs 36, 355–367. doi: 10.1007/s00338-016-1534-9
DeGeorges A., Goreau T. J., Reilly B. (2010). Land-sourced pollution with an emphasis on domestic sewage: Lessons from the Caribbean and implications for coastal development on Indian ocean and pacific coral reefs. Sustainability 2, 2919–2949. doi: 10.3390/su2092919
Gardner T. A., Côté I. M., Gill J. A., Grant A., Watkinson A. R. (2003). Long-term region-wide declines in Caribbean corals. Science 301, 958–960. doi: 10.1126/science.1086050
Haas A. F., Fairoz M. F., Kelly L. W., Nelson C. E., Dinsdale E. A., Edwards R. A., et al. (2016). Global microbialization of coral reefs. Nat. Microbiol. 1, 1–7. doi: 10.1038/nmicrobiol.2016.42
Haas A. F., Gregg A. K., Smith J. E., Abieri M. L., Hatay M., Rohwer F. (2013a). Visualization of oxygen distribution patterns caused by coral and algae. PeerJ 1, e106. doi: 10.7717/peerj.106
Haas A. F., Jantzen C., Naumann M. S., Iglesias-Prieto R., Wild C. (2010). Organic matter release by the dominant primary producers in a Caribbean reef lagoon: Implication for in situ O2 availability. Mar. Ecol. Prog. Ser. 409, 27–39. doi: 10.3354/meps08631
Haas A. F., Nelson C. E., Rohwer F., Wegley-Kelly L., Quistad S. D., Carlson C. A., et al. (2013b). Influence of coral and algal exudates on microbially mediated reef metabolism. PeerJ 1, e108. doi: 10.7717/peerj.108
Haas A. F., Nelson C. E., Wegley Kelly L., Carlson C. A., Rohwer F., Leichter J. J., et al. (2011). Effects of coral reef benthic primary producers on dissolved organic carbon and microbial activity. PloS ONe 6 (11), e27973. doi: 10.1371/journal.pone.0027973
Haas A. F., Smith J. E., Thompson M., Deheyn D. D. (2014). Effects of reduced dissolved oxygen concentrations on physiology and fluorescence of hermatypic corals and benthic algae. PeerJ 2, e235. doi: 10.7717/peerj.235
Haynes W.M. (Ed). (2016). CRC Handbook of Chemistry and Physics(97th ed.). CRC Press 2, e235. doi: 10.1201/9781315380476
Hench J. L., Leichter J. J., Monismith S. G. (2008). Episodic circulation and exchange in a wave-driven coral reef and lagoon system. Limnology Oceanography 53, 2681–2694. doi: 10.4319/lo.2008.53.6.2681
Hoegh-Guldberg O. (1999). Climate change, coral bleaching and the future of the world’s coral reefs. Mar. Freshw. Res. 50, 839–866. doi: 10.1071/MF99078
Hoegh-Guldberg O., Mumby P. J., Hooten A. J., Steneck R. S., Greenfield P., Gomez E., et al. (2007). Coral reefs under rapid climate change and ocean acidification. science 318, 1737–1742. doi: 10.1126/science.1152509
Holzhauser C. (2022). Local scale hydrodynamics and oxygen fluctuations near coral reefs. MSc Thesis. Utrecht University, The Netherlands. Available at: https://studenttheses.uu.nl/handle/20.500.12932/41833
Hughes T. P. (1994). Catastrophes, phase shifts, and large-scale degradation of a Caribbean coral reef. Science 265, 1547–1551. doi: 10.1126/science.265.5178.1547
Incropera F. P., DeWitt D. P. (1990). Convection Correlations: Turbulent Flow in Circular Tubes. Fundamentals of Heat and Mass Transfer, Third Edition. Incropera, FP and DeWitt, DP, New York, John Wiley – Sons (1990b), 495–498
Jackson J. B. C., Donovan M. K., Cramer K. L., Lam V. V. (2014). “Status and trends of Caribbean coral reefs,” in Global coral reef monitoring network (Gland, Switzerland: IUCN), 1970–2012.
Johnson M. D., Scott J. J., Leray M., Lucey N., Bravo L. M. R., Wied W. L., et al. (2021). Rapid ecosystem-scale consequences of acute deoxygenation on a Caribbean coral reef. Nat. Commun. 12, 1–12. doi: 10.1038/s41467-021-24777-3
Jorissen H., Nugues M. M. (2021). Coral larvae avoid substratum exploration and settlement in low-oxygen environments. Coral Reefs 40, 31–39. doi: 10.1007/s00338-020-02013-6
Jorissen H., Skinner C., Osinga R., De Beer D., Nugues M. M. (2016). Evidence for water-mediated mechanisms in coral–algal interactions. Proc. R. Soc. B: Biol. Sci. 283, 20161137. doi: 10.1098/rspb.2016.1137
Kelly L. W., Nelson C. E., Petras D., Koester I., Quinlan Z. A., Arts M. G., et al. (2022). Distinguishing the molecular diversity, nutrient content, and energetic potential of exometabolomes produced by macroalgae and reef-building corals. Proc. Natl. Acad. Sci. 119. doi: 10.1073/pnas.2110283119
Koehl M. A. R. (1982). The interaction of moving water and sessile organisms. Sci. Am. 247, 124–135. doi: 10.1038/scientificamerican1282-124
Lenihan H. S., Hench J. L., Holbrook S. J., Schmitt R. J., Potoski M. (2015). Hydrodynamics influence coral performance through simultaneous direct and indirect effects. Ecology 96, 1540–1549. doi: 10.1890/14-1115.1
Levenstein M. A., Gysbers D. J., Marhaver K. L., Kattom S., Tichy L., Quinlan Z., et al. (2022). Millimeter-scale topography enables coral larval settlement in wave-driven oscillatory flow. PLoS ONE 17 (9), e0274088. doi: 10.1371/journal.pone.0274088
Lewis J. R. (1968). Water movements and their role in rocky shore ecology. Sarsia 34, 13–36. doi: 10.1080/00364827.1968.10413369
Li L., Barry D. A., Stagnitti F., Parlange J.-Y. (1999). Submarine groundwater discharge and associated chemical input to a coastal sea. Water Resour. Res. 35, 3253–3259. doi: 10.1029/1999WR900189
Longsworth L. G. (1955). Diffusion in liquids and the Stokes-Einstein relation. In Shedlovsky T. (ed.) Electrochemistry in biology and medicine. New York, N.Y.: John Wiley & Sons, Inc., 225–247.
Lowe R. J., Koseff J. R., Monismith S. G. (2005). Oscillatory flow through submerged canopies: 1. Velocity structure. J. Geophysical Research: Oceans 110, C10016. doi: 10.1029/2004JC002788
Macías-Zamora J. V. (2011). “Ocean pollution,” in Letche T, Vallero D Waste (Amsterdam, the Netherlands: Elsevier), 265–279.
Mass T., Genin A., Shavit U., Grinstein M., Tchernov D. (2010). Flow enhances photosynthesis in marine benthic autotrophs by increasing the efflux of oxygen from the organism to the water. Proc. Natl. Acad. Sci. 107, 2527–2531. doi: 10.1073/pnas.0912348107
McDole T., Nulton J., Barott K. L., Felts B., Hand C., Hatay M., et al. (2012). Assessing coral reefs on a pacific-wide scale using the microbialization score. PloS One 7 (9), e43233. doi: 10.1371/journal.pone.0043233
Monismith S. G. (2007). Hydrodynamics of coral reefs. Annu. Rev. Fluid Mech. 39, 37–55. doi: 10.1146/annurev.fluid.38.050304.092125
Monismith S. G., Rogers J. S., Koweek D., Dunbar R. B. (2015). Frictional wave dissipation on a remarkably rough reef. Geophysical Res. Lett. 42, 4063–4071. doi: 10.1002/2015GL063804
Mora C. (2008). A clear human footprint in the coral reefs of the Caribbean. Proc. R. Soc. B: Biol. Sci. 275, 767–773. doi: 10.1098/rspb.2007.1472
Mumby P. J. (2006). The impact of exploiting grazers (Scaridae) on the dynamics of Caribbean coral reefs. Ecol. Appl. 16, 747–769. doi: 10.1890/1051-0761(2006)016[0747:TIOEGS]2.0.CO;2
Nelson H. R., Altieri A. H. (2019). Oxygen: The universal currency on coral reefs. Coral Reefs 38, 177–198. doi: 10.1007/s00338-019-01765-0
Nelson C. E., Wegley Kelly L., Haas A. F. (2022). Microbial interactions with dissolved organic matter are central to coral reef ecosystem function and resilience. Annu. Rev. Mar. Sci. 15, 431–460. doi: 10.1146/annurev-marine-042121-080917
Nowell A. R. M., Jumars P. A. (1984). Flow environments of aquatic benthos. Annu. Rev. Ecol. systematics 15, 303–328. doi: 10.1146/annurev.es.15.110184.001511
Pandolfi J. M., Connolly S. R., Marshall D. J., Cohen A. L. (2011). Projecting coral reef futures under global warming and ocean acidification. Science 333, 418–422. doi: 10.1126/science.1204794
Pandolfi J. M., Jackson J. B., Baron N., Bradbury R. H., Guzman H. M., Hughes T. P., et al. (2005). Are US coral reefs on the slippery slope to slime? Science (New York, N.Y.) 307(5716), 1725–1726. doi: 10.1126/science.1104258
Prouty N. G., Cohen A., Yates K. K., Storlazzi C. D., Swarzenski P. W., White D. (2017). Vulnerability of coral reefs to bioerosion from land-based sources of pollution. Science (New York, N.Y.) 307 (5716), 1725–1726. doi: 10.1002/2017JC013264
Reverter M., Helber S. B., Rohde S., de Goeij J. M., Schupp P. J. (2022). Coral reef benthic community changes in the anthropocene: Biogeographic heterogeneity, overlooked configurations, and methodology. Global Change Biol. 28, 1956–1971. doi: 10.1111/gcb.16034
Roach T. N., Abieri M. L., George E. E., Knowles B., Naliboff D. S., Smurthwaite C. A., et al. (2017). Microbial bioenergetics of coral-algal interactions. PeerJ 5, e3423. doi: 10.7717/peerj.3423
Rogers J. S., Maticka S. A., Chirayath V., Woodson C. B., Alonso J. J., Monismith S. G. (2018). Connecting flow over complex terrain to hydrodynamic roughness on a coral reef. J. Phys. Oceanography 48, 1567–1587. doi: 10.1175/JPO-D-18-0013.1
Rogers J. S., Monismith S. G., Feddersen F., Storlazzi C. D. (2013). Hydrodynamics of spur and groove formations on a coral reef. J. Geophysical Research: Oceans 118, 3059–3073. doi: 10.1002/jgrc.20225
Runyan H., Petrovic V., Edwards C. B., Pedersen N., Alcantar E., Kuester F., et al. (2022). Automated 2D, 2.5 d, and 3D segmentation of coral reef pointclouds and orthoprojections. Front. Robotics AI 9. doi: 10.3389/frobt.2022.884317
Sandin S. A., Edwards C. B., Pedersen N. E., Petrovic V., Pavoni G., Alcantar E., et al. (2020). Considering the rates of growth in two taxa of coral across Pacific islands. Advances in marine biology (Elsevier) 87 (1), 167–191. doi: 10.1016/bs.amb.2020.08.006
Shih T.-H., Liou W. W., Shabbir A., Yang Z., Zhu J. (1995). A new k-ϵ eddy viscosity model for high reynolds number turbulent flows. Comput. fluids 24, 227–238. doi: 10.1016/0045-7930(94)00032-T
Silveira C. B., Luque A., Roach T. N., Villela H., Barno A., Green K., et al. (2019). Biophysical and physiological processes causing oxygen loss from coral reefs. Elife 8, e49114. doi: 10.7554/eLife.49114.sa2
Smith J. E., Brainard R., Carter A., Grillo S., Edwards C., Harris J., et al. (2016). Re-evaluating the health of coral reef communities: baselines and evidence for human impacts across the central pacific. Proc. R. Soc. B: Biol. Sci. 283, 20151985. doi: 10.1098/rspb.2015.1985
Smith J. E., Price N. N., Nelson C. E., Haas A. F. (2013). Coupled changes in oxygen concentration and pH caused by metabolism of benthic coral reef organisms. Mar. Biol. 160, 2437–2447. doi: 10.1007/s00227-013-2239-z
Smith J. E., Shaw M., Edwards R. A., Obura D., Pantos O., Sala E., et al. (2006). Indirect effects of algae on coral: Algae-mediated, microbe-induced coral mortality. Ecol. Lett. 9, 835–845. doi: 10.1111/j.1461-0248.2006.00937.x
Stocking J. B., Laforsch C., Sigl R., Reidenbach M. A. (2018). The role of turbulent hydrodynamics and surface morphology on heat and mass transfer in corals. J. R. Soc. Interface 15, 20180448. doi: 10.1098/rsif.2018.0448
Van den Bergh M., Boix X., Roig G., de Capitani B., Van Gool L. (2012). “Seeds: Superpixels extracted via energy-driven sampling,” in Fitzgibbon A., Lazebnik S., Perona P., Sato Y., Schmid C. (eds) . Computer Vision – ECCV 2012. ECCV 2012. Lecture Notes in Computer Science (Springer, Berlin, Heidelberg) 13–26. doi: 10.1007/978-3-642-33786-4_2
Vaquer-Sunyer R., Duarte C. M. (2008). Thresholds of hypoxia for marine biodiversity. Proc. Natl. Acad. Sci. 105, 15452–15457. doi: 10.1073/pnas.0803833105
Viehman T. S., Hench J. L., Griffin S. P., Malhotra A., Egan K., Halpin P. N. (2018). Understanding differential patterns in coral reef recovery: Chronic hydrodynamic disturbance as a limiting mechanism for coral colonization. Mar. Ecol. Prog. Ser. 605, 135–150. doi: 10.3354/meps12714
Wangpraseurt D., Weber M., Røy H., Polerecky L., De Beer D., Nugues M. M. (2012). In situ oxygen dynamics in coral-algal interactions. PloS One 7, e31192. doi: 10.1371/journal.pone.0031192
Westoby M. J., Brasington J., Glasser N. F., Hambrey M. J., Reynolds J. M. (2012). ‘Structure-from-Motion’photogrammetry: A low-cost, effective tool for geoscience applications. Geomorphology 179, 300–314. doi: 10.1016/j.geomorph.2012.08.021
Wild C., Huettel M., Klueter A., Kremb S. G., Rasheed M. Y., Jørgensen B. B. (2004). Coral mucus functions as an energy carrier and particle trap in the reef ecosystem. Nature 428, 66–70. doi: 10.1038/nature02344
Wild C., Niggl W., Naumann M. S., Haas A. (2010). Organic matter release by Red Sea coral reef organisms – potential effects on microbial activity and in situ O2 availability. Mar Ecol Prog Ser 411, 61–71. doi: 10.1371/journal.pone.0027973
Wolf G., Picioreanu C., Van Loosdrecht M. C. M. (2007). Kinetic modelling of photototrophic biofilms – the PHOBIA model. Biotechnol Bioeng 97 (5), 1064–1079.
Yu X., Rosman J. H., Hench J. L. (2018). Interactions of waves with idealized high-relief bottom roughness. Coast. Eng. Proc. 1 (36), 57. doi: 10.9753/icce.v36.waves.57
Keywords: coral reef, hypoxia, microbial ecology, 3D imagery, hydrodynamics
Citation: Candy AS, Taylor Parkins SK, Van Duyl FC, Mueller B, Arts MGI, Barnes W, Carstensen M, Scholten YJH, El-Khaled YC, Wild C, Wegley Kelly L, Nelson CE, Sandin SA, Vermeij MJA, Rohwer FL, Picioreanu C, Stocchi P and Haas AF (2023) Small-scale oxygen distribution patterns in a coral reef. Front. Mar. Sci. 10:1135686. doi: 10.3389/fmars.2023.1135686
Received: 01 January 2023; Accepted: 01 March 2023;
Published: 11 April 2023.
Edited by:
Noelle Marie Lucey, Smithsonian Tropical Research Institute, PanamaReviewed by:
Melissa Garren, Monterey Bay, United StatesAmanda Shore, Farmingdale State College, United States
Copyright © 2023 Candy, Taylor Parkins, Van Duyl, Mueller, Arts, Barnes, Carstensen, Scholten, El-Khaled, Wild, Wegley Kelly, Nelson, Sandin, Vermeij, Rohwer, Picioreanu, Stocchi and Haas. This is an open-access article distributed under the terms of the Creative Commons Attribution License (CC BY). The use, distribution or reproduction in other forums is permitted, provided the original author(s) and the copyright owner(s) are credited and that the original publication in this journal is cited, in accordance with accepted academic practice. No use, distribution or reproduction is permitted which does not comply with these terms.
*Correspondence: Adam S. Candy, YWRhbS5jYW5keUBuaW96Lm5s; Shannara K. Taylor Parkins, c2h0YXBhQGJpb3N1c3RhaW4uZHR1LmRr; Andreas F. Haas, YW5kcmVhcy5mbG9yaWFuLmhhYXNAZ21haWwuY29t
†These authors have contributed equally to this work