 Yixue Zhang
 Ying Wu
 Jing Zhang
 Yi Xu
Yi Xu Ke Huang
 Jie Jin
 Jinlong Dai
 Qi Ye
Qi Ye Jian Li2
- 1State Key Laboratory of Estuarine and Coastal Research, East China Normal University, Shanghai, China
- 2State Key Laboratory of Tropical Oceanography, South China Sea Institute of Oceanology, Chinese Academy of Sciences, Guangzhou, China
Marine organic matter (OM) pools are the key to understanding biogeochemical cycles and carbon storage, especially under ongoing ocean warming. The tropical eastern Indian Ocean (IO) is ideal for unraveling marine OM pools for being one of the least understood ocean basins in terms of its complex physical and biogeochemical dynamics. So far, OM transformation and export remain underexplored and enigmatic in the IO. Here, we integrated in situ observations and incubation experiments in the Central IO (CIO) and Bay of Bengal (BoB). A large OM pool was found in the CIO, where we emphasized the prominent contribution of production in the deep euphotic layer, with physical forcing seasonally playing a supporting role. The dissolved organic matter (DOM)-degradation experiment results revealed high efficiency of in situ DOM consumption in the BoB, whereas dark carbon fixation by ammonia-oxidizing microorganisms was considered an alternative strategy in the euphotic CIO. Water mixing was found to highly influence the OM pools in the mesopelagic waters in the tropical eastern IO, but active microbial respiration could also regulate the OM degradation in the CIO. Our results emphasized the heterogeneity of OM pools between the BoB and CIO, and stated their different regulators of carbon reservoir considering an ocean warming scenario.
1 Introduction
The role of organic matter (OM) and its climatic response have been the focal points in oceanic carbon sequestration, especially in the context of global change (Lønborg et al., 2020; Wagner et al., 2020; Dittmar et al., 2021). The efficiency of biological carbon pump has been expected to decrease in lockstep with ocean warming (Riebesell et al., 2009). Future projections of long-term persistent dissolved organic matter (DOM) reservoir, serving as one of the largest carbon sinks in the ocean, however, remain an unsolved challenge because the mechanisms that govern DOM cycling are highly complex across large spatial-temporal scales with different climatic responses (Dittmar et al., 2021; Zakem et al., 2021).
DOM pool and their persistence are overall affected by a spectrum of biological and physical processes during their residence in the ocean (Hansell et al., 2012; Bauer et al., 2013; Lønborg et al., 2020; Dittmar et al., 2021). From the perspective of biological control, DOM in the epipelagic zones has been highly regulated by active phytoplankton and heterotrophic activities. Specifically, marine phytoplankton is responsible for most of the OM release in the open ocean, which is subsequently consumed by microheterotrophs (including bacteria and archaea) (Hansell et al., 2009; Carlson and Hansell, 2015; Dittmar et al., 2021). A fraction of DOM, however, escapes the microbial consumption and moves with ocean circulation for thousands of years (Hansell et al., 2009). Phytoplankton production was highly dependent on the nutrient availability, and some microheterotrophs also rely on nutrient uptake to degrade OM (Romera-Castillo et al., 2016; Deng et al., 2021). Chemoautotrophic microorganisms also play a crucial role in DOM production (Kaiser et al., 2017; Bayer et al., 2019a), but there are many unknowns about the chemical nature and biogeochemical significance of released compounds. The mesopelagic waters act as the main engine for DOM dynamics, where heterotrophic microbes continuously consume and modify DOM and are responsible for rendering DOM more recalcitrant progressively as a potential carbon sink (Osterholz et al., 2015; Dittmar et al., 2021; Zakem et al., 2021). These biological interactions subject to nutrient availability and community compositions will likely change in a warmer and more stratified ocean, and significant changes in DOM formation can be expected in the next century (Lønborg et al., 2020; Wagner et al., 2020). Although fewer studies have been done, ocean physics is paramount for the turnover of DOM. Convective mixing or isopycnal transport allows DOM to be routed into the ocean’s interior to escape rapid microbial degradation (Carlson and Hansell, 2015). The variabilities of thermohaline structure (i.e., mixed layer, thermocline depth) affect the vertical stratification and redistribute oxygen and biogenic elements (Talley et al., 2016; Thushara et al., 2019; Diaz et al., 2021). For instance, the strengthening upwelling will increase carbon accumulation and export, in parallel to new production increase (Romera-Castillo et al., 2016; Lønborg et al., 2020). On the contrary, as a consequence of enhanced stratification, carbon production will decline but it tends to release as dissolved form rather than particulate form (Santinelli et al., 2013; Lønborg et al., 2020). Some abiotic processes, like light-induced and heat-induced reactions, can also produce molecules resistant to microbial degradation (Hertkorn et al., 2006; Dittmar and Paeng, 2009). Knowledge is still scarce on how biological controls and ocean dynamics make joint contributions or act as counterparts in the DOM transformation in an biologically and physically active region.
The eastern tropical Indian Ocean (IO) experienced substantial spatial-temporal variabilities of physical-biological interactions under the seasonal reversal monsoons, making it a potential hotspot for studying oceanic carbon dynamics (Hood et al., 2015; Hermes et al., 2019; Beal et al., 2020). Compared to the tropical Pacific and Atlantic Ocean, the air‐sea CO2 differences in the tropical IO have further emphasized its role in carbon export and climatic regulation in the earth system (Landschützer et al., 2016). The distributions of nutrient supply, iron limitation, elemental stoichiometry in OM, primary production, and community compositions were found to vary meridionally in the eastern tropical IO (Baer et al., 2019; Garcia et al., 2018; Wei et al., 2019; Dalabehara and Sarma, 2021; Jayaram et al., 2021; Liu H. et al., 2021; Liu Y. et al., 2021). For instance, compared to the central or south Indian Ocean, the Bay of Bengal (BoB) was overall characterized as high total nitrogen, alleviated iron stress and high rates of new production (Kumar et al., 2004; Grand et al., 2015; Baer et al., 2019). Variable responses of DOM to different biological controls (i.e., primary production, chemoautotrophic production) are expected yet underexplored in the tropical IO. From the perspective of ocean dynamics, strong stratification is one of the most pronounced characteristics in the tropical IO (Sarma et al., 2016; Beal et al., 2020). Multiple physical forcing has been proved to strengthen or disturb the vertical stratification, resulting the fluctuations of different biogeochemical processes. For instance, the “barrier layer”, the layer between the bottoms of the mixed layer and of the isothermal layer, limits the phytoplankton growth; and wind-induced upwelling modulates the thermocline depth and associated subsurface blooms (Zhang H. et al., 2021; Hu et al., 2022). In addition, highly variable current systems in the equatorial IO (e.g., Equatorial Undercurrent (EUC)) redistribute vast amounts of heat, saltwater, nutrients, and oxygen (Schott et al., 2009; Huang et al., 2022), thus giving rise to significant ecosystem changes. These active environmental forcing are expected to be more dynamic and sensitive under global change, as the eastern tropical IO, also termed the Indian Ocean warm pool (IOWP), has been warming faster than any other ocean basins (Annamalai et al., 2013; Dong et al., 2014; Roxy et al., 2014). However, there is still a fundamental lack of knowledge on DOM distributions attributed to these physical-biological variabilities in the tropical IO.
We hypothesize that large variabilities of OM pools will occur in the eastern tropical IO, attributed to divergent physical-biological interactions. In this study, we combined in situ observations with incubation experiments in the Central IO (CIO) and Bay of Bengal (BoB) to describe the linkage between the OM change and environmental forcing. This work acts as a preliminary attempt to understand the OM transformation in the tropical IO and allows us to make future projections in response to ocean warming.
2 Materials and methods
2.1 Sample collection
The physical-biogeochemical observation was conducted during 29 March - 29 April 2018. Two transects at 10°N (from 84.5° to 88.25°E) in the southern BoB and 0°N (from 82° to 94°E) in the CIO were investigated in the 0-500 m layer (Figure 1). Hydrographic data, including temperature and salinity, were binned every 1 m depth and collected at 23 stations through a Sea-Bird 911 plus conductivity-temperature-depth profiler (CTD, Belleview, WA, United States). Surface water was collected using an acid-cleaned bucket at 12 stations. The associated vertical profiles of water samples were collected using an 8-L Niskin bottle (Hydro-Bio, Altenholz, Germany) mounted on the CTD. Samples for total organic carbon (TOC) analyses remained unfiltered, and samples for fluorescent dissolved organic matter (FDOM) and nutrients were filtered through 0.22-μm polyethersulfone filters immediately after sampling. The samples for organic matter analyses and nutrient analyses were collected into pre-combusted ampoules and acid–cleaned polyethylene containers, respectively. All samples were stored frozen at − 20°C immediately after filtration until laboratory analyses. Two samples for microbial analyses were solely collected at a depth of deep chlorophyll maximum (DCM) in the station CIO04 (0°N, 85°E) and IS (8°N, 85°E). Ten liters of seawater in each station was filtered through 0.22-µm Nuclepore polycarbonate membrane filters (Whatman, NJ, United States) and were immediately stored at − 40°C until DNA extraction.
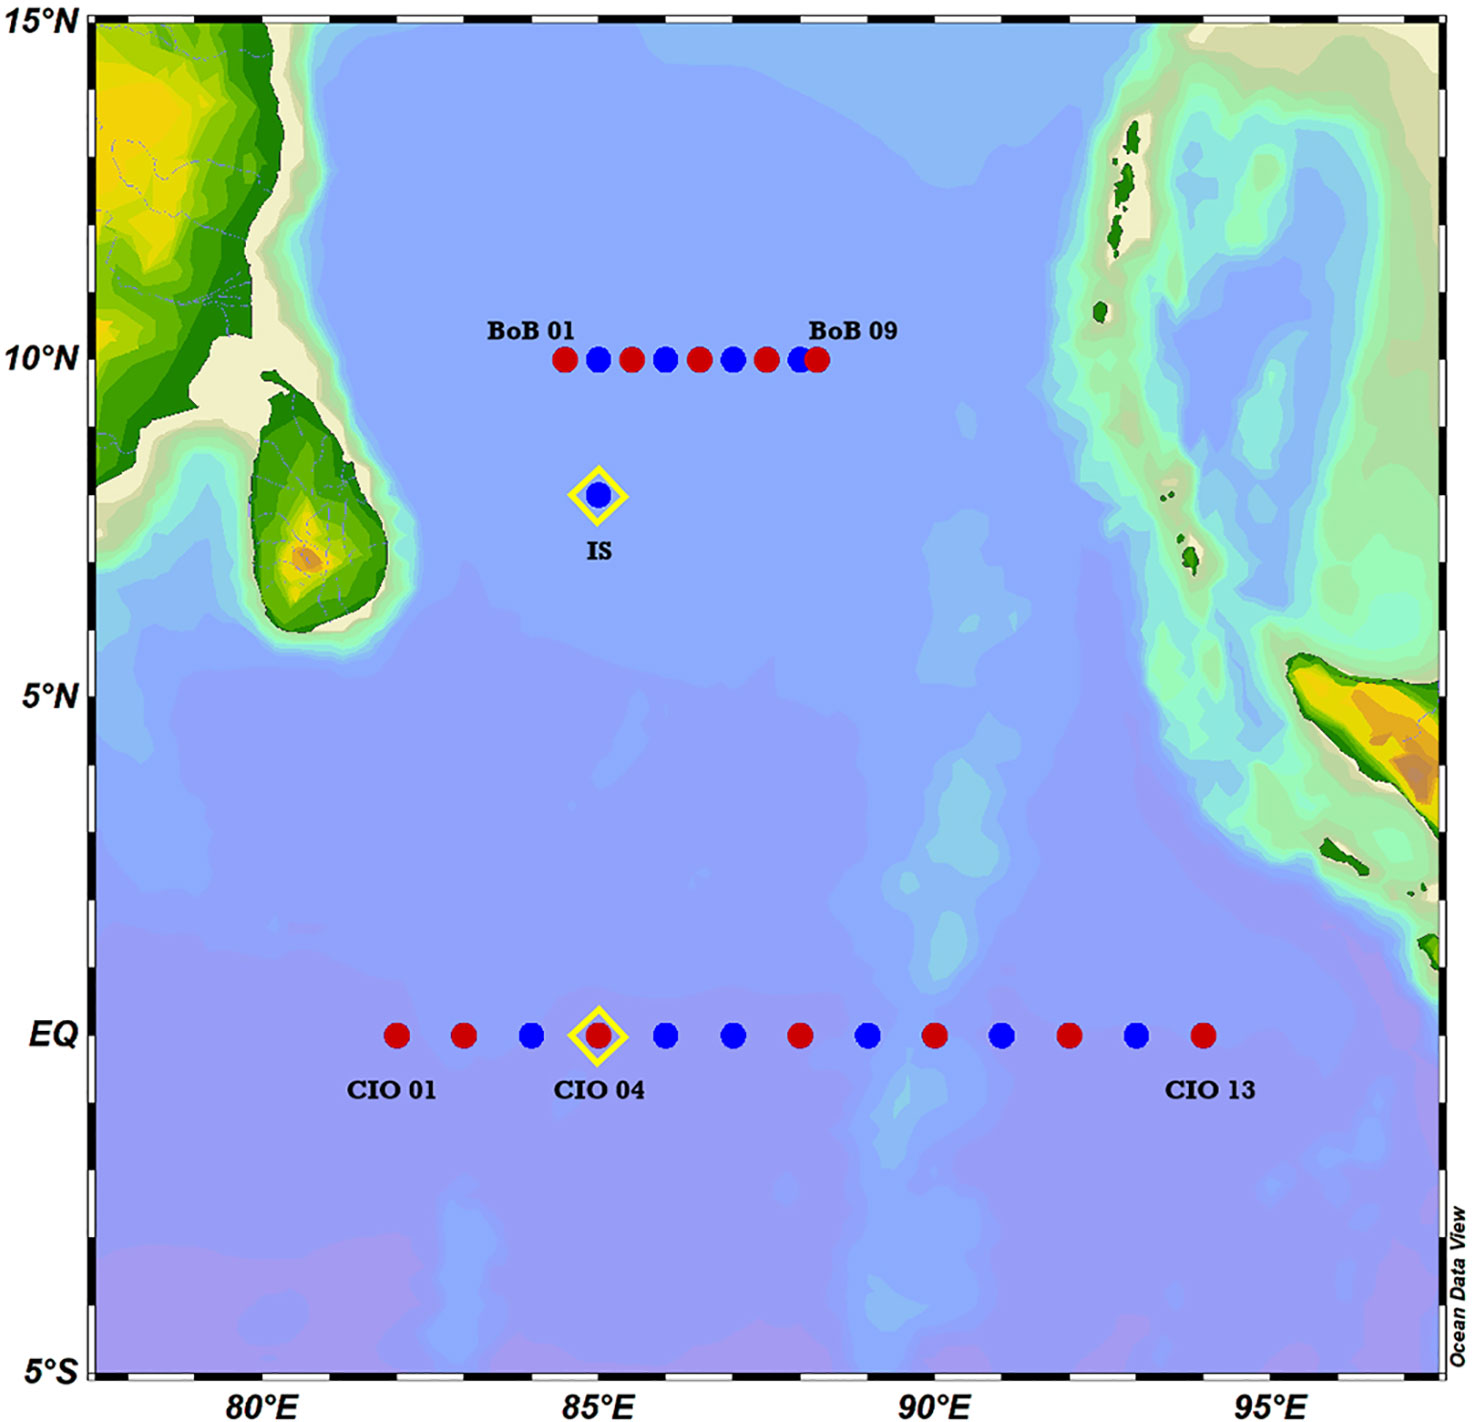
Figure 1 Sampling stations in the Bay of Bengal (BoB) and the Central Indian Ocean (CIO). (Blue dots indicate the stations of hydrographic data collection, red dots indicate the stations of both hydrographic data and water sample collection, yellow diamonds indicate the stations of incubation set-up).
2.2 DOM-degradation experiment set-up
The DOM-degradation experiments were carried out using field-collected seawater at a depth of DCM in the station CIO04 (70 m, hereafter, Exp-CIO) on 9 April 2018 and station IS (67 m, hereafter, Exp-BoB) on 26 April 2018, respectively (Figure 1). In each station, the DCM seawater was filtered with a 0.22 µm Nuclepore polycarbonate membrane filter (Whatman, NJ, United States) to remove microbial communities, and with a 1.2 µm GF/C membrane (Whatman, NJ, United States) to remove phytoplankton, respectively. The 1.2 µm filtrate thereby contained the DCM-dwelling microbial communities. Then, the 0.22 µm filtrate was mixed with 1.2 µm filtrate at a 3:1 v/v ratio. The dilution culture technique closely followed that Carlson et al. (2004) used, which allowed the bacterioplankton to be released from grazer pressure, stimulating bacterial growth and substrate utilization. In each station, one group was set up with three replicates (the volume of each replicate was 4 L), which were all placed in separate sterile bottles in a temperature-controlled laboratory at 20°C in dark. Over 60 days, the bottles were opened and shaken for a short time on a daily basis, in order to make oxygen flow and seawater well mixed. Samples for dissolved organic carbon (DOC) and FDOM analyses were collected at 7-time points to monitor the DOM changes, including the moment after mixing (Day 0), 24 h (Day 1), 72 h (Day 3), 144 h (Day 6), 240 h (Day 10), 720 h (Day 30) and 1440 h (Day 60). Samples for dissolved organic nitrogen (DON) and nutrient analyses were collected on Day 0 and Day 1. Samples for DOC, FDOM, DON and nutrients were filtered through 0.22-μm polyethersulfone filters. For the 7-time points, we managed 21 sterile bottles at each station. Samples with their replicates were collected from different bottles at each time point, which managed to keep the volume in each replicate unchanged during the experiment.
2.3 Sample analyses
TOC and total dissolved nitrogen (TDN) concentration were determined by high-temperature catalytic combustion using a Shimadzu TOC-LCPH total organic carbon analyzer (TOC-LCPH, Shimadzu, Japan). The high sensitivity configurations of Shimadzu TOC analyzers have detection limits of 0.33 μM C for TOC and 4.2 μM N for TDN. The sample acidification to pH = 2 prior to analysis is achieved by adding concentrated hydrochloric acid (Merck, Germany) as part of the automatic sample analysis in the TOC-LCPH. At this pH and with sparging, all inorganic carbon was removed from the samples. Standardization was achieved using potassium hydrogen phthalate for TOC and potassium nitrate for TDN. Each TOC and TDN sample were determined three to five times until standard variation< 2% and< 7%, respectively. Consistency of results was ensured by routinely measuring consensus reference material (deep-sea water) provided by Dr. Hansell, University of Miami.
Concentrations of dissolved inorganic nitrogen (DIN) (i.e., nitrate + nitrite) and dissolved inorganic phosphorus were analyzed on a continuous flow-through injection system (SKALAR Analytical B.V., The Netherlands). The detection of limits of nitrate, nitrite and phosphate is 0.1 μM, 0.03 μM and 0.03 μM, respectively. Precision of the analysis, represented by the coefficient of variation, was within 5.0%. DON concentration was obtained as the difference between TDN and DIN (DON = TDN − DIN). Measurements of concentrations were not performed since in the open ocean is typically< 0.1 μmol kg−1 (Lipschultz, 2001).
FDOM analyses were conducted on a fluorescence spectrometer (Hitachi F-4500) using 3D matrix scanning. Briefly, emission scans from 300 nm to 550 nm at 1 nm intervals were acquired at excitation wavelengths between 250 nm and 480 nm at 6 nm intervals. Blank subtraction and Raman area normalization were performed. We conducted parallel factor analysis (PARAFAC) in MATLAB coupled with excitation-emission matrix (EEM). The model was validated through a split-half analysis function (Stedmon and Bro, 2008) and matched with published spectra from OpenFluor (Murphy et al., 2014). Different fluorescent components were distinguished and corresponded to identified peaks in Coble classifications (e.g., peaks M, C, T) (Coble, 1996) (Table S1). Specific peak ratios serve as indicators of DOM source and lability. M: C values reflect the influence of biological production and photodegradation, with Peak M indicating marine-derived DOM (Coble, 1996; Helms et al., 2013; Hansen et al., 2016; Wang et al., 2017). T: C values describe the relative amount of fresh v.s. degraded DOM, with higher (lower) values indicating a higher proportion of labile (recalcitrant) materials (Baker et al., 2008; Hansen et al., 2016). The ratio of the sum of protein-like components to humic-like components (P: H) determines the dominant fraction of DOM fluorescence, as fluorescent components were generally classified into these two components (Kowalczuk et al., 2013).
Total DNA was extracted from two randomly selected replicate filters using a MoBio PowerSoil DNA Isolation Kit (MOBIO Laboratories, Carlsbad, CA, United States). Final concentrations and purity of DNA were measured spectrophotometrically with a NanoDrop ND2000 (Thermo Fisher Scientific, Wilmington, DE, United States). The V4-V5 hypervariable regions of the archaeal 16S rRNA genes were amplified using primers 524F10extF (5′-TGYCAGCCGCCGCGGTAA-3′) and Arch958RmodR (5′-YCCGGCGTTGAVTCCAATT-3′) (Pires et al., 2012), and the V4-V5 hypervariable regions of the bacterial 16S rRNA gene were amplified using primers primer 515F (5′-GTGCCAGCMGCCGCGG-3′) and 907R (5′-CCGTCAATTCMTTTRAGTTT-3′) (Xiong et al., 2012). Raw Illumina FASTQ files were demultiplexed, quality-filtered, and analyzed using Quantitative Insights into Microbial Ecology (QIIME) (version 1.17) (Caporaso et al., 2010). Operational taxonomic units (OTUs, 97% similarity cutoff) were clustered using UPARSE (version 7.1). Chimeric sequences were screened using UCHIME. The abundances of OTUs from each sample were determined by OTU clustering. Reads from each sample were assigned to each OTU, and an OTU table was generated using the “usearch_global” command. To obtain the taxonomic information for each species corresponding to an OTU, the Ribosomal Database Project (RDP) Classifier was used to analyze representative OTU sequences. The community composition of archaea and bacteria in each sample was calculated at the genus level and order level, respectively.
2.4 Companion observations and measurements
Dissolved oxygen (DO) was measured immediately after sample collection with a DO analyzer (Jenco, San Diego, California, United States, Model 9173). Apparent oxygen utilization (AOU) was calculated as the difference between oxygen saturation and the observed oxygen concentration (Garcia and Gordon, 1992). The mixed layer depth (MLD) was calculated as the depth corresponding to the density of surface density minus Δσ (Kara et al., 2000):
where Δσ represented the difference in density from the reference depth of the sea surface (10 m) to the bottom of the mixed layer and ΔT = 0.8°C was implemented. The T0, S0, and P0 were temperature, salinity, and pressure at the sea surface (10 m), respectively. The depth of the 20°C isotherm was widely used to represent the thermocline depth (Kessler, 1990). The DCM depth was determined based on the highest fluorescence signals derived from CTD. Satellite-derived Chlorophyll a (Chl a) images were derived from the Suomi National Polar-Orbiting Partnership (SNPP) Visible Infrared Imager Radiometer Suite (VIIRS) from NOAA STAR. The euphotic layer depth (Zeu) was obtained from MODIS/Aqua products by the Moderate-Resolution Imaging Spectroradiometer (MODIS) with a nominal 4 km resolution (https://oceancolor.gsfc.nasa.gov/data/aqua/), in which the Zeu was derived from an algorithm by Lee et al. (2007).
3 Results
3.1 Oceanographic settings
Sea Surface temperatures (SST) in the study region generally exceeded 28°C of the warm pool threshold, where the highest SST (T > 31°C) was observed in the BoB (Figures 2A, D). In the BoB, the thermocline depths (115-130 m) were deeper than the euphotic layer (111 ± 11 m), whereas the shallower thermocline depths (88-116 m) lay within the euphotic CIO (113 ± 6 m), especially with an uplift of the thermocline depths in the regions of 82°-87°E (hereafter, w-CIO) (Figures 2A, D). A clear distinction of salinity in the upper waters was observed (Figures 2B, E), with surface BoB covered by low-salinity waters (S < 33) and high-salinity waters (S > 35) mainly appearing in the 50-150 m layer in the w-CIO. Intensified stratification with shallow MLD (17 ± 5 m) was observed in the BoB, and the MLD was 60 ± 8 m in the CIO. According to the T/S diagram (Figure 3), we confirmed the presence of high-temperature Bay of Bengal water (BBW), Arabian Sea High Salinity Water (ASHSW), while relatively low-temperature North Indian Central water (NICW) and Indian Central water (ICW) were observed below the 25 kg m-3 isopycnal in the study region. The identification of different water masses referred to You (1997) using temperature and salinity as proxies. The ASHSW was mainly introduced into the CIO by the eastward EUC, as seen from Figure S1. Below the EUC, the CIO was characterized as a westward equatorial intermediate current (EIC) (Figure S1).
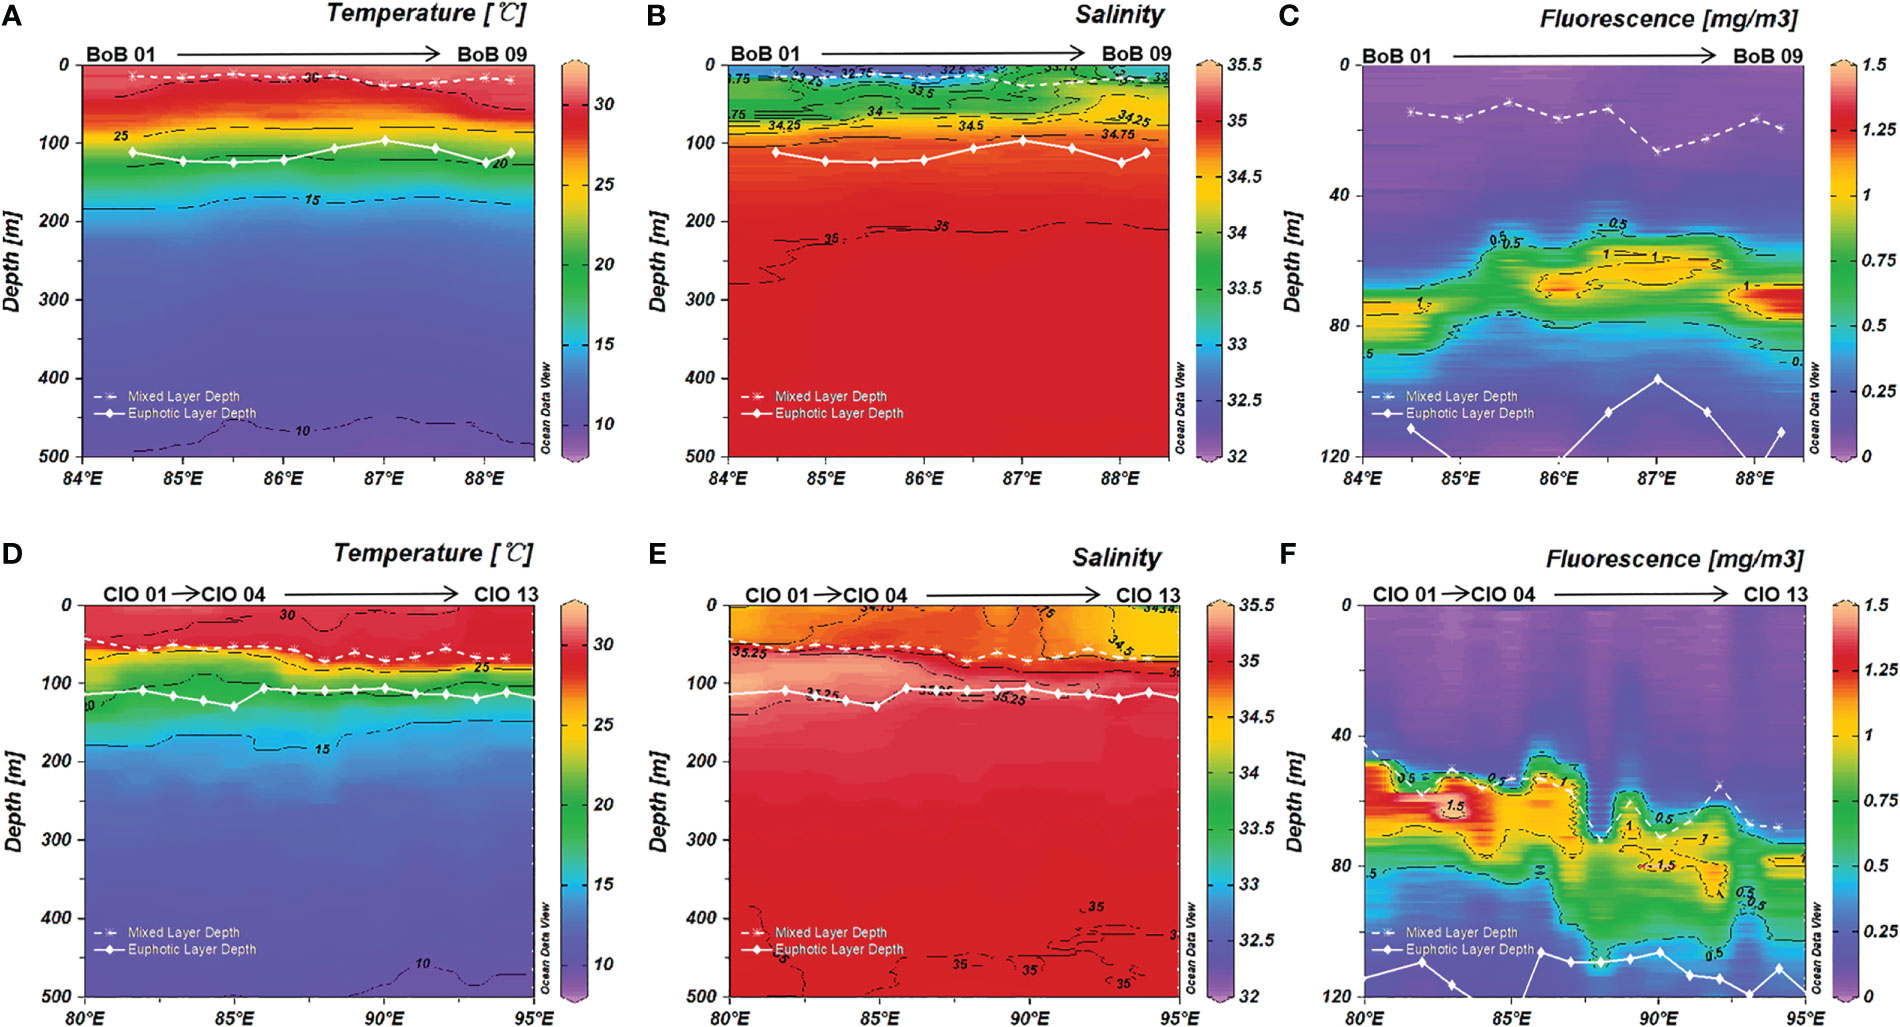
Figure 2 Vertical profiles of (A) temperature; (B) salinity; (C) fluorescence in the Bay of Bengal (BoB) and (D) temperature; (E) salinity; (F) fluorescence in the Central Indian Ocean (CIO). The white dotted line indicated the MLD depth; the white solid line indicate the euphotic layer depth.
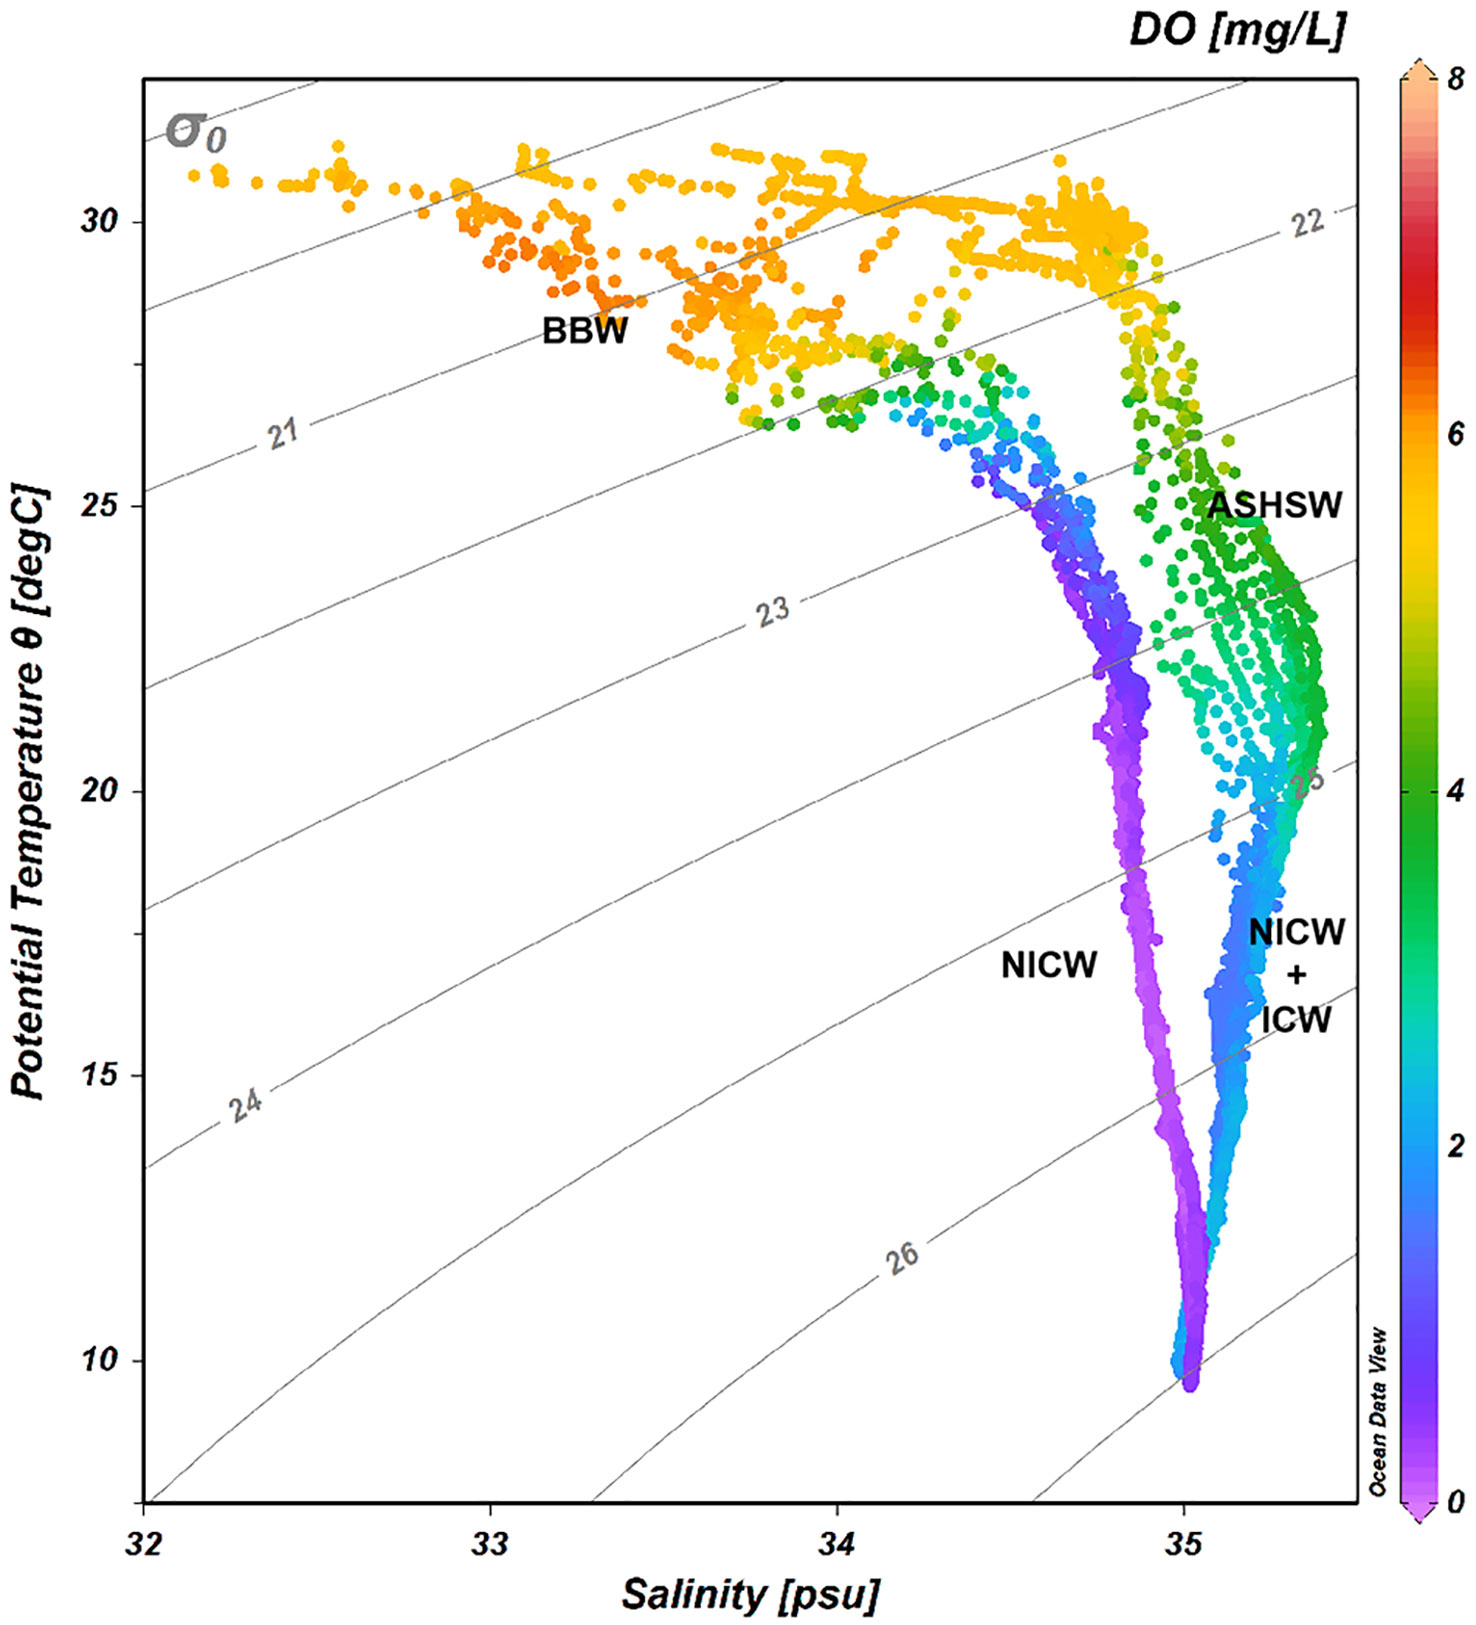
Figure 3 T-S diagram indicating the identified water masses in all stations. Isopycnals are shown as gray lines. The colorbar refers to the dissolved oxygen derived from CTD. Abbreviation in alphabetical order: ASHSW, Arabian Sea High Salinity Water; BBW, Bay of Bengal Water; ICW, Indian Central Water; NICW, North Indian Central Water.
The vertical profiles of DO and AOU are shown in Figure S2. The oxygen contrasted between the BoB and CIO, where hypoxic waters (0.13 mg L-1< O2 ≤ 1.95 mg L-1) below 100 m were found in the BoB, and oxic waters (O2 > 1.95 mg L-1) were found in the CIO, following Lachkar et al. (2016). AOU was comparably higher below 100 m in the BoB than the CIO. Nitrate and nitrite were basically not detected in the mixed layer in the BoB, and the upper thermocline waters were also characterized by nutrient deficiency (Figure 4A, B). In comparison, a small amount of nutrients was detected in the mixed layer in the w-CIO, where average nitrate and nitrite concentrations in the 0-50 m layer were 0.04 ± 0.01 μM and 0.03 ± 0.02 μM, respectively (Figures 4D, E). In the euphotic waters, the nutrients were much replenished in the w-CIO with a nitrite maximum observed (Figures 4D–F), where average DIN concentrations in the 50-100 m layer were significantly higher (8.69 ± 4.82 μM) than that in the rest of the CIO (3.62 ± 5.79 μM) (t-test, p< 0.01). High nutrients were generally enriched below the euphotic layer, especially in the BoB (Figure S3). The variation of DCM depths was relatively small (69 ± 6 m) in the BoB (Figure 2C). A shoaling of DCM (63 ± 6 m) occurred in the w-CIO with higher fluorescence signals, whereas deeper DCM depths were found in the rest stations of CIO (76 ± 5 m) (Figure 2F).
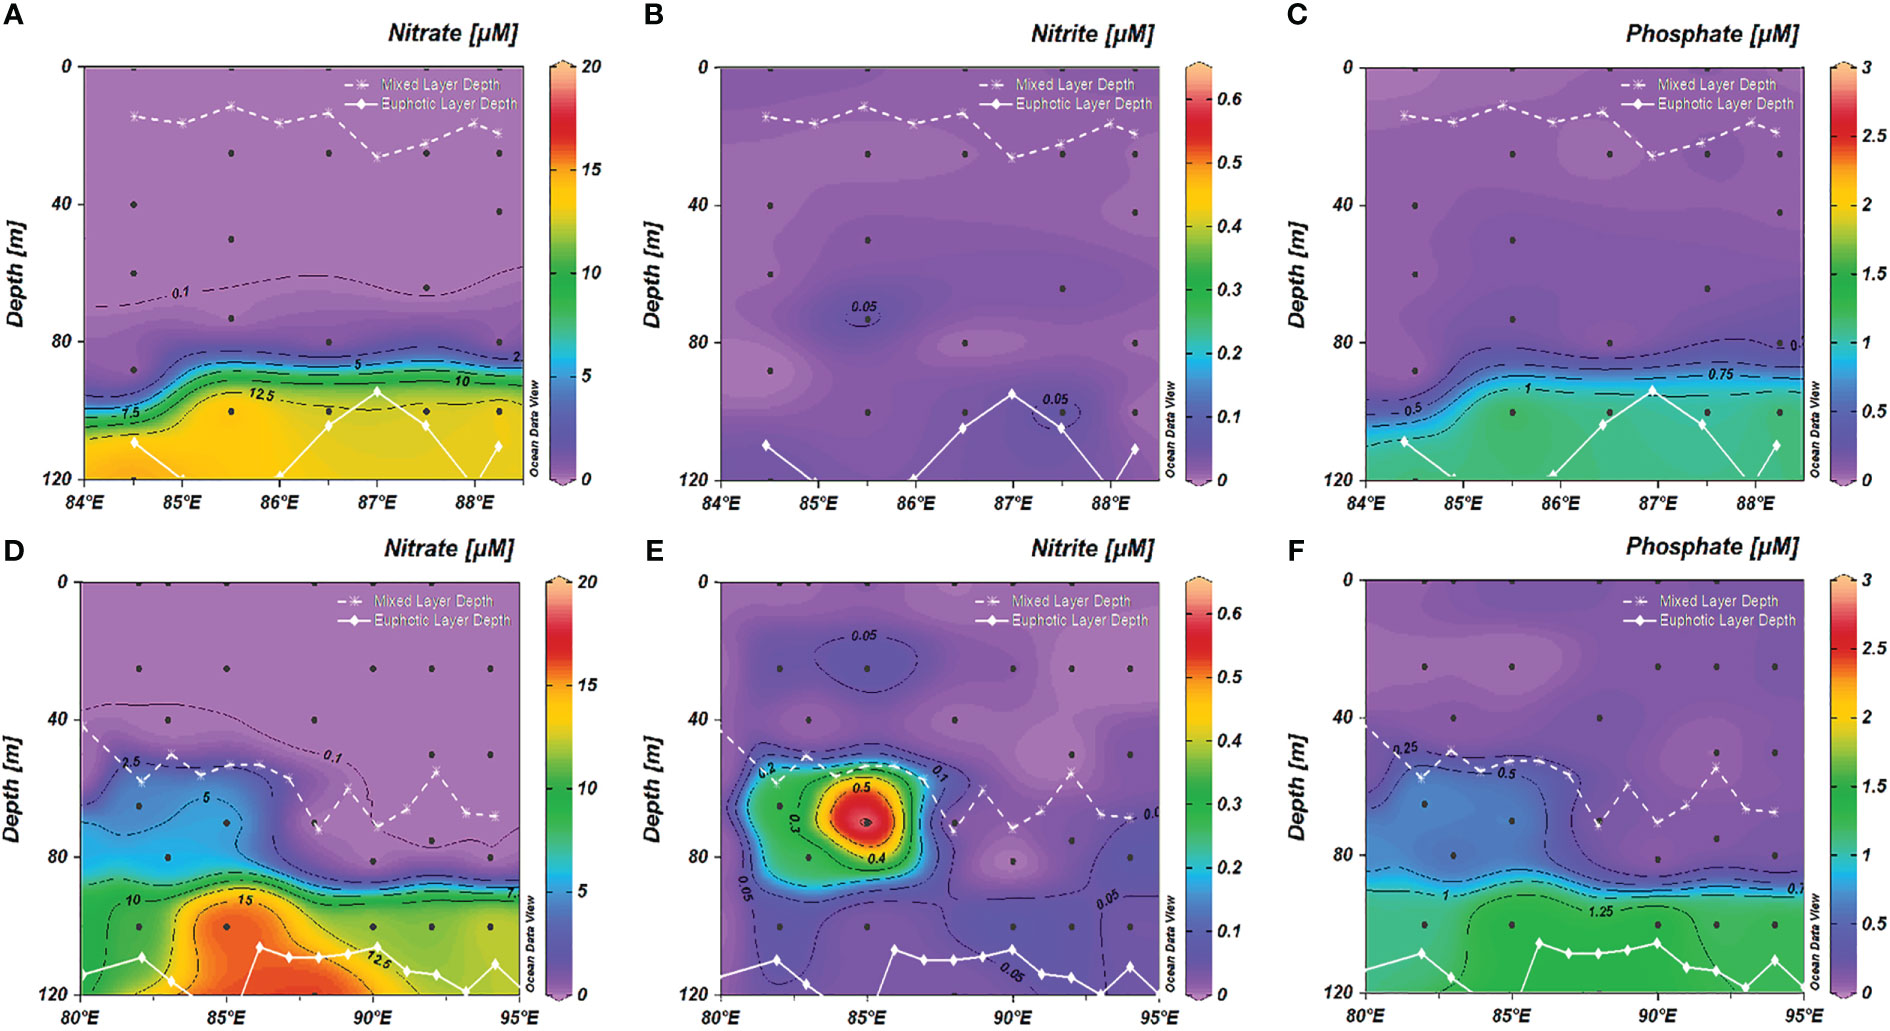
Figure 4 Vertical profiles of (A) nitrate (B) nitrite and (C) phosphate in the euphotic layer in the Bay of Bengal (BoB); Vertical profiles of (D) nitrate (E) nitrite and (F) phosphate in the euphotic layer in the Central Indian Ocean (CIO). The white dotted line indicated the MLD depth; the white solid line indicate the euphotic layer depth.
3.2 Fluorescent components
Six fluorescent components were distinguished using EEMs-PARAFAC (Table S1 and Figure S4), as described in Zhang Y et al. (2021). Briefly, C1, C2, C4, and C6 were identified as humic-like components, among which the ratio of C2 (corresponding to peak M) and C1 (corresponding to peak C) referred to the M: C values (Coble, 1996; Kowalczuk et al., 2009; Osburn et al., 2011). C3 and C5 were protein-like components, close to the tryptophan-like peak T and the tyrosine-like peak B, respectively (Stedmon and Markager, 2005; Yamashita et al., 2013). The ratio of C3 and C1 thus referred to the T: C values.
3.3 Vertical profiles of DOM properties
TOC was mainly distributed in the euphotic layer, with a larger pool observed in the w-CIO (Figures 5A, E). As POC concentrations in the mixed layer (20 m) was relatively low in the CIO (2.3 ± 0.2 µM) and BoB (1.7 ± 0.6 µM) in spring (Garcia et al., 2018), significant fraction of TOC was composed as DOC in our study region, with DOC/TOC ratio exceeded 0.96 in the mixed layer. In the 0-50 m layer, TOC concentrations were comparable in the w-CIO and BoB (averaged 72 ± 3 µM and 71 ± 7 µM, respectively), while in the 50-100 m layer, the TOC concentrations were significantly higher in the w-CIO (averaged 64 ± 1 µM) compared to the BoB (58 ± 3 µM) (t-test, p< 0.01). Large vertical gradients of TOC concentrations were evident in the euphotic BoB, resulting in lower and constant concentrations (46 ± 4 µM) in the 100-500 m layer. In comparison, we found less drastic declines within the euphotic waters in the w-CIO, resulting in significantly higher TOC concentrations (52 ± 5 µM) in the 100-500 m layer (t-test, p< 0.01). As to in deep ocean (1000 m) in the eastern tropical IO, TOC concentrations fell within a narrow range of 38-42 μM and 38-44 μM in the BOB and w-CIO, respectively (data not shown).
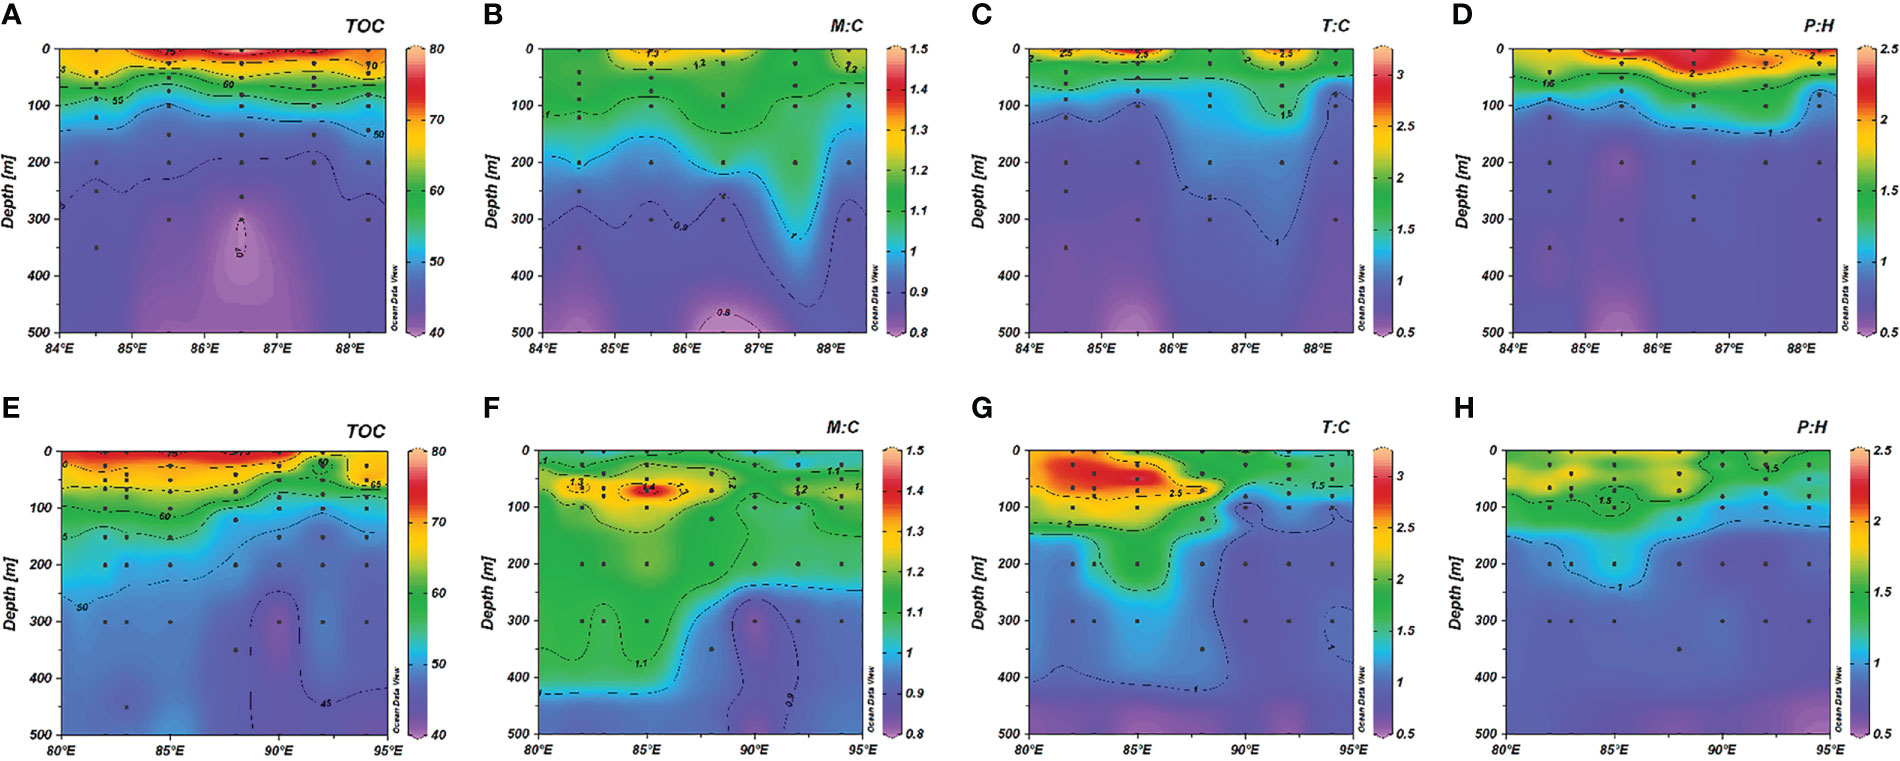
Figure 5 Vertical profiles of (A) TOC; (B) M: C; (C) T: C; (D) P: H in the Bay of Bengal (BoB) and (E) TOC; (F) M: C; (G) T: C; (H) P: H in the Central Indian Ocean (CIO).
A clear distinction of fluorescent characteristics was observed in the eastern tropical IO (Figure 5 and Figure S5). The fluorescent intensities of humic-like peak C and peak M generally increased with depth, on the contrary, protein-like peak T and peak B exhibited decreasing trends (Figure S5). The intensities of peak T were higher in the euphotic w-CIO than that in the BoB, with a maximum in the 50-100 m layer, but peak B intensities were comparably higher in the euphotic BoB. As for the ratios of fluorescent intensities as a proxy of DOM nature, M: C and T: C values were found significantly higher in the euphotic w-CIO, and these fluorescent indicators also remained at relatively high levels in the mesopelagic waters (Figures 5F, G). It was important to note that the vertical distributions of M: C and T: C values were uncoupled from those of TOC in the w-CIO. Other than the gradual decrease of organic carbon concentrations with depth, a M: C maximum occurred around the depth of DCM, and the peak values of T: C and P: H were also presented (Figures 5F–H). We summarized the correlations among different variables in the Table S2. In the 0-100 m layer in the w-CIO, the peak C intensities negatively correlated with TOC (r = − 0.59, p< 0.05), whereas the peak M and peak T intensities were positively correlated with CTD-fluorescence signals (r = 0.70, p< 0.01; r = 0.56, p< 0.05). In the BoB, however, the fluorescent indicators largely followed the TOC patterns, in which M: C, T: C, and P: H were all found highest in the mixed layer and decreased downwards to constantly low values in mesopelagic waters (Figures 5B–D). Notably, despite T:C values in the w-CIO was generally higher than that in the BoB, P:H values was relatively higher in the BoB, attributing to the high intensities of peak B. In the 0-100 m layer, TOC concentrations negatively correlated with peak C (r = − 0.55, p< 0.01) and peak M intensities (r = − 0.46, p< 0.05), and positively correlated with peak T and peak B intensities (r = 0.58, p< 0.05; r = 0.80, p< 0.01).
In the 100-500 m layer (hereafter, the mesopelagic waters), TOC exhibited significant negative correlations with AOU and positive correlations with temperature in the w-CIO, as was the case in the BoB. The multiple correlation between TOC, temperature and AOU was considered (Table 1). The slope molar ratio of TOC/AOU was significantly changed with and without temperature considered in the BoB (t-test, p< 0.01). However, despite the change was also observed in the w-CIO, it was not statistically significant (t-test). Besides, the correlations among variables were different between the two regions (Table S2). In the w-CIO, the peak T and peak B intensities were negatively correlated with AOU (r = − 0.93, p< 0.01; r = − 0.66, p< 0.05), and the peak C intensities were positively correlated with AOU (r = 0.62, p< 0.05). The peak T intensities also negatively correlated with nitrate and phosphate concentrations (r = − 0.91, p< 0.01; r = − 0.88, p< 0.01), respectively. In the BoB, however, none of the fluorescent components were significantly correlated with AOU, but the peak C intensities were negatively correlated with temperature (r = − 0.55, p< 0.05).
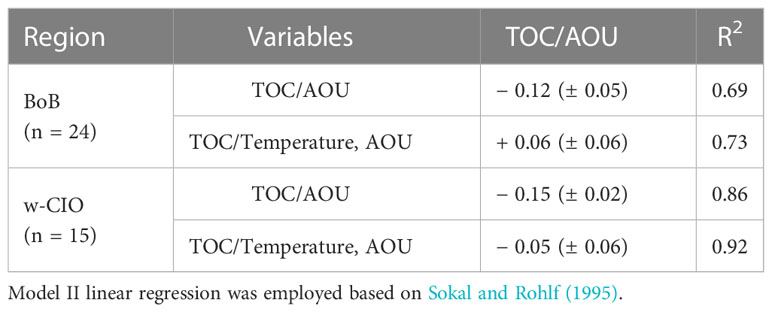
Table 1 Slope molar ratio of the linear regression between TOC and AOU, and the multiple regression between TOC, temperature and AOU in the mesopelagic waters (100-500 m layer).
3.4 DOM-degradation experiment results
The DOM-degradation experiment results for Exp-CIO and Exp-BoB are shown in Figure 6 and Figure S6. The thermohaline properties (T, S) and biological proxies (surface Chl a, CTD fluorescent signals) in the two stations are similar to the CIO 01-04 and BoB 01-09, respectively, making the two stations good representatives of local environment. Comparable DOC concentrations at Day 0 were observed in two experiments (65 ± 2 µM in Exp-CIO and 64 ± 2 µM in Exp-BoB) (Figure 6A), which were consistent with concentrations in the DCM water at CIO04 (in situ 64 µM) and IS (in situ 63 µM). The absence of contamination during the experimental setup was thereby confirmed. By the end of the incubation, more DOC was left in the Exp-CIO compared to the Exp-BoB (Figure 6A). A 15% loss of DOC over the 60-day course in the Exp-BoB was observed, which was about 1.6-fold higher than that in the Exp-CIO. The gradual increase of peak C during the incubation was observed in both Exp-BoB and Exp-CIO, and the sharp decrease of protein-like peak B occurred in the Exp-BoB, accompanied by the slight decreasing trend of protein-like peak T (Figure S6A). These changes together with the overall decline of T: C and P: H values suggested that while DOC was being consumed, there were growing contributions from recalcitrant and humic-like materials (Figures 6B, C, S6). Other than the continual consumption of DOC in the Exp-BoB, DOM was freshly produced on Day 1 in the Exp-CIO, primarily composed of relatively labile and protein-like materials, indicated by the significant increase of peak T intensity (t-test, p< 0.05) (Figure S6C). The newly-produced DOM was consumed at a high rate according to the sharp decline of DOC and peak T intensity from Day 1 to Day 3, and the subsequent consumption rates remained relatively low, resulting in the final 9% reduction of DOC over the 60-day course (Figure 6A, S6C). The DOM transformation processes thus highly contrasted between the Exp-CIO and Exp-BoB, especially in the early stages. On Day 1, along with the rapid decline of DOC, the fluorescent intensity of peak T significantly declined (t-test, p<0.05) in the Exp-BoB (Figure S6). Both DON and nitrate concentrations also significantly decreased in the Exp-BoB (t-test, p< 0.01) (Figures 6D, E). However, there was no measured nitrate decline in the Exp-CIO, while a significant increase was displayed in DON concentrations (t-test, p< 0.05) (Figures 6D, E). Also, the nitrite concentrations significantly increased on Day 1 in the Exp-CIO (t-test, p< 0.01) (Figure 6F).
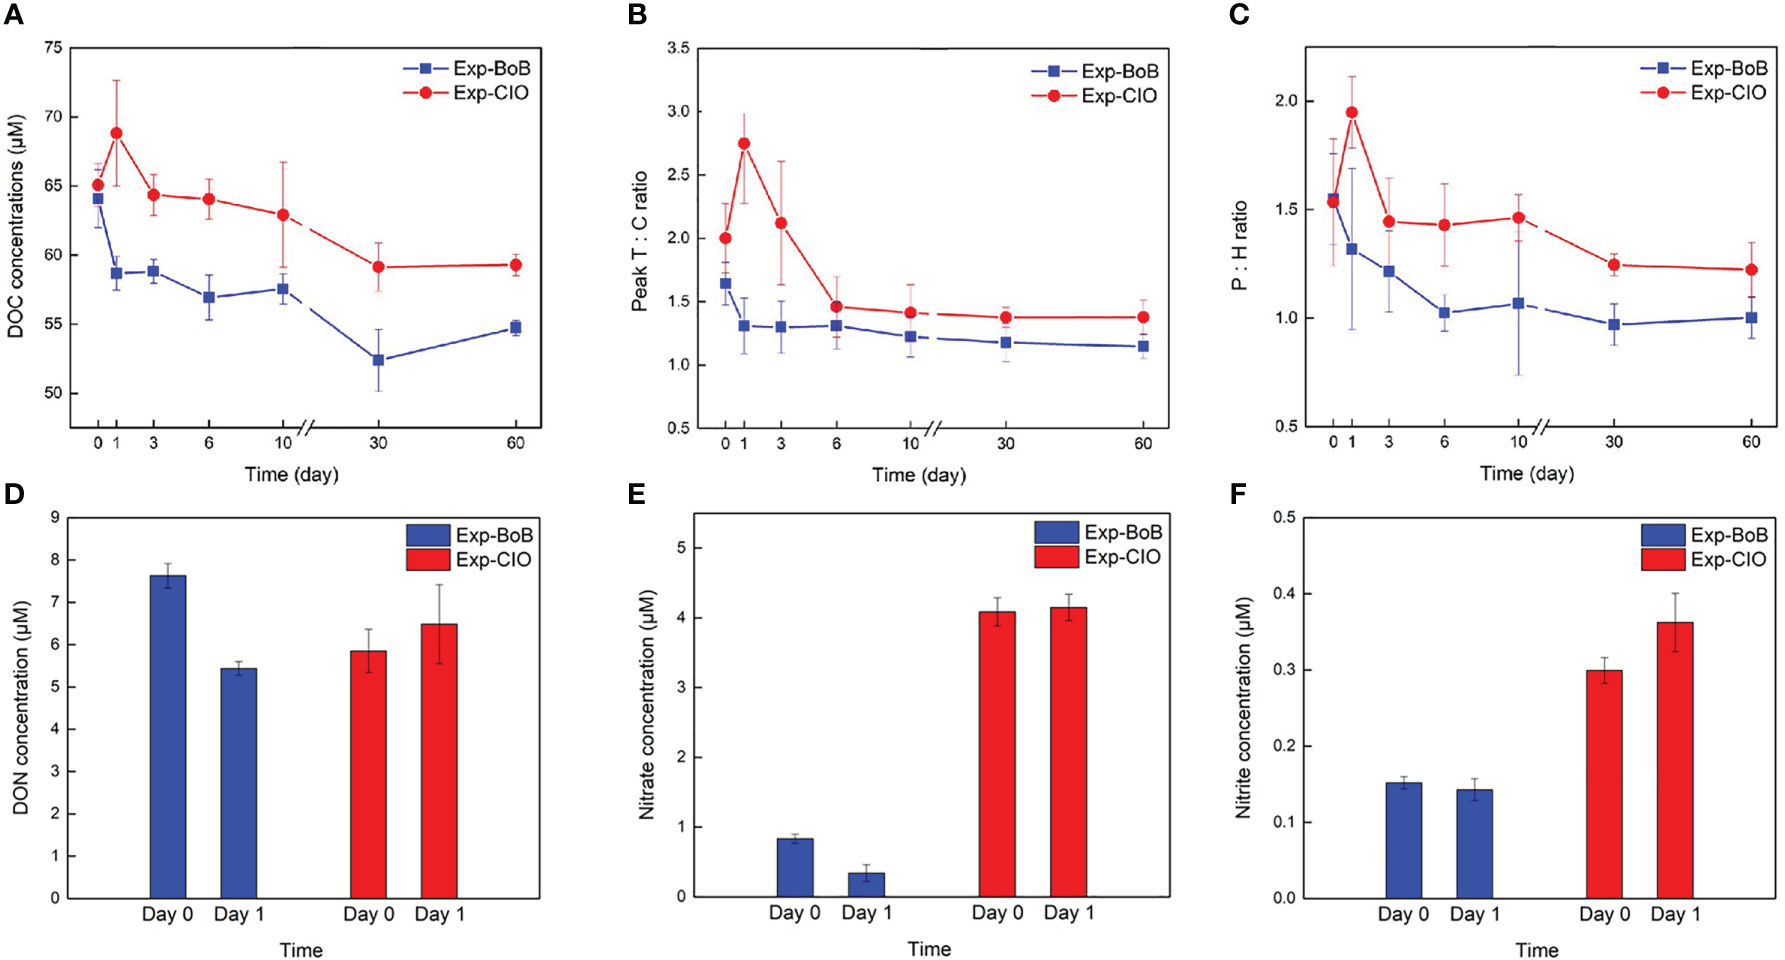
Figure 6 The incubation results of (A) DOC; (B) T: C; (C) P: H change in a course of 60 days, and the (D) DON; (E) nitrate; (F) nitrite change between Day 0 and Day 1. The error bars indicated the replicates for incubation bottles, as we set one group with three replicates in each station.
3.5 Composition of total (DNA) bacterial and archaeal communities
From the perspective of archaeal communities, Euryarchaeota and Thaumarchaeota were considered the main archaeal phyla in the tropical IO (Figure S7A). The major families within Euryarchaeota were Marine Group II (MGII) and Marine Group III (MGIII), and Nitrosopumilaceae was the most abundant family within Thaumarchaeota. Figure 7A revealed the great variations in the percentage compositions between the w-CIO and BoB at the genus level. Members of ammonia-oxidizing archaea (AOA), dominated by the uncultured Nitrosopumilaceae members, was the most abundant genus (87.2%) in the w-CIO, followed by uncultured MGII and MGIII members (11.3% and 1.1%, respectively). However, uncultured MGII members were the dominant genus in the BoB (72.5%), and uncultured MGIII members made up 25.0% of the archaeal sequences. The diversity and richness estimators were shown in Table S3. The archaeal richness was higher in the w-CIO, and the diversity indices were comparable in the w-CIO and BoB.
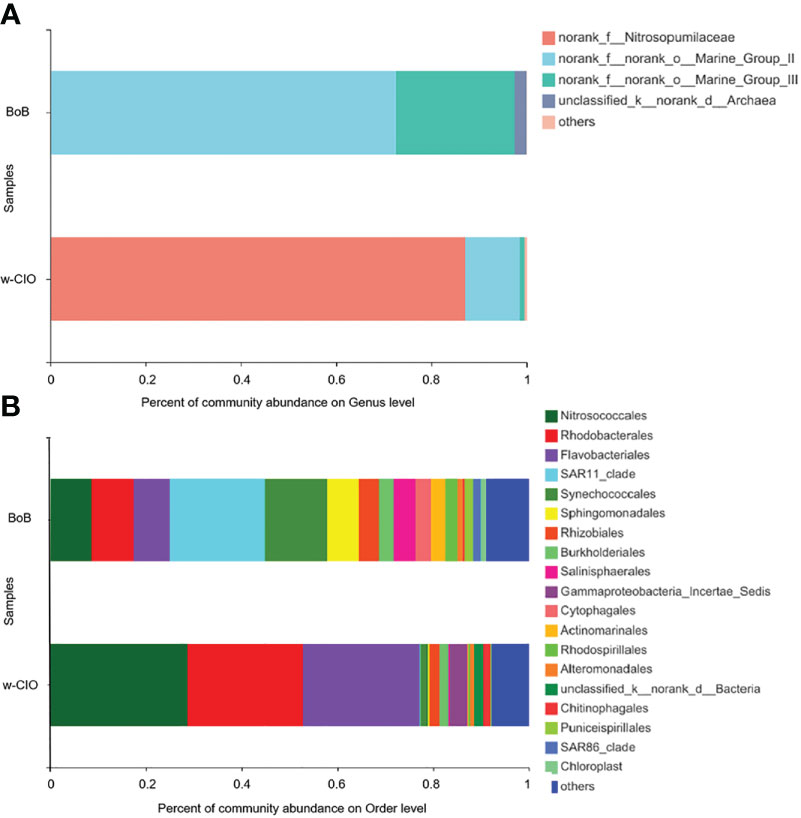
Figure 7 The percentage compositions between the Bay of Bengal (BoB) and the w-CIO of (A) archaeal sequences at the genus level and of (B) bacterial sequences at the order level.
For total bacterial communities, Proteobacteria and Bacteroidota jointly reach 78.7-91.4% in the tropical IO at the phylum level (Figure S7B). Figure 7B revealed the bacterial percentage compositions in the w-CIO and BoB at the order level. The w-CIO was populated mainly by the ammonia-oxidizing bacteria (AOB) members, Nitrosococcales (28.6%). Rhodobacterales (24.1%) and Flavobacteriales (24.3%) also constituted the bacterial sequences. The BoB was overall characterized by a large diversity of bacterial communities, including SAR 11 (19.9%), Synechococcales (13.0%), Nitrosococcales (8.6%), Rhodobacterales (8.7%), Flavobacteriales (7.6%). As it was shown in Table S3, the bacterial richness and diversity was both higher in the BoB.
4 Discussion
4.1 Euphotic OM distributions in two different stratified systems
It was beyond the expected that abundant organic matter was observed in the euphotic w-CIO rather than the BoB, as the BoB has long been considered a more productive area with substantial allochthonous inputs and eddy activities (Kumar et al., 2007; Sarma et al., 2019). Similar concentrations were found in the previous investigation of the CIO (Hansell, 2009), which was also comparable to the concentrations in the productive Central Atlantic and higher than in the Central Pacific (Hansell et al., 2009; Roshan and DeVries, 2017).
In the w-CIO, fresh biologically-derived DOM in the mixed layer proved the fact that DOM was largely produced by phytoplankton. Ocean mixing and the related redistribution of nutrients would directly affect phytoplankton biomass and production (Talley et al., 2016; Thushara et al., 2019; Diaz et al., 2021; Hu et al., 2022) and thus play a predominant role in the DOM pool. The seasonal uplifting of MLD was confirmed in the w-CIO based on the monthly climatology of MLD in Hu et al. (2022), likely subject to the weakened monsoon and surface heating in spring. Stimulated production was a possible consequence of the shoaling of the mixed layer, as it was concurrent with a rise in the depth-averaged light intensity, known as “detrainment events” (McCreary et al., 1996). These events were considered highly productive and were found to develop throughout the Arabian Sea in spring (McCreary et al., 1996; Sunny et al., 2022). The satellite-derived Chl a distribution further confirmed the enhanced production in the w-CIO during the sampling period, with surface Chl a concentrations significantly increased in April (t-test, p< 0.01) (Figure S8). The unexhausted nitrate in the mixed layer implied the continuing influence of the detrainment event because new nutrients could hardly be introduced into the mixed layer in these stratified CIO waters (Hu et al., 2022). Therefore, such a large DOM pool associated with the seasonal mixed-layer dynamics might be a periodic observation, and its duration, in part, depended on the timescales of nutrient exhaustion.
More attention should be paid that the large OM stock in the w-CIO was highly ascribed to the size of the DOM pool in the deep euphotic waters. As high M: C and T:C values both indicated the contributions from fresh biologically-derived DOM, and peak T represented the labile proteins or peptides (Fellman et al., 2010; Hansen et al., 2016), the maxima of these values implied that in situ production was highly stimulated to fuel DOM release in the deep euphotic w-CIO (Figures 5F, G, S5G). Hu et al. (2022) has found that even when phytoplankton growth in the near-surface or mixed layer was limited, strong phytoplankton blooms could occur in the subsurface layers under specific physical forcing. The intensity of production below the mixed layer largely depended on the seasonal dynamics of thermocline depth, in which an upward movement of thermocline allowed for high production by replenishing nutrients (Xu et al., 2021; Hu et al., 2022). A mild uplift of thermocline depth was observed in the w-CIO, accompanied by the shoaling of nutrient isopleths in the deep euphotic waters (Figures 2D, 4D). Strong chlorophyll maximum formed where biologically derived DOM was also maximally present, implying that the new nutrients were effectively replenished and boosted the DOM release. The stimulated production below the mixed layer due to the thermocline uplift has been documented in the vicinity of the w-CIO in spring (Dalabehara and Sarma, 2021; Hu et al., 2022) and was attributed to the seasonal Ekman pumping (Hu et al., 2022). The w-CIO in this work, although closer to the equatorial regions, shared similar longitudes with the investigated area in Hu et al. (2022). We assumed that the thermocline heave in the w-CIO was likely triggered by the collateral effect or the rippling from the thermocline dynamics in the neighboring regions. It should be noted that the weak thermocline uplift and enhanced production could already be the result of being masked by EUC intrusion. During sampling, the deep euphotic w-CIO was highly affected by the ASHSW introduced by EUC (Figures 3, S1). The ASHSW is characterized as high-temperature, oxygen-depleted and low-nitrate waters (Sardessai et al., 2010). The mixing of ASHSW or EUC was found to reduce the nitrate levels in the vicinity of the equatorial region by depressing the nitrate isolines (Sardessai et al., 2010). One could imagine that the balance between the the nutrient depression induced by EUC and nutrient replenishment by thermocline heave jointly contributed to the local production and OM release in the w-CIO. We thus emphasized the crucial role of seasonal thermocline heave in regulating the DOM pool in the w-CIO. Platforms for long-time serial observations, such as Bio-Argo floats, could be further deployed to generate sufficient data of temperature, nutrients and chlorophyll a, in order to detect the frequency and intensity of such small-scale process and its related biogeochemistry. It could also act as robust constraints in model simulations to better predict DOM dynamics.
In the BoB, DOM of biological origin was actively released in the mixed layer, indicated by the high T:C and P:H values (Figures 5C, D). The mixed-layer production was found to substantially contribute to the euphotic primary production in the BoB, primarily governed by mixed-layer nutrient availability (Dalabehara and Sarma, 2021). Attributing to the highly intense stratification, a state of nutrient depletion was emphasized in the mixed layer in the BoB, which potentially limited the DOM production as well as heterotrophic consumption. However, the high protein-like components in the mixed layer were mostly comprised of peak B, which was different from the case in the w-CIO (Figures S5D, H). Compared to peak T, biologically recalcitrant nature was more evident in the peak B, and the domination of peak B over peak T could indicate relatively high microbial degradation (Yamashita et al., 2017). This active heterotrophic consumption could be attributed to the bacterial abundance, as bacterial abundance in the mixed layer in the BoB was higher than other depth zones as well as in the CIO (Ramaiah et al., 2009). It should be noted that BBW covered the mixed layer in the BoB (Figures 3). The BBW was found to be a perennial presence of low-salinity water mass in the BoB, resulting from the excess of precipitation over evaporation and other low-salinity water intrusion (Sengupta et al., 2006). In spring, the spreading of freshwater plumes is generally limited to north of 15°N (Jana et al., 2015), assuming to make a minor terrestrial impact to our study area. Compared to the w-CIO, there was also a less pronounced contribution to the DOM pool from deep euphotic production in the BoB. These results, together with the large vertical gradient of TOC in the euphotic layer, jointly revealed that the DOM experienced efficient degradation in the euphotic BoB. Therefore, it raised the question of whether heterotrophic processes differently prevailed in the euphotic waters in the w-CIO and BoB, which might play a crucial role in elucidating the fate of the OM pool.
4.2 Different DOM degradation efficiency in the euphotic waters in the eastern IO
The experiments were carried out to monitor different microbial controls on the DOM pool, which minimized the influences of phytoplankton production and physical processes. As expected from in situ observations, the incubation results primarily revealed the heterotrophy in the BoB, where almost 15% of DOC was exhausted from days to months (Figure 6A). Diverse heterotrophic archaea and bacteria populated the BoB (Figure 7), where MGII and MGIII members were known to efficiently degrade high-molecular-weight (HMW) DOM such as proteins, carbohydrates, and lipids (Li et al., 2015; Haro-Moreno et al., 2017), and the abundant SAR 11 were superior competitors for the low-molecular-weight (LMW) DOM in oligotrophic environments (Giovannoni, 2017). The high diversity of bacterial communities also supported the heterotrophy (Table S3), as it was more likely to harbor the right enzymes to degrade diverse DOM (Dittmar et al., 2021). The sharp decrease of peak B intensity suggested that such protein-like DOM was prioritized for uptake of these heterotrophic microorganisms (Figure S6). A nitrate drawdown implied that heterotrophic microbes assimilated nutrients during DOM consumption (Figure 6E), thus potentially competing with phytoplankton production and aggravating the oligotrophy in the BoB. Heterotrophic microbes were found to make a higher contribution to nitrate uptake relative to DIN regeneration in oligotrophic oceans, which often resulted in an overestimation of new production, especially when there was an episodic nitrate import (e.g., upwelling in the BoB) (Deng et al., 2021). Therefore, our results suggested a prominent role of heterotrophic microbes in the euphotic waters, which might challenge the previous estimates of total production in the BoB, and intensely mitigate the carbon export.
Other than the continual DOC consumption, in the Exp-CIO, DOM release was evident on Day 1 after being isolated from the light (Figure 6A). The newly produced DOM, dominated by protein-like components, was basically characterized as bioavailable nature. Substantial chemoautotrophic communities, including members of AOA and AOB, were found to inhibit the w-CIO (Figure 7). Studies have proven that AOA, which performs ammonium oxidation to nitrite, tends to predominate over AOB and is among the most important roles to DOM production through chemoautotrophy (Martens-Habbena et al., 2009). The increase of nitrite in the Exp-CIO confirmed that these species actively contributed to the mesocosm in the early stage. A suite of labile DOM, dominated by nitrogen-containing compounds, could be exuded by AOA into the ambient water (Bayer et al., 2019a). Our results supported this argument based on the increased labile, protein-like FDOM and DON in the Exp-CIO (Figures 6B-D and Figure S6C). It should be noted that only peak T intensities significant increased (Figures S6C), which implied that the AOA-released DOM were mostly composed of intact proteins or less degraded peptides (Fellman et al., 2010). Therefore, the sizeable OM pool with high intensities of peak T from in situ observations might also partially benefit from the chemoautotrophic release in the w-CIO. According to Zakem et al. (2022), the chemoautotrophic carbon fixation could form a carbon pool of 0.2-0.5 Pg C yr-1. As AOA and AOB were both important marine nitrifiers which were tightly coupled with nitrite and nitrate production, the oceanic new production could also be stimulated by the chemoautotrophic activities of these species (Yool et al., 2007). We argued that chemoautotrophic contribution should be further included in total production estimates in the CIO, which might break the long-standing impression of CIO being a low-productive area. Also, the DOC increasing on Day 1 in the Exp-CIO seemed to be comparatively higher than the results of pure culture from Bayer et al. (2023). As multiple interactions of AOA with heterotrophic bacteria have been progressively revealed (Bayer et al., 2019a; Bayer et al., 2019b; Bayer et al., 2023), it raised concern that whether the metabolic interactions between ammonia-oxidizing members and diverse species in natural waters could potentially cause a difference in the carbon production. The cell death (including picophytoplankton after cutting off light) might also additionally play a role, as it was well established that microbial cell death resulted in lysis and released DOM into the surrounding waters including peptides (Franklin et al., 2006; Bronk et al., 2007). Here, we should emphasize that we did not rule out the possibility of active chemoautotrophy in the BoB, but there was no supporting evidence in this snapshot observation. Compared to the Exp-BoB, the bulk DOC overall experienced less consumption (9%) in the Exp-CIO, with more DOC left by the 60-day incubation (Figure 6A). Here we should probably exclude the risk that nutrient availability resulted in the difference of DOM degradation efficiency. During 60 days, the phosphate concentrations were determined as 0.13 ± 0.03 µM and 0.42 ± 0.06 µM in the Exp-BoB and Exp-CIO, respectively, with no significant changes over time (t-test). The DIN concentrations also showed no significant change at the end of the experiments (Exp-BoB: 0.43 ± 0.10µM; Exp-CIO: 3.87 ± 0.54µM) from Day 1 (t-test). Therefore, the relatively low richness and diversity of bacteria primarily limited the DOM degradation (Table S3). The community compositions also influenced the growth efficiency and other aspects of metabolism (Del Giorgio et al., 2011), which might additionally cause the difference of DOM degradation.
It was important to note that, despite the continual biological processing of DOM, DOC concentrations on the final Day 60 in both Exp-BoB and Exp-CIO were still higher than that in the deep ocean (1000 m), which was generally regarded as a recalcitrant DOM pool for it surviving the seasonal to millennial mixing cycles (Letscher and Moore, 2015). Our results thus highlighted the existence of non-recalcitrant DOM that escaped in situ consumption, which accounted for 18% and 14% of DCM-DOC in the w-CIO and BoB, respectively. One plausible reason was derived from DOM-microbe affinity, which was known to fundamentally mediate the DOM turnover efficiency (Zakem et al., 2021). Letscher et al. (2015) also found that a subset of DOM resisted consumption in the epipelagic but was efficiently assimilated by mesopelagic communities. In comparison, the lower DOC consumption (9%) evidenced less affinity between DOM and DCM-dwelling heterotrophs in the w-CIO, which might favor the effective DOM accumulation in the euphotic waters and contribute to the carbon export. Our results showed that DOC degradation in both w-CIO and BoB was on relatively rapid timescales (in 10 days) (Figure 6A), which was shorter than the timescales for oceanic POC export to mesopelagic waters (2-4 weeks) (Bendtsen et al., 2015) (assuming DOC has longer export timescales). Therefore, it implied that DOM might experience strong degradation in the euphotic waters before export, especially in the BoB. However, the seasonal variabilities should be further examined. For instance, the spring/autumn EUC would result in an advection of DOC or an input of additional DOC (Liu et al., 2022), and consequently change the carbon export in the w-CIO (Jana et al., 2015). In the summer or autumn, the widespread freshwater might bring terrestrial OM into the BoB (Jana et al., 2015), which potentially increase the export.
4.3 Mesopelagic turnover of organic matter in the tropical IO
It is recognized that mesopelagic waters play a crucial role in regulating carbon transfer and, ultimately, its long-term sequestration in deep oceans (Robinson et al., 2010; Sanders et al., 2016). A smaller vertical gradient of TOC revealed the increased downward export of OM to mesopelagic waters in the w-CIO, which was consistent with the assumption derived from the DOM-degradation experiments. Based on the molar ratio ΔC: ΔAOU = − 0.72 derived from the Redfield stoichiometry (C:O:N:P = 106:42:16:1) (Anderson and Sarmiento, 1995), the slopes of linear regressions between AOU and TOC revealed that about 21 ± 3% and 17 ± 6% of TOC decrease could be explained by TOC mineralization by aerobic heterotrophic microorganisms in the mesopelagic w-CIO and BoB, respectively. However, as both TOC and AOU are partially controlled by different water masses according to the correlations with temperature (Table 1 and Table S2), the regressions between these two variables with and without temperature indicate whether water mixing overestimates the contribution of TOC to AOU (Doval and Hansell, 2000). You (1997) also confirmed that the temperature could serve as a conservative tracer of water mixing in the eastern Indian Ocean. In the BoB, this overestimation was particularly evident by the significant slope change when temperature was included in the multiple regressions (Table 1). As the intensities of humic-like peak C and peak M gradually increase with depth, the decoupling between these components and AOU suggested other inputs of recalcitrant materials, unrelated to OM mineralization via aerobic heterotrophic consumption (Table S2). The correlations between peak C intensities and water mass properties (i.e. temperature) further confirmed the prominent role of physical processes (Table S2). The mesopelagic BoB was mostly occupied by NICW according to T-S diagram and previous literature (You and Tomczak, 1993). NICW is originated from Indian Central Water (ICW), which enters the northern hemisphere along the African coast via the Somali Current and then flow eastward to fill the BoB (You, 1997). The recalcitrant OM in the NICW is plausible for two reasons: (1) NICW is an aged form of ICW, making the mesopelagic waters in the BoB become the oldest in the eastern IO, which was evidenced by the partial pressures of dissolved Chlorofluorocarbon 12 (pCFC-12) (Fine et al., 2008). It was stated that the transformation of ICW to NICW is a very slow process, accompanied by a significant fall in oxygen values due to consumption by oxidation of organic matter (You, 1997). Therefore, a huge recalcitrant carbon pool in this oldest water mass was anticipated. (2) NICW tends to interact with sediments of the African shelf and the western coast of India along the advective flow path of ICW. These processes were assumed to easily generate recalcitrant materials, which was also an important source of iron to the BoB (Grand et al., 2015). It should be noted that this recalcitrant OM input might play a more important role in the vicinity of 300 m in our study region, as the supply of ICW to the northern hemisphere occurred predominantly on the 26.7 kg m-3 density surface (You and Tomczak, 1993). In comparison, the mesopelagic w-CIO, which also affected by the water mixing from the drastic change of TOC/AOU slope, was occupied by the mixing water masses of NICW and ICW (Figure 3). The distributions of pCFC-12 also confirmed that relatively young age was found in the mesopelagic waters in the CIO (Fine et al., 2008).
Here, we plotted the TOC and AOU in both water masses, where the NICW possessed relatively lower concentrations of TOC than ICW (Figure S9), further confirming that the NICW was an aged water mass in the eastern IO. Based on the correlation between the TOC and AOU in the water masses, unlike the ICW where OM oxidation actively occurred, no correlation was found in the NICW. It also suggested that the mesopelagic BoB was less influenced biological activities. In addition, it should be noted that there were seasonal differences for different water masses. NICW has a strong seasonal variation, which often enters the BoB during the southeast monsoon (You, 1997), assuming that the mesopelagic BoB seasonally received the additional OM supply along the advective pathway of NICW, unrelated to the OM production via microbial transformation. The ICW, on the contrary, has the weakest seasonal variation, which was probably because ICW source region is not under monsoonal effect (You, 1997). Therefore, one can assume that the seasonal variations of TOC in the mesopelagic w-CIO were mainly driven by biological effects.
Despite the overestimation of TOC/AOU was also found in the mesopelagic w-CIO (Table 1), 7 ± 9% of TOC decrease could still be explained by TOC mineralization via aerobic heterotrophic microorganisms in the mesopelagic w-CIO. This result was slightly higher than that in the 5°N-43°S in the eastern IO (~4%) from Doval and Hansell (2000). As the slope change of TOC/AOU was statistically non-significant and much smaller (change by ~65%) compared to the BoB (change by ~150%), one can assume a more important role of mesopelagic microbial processes in the w-CIO rather than BoB. The correlations between AOU and intensities of peak T and peak B indicated that the labile protein-like compounds were depleted through microbial respiration in the w-CIO (Table S2), which also released nutrients back to the ocean interior. Such utilization of biologically reactive OM by microorganisms might further supported the microbial loop and fueled the microbial carbon pump (MCP) in this region (Helms et al., 2013; Zhang et al., 2018). The correlation between the AOU and peak C intensities also revealed the recalcitrant OM production via aerobic microbial transformation in the mesopelagic w-CIO (Table S2). These results thereby raised the possibility that the MCP operated at high efficiency in the mesopelagic w-CIO, with substantial inputs of biogenic OM that stimulated the heterotrophs. Therefore, compared to the BoB, we highlighted the importance of mesopelagic microbial processes for the carbon reservoir in the w-CIO.
4.4 Future uncertainties of carbon sequestration in the eastern IO
As rapid warming of sea surface temperature was reported, investigating the climatic responses of eastern IO has become of major concern in many research fields (Roxy et al., 2014; Hermes et al., 2019; Beal et al., 2020). A significant decrease in net primary production was found in the southern BoB (including our study region) in the last two decades, attributed to the weak supply of nutrients under intense stratification (Sridevi et al., 2023). The organic carbon sequestration was, therefore, highly depended on the changes of heterotrophic respiration in the BoB. Although microbial respiration has faster temperature response rates than photosynthesis (Barton et al., 2020), the microbial communities and nutrient availability are also the major controls of oceanic heterotrophic activities (Letscher et al., 2015). The abundant SAR 11 clade in the euphotic BoB was found to benefit and replace other taxa in a warming and more oligotrophic ocean (Morán et al., 2015). With nutrient supply weakening in a more stratified system, the responses of SAR 11 clade to the temperature might be the key role of altering carbon fluxes in the future BoB.
Different from the expectation of ocean warming with climate change, a temperature anomaly in the w-CIO was surprisingly revealed by a 30-year hydrological record (Figure 8A). The decreasing temperature trend mostly appeared between the 50-100 m layer in the 80°E-90°E where in situ production was seasonally stimulated by the thermocline heave. Unlike the phytoplankton that prefers a warmer ocean (Flombaum et al., 2020), there are many possibilities of heterotrophic responses. The abundant heterotrophic micobes (Rhodobacterales, Flavobacterales) in the w-CIO were found insensitive to the temperature change (Yeh and Fuhrman, 2022). Some studies, however, found that they benefited in a warming ocean (Arandia-Gorostidi et al., 2020; Tonelli et al., 2021). The thermohaline properties resulted in the increasing density of the water mass (Figures 8A–C). The cooled and densified water mass also tends to migrate to greater depths and depresses the nitrate isolines, which reduced the nitrate levels at local scales. The responses of microorganisms to this weakened nutrient availability are also expected to be the focal points of carbon production and export in the euphotic w-CIO.
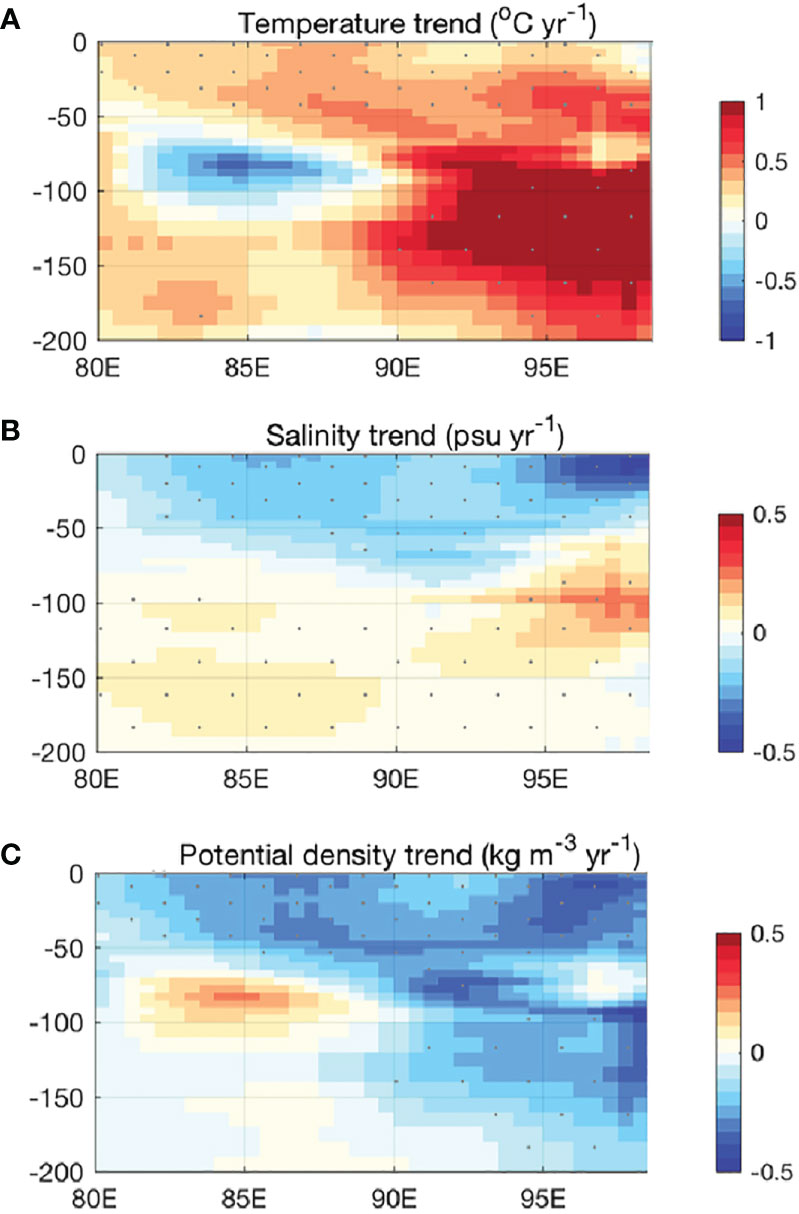
Figure 8 A 30-year record of (A) temperature trend, (B) salinity trend, and (C) potential density trend in the upper waters of the Central Indian Ocean (IO). The datasets was downloaded from: https://data.marine.copernicus.eu/product/INSITU_GLO_PHY_TS_OA_MY_013_052/description. It is a quality-controlled gridded monthly temperature and salinity field of 30 years (1990 to 2019). The trend analysis returns the linear trend of these variables by least squares. Mann-Kendall test of the null hypothesis of the trend were performed with a typical value of 0.05 was used as the significance level of the test.
It should be noted that another difference between the w-CIO and BoB occurred in the mesopelagic waters. Despite the carbon reservoir in both regions was highly affected by the water mass mixing, OM degradation and the related microbial loop were more active in the mesopelagic w-CIO. Previous studies have demonstrated that recalcitrant compounds could be consumed by heterotroph at a higher temperature (Lønborg et al., 2016; Lønborg et al., 2018; Zakem et al., 2021). Lønborg et al. (2018) also predicted that a 1°C ocean warming would decrease almost 15% of the semi-labile and semi-recalcitrant DOC pools. Therefore, it appeared that the mesopelagic w-CIO was likely to be more sensitive to the ocean warming in terms of biological control.
5 Conclusion
Our results revealed the heterogeneity of the OM pool in the tropical IO and shed light on the complexity of physical-biological controls. The thermocline heave, with its strong seasonal variation, was an important factor in these highly stratified water columns. Except for the mixed layer production, DOM release from the deep euphotic zone might also exhibit strong seasonality in the w-CIO under physical forcing. As the deep euphotic w-CIO experienced diverse physical processes (e.g. seasonal EUC), their joint contributions to the biogeochemical cycles in the eastern IO might become a substantial challenge. We have emphasized the strong DOM degradation efficiency in the euphotic BoB, and the mesopelagic BoB consequently received relatively recalcitrant rather than labile OM from upper waters. However, the recalcitrant carbon pool in the mesopelagic BoB was more affected by the advection of old water mass (i.e. NICW). In comparison, apart from the substantial influence of water mixing, the w-CIO was also regulated by biological activities throughout the euphotic and mesopelagic columns, where the chemoautotrophic contribution by AOA was an important consideration in the DOM pool in the euphotic CIO. Future estimates about the carbon reservoir changes should be more cautious in the eastern IO, where the w-CIO tended to exhibit an abnormal temperature change that potentially altered the carbon cycle.
Data availability statement
Sequence data in this study were entered into the NCBI Sequence Read Archive (SRA) under BioProject ID PRJNA954975. Other data reported in this study are available at Mendeley Data (doi: 10.17632/mrddf37zxz.3). Further inquiries can be directed to the corresponding author.
Author contributions
YZ contributed to sample collection, sample analysis, and manuscript writing. YW contributed to the research design and manuscript writing. JZ contributed to the research design and sample collection. YX, KH, JD and QY provided support for the data interpretation. JJ provided support for the nutrient analyses. JL and ZZ provided support for the sample collection. All authors provided significant input on the final manuscript.
Funding
We are grateful for the financial support from the National Natural Science Foundation of China (NSFC) (42230402, 42090043, 42176026) and “the Research Funds of Happiness Flower ECNU (2021ST2110)”.
Acknowledgments
We thank the captain, crew, and scientists aboard the R/V Shiyan III, led by chief scientist Jian Li, for their support during the cruise. Special thanks are given to Yue Tang, Xiaohui Zhang, Yao Wang, and Yuxi Ma for their help in the sampling. We highly appreciate the valuable comments and suggestions given by the reviewers.
Conflict of interest
The authors declare that the research was conducted in the absence of any commercial or financial relationships that could be construed as a potential conflict of interest.
Publisher’s note
All claims expressed in this article are solely those of the authors and do not necessarily represent those of their affiliated organizations, or those of the publisher, the editors and the reviewers. Any product that may be evaluated in this article, or claim that may be made by its manufacturer, is not guaranteed or endorsed by the publisher.
Supplementary material
The Supplementary Material for this article can be found online at: https://www.frontiersin.org/articles/10.3389/fmars.2023.1141844/full#supplementary-material
References
Anderson L. A., Sarmiento J. L. (1995). Global ocean phosphate and oxygen simulations. Global Biogeochem. Cycles 9 (4), 621–636. doi: 10.1029/95GB01902
Annamalai H., Hafner J., Sooraj K., Pillai P. (2013). Global warming shifts the monsoon circulation, drying south Asia. J. Climate 26 (9), 2701–2718. doi: 10.1175/jcli-d-12-00208.1
Arandia-Gorostidi N., Alonso-Sáez L., Stryhanyuk H., Richnow H. H., Morán X. A. G., Musat N. (2020). Warming the phycosphere: differential effect of temperature on the use of diatom-derived carbon by two copiotrophic bacterial taxa. Environ. Microbiol. 22 (4), 1381–1396. doi: 10.1111/1462-2920.14954
Baer S. E., Rauschenberg S., Garcia C. A., Garcia N. S., Martiny A. C., Twining B. S., et al. (2019). Carbon and nitrogen productivity during spring in the oligotrophic Indian ocean along the GO-SHIP IO9N transect. Deep Sea Res. Part II: Topical Stud. Oceanogr. 161, 81–91. doi: 10.1016/j.dsr2.2018.11.008
Baker A., Tipping E., Thacker S., Gondar D. (2008). Relating dissolved organic matter fluorescence and functional properties. Chemosphere 73 (11), 1765–1772. doi: 10.1016/j.chemosphere.2008.09.01
Barton S., Jenkins J., Buckling A., Schaum C.-E., Smirnoff N., Raven J. A., et al. (2020). Evolutionary temperature compensation of carbon fixation in marine phytoplankton. Ecol. Lett. 23 (4), 722–733. doi: 10.1111/ele.13469
Bauer J. E., Cai W. J., Raymond P. A., Bianchi T. S., Hopkinson C. S., Regnier P. A. (2013). The changing carbon cycle of the coastal ocean. Nature 504 (7478), 61–70. doi: 10.1038/nature12857
Bayer B., Hansman R. L., Bittner M. J., Noriega-Ortega B. E., Niggemann J., Dittmar T., et al. (2019a). Ammonia-oxidizing archaea release a suite of organic compounds potentially fueling prokaryotic heterotrophy in the ocean. Environ. Microbiol. 21 (11), 4062–4075. doi: 10.1111/1462-2920.14755
Bayer B., McBeain K., Carlson C. A., Santoro A. E. (2023). Carbon content, carbon fixation yield and dissolved organic carbon release from diverse marine nitrifiers. Limnol. Oceanogr. 68 (1), 84–96. doi: 10.1002/lno.12252
Bayer B., Pelikan C., Bittner M. J., Reinthaler T., Könneke M., Herndl G. J., et al. (2019b). Proteomic response of three marine ammonia-oxidizing archaea to hydrogen peroxide and their metabolic interactions with a heterotrophic alphaproteobacterium. Msystems 4 (4), e00181–e00119. doi: 10.1128/mSystems.00181-19
Beal L., Vialard J., Roxy M., Li J., Andres M., Annamalai H., et al. (2020). A road map to IndOOS-2: better observations of the rapidly warming Indian ocean. Bull. Am. Meteorol. Soc. 101 (11), E1891–E1913. doi: 10.1175/BAMS-D-19-0209.1
Bendtsen J., Hilligsøe K. M., Hansen J. L., Richardson K. (2015). Analysis of remineralisation, lability, temperature sensitivity and structural composition of organic matter from the upper ocean. Prog. Oceanogr. 130, 125–145. doi: 10.1016/j.pocean.2014.10.009
Bronk D. A., See J. H., Bradley P., Killberg L. (2007). DON as a source of bioavailable nitrogen for phytoplankton. Biogeosciences 4 (3), 283–296. doi: 10.5194/bg-4-283-2007
Caporaso J. G., Kuczynski J., Stombaugh J., Bittinger K., Bushman F. D., Costello E. K., et al. (2010). QIIME allows analysis of high-throughput community sequencing data. Nat. Methods 7 (5), 335–336. doi: 10.1038/nmeth.f.303
Carlson C. A., Giovannoni S. J., Hansell D. A., Goldberg S. J., Parsons R., Vergin K. (2004). Interactions among dissolved organic carbon, microbial processes, and community structure in the mesopelagic zone of the northwestern Sargasso Sea. Limnol. Oceanogr. 49 (4), 1073–1083. doi: 10.2307/3597658
Carlson C. A., Hansell D. A. (2015). “DOM sources, sinks, reactivity, and budgets.” in Biogeochemistry of Marine Dissolved Organic Matter (San Diego, CA: Academic Press), 65–126. doi: 10.1016/b978-0-12-405940-5.00003-0
Coble P. G. (1996). Characterization of marine and terrestrial DOM in seawater using excitation-emission matrix spectroscopy. Mar. Chem. 51 (4), 325–346. doi: 10.1016/0304-4203(95)00062-3
Dalabehara H., Sarma V. (2021). Physical forcing controls spatial variability in primary production in the Indian ocean. Deep Sea Res. Part II: Topical Stud. Oceanogr. 183, 104906. doi: 10.1016/j.dsr2.2020.104906
Del Giorgio P. A., Condon R., Bouvier T., Longnecker K., Bouvier C., Sherr E., et al. (2011). Coherent patterns in bacterial growth, growth efficiency, and leucine metabolism along a northeastern pacific inshore-offshore transect. Limnol. Oceanogr. 56 (1), 1–16. doi: 10.4319/lo.2011.56.1.0001
Deng W., Wang S., Wan X., Zheng Z., Jiao N., Kao S. J., et al. (2021). Potential competition between marine heterotrophic prokaryotes and autotrophic picoplankton for nitrogen substrates. Limnol. Oceanogr. 66 (9), 3338–3355. doi: 10.1002/lno.11883
Diaz B. P., Knowles B., Johns C. T., Laber C. P., Bondoc K. G. V., Haramaty L., et al. (2021). Seasonal mixed layer depth shapes phytoplankton physiology, viral production, and accumulation in the north Atlantic. Nat. Commun. 12 (1), 1–16. doi: 10.1038/s41467-021-26836-1
Dittmar T., Lennartz S. T., Buck-Wiese H., Hansell D. A., Santinelli C., Vanni C., et al. (2021). Enigmatic persistence of dissolved organic matter in the ocean. Nat. Rev. Earth Environ. 2 (8), 570–583. doi: 10.1038/s43017-021-00183-7
Dittmar T., Paeng J. (2009). A heat-induced molecular signature in marine dissolved organic matter. Nat. Geosci. 2 (3), 175–179. doi: 10.1038/ngeo440
Dong L., Zhou T., Wu B. (2014). Indian Ocean warming during 1958–2004 simulated by a climate system model and its mechanism. Climate Dyn. 42 (1), 203–217. doi: 10.1007/s00382-013-1722-z
Doval M. D., Hansell D. A. (2000). Organic carbon and apparent oxygen utilization in the western south pacific and the central Indian oceans. Mar. Chem. 68 (3), 249–264. doi: 10.1016/S0304-4203(99)00081-X
Fellman J. B., Hood E., Spencer R. G. (2010). Fluorescence spectroscopy opens new windows into dissolved organic matter dynamics in freshwater ecosystems: a review. Limnol. Oceanogr. 55 (6), 2452–2462. doi: 10.4319/lo.2010.55.6.2452
Fine R. A., Smethie W. M. Jr., Bullister J. L., Rhein M., Min D. H., Warner M. J., et al. (2008). Decadal ventilation and mixing of Indian ocean waters. Deep Sea Res. Part I: Oceanogr. Res. Papers 55 (1), 20–37. doi: 10.1016/j.dsr.2007.10.002
Flombaum P., Wang W. L., Primeau F. W., Martiny A. C. (2020). Global picophytoplankton niche partitioning predicts overall positive response to ocean warming. Nat. Geosci. 13 (2), 116–120. doi: 10.1038/s41561-019-0524-2
Franklin D. J., Brussaard C. P., Berges J. A. (2006). What is the role and nature of programmed cell death in phytoplankton ecology? Eur. J. Phycol. 41 (1), 1–14. doi: 10.1080/09670260500505433
Garcia C. A., Baer S. E., Garcia N. S., Rauschenberg S., Twining B. S., Lomas M. W., et al. (2018). Nutrient supply controls particulate elemental concentrations and ratios in the low latitude eastern Indian ocean. Nat. Commun. 9 (1), 1–10. doi: 10.1038/s41467-018-06892-w
Garcia H. E., Gordon L. I. (1992). Oxygen solubility in seawater: better fitting equations. Limnol. Oceanogr. 37 (6), 1307–1312. doi: 10.4319/lo.1992.37.6.1307
Giovannoni S. J. (2017). SAR11 bacteria: the most abundant plankton in the oceans. Annu. Rev. Mar. Sci. 9, 231–255. doi: 10.1146/annurev-marine-010814-015934
Grand M. M., Measures C. I., Hatta M., Hiscock W. T., Landing W. M., Morton P. L., et al. (2015). Dissolved fe and Al in the upper 1000 m of the eastern Indian ocean: a high-resolution transect along 95° e from the Antarctic margin to the bay of Bengal. Global Biogeochem. Cycles 29 (3), 375–396. doi: 10.1002/2014GB004920
Hansell D. A. (2009). Dissolved organic carbon in the carbon cycle of the Indian Ocean. Indian Ocean biogeochemical processes and ecological variability, 185, 217–230. doi: 10.1029/2007gm000684
Hansell D. A., Carlson C. A., Repeta D. J., Schlitzer R. (2009). Dissolved organic matter in the ocean: a controversy stimulates new insights. Oceanography 22 (4), 202–211. doi: 10.5670/oceanog.2009.109
Hansell D. A., Carlson C. A., Schlitzer R. (2012). Net removal of major marine dissolved organic carbon fractions in the subsurface ocean. Global Biogeochem. Cycles 26 (1), GB1016. doi: 10.1029/2011gb004069
Hansen A. M., Kraus T. E., Pellerin B. A., Fleck J. A., Downing B. D., Bergamaschi B. A. (2016). Optical properties of dissolved organic matter (DOM): effects of biological and photolytic degradation. Limnol. Oceanogr. 61 (3), 1015–1032. doi: 10.1002/lno.10270
Haro-Moreno J. M., Rodriguez-Valera F., López-García P., Moreira D., Martin-Cuadrado A. B. (2017). New insights into marine group III euryarchaeota, from dark to light. ISME J. 11 (5), 1102–1117. doi: 10.1038/ismej.2016.188
Helms J. R., Stubbins A., Perdue E. M., Green N. W., Chen H., Mopper K. (2013). Photochemical bleaching of oceanic dissolved organic matter and its effect on absorption spectral slope and fluorescence. Mar. Chem. 155, 81–91. doi: 10.1016/j.marchem.2013.05.015
Hermes J. C., Masumoto Y., Beal L., Roxy M. K., Vialard J., Andres M., et al. (2019). A sustained ocean observing system in the Indian ocean for climate related scientific knowledge and societal needs. Front. Mar. Sci. 355. doi: 10.3389/fmars.2019.00355
Hertkorn N., Benner R., Frommberger M., Schmitt-Kopplin P., Witt M., Kaiser K., et al. (2006). Characterization of a major refractory component of marine dissolved organic matter. Geochimica Cosmochimica Acta 70 (12), 2990–3010. doi: 10.1016/j.gca.2006.03.021
Hood R., Bange H., Beal L., Beckley L., Burkill P., Cowie G., et al. (2015). Science Plan of the Second International Indian Ocean Expedition (IIOE-2): A Basin-Wide Research Program. Scientific Committee on Oceanic Research, Newark, Delaware, USA.
Hu Q., Chen X., He X., Bai Y., Zhong Q., Gong F., et al. (2022). Seasonal variability of phytoplankton biomass revealed by satellite and BGC-argo data in the central tropical Indian ocean. J. Geophys. Res.: Oceans 127 (10), e2021JC018227. doi: 10.1029/2021JC018227
Huang K., Wang D., Chen G., Nagura M., Han W., McPhaden M. J., et al. (2022). Intensification and dynamics of the westward equatorial undercurrent during the summers of 1998 and 2016 in the Indian ocean. Geophys. Res. Lett. 49 (20), e2022GL100168. doi: 10.1029/2022gl100168
Jana S., Gangopadhyay A., Chakraborty A. (2015). Impact of seasonal river input on the bay of Bengal simulation. Continental Shelf Res. 104, 45–62. doi: 10.1016/j.csr.2015.05.001
Jayaram C., Bhaskar T. U., Chacko N., Prakash S., Rao K. (2021). Spatio-temporal variability of chlorophyll in the northern Indian ocean: a biogeochemical argo data perspective. Deep Sea Res. Part II: Topical Stud. Oceanogr. 183, 104928. doi: 10.1016/j.dsr2.2021.104928
Kaiser D., Konovalov S., Schulz-Bull D. E., Waniek J. J. (2017). Organic matter along longitudinal and vertical gradients in the black Sea. Deep Sea Res. Part I: Oceanogr. Res. Papers 129, 22–31. doi: 10.1016/j.dsr.2017.09.006
Kara A. B., Rochford P. A., Hurlburt H. E. (2000). Mixed layer depth variability and barrier layer formation over the north pacific ocean. J. Geophys. Res.: Oceans 105 (C7), 16783–16801. doi: 10.1029/2000jc900071
Kessler W. S. (1990). Observations of long rossby waves in the northern tropical pacific. J. Geophys. Res.: Oceans 95 (C4), 5183–5217. doi: 10.1029/jc095ic04p05183
Kowalczuk P., Durako M. J., Young H., Kahn A. E., Cooper W. J., Gonsior M. (2009). Characterization of dissolved organic matter fluorescence in the south Atlantic bight with use of PARAFAC model: interannual variability. Mar. Chem. 113 (3-4), 182–196. doi: 10.1016/j.marchem.2009.01.015
Kowalczuk P., Tilstone G. H., Zabłocka M., Röttgers R., Thomas R. (2013). Composition of dissolved organic matter along an Atlantic meridional transect from fluorescence spectroscopy and parallel factor analysis. Mar. Chem. 157, 170–184. doi: 10.1016/j.marchem.2013.10.004
Kumar S. P., Nuncio M., Ramaiah N., Sardesai S., Narvekar J., Fernandes V., et al. (2007). Eddy-mediated biological productivity in the bay of Bengal during fall and spring intermonsoons. Deep Sea Res. Part I: Oceanogr. Res. Papers 54 (9), 1619–1640. doi: 10.1016/j.dsr.2007.06.002
Kumar S., Ramesh R., Sardesai S., Sheshshayee M. S. (2004). High new production in the bay of Bengal: possible causes and implications. Geophys. Res. Lett. 31 (18), L18304. doi: 10.1029/2004GL021005
Lønborg C., Álvarez–Salgado X. A., Letscher R. T., Hansell D. A. (2018). Large Stimulation of recalcitrant dissolved organic carbon degradation by increasing ocean temperatures. Front. Mar. Sci. 4. doi: 10.3389/fmars.2017.00436
Lønborg C., Carreira C., Jickells T., Álvarez-Salgado X. A. (2020). Impacts of global change on ocean dissolved organic carbon (DOC) cycling. Front. Mar. Sci. 7. doi: 10.3389/fmars.2020.00466
Lønborg C., Cuevas L. A., Reinthaler T., Herndl G. J., Gasol J. M., Morán X. A. G., et al. (2016). Depth dependent relationships between temperature and ocean heterotrophic prokaryotic production. Front. Mar. Sci. 3, 90. doi: 10.3389/fmars.2016.00090
Lachkar Z., Smith S., Lévy M., Pauluis O. (2016). Eddies reduce denitrification and compress habitats in the Arabian Sea. Geophys. Res. Lett. 43 (17), 9148–9156. doi: 10.1002/2016GL069876
Landschützer P., Gruber N., Bakker D. C. (2016). Decadal variations and trends of the global ocean carbon sink. Global Biogeochem. Cycles 30 (10), 1396–1417. doi: 10.1002/2015gb005359
Lee Z., Weidemann A., Kindle J., Arnone R., Carder K. L., Davis C. (2007). Euphotic zone depth: its derivation and implication to ocean-color remote sensing. J. Geophys. Res.: Oceans 112 (C3), C03009. doi: 10.1029/2006JC003802
Letscher R. T., Knapp A. N., James A. K., Carlson C. A., Santoro A. E., Hansell D. A. (2015). Microbial community composition and nitrogen availability influence DOC remineralization in the south pacific gyre. Mar. Chem. 177, 325–334. doi: 10.1016/j.marchem.2015.06.024
Letscher R. T., Moore J. K. (2015). Preferential remineralization of dissolved organic phosphorus and non-redfield DOM dynamics in the global ocean: impacts on marine productivity, nitrogen fixation, and carbon export. Global Biogeochem. Cycles 29 (3), 325–340. doi: 10.1002/2014gb004904
Li M., Baker B. J., Anantharaman K., Jain S., Breier J. A., Dick G. J. (2015). Genomic and transcriptomic evidence for scavenging of diverse organic compounds by widespread deep-sea archaea. Nature communications. 6 (1), 1–6. doi: 10.1038/ncomms9933
Lipschultz F. (2001). A time-series assessment of the nitrogen cycle at BATS. Deep Sea Res. Part II: Topical Stud. Oceanogr. 48 (8-9), 1897–1924. doi: 10.1016/s0967-0645(00)00168-5
Liu H., Song Y., Zhang X., Zhang G., Wu C., Wang X., et al. (2021). Spatial variation in primary production in the Eastern Indian ocean. Front. Mar. Sci. 8, 757529. doi: 10.3389/fmars.2021.757529
Liu Y., Sun J., Wang X., Liu X., Wu X., Chen Z., et al. (2021). Fluorescence characteristics of chromophoric dissolved organic matter in the Eastern Indian ocean: a case study of three subregions. Front. Mar. Sci. 8, 742595. doi: 10.3389/fmars.2021.742595
Liu M., Zheng H., Chen M., Liang J., Duan M., Du H., et al. (2022). Dissolved PAHs impacted by air-sea interactions: net volatilization and strong surface current transport in the Eastern Indian ocean. J. Hazard. Mater. 431, 128603. doi: 10.1016/j.jhazmat.2022.128603
Martens-Habbena W., Berube P. M., Urakawa H., de la Torre J. R., Stahl D. A. (2009). Ammonia oxidation kinetics determine niche separation of nitrifying archaea and bacteria. Nature 461 (7266), 976–979. doi: 10.1038/nature08465
McCreary J. P. Jr., Kohler K. E., Hood R. R., Olson D. B. (1996). A four-component ecosystem model of biological activity in the Arabian Sea. Prog. Oceanogr. 37 (3-4), 193–240. doi: 10.1016/s0079-6611(96)00005-5
Morán X. A. G., Alonso-Sáez L., Nogueira E., Ducklow H. W., González N., López-Urrutia Á., et al. (2015). More, smaller bacteria in response to ocean's warming? Proc. R. Soc. B: Biol. Sci. 282 (1810), 20150371. doi: 10.1098/rspb.2015.0371
Murphy K. R., Stedmon C. A., Wenig P., Bro R. (2014). OpenFluor–an online spectral library of auto-fluorescence by organic compounds in the environment. Anal. Methods 6 (3), 658–661. doi: 10.1039/c3ay41935e
Osburn C. L., Wigdahl C. R., Fritz S. C., Saros J. E. (2011). Dissolved organic matter composition and photoreactivity in prairie lakes of the US great plains. Limnol. Oceanogr. 56 (6), 2371–2390. doi: 10.4319/lo.2011.56.6.2371
Osterholz H., Niggemann J., Giebel H.-A., Simon M., Dittmar T. (2015). Inefficient microbial production of refractory dissolved organic matter in the ocean. Nat. Commun. 6 (1), 1–8. doi: 10.1038/ncomms8422
Pires A. C., Cleary D. F., Almeida A., Cunha Â., Dealtry S., Mendonça-Hagler L. C., et al. (2012). Denaturing gradient gel electrophoresis and barcoded pyrosequencing reveal unprecedented archaeal diversity in mangrove sediment and rhizosphere samples. Appl. Environ. Microbiol. 78 (16), 5520–5528. doi: 10.1128/aem.00386-12
Ramaiah N., Fernandes V., Rodrigues V. V., Paul J. T., Gauns M. (2009). Bacterioplankton abundance and production in Indian ocean regions. Indian Ocean Biogeochem. Processes Ecol. Variability 185, 119–132. doi: 10.1029/2008GM000711
Riebesell U., Körtzinger A., Oschlies A. (2009). Sensitivities of marine carbon fluxes to ocean change. Proc. Natl. Acad. Sci. 106 (49), 20602–20609. doi: 10.2307/40536043
Robinson C., Steinberg D. K., Anderson T. R., Arístegui J., Carlson C. A., Frost J. R., et al. (2010). Mesopelagic zone ecology and biogeochemistry–a synthesis. Deep Sea Res. Part II: Topical Stud. Oceanogr. 57 (16), 1504–1518. doi: 10.1016/j.dsr2.2010.02.018
Romera-Castillo C., Letscher R. T., Hansell D. A. (2016). New nutrients exert fundamental control on dissolved organic carbon accumulation in the surface Atlantic ocean. Proc. Natl. Acad. Sci. 113 (38), 10497–10502. doi: 10.1073/pnas.1605344113
Roshan S., DeVries T. (2017). Efficient dissolved organic carbon production and export in the oligotrophic ocean. Nat. Commun. 8 (1), 1–8. doi: 10.1038/s41467-017-02227-3
Roxy M. K., Ritika K., Terray P., Masson S. (2014). The curious case of Indian ocean warming. J. Climate 27 (22), 8501–8509. doi: 10.1175/jcli-d-14-00471.1
Sanders R. J., Henson S. A., Martin A. P., Anderson T. R., Bernardello R., Enderlein P., et al. (2016). Controls over ocean mesopelagic interior carbon storage (COMICS): fieldwork, synthesis, and modeling efforts. Front. Mar. Sci. 3. doi: 10.3389/fmars.2016.00136
Santinelli C., Hansell D., d’Alcalà M. R. (2013). Influence of stratification on marine dissolved organic carbon (DOC) dynamics: the Mediterranean Sea case. Prog. Oceanogr. 119, 68–77. doi: 10.1016/j.pocean.2013.06.001
Sardessai S., Shetye S., Maya M., Mangala K., Kumar S. P. (2010). Nutrient characteristics of the water masses and their seasonal variability in the eastern equatorial Indian ocean. Mar. Environ. Res. 70 (3-4), 272–282. doi: 10.1016/j.marenvres.2010.05.009
Sarma V., Rao D., Rajula G., Dalabehera H., Yadav K. (2019). Organic nutrients support high primary production in the bay of Bengal. Geophys. Res. Lett. 46 (12), 6706–6715. doi: 10.1029/2019gl082262
Sarma V., Rao G., Viswanadham R., Sherin C., Salisbury J., Omand M. M., et al. (2016). Effects of freshwater stratification on nutrients, dissolved oxygen, and phytoplankton in the bay of Bengal. Oceanography 29 (2), 222–231. doi: 10.5670/oceanog.2016.54
Schott F. A., Xie S. P., McCreary J.P. Jr. (2009). Indian Ocean circulation and climate variability. Rev. Geophys. 47 (1), RG1002. doi: 10.1029/2007rg000245
Sengupta D., Bharath Raj G. N., Shenoi S. S. C. (2006). Surface freshwater from bay of Bengal runoff and Indonesian throughflow in the tropical Indian ocean. Geophys. Res. Lett. 33 (22), L22609. doi: 10.1029/2006GL027573
Sokal R. R., Rohlf F. J. (1995). Model II regression. biometry: the principle and practice of statistics in biological research (New York: WH Freeman and Company), 541–554.
Sridevi B., Sabira S., Sarma V. V. S. S. (2023). Impact of ocean warming on net primary production in the northern Indian ocean: role of aerosols and freshening of surface ocean. Environ. Sci. pollut. Res. 30, 53616–53634. doi: 10.1007/s11356-023-26001-9
Stedmon C. A., Bro R. (2008). Characterizing dissolved organic matter fluorescence with parallel factor analysis: a tutorial. Limnol. Oceanogr.: Methods 6 (11), 572–579. doi: 10.4319/lom.2008.6.572
Stedmon C. A., Markager S. (2005). Resolving the variability in dissolved organic matter fluorescence in a temperate estuary and its catchment using PARAFAC analysis. Limnol. Oceanogr. 50 (2), 686–697. doi: 10.2307/3597742
Sunny G. M., Sherin C., Vishnu N., Reddy B., Sudheesh V., Prachi M., et al. (2022). Variability of particulate organic carbon and assessment of satellite retrieval algorithms over the eastern Arabian Sea. Environ. Monit. Assess. 194 (9), 1–18. doi: 10.1007/s10661-022-10264-9
Talley L., Feely R., Sloyan B., Wanninkhof R., Baringer M., Bullister J., et al. (2016). Changes in ocean heat, carbon content, and ventilation: a review of the first decade of GO-SHIP global repeat hydrography. Annu. Rev. Mar. Sci. 8 (1), 185–215. doi: 10.1146/annurev-marine-052915-100829
Thushara V., Vinayachandran P. N. M., Matthews A. J., Webber B. G., Queste B. Y. (2019). Vertical distribution of chlorophyll in dynamically distinct regions of the southern bay of Bengal. Biogeosciences 16 (7), 1447–1468. doi: 10.5194/bg-16-1447-2019
Tonelli M., Signori C. N., Bendia A., Neiva J., Ferrero B., Pellizari V., et al. (2021). Climate projections for the southern ocean reveal impacts in the marine microbial communities following increases in sea surface temperature. Front. Mar. Sci. 8, 636226. doi: 10.3389/fmars.2021.636226
Wagner S., Schubotz F., Kaiser K., Hallmann C., Waska H., Rossel P. E., et al. (2020). Soothsaying DOM: a current perspective on the future of oceanic dissolved organic carbon. Front. Mar. Sci. 7. doi: 10.3389/fmars.2020.00341
Wang C., Guo W., Li Y., Stubbins A., Cheng Y., Song G., et al. (2017). Hydrological and biogeochemical controls on absorption and fluorescence of dissolved organic matter in the northern south China Sea. J. Geophys. Res. 122 (12), 3405–3418. doi: 10.1002/2017jg004100
Wei Y., Zhang G., Chen J., Wang J., Ding C., Zhang X., et al. (2019). Dynamic responses of picophytoplankton to physicochemical variation in the eastern Indian ocean. Ecol. Evol. 9 (8), 5003–5017. doi: 10.1002/ece3.5107
Xiong J., Liu Y., Lin X., Zhang H., Zeng J., Hou J., et al. (2012). Geographic distance and pH drive bacterial distribution in alkaline lake sediments across Tibetan plateau. Environ. Microbiol. 14 (9), 2457–2466. doi: 10.1111/J.1462-2920.2012.02799.X
Xu Y., Wu Y., Wang H., Zhang Z., Li J., Zhang J. (2021). Seasonal and interannual variabilities of chlorophyll across the eastern equatorial Indian ocean and bay of Bengal. Prog. Oceanogr. 198, 102661. doi: 10.1016/j.pocean.2021.102661
Yamashita Y., Boyer J. N., Jaffé R. (2013). Evaluating the distribution of terrestrial dissolved organic matter in a complex coastal ecosystem using fluorescence spectroscopy. Continental Shelf Res. 66, 136–144. doi: 10.1016/j.csr.2013.06.010
Yamashita Y., Hashihama F., Saito H., Fukuda H., Ogawa H. (2017). Factors controlling the geographical distribution of fluorescent dissolved organic matter in the surface waters of the pacific ocean. Limnol. Oceanogr. 62 (6), 2360–2374. doi: 10.1002/lno.10570
Yeh Y. C., Fuhrman J. A. (2022). Effects of phytoplankton, viral communities, and warming on free-living and particle-associated marine prokaryotic community structure. Nat. Commun. 13 (1), 7905. doi: 10.1038/s41467-022-35551-4
Yool A., Martin A. P., Fernández C., Clark D. R. (2007). The significance of nitrification for oceanic new production. Nature 447 (7147), 999–1002. doi: 10.1038/nature05885
You Y. (1997). Seasonal variations of thermocline circulation and ventilation in the Indian ocean. J. Geophys. Res.: Oceans 102 (C5), 10391–10422. doi: 10.1029/96JC03600
You Y., Tomczak M. (1993). Thermocline circulation and ventilation in the Indian ocean derived from water mass analysis. Deep Sea Res. Part I: Oceanogr. Res. Papers 40 (1), 13–56. doi: 10.1016/0967-0637(93)90052-5
Zakem E. J., Bayer B., Qin W., Santoro A. E., Zhang Y., Levine N. M. (2022). Controls on the relative abundances and rates of nitrifying microorganisms in the ocean. Biogeosciences 19 (23), 5401–5418. doi: 10.5194/bg-19-5401-2022
Zakem E. J., Cael B., Levine N. M. (2021). A unified theory for organic matter accumulation. Proc. Natl. Acad. Sci. 118 (6), e2016896118. doi: 10.1073/pnas.2016896118
Zhang C., Dang H., Azam F., Benner R., Legendre L., Passow U., et al. (2018). Evolving paradigms in biological carbon cycling in the ocean. Natl. Sci. Rev. 5 (4), 481–499. doi: 10.1093/nsr/nwy074
Zhang Y., Wu Y., Zhang J., Jin J., Li J., Zhang Z. (2021). Seasonal dynamics of surface dissolved organic matter in the south China Sea and the straits of malacca: implications for biogeochemical province delineation of marginal seas. J. Geophys. Res.: Biogeosci. 126 (10), e2021JG006535. doi: 10.1029/2021JG006535
Keywords: Indian Ocean, DOC (dissolved organic carbon), fluorescent dissolved organic matter (FDOM), dark carbon fixation, ocean warming
Citation: Zhang Y, Wu Y, Zhang J, Xu Y, Huang K, Jin J, Dai J, Ye Q, Li J and Zhang Z (2023) Different behaviors of organic matter under physical-biological controls in the eastern Indian Ocean. Front. Mar. Sci. 10:1141844. doi: 10.3389/fmars.2023.1141844
Received: 10 January 2023; Accepted: 20 April 2023;
Published: 03 May 2023.
Edited by:
Hiroaki Saito, The University of Tokyo, JapanReviewed by:
Youhei Yamashita, Hokkaido University, JapanFrance Van Wambeke, UMR7294 Institut Méditerranéen d'océanographie (MIO), France
Copyright © 2023 Zhang, Wu, Zhang, Xu, Huang, Jin, Dai, Ye, Li and Zhang. This is an open-access article distributed under the terms of the Creative Commons Attribution License (CC BY). The use, distribution or reproduction in other forums is permitted, provided the original author(s) and the copyright owner(s) are credited and that the original publication in this journal is cited, in accordance with accepted academic practice. No use, distribution or reproduction is permitted which does not comply with these terms.
*Correspondence: Ying Wu, d3V5aW5nQHNrbGVjLmVjbnUuZWR1LmNu