 Camille de la Vega1*
 Martin Paar1†
 Linda Köhler2,3
 Christian von Dorrien2
 Michael Kriegl2,4,5
 Daniel Oesterwind2
 Hendrik Schubert1
- 1Institute of Biological Sciences, Chair of Ecology, University of Rostock, Rostock, Germany
- 2Thünen Institute of Baltic Sea Fisheries, Rostock, Germany
- 3Institute for Applied Ecosystem Research, Neu Broderstorf, Germany
- 4Leibniz Centre for Tropical Marine Research (ZMT), Bremen, Germany
- 5Center for Ocean and Society, Christian-Albrechts-University Kiel, Kiel, Germany
Bottom trawling is one of the main pressures on benthic ecosystems, directly impacting the targeted species and physically disturbing the seabed and the benthic invertebrate communities, in turn indirectly impacting benthivorous fish and the entire benthic food web structure and functioning. To predict the cascading effect of bottom trawling on benthic and demersal fish communities, it is crucial to understand the trophic interactions between benthic and demersal fish and benthic invertebrates. Here, we assessed the diet of benthic and demersal fish and the structure and functioning of the benthic food web in two areas in the German Baltic Sea, the Fehmarnbelt and the Odra Bank. The Fehmarnbelt benthic invertebrate community is characterized by a high number of species and biomass, contrary to the one on the Odra Bank which is species poor with high individual abundance but low biomass. We used mixing models based on stable isotopes of carbon and nitrogen combined with stomach content analyses to estimate the fish diet at both sites, and we used community-wide trophic indices, derived from stable isotopes to compare the structure and functioning of the fish benthic food webs. We show that fish in the Fehmarnbelt can chose preferential prey items, resulting in higher trophic diversity, contrary to fish on the Odra Bank, which feed on all available prey species, resulting in higher trophic redundancy. We found that the generalist behavior of fish on the Odra Bank is likely the result of scarcity in prey items, the benthic invertebrate community being species poor with high abundance of small individuals. We demonstrate that the differences in structure and functioning of the benthic fish food web between the two sites was mainly driven by differences in the characteristics of the benthic prey communities.
1 Introduction
Marine ecosystems are being modified as a result of multiple stressors, including global environmental change, fish exploitation, pollution, and habitat degradation (IPCC, 2019). Determining the resilience of marine ecosystems to perturbations is essential for sustainable management in a changing environment (Silberberger et al., 2018). In the last decades, the Baltic Sea has experienced severe changes as a direct result of anthropogenic activities (Ojaveer et al., 2010; Zeller et al., 2011; Gustafsson et al., 2012; Kabel et al., 2012; Reusch et al., 2018). The cumulative pressure of eutrophication, climate change and intensified fisheries have led to food web reorganization and significant changes in ecosystem structure and functioning (Tomczak et al., 2016; Möllmann, 2019). The fishing impact relative to the other stressors has become stronger in the recent years (Tomczak et al., 2016). Especially, mobile bottom trawl fisheries directly impact the abundance and production of the target species, but also physically disturb the seabed, indirectly impacting the production, biomass and species richness of benthic invertebrate communities (Collie et al., 2000; Hiddink et al., 2006; Kaiser et al., 2006; van Denderen et al., 2013; Nielsen et al., 2022), in turn impacting benthivorous fish, with consequences for the entire benthic ecosystem (Kaiser et al., 2002; Eigaard et al., 2016; Hiddink et al., 2017; Pitcher et al., 2017; Hiddink et al., 2019). Food web structure is inherently linked to ecosystem resilience (Yen et al., 2016; Sanders et al., 2018). Thus, assessing the benthic food web structure and functioning is key to understand and predict the cascading impacts of mobile bottom trawling on benthic ecosystem.
Extensive areas of the Baltic Sea seabed are exposed to damaging fishing gears (European Environment Agency [EEA], 2019). Since the early 1990s, the European Union Habitats Directive (Council directive 92/43/EEC) on the “Conservation of Natural Habitats and of Wild Fauna and Flora”, requires EU Member States to establish “special areas of conservation” (SAC). In 2017, it was decided on German national level that measures excluding fishing with mobile bottom contacting gears should be implemented in the five Baltic SACs in the German exclusive economic zone (EEZ). The species composition, abundance, biomass, and trophic functions (e.g., filter feeder, deposit feeder) in benthic invertebrate communities are well described in the German Baltic SACs (Zettler and Gosselck, 2006; Gogina and Zettler, 2010; Darr et al., 2014; Schiele et al., 2014; Gogina et al., 2016). However, little is known about benthic fish communities and especially the link between benthic fish and their biotopes, which is crucial to evaluate the impact of mobile bottom trawling on fish and the benthic food web.
Here, we assessed the trophic relationships between benthic and demersal fish and benthic invertebrates in the Fehmarnbelt area and on the Odra Bank (Figure 1), both being Baltic SACs, where measures excluding fishing with mobile bottom contacting gears are in the process of being implemented. Both areas are important feeding and/or reproductive grounds for fish, birds, and marine mammals, but they differ in their biotopes (Zettler and Gosselck, 2006; Darr et al., 2014; Schiele et al., 2014).
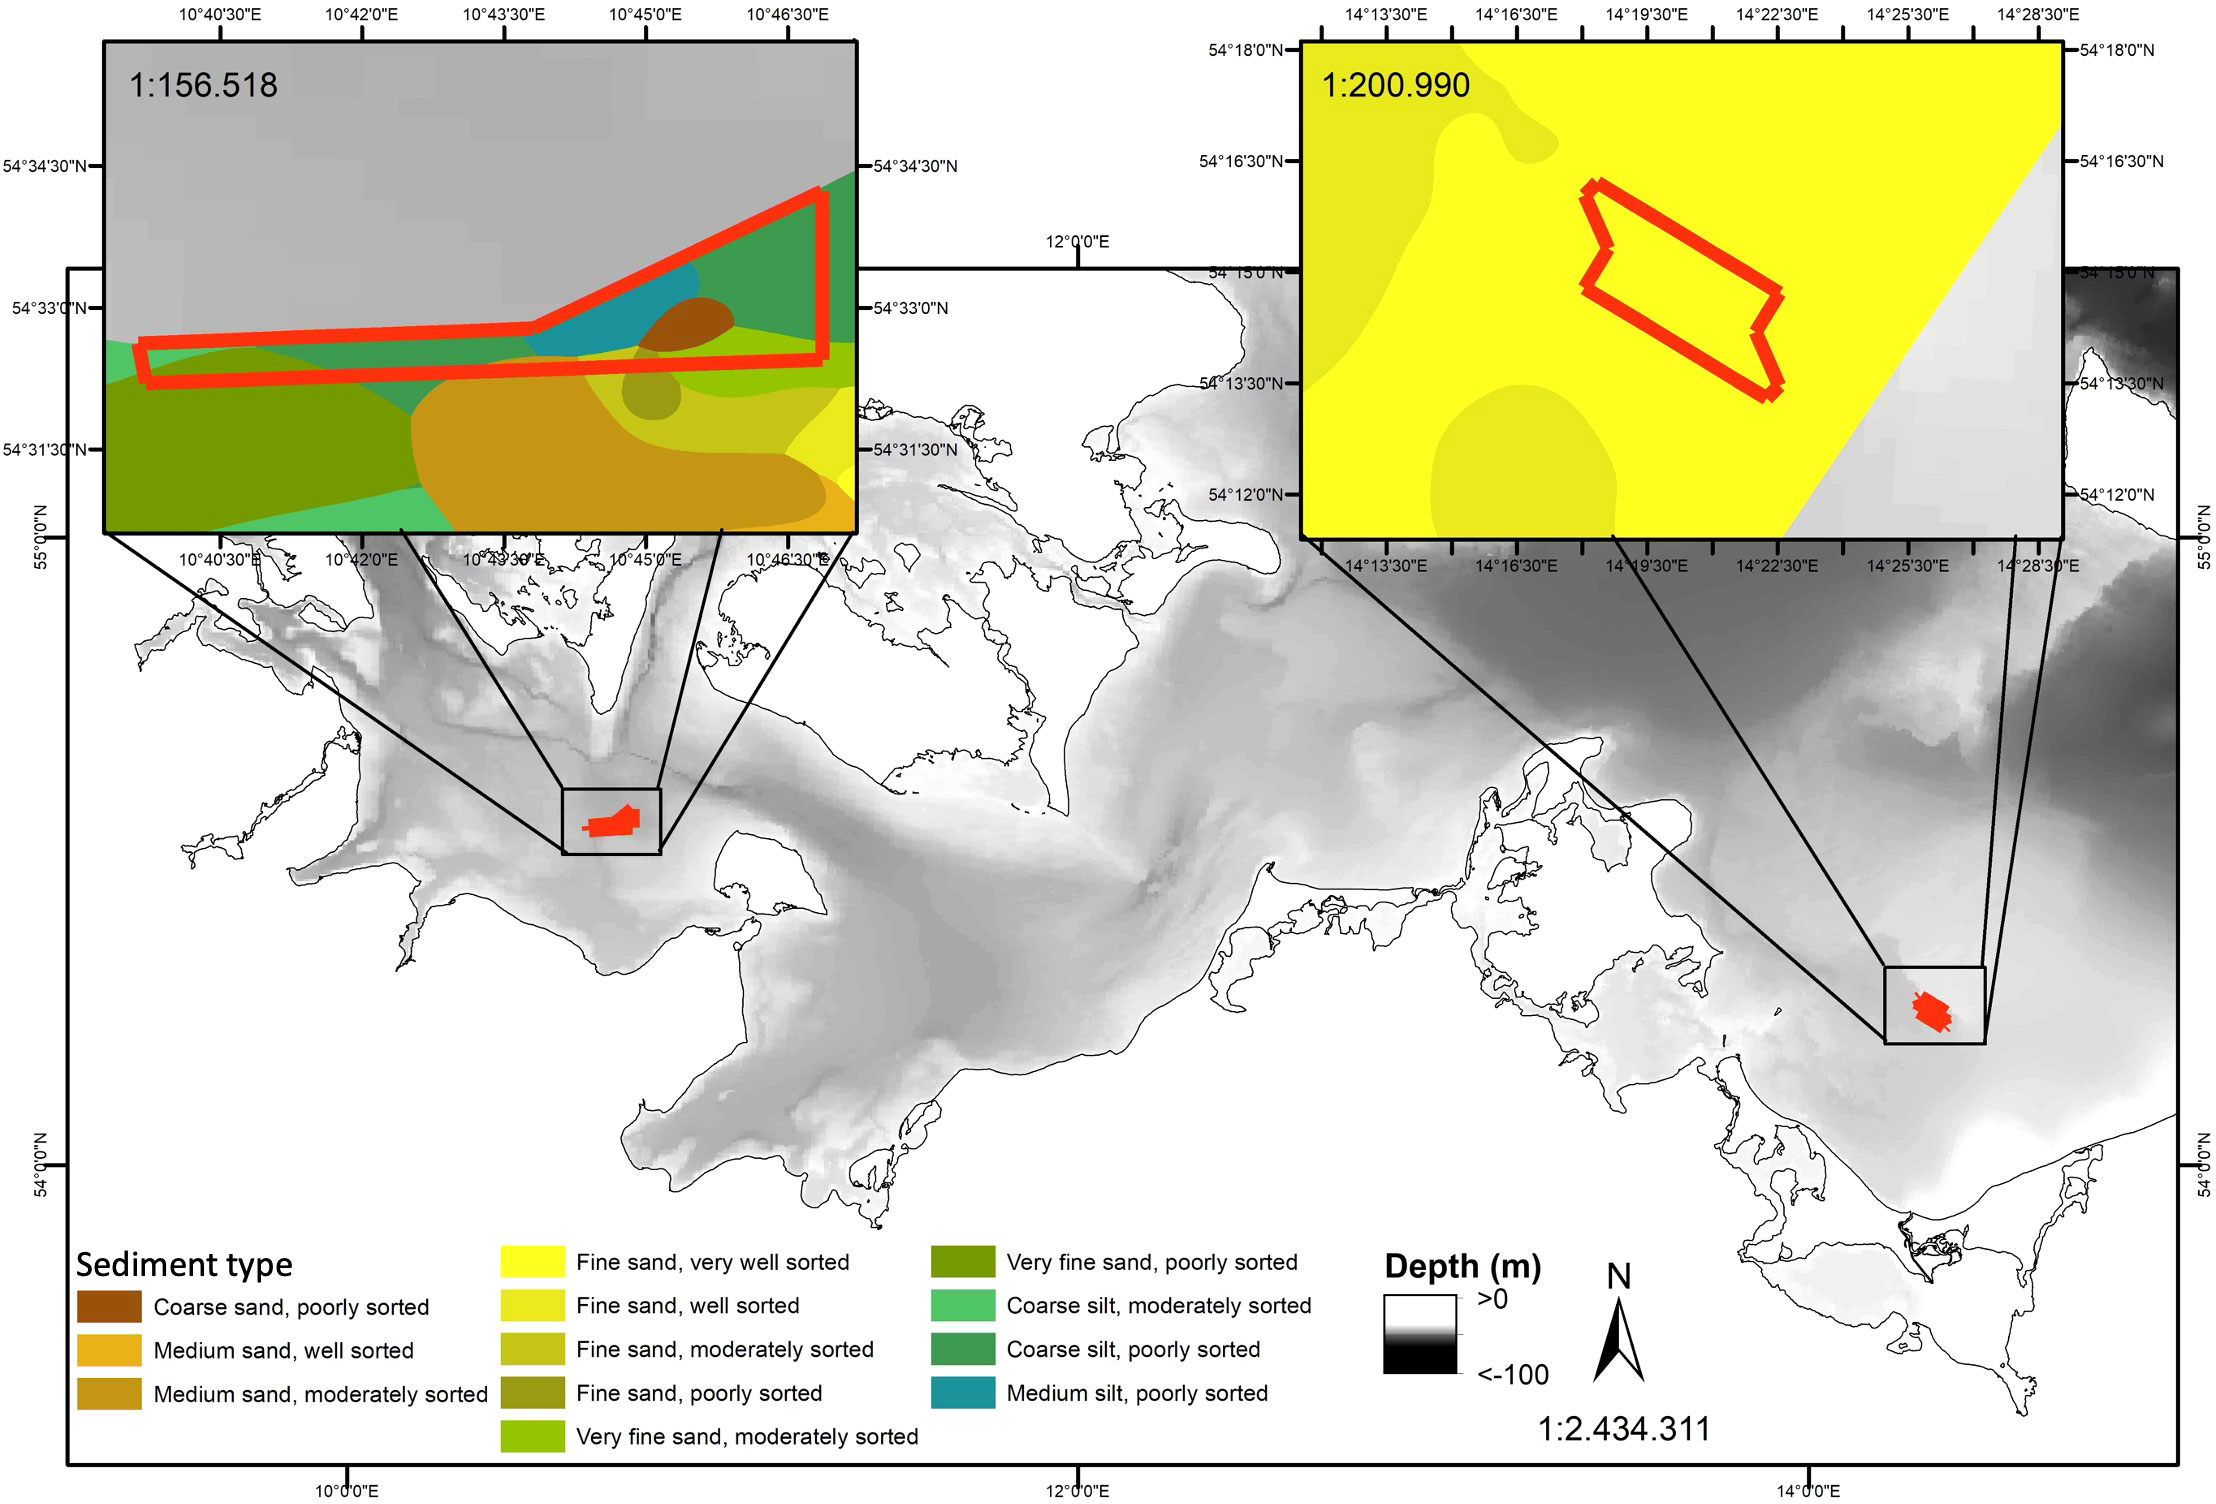
Figure 1 Map depicting the sediment type of the sampling sites in the Fehmarnbelt and Odra Bank regions. Data source: Bundesamt für Seeschifffahrt und Hydrographie (BSH), 2016: Meeresbodensedimente im Maßstab 1:100.000 in der deutschen Ostsee - WMS. Bundesamt für Seeschifffahrt und Hydrographie (BSH); https://www.geoseaportal.de/mapapps/resources/apps/sedimentverteilung_auf_dem_meeresboden/index.html?lang=en&stateId=df8ea853-9890-4f7e-8ea8-5398906f7e7b.
The Fehmarnbelt area is a reef area at ~40 m depth, and is the main pathway of water exchange between the North Sea and the Baltic Sea (Leppäranta and Myrberg, 2009). The combination of permanent exposure to saline and oxygen-rich waters on sandy and muddy sediment allow the settlement of species-rich communities (Darr et al., 2014), dominated by the long-lived ocean quahog (Arctica islandica; Schiele et al. (2014)). The Odra Bank area is a permanently submerged sandbank at ~20 m depth in the brackish central Pomeranian Bight (Leppäranta and Myrberg, 2009) and a typical habitat for a benthic community of limited species number, dominated by crustaceans, mollusks and polychaetes, with relatively low biomass but high individual abundance (Darr et al., 2014), especially of species that can cope with high water turbulence exposure and low salinity (Zettler and Gosselck, 2006). Overall, the benthic invertebrate community in the Fehmarnbelt area consists of numerous large, long-lived species, whereas the one on the Odra Bank consists of few, small short-living species, following the eastward decrease in salinity (Darr et al., 2014). In general, benthic communities in fully marine areas, such as the Fehmarnbelt, are characterized by specialist species, whereas benthic communities in brackish waters, such as on the Odra Bank, are dominated by few generalist species that are able to switch between different functional traits, therefore increasing the functional redundancy in the community (Bonsdorff, 2006; Darr et al., 2014). In food webs, trophic redundancy is a similar concept, defined as the proportion of species having similar trophic ecologies (Layman et al., 2007a). The trophic redundancy increases with increasing diet overlap between species. It is generally predicted that food web resilience to perturbations increases with trophic redundancy (Sanders et al., 2018).
Bulk stable isotopes of carbon and nitrogen are common tools to study food webs. The ratio between heavy (13C) and light (12C) stable carbon isotopes of bulk tissue (δ13C, expressed in per mil) at the base of the food web is influenced by the environment, and δ13C values are transferred with a 13C enrichment of 1‰ to 2‰ between each trophic level, creating an inextricable link between the base of the food web and consumers (Fry et al., 1984). δ13C values can therefore be used to trace the origin of food sources in consumers, e.g. terrestrial versus marine environment (Boutton, 1991; Keeley and Sandquist, 1992), benthic versus pelagic production (DeNiro and Epstein, 1978; Rau et al., 1983; France, 1995), coastal versus offshore environments (Graham et al., 2010; McMahon et al., 2013; Bird et al., 2018). The ratio between heavy (15N) and light (14N) stable nitrogen isotopes of bulk tissue (δ15N) increases by ~3‰ at each trophic level, providing a continuous measure of trophic position of consumers (Post, 2002). This method is complementary to stomach content analyses (Sturbois et al., 2022). Stomach content analyses give a snapshot of the ingested prey items whereas stable isotope composition provides dietary information integrated over a few days to a few months depending on the turnover rate and metabolic activity of the analyzed tissue (Vander Zanden et al., 2015). As stable isotope composition of consumers tissues provides a cumulative signal of assimilated diet, isotopic niches can be used to infer trophic niches (Bearhop et al., 2004; Layman et al., 2007a; Jackson et al., 2012). The complexity of food web structures can be described by “community-wide” trophic indices, such as trophic redundancy, calculated from community distribution of bivariate stable isotope data, i.e., δ13C and δ15N values (Layman et al., 2007a).
In this study, we analyzed δ13C and δ15N values of benthic invertebrates and fish, combined with stomach contents of fish, to investigate the diet of benthic fish, and used community-wide trophic indices to compare the structure of the benthic food webs in the Fehmarnbelt area and on the Odra Bank in spring-early summer. We predict that, 1- as the benthic invertebrate communities differ, the diet of benthic fish will also differ between the Fehmarnbelt and Odra Bank, with fish on the brackish Odra bank being more opportunistic than in the more marine Fehmarnbelt area, 2- the trophic redundancy in the fish community will be higher on the Odra Bank than in the Fehmarnbelt area.
2 Material and methods
2.1 Fish and benthic invertebrate sampling
Fish were collected between the 23rd of May and the 20th of July 2020 with beam trawls operated from the Fisheries Research Vessels (FRV) “Clupea” and “Solea”. We used two different gears, a 2m (2m width, 0.45m height, 10mm mesh size at codend) and a 3m (3m width, 0.45m height, 20mm mesh size at codend) beam trawl, with different fishing selectivity to increase the number of species caught. The 2m beam trawl was towed for 2.5 minutes at an average speed of 2 knots. The 3m beam trawl was towed for 15 minutes at an average speed of 3 knots. During the sampling period, a total of 73 hauls were carried out in the Fehmarnbelt area (32 hauls) and on the Odra Bank (41 hauls; Figure 1). The sampling effort with both fishing gears, and thus the probability of capture, was similar in both areas. Fish were identified to the lowest possible taxonomic level, counted and frozen on board until further analysis. In the lab, each fish was measured to the nearest millimeter and weighed to the nearest 10mg.
Because of the small net mouth, beam trawls are likely to fail capturing large and fast-swimming fish individuals. Our results therefore focus on the benthic and demersal fish communities of less mobile and small fish individuals. Less mobile species, by staying for a longer period in the studied areas, are good indicators of ecological and environmental changes, and they are likely to be the first and most impacted by physical changes on the seabed, and/or functional changes in the benthic food web, compared to highly mobile and migratory species.
In addition to fish samples, epi-benthic invertebrates and benthic infauna were collected throughout the Fehmarnbelt and the Odra Bank areas. Epi-benthic invertebrates were sampled from the beam trawl catches. In addition, demersal Mysidacea individuals (hereafter mysids) were collected from the 2m beam trawl catches on the Odra Bank. At least three individuals from the dominant size class were taken from each species. Benthic infauna was collected using a Van-Veen grab (45kg, sampled area per grab: 0.125m-2, 10–15cm penetration depth) operated from the FRV “Solea”. Three replicates were performed within the Fehmarnbelt area and on the Odra Bank. The content of Van-Veen grab was sieved through 1 mm metal mesh, following the guidelines of the Helsinki Commission 2008. All macrozoobenthic species were kept alive for 24h in filtered seawater to allow gut content evacuation, before being frozen at -20°C until further analysis.
2.2 Fish stomach content analyses
The stomach content of up to five individuals per 5mm intervals size classes and per species were examined. The stomach of each individual fish was removed via ventral dissections. Stomach content was stored in 98% ethanol and later sorted and identified to the lowest possible taxonomic level. Due to differences in digestibility between prey items, it is difficult to robustly quantify the amount of each prey item in the stomach. Here, we calculated the average frequency of occurrence (%) of prey species for each fish species, all size classes combined. This method provides a qualitative picture of the food spectrum consumed by the fish community.
2.3 Sample preparation for stable isotope analyses
For each species of benthic invertebrates, three replicates were analyzed for stable isotopes. To cover the range of individual size in the whole population, three size classes were analyzed per species. When the animals were large enough to be analyzed individually, three entire individuals were analyzed. When the animals were too small to be analyzed individually, 10 individuals per size classes were pooled. Bivalves were dissected, and shells and guts removed.
We analyzed the fish species contributing of at least 5% of the total biomass of fish caught. To avoid substantial ontogenetic shifts, we grouped the fish individuals into two size classes: longer or equal to 10cm, and shorter than 10cm. At least five individuals per group were analyzed. We analyzed dorsal muscle tissue for individuals longer than 10cm, and the entire eviscerated individuals when they were shorter than 10cm.
All samples were freeze-dried and homogenized using a pastel and mortar. To avoid potential bias due to CaCO3 in organisms with calcified structure (e.g. echinoderms, entire fish individuals), samples for δ13C analyses were acidified in glass vials with 1mol.L-1 hydrochloric acid, dried at 50°C and homogenized again (Bunn et al., 1995; Pinnegar and Polunin, 1999). Lipids were removed from fish samples using repeated rinses with 2ml cyclohexane to avoid the bias due to the depletion in 13C in lipids relative to the diet (Tieszen et al., 1983) before δ13C analyses. Samples were then dried at 50°C and homogenized again. δ15N values were determined on raw samples to avoid any potential bias due to acidification and delipidation. Approximately 0.5mg of sample was precisely weighed ( ± 1μg) and sealed in a tin capsule.
To have a reference of basal δ13C and δ15N values in both areas, we analyzed the stable isotope composition of the small fraction of particulate organic matter (POM;<55μm) and the bigger fraction of POM (55-200μm). Sampling procedure, sample preparation and results of POM δ13C and δ15N values are detailed in Supplementary Material.
2.4 Instrumental analyses for stable isotopes
All samples were run for δ13C and δ15N separately. Samples were analyzed using an elemental analyzer (Flash EA 1112, Thermo Scientific, Milan, Italy) coupled to Delta V isotope ratio mass spectrometer (IRMS; Thermo Fisher Scientific) at the LIENSs stable isotope facility of the University of La Rochelle, France. Isotope values are reported in standard δ-notation (‰) relative to Vienna Pee Dee Belemnite and atmospheric N2 for δ13C and δ15N, respectively. To monitor precision, we used acetanilide (Thermo Fisher Scientific) as laboratory internal standard, and precision was<0.15‰ for both δ13C and δ15N. To determine accuracy, we used international reference standards with known δ13C (USGS-24: δ13C = –16.05‰; IAEA-CH6: δ13C = –10.45‰; IAEA-600: δ13C = –27.771‰) and δ15N values (IAEA-N-2: δ15N = 20.41‰; IAEA- NO-3: δ15N = 4.7‰; IAEA-600: δ15N = 1.0‰).
2.5 Data treatment and statistical analyses
2.5.1 Grouping of invertebrate species
Invertebrate species were grouped based on their trophic behavior according to Gogina and Zettler (2010) for statistical analyses on stable isotope data. We identified four groups in the Fehmarnbelt area, i.e. filter feeders (dominated by A. islandica), polychaete omnivores (unidentified polychaete species), epifauna omnivores (dominated by Carcinus maenas and Psammechinus miliaris), and scavengers (dominated by Ophiura albida), and five groups on the Odra Bank, i.e. filter feeders (dominated by Cerastoderma edule and Mytilus edulis), polychaete omnivores (unidentified polychaete species), epifauna omnivores (dominated by Crangon crangon), detritivores (Gammarus species) and grazers (Peringia ulvae). The list of species per group is shown in Supplementary Table 2.
2.5.2 Stable isotopes mixing models
The combination of classical stomach content analyses and stable isotope analysis provide complementary information about trophic ecology of consumers (e.g. Sturbois et al. (2022)) and allows a more complete picture of the fish diet. To provide an estimate of the relative contribution of food sources assimilated by each fish species, we used Bayesian mixing models from the MixSIAR package (Stock et al., 2018) in R (R Core Team, 2018). Separate mixing models were run for each area (i.e., Fehmarnbelt and Odra Bank) using the groups of invertebrate species as food sources. They were only caught on the Odra Bank. As mysids are an important food source for many fish species in the Baltic Sea (Ustups et al., 2016), and as they are present in the Fehmarnbelt area (Zettler and Gosselck, 2006), we included mysids as food source in the mixing models for the Fehmarnbelt area, using their δ13C and δ15N values from the Odra Bank, assuming that they had similar values between the two areas. This assumption is supported by the similar δ13C and δ15N values of both fractions of particulate organic matter (POM) in the Fehmarnbelt area and on the Odra Bank (Supplementary Table 3). The small fraction of POM (<55μm) represents the base of the food web, and the bigger fraction of POM (55-200μm) mainly consisted of zooplankton (Supplementary Data).
We run separate models for fish<10cm (whole individuals) and fish ≥10cm (muscle tissue), as the trophic fractionation factors between food sources and consumers can vary between tissues (Sweeting et al., 2007). Fractionation factors between invertebrates and fish were assumed to be 3.2 ± 1.3‰ for muscle tissue and 2.9 ± 1.8‰ for whole individuals for δ15N (Sweeting et al., 2007) and 0.4 ± 1.30‰ for both muscle tissue and whole individuals for δ13C (Kiljunen et al., 2020).
2.5.3 Community-wide trophic indices
All trophic indices based on stable isotopes were calculated using the Stable Isotope Bayesian Ellipses in R (SIBER) package (Jackson et al., 2019) in R (R Core Team, 2018). These indices were proposed by Layman et al. (2007a) and adapted by (Jackson et al., 2011) for calculation using Bayesian statistical approach. The indices were calculated with 105 iterations from the Markov chain Monte Carlo (MCMC) simulation (Jackson et al., 2011), the mode and 50%, 75% and 95% confidence intervals of each index are reported. To compare the indices between sites, we calculated the proportion, and therefore the probability, of their Bayesian posterior distribution at one site to be smaller (or bigger) than at the other site. We consider tendencies between sites when the probability of the posterior distribution of one index to be different between sites was between 75% and 95%. We considered significant differences between sites when the probability was >95%. The indices include: 1. the sample size corrected standard ellipse area (SEAc in ‰2), 2. the mean percentage overlap of SEAc within each fish community, 3. δ15N range, 4. δ13C range, 5. mean distance to centroid (CD), 6. mean nearest neighbor distance (MNND), 7. standard deviation of the nearest neighbor distance (SDNND).
We used the SEAc as a measure of the mean core isotopic niche width of the entire fish community (Supplementary Figure 1A), and of each fish species separately (Supplementary Figure 2), in the Fehmarnbelt area and on the Odra Bank. SEAc is not influenced by extreme values or samples sizes (Jackson et al., 2011), allowing robust comparison between sites. To have a measure of the diet overlap between species in the fish community, we calculated the mean percentage of overlap between all the standard ellipses of fish species (Mean%Overlap; Eq. 1), in the Fehmarnbelt area and on the Odra Bank. Generally, high diet overlap indicates high trophic redundancy (Layman et al., 2007a).
With %OverlapEllipses1.2 = percentage of overlap between the ellipse of species 1 and the ellipse of species 2, %OverlapEllipses1.3 = percentage of overlap between the ellipse of species 1 and the ellipse of species 3 and so on, for all the two-by-two combinations possible within each fish community (i.e., in the Fehmarnbelt area and on the Odra Bank), N = number of possible combinations.
We calculated the δ15N and δ13C ranges, CD, MNND and SDNND for the entire fish community at both sites. The δ15N range provides information on the trophic length of the community. The δ13C range gives an estimate of niche diversification at the base of the food web (Jackson et al., 2011). The CD is the average Euclidean distance of each species to the δ13C – δ15N centroid, which is calculated as the mean δ13C and δ15N value for all species in the food web. The CD is a measure of the average degree of trophic diversity (Layman et al., 2007a; Jackson et al., 2011). The MNND is the mean of the Euclidean distances to each species’ nearest neighbor in the δ13C – δ15N bi-plot space and is a measure of the overall density of species packing. The SDNND is the standard deviation of the Euclidean distances to each species’ nearest neighbor in δ13C – δ15N bi-plot space, and can be used to infer population trophic evenness (Jackson et al., 2012): low SDNND values suggest more even distribution and higher redundancy in trophic niches (Layman et al., 2007a; Jackson et al., 2011).
As the isotopic values of consumers depends on those of dietary items, conclusions about consumer trophic niches drawn from isotopic niches are influenced by the variability in isotopic values of available food sources (Newsome et al., 2007; Hoeinghaus and Zeug, 2008). To meaningfully compare the fish trophic indices between the Fehmarnbelt area and the Odra Bank accounting for isotopic variability in the prey items, we standardized the fish indices using the benthic invertebrate trophic indices, following the approach of Warry et al. (2016). We divided the SEAc of the entire fish community (SEAc.fish; Supplementary Figure 1A) and the SEAc of the two fish species occurring at both sites (P. platessa and P. minutus) by the SEAc of the entire benthic invertebrate community (SEAc.invert; Supplementary Figure 1A). We divided the δ15N and δ13C ranges of the fish community (Supplementary Figure 1B) by the δ15N and δ13C ranges of the benthic invertebrate community (Supplementary Figure 1C). We divided the CD, MNND and SDNND indices of the fish communities by the square root of SEAc of benthic invertebrate community to maintain common units in the numerator and denominator (Warry et al., 2016).
In addition, δ13C and δ15N values represent two different aspects of trophic structure, i.e., the relative importance of basal sources and trophic position, respectively, and should have equal weighting when combined in trophic indices describing the overall trophic structure of a food web (Hoeinghaus and Zeug, 2008). Thus, to avoid over- or underweighting of one of the two isotopic ratios, δ13C and δ15N values were scaled using z-transformation before calculation of the indices based on Euclidian distances, i.e., CD, NND and SDNND, as advised by Cornwell et al. (2006) and Hoeinghaus and Zeug (2008).
3 Results
3.1 Fish diet in spring-early summer assessed from stomach content analyses
In the Fehmarnbelt area, the diet assessed from stomach content analyses of most fish species consisted of multiple prey species (Figure 2A). Bivalves had the highest occurrence in the stomach of the most abundant flat fish, Limanda limanda (39.5%) and Pleuronectes platessa (52.6%), followed by gastropods, crustaceans, polychaetes, Ophiuroidea and plant detritus (Figure 2A). Lumpenus lampretaeformis, Zoarces viviparus and Pomatoschistus minutus had similar diverse diets, with bivalves having the highest occurrence (30.8 to 50.1%), followed by crustaceans (25.6% to 37.6%; Figure 2A). The diet of Merlangius merlangus consisted of bivalves, the gastropod, crustaceans, polychaetes, nematodes and plant detritus (Figure 2A). The diet of the flat fish A. laterna <10cm and G. morhua <10cm consisted only of crustaceans, with a clear dominance of mysids (80%) followed by copepods (20%) in the diet of G. morhua <10 cm (Figure 2A).

Figure 2 Percentage (%) of occurrence of prey species in the stomach of benthic and demersal fish from the Fehmarnbelt area (A) and the Odra Bank (B) in spring-early summer 2020; The full species names are listed in Supplementary Table 1.
On the Odra Bank, the diet of all fish species (i.e., Platichthys flesus ≥10cm, P. platessa ≥10cm and P. minutus <10cm) assessed from stomach content analyses, consisted of a wide range of prey species with relatively similar occurrence (Figure 2B). Bivalves, such as M. edulis, had the highest occurrence in the diet of P. flesus ≥10cm (36.7%), followed by multiple species of crustaceans (25.9%), gastropods (17.6%), and polychaetes (13.6%; Figure 2B). Gastropods had the highest occurrence in the diet of P. platessa ≥10cm (35.4%), followed by bivalves (25.1%) and polychaetes (20.8%; Figure 2B). Polychaetes had the highest occurrence in the diet of P. minutus (37.5%), followed by crustaceans (25.0%), bivalves, gastropods, crustaceans and Bryozoa (Figure 2B).
The diet of P. platessa ≥10cm and P. minutus <10cm differed between the Fehmarnbelt and the Odra Bank. The diet of P. platessa ≥10cm was dominated by bivalves in the Fehmarnbelt area and by gastropods on the Odra Bank (Figures 2A, B). The diet of P. minutus <10cm was dominated by bivalves in the Fehmarnbelt area and by polychaetes on the Odra Bank (Figures 2A, B).
3.2 Stable isotope composition of benthic invertebrate and fish
The range of δ13C values of benthic invertebrate groups was 6.3‰, from –21.5 ± 1.1‰ (filter feeders) to –15.2 ± 2.2‰ (scavengers) in the Fehmarnbelt area (Figure 3A) and 3.0‰ from –23.5 ± 0.6‰ (filter feeders) to –20.5 ± 1.6‰ (epifauna omnivores) on the Odra Bank (Figure 3B). The range of δ15N values of benthic invertebrate groups was 2.0‰ from 8.8 ± 0.7‰ (filter feeders) to 10.8 ± 0.7‰ (epifauna omnivores) in the Fehmarnbelt area (Figure 3A) and 4.6‰ from 4.2 ± 0.8‰ (grazers) to 8.8 ± 1.9‰ (epifauna omnivores) on the Odra Bank (Figure 3B).
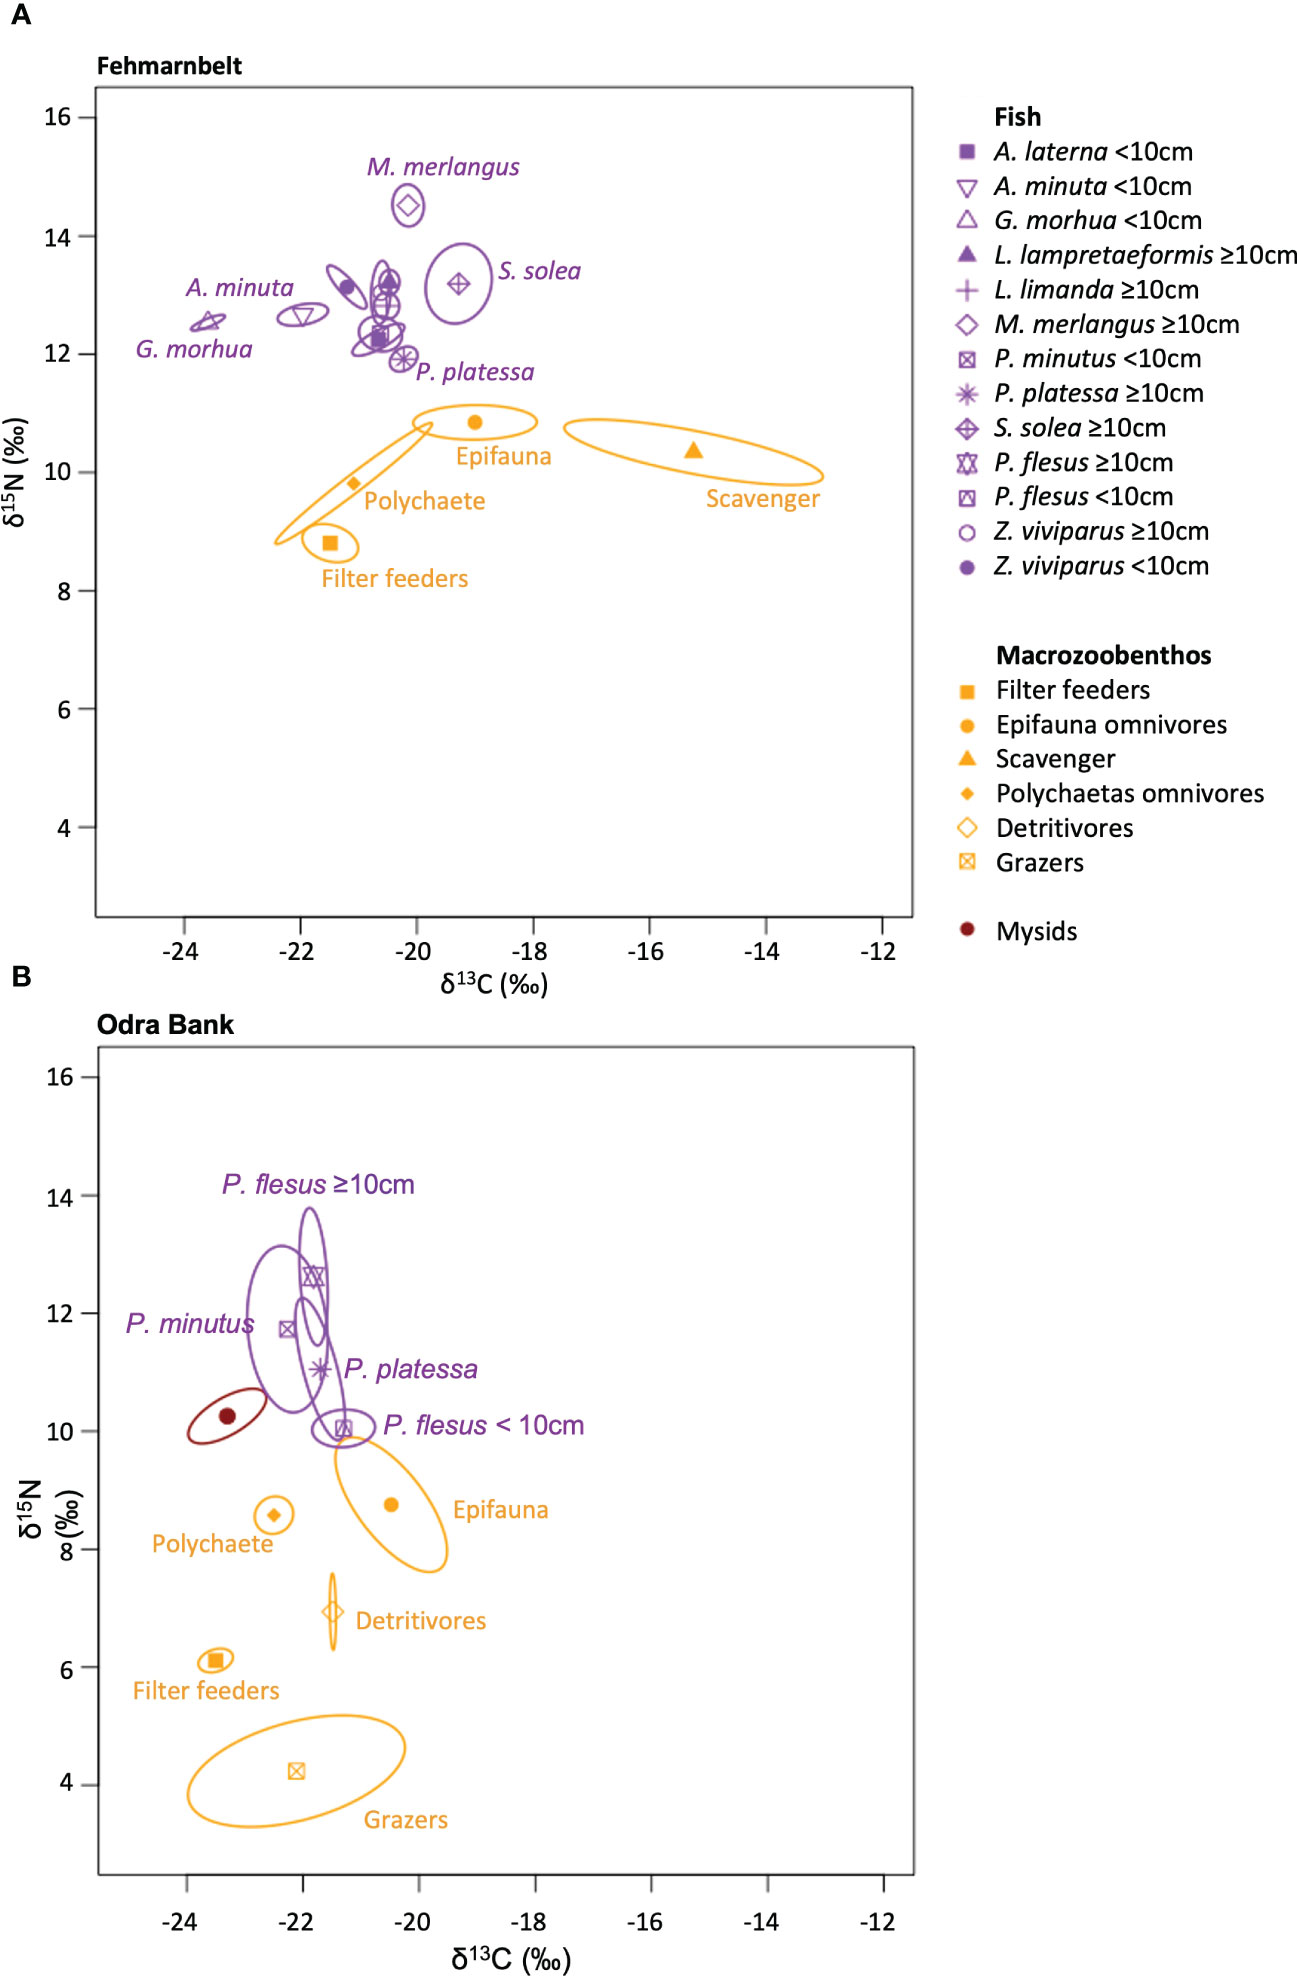
Figure 3 Stable isotope bi-plots for (A) Fehmarnbelt and (B) Odra Bank, illustrating the isotopic niche of invertebrate groups and fish species. The symbols represent the mean of each invertebrate groups and fish species. The lines enclose the small sample size corrected standard ellipse area (SEAc) for each invertebrate groups and fish species. The full species names are listed in Supplementary Table 2.
The range of δ13C values of fish was 4.3‰ from –23.6 ± 0.3‰ (G. morhua <10cm) to –19.3 ± 0.5‰ (S. solea ≥10cm) in the Fehmarnbelt area (Figure 3A) and 1.0‰ from –22.3 ± 0.9‰ (P. minutus<10cm) to –21.3 ± 0.5‰ (P. flesus <10cm) on the Odra Bank (Figure 3B). The range of δ15N values of fish was 2.6‰, from 14.5 ± 0.4‰ (M. merlangus ≥10cm) to 11.9 ± 0.3‰ (P. platessa ≥10cm), in the Fehmarnbelt area (Figure 3A) and 2.6‰ from 12.6 ± 1.8‰ (P. flesus ≥10cm) to 10.0 ± 0.3‰ (P. flesus <10cm) on the Odra Bank (Figure 3B).
3.3 Fish diet assessed with stable isotopes
Overall, the diet of most fish species in the Fehmarnbelt area consisted of a mixture of epifauna omnivores, filter feeders, polychaete omnivores, scavengers, and mysids (Figure 4A). Filter feeders, mainly consisting of bivalves (Supplementary Table 2), dominated the diet of the two most abundant flat fish, L. limanda ≥10cm (46.4 ± 9.5%) and P. platessa ≥10cm (73.1 ± 7.4%), and of P. minutus <10cm (62.1 ± 11.9%; Figure 4A). Mysids dominated the diet of G. morhua <10cm (84.8 ± 7.4%; Figure 4A).
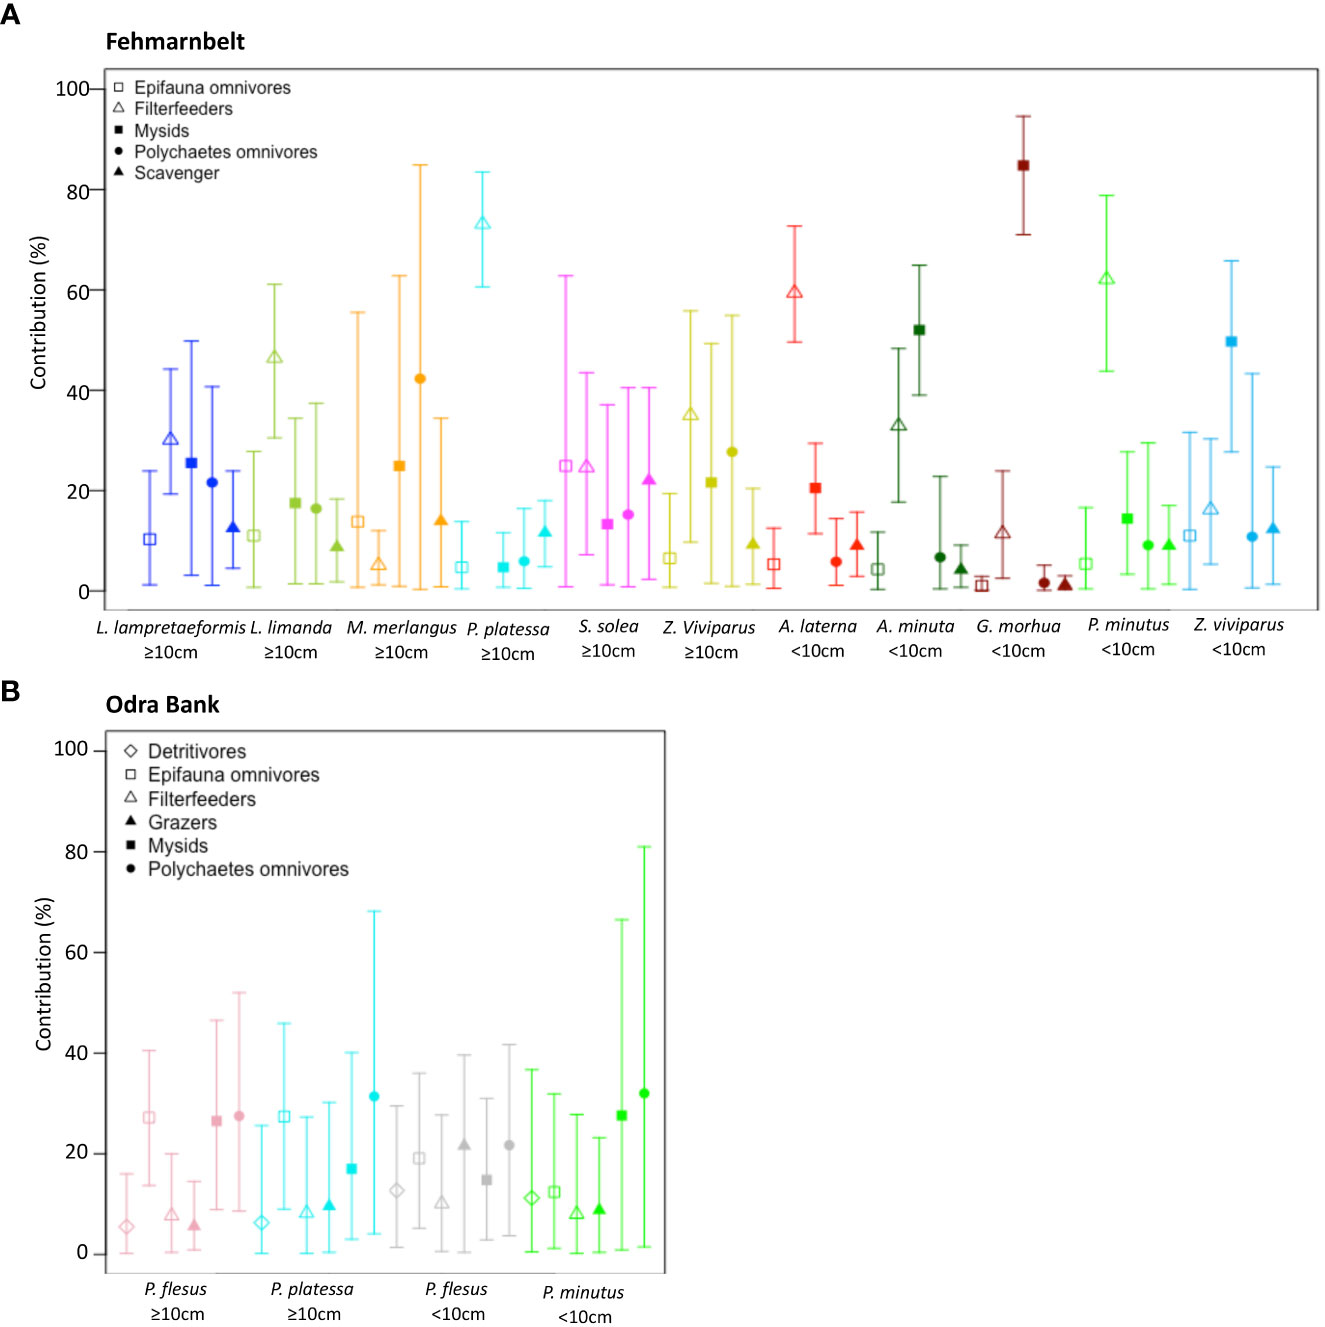
Figure 4 Mean and 95% confidence interval of the contribution of invertebrate groups to the diet of fish in (A) the Fehmarnbelt and (B) the Odra Bank, estimated from δ13C and δ15N values using the MixSIAR package. The full species names are listed in Supplementary Table 2.
Generally, all fish species on the Odra Bank had a more mixed diet than those in the Fehmarnbelt area (Figures 4A, B). The diet of the two flat fish species P. flesus ≥10cm and P. platessa ≥10cm, the goby P. minutus <10cm was a mixture of polychaete omnivores (27.5 ± 13.2%, 31.4 ± 20.1% and 32.0 ± 27.3%, respectively), epifauna omnivores (27.2 ± 8.3%, 27.4 ± 11.3% and 12.4 ± 10.6%, respectively), mysids (26.5 ± 11.5%, 17.0 ± 11.7% and 27.6 ± 22.0%, respectively), with grazers, filter feeders and detritivores contributing to ~10% (Figure 4B). Contrary to the Fehmarnbelt area, filter feeders had low contribution to the fish diets on the Odra Bank, from 7.7 ± 6.4% to the diet of P. flesus ≥10cm to 10.1 ± 8.7% to the diet of P. flesus <10cm (Figure 4B).
3.4 Trophic indices
The standardized trophic niche width of the total fish community (SEAc.fish/SEAc.invert) tended to be smaller in the Fehmarnbelt area than on the Odra Bank (89.6% probability; Figure 5A). The standardized trophic niche widths of P. minutus <10cm and P. platessa ≥10cm, which are the only fish species caught at both sites, were significantly smaller (>95% probability) in the Fehmarnbelt area (mode SEAc<1‰2 for both species) than on the Odra Bank (CI95%: 2.3 to 9.5‰2 for P. minutus; CI95%: 1.0 to 3.9‰2 for P. platessa; Figure 5B). Overall, the trophic niche widths of benthic and demersal fish species from the Fehmarnbelt area were smaller than those from the Odra Bank (Supplementary Figure 2A, B). In the Fehmarnbelt area, most of the fish species had similar trophic niche widths ranging from 0.1 to 1.2‰2 (Supplementary Figure 2A). On the Odra Bank, the trophic niche width of P. minutus <10cm was the largest (CI95%: 2.3 to 9.5‰2) and the trophic niche width of P. flesus <10cm was the smallest (CI95%: 0 to 1‰2; Supplementary Figure 2B).
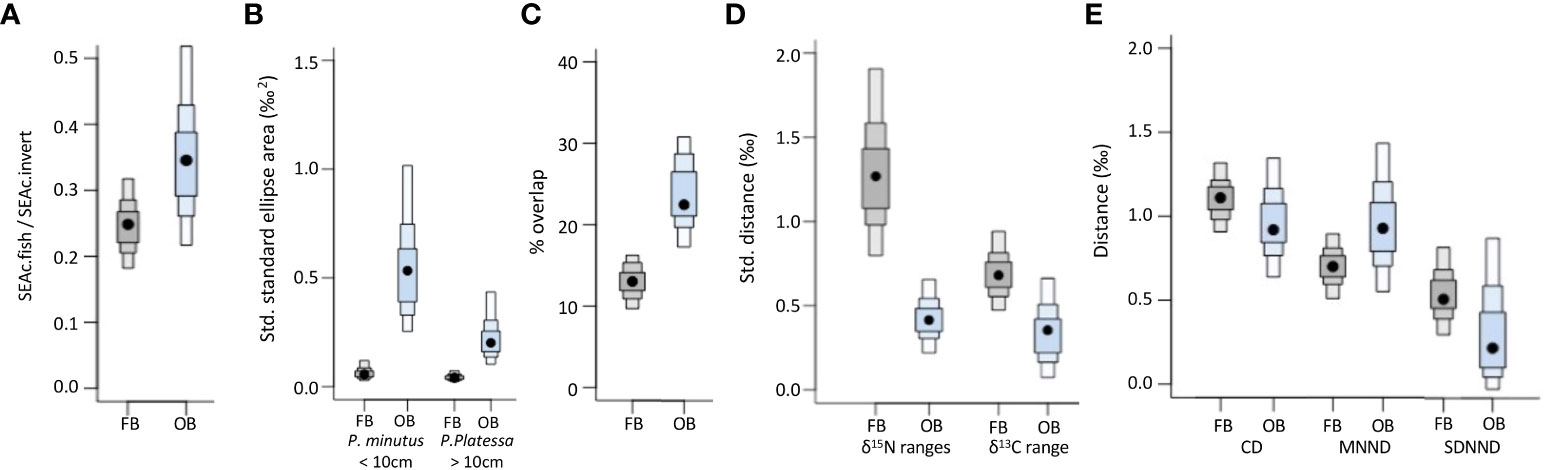
Figure 5 Community-wide trophic indices (mode and 50%, 75% and 95% confidence intervals) for the Fehmarnbelt (FB, in grey) and Odra Bank (OB, in blue). (A) Ratio between the total standard ellipse area (SEAc) of the fish community (SEAc.fish) and the total SEAc of the benthic invertebrate community (SEAc.invert); (B) Standardised standard ellipse areas for the two species occurring in both the Fehmarnbelt and Odra Bank; (C) Mean percentage (%) of overlap of standard ellipse areas; (D) d15N and d13C ranges of the fish community standardised by the total d15N and d13C range of the benthic invertebrate community; (E) Standardised mean distance to centroid (CD), standardised mean nearest neighbor distance (MNND), and standardised standard deviation of the nearest neighbor distance (SDNND) calculated on the scaled isotopic data of the fish community.
The average proportion of overlap between the standard ellipses of fish species was significantly higher (with >95% probability) on the Odra Bank (23.4%) than in the Fehmarnbelt area (13.2%; Figure 5C). In the Fehmarnbelt area, six species, i.e., P. platessa ≥10cm, S. solea ≥10cm, Aphia minuta <10cm, Z. viviaprus <10cm, M. merlangus ≥10cm and G. morhua<10cm, showed standard ellipses which did not overlap with any of the other fish species (Figure 3A). On the Odra Bank, the standard ellipse of each fish species overlapped with the standard ellipse of at least one other fish species (Figure 3B).
Both the standardized δ15N and δ13C ranges of the fish community were significantly higher (>95% probability) in the Fehmarnbelt area (1.3‰ and 0.7‰, respectively) than on the Odra Bank (0.4‰ and 0.4‰, respectively; Figure 5D). When not standardized, the δ15N range of the fish community was similar in the Fehmarnbelt area and on the Odra Bank (Supplementary Figure 1B), whereas the δ15N range of the benthic invertebrate community was significantly lower (>95% probability) in the Fehmarnbelt area than on the Odra Bank (Supplementary Figure 1C).
The standardized CD and standardized SDNND calculated on scaled δ15N and δ13C values tended to be higher (87.2% and 77.1% probability, respectively) in the Fehmarnbelt area (0.34‰ and 0.17‰, respectively) than on the Odra Bank (0.27‰ and 0.11‰, respectively; Figure 5E). The standardized MNND calculated on scaled δ15N and δ13C values did not differ between sites (Figure 5E).
4 Discussion
4.1 Fish diet
The fish diets assessed with stomach contents represented a snapshot of the ingested prey items at the time of sampling between the 23rd of May and the 20th of July. In contrast, the half-life of fish muscle tissue being estimated to be one to three months (Buchheister and Latour, 2010; Winter et al., 2019), the stable isotopes reflected the fish diet assimilated between March and July. Overall, fish diets assessed with stomach contents concur with fish diets estimated with mixed models based on the stable isotope compositions. For example, the high occurrence of mysids in the diet of the demersal small cod (G. morhua<10cm) in the Fehmarnbelt area inferred from stomach contents was confirmed by stable isotope results, and supports the importance of pelagic crustaceans in the diet of small cods (Sparholt, 1994). The high proportion of filter feeders in the diet of several “true” benthic fish species, such as L. limanda, P. platessa, and P. minutus from the Fehmarnbelt area, compared to the Odra Bank found using stable isotopes was supported by the high occurrence of bivalves in the stomach of these fish species. The diet of the two fish species caught at both sites, i.e., P. platessa and P. minutus was dominated by bivalve filter feeders in the Fehmarnbelt area in both stomach contents and mixing models based on stable isotopes. The high proportion of polychaetes in the diet of P. minutus on the Odra Bank was also confirmed by both diet assessment methods. However, the high proportion of gastropods (mainly P. ulvae) in the diet of P. platessa on the Odra Bank observed in stomach content was not supported by mixing model based on stable isotope results, showing instead high proportion of polychaetes and epifauna omnivores (e.g., C. crangon). P. platessa in the Baltic Sea is generally assigned to the flat fish feeding group “polychaete and small crustacean feeders” (Link et al., 2005; Rau et al., 2019), which agrees with the results of the mixing model based on stable isotopes. The high occurrence of gastropods in fish stomach contents is likely an overestimation due to differences in digestibility of food items (Amundsen and Sánchez-Hernández, 2019), the shell of gastropods such as P. ulvae remaining longer in the fish stomach compared to soft tissue of polychaetes or chitin of crustaceans. The overall agreement between both diet assessment methods provides confidence in the stable isotope methods to further infer fish trophic relationships and benthic food web structure and functioning.
The diet of fish differed between the Fehmarnbelt area and the Odra Bank, confirming our prediction. The high contribution of filter feeders, consisting mainly of bivalves, to the diet of fish from the Fehmarnbelt area, is consistent with the high biomass of bivalves dominating the total biomass of the benthic invertebrate community in the Fehmarnbelt area (Darr et al., 2014), as it is energetically advantageous for fish to select large prey items (Norin and Clark, 2017). In contrast, the benthic invertebrate community in the Odra Bank is characterized by low biomass but high individual abundance of bivalves, gastropods, polychaetes and amphipods (Darr et al., 2014), which could explain the more mixed diet of fish on the Odra Bank, feeding on all available small but abundant prey items. Combined with the smaller isotopic niche width of individual fish species (Figure 5B, Supplementary Figure 2), and the smaller standardized isotopic niche of the entire fish community (Figure 5A) in the Fehmarnbelt area compared to the Odra Bank, these results show that fish on the Odra Bank are more generalist and feed on a wider variety of the available resources (Cummings et al., 2012) than in the Fehmarnbelt area, confirming our prediction. The trophic niche width increases when food resources become scarce, constraining the ability of the fish to choose preferential prey items (Wilson and Turelli, 1986; Bolnick, 2001; Svanbäck and Persson, 2004). The generalist behavior of fish on the Odra Bank is likely the result of scarcity in prey items, the benthic invertebrate community being species poor and having low biomass (Darr et al., 2014), preventing the fish to select large prey items as they can do in the Fehmarnbelt area.
4.2 Food web structure and functioning
The smaller overlapping area of isotopic niches in the Fehmarnbelt (Figure 5C) shows that the proportion of small benthic fish species having similar trophic ecologies, and thus the trophic redundancy, is lower in the Fehmarnbelt area than on the Odra Bank (Layman et al., 2007a), confirming our prediction. This is supported by the larger ranges of δ15N and δ13C values of fish in the Fehmarnbelt area (Figure 5D) suggesting respectively more trophic levels and more diversity in the exploited food sources, and thus lower trophic redundancy in the Fehmarnbelt area than on the Odra Bank (Jackson et al., 2011). The higher CD in the Fehmarnbelt area also indicates higher trophic diversity, and therefore lower trophic redundancy in the Fehmarnbelt area compared to the Odra Bank (Layman et al., 2007a; Jackson et al., 2011). This is supported by the lower SDNND on the Odra Bank which reflects more even distribution and lower diversity, and therefore higher trophic redundancy in the benthic and demersal fish community on the Odra Bank compared to the Fehmarnbelt area (Layman et al., 2007a; Jackson et al., 2011). Overall, all trophic indices concur, strongly suggesting that the trophic redundancy is higher, and conversely, that the trophic diversity is lower on the Odra Bank than in the Fehmarnbelt area.
4.3 Implication for food web resilience to perturbations
It is generally predicted that trophic generalists are less sensitive to perturbations because of their ability to shift among alternative food resources (Purvis et al., 2000). The presence of opportunistic generalist consumers relying on similar prey species increases the number of parallel trophic links in a food web, and thus the trophic redundancy (Saint-Béat et al., 2015), in turn increasing the food web resilience to perturbations (Baird et al., 2007; Sanders et al., 2018). This would suggest that the demersal and benthic fish food web on the Odra Bank has higher ability to cope with disturbances than the one in the Fehmarnbelt area. However, if anthropogenic impacts, such as mobile bottom trawling, reduce available resource pools to a certain tipping point, the extension of the fish species and/or community niche widths (Wilson and Turelli, 1986; Bolnick, 2001; Svanbäck and Persson, 2004) might no longer ensue in response to resource scarcity because prey choice is so constrained (Layman et al., 2007b). The food web of the Odra Bank, which is species-poor with low biomass, might thus not have buffering capacity to additional perturbations.
In the Fehmarnbelt area, the higher trophic diversity, shown by the higher standardized δ15N and δ13C ranges and the higher CD and SDNND, was partly driven by six fish species, whose trophic niches did not overlap with any other fish species (Figure 3A). These include four important commercial species, i.e., G. morhua, P. platessa, M. merlangus and S. solea. Our results highlight the importance of bivalve filter feeders as food source for the fish community, especially P. platessa, in the Fehmarnbelt area. Hard-bodied and large benthic invertebrates, such as bivalves, are generally assumed to be the most affected by mobile bottom trawling, which can induce a shift in the benthic community towards smaller and soft-bodied species (Kaiser et al., 2000; Duineveld et al., 2007). This suggests that potential negative impact of mobile bottom trawling on the biomass and abundance of bivalves in the Fehmarnbelt area might alter the functioning of the benthic food web, with stronger impact on fish species relying on bivalves, including commercially important species.
4.4 Isotopic variability in prey species
The range of δ15N values was higher in the benthic invertebrate community on the Odra Bank (4.6‰) than in the Fehmarnbelt area (2.0‰). The high δ15N range on the Odra Bank could be due to either, the benthic invertebrate community covering two trophic levels, if considering a trophic fractionation factor of ~3‰ (Post, 2002), or, and most likely, high variability in δ15N values of basal sources. δ15N values of basal sources in the coastal Baltic Sea are highly spatially and seasonally variable due to a combination of factors including availability of inorganic nitrogen, riverine versus marine influence and seasonal phytoplankton succession (Maksymowska et al., 2000; Lesutienė et al., 2014; Remeikaitė-Nikienė et al., 2017). Studies in the Curonian lagoon showed that the δ15N values of particulate organic matter (POM) potentially range within one year from –0.9 ‰ to 15.5 ‰ (Remeikaitė-Nikienė et al., 2017). The Odra Bank is seasonally influenced by the Oder River, supplying 15N-enriched nitrate (Voss et al., 2000). In addition, locally and temporally restricted blooms of N2-fixing cyanobacteria can lead to low δ15N values of POM down to 0.9 ‰ (Lesutienė et al., 2014). The high range of δ15N values in benthic invertebrates from the Odra Bank therefore likely reflects high variability in δ15N values of basal sources. The lower δ15N range in the Fehmarnbelt could be explained by its permanent exposure to saline and oxygen-rich waters, compared to the more riverine influenced Odra Bank. The higher range of δ13C values in the benthic invertebrate community in the Fehmarnbelt area (6.3‰) compared to that on the Odra Bank (3.0‰), suggests that benthic invertebrates in the Fehmarnbelt area rely on a higher diversity of food sources. This was mainly driven by the presence of Ophiura albida which has various modes of feeding (Boos and Franke, 2004). Further studies are needed to robustly constrain the temporal and spatial variability in stable isotope composition of basal sources, and better understand the functioning of trophic relationships within the benthic invertebrate community.
5 Conclusion
Here, we demonstrate that the difference in trophic behavior of benthic and demersal fish species between the two sites was mainly driven by differences in the characteristics of the prey communities. This suggests that the distribution of fish (species richness, biomass and abundance) between the Fehmarnbelt area and the Odra Bank, and potentially in the entire Baltic Sea (Frelat et al., 2018; Rau et al., 2019), is driven by food availability, and not only by salinity, which is likely an indirect driver through its influence on benthic prey communities (Darr et al., 2014). European Union member states with fishing interests in the area agreed in 2022 on measures excluding fishing with mobile bottom contacting gears in the five special areas of conservation (SAC) in the Baltic German exclusive economic zone (EEZ), including the Fehmarnbelt and the Odra Bank. The exclusion of mobile bottom trawling from the Fehmarnbelt and Odra Bank areas, which are both currently influenced by a combination of multiple anthropogenic stressors, is likely to have positive effects on food availability for fish, potentially enhancing fish biomass and production. This needs to be investigated further once this exclusion measure will have been implemented. To evaluate the efficiency of this conservation measures, benthic and demersal fish monitoring should be conducted monthly or seasonally, as the fish community, and thus the structure and functioning of the fish food web, might differ between seasons, this study investigating only the fish food web in spring-early summer. In addition, fish often connect different habitats (Kritzer et al., 2016), therefore additional food web studies looking at potential links between the different biotopes in the Fehmarnbelt and adjacent areas, and including larger and more mobile fish individuals, are needed to better understand the functioning of the food web on a larger spatial scale. Overall, our results demonstrate differences in the functioning and structure of the benthic fish food web between the Fehmarnbelt area and Odra Bank and can be used as a baseline for further studies assessing the effect of the exclusion of fisheries with mobile bottom contacting gears on the benthic food web structure and functioning in these two areas.
Data availability statement
The raw data supporting the conclusions of this article will be made available by the authors, without undue reservation.
Ethics statement
Ethical review and approval was not required for the animal study because our study present results on fish. As a federal fisheries research institute, the Thünen Institute of Baltic Sea Fisheries have the experience and permission for fishing within the study areas and is particularly committed to ethical values when dealing with living animals. The Thünen Institute follows the following fundamental principles: 1- keep the sampling effort to the minimum needed to accomplish the research tasks; 2- keep stress for the sampled animals as low as possible.
Author contributions
MP and HS designed the study. MP, MK, LK, and DO collected the samples. MP and LK analyzed the samples. CdlV performed the data and statistical analyses and wrote the first draft of the manuscript. MP, CvD, MK, DO, and HS contributed substantially to the revisions. All authors contributed to the article and approved the submitted version.
Funding
This work resulted from the DAM pilot mission “MGF-Ostsee” (03F0848B), funded by the German Federal Ministry of Education and Research (BMBF).
Acknowledgments
We thank the crew of FRV “Clupea” and FRV “Solea” for their support during the cruises, and Gaël Guillou for his help in the stable isotope lab in La Rochelle.
Conflict of interest
The authors declare that the research was conducted in the absence of any commercial or financial relationships that could be construed as a potential conflict of interest.
Publisher’s note
All claims expressed in this article are solely those of the authors and do not necessarily represent those of their affiliated organizations, or those of the publisher, the editors and the reviewers. Any product that may be evaluated in this article, or claim that may be made by its manufacturer, is not guaranteed or endorsed by the publisher.
Supplementary material
The Supplementary Material for this article can be found online at: https://www.frontiersin.org/articles/10.3389/fmars.2023.1143792/full#supplementary-material
References
[EEA] (2019). Marine messages II: navigating the course towards clean, healthy and productive seas through implementation of an ecosystem-based approach (Luxembourg: Publications Office of the European Union), 82. doi: 10.2800/71245
Amundsen P. A., Sánchez-Hernández J. (2019). Feeding studies take guts–critical review and recommendations of methods for stomach contents analysis in fish. J. Fish Biol. 95, 1364–1373. doi: 10.1111/jfb.14151
Baird D., Asmus H., Asmus R. (2007). Trophic dynamics of eight intertidal communities of the sylt-rømø bight ecosystem, northern wadden Sea. Mar. Ecol. Prog. Ser. 351, 25–41. doi: 10.3354/meps07137
Bearhop S., Adams C. E., Waldron S., Fuller R. A., MacLeod H. (2004). Determining trophic niche width: a novel approach using stable isotope analysis. J. Anim. Ecol. 73, 1007–1012. doi: 10.1111/j.0021-8790.2004.00861.x
Bird C. S., Veríssimo A., Magozzi S., Abrantes K. G., Aguilar A., Al-Reasi H., et al. (2018). A global perspective on the trophic geography of sharks. Nat. Ecol. Evol. 2, 299. doi: 10.1038/s41559-017-0432-z
Bolnick D. I. (2001). Intraspecific competition favours niche width expansion in drosophila melanogaster. Nature 410, 463–466. doi: 10.1038/35068555
Bonsdorff E. (2006). Zoobenthic diversity-gradients in the Baltic Sea: continuous post-glacial succession in a stressed ecosystem. J. Exp. Mar. Biol. Ecol. 330, 383–391. doi: 10.1016/j.jembe.2005.12.041
Boos K., Franke H.-D. (2004). Abundance and distribution of ophiuroids off helgoland, German bight (North sea). echinoderms: münchen (Leiden: AA Balkema Publishers), 157–158.
Boutton T. W. (1991). “Stable carbon isotope ratios of natural materials: II. atmospheric, terrestrial, marine and freshwater environments,” in Carbon isotope techniques. Ed. Fry D. C. C. B. (San Diego, CA: Academic Press), 173–186.
BSH (2016) Meeresbodensedimente im maßstab 1:100.000 in der deutschen ostsee - WMS. bundesamt für seeschifffahrt und hydrographie (BSH). Available at: https://www.geoseaportal.de/mapapps/resources/apps/sedimentverteilung_auf_dem_meeresboden/index.html?lang=en&stateId=df8ea853-9890-4f7e-8ea8-5398906f7e7b.
Buchheister A., Latour R. J. (2010). Turnover and fractionation of carbon and nitrogen stable isotopes in tissues of a migratory coastal predator, summer flounder (Paralichthys dentatus). Can. J. fish. Aquat. Sci. 67, 445–461. doi: 10.1139/F09-196
Bunn S. E., Loneragan N. R., Kempster M. A. (1995). Effects of acid washing on stable isotope ratios of c and n in penaid shrimp and seagrass: implications for food web studies using multiple stable isotopes. Limnol. Oceanogr. 40, 4. doi: 10.4319/lo.1995.40.3.0622
Collie J. S., Hall S. J., Kaiser M. J., Poiner I. R. (2000). A quantitative analysis of fishing impacts on shelf-sea benthos. J. Anim. Ecol. 69, 785–798. doi: 10.1046/j.1365-2656.2000.00434.x
Cornwell W. K., Schwilk D. W., Ackerly D. D. (2006). A trait-based test for habitat filtering: convex hull volume. Ecology 87, 1465–1471. doi: 10.1890/0012-9658(2006)87[1465:ATTFHF]2.0.CO;2
Cummings D. O., Buhl J., Lee R. W., Simpson S. J., Holmes S. P. (2012). Estimating niche width using stable isotopes in the face of habitat variability: a modelling case study in the marine environment. PLoS One 7, e40539. doi: 10.1371/journal.pone.0040539
Darr A., Gogina M., Zettler M. L. (2014). Functional changes in benthic communities along a salinity gradient–a western Baltic case study. J. Sea Res. 85, 315–324. doi: 10.1016/j.seares.2013.06.003
DeNiro M. J., Epstein S. (1978). Influence of diet on the distribution of carbon isotopes in animals. Geochim. Cosmochim. Acta 42, 495–506. doi: 10.1016/0016-7037(78)90199-0
Duineveld G. C., Bergman M. J., Lavaleye M. S. (2007). Effects of an area closed to fisheries on the composition of the benthic fauna in the southern north Sea. ICES J. Mar. Sci. 64, 899–908. doi: 10.1093/icesjms/fsm029
Eigaard O. R., Bastardie F., Breen M., Dinesen G. E., Hintzen N. T., Laffargue P., et al. (2016). Estimating seabed pressure from demersal trawls, seines, and dredges based on gear design and dimensions. ICES J. Mar. Sci. 73, i27–i43. doi: 10.1093/icesjms/fsw116
France R. (1995). Carbon-13 enrichment in benthic compared to planktonic algae: foodweb implications. Mar. Ecol. Prog. Ser. 124, 307–312. doi: 10.3354/meps124307
Frelat R., Orio A., Casini M., Lehmann A., Mérigot B., Otto S. A., et al. (2018). A three-dimensional view on biodiversity changes: spatial, temporal, and functional perspectives on fish communities in the Baltic Sea. ICES J. Mar. Sci. 75, 2463–2475. doi: 10.1093/icesjms/fsy027
Fry B., Anderson R. K., Entzeroth L., Bird J. L., Parker P. L. (1984). 13C enrichment and oceanic food web structure in the northwestern gulf of Mexico. Contrib. Mar. Sci. 27, 49–63.
Gogina M., Nygård H., Blomqvist M., Daunys D., Josefson A. B., Kotta J., et al. (2016). The Baltic Sea scale inventory of benthic faunal communities. ICES J. Mar. Sci. 73, 1196–1213. doi: 10.1093/icesjms/fsv265
Gogina M., Zettler M. L. (2010). Diversity and distribution of benthic macrofauna in the Baltic Sea: data inventory and its use for species distribution modelling and prediction. J. Sea Res. 64, 313–321. doi: 10.1016/j.seares.2010.04.005
Graham B. S., Koch P. L., Newsome S. D., McMahon K. W., Aurioles D. (2010). Using isoscapes to trace the movements and foraging behavior of top predators in oceanic ecosystems. Isoscapes. (Berlin, Germany: Springer), 299–318.
Gustafsson B. G., Schenk F., Blenckner T., Eilola K., Meier H., Müller-Karulis B., et al. (2012). Reconstructing the development of Baltic Sea eutrophication 1850–2006. Ambio 41, 534–548. doi: 10.1007/s13280-012-0318-x
Hiddink J. G., Jennings S., Kaiser M., Queirós A., Duplisea D., Piet G. (2006). Cumulative impacts of seabed trawl disturbance on benthic biomass, production, and species richness in different habitats. Can. J. Fish. Aquat. Sci. 63, 721–736. doi: 10.1139/f05-266
Hiddink J. G., Jennings S., Sciberras M., Bolam S. G., Cambiè G., McConnaughey R. A., et al. (2019). Assessing bottom trawling impacts based on the longevity of benthic invertebrates. J. Appl. Ecol. 56, 1075–1084. doi: 10.1111/1365-2664.13278
Hiddink J. G., Jennings S., Sciberras M., Szostek C. L., Hughes K. M., Ellis N., et al. (2017). Global analysis of depletion and recovery of seabed biota after bottom trawling disturbance. Proc. Natl. Acad. Sci. 114, 8301–8306. doi: 10.1073/pnas.1618858114
Hoeinghaus D. J., Zeug S. C. (2008). Can stable isotope ratios provide for community-wide measures of trophic structure? Comment. Ecol. 89, 2353–2357. doi: 10.1890/07-1143.1
IPCC (2019). “Summary for policymakers,” in IPCC special report on the ocean and cryosphere in a changing climate. Eds. Pörtner H.-O., Roberts D. C., Masson-Delmotte V., Zhai P., Tignor M., Poloczanska E., et al Available online: https://www.ipcc.ch/srocc/
Jackson M. C., Donohue I., Jackson A. L., Britton J. R., Harper D. M., Grey J. (2012). Population-level metrics of trophic structure based on stable isotopes and their application to invasion ecology. PloS One 7, e31757. doi: 10.1371/journal.pone.0031757
Jackson A. L., Inger R., Parnell A. C., Bearhop S. (2011). Comparing isotopic niche widths among and within communities: SIBER–stable isotope Bayesian ellipses in r. J. Anim. Ecol. 80, 595–602. doi: 10.1111/j.1365-2656.2011.01806.x
Kabel K., Moros M., Porsche C., Neumann T., Adolphi F., Andersen T. J., et al. (2012). Impact of climate change on the Baltic Sea ecosystem over the past 1,000 years. Nat. Climate Change 2, 871–874. doi: 10.1038/nclimate1595
Kaiser M., Clarke K., Hinz H., Austen M. C., Somerfield P. J., Karakassis I. (2006). Global analysis of response and recovery of benthic biota to fishing. Mar. Ecol. Prog. Ser. 311, 1–14. doi: 10.3354/meps311001
Kaiser M. J., Collie J. S., Hall S. J., Jennings S., Poiner I. R. (2002). Modification of marine habitats by trawling activities: prognosis and solutions. Fish Fish. 3, 114–136. doi: 10.1046/j.1467-2979.2002.00079.x
Kaiser M. J., Ramsay K., Richardson C., Spence F., Brand A. (2000). Chronic fishing disturbance has changed shelf sea benthic community structure. J. Anim. Ecol. 69, 494–503. doi: 10.1046/j.1365-2656.2000.00412.x
Keeley J. E., Sandquist D. (1992). Carbon: freshwater plants. Plant Cell Environ. 15, 1021–1035. doi: 10.1111/j.1365-3040.1992.tb01653.x
Kiljunen M., Peltonen H., Lehtiniemi M., Uusitalo L., Sinisalo T., Norkko J., et al. (2020). Benthic-pelagic coupling and trophic relationships in northern Baltic Sea food webs. Limnol. Oceanogr. 65, 1706–1722. doi: 10.1002/lno.11413
Kritzer J. P., DeLucia M.-B., Greene E., Shumway C., Topolski M. F., Thomas-Blate J., et al. (2016). The importance of benthic habitats for coastal fisheries. BioScience 66, 274–284. doi: 10.1093/biosci/biw014
Layman C. A., Arrington D. A., Montaña C. G., Post D. M. (2007a). Can stable isotope ratios provide for community-wide measures of trophic structure? Ecology 88, 42–48. doi: 10.1890/0012-9658(2007)88[42:CSIRPF]2.0.CO;2
Layman C. A., Quattrochi J. P., Peyer C. M., Allgeier J. E. (2007b). Niche width collapse in a resilient top predator following ecosystem fragmentation. Ecol. Lett. 10, 937–944. doi: 10.1111/j.1461-0248.2007.01087.x
Leppäranta M., Myrberg K. (2009). Physical oceanography of the Baltic Sea (Chichester: Praxis Publishing Ltd).
Lesutienė J., Bukaveckas P. A., Gasiūnaitė Z. R., Pilkaitytė R., Razinkovas-Baziukas A. (2014). Tracing the isotopic signal of a cyanobacteria bloom through the food web of a Baltic Sea coastal lagoon. Estuarine Coast. Shelf Sci. 138, 47–56. doi: 10.1016/j.ecss.2013.12.017
Link J. S., Fogarty M. J., Langton R. W. (2005). The trophic ecology of flatfishes. In: Gibson RN (ed) Flatfishes: biology and exploitation. Fish Aquat. Resour. Ser. 9, Blackwell Publishing, Oxford, p 164–184.
Maksymowska D., Richard P., Piekarek-Jankowska H., Riera P. (2000). Chemical and isotopic composition of the organic matter sources in the gulf of gdansk (Southern Baltic Sea). Estuarine Coast. Shelf Sci. 51, 585–598. doi: 10.1006/ecss.2000.0701
McMahon K. W., Hamady L. L., Thorrold S. R. (2013). A review of ecogeochemistry approaches to estimating movements of marine animals. Limnol. Oceanogr. 58, 697–714. doi: 10.4319/lo.2013.58.2.0697
Möllmann C. (2019). Effects of climate change and fisheries on the marine ecosystem of the Baltic Sea. Oxford Res. Encyclo. Climate Sci. (ed. Möllmann C.) (University Press). doi: 10.1093/acrefore/9780190228620.013.682
Newsome S. D., Martinez del Rio C., Bearhop S., Phillips D. L. (2007). A niche for isotopic ecology. Front. Ecol. Environ. 5, 429–436. doi: 10.1890/1540-9295(2007)5[429:ANFIE]2.0.CO;2
Nielsen J. R., Vastenhoud B. M., Bossier S., Møhlenberg F., Christensen A., Diekman R., et al. (2022). Impacts of habitat-specific benthic fishing compared to those of short-term induced variability by environmental drivers in a turbulent Baltic Sea environment. Fish. Res. 257, 106514. doi: 10.1016/j.fishres.2022.106514
Norin T., Clark T. D. (2017). Fish face a trade-off between ‘eating big’for growth efficiency and ‘eating small’to retain aerobic capacity. Biol. Lett. 13, 20170298. doi: 10.1098/rsbl.2017.0298
Ojaveer H., Jaanus A., MacKenzie B. R., Martin G., Olenin S., Radziejewska T., et al. (2010). Status of biodiversity in the Baltic Sea. PloS One 5, e12467. doi: 10.1371/journal.pone.0012467
Pinnegar J., Polunin N. (1999). Differential fractionation of δ13C and δ15N among fish tissues: implications for the study of trophic interactions. Funct. Ecol. 13, 225–231. doi: 10.1046/j.1365-2435.1999.00301.x
Pitcher C. R., Ellis N., Jennings S., Hiddink J. G., Mazor T., Kaiser M. J., et al. (2017). Estimating the sustainability of towed fishing-gear impacts on seabed habitats: a simple quantitative risk assessment method applicable to data-limited fisheries. Methods Ecol. Evol. 8, 472–480. doi: 10.1111/2041-210X.12705
Post D. M. (2002). Using stable isotopes to estimate trophic position: models, methods, and assumptions. Ecology 83, 703–718. doi: 10.1890/0012-9658(2002)083[0703:USITET]2.0.CO;2
Purvis A., Gittleman J. L., Cowlishaw G., Mace G. M. (2000). Predicting extinction risk in declining species. Proc. R. Soc. London. Ser. B: Biol. Sci. 267, 1947–1952. doi: 10.1098/rspb.2000.1234
Rau A., Lewin W.-C., Zettler M. L., Gogina M., von Dorrien C. (2019). Abiotic and biotic drivers of flatfish abundance within distinct demersal fish assemblages in a brackish ecosystem (western Baltic Sea). Estuarine Coast. Shelf Sci. 220, 38–47. doi: 10.1016/j.ecss.2019.02.035
Rau G. H., Mearns A. J., Young D. R., Olson R. J., Schafer H. A., Kaplan I. R. (1983). Animal C/C correlates with trophic level in pelagic food webs. Ecology 64, 1314–1318. doi: 10.2307/1937843
Remeikaitė-Nikienė N., Lujanienė G., Malejevas V., Barisevičiūtė R., Zilius M., Vybernaitė-Lubienė I., et al. (2017). Assessing nature and dynamics of POM in transitional environment (the curonian lagoon, SE Baltic Sea) using a stable isotope approach. Ecol. Indic. 82, 217–226. doi: 10.1016/j.ecolind.2017.06.035
Reusch T. B., Dierking J., Andersson H. C., Bonsdorff E., Carstensen J., Casini M., et al. (2018). The Baltic Sea as a time machine for the future coastal ocean. Sci. Adv. 4, eaar8195. doi: 10.1126/sciadv.aar8195
R Core Team. (2018). R: A language and environment for statistical computing (Vienna: R foundation for statistical computing). Available at: https://www.R-project.org/.
Saint-Béat B., Baird D., Asmus H., Asmus R., Bacher C., Pacella S. R., et al. (2015). Trophic networks: how do theories link ecosystem structure and functioning to stability properties? A review. Ecol. Indic. 52, 458–471. doi: 10.1016/j.ecolind.2014.12.017
Sanders D., Thébault E., Kehoe R., Frank van Veen F. (2018). Trophic redundancy reduces vulnerability to extinction cascades. Proc. Natl. Acad. Sci. 115, 2419–2424. doi: 10.1073/pnas.1716825115
Schiele K. S., Darr A., Zettler M. L. (2014). Verifying a biotope classification using benthic communities–an analysis towards the implementation of the European marine strategy framework directive. Mar. pollut. Bull. 78, 181–189. doi: 10.1016/j.marpolbul.2013.10.045
Silberberger M. J., Renaud P. E., Kröncke I., Reiss H. (2018). Food-web structure in four locations along the European shelf indicates spatial differences in ecosystem functioning. Front. Mar. Sci. 5. doi: 10.3389/fmars.2018.00119
Stock B. C., Jackson A. L., Ward E. J., Parnell A. C., Phillips D. L., Semmens B. X. (2018). Analyzing mixing systems using a new generation of Bayesian tracer mixing models. PeerJ 6, e5096. doi: 10.7717/peerj.5096
Sturbois A., Cozic A., Schaal G., Desroy N., Riera P., Le Pape O., et al. (2022). Stomach content and stable isotope analyses provide complementary insights into the trophic ecology of coastal temperate bentho-demersal assemblages under environmental and anthropogenic pressures. Mar. Environ. Res. 182, 105770. doi: 10.1016/j.marenvres.2022.105770
Svanbäck R., Persson L. (2004). Individual diet specialization, niche width and population dynamics: implications for trophic polymorphisms. J. Anim. Ecol. 73, 973–982. doi: 10.1111/j.0021-8790.2004.00868.x
Sweeting C., Barry J., Barnes C., Polunin N., Jennings S. (2007). Effects of body size and environment on diet-tissue δ15N fractionation in fishes. J. Exp. Mar. Biol. Ecol. 340, 1–10. doi: 10.1016/j.jembe.2006.07.023
Tieszen L. L., Boutton T. W., Tesdahl K. G., Slade N. A. (1983). Fractionation and turnover of stable carbon isotopes in animal tissues: implications for δ13C analysis of diet. Oecologia 57, 32–37. doi: 10.1007/BF00379558
Tomczak M. T., Szymanek L., Pastuszak M., Grygiel W., Zalewski M., Gromisz S., et al. (2016). Evaluation of trends and changes in the gulf of gdańsk ecosystem–an integrated approach. Estuaries coasts 39, 593–604. doi: 10.1007/s12237-015-0026-4
Ustups D., Bergström U., Florin A., Kruze E., Zilniece D., Elferts D., et al. (2016). Diet overlap between juvenile flatfish and the invasive round goby in the central Baltic Sea. J. Sea Res. 107, 121–129. doi: 10.1016/j.seares.2015.06.021
van Denderen P. D., van Kooten T., Rijnsdorp A. D. (2013). When does fishing lead to more fish? community consequences of bottom trawl fisheries in demersal food webs. Proc. R. Soc. B: Biol. Sci. 280, 20131883. doi: 10.1098/rspb.2013.1883
Vander Zanden M. J., Clayton M. K., Moody E. K., Solomon C. T., Weidel B. C. (2015). Stable isotope turnover and half-life in animal tissues: a literature synthesis. PloS One 10, e0116182. doi: 10.1371/journal.pone.0116182
Voss M., Larsen B., Leivuori M., Vallius H. (2000). Stable isotope signals of eutrophication in Baltic Sea sediments. J. Mar. Syst. 25, 287–298. doi: 10.1016/S0924-7963(00)00022-1
Warry F. Y., Reich P., Cook P. L., Mac Nally R., Thomson J. R., Woodland R. J. (2016). Nitrogen loads influence trophic organization of estuarine fish assemblages. Funct. Ecol. 30, 1723–1733. doi: 10.1111/1365-2435.12647
Wilson D. S., Turelli M. (1986). Stable underdominance and the evolutionary invasion of empty niches. Am. Nat. 127, 835–850. doi: 10.1086/284528
Winter E. R., Nolan E. T., Busst G., Britton J. R. (2019). Estimating stable isotope turnover rates of epidermal mucus and dorsal muscle for an omnivorous fish using a diet-switch experiment. Hydrobiologia 828, 245–258. doi: 10.1007/s10750-018-3816-4
Yen J. D. L., Cabral R. B., Cantor M., Hatton I., Kortsch S., Patrício J., et al. (2016). Linking structure and function in food webs: maximization of different ecological functions generates distinct food web structures. J. Anim. Ecol. 85, 537–547. doi: 10.1111/1365-2656.12484
Zeller D., Rossing P., Harper S., Persson L., Booth S., Pauly D. (2011). The Baltic Sea: estimates of total fisheries removals 1950–2007. Fish. Res. 108, 356–363. doi: 10.1016/j.fishres.2010.10.024
Zettler M. L., Gosselck F. (2006). Benthic assessment of marine areas of particular ecological importance within the German Baltic Sea EEZ. In: Nordheim H., von Boedeker D., Krause J. C. (Eds.), Progress in Marine Conservation in Europe – NATURA 2000 sites in German offshore waters (Berlin: Springer-Verlag), 141–156.
Keywords: benthic food web structure and functioning, stable isotopes of carbon and nitrogen, stomach content, fish diet, German Baltic Sea, bottom trawling
Citation: de la Vega C, Paar M, Köhler L, von Dorrien C, Kriegl M, Oesterwind D and Schubert H (2023) Trophic redundancy in benthic fish food webs increases with scarcity of prey items, in the Southern Baltic Sea. Front. Mar. Sci. 10:1143792. doi: 10.3389/fmars.2023.1143792
Received: 13 January 2023; Accepted: 19 May 2023;
Published: 02 June 2023.
Edited by:
Chiara Piroddi, Joint Research Centre, ItalyReviewed by:
Daniele Brigolin, Università Iuav di Venezia, ItalyJosé Lino Vieira De Oliveira Costa, University of Lisbon, Portugal
Copyright © 2023 de la Vega, Paar, Köhler, von Dorrien, Kriegl, Oesterwind and Schubert. This is an open-access article distributed under the terms of the Creative Commons Attribution License (CC BY). The use, distribution or reproduction in other forums is permitted, provided the original author(s) and the copyright owner(s) are credited and that the original publication in this journal is cited, in accordance with accepted academic practice. No use, distribution or reproduction is permitted which does not comply with these terms.
*Correspondence: Camille de la Vega, Y2FtLmRlbGF2ZWdhQGdtYWlsLmNvbQ==
†Present address: Martin Paar, PlanBlue GmbH, Bremen Innovation and Technology Center (BITZ), Bremen, Germany