 Zhinuo Zhou1Ge-Yi Fu2
 Yi Fang1
 Ye Yuan1
 Hong-Bin Shen1
 Chun-Sheng Wang2
 Xue-Wei Xu2
 Peng Zhou2*
 Xiaoyong Pan1*
- 1Key Laboratory of System Control and Information Processing, Ministry of Education of China, Institute of Image Processing and Pattern Recognition, Shanghai Jiao Tong University, Shanghai, China
- 2Key Laboratory of Marine Ecosystem Dynamics, Ministry of Natural Resources and Second Institute of Oceanography, Ministry of Natural Resources, Hangzhou, China
Introduction: In response to the need for automated classification in global marine biological studies, deep learning is applied to image-based classification of marine echinoderms.
Methods: Images of marine echinoderms are collected and classified according to their systematic taxonomy. The images belong to 5 classes, 38 orders, 145 families, 459 genera, and 1021 species, respectively. The deep learning model, EfficientNetV2, outperforms the competing model and is chosen for developing the automated classification tool, EchoAI. Then, the EfficientNetV2-based tool, EchoAI is applied to each taxonomic level.
Results: The accuracy for the test dataset was 0.980 (class), 0.876 (order), 0.738 (family), 0.612 (genus), and 0.469 (species), respectively. Online prediction service is provided.
Discussion: The EchoAI model and results are facilitated for investigating the diversity, abundance and distribution of species at the global scale, and the methodological strategy can also be applied to image classification of other categories of marine organisms, which is of great significance for global marine studies. EchoAI is freely available at http://www.csbio.sjtu.edu.cn/bioinf/EchoAI/ for academic use.
Introduction
Extensive survey on marine biodiversity is critical to the sustainable development of oceans, which results in significant workloads of taxonomic determination and classification. For instance, manually determining and classifying images of marine organisms is labor-consuming and time-costing, which requires experienced taxonomic researchers with strong domain knowledge. Moreover, different taxonomic researchers may make different decisions on the same image. Therefore, technologies of automated image classification are greatly demanded, such as machine-learning-based strategies, which consist of feature extraction, classification model training, and prediction. To date, there exist some machine learning-based approaches for automatic marine image classification. For example, these machine learning-based approaches were first applied in fish classifications (White et al., 2006; Larsen et al., 2009; Alsmadi, 2010). Compared with nektons, benthic fauna is relatively motionless, making them suitable for underwater imaging. Currently, deep learning approaches based on convolutional neural networks (CNNs) are increasingly being applied in studies on benthic fauna, such as automated identification of benthic epifauna with computer vision (Piechaud et al., 2019), automated classification of fauna in seabed photographs (Durden et al., 2021).
Among the benthic fauna, species of Echinodermata distribute widely in the oceans, from shallow to abyssal zone, and their biodiversity could be an indicator for health of their habitat. Echinodermata comprises five classes, Asteroidea (starfish), Crinoidea (sea lilies and feather stars), Echinoidea (sea urchins), Holothuroidea (sea cucumbers), and Ophiuroidea (brittle stars) (Mah and Blake, 2012; Stöhr et al., 2012), which differ from each other greatly in appearance. The differences in appearance gradually decrease with taxonomic levels going lower, while the difficulty in classification increases. However, existing machine learning based approaches generally train a unified model on collected images at different taxonomic levels. Currently there is still no specific model for classifying echinoderms at different taxonomic levels, which is in an urgent need for further extensive marine surveys. Therefore, an image-based artificial intelligence classification tool EchoAI for echinoderms at different taxonomic levels is developed in this study, including benchmark dataset construction, model training at different taxonomic levels, model evaluation and online application.
Materials and methods
In this study, we first collected the echinoderms images from World Register of Marine Species (WoRMS, https://marinespecies.org). Then, we trained a deep learning model using these collected images according to the biological systematic classification order. In the end, model interpretation was applied to the images for detecting the key regions. The workflow is shown in Figure 1.
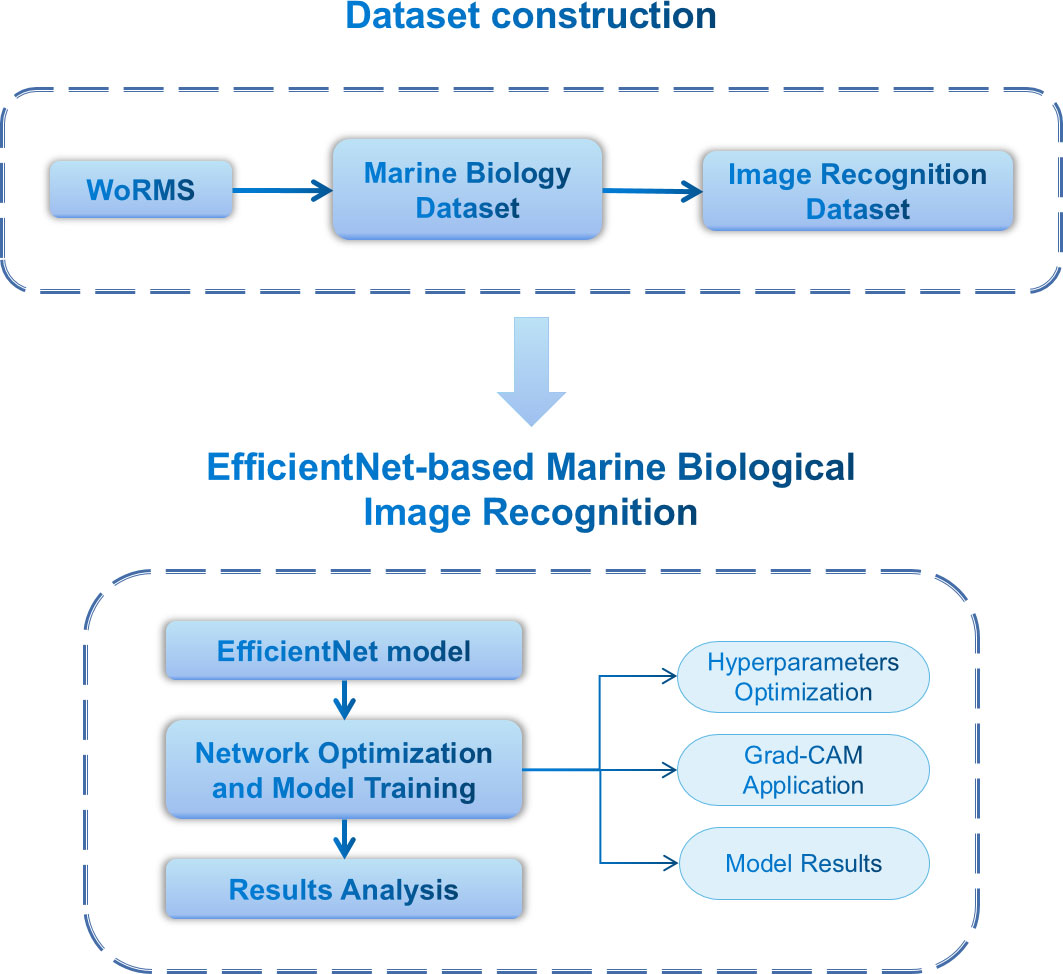
Figure 1 The workflow of EchoAI in this study. The entire pipeline starts with dataset preparation, followed by model training using deep-learning model, and interpretation of the prediction results.
Dataset preparation
The images used in this study were retrieved from the World Register of Marine Species (WoRMS, https://marinespecies.org), which focuses on a worldwide collection of information on marine species. Moreover, the WoRMS platform contains comprehensive taxonomic information on marine species, such as scientific names, corresponding synonyms, and habitat information. Regarding to the dataset at each taxonomic level, the images with missing taxonomic information were not included in the training and test datasets.
Since the format of the raw data downloaded from WoRMS is not exactly the same, it is first necessary to unify the format of the files and convert all the images to the RGB format, so that the image data is consistent with the model input. After the format unification, the images that are corrupted for various reasons were then removed, including images that were lost during format conversion, images that were formatted corruptly when they were downloaded, and images with some special formats. Since the image data downloaded from WoRMS contained images, such as sketch, maps, manual screening of all the images was conducted. Finally, we obtained the dataset for benchmarking in this study (Supplementary Table S1). The details of the datasets for the five classification levels are shown in Table 1.
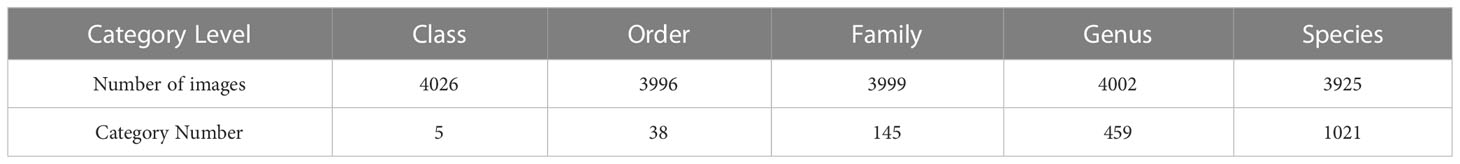
Table 1 The number of images for the five taxonomic levels.
Model architecture
EfficientNetV2 model in EchoAI
The module scaling architecture EfficientNet (Tan and Le, 2019) consists of the baseline and a range of non-independent parameters. The most common way is to scale up ConvNets by their depth (He et al., 2016) or width (Zagoruyko and Komodakis, 2016). Another less common, but increasingly popular, way is to scale up the models by image resolution (Huang et al., 2019). In previous work, it is common to scale only one of the three dimensions: depth, width or image size. EfficientNet proposes a simple yet effective module scaling method. The method uniformly scales the network width, depth, and resolution with a set of fixed scaling coefficients (Tan and Le, 2019). This strategy can reduce the number of parameters and the amount of computational resource, while achieving improved performance. However, the series of EfficientNet models still have some defects.
EfficientNetV2 is an improved model based on EfficientNet, it is a smaller and faster group of CNNs compared to the previous models for image recognition. Many previous works, such as FixRes (Touvron et al., 2019), and Mix&Match (Hoffer et al., 2019), usually keep the same regularization for all image sizes, causing a drop in the prediction accuracy. However, EfficientNetV2 proposes a progressive learning, in the early training epochs, they train the network with a small image size and weak regularization, then they gradually increase the image size and add stronger regularization (Tan and Le, 2021). In spite of training parameter efficiency, recent works aim to improve training or inference speed instead of the parameter efficiency. For example, RegNet (Radosavovic et al., 2020), ResNet (Zhang et al., 2020), TResNet (Ridnik et al., 2021), and EfficientNet-X (Li et al., 2021) focus on GPU inference speed. NFNets (Brock et al., 2021) and BoTNets(Srinivas et al., 2021) focus on improving training speed. Their training or inference speed often comes with the cost of more parameters while EfficientNetV2 aims to significantly improve both training speed and parameter efficiency than prior methods (Tan and Le, 2021) Another improvement of EfficientNetV2 is the use of Fused-MBConv (Gupta and Tan, 2019). The structure of the Fused-Convolution block is shown in Supplementary Figure 1. The use of depthwise convolutions (Sifre and Mallat, 2014) in the shallow layers of the network slows down the training in the early stages. EfficientNetV2 leverages the network architecture search to automatically search for the best combination of MBConv and Fused-MBConv.
Learning rate and batch size optimization for EfficientNetV2
The learning rate is a hyperparameter that guides how to adjust the network weights using the gradient of the loss function. The lower the learning rate is, the slower the loss function of the network model changes. The low learning rate allows the model to not miss any of the minimal values, but the model tends to get trapped in the local minima or saddle points. Moreover, the model may fail to converge, while higher learning rates result in faster parameter updates. A high learning rate can lead to gradient explosion, oscillations, etc.
Batch size is the number of samples selected for each training session. During model training, due to the large number of data samples, a certain amount of images from the dataset is selected in batches for training, and then the weights are updated based on the average value of this batch of images. If the batch size is too small, the training time of the model will be too long and the gradient will oscillate severely, making the model too slow to converge. If the batch size is too large, the gradient direction between different batches will vary too small, making the model easy to converge at the local optimum point.
To select the best hyperparameters for model training, empirical hyperparameters and multiple experiments are needed to find the hyperparameters that achieve the best performance on the validation set using grid search, where the optimized model was called as EchoAI (Classification of Echinoderms in the Oceans by EfficientNetV2).
Grad-CAM for model interpretation
The interpretability of network models is of great research importance in evaluating the model robustness. Using the Grad-CAM approach (Selvaraju et al., 2020), the interpretability of EchoAI can be explored, providing a visual interpretation of the decisions for the subsequent classification levels and the accuracy analysis of each category.
Previous work (Zhou et al., 2015) has shown that the convolutional units of various layers of CNNs actually behave as object detectors, even no supervision on the location of the object was provided. CAM (Zhou et al., 2016) is class activation mapping, it can display what the model considers to be the most important in the image during the decision making, which is similar to a heat map. Grad-CAM (Selvaraju et al., 2020) overcomes the disadvantage of CAM that requires replacing the classifier to retrain the model. The basic principle of Grad-CAM is to calculate the weights of each feature map in the convolution layer relative to the image class, and then maps the weighted and summed feature maps to the original input image. The general structure of Grad-CAM is shown in Supplementary Figure 2.
For a category c, Grad-CAM’s class activation mapping is calculated as follows:
Where Sc denotes the predicted value of the model for this image; Z=c1×c2 denotes the size of the feature map; k denotes the k-th channel in the feature layer A; denotes the data of the feature layer A at the i-th row and j-th column position in the channel k; Ak denotes the data of the k-th channel in the feature layer A; denotes the targeted weight parameter of Ak.
The mechanism of Grad-CAM (Supplementary Figure 2): The model first makes decisions on the input image, then the output of the last convolutional layer and the final model prediction score are obtained in the forward propagation. After back-propagating gradient information, the Grad-CAM heat map is obtained by summing the mean value of each point of the feature map with the ReLU activation function.
Experiments
Model evaluation criteria
In this study, we use the accuracy as an evaluation metric to assess the classification performance of the model which rely on a confusion matrix (Manel et al., 2001).
where TP, TN, FP, FN are true positives, true negatives, false positives and false negatives.
In order to explore the performance of the training results at each taxonomy level in the echinoderm dataset, the accuracy metric is also extended to multi-class classification tasks. For the overall performance, the accuracy of each taxonomy was also evaluated separately, which takes the impact of inter-class imbalance of the dataset on the model performance into account. The accuracy of each taxonomy is calculated the same as the overall accuracy of the model. For the accuracy of each taxonomy, TP, TN, FP, FN are counted in one specific taxonomy. While for the overall accuracy of the model, TP, TN, FP, FN are counted in the whole dataset.
Results
Learning rate and batch size optimization
In order to optimize the model performance and investigate the relationship between the hyperparameters and the performance of the model, we train the classification model with different learning rates (0.01, 0.001, 0.0001) and different batch sizes (4, 8, 16) at the class level.
As shown in Figures 2A, B, the training loss and accuracy change with the number of iterations for the model training and evaluation. Overall, the higher the learning rate, the faster the model converges. When the learning rate is too low, e.g., learning rate=0.0001, the model falls into a local optimum and cannot find the global optimal solution, and the final training loss is higher than the other two cases. In addition, the accuracy, both in the train and validation sets, is also lower than the other two cases. For the learning rates of 0.01 and 0.001, the performance of the model with a learning rate of 0.01 is better than that of the model with a learning rate of 0.001, both in terms of training loss and accuracy on the train set and the validation set. Thus, 0.01 is chosen as the learning rate of the EchoAI model in our work.
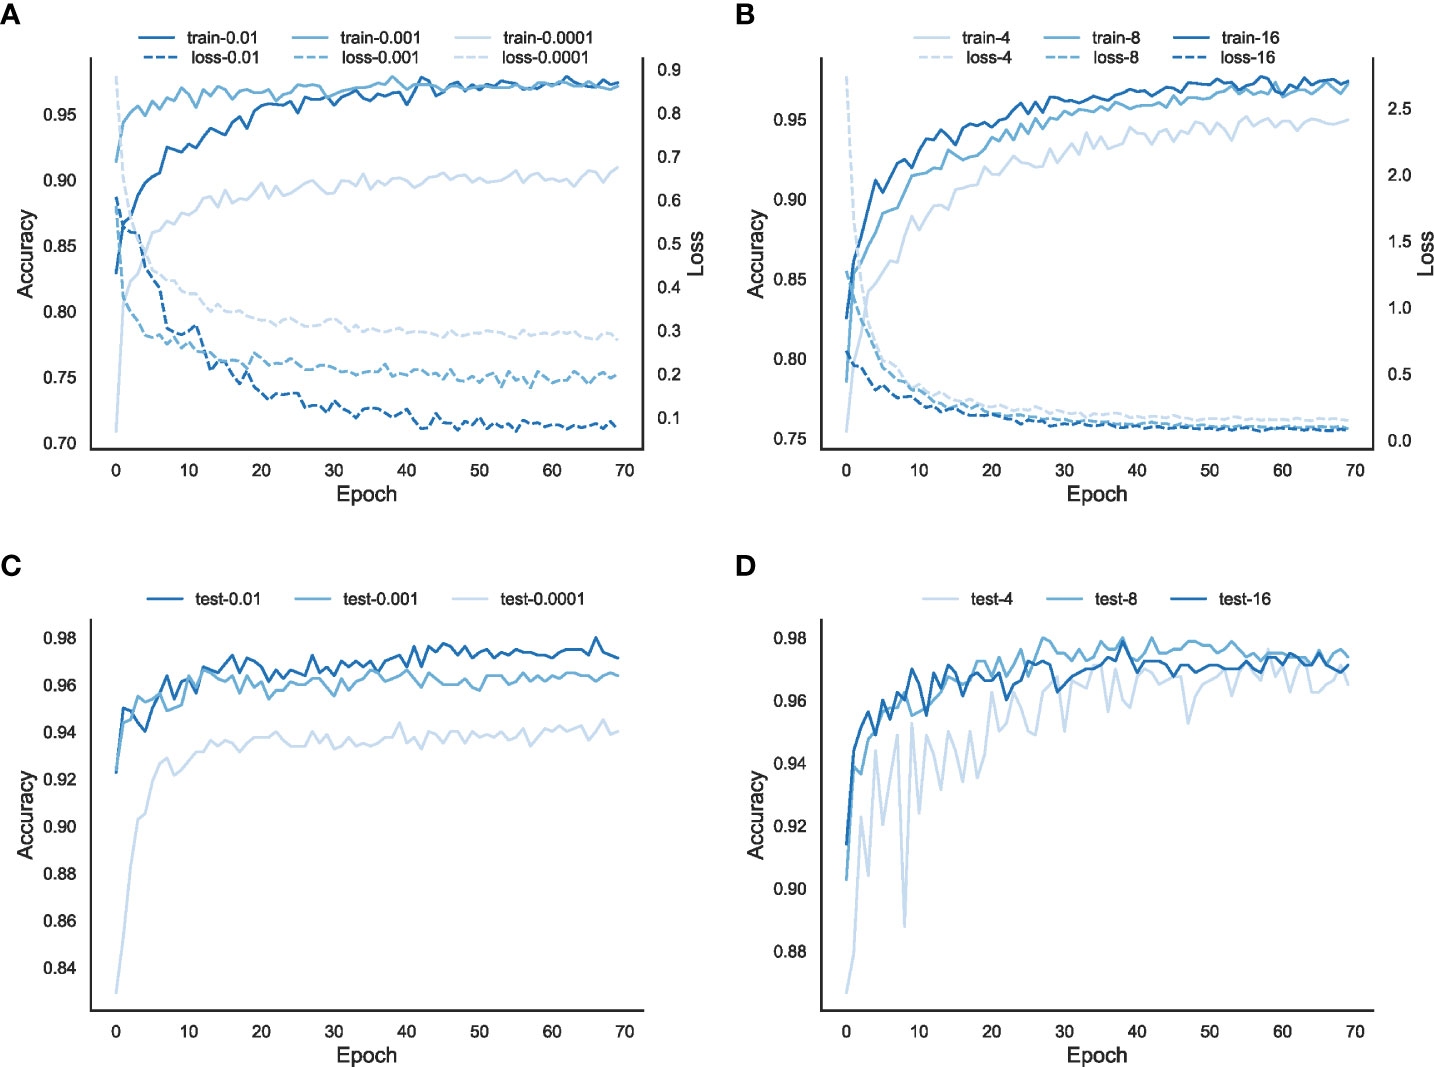
Figure 2 Parameter optimization of the model EchoAI with different learning rates and batch sizes. (A) is the loss and accuracy of the model in the training set for different learning rates; (B) is the accuracy of the model in the validation set for different learning rates; (C) is the loss and accuracy of the model in the training set for different batch sizes; and (D) is the accuracy of the model in the validation set for different batch sizes.
In order to select the appropriate batch size, the batch sizes are set to 4, 8, and 16, respectively. The results of different batch sizes are shown in Figures 2C, D. In terms of the accuracy of the training set, the accuracy of the model with a batch size=4 is lower than that of the model with a batch size 8 or 16 on the training set, but the difference between the models with a batch size 8 or 16 is small. From the accuracy of the validation set, the accuracy of all three batch sizes is not very different, of which, the batch size=4 is slightly lower. Considering that the training speed is faster with the batch size=16, and the accuracy rates on both the train and validation sets are good, we choose 16 as the batch size for the EchoAI model.
In-depth exploration at different taxonomic levels
When the taxonomic levels going lower, from class to species, the number of categories increases, from 5 (class), 38 (order), 145 (family), 459 (genus), to 1021 (species), and the number of training samples for each category decreases a lot. The performance of the models trained at the five taxonomic levels are shown in Figure 3.
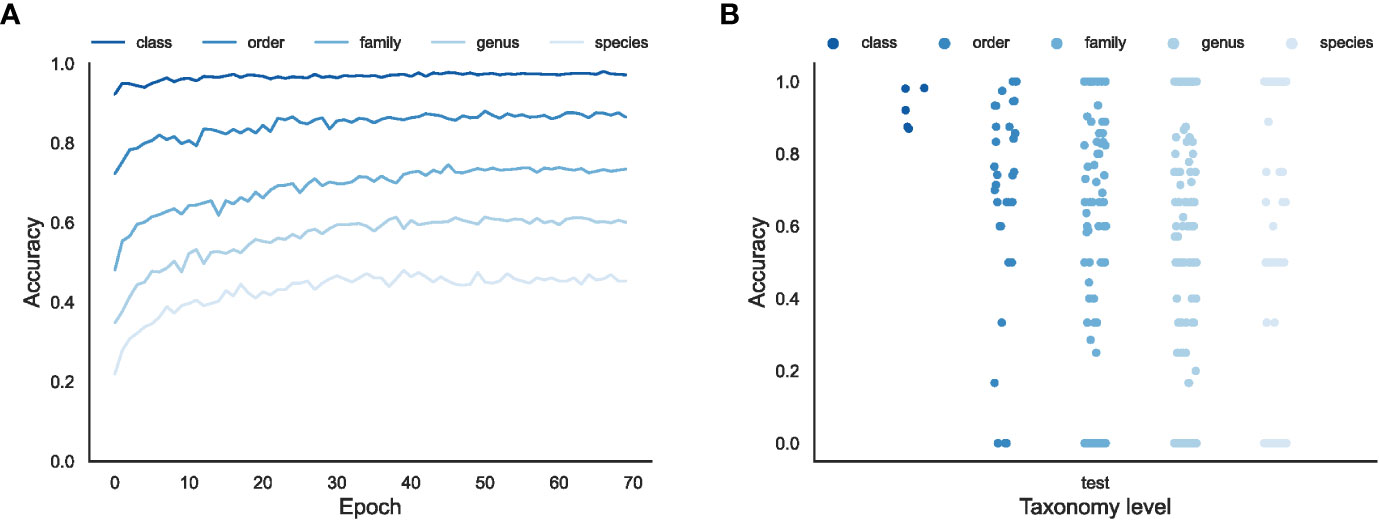
Figure 3 The overall effectiveness of the EchoAI models for the test set at different taxonomic levels. (A) the change of accuracy over Epoch; (B) the distribution of accuracy for each taxon (represented by the point) predicted by the optimized EchoAI.
As shown in Figure 3A, EchoAI yields the highest accuracy in the test set at the class level, because the dataset has the least number of categories and each category has the largest number of training samples. The optimal model yields an accuracy of 98.0% in the test set. EchoAI in the order level yields an accuracy of 87.6% in the test set. The accuracy of the EchoAI model in the family level reaches 73.8% in the test set. Based on the higher number of categories in the family level, it can be assumed that the model under the family level also has good predictive power. The accuracy of the EchoAI model in genus level in the test set reaches 61.2%, with the number of categories in the dataset from 145 to 459. The accuracy of the model in the species level reaches 46.9% in the test set, which has expanded the number of categories in the dataset to 1021, and the model can be considered to still have potential predictive power. Although the models in the family, genus and species levels do not perform as well as the models in the class and order levels, the EchoAI model in these levels can still be used as a reference for manual classification.
Since there exist small sample categories in the dataset, it is necessary to focus on the accuracy of each category in addition to the overall accuracy (Figure 3B). The accuracies of the EchoAI model show that there is no small sample classification problem in the classification level of Class. In Order level, its performance is slightly worse than that of Class level classification, but better than the other three classification levels. It is because the number of categories in the Order level is more than that at the Class level, but less than the others, and the number of small sample categories in Order level is smaller. In the classification of the Family level, the distribution of accuracy becomes scattered, the accuracy of some categories reach100%, but the accuracy of a few categories is lower than 75% or even 50%. Moreover, the accuracy of some categories is 0, which shows that the imbalance problem has a big impact on the model performance for those minority categories.
EchoAI model uses EfficientNetV2 as the backbone network, to demonstrate its advantage, we further compare it with ResNet (He et al., 2016) backbone on the same echinoderm dataset. The results are shown in Figure 4. From the loss of the training set at different taxonomic levels (Figure 4A), the convergence speed of the EchoAI model is faster than that of ResNet at each taxonomic level, and the final converged loss is smaller than that of ResNet. From the accuracy of the optimal model in the test set (Figure 4B), the accuracy of the EchoAI model is higher than that of ResNet at each taxonomic level. The results demonstrate that EchoAI with EfficientNetV2 yields better performance on the echinoderm dataset than ResNet.
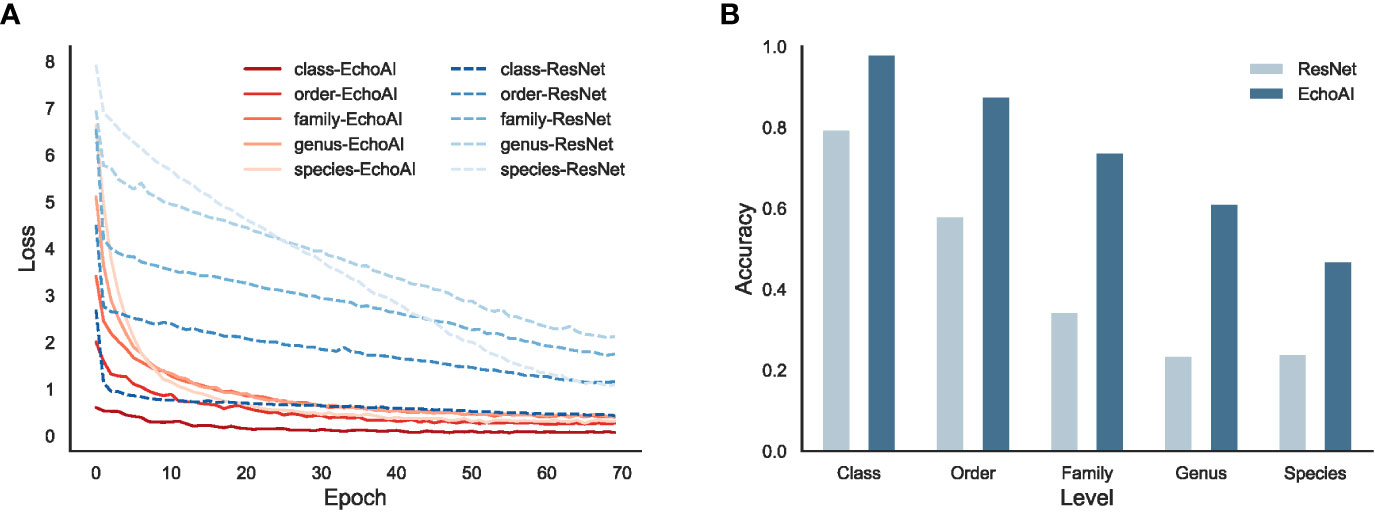
Figure 4 The performance comparison of EchoAI and ResNet on the echinoderm dataset. (A) is the loss of the training set at different taxonomic levels for EchoAI and ResNet; (B) is the optimal accuracy of EchoAI and the ResNet on the test set at each taxonomic level.
Model results by top-n prediction
As the classification level of the dataset gradually refines, the number of categories of the data increases and the number of training samples for each category decreases. When the model encounters a more complex multi-classification task, there will be a high probability of predicting the image as other categories, especially for those similar categories. In the previous model training, only the classification of the maximum probability was considered as the predicted category. For the sake of more complete and comprehensive evaluation of the predictive power of the model, we use another judgment criterion for evaluating the model. The model prediction is judged to be correct if the model has the correct category in its top n predictions (the n highest prediction probabilities by EchoAI model). In order to investigate the effect of different values of n on the model evaluation, we perform the evaluation on n = 1, 2, 3, 4, 5, respectively, the results for different values of n are shown in Figure 5. We can see that the accuracy decreases with the number of categories and a bigger n yields a higher performance. It is worth noting that, after adjusting the model evaluation criterion, the accuracy of the model EchoAI trained at the species level exceeds 0.600 in the test set, reaching 0.678, which is considered to be more reliable with 1021 categories at the species level.
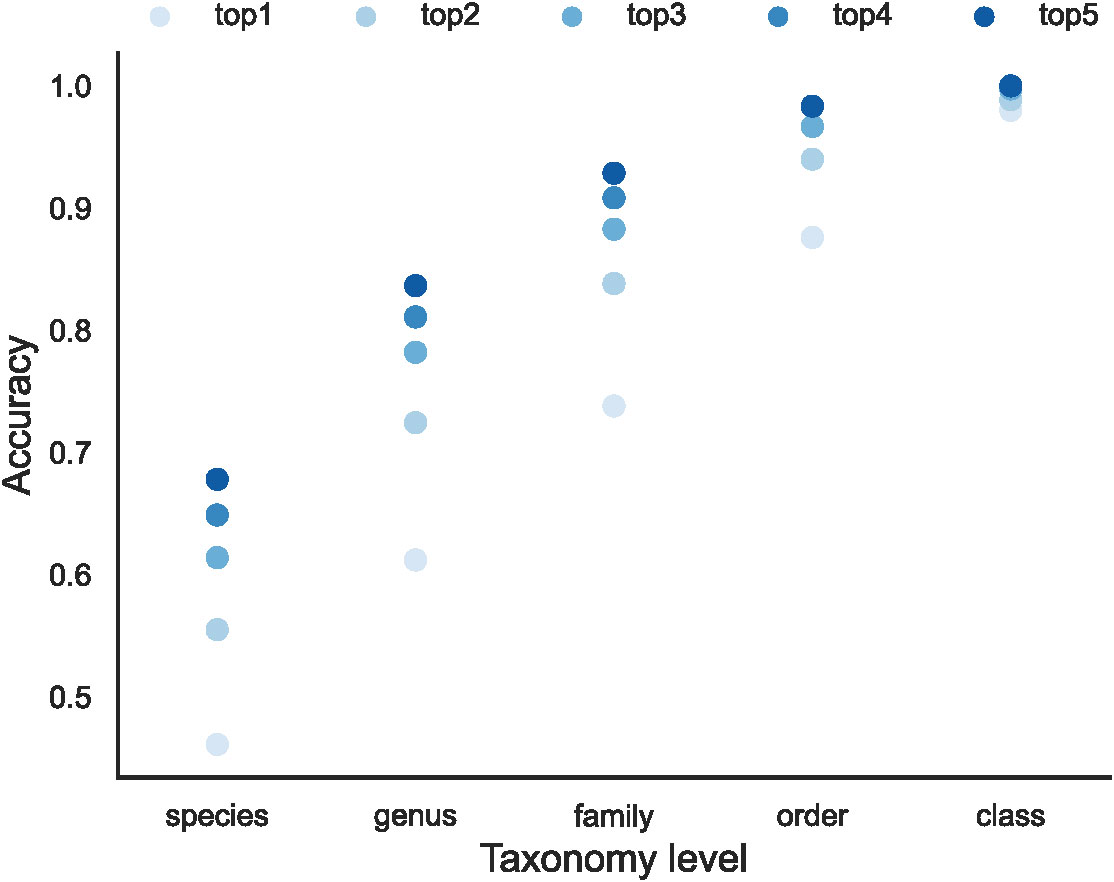
Figure 5 The top-n accuracy of EchoAI at different taxonomy levels.
Interpretable analysis of Grad-CAM
In this study, we analyze the impact of the model when the classification level is deepened in three perspectives: the number of categories, the data features in each category, and the amount of images in each category. The information of the dataset has been given in Table 1, and it can be assumed that the size of the data volume at the five classification levels does not affect the model comparison within the error range. We apply Grad-CAM on the trained models for each category. Heat maps (Figure 6) are first drawn by applying Grad-CAM’s model at five classification level.
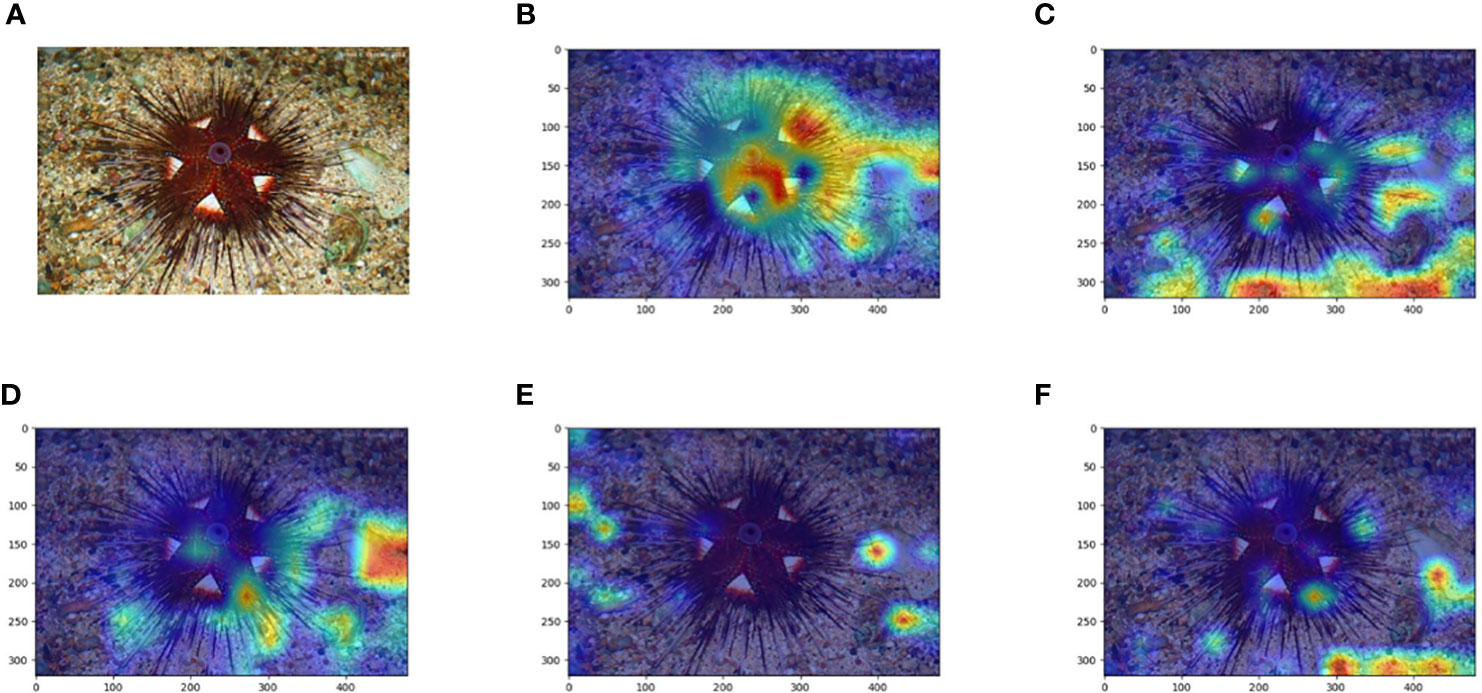
Figure 6 Comparison of the original image and Grad-CAM heat map of the Echinoidea image at the five classification levels. (A) is the original image, (B–F) are Grad-CAM heat maps at the Class, Order, Family, Genus and Species classification levels, respectively.
The Grad-CAM heat map shows that the “attention” of the EchoAI model trained at the Class level is well focused on the biological object to be recognized, and the model is not disturbed by the background environment and color. While the attention to the background and the object itself varies at the other classification levels. In contrast, the heat maps of the EchoAI models at other taxonomic levels show that the models do not focus exclusively on the object themselves, and there are even cases where most of the attention is focused on the background. A potential explanation is that Figures 6A–F, the amount of images in this category is small, resulting in the model not learning the discriminate features of the objects for this category.
Demonstration and web service of EchoAI
Using the optimized EchoAI model, we demonstrate some prediction examples (shown in Figure 7). Predictions of the above images are all accurate and the probability of prediction is close to 100%, which reflects the strong prediction ability of the model EchoAI. To make EchoAI be accessible for taxonomic classifications of echinoderm images, an online prediction service of EchoAI is provided (http://www.csbio.sjtu.edu.cn/bioinf/EchoAI/). The users could upload their own images and conduct the prediction, by following the instructions on the webpage.
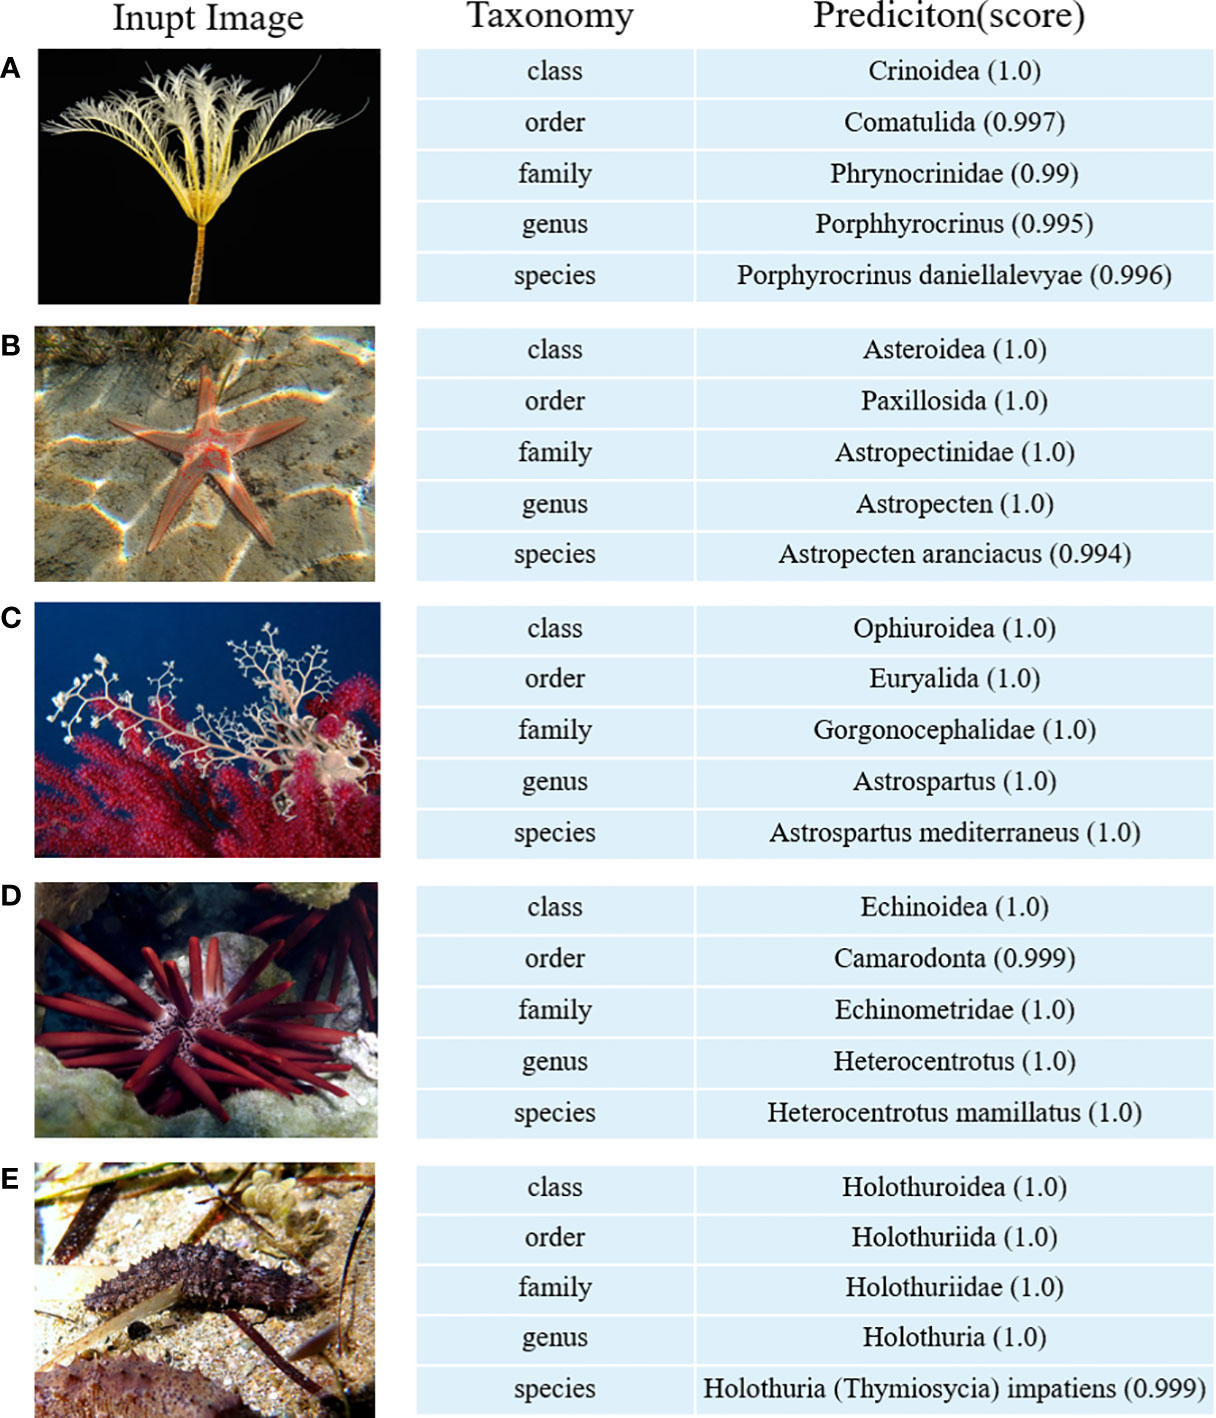
Figure 7 Illustration of image prediction results by EchoAI. (A) belongs to the category Crinoidea (class classification level); (B) belongs to the category Paxillosida (order classification level); (C) belongs to the category Gorgonocephalidae (family classification level); (D) belongs to the category Heterocentrotus (genus classification level); (E) belongs to the category Holothuria (Thymiosycia) impatiens (species classification level).
Discussion
Although EchoAI is superior to competing methods, but its accuracy levels may still be not high enough from the perspective of experienced taxonomists. Identification at the family, genus and species levels are much more difficult than that at class and order levels due to the following reasons: 1) the images at the family, genus and species level are very morphologically heterogeneous, which are so similar that microscopic examination is needed; 2) The number of images for each category at the family, genus and species level is very small, which is not sufficient for training a high-accuracy deep model. To improve the performance of EchoAI, the training dataset could be enlarged, even covering the microscopic images.
Verification by the expertise is important for the images fed into the deep model. Some images retrieved from WoRMS may not be verified by a taxonomic expert and may be misidentified. Therefore, EchoAI would be constantly updated along with WoRMS in case certain image is verified by a taxonomic expert. Since there may be misidentifications in the prediction results provided by EchoAI, where non-experts will not be able to recognize them, EchoAI could be functioned as an assistant tool for experienced taxonomists and the misidentifications could be corrected. We expect that EchoAI would benefit the studies on the taxonomic determination.
In future research, the dataset size can be increased and the image quality can be further improved. Considering the difficulty of data acquisition, the development of generative models to augment the categories with fewer samples, especially deep diffusion models (Yang et al., 2022), will be mainly considered. The forward diffusion process is used to model the multi-level hidden variables for this category of image samples, and then the inverse process is used to extract the multi-leveled feature information of the intermediate hidden variables using neural networks, and then the new image is generated as synthesized training samples by inverse sampling of the hidden variables for this category.
Conclusion
In this study, based on images collected from WoRMS, we applied and optimized EchoAI with EfficientNetV2 as the backbone model for classifying marine echinoderms at the levels of class, order, family, genus, species. At the genus level, the size of the dataset is 4002 and the total number of categories is 459. The trained model achieves an accuracy of 0.612 in the test set. The classification by EchoAI is interpretably analyzed using Grad-CAM, and online classification prediction service is provided based on EchoAI. In addition, the classification module can also be extended to other platforms, such as laboratory image analysis equipment, underwater vehicle, etc., to help improve the efficiency of the marine survey and real-time monitoring. The study would help investigate the diversity, abundance and distribution of species at a global scale, and the strategy can also be applied to the image classification of other marine organisms.
Data availability statement
The original contributions presented in the study are included in the article/Supplementary Material. Further inquiries can be directed to the corresponding authors.
Author contributions
XP and PZ conceived the study. ZZ, XP, and PZ designed algorithms. ZZ, GF, YY, HS, CW, XX, XP, PZ, and HS wrote the paper. YF implemented the web server. All authors contributed to the article and approved the submitted version.
Funding
This work was sponsored by the Oceanic Interdisciplinary Program of Shanghai Jiao Tong University (No. SL2021MS005, SL2022ZD108), the National Natural Science Foundation of China (No. 61903248), and the Scientific Research Fund of the Second Institute of Oceanography, MNR (No. SZ2101).
Conflict of interest
The authors declare that the research was conducted in the absence of any commercial or financial relationships that could be construed as a potential conflict of interest.
Publisher’s note
All claims expressed in this article are solely those of the authors and do not necessarily represent those of their affiliated organizations, or those of the publisher, the editors and the reviewers. Any product that may be evaluated in this article, or claim that may be made by its manufacturer, is not guaranteed or endorsed by the publisher.
Supplementary material
The Supplementary Material for this article can be found online at: https://www.frontiersin.org/articles/10.3389/fmars.2023.1147690/full#supplementary-material
References
Alsmadi (2010). Fish recognition based on robust features extraction from size and shape measurements using neural network. J. Comput. Sci. 6 (10), 1088–1094. doi: 10.3844/jcssp.2010.1088.1094
Brock A., De S., Smith S. L., Simonyan K. (2021). “High-performance large-scale image recognition without normalization,” in International conference on machine learning: PMLR (Vienna, Austria: Proceedings of the 38th International Conference on Machine Learning, PMLR), 1059–1071.
Durden J. M., Hosking B., Bett B. J., Cline D., Ruhl H. A. (2021). Automated classification of fauna in seabed photographs: The impact of training and validation dataset size, with considerations for the class imbalance. Prog. Oceanography 196, 102612. doi: 10.1016/j.pocean.2021.102612
Gupta S., Tan M. (2019). EfficientNet-EdgeTPU: Creating accelerator-optimized neural networks with AutoML. Google AI Blog 2, 1. Available: https://ai.googleblog.com/2019/08/efficientnet-edgetpu-creating.html.
He K. M., Zhang X. Y., Ren S. Q., Sun J. (2016). “Deep residual learning for image recognition,” in 2016 ieee conference on computer vision and pattern recognition (Cvpr) (Las Vegas, Nevada: Proceedings of the IEEE Conference on Computer Vision and Pattern Recognition (CVPR)), 770–778. doi: 10.1109/Cvpr.2016.90
Hoffer E., Weinstein B., Hubara I., Ben-Nun T., Hoefler T., Soudry D. (2019). Mix & match: training convnets with mixed image sizes for improved accuracy, speed and scale resiliency. arXiv preprint arXiv:1908.08986. doi: 10.48550/arXiv.1908.08986
Huang Y., Cheng Y., Bapna A., Firat O., Chen D., Chen M., et al. (2019). Gpipe: Efficient training of giant neural networks using pipeline parallelism. Adv. Neural Inf. Process. Syst. 32, 103–112. doi: 10.48550/arXiv.1811.06965
Larsen R., Olafsdottir H., Ersboll B. K. (2009). Shape and texture based classification of fish species. Image Analysis Proc. 5575, 745–749. doi: 10.1007/978-3-642-02230-2_76
Li S., Tan M., Pang R., Li A., Cheng L., Le Q. V., et al (2021). “Searching for fast model families on datacenter accelerators,” in Proceedings of the IEEE/CVF conference on computer vision and pattern recognition (Proceedings of the IEEE/CVF Conference on Computer Vision and Pattern Recognition (CVPR)), 8085–8095.
Mah C. L., Blake D. B. (2012). Global diversity and phylogeny of the asteroidea (Echinodermata). PloS One 7 (4), e35644. doi: 10.1371/journal.pone.0035644
Manel S., Williams H. C., Ormerod S. J. (2001). Evaluating presence–absence models in ecology: the need to account for prevalence. J. Appl. Ecol. 38 (5), 921–931. doi: 10.1046/j.1365-2664.2001.00647.x
Piechaud N., Hunt C., Culverhouse P., Foster N., Howell K. (2019). Automated identification of benthic epifauna with computer vision. Mar. Ecol. Prog. Ser. 615, 15–30. doi: 10.3354/meps12925
Radosavovic I., Kosaraju R. P., Girshick R., He K., Dollár P. (2020). “Designing network design spaces,” in Proceedings of the IEEE/CVF conference on computer vision and pattern recognition (Proceedings of the IEEE/CVF Conference on Computer Vision and Pattern Recognition (CVPR)), 10428–10436.
Ridnik T., Lawen H., Noy A., Ben Baruch E., Sharir G., Friedman I. (2021). “Tresnet: High performance gpu-dedicated architecture,” in Proceedings of the IEEE/CVF winter conference on applications of computer vision (Waikoloa, HI, USA: Proceedings of the IEEE/CVF Winter Conference on Applications of Computer Vision (WACV)), 1400–1409.
Selvaraju R. R., Cogswell M., Das A., Vedantam R., Parikh D., Batra D. (2020). Grad-CAM: Visual explanations from deep networks via gradient-based localization. Int. J. Comput. Vision 128 (2), 336–359. doi: 10.1007/s11263-019-01228-7
Sifre L., Mallat S. (2014). Rigid-motion scattering for texture classification. arXiv preprint arXiv:1403.1687.
Srinivas A., Lin T.-Y., Parmar N., Shlens J., Abbeel P., Vaswani A. (2021). “Bottleneck transformers for visual recognition,” in Proceedings of the IEEE/CVF conference on computer vision and pattern recognition (Nashville, Tennessee), 16519–16529. doi: 10.48550/arXiv.1403.1687
Stöhr S., O’Hara T. D., Thuy B. (2012). Global diversity of brittle stars (Echinodermata: Ophiuroidea). PloS One 7 (3), e31940. doi: 10.1371/journal.pone.0031940
Tan M. X., Le Q. V. (2019). “EfficientNet: Rethinking model scaling for convolutional neural networks,” in International conference on machine learning (Los Angeles, United States: Proceedings of the 36th International Conference on Machine Learning, PMLR), vol. 97. .
Tan M. X., Le Q. V. (2021). “EfficientNetV2: Smaller models and faster training,” in International conference on machine learning (Vienna, Austria: Proceedings of the 38th International Conference on Machine Learning, PMLR), vol. 139. , 7102–7110.
Touvron H., Vedaldi A., Douze M., Jégou H. (2019). Fixing the train-test resolution discrepancy. Adv. Neural Inf. Process. Syst. 32, 8252–8262. doi: 10.48550/arXiv.1906.06423
White D. J., Svellingen C., Strachan N. J. C. (2006). Automated measurement of species and length of fish by computer vision. Fisheries Res. 80 (2-3), 203–210. doi: 10.1016/j.fishres.2006.04.009
Yang L., Zhang Z., Song Y., Hong S., Xu R., Zhao Y., et al. (2022). Diffusion models: A comprehensive survey of methods and applications. arXiv preprint arXiv:2209.00796. doi: 10.48550/arXiv.2209.00796
Zagoruyko S., Komodakis N. (2016). Wide residual networks. Proceedings of the British Machine Vision Conference (BMVC) 2016, 87.1-87.12. doi: 10.5244/C.30.87
Zhang H., Wu C., Zhang Z., Zhu Y., Lin H., Zhang Z., et al. (2022). ResNeSt: Split-attention networks. Proceedings of the IEEE/CVF Conference on Computer Vision and Pattern Recognition, 2736–2746. doi: 10.1109/CVPRW56347.2022.00309
Zhou B., Khosla A., Lapedriza A., Oliva A., Torralba. A. (2015). Object detectors emerge in deep scene cnns. arXiv preprint arXiv:1412.6856. doi: 10.48550/arXiv.1412.6856
Zhou B., Khosla A., Lapedriza A., Oliva A., Torralba A. (2016). “Learning deep features for discriminative localization,” in 2016 ieee conference on computer vision and pattern recognition (Cvpr) (Las Vegas, Nevada: Proceedings of the IEEE Conference on Computer Vision and Pattern Recognition (CVPR)), 2921–2929. doi: 10.1109/Cvpr.2016.319
Keywords: echinoderms, marine organism, deep learning, EfficientNetV2, model interpretability, image classification
Citation: Zhou Z, Fu G-Y, Fang Y, Yuan Y, Shen H-B, Wang C-S, Xu X-W, Zhou P and Pan X (2023) EchoAI: A deep-learning based model for classification of echinoderms in global oceans. Front. Mar. Sci. 10:1147690. doi: 10.3389/fmars.2023.1147690
Received: 19 January 2023; Accepted: 09 March 2023;
Published: 04 April 2023.
Edited by:
Hongsheng Bi, University of Maryland, College Park, United StatesReviewed by:
Luciano Ortenzi, University of Tuscia, ItalySabine Stöhr, Swedish Museum of Natural History, Sweden
Copyright © 2023 Zhou, Fu, Fang, Yuan, Shen, Wang, Xu, Zhou and Pan. This is an open-access article distributed under the terms of the Creative Commons Attribution License (CC BY). The use, distribution or reproduction in other forums is permitted, provided the original author(s) and the copyright owner(s) are credited and that the original publication in this journal is cited, in accordance with accepted academic practice. No use, distribution or reproduction is permitted which does not comply with these terms.
*Correspondence: Xiaoyong Pan, MjAwOHh5cGFuQHNqdHUuZWR1LmNu; Peng Zhou, emhvdXBlbmdAc2lvLm9yZy5jbg==