 M. Kelsey Lane1*
 Jennifer S. Fehrenbacher1
 Jennifer L. Fisher2
 Melanie R. Fewings1
 Byron C. Crump1
 Craig M. Risien1
 Grace M. L. Meyer1Faith Schell1
- 1College of Earth, Ocean & Atmospheric Sciences, Oregon State University, Corvallis, OR, United States
- 2Cooperative Institute for Marine Ecosystem and Resources Studies, Oregon State University, Newport, OR, United States
Under future climate scenarios, ocean temperatures that are presently extreme and qualify as marine heatwaves (MHW) are forecasted to increase in frequency and intensity, but little is known about the impact of these events on one of the most common paleoproxies, planktonic foraminifera. Planktonic foraminifera are globally ubiquitous, shelled marine protists. Their abundances and geochemistry vary with ocean conditions and fossil specimens are commonly used to reconstruct ancient ocean conditions. Planktonic foraminiferal assemblages are known to vary globally with sea surface temperature, primary productivity, and other hydrographic conditions, but have not been studied in the context of mid-latitude MHWs. For this study, the community composition and abundance of planktonic foraminifera were quantified for 2010-2019 along the Newport Hydrographic Line, a long-term monitoring transect at 44.6°N in the Northern California Current (NCC). Samples were obtained from archived plankton tows spanning 46 to 370 km offshore during annual autumn (August – October) cruises. Two MHWs impacted the region during this timeframe: the first during 2014-2016 and a second, shorter duration MHW in 2019. During the 2014-2016 MHW, warm water subtropical and tropical foraminifera species were more prevalent than the typical polar, subpolar, and transitional species common to this region. Cold water species were abundant again after the first MHW dissipated in late 2016. During the second, shorter-duration MHW in 2019, the assemblage consisted of a warm water assemblage but did not include tropical species. The foraminiferal assemblage variability correlated with changes in temperature and salinity in the upper 100 meters and was not correlated with distance offshore or upwelling. These results suggest that fossil foraminiferal assemblages from deep sea sediment cores may provide insight into the magnitude and frequency of past MHWs.
1 Introduction
The California Current is an eastern boundary upwelling system known for its immense productivity that supports a diverse ecosystem and valuable fisheries (Figure 1). This productivity is driven by wind-driven coastal upwelling that delivers nutrient rich waters to the photic zone. In the northern California Current (NCC) region, productivity varies seasonally, with equatorward winds driving the upwelling of cold, nutrient-rich water onto the shelf during summer months and poleward winds driving downwelling conditions during winter months (Figure 2; Checkley and Barth, 2009). Filaments of cold upwelled water can extend approximately 200 km from shore, delivering nutrient subsidies to otherwise oligotrophic offshore waters (Huyer, 1983). This ecologically and commercially important region recently experienced two marine heatwaves (MHWs), resulting in major impacts on the marine food web and fisheries (Brodeur et al., 2019).
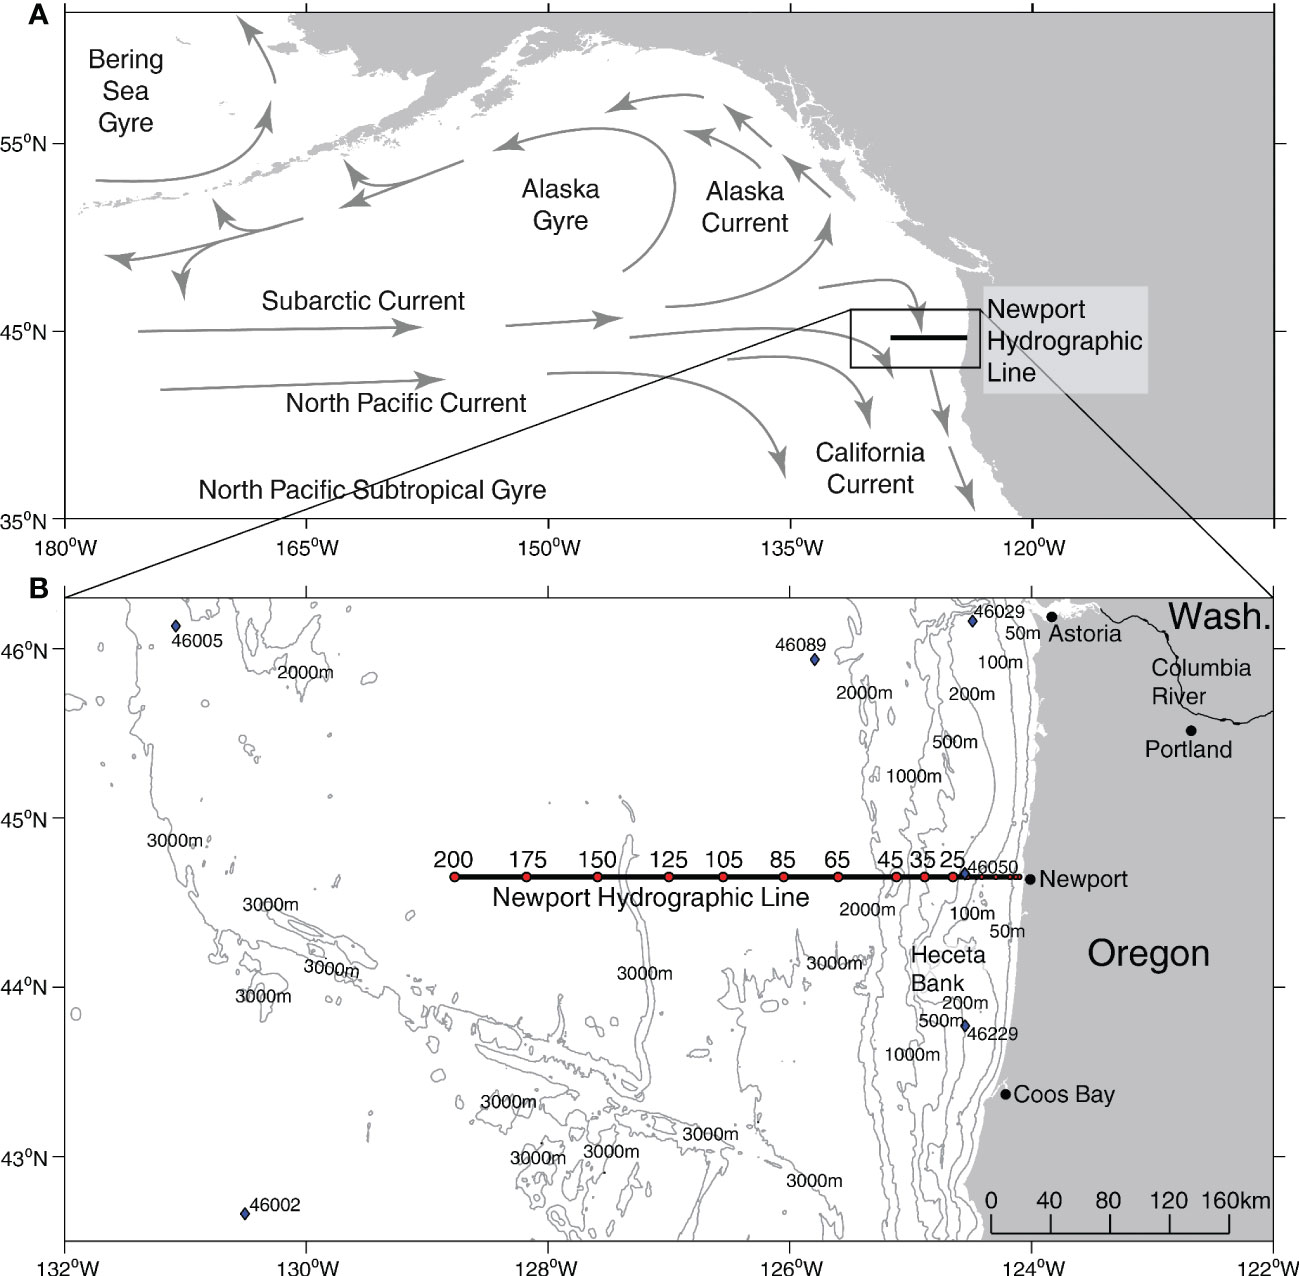
Figure 1 Study region. (A) Schematic map of Northeast Pacific oceanography. (B) Bathymetry along the Newport Hydrographic Line (black line) with individual sampling stations (red dots), and National Buoy Data Center buoys (blue diamonds). Bathymetry data from GEBCO Bathymetric Compilation Group (2021).
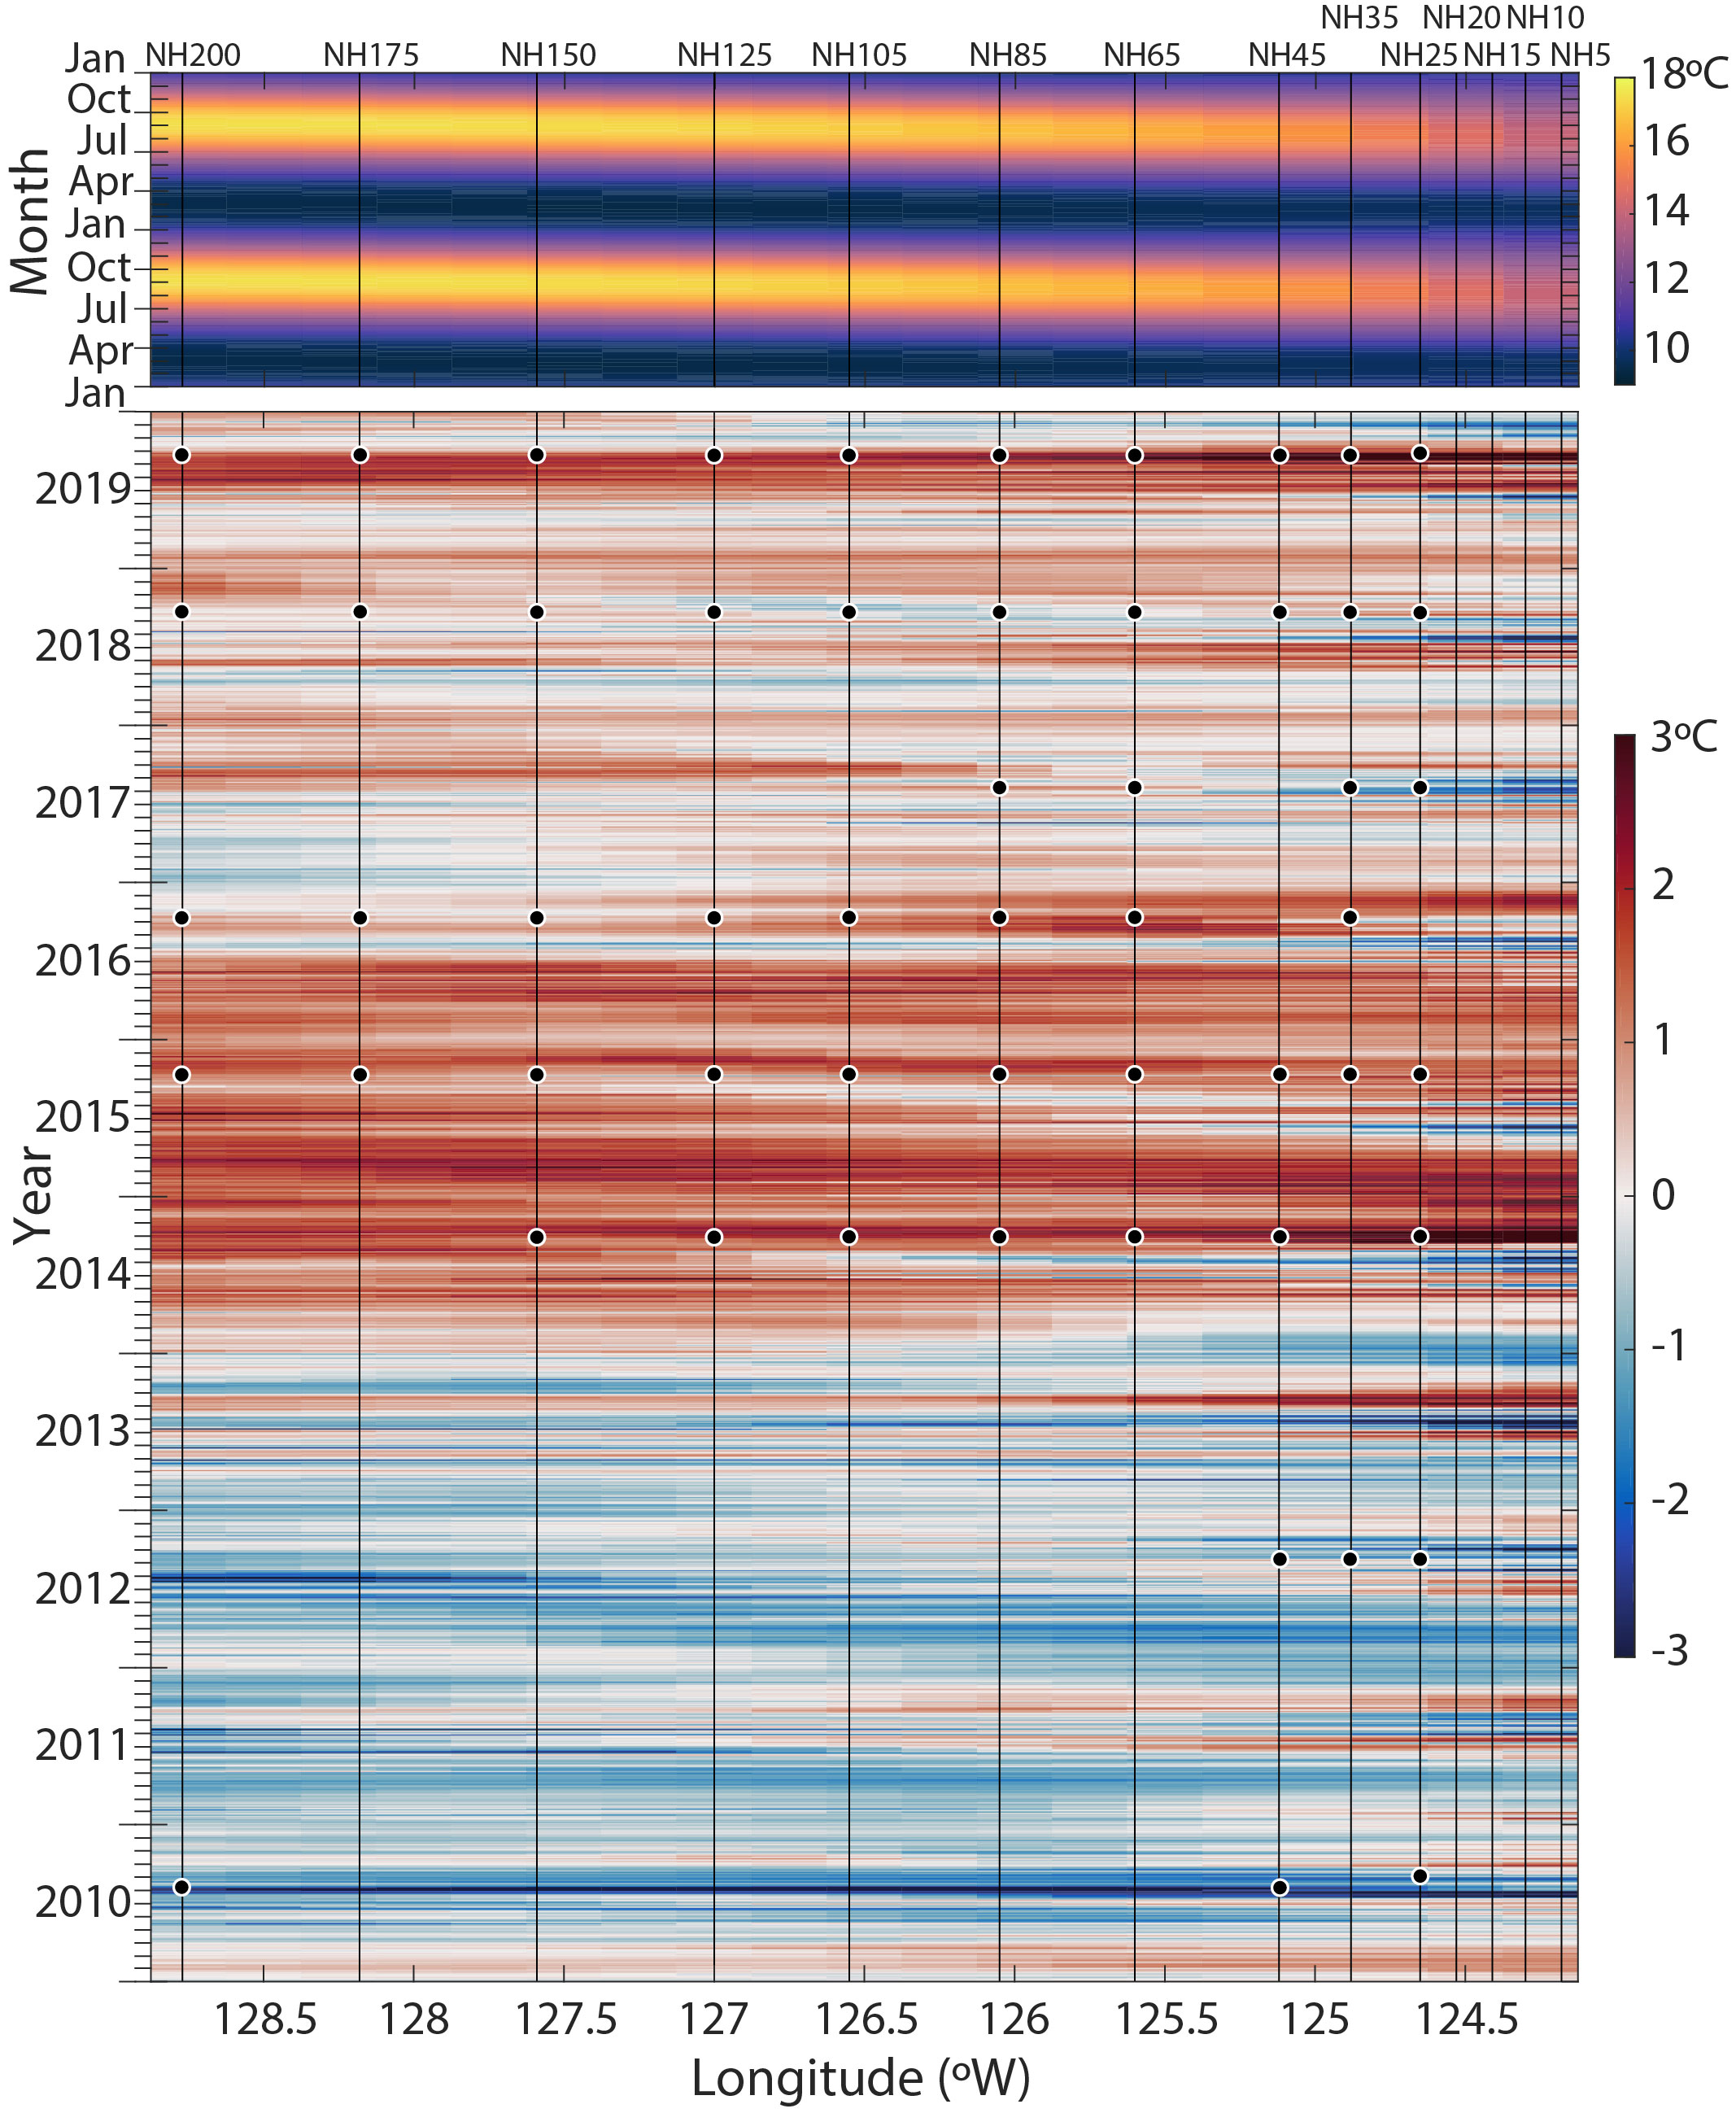
Figure 2 Sea-surface temperature (SST) climatology and Hovmöller plot of SST anomalies along the Newport Hydrographic (NH) Line. The 39-year (1982-2020) seasonal climatology is shown across two years in the upper panel (from OISST, see Methods). In the lower panel, SST anomalies from 2010-2019 are shown relative to the 39-year climatology. Vertical lines show the NH Line stations from NH-5 to NH-200. The date and location of each sample analyzed in this study is indicated with a black circle.
MHWs are discrete warm water events distinguished by prolonged strongly positive sea surface temperature (SST) anomalies relative to a historical baseline (Hobday et al., 2016). The first MHW (colloquially called the ‘Warm Blob’ (Bond et al., 2015)) initially formed in the Gulf of Alaska in 2013 and was associated with anomalously high atmospheric pressure (Tseng et al., 2017). The anomalously warm water mass persisted in the Northeast Pacific and extended to the NCC in the fall of 2014 (Figure 2; Peterson et al., 2017). SSTs off the coast of Oregon State rose by 6°C within seven hours in mid-September 2014 (Peterson et al., 2017). The NCC SST anomalies remained warm through 2015. In late 2015 and into 2016, the MHW was exacerbated by an El Niño (Gentemann et al., 2017; Tseng et al., 2017). During peak warming in the fall-winter 2015-2016, the positive temperature anomaly reached a depth of 150 m (Peterson et al., 2017). A second, shorter-duration, MHW emerged in the Gulf of Alaska in May 2019, coined the ‘Blob 2.0’ (Amaya et al., 2020). This MHW spread to the NCC in late summer 2019, peaked in the NCC in September 2019, and was of a similar magnitude of surface warming to the ‘Warm Blob’ (Figure 2), though the depth of the temperature anomaly was shallower (~upper 20 m, Thompson et al., 2019; Amaya et al., 2020).
The biological impacts of these NCC MHWs were dramatic, including coastwide harmful algal blooms, the appearance of novel species, and declines in economically important fisheries (McCabe et al., 2016; Peterson et al., 2017; Du and Peterson, 2018; Brodeur et al., 2019). In 2015-2016, ichthyoplankton spawning and nursery habitats shifted 500-1,000 km to the north because of warming (Auth et al., 2018). Six novel tropical copepod species were collected off Oregon during the 2014-2016 MHW that had not previously been found in the NCC in the 20+ years of a long-term study (Peterson et al., 2017). Future climate scenarios predict the temperatures we observe during present-day MHWs will become more frequent (Frölicher et al., 2018). The question remains: how will biological communities respond if conditions that presently qualify as MHWs become the “new normal”, and how will these communities shift during more extreme events? Here, we examine the response of planktonic foraminifera in the NCC to the recent transient warming events.
Planktonic foraminifera are globally ubiquitous marine protists with shells made of calcium carbonate that are commonly used as paleoproxies (Kucera, 2007). Foraminiferal assemblages and the geochemical composition of the organisms’ shells correlate with growth conditions, including ocean temperature, ocean acidification, and productivity (Schiebel and Hemleben, 2017; Jentzen et al., 2018). Foraminifera species’ long fossil record, short life cycle (~1-3 months) and known environmental affinities make fossil foraminifera valuable for tracking past ocean changes (Lea et al., 2000; Kucera, 2007; Rongstad et al., 2020).
Planktonic foraminifera also record modern, anthropogenic changes in the ocean (Field et al., 2006; Jonkers et al., 2019). In general, foraminiferal assemblages have shifted poleward since the Industrial age (Roy et al., 2015; Jonkers et al., 2019). Gradual changes in foraminiferal assemblages in seafloor sediment samples from the Santa Barbara Basin, California, USA, during the Industrial age correlate with long-term changes in temperature and carbonate chemistry (Field et al., 2006; Pak et al., 2018; Osborne et al., 2020). Marine calcifiers, like foraminifera, are impacted by multiple stressors, like the synergistic effects of increased warming and ocean acidification, which makes it harder for these organisms to build their shells (Russell et al., 2004; Moy et al., 2009; Osborne et al., 2020). These sediment records demonstrate the utility of foraminifera for reconstructing ocean temperature and ocean acidification trends in the California Current. Understanding how modern planktonic foraminiferal assemblages respond to dramatic, transient warming events such as MHWs will help predict how foraminifera will fare under future warming scenarios. This understanding will also improve the interpretation of sediment cores, providing insight into the magnitude and frequency of past warming events and will improve the interpretation of sediment cores obtained from the NCC region.
While foraminifera are widely studied in tropical and subtropical oceans, comparatively fewer studies have been conducted in the NCC, with sediment trap and plankton net studies limited to only a few years (Bradshaw, 1959; Reynolds and Thunell, 1985; Ortiz and Mix, 1992; Ortiz et al., 1995; Davis et al., 2016). These studies showed that foraminiferal assemblages and abundances in the NCC are linked to temperature, salinity, light, and food availability (Ortiz et al., 1995). Previous studies suggest planktonic foraminifera common in the NCC during upwelling periods when the thermocline is shallower include the polar species Neogloboquadrina pachyderma, the subpolar species Turborotalita quinqueloba and Neogloboquadrina incompta, and the transitional species Globigerina bulloides (Ortiz and Mix, 1992). The presence of these species in the NCC varies seasonally, with the species N. pachyderma and G. bulloides associated with colder, upwelled water (Taylor et al., 2018). During periods with a deeper, more stable thermocline and in samples obtained farther offshore, the assemblages consist of subtropical species including Orbulina universa, Neogloboquadrina dutertrei, and Globigerinoides ruber, though the last is in lower abundance (Reynolds and Thunell, 1985; Ortiz and Mix, 1992). In southern offshore waters near the North Pacific subtropical gyre, species diversity increases, and subtropical and tropical species like G. ruber, Trilobatus sacculifer, Globigerinella siphonifera, and Globigerinella calida are present (Figure 1A; Taylor et al., 2018).
To investigate changes in the planktonic foraminiferal assemblage during recent MHWs in the NCC, we analyzed community composition using preserved samples collected during the late summer and fall from a preexisting long-term ocean monitoring program (2010-2019). The samples were collected with vertical plankton net tows (upper 100 meters) at stations from 46 to 370 km offshore along the Newport Hydrographic (NH) Line, a long-term, longitudinal sampling transect off the Oregon coast at a latitude of 44.6°N (Figure 1B). We tested whether the presence or absence of a MHW co-occurred with distinct foraminiferal assemblages across the sampling transect. We also investigated whether the foraminifera community composition changed in response to distance offshore and other potential environmental predictors, as the transect spans gradients in environmental variables including temperature, salinity, and nutrients that are strongly influenced by seasonal upwelling (Huyer, 1983; Bograd et al., 2009; Checkley and Barth, 2009). We found that the planktonic foraminiferal assemblage changed dramatically along with water temperature during the 2014-16 and 2019 MHWs. As the first record of planktonic foraminifera assemblage changes associated with MHWs in the NCC, this archive represents a novel perspective on a planktonic community, one with unique paleoclimate utility that could provide valuable information on the occurrence of warm water anomalies before the modern temperature record. The implications are significant globally because foraminifera play a role in the long-term carbon cycle through shell flux to the deep sea (Schiebel et al., 2007).
2 Materials and methods
Foraminifera were enumerated from previously archived plankton net samples collected from NH Line stations NH25, NH35, NH45, NH65, NH75, NH105, NH125, NH150, NH175, and NH200 during the fall (August-October) from 2010, 2012, and 2014-2019 (Figure 1B; Table 1). Plankton tows were collected using a ½ meter diameter plankton net fitted with 200- µm mesh and towed vertically over the upper 100 m. Juvenile forms and smaller foraminifera species, like T. quinqueloba, may be under-sampled in this archive due to the mesh size of the nets. However, smaller specimens (<100 µm) were routinely found in the net tow samples, indicating they were at least partially represented. The tow volume was recorded using a TSK 2030 flowmeter. Samples were preserved in 5% sodium-bicarbonate (NaHCO3) buffered formalin. Samples were collected at different times of day, and while daytime samples could have missed diel vertical migrators, most studies have shown that planktonic foraminifera do not exhibit this migration pattern (Schiebel and Hemleben, 2017; Meilland et al., 2019). Further, although sampling was limited to the upper 100 m, potentially missing deeper-dwelling species like G. scitula, G. hexagona and G. calida, previous studies have shown that, in this region, foraminifera are most abundant in the upper 100 m (Ortiz and Mix, 1992).
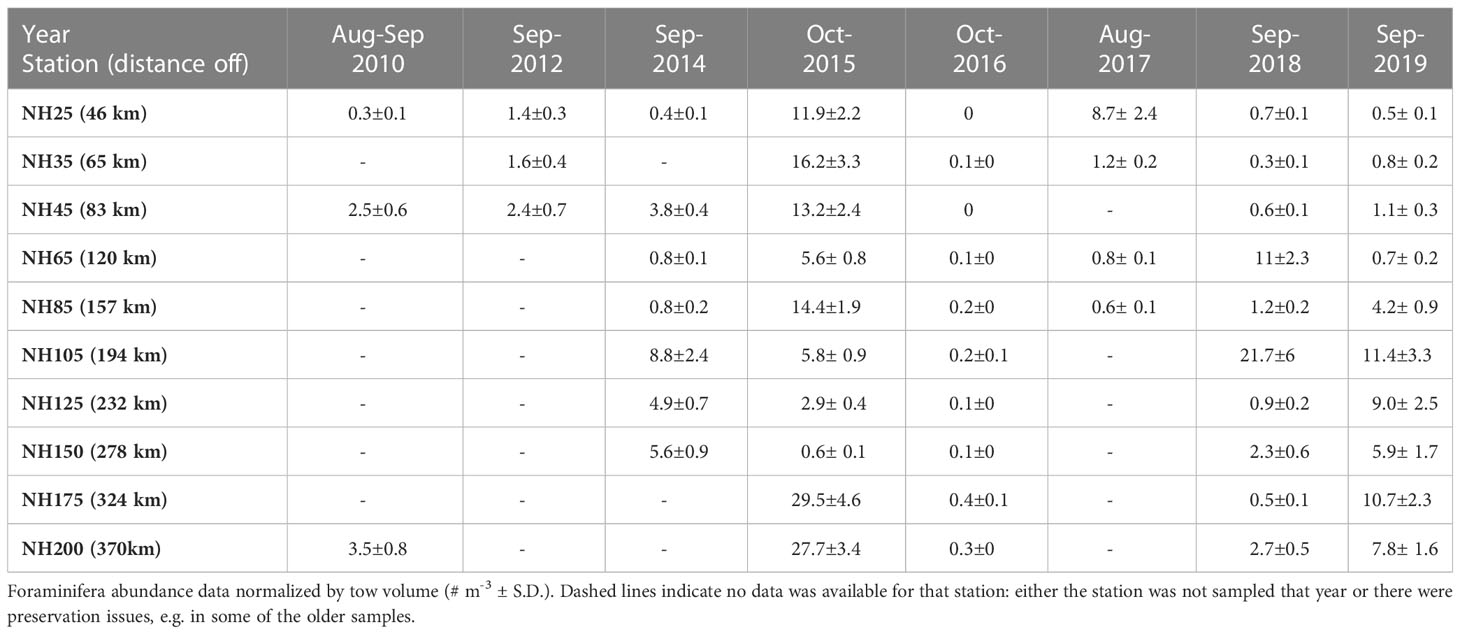
Table 1 Foraminifera abundance data.
Foraminifera were picked from the preserved tow material using a dissecting microscope after pouring and swirling the contents from each sample into a large beaker to isolate the foraminifera into the center. The ‘swirl and pick’ procedure was repeated until all foraminifera were removed from the tow material. Live and dead foraminifera could not be distinguished. Plankton tow samples with a pH <7.5 and less than 5 foraminifera were excluded due to preservation concerns (4 samples out of the total 63). All foraminifera were rinsed in buffered deionized water, air-dried, and transferred to paleontological slides. Foraminifera were identified to species. Counts of each species were normalized by the tow volume to account for the variability in volume between tows, and abundances are reported as the number per cubic meter of tow volume (Table 1; Supplement, Dataset S1). Foraminifera abundances were also reported as percent abundances, i.e., the relative abundance of each species to the total foraminifera abundances, because plankton tows can be ‘patchy’, and this representation helps to standardize across the variability in total abundance among stations or years (Figures 3C, D). Foraminifera species are reported by bioprovince using the classification of Kucera (2007).
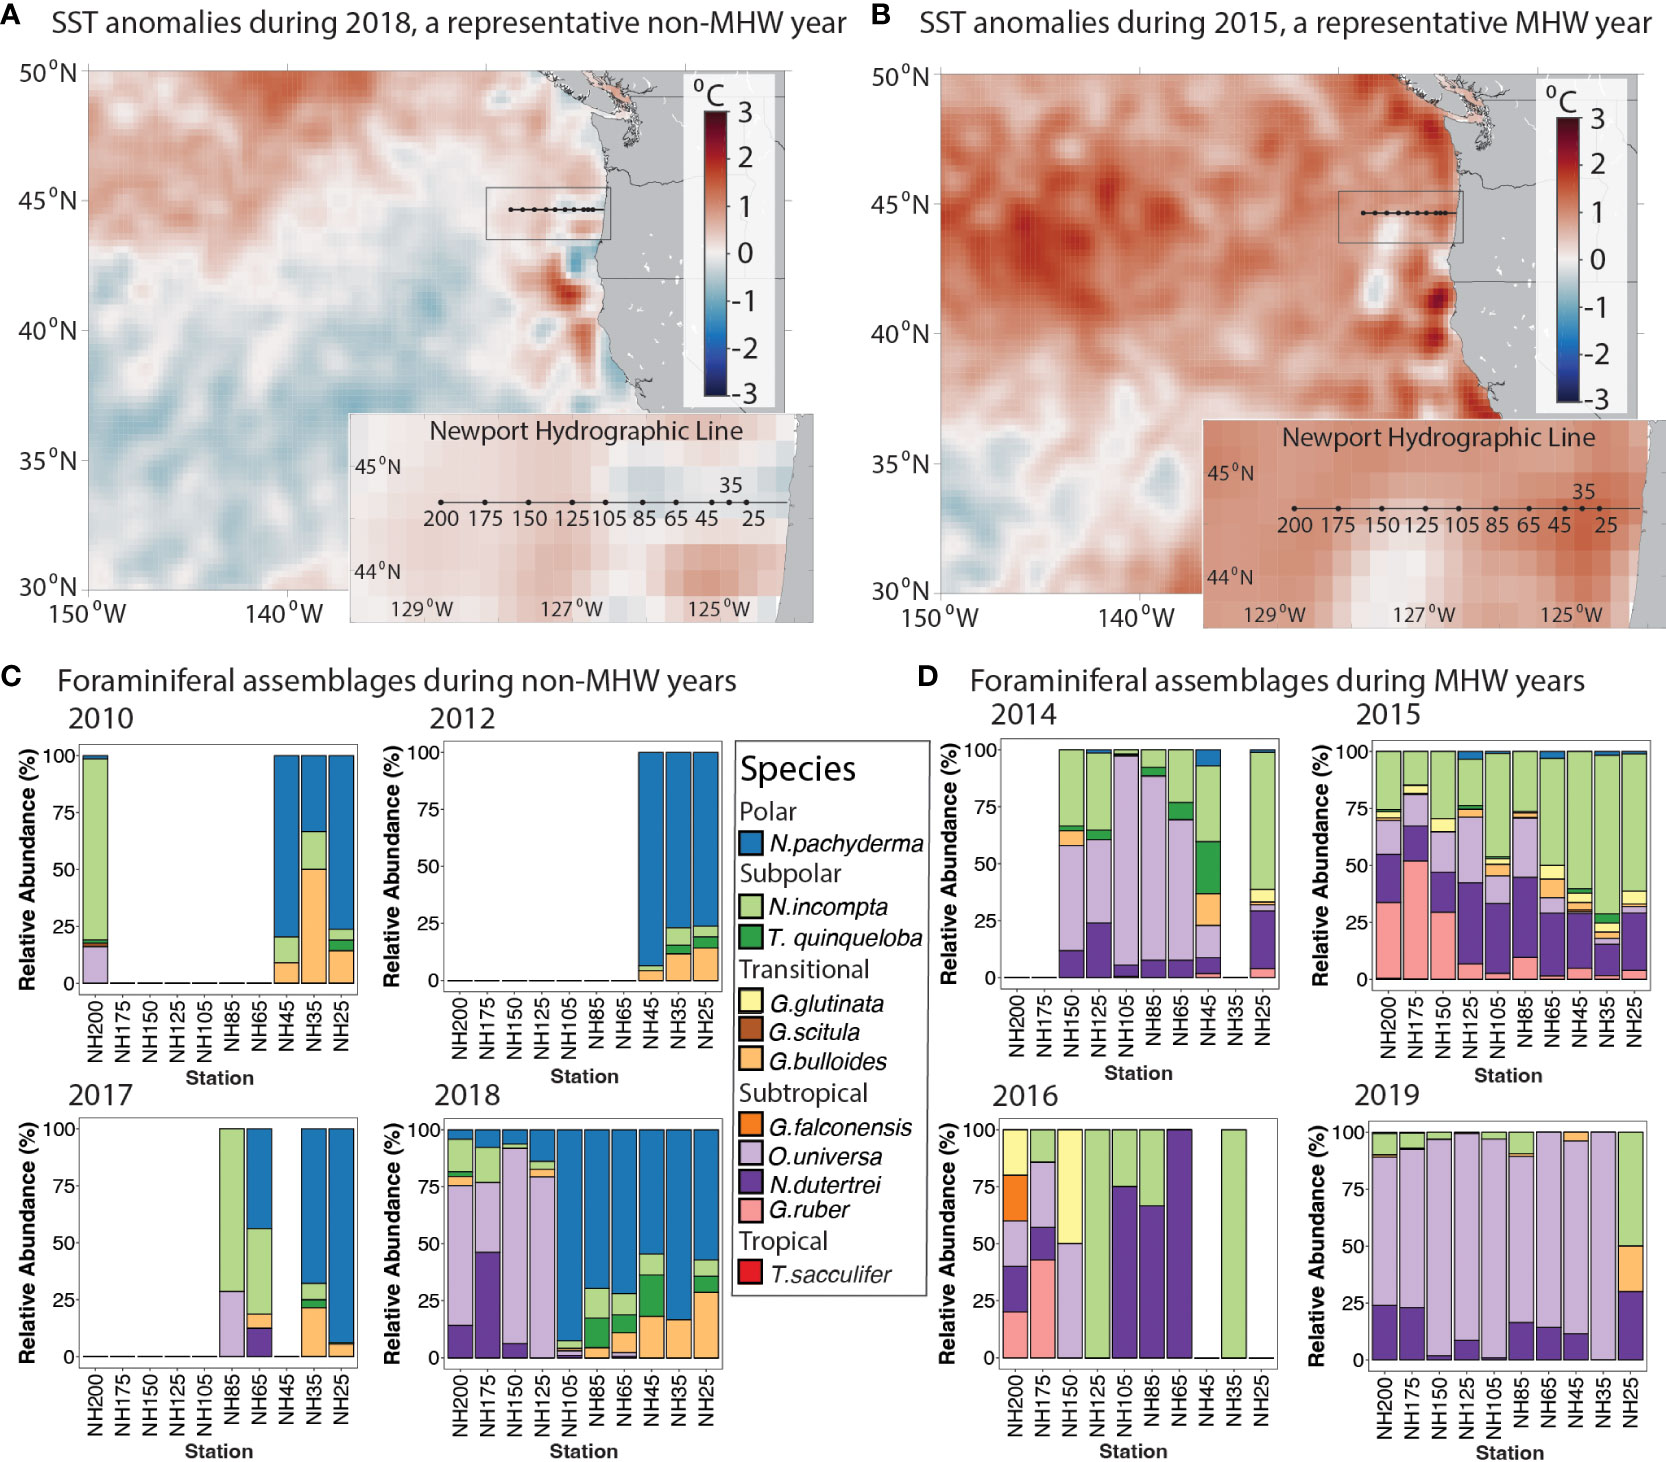
Figure 3 Planktonic foraminifera relative abundances in MHW and non-MHW years. (A, B) Time-averaged sea surface temperature anomalies for (A) 23 August - 21 September 2018, a 30-day period during a representative non-MHW year, and (B) 12 September - 11 October 2015, a 30-day period during a representative MHW year. Anomalies are calculated relative to a 39-year climatological estimate (from OISST, see Methods). (C, D) Foraminifera relative abundance (%) for all available NH Line stations from fall cruises, grouped by years (C) without a MHW and (D) with a MHW. Species are grouped by bioprovince following Kucera (2007). Foraminifera samples were collected in the upper 100 m of the water column. Station name denotes distance in nautical miles offshore, e.g., NH200 is 200 nautical miles offshore.
To visualize the spatial and temporal evolution of the SST anomalies along the NH Line during each MHW, a Hovmöller plot was generated from the Daily Optimum Interpolation Sea Surface Temperature (OISST v2.1) product, which is provided on a 0.25° latitude-longitude grid (Huang et al., 2021). SST anomalies were calculated by subtracting a climatology derived from the best-fit mean plus annual and semi-annual harmonics of SST calculated for the 39-year period 1982-2020 at each grid location (Figure 2). Additionally, 30-day mean SST anomaly plots were generated for the periods 12 September - 11 October 2015 (a MHW year) and 23 August - 21 September 2018 (a non-MHW year) using the same OISST v2.1 product and climatology (Figures 3A, B).
To investigate what environmental correlates corresponded with changes in foraminifera abundances, we considered the following environmental parameters that were co-located with each vertical plankton tow: sea surface temperature (SST), average temperature over the upper 100 m (Ave. Temp), sea surface salinity (SSS), average salinity over the upper 100 m (Ave. Sal), extracted chlorophyll-a concentration (µg L-1) from the deep chlorophyll maximum (DCM). We also considered the mean Biologically Effective Upwelling Transport Index (BEUTI) for the previous 30 days at 45°N, a reanalysis-based estimate of the total vertical nitrate flux upwelled/downwelled (Jacox et al., 2018). Environmental parameters are summarized in the Supplement, Dataset S2. Water column temperature and salinity were collected using a profiling Seabird SBE911 or SBE25 CTD and averaged in 1-m vertical bins. Chlorophyll-a (chl-a) water samples collected from the DCM were immediately filtered through precombusted 25-mm glass-fiber filters and stored at 20°C, then extracted for 12 h in the dark at 20°C using 90% acetone as the solvent (Du et al., 2015). Chlorophyll fluorescence was measured with a Turner Designs©10-AU fluorometer (Turner Designs, Sunnyvale, CA, USA). Chl-a data were log-transformed, and all environmental data were standardized with z-scores to weigh all variables equally. The depth range of the strong temperature anomalies varied from year to year, so we included two temperature and salinity metrics (Table 2; Figure S1). Although environmental variables showed some multicollinearity, all variables were included in the model selection process. The strongest correlation was between Ave.Sal and SST and Ave.Sal and Ave.Temp (Table S1, Pearson correlation coefficient r=0.76 and r=0.78 respectively). To test whether there were significant differences in foraminifera abundances between years with the presence/absence of a MHW, we used a one-way analysis of variance (ANOVA; R Core Team, 2020).
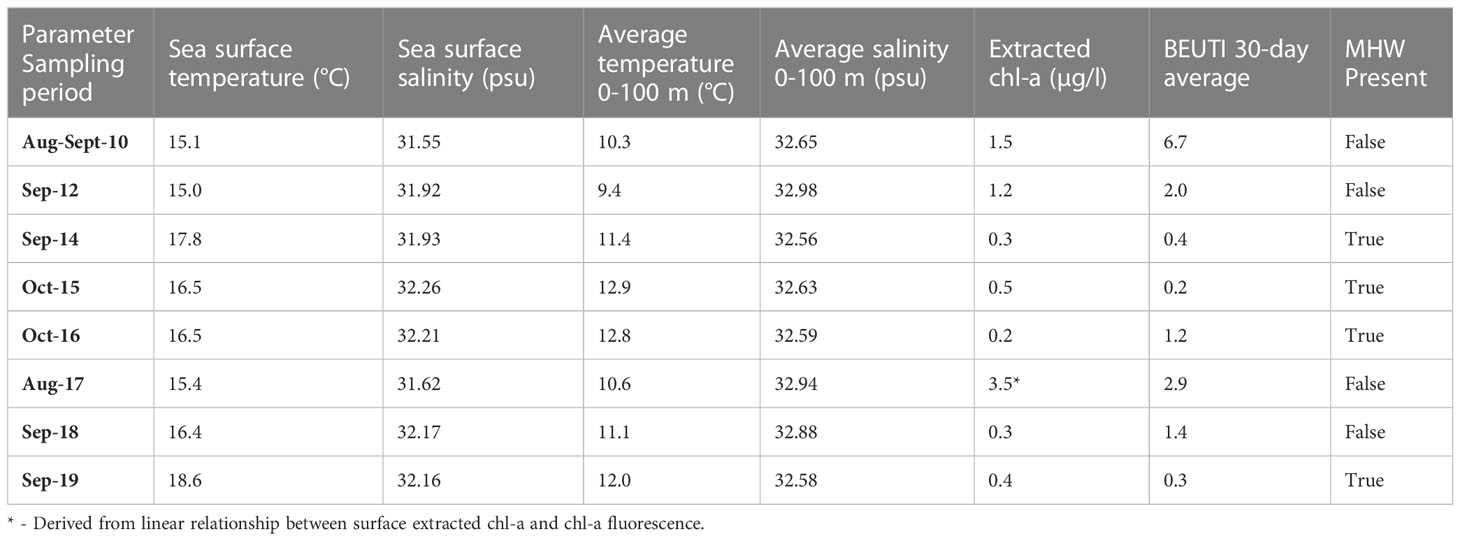
Table 2 Average annual environmental data.
Annual and along-transect trends in the community composition were visualized and evaluated using multivariate methods. Abundance data were square-root transformed to down-weight high abundances in one year and better reveal interannual patterns (Clarke et al., 2014). We conducted analysis on the Bray-Curtis dissimilarity matrix. Samples from 2016 were excluded because they contained insufficient numbers of foraminifera to represent the community, possibly an artifact of the high number of gelatinous organisms also found in the samples. Interannual patterns in the community composition were visualized using a principal coordinates ordination analysis (PCOA) plot (Figure 4A). To determine the contribution of different species, the relative contributions of the five most abundant species – N. pachyderma, N. incompta, N. dutertrei, O. universa and G. ruber – were included on the PCOA as scaled bubbles (Figure 4B). To detect if there is a relationship among stations, distances among centroids for the combined factor ‘Station x MHW’ were calculated and plotted on a PCOA plot (Figure 5).
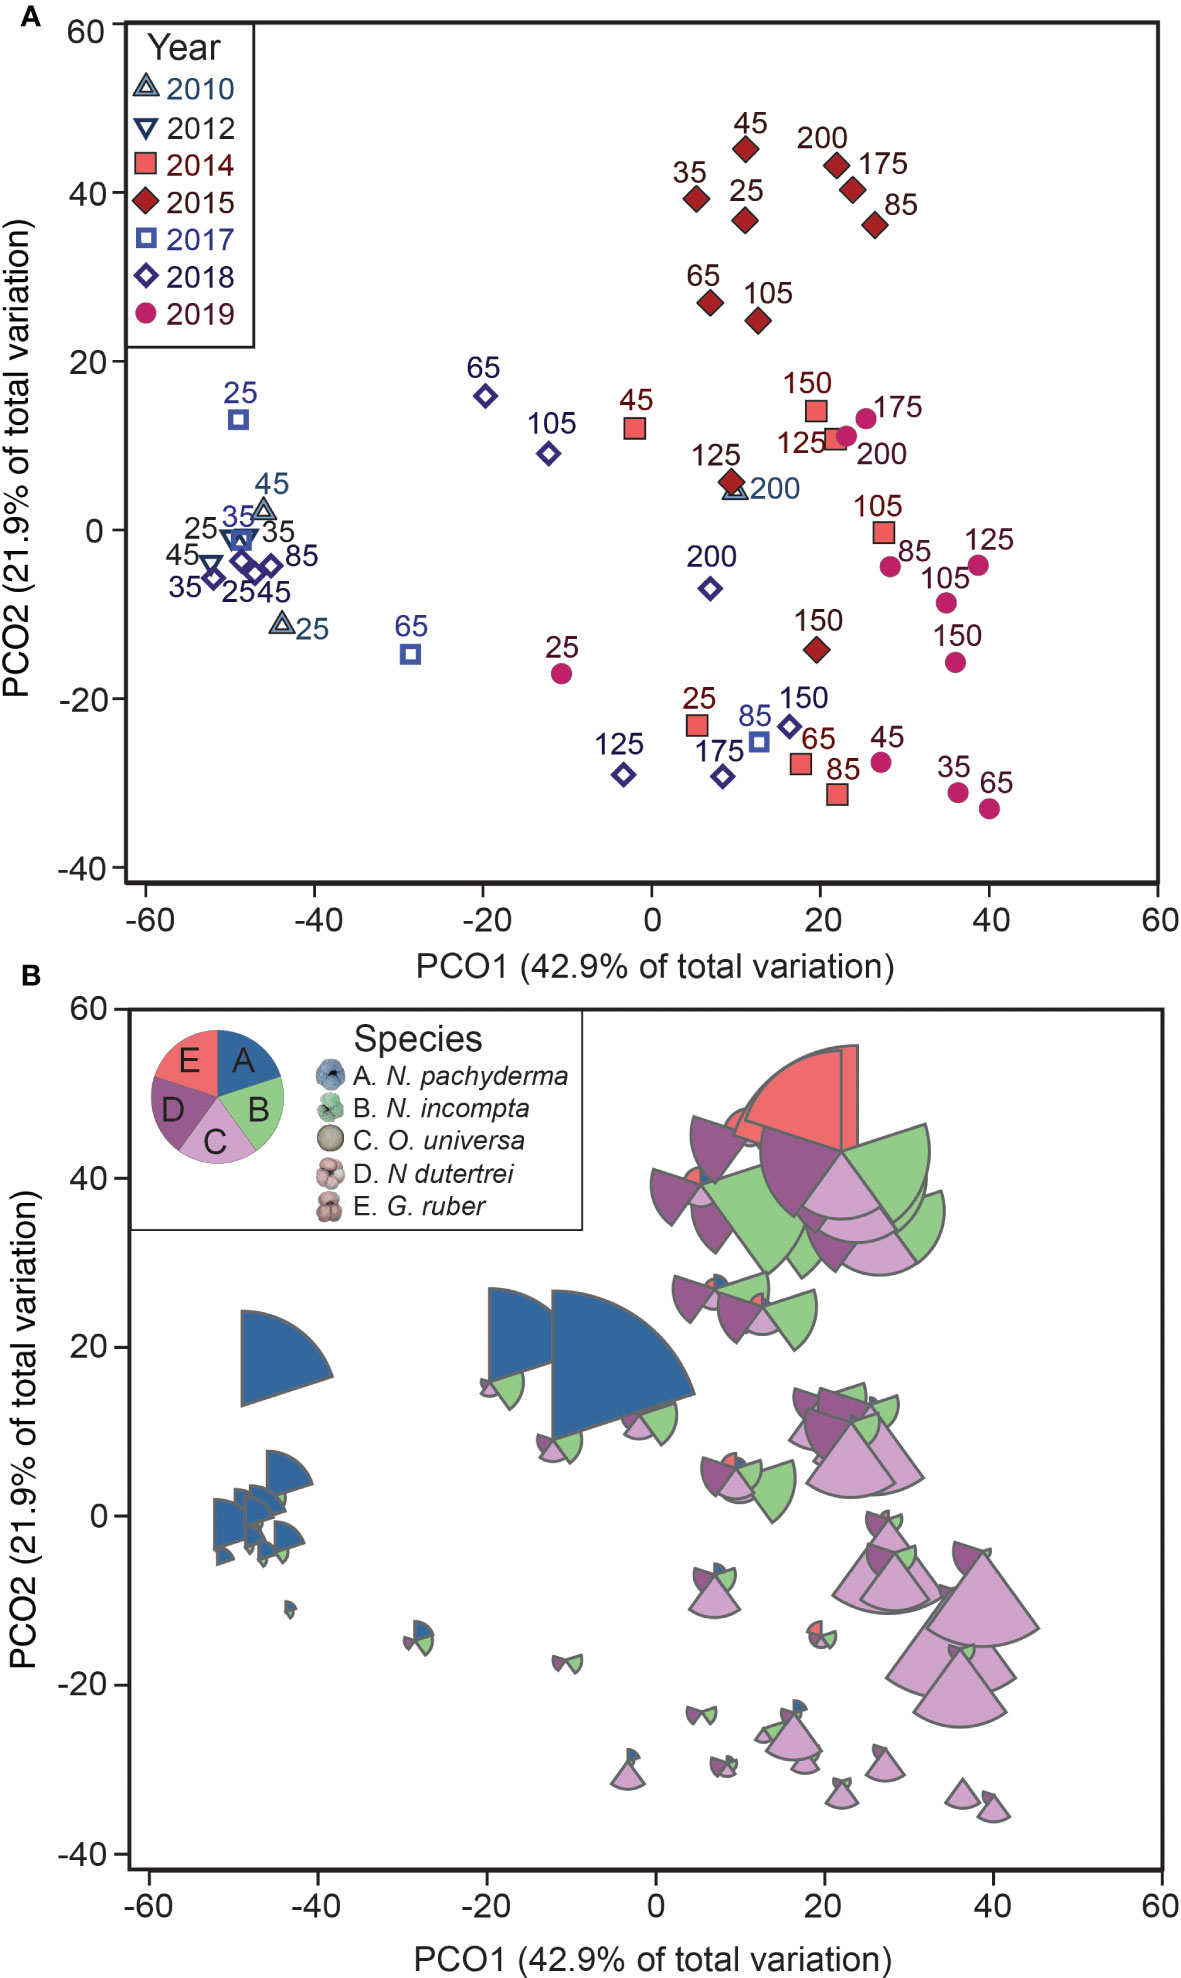
Figure 4 Foraminiferal assemblages highlighting annual and species distribution patterns. The foraminifera abundance data shown in a principal coordinates ordination analysis (PCOA) plot of square-root transformed Bray-Curtis resemblance matrix for all foraminifera abundance data (excluding 2016). The axes in A and B are identical. The upper plot (A) highlights the patterns in different stations and different years, and the lower plot (B) includes patterns in species abundances, with the five most abundant species plotted as bubbles. All slices of the bubbles are scaled from the foraminifera density (0-4 # m-3).
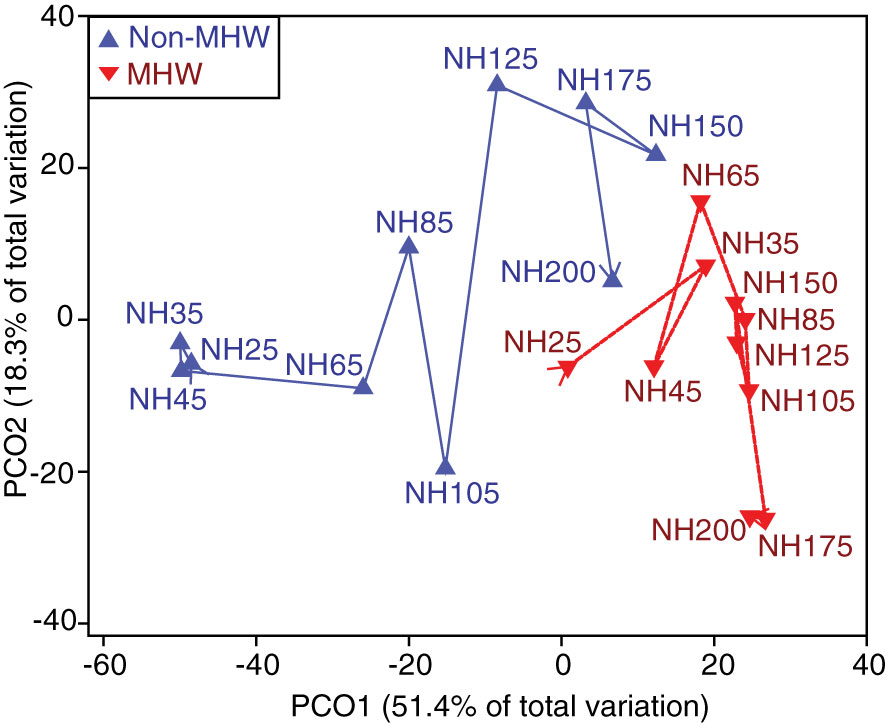
Figure 5 Foraminiferal assemblage patterns along the NH Line transect. A PCOA plot of the distances among centroids for each station. Station centroids are differentiated for years with a MHW (red) and years without a MHW (blue). The overlaid trajectory shows increasing distance offshore from NH25 increasing to NH200.
A permutational multivariate analysis of variance (PERMANOVA) routine (Anderson et al., 2008) was used to partition the variation in the foraminiferal assemblages between years with and without a MHW. The PERMANOVA partitions variance in the multivariate space as defined by the resemblance matrix (here, Bray-Curtis dissimilarity) and simultaneously tests the response of many covariates (Anderson et al., 2008). The PERMANOVA design included MHW as a fixed factor, with year as a nested, random factor and distance offshore as a quantitative covariate. PERMANOVA assumes homogeneity of variance between pre-defined groups (Anderson et al., 2008). The dispersion between the two groups — MHW and non-MHW — was tested using the homogeneity of multivariate dispersions routine (PERMDISP with 9999 permutations). The dispersion between the two primary groupings of these data, the presence or absence of a MHW, was not significant (PERMDISP routine, p=0.9).
We tested which environmental variables best predicted the variation in the foraminiferal assemblages using a distance-based linear modeling (DistLM) multiple regression approach (Anderson et al., 2008). We used forward selection, sequential tests to select the best number of variables to include in the model. The most parsimonious model was selected based on the lowest Akaike Information Criterion corrected (AICc) model selection criteria (Sugiura, 1978). AICc was selected due to the relatively small sample size (Burnham and Anderson, 2002). The final ordination was then constrained based on the maximum variation of the environmental variables using distance-based redundancy analysis (dbRDA; Figure 6). Significant environmental variables from the DistLM were plotted as vectors (p<0.05; Figure 6). All multivariate analyses were completed using the statistical software PRIMER-e with the PERMANOVA+ add-on package (Anderson et al., 2008).
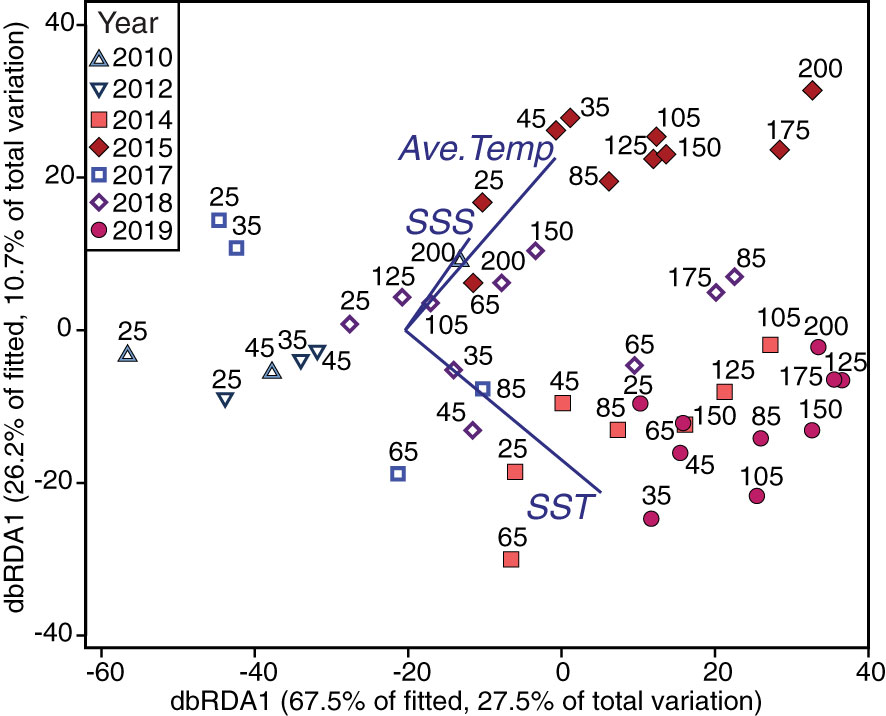
Figure 6 Constrained ordination predicting foraminiferal assemblages from significantly related environmental variables. Foraminifera abundance data plotted as predicted by the environmental data, using redundancy analysis (dbRDA) of dissimilarities calculated on a Bray-Curtis resemblance matrix using square-root transformed foraminifera abundances. Labels indicate NH Line station and colors/symbols indicate different years. The dbRDA model explains 38.2% of the total variation of the foraminifera data. The significant environmental variables, sea surface temperature (SST), sea surface salinity (SSS), and average temperature over the upper 100-m (Ave. Temp), are plotted as vectors with their direction signifying the direction of forcing on the ordination. Best model fit and significant variables were identified using distance-based linear modelling (DistLM).
3 Results
During the MHW years 2014-2016 and 2019, the NH Line experienced anomalously warm SSTs across the entire longitudinal transect (Figure 2). Average 0-100 m temperatures across the transect were higher than in other years, particularly during 2015 and 2016 (~12.9 and 12.8°C; Table 2). Estimated upwelling and primary productivity were reduced (Table 2). During non-MHW years 2010, 2012, 2017, and 2018, SST anomalies were generally negative nearer the coast at the time of sampling, and SST anomalies increased moving offshore along the Newport Hydrographic Line (Figure 2). For example, in 2018, over the month prior to sampling, stations NH25 - NH85 exhibited negative average SST anomalies and stations offshore of NH105 had neutral to slightly positive SST anomalies (Figure 3A). Although the foraminiferal assemblages were highly variable from year to year and station to station, there were robust differences between the MHW and non-MHW years.
During the MHW years, the planktonic foraminifera community composition was less variable across the transect than during non-MHW years (Figures 3D, 4). In late 2014, within a month of the onset of the 2014-2016 MHW, subtropical species N. dutertrei and O. universa were higher in abundance compared to the previous years (averaging 14% and 41% of relative abundance, respectively; Figures 3D, 4B) and the polar species N. pachyderma decreased to <10% of abundance at all stations. In October 2015, during the peak warming of the 2014-2016 marine heatwave (~2.0°C SST anomalies on monthly time scales, Figure 3B) the foraminiferal assemblage was dominated by the subpolar species N. incompta (40%) at the more nearshore stations and the subtropical species N. dutertrei (25%) and G. ruber (15%) farther offshore (Figures 3D, 4B). The subtropical species G. ruber abundances ranged from 2-10% of the total in the more coastal stations to >50% in the offshore station NH175 (Figure 4B). The tropical species T. sacculifer was also present at the offshore stations NH175 and NH200, though in low abundance (<1%, present but not visible in Figure 3D). In 2016, assemblages were like 2015, except T. sacculifer was absent (Figure 3D). In 2019, within a month of the onset of the second MHW, the subtropical species O. universa and N. dutertrei again dominated the foraminiferal assemblages, similar to the onset of the 2014-2016 MHW, although the subpolar species N. incompta was less common than in 2014 (Figures 3D, 4B).
During the non-MHW years, the polar species N. pachyderma and transitional species G. bulloides were dominant at the most nearshore stations NH25-NH45 (~70% and ~20% of relative abundance respectively; Figures 3C, 4B). These nearshore communities were associated with productive, colder water near the coast, and extended offshore as far as NH105 in 2018, possibly due to recently upwelled water (~10.3°C average through the upper 100 m; Table 2 and Figure 2). In warmer waters farther offshore, the foraminiferal assemblages were more variable across the different non-MHW years (Figure 3C). In 2010, the offshore station was dominated by the subpolar species N. incompta (79% relative abundance), while in 2018 the offshore stations were dominated by the subtropical species O. universa (~60% of the relative abundance; Figures 3C, 4B).
Total foraminifera abundances, normalized by net tow volume, were highly variable among years (Figure 3; Table 1). There was an average of 4.9 ± 7 (S.D.) foraminifera m-3 across all samples (Table 1). The average foraminifera abundances were lower for non-MHW years 2010 and 2012 than average (although those years are represented by only 3 out of 10 stations). Foraminifera density increased in 2014, at the onset of the 2014-2016 MHW, and peaked in 2015 (Table 1). In 2016, in the last year of the 2014-2016 MHW, foraminifera abundances were extremely low (Table 1), possibly due to a bloom of gelatinous organisms that can consume foraminifera (O’Loughlin et al., 2020). In 2017 and 2018, after the first MHW dissipated, foraminifera density returned to near average values, (note in 2017 data were available for only 4 out of 10 stations; Table 1), except for the high abundances (or ‘blooms’) of the polar species N. pachyderma at several individual stations (NH25 in 2017 and NH65 and NH105 in 2018; Figures 3C, 4B). During the 2019 MHW, foraminifera densities were higher (Table 1). Maximum abundances occurred in October 2015 at Station NH175 and NH200 (29.5 and 27.7 foraminifera m-3, respectively) and in September 2017 at Station NH105 (21.7 m-3, Table 1). Despite the variable average abundances, there was no significant difference in transect-averaged abundances (one-way ANOVA, p>0.05) between years with and without a MHW.
While the transect-averaged abundances did not differ with the presence or absence of a MHW, changes in the foraminiferal assemblages were striking. Foraminiferal assemblages varied primarily with the presence or absence of a MHW and only secondarily by year or distance offshore (Figures 4, 5). In a multivariate analysis (PCOA), communities sampled during the non-MHW years 2010, 2012, and 2017 clustered tightly and separately from those sampled during the MHW years 2014, 2015, and 2019 (Figure 4A). In 2018, the only non-MHW year with data from the entire NH line transect from NH25 to NH200, assemblages at the more nearshore stations (NH25-NH105) clustered with the non-MHW years while assemblages at the offshore stations (NH125 – NH200) clustered with the MHW years, (Figures 4, 5, S1). During the MHW years, assemblages from 2014 and 2019 clustered separately from the 2015 stations (Figure 4A). As mentioned above, assemblages during non-MHW years were dominated by the polar species N. pachyderma, which was rare during the MHW years (Figure 4B). Assemblages during the MHW years were more variable and were dominated by the subtropical species O. universa in 2014 and 2019 and by a mixture of subpolar and subtropical species in 2015 (Figure 4B).
Foraminifera community composition varied significantly between years with and without a MHW and along the transect, as revealed by a PERMANOVA test. There were statistically significant differences in foraminiferal assemblages between years with and without a MHW (p<0.05); among individual years (p<0.05); and with distance offshore (p<0.05) (Table 3). The interaction between distance offshore and MHW and the interaction between distance offshore and year were all significant (Table 3, p<0.05) indicating that the offshore gradient in foraminiferal assemblages was different between years with and without a MHW. During MHWs, most stations had similar foraminifera communities, regardless of distance offshore (Figures 3D, 5).

Table 3 PERMANOVA Results.
Temperature and salinity patterns provided significant statistical skill in predicting foraminiferal assemblages (DistLM, Anderson et al., 2008). The most parsimonious distance-based linear model as a function of physical predictor variables of the foraminiferal assemblage included SST, SSS, and the average temperature in the upper 100 m of the water column (R2 = 0.41). SST was the best single variable predictor, explaining ~25% of the variability of the assemblages (Table 4), though all environmental variables were significant as single predictors of the variation (marginal tests, Table 4). Differences in the foraminiferal assemblages, constrained by the most parsimonious model from the DistLM analysis, revealed a separation in ordination space between years with and without a MHW (Figure 6). During non-MHW years, the stations closer to the coast were well-separated in ordination space from all the stations sampled during MHW years, while some of the offshore samples during non-MHW years clustered within the samples from MHW years (Figure 6). SSS, SST, and average temperature in the upper 100 m were the main environmental drivers separating the MHW and non-MHW years (Table 4). During the MHW years, the foraminiferal assemblages in 2014 and 2019 clustered separately from the foraminiferal assemblage in 2015 (Figure 6). The vectors of the average temperature over the upper 100 m (Ave. Temp) and surface temperature (SST) were orthogonal to one another, indicating differential assemblage shifts during MHW years in response to differences in water column structure, characterized by shallow warming during the 2014 and 2019 events as compared to 2015, when the warm water extended deeper in the water column (see Introduction and Figure 6).
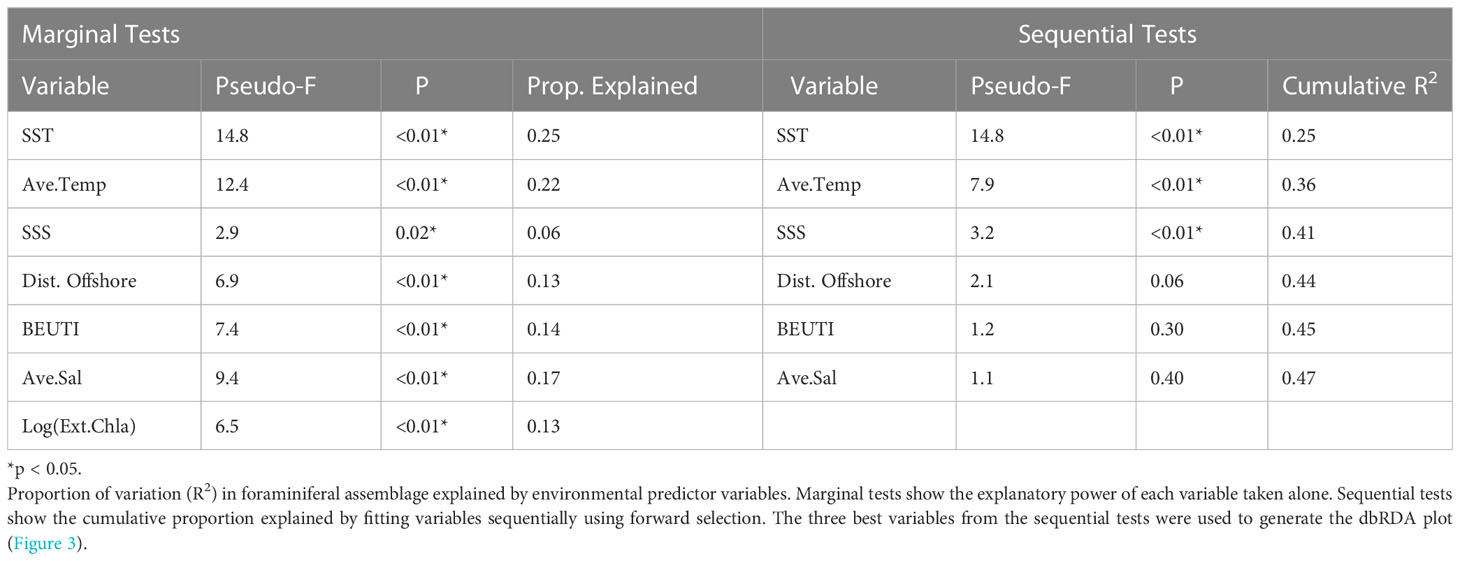
Table 4 DistLM Results.
4 Discussion
Foraminiferal assemblages in the NCC region underwent substantial interannual changes associated with SST changes driven by regional MHWs. In years without a MHW, and consistent with previous studies (Ortiz and Mix, 1992), foraminiferal assemblages along the section of the NH Line nearer the coast (NH25 - NH105) were dominated by polar, subpolar, and transitional species, while offshore assemblages included subtropical species (Figures 3C, 5). In contrast, during the MHWs (2014-2016 and 2019), the planktonic foraminiferal assemblage along the entire transect was dominated by subtropical species (Figures 3D, 5). Because planktonic foraminifera are preserved in deep sea sediments, these results indicate the potential utility of foraminifera to detect MHWs in the fossil record in this region.
Over the last decade, the common assemblages at more nearshore stations included the polar species N. pachyderma, subpolar species N. incompta, and transitional species G. bulloides, while offshore assemblages included the subtropical species N. dutertrei and O. universa (Figure 3). The assemblage transitioned from colder water species typically associated with productive water masses to warmer water species associated with less productive water masses along the transect (Schiebel and Hemleben, 2017). This shift was correlated with distance offshore, possibly due to the longitudinal water temperature gradient typically driven by upwelling (Table 3; Figure 5). Although offshore data availability was limited during 2010, 2012, and 2017 due to preservation and sampling issues, these patterns were consistent with previous studies in this region (Ortiz and Mix, 1992; Ortiz et al., 1995). Our analysis points to the following question for future studies to address: is there a consistent transition from a more upwelling-influenced, productive, nearshore community to an oligotrophic community offshore along the NH Line (~NH105, Figure 5)?
The high abundances, or ‘blooms’, of the polar species N. pachyderma at several stations in 2017 and 2018 is consistent with other studies that suggest upwelling can influence their abundance in this region (Figures 3C, 4B; Davis et al., 2016). G. bulloides, a species often associated with signatures of upwelling in the California Current (Ortiz et al., 1995; Taylor et al., 2018), was present in these samples, but was not as abundant as N. pachyderma during the late upwelling season (Figure 3B). G. bulloides was not associated with upwelling in a central California Current study (Davis et al., 2016) and had a seasonally bimodal distribution in another NCC study (Ortiz and Mix, 1992). Several genotypes of G. bulloides are present in this region and it is possible that the different genotypes have different ecological preferences that do not always correlate with upwelling conditions (Darling et al., 2017; Taylor et al., 2018).
During the MHWs in 2014-2016 and 2019, the planktonic foraminiferal assemblages were composed primarily of subtropical species along the entire transect, though species’ relative abundances varied with the depth of the warm water anomaly. In 2014-2016, the planktonic foraminiferal assemblages were dominated by the species O. universa, N. dutertrei, N. incompta and G. ruber, that are typically associated with subtropical and transitional bioprovinces and less common in upwelling regions (Kucera, 2007; Schiebel and Hemleben, 2017). During the short duration fall 2019 MHW, which reached the NCC region a month prior to sampling (Amaya et al., 2020), the prevalence of subtropical species O. universa and N. dutertrei along the entire NH Line suggests that planktonic foraminiferal assemblages can respond rapidly to transient warming events (Figures 2, 3). Estimated upwelling was reduced during both MHWs (Table 2). During the MHWs, the cold-water foraminifera species G. bulloides and N. pachyderma were rare (Figures 3D, 4B), leading to less longitudinal variability in the foraminiferal assemblage compared to non-MHW years (Figure 5).
Changes in the foraminiferal assemblage and abundances were particularly prominent in 2015, at the peak of the first MHW, when the anomalously warm water penetrated most of the upper 50 m of the water column (Figures 6, S1). During this period, subtropical and tropical species were more abundant compared to the shallower warm water anomalies in the fall 2014 and 2019 (Figure 4B). The depth of the MHW was a significant contributor to predicting the foraminiferal assemblages, as modeled by differences in the sea surface temperatures versus the average temperatures over the upper 100 m of the water column (Figure 6). We postulate that the high abundance of the warmer water species in 2015 reflects a more favorable habitat for foraminifera productivity, with a more stable upper water column favoring the growth of warm water species.
During the 2015 MHW, the very high abundances of the subtropical species G. ruber, which are uncommon in the NCC, and the first known occurrence of the tropical species T. sacculifer are striking. Although G. ruber has been identified in this region, previous studies found it to be more common in the subtropical gyre waters more than 500 km offshore (~10%) and rare (<0.1%) in stations within 220 km of the coast (Ortiz et al., 1995). Our study found G. ruber was more abundant along the entire transect in 2015, representing ~30-50% of the relative abundance of offshore stations NH150 – NH200 (278 – 370 km offshore) and ~5% of the relative abundance at the remaining stations (46 – 232 km offshore, Figure 3B). T. sacculifer has not been previously identified in this region and has only been found south of ~35°N latitude (Taylor et al., 2018). In our study, T. sacculifer was observed in 2015 at NH200, the offshore station with SST near 18° C. Both T. sacculifer and G. ruber are algal symbiont-bearing, spinose species associated with warmer (>15°C and abundant at >22°C) and more oligotrophic waters (Kretschmer et al., 2018) and the North Pacific subtropical gyre (Eguchi et al., 2003).
The exact mechanism for the presence and high abundance of these warm water and novel species in the NCC is unclear, but similar patterns were seen across other plankton communities in this region including six novel copepod species and two novel larval fish species (Peterson et al., 2017; Auth et al., 2018; Du and Peterson, 2018; Brodeur et al., 2019). The prolonged warming during the 2014-2016 MHW may have promoted ideal conditions for warm water foraminifera to reproduce and maintain a high standing stock. It could also be the result of oceanic transport of warmer water species from different source waters compared to the source waters associated with more usual El Niño cycles (Peterson et al., 2017; Du and Peterson, 2018).
The pronounced changes in the foraminiferal assemblages in association with the presence and absence of MHWs, as described above, have implications for paleoecology (Schiebel and Hemleben, 2017). Warmer water foraminiferal assemblages were present along the transect in 2014 and 2019, two sampling periods conducted only a few weeks after the most extreme SST anomalies associated with the MHWs reached the region (Figure 2; Peterson et al., 2017; Thompson et al., 2019). After prolonged warming, a novel, tropical foraminifera species was present in the region. These warm water foraminifera species did not persist in this region for multiple years, but were replaced with the more common colder water species during the interceding non-MHW years (2017-2018, Figure 3C). This record of assemblage changes helps efforts to predict the biological response to a warming ocean under anthropogenic climate change, but also aids in the interpretation of the presence of rare taxa in the fossil record. While short term MHWs would potentially be obscured in bioturbated sediments, they would be present in laminated sediments (Pak et al., 2018). Prolonged MHWs would potentially be identified in the sediment record as transient, thermophilic species. For example, the short-term increase in warm taxa at 150 kybp in the Santa Barbara Basin could be indicative of a transient, regional, warming event (See Figure 8 in Kennett and Venz, 1995). Future studies of foraminiferal assemblages in well-preserved sediments could consider the expected paleo-signature of regional, transient warming events compared to long-term ecosystem changes and trends.
These results demonstrate that the foraminiferal assemblage response to transient warming events makes them a promising tool for quantifying the frequency and intensity of marine heatwaves in the paleorecord in the NCC and elsewhere. Consistent with this idea, there were significant changes in foraminiferal assemblages collected from sediment traps during a period of high SST at Station Papa in the North Pacific between August 1985 to July 1986 (Sautter and Thunell, 1989). Similar to our study, the warmer water species O. universa was abundant in the samples throughout that ‘anomalously warm’ period. In the paleo record from the Santa Barbara Basin, a similar shift from cold to warm water species was identified in sediment trap samples coinciding with the strong 1997-98 El Niño (Black et al., 2001). These short duration assemblage changes should be detectable as short-term increases in warm water species in sediment cores, particularly in laminated, high sedimentation rate cores, and could potentially be used to detect paleo-MHWs. High abundances of subtropical species in areas where those species are not usually abundant could be indicative of a particularly intense warming event (i.e., G. ruber or T. sacculifer in the 2015 MHW).
The NH Line sampling plan was designed for fisheries research, but could be resampled to provide valuable insight about planktonic foraminiferal assemblages. Our use of the existing archive allowed for the first report of foraminiferal assemblages’ variations in association with extratropical warming in this region. While the NH line sampling plan was not originally designed to target planktonic foraminifera, the samples provided a unique opportunity to study planktonic foraminiferal assemblages in the NCC region over a decade when dedicated foraminifera sampling did not often occur. Plankton distributions can be patchy, so planktonic foraminifera caught in plankton nets provide a ‘snapshot’ of current assemblages, but they also reflect differences in species’ depth habitat preferences, advection or transport in ocean currents, and ontogeny over longer time scales (Schiebel and Hemleben, 2017). Remaining archive samples could be used in the future to address abundance and assemblage shifts in response to other climate perturbations.
The NH Line archive also provides much-needed information about planktonic foraminifera in a region particularly prone to the effects of climate change, including ocean acidification (Feely et al., 2008; Gruber et al., 2012). Seasonally upwelled waters in the NCC are frequently low in dissolved oxygen and have a relatively low pH (Feely et al., 2008). Atmospheric increases in CO2 due to anthropogenic input will further lower ocean pH in the surface ocean, leading to rapid ocean acidification in the NCC (Gruber et al., 2012) and has already reduced foraminiferal calcification (Osborne et al., 2020). Considering the pH of open ocean surface waters has decreased by ~0.1 units and is expected to decline another 0.3-0.4 units by the end of this century (Orr et al., 2005), the potential effects of combined stresses of MHWs and ocean acidification are important unknowns. Future studies should resolve changes in planktonic foraminifera adult size, calcification intensity, and net calcification during NCC MHWs. The implications of ocean acidification, coupled with transient warming events like MHWs, for foraminifera have global significance because foraminiferal shell flux is an important global carbon sink (Schiebel et al., 2007).
Data availability statement
The original contributions presented in the study are included in the article/Supplementary Material. Further inquiries can be directed to the corresponding author.
Author contributions
MKL, JSF, and JLF contributed to conception and design of the study. MKL, JSF, GM, FS collected the data. MKL and CR performed the statistical analysis. MKL wrote the first draft of the manuscript. MKL, JSF, JLF, MF, BC, and CR contributed to manuscript revision. All authors contributed to the article and approved the submitted version.
Funding
MKL was supported by NSF GRFP Grant 1840998 and the ARCS Scholarship program. Sample collection was supported by NOAA Fisheries. JSF was supported by NSF OCE grant 2049143. MF and CR were supported by NOAA’s Climate Program Office, Climate Monitoring Program grant NA17OAR4310154 and NASA Ocean Vector Winds Science Team grant 80NSSC18K1611.
Acknowledgments
We would like to thank and acknowledge the captains, crew and science parties who collected these samples. We thank Marti Anderson for her help with multivariate analysis approaches and June Padman for her help with species identification. Special thanks to Jim Kelly for help picking foraminifera.
Conflict of interest
The authors declare that the research was conducted in the absence of any commercial or financial relationships that could be construed as a potential conflict of interest.
Publisher’s note
All claims expressed in this article are solely those of the authors and do not necessarily represent those of their affiliated organizations, or those of the publisher, the editors and the reviewers. Any product that may be evaluated in this article, or claim that may be made by its manufacturer, is not guaranteed or endorsed by the publisher.
Supplementary material
The Supplementary Material for this article can be found online at: https://www.frontiersin.org/articles/10.3389/fmars.2023.1155761/full#supplementary-material
References
Amaya D. J., Miller A. J., Xie S.-P., Kosaka Y. (2020). Physical drivers of the summer 2019 north pacific marine heatwave. Nat. Commun. 11 (1), 1903. doi: 10.1038/s41467-020-15820-w
Anderson M. J., Gorley R. N., Clarke K. R. (2008). PERMANOVA+ for PRIMER: Guide to software and statistical methods (Plymouth, UK: PRIMER-E).
Auth T. D., Daly E. A., Brodeur R. D., Fisher J. L. (2018). Phenological and distributional shifts in ichthyoplankton associated with recent warming in the northeast pacific ocean. Global Change Biol. 24 (1), 259–272. doi: 10.1111/gcb.13872
Black D. E., Thunell R. C., Tappa E. J. (2001). Planktonic foraminiferal response to the 1997–1998 El niño: A sediment-trap record from the Santa Barbara basin. Geology 29 (12), 1075. doi: 10.1130/0091-7613(2001)029<1075:PFRTTE>2.0.CO;2
Bograd S. J., Schroeder I., Sarkar N., Qiu X., Sydeman W. J., Schwing F. B. (2009). Phenology of coastal upwelling in the California current. Geophysi. Res. Lett. 36 (1). doi: 10.1029/2008GL035933
Bond N. A., Cronin M. F., Freeland H., Mantua N. (2015). Causes and impacts of the 2014 warm anomaly in the NE pacific. Geophysi. Res. Lett. 42 (9), 3414–3420. doi: 10.1002/2015GL063306
Bradshaw J. S. (1959). No. 196. ecology of living planktonic foraminifera in the north and equatorial pacific ocean. Contributions Cushman Foundation Foraminiferal Res. X (2).
Brodeur R. D., Auth T. D., Phillips A. J. (2019). Major shifts in pelagic micronekton and macrozooplankton community structure in an upwelling ecosystem related to an unprecedented marine heatwave. Frontiers in marine science. 6 212. doi: 10.3389/fmars.2019.00212
Burnham K. P., Anderson M. J. (2002). Model selection and multi-model inference: A practical information- theoretic approach. 2nd edition (New York, NY, USA: Springer New York).
Checkley D. M., Barth J. A. (2009). Patterns and processes in the California current system. Prog. Oceanogr. 83 (1–4), 49–64. doi: 10.1016/j.pocean.2009.07.028
Clarke K. R., Gorley R. N., Somerfield P. J., Warwick R. M. (2014). Change in marine communities: An approach to statistical analysis and interpretation. 3rd edition (Plymouth, UK: PRIMER-E).
Darling K. F., Wade C. M., Siccha M., Trommer G., Schulz H., Abdolalipour S., et al. (2017). Genetic diversity and ecology of the planktonic foraminifers globigerina bulloides, turborotalita quinqueloba and neogloboquadrina pachyderma off the Oman margin during the late SW monsoon. Mar. Micropaleontol. 137, 64–77. doi: 10.1016/j.marmicro.2017.10.006
Davis C. V., Hill T. M., Russell A. D., Gaylord B., Jahncke J. (2016). Seasonality in planktic foraminifera of the central California coastal upwelling region. Biogeosciences 13 (18), 5139–5150. doi: 10.5194/bg-13-5139-2016
Du X., Peterson W. T. (2018). Phytoplankton community structure in 2011–2013 compared to the extratropical warming event of 2014–2015. Geophysi. Res. Lett. 45 (3), 1534–1540. doi: 10.1002/2017GL076199
Du X., Peterson W., O’Higgins L. (2015). Interannual variations in phytoplankton community structure in the northern California current during the upwelling seasons of 2001-2010. Mar. Ecol. Prog. Ser. 519, 75–87. doi: 10.3354/meps11097
Eguchi N. O., Ujiié H., Kawahata H., Taira A. (2003). Seasonal variations in planktonic foraminifera at three sediment traps in the subarctic, transition and subtropical zones of the central north pacific ocean. Mar. Micropaleontol. 48 (1–2), 149–163. doi: 10.1016/S0377-8398(03)00020-3
Feely R. A., Sabine C. L., Hernandez-Ayon J. M., Ianson D., Hales B. (2008). Evidence for upwelling of corrosive “Acidified” water onto the continental shelf. Science 320 (5882), 1490–1492. doi: 10.1126/science.1155676
Field D. B., Baumgartner T. R., Charles C. D., Ferreira-Bartrina V., Ohman M. D. (2006). Planktonic foraminifera of the California current reflect 20th-century warming. Science 311 (5757), 63–66. doi: 10.1126/science.1116220
Frölicher T. L., Fischer E. M., Gruber N. (2018). Marine heatwaves under global warming. Nature 560 (7718), 360–364. doi: 10.1038/s41586-018-0383-9
GEBCO Bathymetric Compilation Group 2021 (2021). The GEBCO_2021 grid - a continuous terrain model of the global oceans and land. NERC EDS Br. Oceanogr. Data Centre NOC. doi: 10.5285/c6612cbe-50b3-0cff-e053-6c86abc09f8f
Gentemann C. L., Fewings M. R., García-Reyes M. (2017). Satellite sea surface temperatures along the West coast of the united states during the 2014-2016 northeast pacific marine heat wave: Coastal SSTs during “the blob”. Geophysi. Res. Lett. 44 (1), 312–319. doi: 10.1002/2016GL071039
Gruber N., Hauri C., Lachkar Z., Loher D., Frölicher T. L., Plattner G.-K. (2012). Rapid progression of ocean acidification in the California current system. Science 337 (6091), 220–223. doi: 10.1126/science.1216773
Hobday A. J., Alexander L. V., Perkins S. E., Smale D. A., Straub S. C., Oliver E. C. J., et al. (2016). A hierarchical approach to defining marine heatwaves. Prog. Oceanogr. 141, 227–238. doi: 10.1016/j.pocean.2015.12.014
Huang B., Liu C., Banzon V., Freeman E., Graham G., Hankins B., et al. (2021). Improvements of the daily optimum interpolation Sea surface temperature (DOISST) version 2.1. J. Climate 34 (8), 2923–2939. doi: 10.1175/JCLI-D-20-0166.1
Huyer A. (1983). Coastal upwelling in the California current system. Prog. Oceanogr. 12 (3), 259–284. doi: 10.1016/0079-6611(83)90010-1
Jacox M. G., Edwards C. A., Hazen E. L., Bograd S. J. (2018). Coastal upwelling revisited: Ekman, bakun, and improved upwelling indices for the U.S. West coast. J. Geophysi. Res.: Oceans 123 (10), 7332–7350. doi: 10.1029/2018JC014187
Jentzen A., Schönfeld J., Schiebel R. (2018). Assessment of the effect of increasing temperature on the ecology and assemblage structure of modern planktic foraminifers in the Caribbean and surrounding seas. J. Foraminiferal Res. 48 (3), 251–272. doi: 10.2113/gsjfr.48.3.251
Jonkers L., Hillebrand H., Kucera M. (2019). Global change drives modern plankton communities away from the pre-industrial state. Nature 570 (7761), 372–375. doi: 10.1038/s41586-019-1230-3
Kennett J. P., Venz K. (1995). “Late quaternary climatically related planktonic foraminiferal assemblage changes: Hole 893A, Santa Barbara basin, California,” in Proceedings of the ocean drilling program, 146 part 2 scientific results, vol. 146–2 . Eds. Kennett J. P., Baldauf J. G., & Lyle M. (College Station, TX, USA: Ocean Drilling Program). doi: 10.2973/odp.proc.sr.146-2.1995
Kretschmer K., Jonkers L., Kucera M., Schulz M. (2018). Modeling seasonal and vertical habitats of planktonic foraminifera on a global scale. Biogeosciences 15 (14), 4405–4429. doi: 10.5194/bg-15-4405-2018
Kucera M. (2007). “Chapter six planktonic foraminifera as tracers of past oceanic environments,” in Developments in marine geology (Amsterdam, Netherlands: Elsevier), 213–262. doi: 10.1016/S1572-5480(07)01011-1
Lea D. W., Pak D. K., Spero H. J.. (2000). Climate Impact of Late Quaternary Equatorial Pacific Sea Surface Temperature Variations. Science 289 (5485), 1719–1724. doi: 10.1126/science.289.5485.1719
McCabe R. M., Hickey B. M., Kudela R. M., Lefebvre K. A., Adams N. G., Bill B. D., et al. (2016). An unprecedented coastwide toxic algal bloom linked to anomalous ocean conditions. Geophysi. Res. Lett. 43 (19), 10366–10376. doi: 10.1002/2016GL070023
Meilland J., Siccha M., Weinkauf M. F. G., Jonkers L., Morard R., Baranowski U., et al. (2019). Highly replicated sampling reveals no diurnal vertical migration but stable species-specific vertical habitats in planktonic foraminifera. J. Plankton Res. 41 (2), 127–141. doi: 10.1093/plankt/fbz002
Moy A. D., Howard W. R., Bray S. G., Trull T. W. (2009). Reduced calcification in modern southern ocean planktonic foraminifera. Nat. Geosci. 2 (4), 276–280. doi: 10.1038/ngeo460
O’Loughlin J. H., Bernard K. S., Daly E. A., Zeman S., Fisher J. L., Brodeur R. D., et al. (2020). Implications of pyrosoma atlanticum range expansion on phytoplankton standing stocks in the northern California current. Prog. Oceanogr. 188, 102424. doi: 10.1016/j.pocean.2020.102424
Orr J. C., Fabry V. J., Aumont O., Bopp L., Doney S. C., Feely R. A., et al. (2005). Anthropogenic ocean acidification over the twenty-first century and its impact on calcifying organisms. Nature 437 (7059). doi: 10.1038/nature04095
Ortiz J. D., Mix A. C. (1992). The spatial distribution and seasonal succession of planktonic foraminifera in the California current off Oregon, September 1987 – September 1988. Geol. Society London Special Publications 64 (1), 197–213. doi: 10.1144/GSL.SP.1992.064.01.13
Ortiz J. D., Mix A. C., Collier R. W. (1995). Environmental control of living symbiotic and asymbiotic foraminifera of the California current. Paleoceanography 10 (6), 987–1009. doi: 10.1029/95PA02088
Osborne E. B., Thunell R. C., Gruber N., Feely R. A., Benitez-Nelson C. R. (2020). Decadal variability in twentieth-century ocean acidification in the California current ecosystem. Nat. Geosci. 13 (1), 43–49. doi: 10.1038/s41561-019-0499-z
Pak D. K., Hendy I. L., Weaver J. C., Schimmelmann A., Clayman L. (2018). Foraminiferal proxy response to ocean temperature variability and acidification over the last 150 years in the Santa Barbara basin (California). Quaternary Int. 469, 141–150. doi: 10.1016/j.quaint.2016.07.049
Peterson W. T., Fisher J. L., Strub P. T., Du X., Risien C., Peterson J., et al. (2017). The pelagic ecosystem in the northern California current off Oregon during the 2014-2016 warm anomalies within the context of the past 20 years: The pelagic ecosystem during 2014-2016. J. Geophysi. Res.: Oceans 122 (9), 7267–7290. doi: 10.1002/2017JC012952
R Core Team (2020). R: A language and environment for statistical computing (R Foundation for Statistical Computing). Available at: http://www.R-project.org/.
Reynolds L., Thunell R. C. (1985). Seasonal succession of planktonic foraminifera in the subpolar north pacific. J. Foraminiferal Res. 15 (4), 282–301. doi: 10.2113/gsjfr.15.4.282
Rongstad B. L., Marchitto T. M., Marks G. S., Koutavas A., Mekik F., Ravelo A. C., et al (2020). Investigating ENSO-Related Temperature Variability in Equatorial Pacific Core-Tops Using Mg/Ca in Individual Planktic Foraminifera. Paleoceanography and Paleoclimatology 35 (2), e2019PA003774. doi: 10.1029/2019PA003774
Roy T., Lombard F., Bopp L., Gehlen M. (2015). Projected impacts of climate change and ocean acidification on the global biogeography of planktonic foraminifera. Biogeosciences 12 (10), 2873–2889. doi: 10.5194/bg-12-2873-2015
Russell A. D., Hönisch B., Spero H. J., Lea D. W. (2004). Effects of seawater carbonate ion concentration and temperature on shell U, mg, and Sr in cultured planktonic foraminifera. Geochimica Cosmochimica Acta 68 (21), 4347–4361. doi: 10.1016/j.gca.2004.03.013
Sautter L. R., Thunell R. C. (1989). Seasonal succession of planktonic foraminifera; results from a four-year time-series sediment trap experiment in the northeast pacific. J. Foraminiferal Res. 19 (4), 253–267. doi: 10.2113/gsjfr.19.4.253
Schiebel R., Barker S., Lendt R., Thomas H., Bollmann J. (2007). Planktic foraminiferal dissolution in the twilight zone. Deep Sea Res. Part II 54 (5–7), 676–686. doi: 10.1016/j.dsr2.2007.01.009
Schiebel R., Hemleben C. (2017). Planktic foraminifers in the modern ocean (Berlin, Germany: Springer Berlin Heidelberg). doi: 10.1007/978-3-662-50297-6
Sugiura N. (1978). Further analysts of the data by akaike’ s information criterion and the finite corrections. Commun. Stat - Theory Methods 7 (1), 13–26. doi: 10.1080/03610927808827599
Taylor B. J., Rae J. W. B., Gray W. R., Darling K. F., Burke A., Gersonde R., et al. (2018). Distribution and ecology of planktic foraminifera in the north pacific: Implications for paleo-reconstructions. Quaternary Sci. Rev. 191, 256–274. doi: 10.1016/j.quascirev.2018.05.006
Thompson A. R., Schroeder I. D., Bograd S. J., Hazen E. L., Jacox M. G., Leising A., et al. (2019). State of the California current 2018-2019: A novel anchovy regime and a new marine heat wave? Calif. Cooperat. Ocean. Fish. Investig. 60, 1–65.
Keywords: foraminifera, microzooplankton, marine heatwave (MHW), Newport Hydrographic Line, Northern California Current, Oregon, USA
Citation: Lane MK, Fehrenbacher JS, Fisher JL, Fewings MR, Crump BC, Risien CM, Meyer GML and Schell F (2023) Planktonic foraminiferal assemblages reflect warming during two recent mid-latitude marine heatwaves. Front. Mar. Sci. 10:1155761. doi: 10.3389/fmars.2023.1155761
Received: 31 January 2023; Accepted: 03 March 2023;
Published: 27 March 2023.
Edited by:
Shuyang Ma, Ocean University of China, ChinaReviewed by:
Katarína Holcová, Charles University, CzechiaAtsushi Yamaguchi, Hokkaido University, Japan
Copyright © 2023 Lane, Fehrenbacher, Fisher, Fewings, Crump, Risien, Meyer and Schell. This is an open-access article distributed under the terms of the Creative Commons Attribution License (CC BY). The use, distribution or reproduction in other forums is permitted, provided the original author(s) and the copyright owner(s) are credited and that the original publication in this journal is cited, in accordance with accepted academic practice. No use, distribution or reproduction is permitted which does not comply with these terms.
*Correspondence: M. Kelsey Lane, bGFuZW1hcnlAb3JlZ29uc3RhdGUuZWR1