 Jay Lee
 James T. Liu
 Yu-Shih Lin
 Chen-Tung Arthur Chen
 Bo-Shian Wang
- 1Department of Oceanography, National Sun Yat-sen University, Kaohsiung, Taiwan
- 2National Academy of Marine Research, Ocean Affairs Council, Kaohsiung, Taiwan
- 3Taiwan Ocean Research Institute, National Applied Research Laboratories, Kaohsiung, Taiwan
To understand the process-response relations among physical forcing and biogeochemical properties of suspended particles (SPs) in the river-dominated northern South China Sea shelf, a 5-day shipboard observation was conducted at a fixed location on the dispersal pathway of the Zhujiang (Pearl) River plume (ZRP) in the summer of 2016. Instrumented moorings were deployed near the sampling site to record the flow and wave fields every 10 minutes. Hydrographic properties were measured hourly to identify different water masses. Water and SPs samples at the surface (3 m) and near the bottom (3 m above the bed) were taken every 3 h for the analyses of nutrients, chlorophyll-a (Chl-a), and particulate organic matter (POM including POC, PN, and δ13CPOC). Meanwhile, the grain-size composition of SPs and seafloor sediment were also analyzed. Results showed that monsoon winds drove cold upwelling and ZRP waters at the surface. Both the upwelling and ZRP regimes contained newly produced marine phytoplankton based on low POC/Chl-a ratio (PC ratio) and enriched δ13CPOC. However, SPs in the ZRP regime were smaller (<153 µm), having denser particle bulk density, and less enriched δ13CPOC, indicating different bio-communities from the upwelling regime. EOF analysis of the surface data suggested that mixing processes and the dispersal of the ZRP regime were mainly controlled by far-field storm winds, tidal modulation, and strength of mixing. On the other hand, a bottom nepheloid layer (BNL) was observed, mainly consisting of SPs<63 μm with higher bulk density than SPs at the surface. POM in the BNL was degraded and δ13CPOC-depleted according to the PC ratio and δ13CPOC. EOF analysis of the near-bottom data indicated that the dominant physical processes influencing the biogeochemical properties of SPs in the BNL were jointly the upwelling-associated lateral transport (first order) and tide-related resuspension (second order). Our study identified the contrast between the surface and near-bottom regimes with the coupling patterns among physical forcing and physiochemical properties of SPs using good constraints on particle dynamics and particle sources.
1 Introduction
RiOMars systems (river-dominated ocean margins; McKee et al., 2004) receive a variety of terrestrial and marine substances delivered by rivers or coastal currents (Mittelstaedt, 1991; Lacan and Jeandel, 2005; Jeandel, 2016; Liu et al., 2021). The diversity of particles in these systems includes bio-aggregates or flocs on the Amazon shelf (Gibbs, 1977; Nittrouer and DeMaster, 1996; Berhane et al., 1997), terrestrially-derived organic carbon from the Mississippi River (Bianchi et al., 2007), and lithogenic particles delivered from the Changjiang (Yangtze) River (Jiang et al., 2015; Liu et al., 2021). Terrestrial particles are initially dispersed from the river mouth (Wright and Nittrouer, 1995) and carried by the river plume, which generally contains abundant nutrients that enhance the phytoplankton production in the coastal sea (Yin et al., 2001; Isobe and Matsuno, 2008; Xu et al., 2008; Yang et al., 2021). The delivered particles follow a source-to-sink pathway of initial deposition, then resuspension and lateral transport (physical processes), which lead to the final accumulation and burial (sink) (Wright and Nittrouer, 1995). Meanwhile, the offshore marine dissolved (e.g., nutrients) and particulate matters could be carried inshore by landward currents as part of the upwelling circulation (D’Croz and O’Dea, 2007; Lu et al., 2010; Gao et al., 2018; Yang et al., 2021). Therefore, the physiochemical properties of suspended particles (SPs) are complex because of complicated particle dynamics occupying the water column in the coastal region (Dagg et al., 2004; McKee et al., 2004; Liu et al., 2021).
The physicochemical characteristics of SPs undergo transformation while en route, which influences the nature of particles (Turner and Millward, 2002; McKee et al., 2004; Liu et al., 2021). Three direct or indirect processes are involved, including water-particle interactions (e.g., flocculation/deflocculation; Gibbs and Konwar, 1986; Lee et al., 2016; Du et al., 2021); benthic sediment processes (e.g., resuspension; Thorne et al., 2009; O’Hara Murray et al., 2012); and biological processes (e.g., egestion and excretion; Turner and Millward, 2002; Myklestad, 2005; Castillo et al., 2010). For example, water mixing facilitates aggregation of biogenic substances (e.g., transparent exopolymer particles) with inorganic terrestrial particles to obtain high bulk densities (Passow et al., 2001; Ho et al., 2022). Then, the aggregated substances settle to the seafloor because of the ballast effect (McKee et al., 2004; Passow et al., 2014; Rixen et al., 2019). Next, the aggregated particles on the seabed are re-disturbed by current-induced or wave-induced turbulence and become sorted according to the corresponding density and size (Jarvis et al., 2005; Liu et al., 2021; Tian Z. et al., 2022).
Therefore, the physicochemical properties of the SP are conventionally used as indicators or proxies because particles are imprinted with the properties of the ambient environment in the transport processes (Gibbs, 1973; Linders et al., 2018; Liu et al., 2021; Lee et al., 2022). Particulate organic matter (POM) is prevalent in determining the source of SPs and reconstructing the biogeochemical pathways in two-end member systems (Guo et al., 2019; Liu et al., 2021). The relation between the organic carbon stable isotope ratio (δ13CPOC) and C/N (atomic carbon and nitrogen ratio) was utilized to identify signatures of terrestrial plants and marine algae (Lamb et al., 2006). The high Chl-a concentration at the surface of the oligotrophic ocean was regarded as an indication of the upwelling water mass, which carries nutrients from the subsurface water (Xu et al., 2009; Liu et al., 2019).
However, the low weight proportion of the POM and the bio-decomposition could affect the reliability of the source identification, which increases the difficulty of deciphering the target’s provenance (Asada et al., 2005; Harrison et al., 2008; Guo et al., 2015). Thus, multiple measurements of different attributes must be applied to constrain the source interpretation of SPs. For instance, the high Chl-a concentration in the coastal region links to the phytoplankton growth, which could result from the eutrophication related either to upwellings or river runoff (Dickson and Wheele, 1995; Yin et al., 2001; Hong et al., 2009; Liu et al., 2019). The origin can be distinguished according to the nutrient composition because upwellings usually carry a high silicate concentration, whereas river runoffs always have a high N/P ratio (the ratio of inorganic total N to phosphate; Malakoff, 1998; Yin et al., 2001). One of the physical characteristics of the particle, particle bulk density, is also applicable to identifying the species of the SP (e.g., fluffy flocs, biogenic particles, and solid detrital; Hsu and Liu, 2010; Lee et al., 2016; Du et al., 2022). With corresponding observations of flow fields, salinity, and temperature, the physical mechanisms and water masses that transport SPs can be determined (Liu et al., 2019).
The SP in the northern South China Sea (NSCS) shelf was targeted in this study because of the various origins of particles. The largest terrestrial source is the Zhujiang (Pearl) River, of which the annual river discharge is with annual sediment load of 64.5 Mt (Wu et al., 2012). Almost 80% of the river runoff occurs in the wet season (Zhang et al., 2012; Wu et al., 2016). Land-sourced substances are carried northeastward by the Zhujiang river plume (ZRP) in the surface due to the wind-driven current parallel to the Guangdong coastline in summer (Zu and Gan, 2015). Different approaches have been used to identify the dispersing ZRP (Chen et al., 2017; Zhi et al., 2022). According to the in-situ hydrographic measurements, the ZRP was recognized as low salinity water with a high N/P ratio (Yin et al., 2001; Yu et al., 2020). Satellite images show that a band-shaped Chl-a pattern from the Zhujiang river mouth dispersed into the N-limited NSCS, further spreading into the southern Taiwan Strait (Yin et al., 2001; Bai et al., 2015). Another well-known physical process that transports particles in the NSCS is the upwelling circulation which can be recognized as the low sea-surface temperature along the Guangdong coast (Chen et al., 2017; Zhang et al., 2018). The upwelling system is a substantial nutrient pump in the coastal region for the marine food web and enhances the biomass and the particulate organic flux (Kämpf and Chapman, 2016; Zhang et al., 2019).
Although previous research has studied the spatial distribution of biogeochemical properties of SPs on the inner shelf of the NSCS (Yu et al., 2010; Guo et al., 2015; Cao et al., 2020; Huang et al., 2021), the interpretation of these observations may be subject to aliasing over time due to hydrodynamic forcing such as tidal flows. Furthermore, the influence of the physical forcing on the biogeochemical properties of SPs has yet to be well-established in the existing literature. Therefore, our work intends to characterize and quantify the temporal coupling between physical forcing and the biogeochemistry of SPs on the NSCS shelf in summer. This study focuses on contrasting regimes of physical processes, water masses, and SPs from diverse origins on the pathway of the ZRP dispersal. Interdisciplinary approaches were designed to constrain the source of the SP, based on the observation by Lee et al. (2021). We aim to elucidate the source-to-sink nature of the particle transport pathways and improve the knowledge of particle dynamics, including the sediment routing systems (Wright and Coleman, 1973; Gao et al., 2015; Liu et al., 2016; Zhong et al., 2017), sedimentology (Kuehl et al., 1986; Heise et al., 2013; Zhang et al., 2013), and biogeochemical cycles (Cai et al., 2004; Bauer et al., 2013; Wei et al., 2020) in the river-dominated environments on the continental shelf.
2 Material and methods
2.1 Hydrodynamic measurements
R/V Ocean Researcher I was used for the fieldwork on July 24-29, 2016, at Sta. ZHJ2, where the average water depth was ~41 m (Figure 1A). Two taut-line moorings were deployed nearby to record the wave and flow fields (Figure 1B). One mooring was mounted with an AQUAdopp (at 8 m) whose wave mode had 10 minute-bursts, each containing wave height, period, and incident angle averaged over 512 measurements sampled at 1 Hz. WAVEWATCH III (Tolman, 1991) was used for the quality control of the in-situ wave measurement (Supplementary Figure 1). The upward-looking AQUAdopp had a bin size of 0.1 m with a central frequency of 1 MHz. The other mooring was mounted with two RDI ADCPs, one upward-looking (1,200 kHz) at 11 m below the surface and the other downward-looking (300 kHz) at 30 m above bed. The sampling rate for both ADCPs was 10 min (Supplementary Table 1).
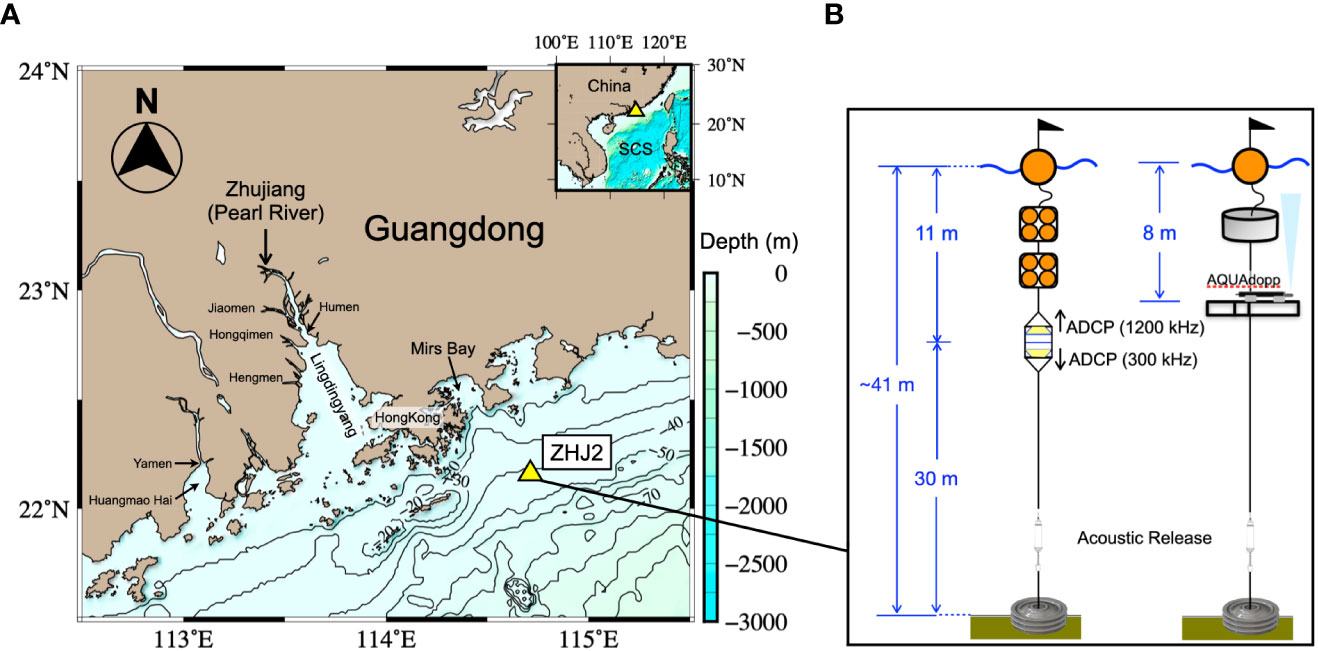
Figure 1 (A) A map showing the study site (ZHJ2; yellow triangles) in the northern South China Sea (insert). (B) A schematic diagram for the configuration of moorings deployed nearby ZHJ2 in July 2016. The map was plotted using the Generic Mapping Tools (GMT, V5.4.2, https://www.soest.hawaii.edu/gmt/).
The measured flow field was separated into tidal and non-tidal contributions. Using a MATLAB program t_tide (Pawlowicz et al., 2002), the tidal part of the flow at the study site was reconstructed through harmonic analysis. The non-tidal part of the flow was extracted after removing the tidal part from the measured flow. The tidal and non-tidal flows were then decomposed into the alongshore and across-shore/on-offshore components by orienting measured flows 15 degrees counterclockwise in the Cartesian coordinate. The NE-ward and inshore directions were defined as positive in the alongshore and across-shore flows, respectively. Flow measurements were used to derive the progressive vectors (PVs), of which the equation is shown in Section 3. The shear velocity () was calculated using flow and wave field measurements through the Sedtrans05 model (Neumeier et al., 2008; Supplementary Table 1).
2.2 Shipboard profiling
Hourly hydrographic profiles were conducted using the SBE 911plus CTD rosette that included salinity, temperature, fluorescence, and light transmission (Supplementary Table 1). The sampling rate was 0.04 seconds (sec) at the CTD lowering rate of 0.5 m s-1. A laser in-situ scattering and transmissometry, LISST-100X, was co-mounted on the rosette to measure volume concentrations (VCs) of SPs from 2.5 to 500 μm grain-size classes, which were classified into<63, 63-153, and >153 μm size groups for further analyses. Each VC record was the average of 10 measurements with a sampling rate of<0.23 sec. The corresponding depth to the VC was converted from the CTD record based on the measuring time of both instruments. The LISST-100X was calibrated by conducting the blank intensity of VCs recorded in the Milli-Q water (Millipore Academic A10) before the cruise.
2.3 Water sample collection and analyses
Water samples were taken every 3 hours (h) at 3 m below the surface and 3 m above the seabed (mab) using Niskin bottles mounted on the CTD rosette for the measurements of nutrients (N, P, and Si), suspended sediment concentration (SSC), Chl-a, and POM (POC, PN, and δ13CPOC; Supplementary Table 2). For nutrient analysis, 100 mL seawater was filtered through a 0.45 μm Millex®-LCR syringe filter and then added with the saturated HgCl2 to kill the bacteria and algae. To identify the size composition of the bulk SSC, a nested filtration system, Catnet, was used onboard to filter 20 L seawater into 100 mL PE bottles through sieves having the mesh sizes of 10, 63, and 153 μm (Hsu and Liu, 2010; Lee et al., 2016; Du and Liu, 2017; Wen et al., 2018; Yang et al., 2021). Samples for Chl-a and POM analyses were separately collected in 500 mL opaque amber bottles. Those collected water samples were immediately filtered on the pre-combusted glass fiber filters (GF/F, Whatman; diameter: 25 mm; pore size: 0.7 µm; pre-combusted at 500°C for 6 h). Filters for Chl-a analysis were amended with a few drops of saturated MgCO3 and wrapped in aluminum foil to prevent photodegradation. All samples were preserved at -20°C until analysis.
Upon returning to the laboratory, Chl-a was extracted from filters using 10 mL of 90% acetone in the dark at 4°C for 24 h and quantified using a 10-AU Field Fluorometer (Turner Designs). The rest of the filters were freeze-dried and weighed to determine the SSC. The filter samples for POM were acidified with 2 N HCl to remove inorganic carbon, rinsed with Milli-Q water to wash off the retained acid, freeze-dried, and analyzed by an elemental analyzer coupled to an isotope ratio mass spectrometer (Flash 2000 and Delta V Plus; both from Thermo Fisher Scientific). International certified standards (USGS40, USGS43, USGS64, USGS73, and NIST8542) and certified soil standards (certificate number 341506; Thermo Fisher Scientific) were regularly used to calibrate the isotopic ratio and assess the precision, which was better than 0.2‰ for δ13CPOC, 2.3% for POC, and 5.5% for PN (1σ).
The concentration of nutrients was determined by colorimetric methods. Nitrite () was evaluated according to the pink azo dye method (Strickland and Parsons, 1972). Nitrate () was calculated by reducing nitrate to nitrite based on the cadmium-copper reduction method. The phosphate ) and silicate () were derived by using the molybdenum blue method and silicon-molybdenum blue method (Murphy and Riley, 1962; Fanning and Pilson, 1973; Pai et al., 1993). Ammonia () was evaluated via indophenol blue methods based on the Berthelot reaction (Ivančič and Degobbis, 1984; Aminot et al., 1997). CSK standards (Wako Pure Chemicals Ltd., Japan) and certified reference materials (KANSO Technos Co., Ltd., Japan) were used to calibrate every 10-15 samples. The precisions of the abovementioned methods were ±0.02 µmol L-1 for , ± 0.08 µmol L-1 for , ± 0.05 µmol L-1, , ± 0.1 µmol L-1 for , ± 0.08 µmol L-1 for , respectively.
2.4 Surface sediment collection and analysis
Surface sediment samples were taken by a Shipek grab every 3 h for the grain-size analysis. The top 1~2 cm of the sediment in the grab bucket was collected into a plastic jar and stored in the refrigerator at 4 °C onboard. Then, sediments were freeze-dried in the laboratory. For grain-size frequency distribution analysis, 0.5 g sediment was treated by the following procedure: (1) washed with distilled water to remove the sea salt; (2) bathed with 10% hydrogen peroxide and hydrochloric acid for 24 h to dissolve organic materials and carbonates; (3) bathed with 1% sodium hexametaphosphate for 24 h and then shaken in the ultrasonic device for 30 sec to prevent aggregation; (4) measured by a laser diffraction size analyzer (LS 13 320, Beckman Coulter) to determine the particle-size distribution from 0.375 to 2,000 μm.
3 Calculations
3.1 Progressive vectors
The PV was derived based on the Lagrangian approach with the Eulerian measurement (in-situ flow field) and has been used in meteorology and marine physics (Liu et al., 2009; Su et al., 2015; Du and Liu, 2017; Ko et al., 2020). The PV was calculated as follows:
where X and Y indicate the east-west and north-south components of the PV, respectively; z is the water depth of the measured point; t is the time of the measurement; m is the sampling length; () and () are the displacements and the velocities of the water parcel at the given time (t), respectively; is the sampling interval. In this paper, only the horizontal PV displacements are shown because the measured vertical velocity on the mooring was unreliable.
3.2 Shear velocity
Using the Sedtrans05 model (Neumeier et al., 2008), shear velocities () induced by waves, currents, and current-wave interactions (marked as , , and , respectively) were evaluated according to the bottom boundary layer theory. The input data included current speed, current direction, significant wave height, wave period, and wave direction. The first two parameters were recorded by the ADCPs; the rest were provided by the AQUAdopp (Figure 1B; Supplementary Table 1). The critical shear velocities () to resuspend particles of 63 and 153 µm sizes were calculated according to Van Rijn (1993). To estimate the possible range of the , the assumed particle densities used in the calculation were 2.65 g cm-3 for the upper limit (quartz; detrital materials) and 1.5 g cm-3 for the lower limit (derived by the measured in-situ bulk density in this study), which is close to the value mentioned in Tian et al. (2022).
3.3 Spectral and coherence analyses
The frequency spectra and the coherence (the correlation between two spectra as the function of the frequency) among , the light transmission, and VCs were computed to distinguish the process-response patterns in the resuspension process. The ‘mscohere’ functions in MATLAB were used and defined as follows (Welch, 1967; Rabiner and Gold, 1975; Kay, 1988):
where Sxx,f and Syy,f are the power spectra of the and the light transmission (or VCs), respectively. and T are the sampling period and the duration of the observation, respectively. Xf and Yf are the results of the Fast Fourier Transform (FFT) for x and y. Xf* (or Yf*) indicates the complex conjugate of the Xf (or Yf). Sxy,f is the cross power spectral density of x and y. Cxy,f is the coherence between Xf and Yf. All data were synchronized at 3 h intervals using linear interpolation before the analysis.
3.4 Particle bulk density
The particle bulk density () is defined as the mass of the bulk particle (solid and void combined in a floc) divided by its total volume and expressed as follows (Hsu and Liu, 2010; Du et al., 2022):
Where the is the measured seawater density by CTD; is the assumed density of the solid particle (2.65 g cm-3); the SSC is the suspended sediment concentration measured by water filtration; the VC is the volume concentration measured by the LISST-100X (Supplementary Tables 1, 2). The low value indicates fluffy particles, such as flocs or biogenic particles, and vice versa (Lee et al., 2016; Du et al., 2022).
3.5 Marine fraction
To evaluate the terrestrial and marine proportions of POM in the bulk POC, a simple mixing model was used with the assumed δ13CPOC end-member values at land and ocean to be -28.8‰ and -18‰, respectively (Goñi et al., 2000; Hu et al., 2006; Liu et al., 2006; Amiel and Cochran, 2008; Gireeshkumar et al., 2013; Lamb and Warn-Varnas, 2015; Ran and Zhang, 2015). The marine fraction (Fm) was subsequently defined as follows:
4 Results
4.1 Flow fields
The PV plot indicates that net flow movement was NE-ward with short-term tidal modulations with resolved M2 and K1 tides (our data was only long enough to resolve these two constituents; Figure 2; Lee et al., 2021). The current speed decreased from 0.39 m s-1 at 3 m to 0.12 m s-1 at 38 m (Supplementary Figure 2). The wind-driven flow field at the surface was mainly resulted from the in-situ wind (Zu et al., 2014; Chen et al., 2017; Lee et al., 2021). The bottom flow was caused by the upwelling-associated landward current along the Guangdong coast, which is controlled by the East Asian monsoon and the variation of the shelf topography (Gan and Allen, 2002; Gan et al., 2009b; Lee et al., 2021). To identify the signature of the water masses at the surface and bottom, the N/P ratio was superimposed on PVs as color-coded circles in Figure 2 for further discussion.
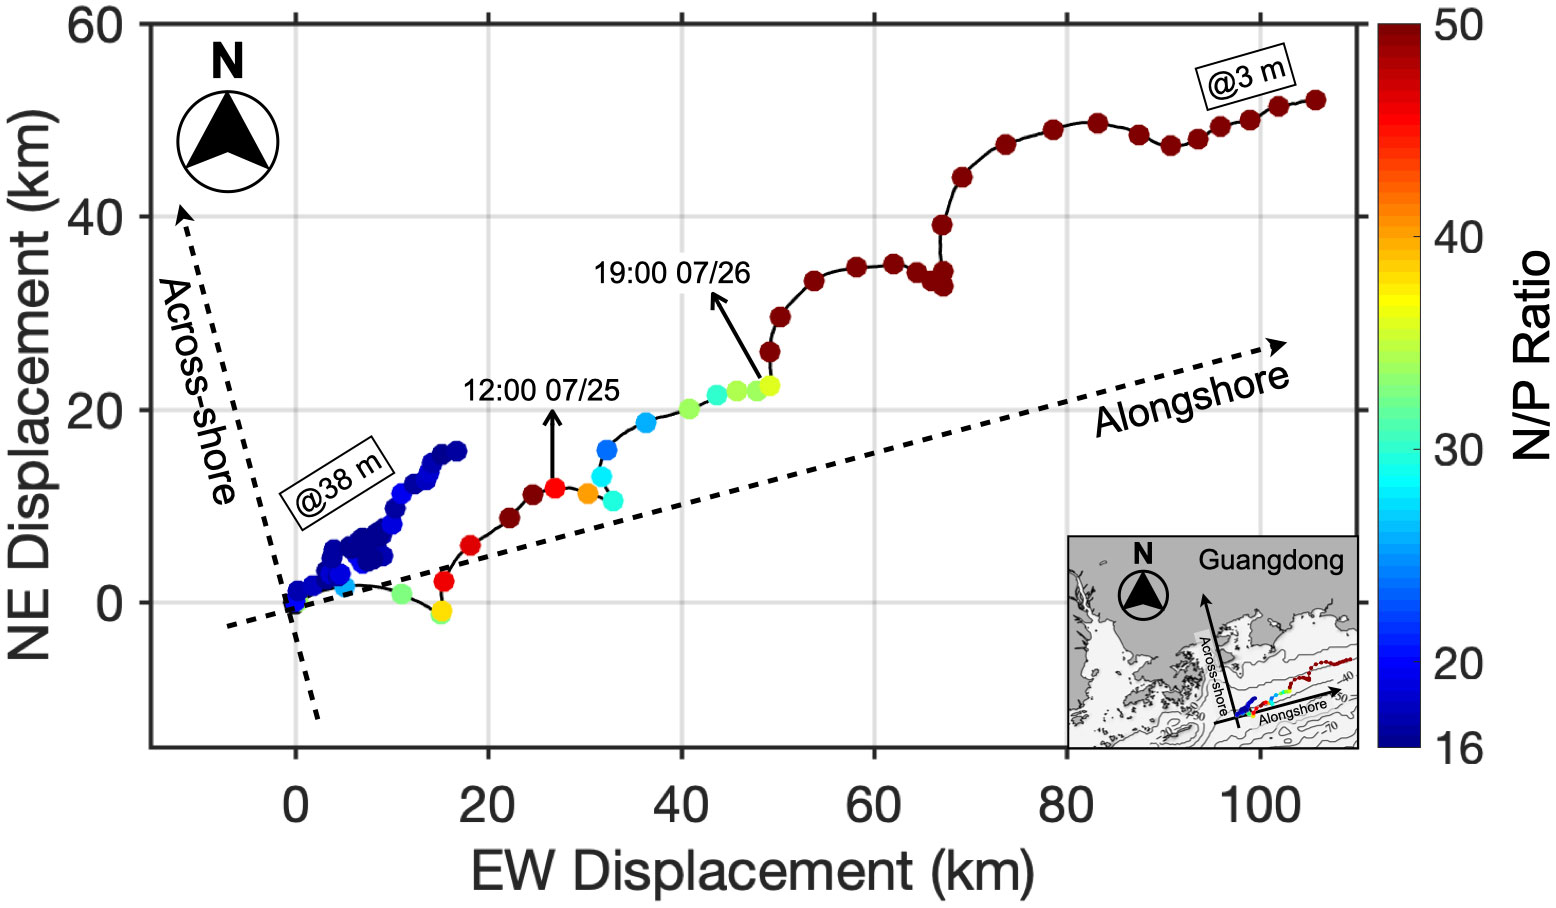
Figure 2 The progressive vectors (PVs) at the surface (3 m) and bottom (38 m). The N/P values (range indicated by the color bar to the right) are superimposed to indicate the sequential change of nutrient composition of the water mass. The marked time points indicate the duration having low N/P within the storm influence. The dashed arrows show the positive alongshore and across-shore directions. The PVs are plotted on a small-scale map (insert) to give a regional perspective.
4.2 Water column structures
The T-S diagram and hydrographic profiles suggested at least two water masses were present at the study site. The upper water column shallower than 10 m was primarily occupied by the ZRP (Figure 3A), having a wide salinity range (28~32) and a narrow temperature span (28~31.5°C). Deeper than 10 m, the ambient coastal water had a very narrow salinity spread (33.5~34.7), and water temperature ranged from 21.5 to 29°C.
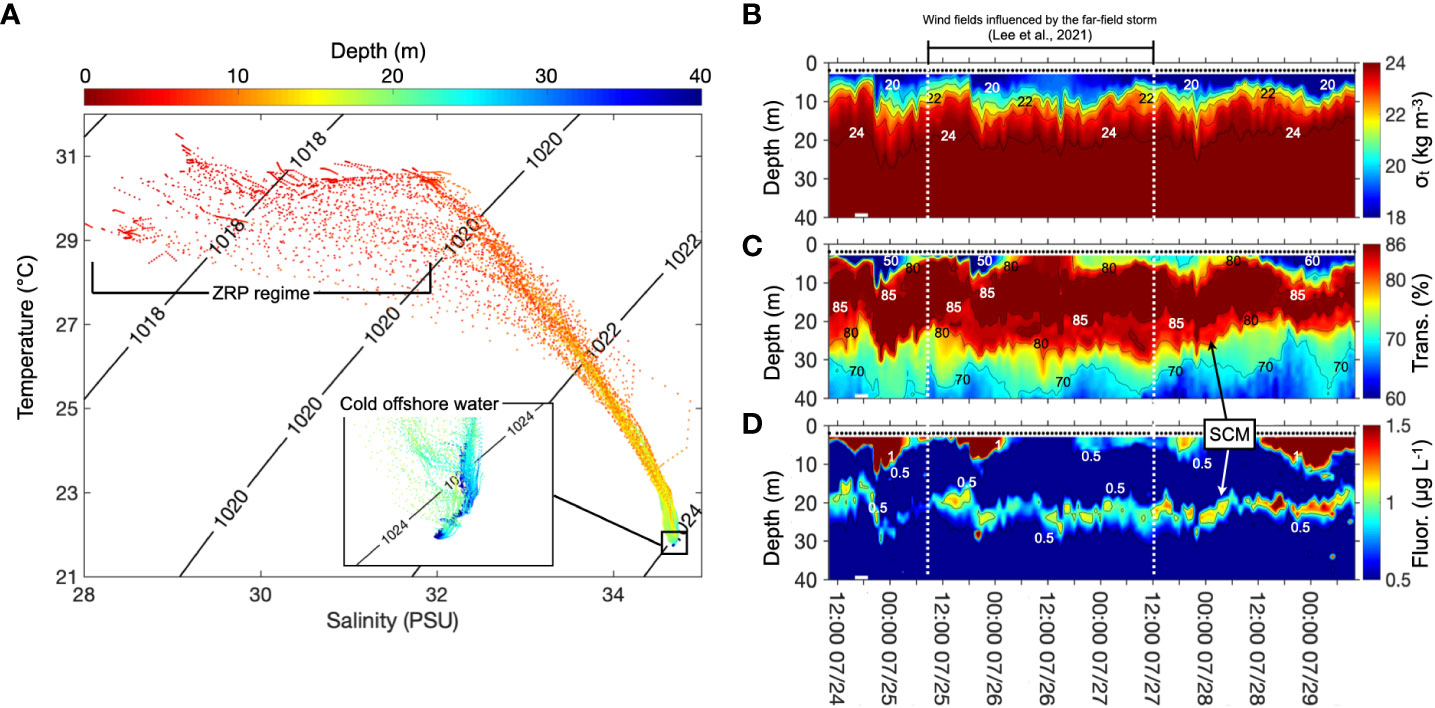
Figure 3 Hydrographic measurements at ZHJ2 including (A) The depth-referenced T-S diagram in which the color bar indicates the depth of the measurement. Warm colors represent shallower depths and cold colors represent deeper depths. The inserted graph is the enlarged section of the T-S diagram at the bottom marked by the black square. The temporal changes in 2-D structures are shown in (B) the water density, (C) the light transmission, and (D) the fluorescence. White dash lines in (B-D) mark the duration of the storm influence. Arrows point out the SCM.
The water density () structure showed a pronounced stratification from 18 kg m-3 at the surface to 24 kg m-3 at the bottom (Figure 3B). The light transmission and the fluorescence revealed a sandwich structure (Figures 3C, D). The light transmission was<50% at the surface, >80% in the middle of the water column, and<70% in the lower water column. The fluorescence was >1 μg L-1 at the surface, >0.5 μg L-1 at mid-depth, and<0.5 μg L-1 near the bottom.
In the upper water column, the temporal variability of all variables presented semi-diurnal to diurnal fluctuations, with the ZRP water having low water density, low light transmission, and high fluorescence (Figure 3B–D). The fluctuation was suppressed around 18:00 07/26 when the surface water had higher water density, higher light transmission, and lower fluorescence. At mid-depth, there was a noticeable layer of high fluorescence around the depth of 22 m, having a thickness of about 5 m in which the fluorescence was consistently higher (>0.5 μg L-1). This has been reported as the subsurface chlorophyll maximum (SCM) in the NSCS (Lu et al., 2010; Chen and Zhao, 2021). A similar fluorescence/Chl-a subsurface maximum layer was also found in the Taiwan Strait and associated with the intermediate nepheloid layer (INL; Du and Liu, 2017; Liu et al., 2019). The SCM corresponding to the relatively high but low light transmission in the mid-depth layer (80~85%; Figures 3C, D) suggests the phytoplanktonic nature of SPs at this depth (Du and Liu, 2017). In the bottom water mass, the water density and fluorescence were consistent at 24 kg m-3 and 0.25 μg L-1, respectively (Figures 3B–D). However, the light transmission at this depth revealed a semi-diurnal to diurnal variability, ranging between 60% and 70%.
4.3 Nutrients and Chl-a
Nutrients were measured to constrain the interpretation of the water mass (Figure 4). The silicate changed from 0.99 to 6.10 µmol L-1 at the surface and from 6.86 to 11.01 µmol L-1 at the bottom (Figure 4A). The concentration of the Chl-a ranged from 0.3 to 2.5 μg L-1 at the surface but was nearly constant at the bottom (~0.3 μg/l; Figure 4B). The concentration of total N (sum of nitrate, nitrite, and ammonia) ranged from 0.85 to 4.86 µmol L-1 at the surface and from 4.94 to 8.28 µmol L-1 at the bottom (Figure 4C). The phosphate changed between below detection and 0.1 µmol L-1 at the surface and varied between 0.31 and 0.55 µmol L-1 at the bottom (Figure 4D). Although nutrients and Chl-a did not exhibit a clear trend at the surface, most parameters increased at the bottom in the 5-day observation, noticeably in the silicate (Figures 4A-D; Supplementary Figure 3).
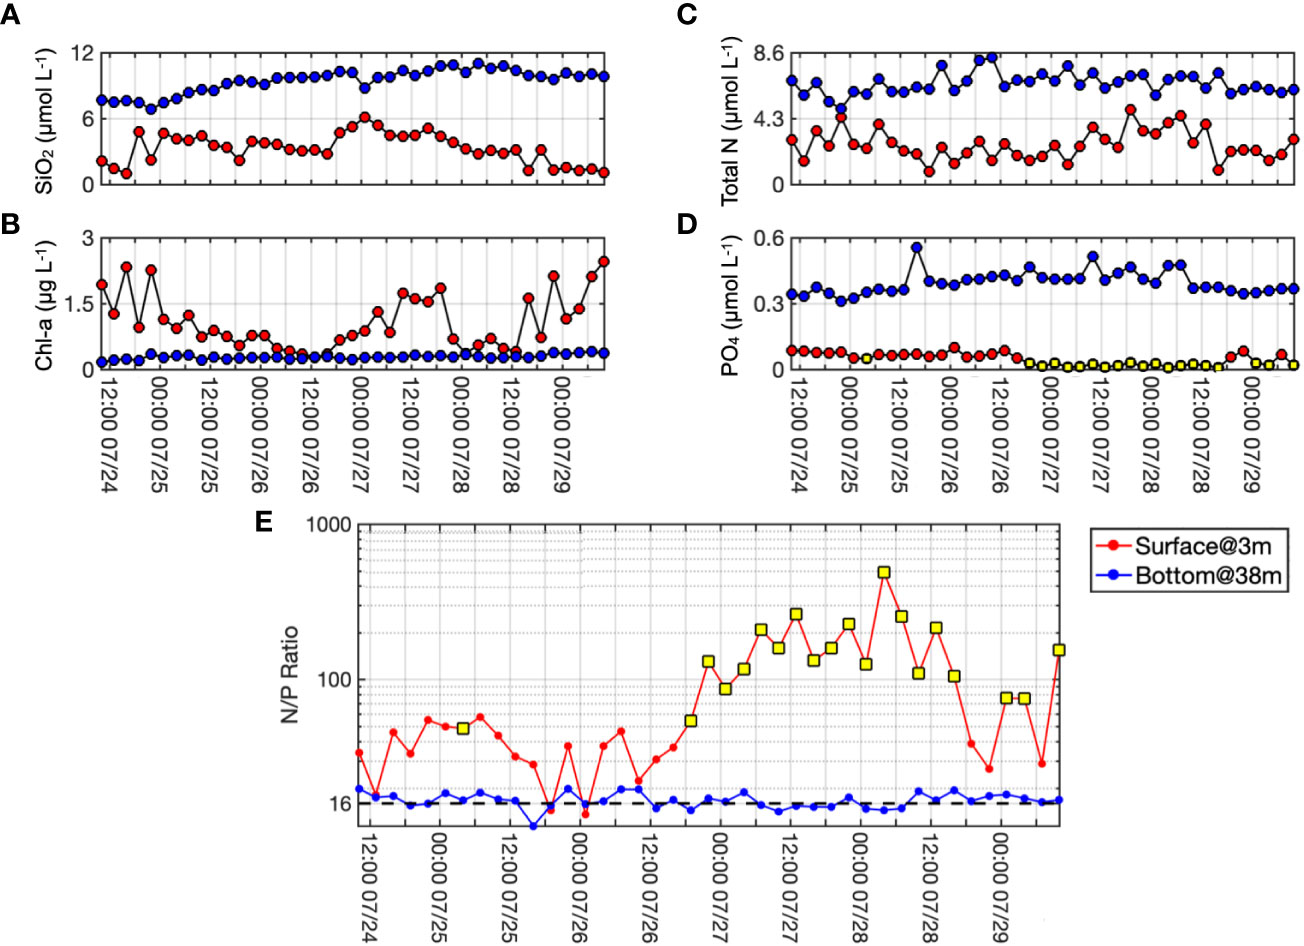
Figure 4 Temporal variabilities of (A) silicate, (B) Chl-a, (C) total N (nitrate + nitrite + ammonia), and (D) phosphate, and (E) the N/P ratio at the surface (red dots and line) and bottom (blue dots and line) at ZHJ2. The black dashed line in (E) indicates the Redfield ratio. The yellow squares marked data points of phosphate concentration below the detection limit.
The N/P ratio at the surface covered a wide range between 13.5 and 491.5 (Figure 4E). The average value was 96, which was six times greater than the Redfield ratio (N/P = 16; Yin et al., 2001). The N/P ratio at the bottom was much lower than that at the surface and ranged between 11.4 and 19.9. Although the concentration of nutrients at the bottom increased (Supplementary Figure 3), the N/P ratio was consistent around the Redfield ratio (Figure 4E).
4.4 Physical properties of suspended particles
The VC of<63 and 63-153 μm size classes were abundant in the upper water column (>4 µL L-1) and near the bottom (1~2 µL L-1; Figures 5A, B). The VC structure of the >153 μm showed higher values in water depth shallower than 25 m with a range from 10 to >50 µL L-1 and significantly decreased to<5 µL L-1 in the lower water column (Figure 5C). VCs at the surface presented semi-diurnal to diurnal fluctuations that were suppressed at around 18:00 07/26 (Figures 5A–C), which was consistent with the CTD profile. The corresponding parameters of the VC (such as light transmission and fluorescence) indicated the influence of the ZRP at the surface and the turbid water at the bottom (Figures 3C, D, 5A–C). Although the depths shown in the VC might deviate, the correspondence among variables suggests that large particles (>153 µm) trapped in the middle of the water column resulted from the stratification (Figure 3B, 5C). Similar VC structures are also observed in the river plume regime seaward of the mouth of the Minjiang River (Du and Liu, 2017).
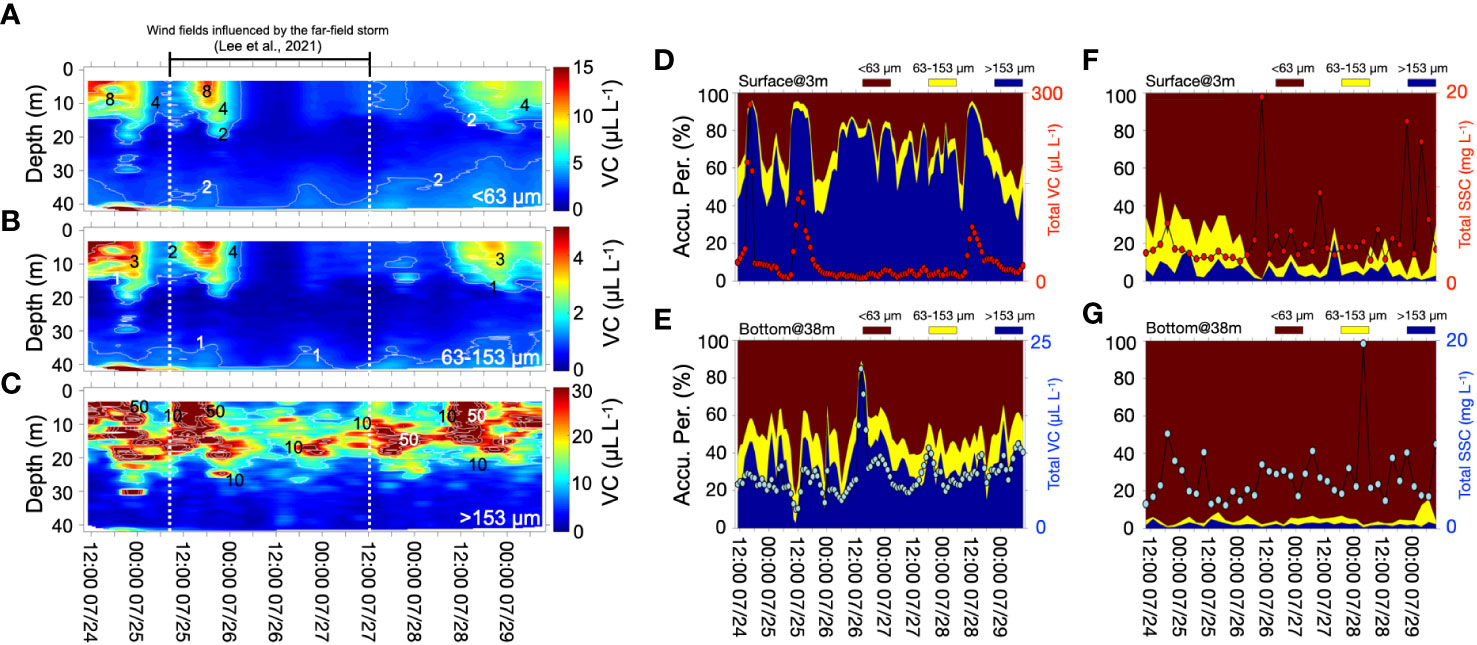
Figure 5 Temporal changes of the 2-D structure of the volume concentration (VC) of the size of (A) <63, (B) 63-153, and (C) >153 µm. The white dash lines in (A-C) mark the duration of the storm influence. Temporal variabilities of the accumulative percentages of size compositions of VC and SSC at the surface (D, F) and the bottom (E, G). The color codes above each frame indicate different size classes.
The temporal distribution of VCs showed size-fractionated structures in the upper water column. At the surface, the VC of<153 µm increased as the salinity decreased (Figures 5A, B; Supplementary Figure 4). However, particles in the >153 µm size class had a higher VC at the salinity peak, known as the plume front, where there was mixing between ZRP and ambient sea waters (Figure 5C; Supplementary Figure 4; Garvine and Monk, 1974; Lee et al., 2016; Li et al., 2021). The VC composition indicates the coarsest particles of >153 μm contributed the most to the total VCs at the surface with an average of 65% and a maximum of 94% (Figure 5D), and the<63 m size class was the second most abundant with an average of 26%. The two smallest size classes were minor in the upper water column but dominant at the bottom, with<63 μm having an average of 50% in the VC composition (Figure 5E). To compare the size composition of the bulk SSC with VCs, the SSC was divided into<63 µm, 63-153 µm, and >153 µm size classes (Figures 5F, G). The average SSC at the surface was 4.6 mg L-1 with a maximum of 19.6 mg L-1 (Figure 5F). In the bottom water, the average SSC was 5.4 mg L-1 with a maximum of 19.7 mg L-1 (Figure 5G). The<63 μm size class contributed most to the bulk SSC both at the surface and near the bottom, and the >153 μm size only contributed lower than 30%. Based on the measured VCs and SSCs, the particle bulk densities () at the surface ranged between 1.03 and 1.52 g cm-3 and averaged 1.19 g cm-3 (Supplementary Figure 5). The ranged between 1.21 and 2.48 g cm-3 and averaged 1.51 g/cm3 at the bottom. It is worth mentioning that the range of is influenced by the assumed density of the solid particle, which is related to the in-situ composition of the SP.
4.5 Chemical characteristics of suspended particles
The bulk POC ranged from 0.06 to 0.19 mg L-1 at the surface, and 0.05 to 0.08 mg L-1 at the bottom (Figure 6A). The POC% in the total SSC varied between 1.05 and 7.09% at the surface and 0.57 and 2.85% at the bottom (Figure 6B). The bulk PN at the surface water varied from 0.01 to 0.03 mg L-1, of which PN% in the total SSC varied between 0.16 and 1.04% (Figures 6C, D). In the bottom water, the bulk PN ranged between 0 and ~0.01 mg L-1, with PN% from 0.06 and 0.29%. Overall, the concentration of POC and PN decreased when the salinity increased in the surface water but rarely changed in the bottom water (Figures 6A, C). The decrease of POC% and PN% with increasing SSC can be fitted with the power regression (R2 > 0.6; Figures 6B, D). Guo et al. (2015) also observed similar results in the Zhujiang estuary and ascribed the pattern to the dilution of organic matter by clastic materials.
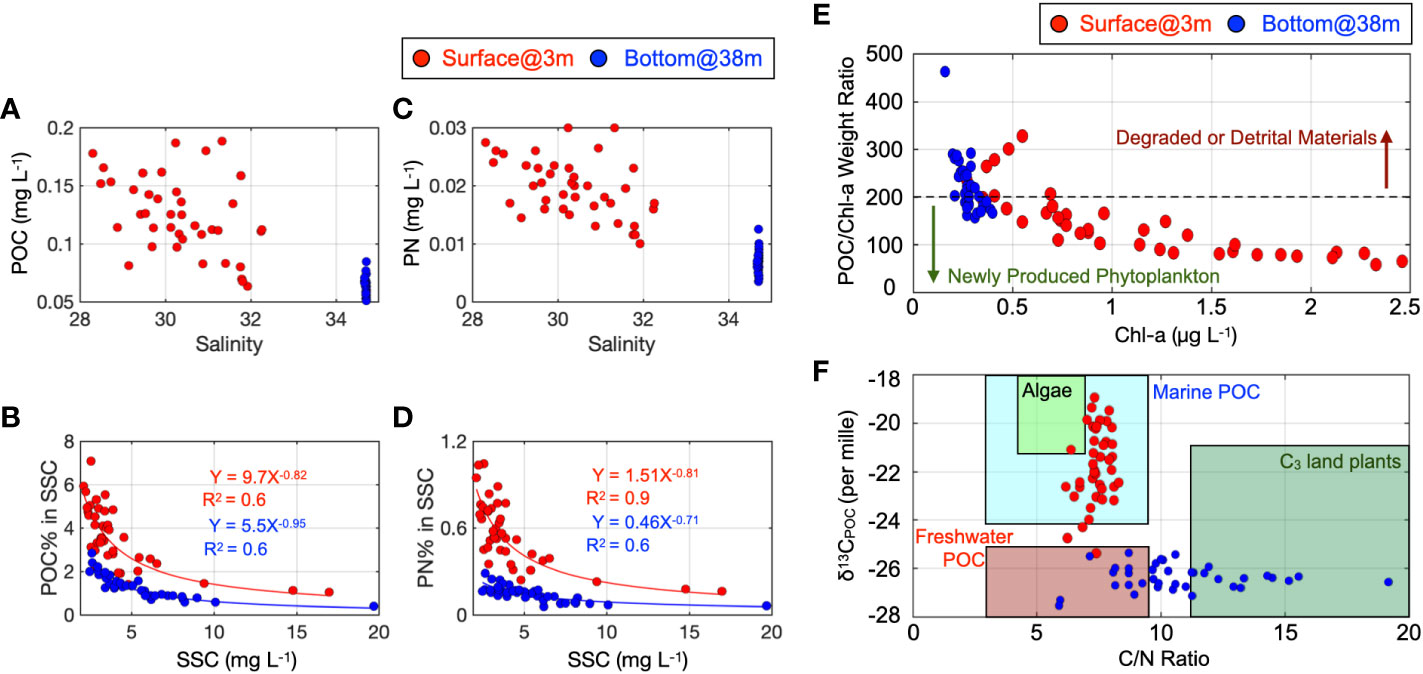
Figure 6 Measured OM parameters from water samples taken at the 3 (red) and 38 m (blue) depths, respectively. (A) The concentration of POC vs. salinity, (B) the POC% is plotted against the SSC with power regression lines, R2, and the fitting equations. (C) The concentration of PN vs. salinity, (D) the PN% is plotted against the SSC with the power regression lines, R2, and the fitting equations. (E) The POC to Chl-a ratio vs. measured Chl-a at the surface (red dots) and bottom (blue dots). The black dashed line indicates the demarcation value at 200. (F) The δ13CPOC vs. C/N diagram. Boxes indicate the different domains of OM in the C/N vs. δ13CPOC diagram (data compiled from Bordovskiy, 1965; Haines, 1976; Sherr, 1982; Schidlowski et al., 1983; Meyers, 1994; Peterson et al., 1994; Middelburg and Nieuwenhuize, 1998; Chivas et al., 2001; Raymond and Bauer, 2001; Cloern et al., 2002; Lamb et al., 2006; and references therein).
The POC to the Chl-a ratio (PC ratio) was used to identify the degradation of the POM (Figure 6E; Wang et al., 2011; Guo et al., 2015). The threshold of the PC ratio between the newly produced phytoplankton and the degraded materials (or detrital) is 200. If the PC ratio is lower than 200, the newly grown phytoplankton dominates and vice versa. Our results show that most PC ratios at the surface were lower than 200 in general (the value changed from 57.7 to 327.3) with a wide range of Chl-a values. The bottom POM showed PC ratios close to or higher than 200 (from 156.5 to 462.5) with a narrower range of Chl-a.
The atomic carbon-to-nitrogen ratio (C/N ratio) ranged from 6.17 to 8.31 at the surface, having an average of 7.4 and a standard deviation of 0.52; it ranged from 5.89 to 19.19 at the bottom, having an average of 10.7 and a standard deviation of 2.71 (Figure 6F; Supplementary Figure 6). The surface δ13CPOC varied from -25.38 to -18.93‰, with a mean value of -21.76‰ and a standard deviation of 1.53‰. The bottom δ13CPOC ranged between -27.55 and -25.35‰ with an average of -26.37‰ and a standard deviation of 0.51‰. According to the C/N ratio and the δ13CPOC, the signature of the POM is characterized as marine sourced at the surface (enriched δ13CPOC) but terrestrial sourced at the bottom (depleted δ13CPOC).
The Fm showed that the proportion of the marine POM ranged between 31.7 and 91.4% at the surface (Figure 7), and the average value was 65.2%. The Fm increased when the salinity decreased, and vice versa. This indicates that the marine POM was dominant in the river plume regime. The Fm in the bottom layer was much lower than that at the surface and was constant around the value of 22.5%, which implies low marine POM content.
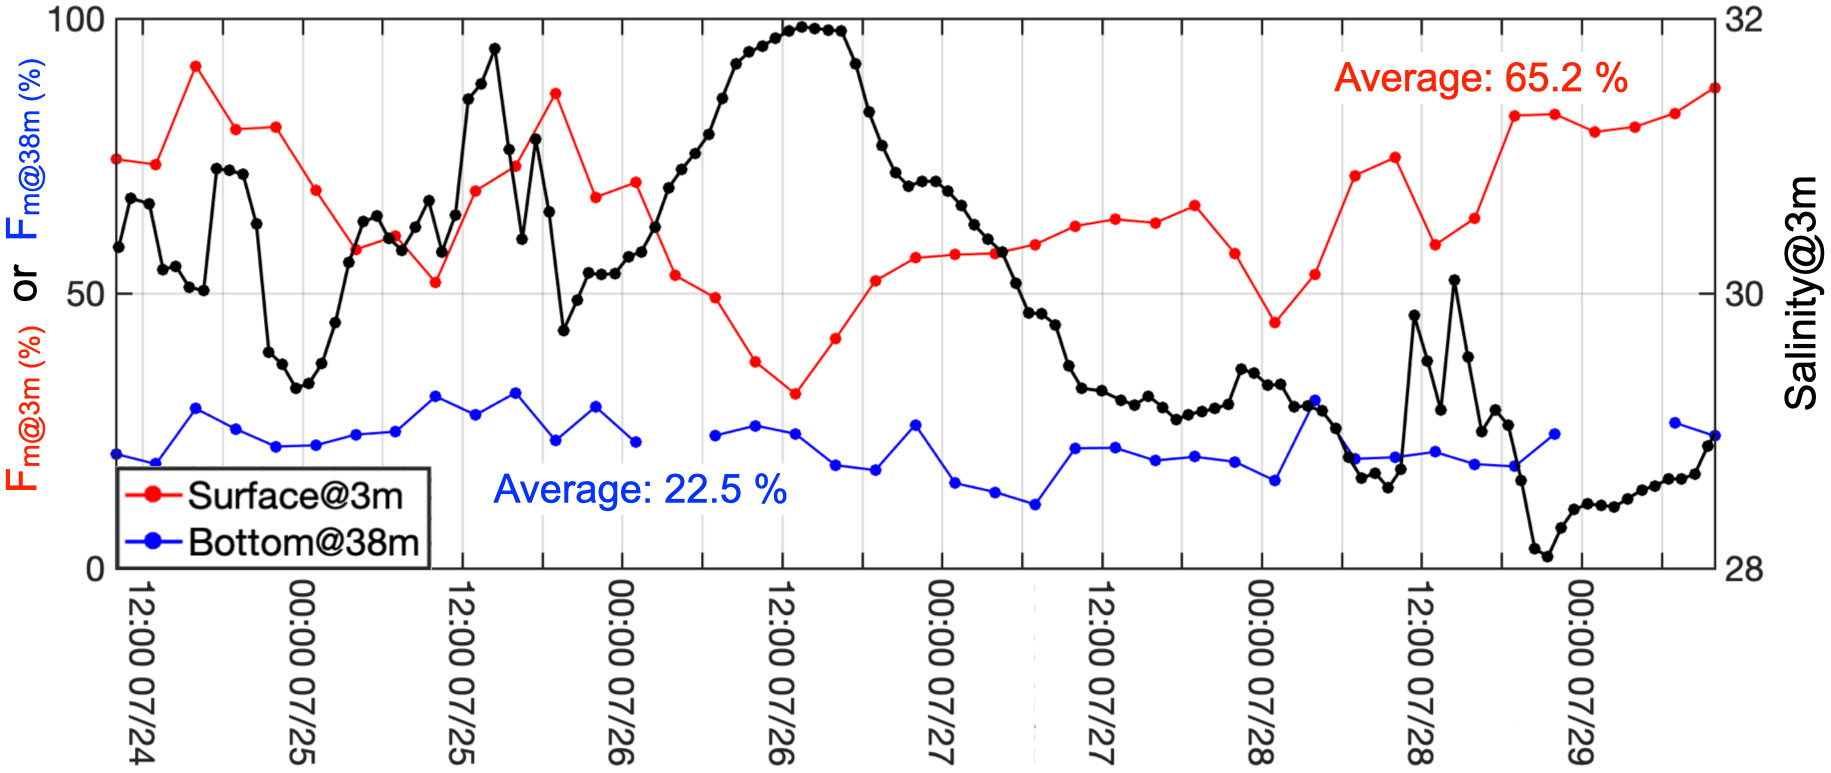
Figure 7 The derived Fm at 3 and 38 m (marked with red and blue lines, respectively). The black line indicates the salinity measured at 3 m during the observation.
4.6 Surface sediment
The grain-size composition of the surface sediment was slightly bimodal (Figure 8A). One peak was at 12 μm, and the other was at 60 μm. Following the previous convention (Lee et al., 2016; Du and Liu, 2017; Du et al., 2022; Liu J. T. et al., 2018), the size classes were classified into<63, 63-153, and>153 μm for cross-comparison with other measured variables (Figure 8B). Most of the contribution (84%) to the bulk volume in the surface sediment was from the<63 μm grain-size class. The second most contribution (15%) was from the 63-153 μm grain-size class. The >153 μm grain size class only contributed<1% to the bulk volume.
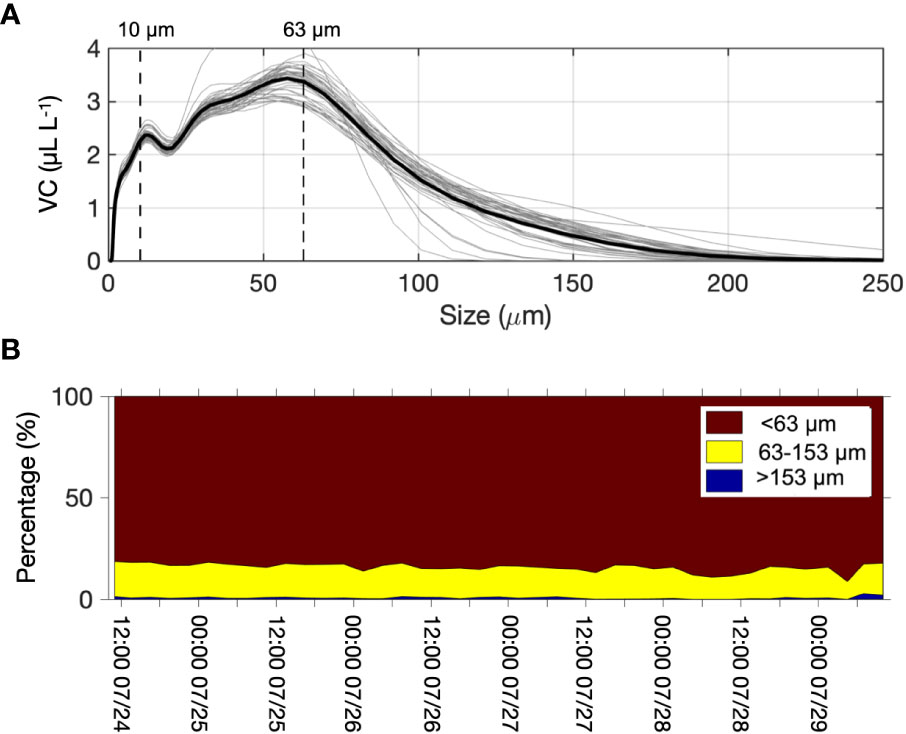
Figure 8 The grain-size composition of the surface sediments collected at ZHJ2 including (A) the size distribution in VC of all samples; (B) temporal changes in percentage of size composition in VC.
4.7 Shear velocity
The ranged from 0.1 to 10.8 mm s-1 and varied semi-diurnally to diurnally (Figure 9). Because of the comparatively low significant wave height (< 1.5 m on average; Supplementary Figure 1), the derived was close to 0 mm s-1. Thus, the was mainly affected by the flow field and followed the variability of the . To clarify the process-response of the resuspension, in the 63 μm grain-size class () was calculated with the particle densities having 2.65 g cm-3 (detrital material; ; red line) and 1.5 g cm-3 (in-situ particle bulk density near the bottom in Supplementary Figure 5; ; red dashed line). Although rarely exceeded the entrainment threshold for detrital material of 63 µm ( at 9.1 mm s-1), it was beyond the at 5.5 mm s-1 frequently (Figure 9). However, the was still lower than in both cases (detrital material and in-situ bulk density) at 17.2 mm s-1 and 8.3 mm s-1, respectively.
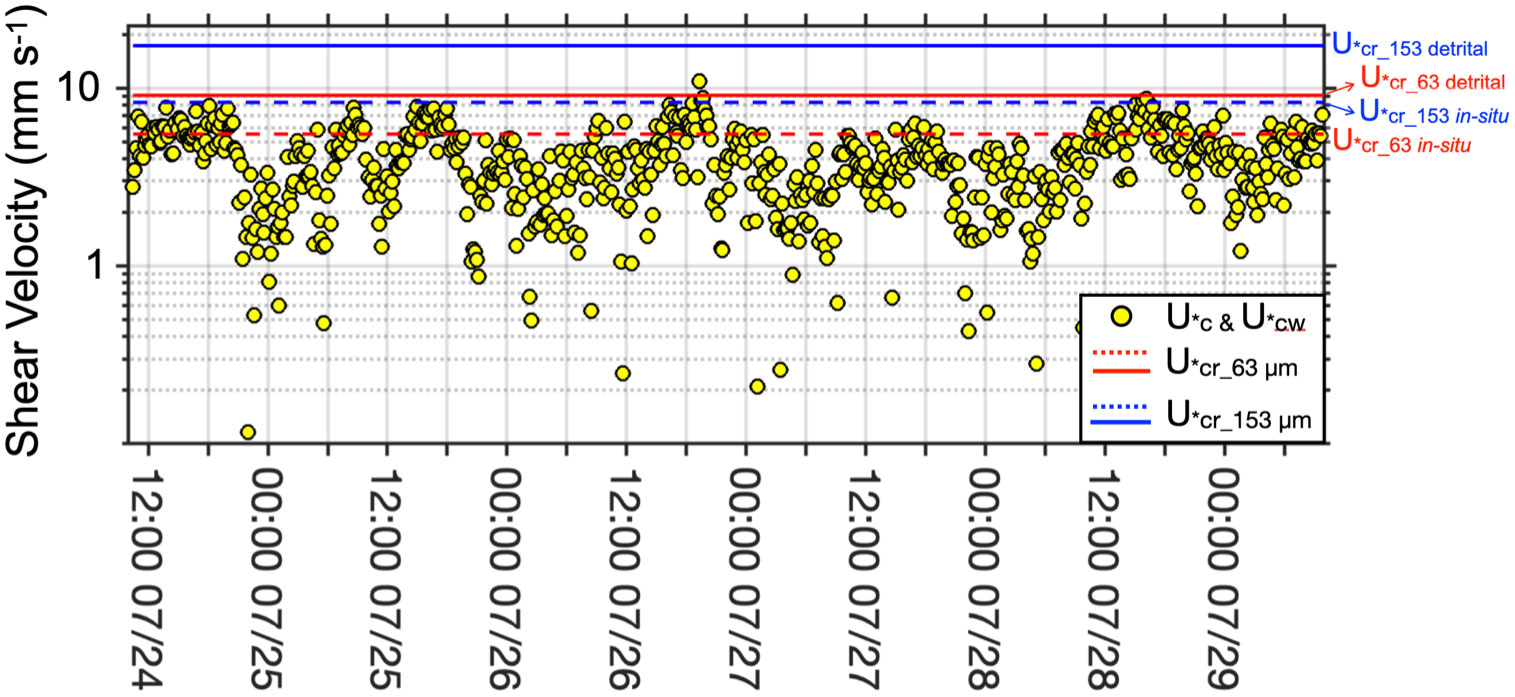
Figure 9 Calculated shear velocities induced by currents and current-wave couplings (u*c and u*cw, marked with yellow dots). The dashed and solid red lines indicate the critical shear velocities of the 63 µm grain size with the measured particle density (1.53 g cm-3) and the assumed detrital density (2.65 g cm-3), respectively. The dashed blue and solid lines indicate the critical shear velocities of the 153 µm grain size with the measured particle density and the assumed detrital density, respectively.
4.8 Frequency spectral and coherence analysis
The frequency spectrum of the shear velocity showed an intense energy peak centered at the diurnal frequency (Figure 10A). Similar patterns were also found in the light transmission and VCs within 1.5 mab, except for the >153 μm grain-size class that showed higher energy at 0.8 cycles per day (Figure 10B–E). The power density of the VC in the<63 μm size class was more substantial and more concentrated at the diurnal frequency than that in other size classes. Among the three sizes, the 63-153 µm class was able to be entrained the highest above the seabed (up to 1.5 m). The spectral coherence of the shear velocity to the light transmission and VCs revealed a high peak (>0.7) at the diurnal period, except for the coarsest size class in the VC (Figure 10F–I).
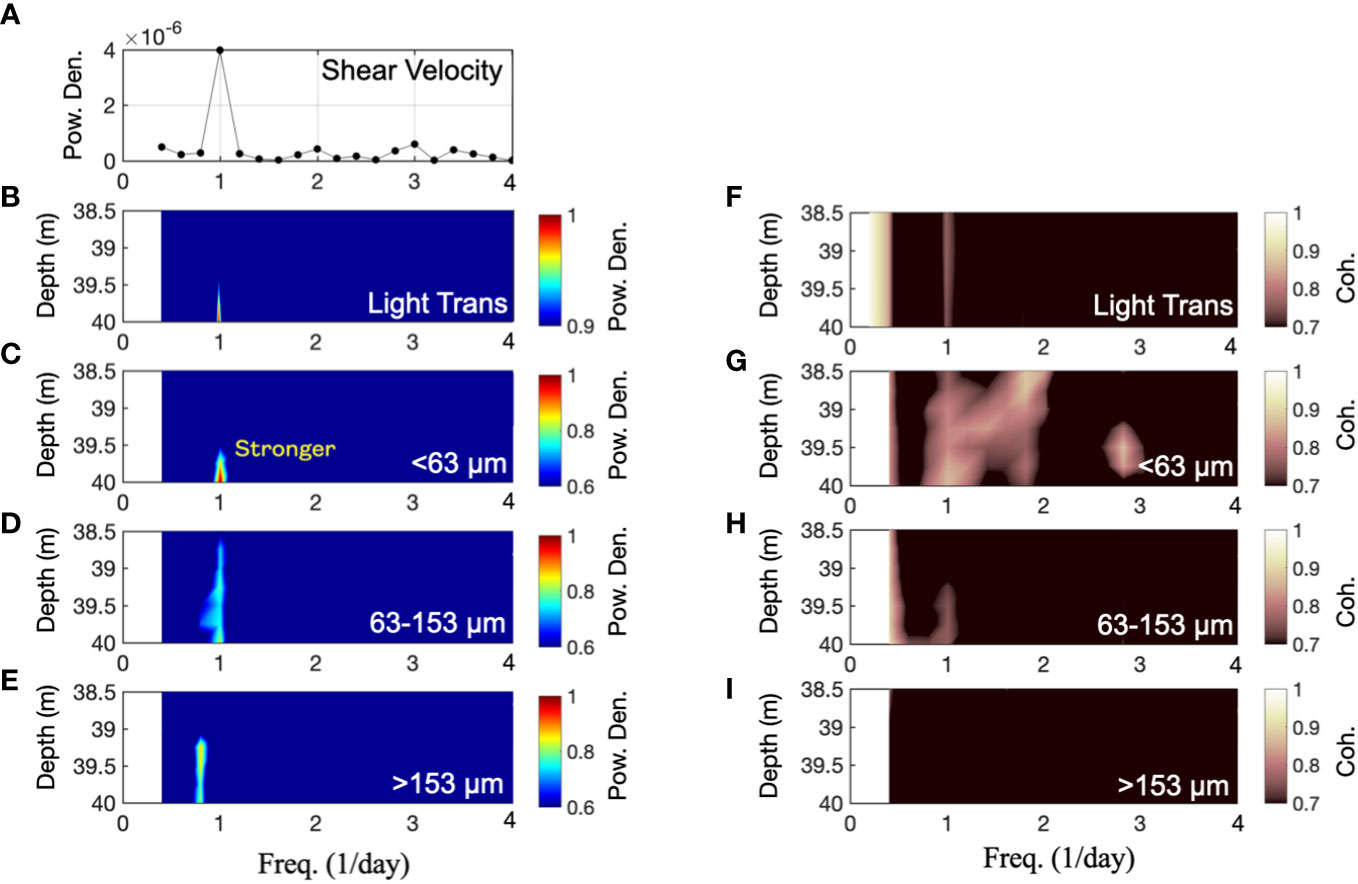
Figure 10 Power spectra and coherence plots of (A) the shear velocity (u*cw); (B-E) light transmission, and VCs in<63, 63-153, and >153 µm grain size classes, respectively in the depth range of 38.5~40 m; (F-I) The coherence between the spectra of the light transmission and VCs in<63, 63-153, and >153 µm grain size classes, respectively in the depth range of 38.5~40 m.
5 Discussion
5.1 The ZPR regime and SPs dynamics in the upper water column
Previous studies have described that the mechanisms controlling the dispersion of the ZRP are couplings among the wind field, tidal and non-tidal flows, and upwelling currents (Zu et al., 2014; Zu and Gan, 2015; Lee et al., 2021). The southwesterly monsoon wind field dominates in the summer and drives the less saline ZRP water northeastward along the Guangdong coast (Figure 2; Gan et al., 2009a; Zu and Gan, 2015; Lee et al., 2021). The diluted ZRP water mass occupies the upper water column of the NSCS and carries abundant Zhujiang effluent. Therefore, the surface water displayed the signature of low water density, low light transmission, high fluorescence, and high VCs on the pathway of the ZRP (referred to as the ZRP regime; Figure 3, 5A–C).
The high N/P ratio at the surface in the NSCS is considered the signature of the ZRP water (Figures 2; 4E; Yin et al., 2001), which was caused by the excessive N exported from the Zhujiang River due to the fast-growing population and agricultural industries along the upper reaches (Yin et al., 2001). Phytoplankton growth was stimulated when the ZRP delivered high riverine N to the N-limited NSCS (Huang et al., 2020). Our data shows that the POM in the ZRP regime was marine-sourced and “fresh” (growing in-situ or in the adjacent area) instead of exported riverine algae (Figures 6E, F; Supplementary Figure 6A). Although POC only contributed 4% to the bulk SSC on average at the surface (Figure 6B), this value is comparable to those in the Changjiang River and Rhône River (Lorthiois et al., 2012; Zhao and Gao, 2019). The maximum proportion of those marine POM reached 90% in the ZRP regime which varied independently against the salinity (Figure 7). The particle size also changed against the salinity, which had finer SPs (<153 µm) in the ZRP regime but coarser size class (>153 µm) at the plume front (Figure 5A-C; Supplementary Figure 4). The bulk density of the SP (1.19 ± 0.13 g cm-3) indicates that particles at the surface water were fluffy with low mass, such as phytoplankton or flocs (Figure 6F; Supplementary Figure 5; Gregory, 1998; Lee et al., 2016; Du et al., 2022).
5.2 The coupling between physical processes and the particle biogeochemistry at the surface
Because of the co-varying nature of the data that included physical forcing, water mass property and the nature of particles, a multivariate analysis technique, empirical orthogonal function (EOF) analysis, was used to render interpretations on the inter-relationship among all variables (Liu et al., 2019; Liu et al., 2021; Yang et al., 2021; Du et al., 2022). The covariability of several independently measured variables at 3 m were synchronized at 3-hr intervals to be objectively deciphered by each eigenmode (Figures 11, 12). In the analysis, the measured flow field was decomposed into alongshore and across-shore components. Then the non-tidal and tidal parts of each alongshore and across-shore flow were separated. The non-tidal flow represents the wind-driven flow. The tidal flow represents tidal motions. The salinity, temperature, and light transmission stand for the signature of the water mass. A Static Stability Index (E value), which has been used to quantify the water column stability (Du and Liu, 2017; Lee et al., 2021), was included to represent the mixing processes. The PC ratio and Fm indicate the biogeochemical properties of the SP related to its transformation (newly produced or degraded) and source/provenance (marine or non-marine). The represents the physical property of the SP. The variables with higher values of eigenvectors are the dominant variables influencing the co-variability of a particular eigenmode (Figures 11, 12). The interpretation of EOF results is subject to the user’s experience and knowledge of the analyzed variables (Liu et al., 2019).
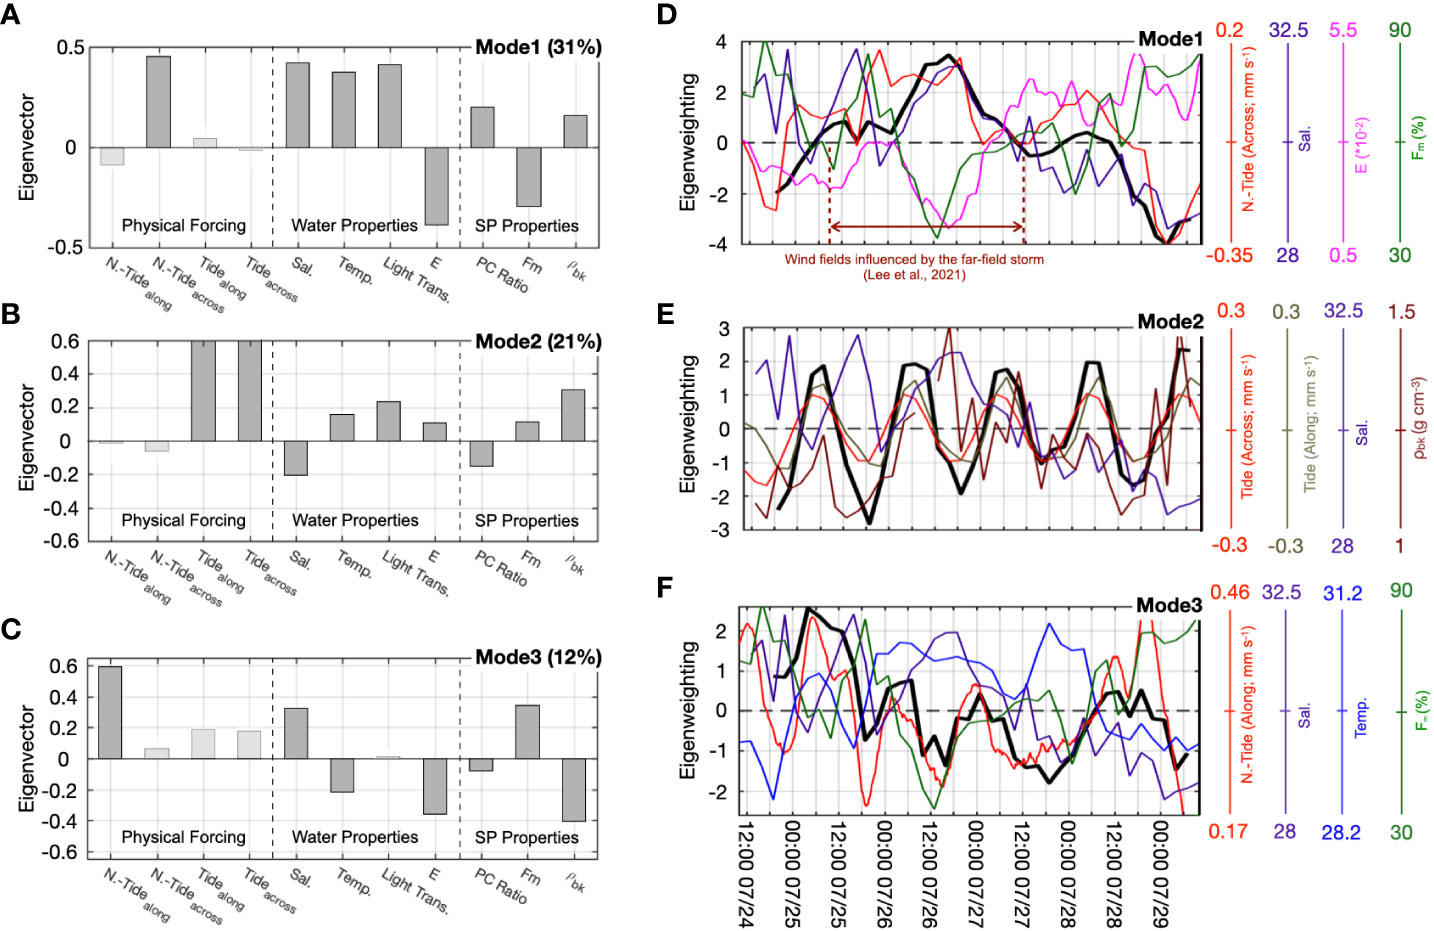
Figure 11 Plots of the EOF analysis results including (A-C) Eigenvectors of the first three modes. The dominant variables are in dark gray, and the rest are in light gray. The eigenweighting curve of each mode (bold black curve) is potted against the selected variables including (D) the across-shore non-tidal flow (red), salinity (dark purple), E (magenta), and Fm (green); (E) the across-shore tidal flow (red), the alongshore tidal flow (yellow-green), salinity (dark purple), and particle bulk density (brown); (F) the along-shore non-tidal flow (red), salinity (dark purple), water temperature (blue), and Fm (green). The duration influenced by the storm wind is marked with the brown dashed lines in (A).
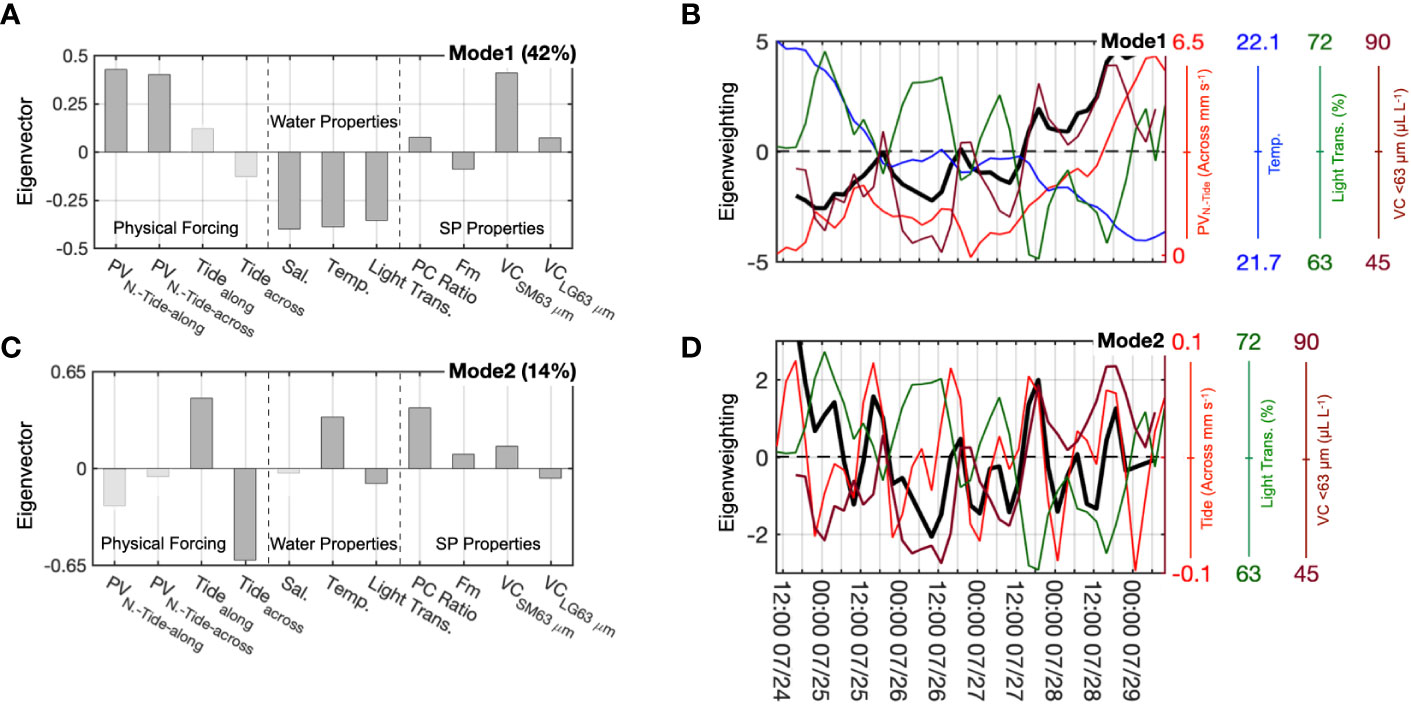
Figure 12 Plots of the EOF analysis of results. (A, B) Eigenvectors of the first two modes. The dominant variables are in dark gray, and the rest are in light gray. The eigenweighting curve of each mode (bold black curve) is potted against the selected variables including (C) the across-shore non-tidal PV (red curve), temperature (blue), light transmission (green), and VCs in the <63 µm size class (brown); (D) the across-shore tidal flow (red), light transmission (green), and VCs in the<63 µm size class (brown).
At the surface, the first three eigenmodes of the EOF analysis explained 64% of the standardized covariance in the original dataset (Figure 11A–C). In the 1st eigenmode (31%; Figure 11A), the eigenvectors in the positive group included landward non-tidal flow (representing physical forcing), salinity, temperature, light transmission (representing offshore water), PC ratio (representing degraded materials), and (representing denser texture). The negative group included E value and Fm (representing low water stability and depleted δ13CPOC). These groupings indicated the landward non-tidal flow that delivered the offshore water mass of higher salinity, temperature, and light transmission (lower turbidity), which was opposite to the water column stability. Furthermore, the landward transport of offshore water entrained more depleted δ13CPOC and degraded particles having a high bulk density.
The temporal pattern of the 1st mode grouping is represented by the eigenweighting curve, plotted against selected variables for comparison (Figure 11D). The variables that mimic the eigenweighting curve of this mode are non-tidal across-shore flow and salinity; and the E and Fm curves are the mirror images of the eigenweighting curve. The zero-crossings of the eigenweighting curve indicate the time that the landward non-tidal flow occurred under the influence of the far-field storm wind and suggests the regime shift at the surface (Figure 11D; Huang et al., 2020; Lee et al., 2021). The low surface N/P ratio in the same period was attributed to the strong wind-induced mixing (low E) between the ZRP and ambient waters (Figure 2; Supplementary Figure 7). The out-of-phase relation of the Fm to the eigenweighting curve suggests that more depleted δ13CPOC, degraded, and denser POM became dominant when the surface was filled with offshore water (Figures 7, 11A, D). Therefore, the 1st mode described the influence of the far-field wind forcing on regimes in the upper water column.
The eigenvectors in the 2nd mode (21%) showed dominance by tidal motions in both alongshore and across-shore directions (Figure 11B). The eigenweighting curve presented in phase with the flood tide (NE-directed alongshore and the inshore-directed across-shore tidal flows; Figure 11E) and out of phase with salinity. Therefore, this mode indicates the on/off-shore dispersal of the ZRP by the tidal modulation (Lee et al., 2021). During the flood tide, the warm river plume enhanced the stratification in the upper water column (positive temperature, negative salinity, and positive E in eigenvectors; Figures 11B, E) and had less turbidity (high light transmission), with fresh marine-sourced POM (negative PC ratio and positive Fm);. When the ebb tide pushed the ZRP offshore, the regime at the surface shifted to the turbid plume front which contained more degraded POM having a denser and the less enriched-δ13CPOC (Figure 11B; Supplementary Table 3).
The eigenvectors in the 3rd mode (12%) show the dominant variables in the positive group were the alongshore non-tidal flow, the salinity, and the Fm (Figure 11C). The dominant negative variables included the water temperature, E, PC ratio, and . These groupings indicated the NE-ward non-tidal flow was associated with the transport of the saline and cold-water mass that carried newly produced and marine-sourced particles with low at the surface. Since Wang et al. (2014) pointed out that the strength of the NE-ward flow had a recognizable contribution to the upwelling intensity in the NSCS, this mode infers the effect of the varying upwelling. The secular trend of the eigenweighting curve was accompanied by the decreasing non-tidal alongshore flow and salinity, implying the regime shifted from the saline upwelling regime to the ZRP regime during observation (Figure 11F), which was observed by the SST satellite images (Supplementary Figure 8; Multiscale Ultrahigh Resolution SST product; JPL MUR MEaSUREs Project, 2015). The corresponding biogeochemical properties of SPs, such as δ13CPOC-derived Fm and , changed due to different bio-communities in the ZRP and upwelling regimes (Yin et al., 2001; Li et al., 2021). Our results showed that POM in the upwelling regime carried lighter biogenic particles having more enriched δ13CPOC than that in the ZRP regime (Figure 11C; Supplementary Table 3; Gan et al., 2010; Lu et al., 2010; Gao et al., 2018).
5.3 The BNL regime and SPs dynamics near the bottom
The bottom regime was identified by the presence of a 10-m thick benthic nepheloid layer (BNL), which is characterized as the water mass with low light transmission than that in the ambient seawater (Figure 3C; Hoshika et al., 2003; Du and Liu, 2017; Tian et al., 2022). The average light transmission in the BNL (68%) was comparable to that in the surface ZRP (71%). Although the BNL has been widely observed in estuaries and marginal seas (Liu et al., 2014; Du and Liu, 2017; Jia et al., 2019; Feng et al., 2021), studies of particle dynamics in the BNL on the NSCS shelf are still in progress (Gong et al., 2020; Li et al., 2021).
The high bulk density of particles and PC ratio in the bottom regime indicated that the POM was degraded (Figures 6; Supplementary Figure 5). This resulted in a low proportion of bulk SP (<3% in POC and<0.3% in PN) and a wide range of C/N ratios with a weak linear relationship (R2<0.12) between the atomic carbon and nitrogen (Figure 6F; Supplementary Figure 6B). The degraded POM in the BNL was suggested as “terrestrial-sourced” due to the depleted δ13CPOC values (lower/lighter than -25‰; Figure 6F), which could be caused by the microbial effects or degradation (Liu et al., 2007; Close and Henderson, 2020). The Fm indicated that the proportion of marine materials (enriched δ13CPOC) only contributed 22.5% of the bulk POM in the bottom regime (Figure 7). Interestingly, there is a missing link to interpret the source of the δ13CPOC in the BNL because both the ZRP and previous surface sediment records had enriched δ13CPOC in the bulk POM (Yu et al., 2010; Guo et al., 2015; Cao et al., 2020). Therefore, the EOF analysis was used to determine the complex process-response relationship between the physical forcing and SPs in the bottom regime.
5.4 The coupling between physical processes and particle biogeochemistry near the bottom
In the EOF analysis (Figure 12A), the PVs of non-tidal flows (Supplementary Figure 2D; Lee et al., 2021) were chosen to represent the net movement/displacement of the bottom water mass as part of the upwelling-associated circulation and were divided into along-shore and across-shore components. The tidal flow represented the tidal forcing. The salinity, temperature, and light transmission represented the bottom water mass. PC ratio, Fm, and VCs represented properties of SPs. VCs were separated into two groups using the 63 μm as the bench line to represent the responses in SPs of different sizes under various hydrodynamic forcing. Only the first two eigenmodes (accounting for 56% of the data) are described in the following section because the third mode only explained<10% of the standardized covariance of the original dataset.
The 1st eigenmode explains 42% of the standardized covariance (Figure 12A). Based on the eigenvectors, the positive PVs in both components represent the net NE-alongshore and landward movements of water masses having low salinity, low temperature, and low light transmission (variables in the negative group). The POM carried by the water masses was degraded and depleted-δ13CPOC (positive PC ratio and negative Fm) and dominated by finer particles partially with coarser size (highly positive in VC<63µm and less in VC>63µm). The eigenweighting curve in the first mode having an increasing secular trend illustrates the main biogeochemical attributes of the SPs associated with the intrusion of the cold offshore water driven by the upwelling circulation (Figures 2, 12C; Supplementary Table 4; Lee et al., 2021).
The 2nd mode explains 14% of the covariability showing the dominance of tidal forcing (Figure 12B). The combined SE tidal flow (positive in the alongshore tidal flow and negative in the across-shore tidal flow) caused the bottom water to become more turbid (negative light transmission), and the POM were degraded, marine-sourced, and finer materials (positive PC ratio, Fm, and VC<63μm).
The 2nd mode eigenweighting curve presented a semidiurnal to diurnal variability and mimicked the variability of the tidal flow (Figure 12D). Since the power density spectrum of the shear stress, the light transmission, and VCs showed pronounced peaks located at/near the diurnal frequency with high coherences (Figure 10), a forcing-response relationship in the entrainment of bottom sediment caused by the tide-related process is clear. The resolved tidal flows near the bottom were likely to generate turbulences inducing resuspension of particles having high bulk density (Supplementary Figure 5; Lee et al., 2021; Liu J. T. et al., 2018; Weeks et al., 1993). The eigenvector of the VC>63μm was negative (Figure 12B) because the theoretical entrainment analysis based on the bulk density of particles indicated the strength of the was insufficient to suspend coarser particles (Figure 9). This explains why the high coherence to the shear velocity only occurred in the VCs of finer size classes at the diurnal frequency (<153 μm; Figures 10G–I). In addition, the surface sediment was mainly composed of<153 μm, which limited the “source” of coarser particles to be suspended (Figure 8, Supplementary Table 4).
5.5 Contrasting regimes in the water column
Although both wind field and tidal forcing played important roles at surface and bottom regimes, the processes-responses were different in the physical forcing and biogeochemical properties of SPs (Figures 11 – 13). At the surface, the summer monsoon wind and tidal flows resulted in the coastal circulations that controlled the dispersal of the regime among upwelling, plume front, and ZRP (Figures 13A, B, E, F). With the episodic far-field storm wind, the mixing processes among regimes increased (Figure 13D). Near the bottom, on the other hand, the southwesterly monsoon wind field was associated with the landward transport of the cold offshore water through the upwelling circulation (Figure 13B). The tidal oscillation caused the local sediment resuspension off the seabed, which led to the development of the BNL (Figures 13B, C)
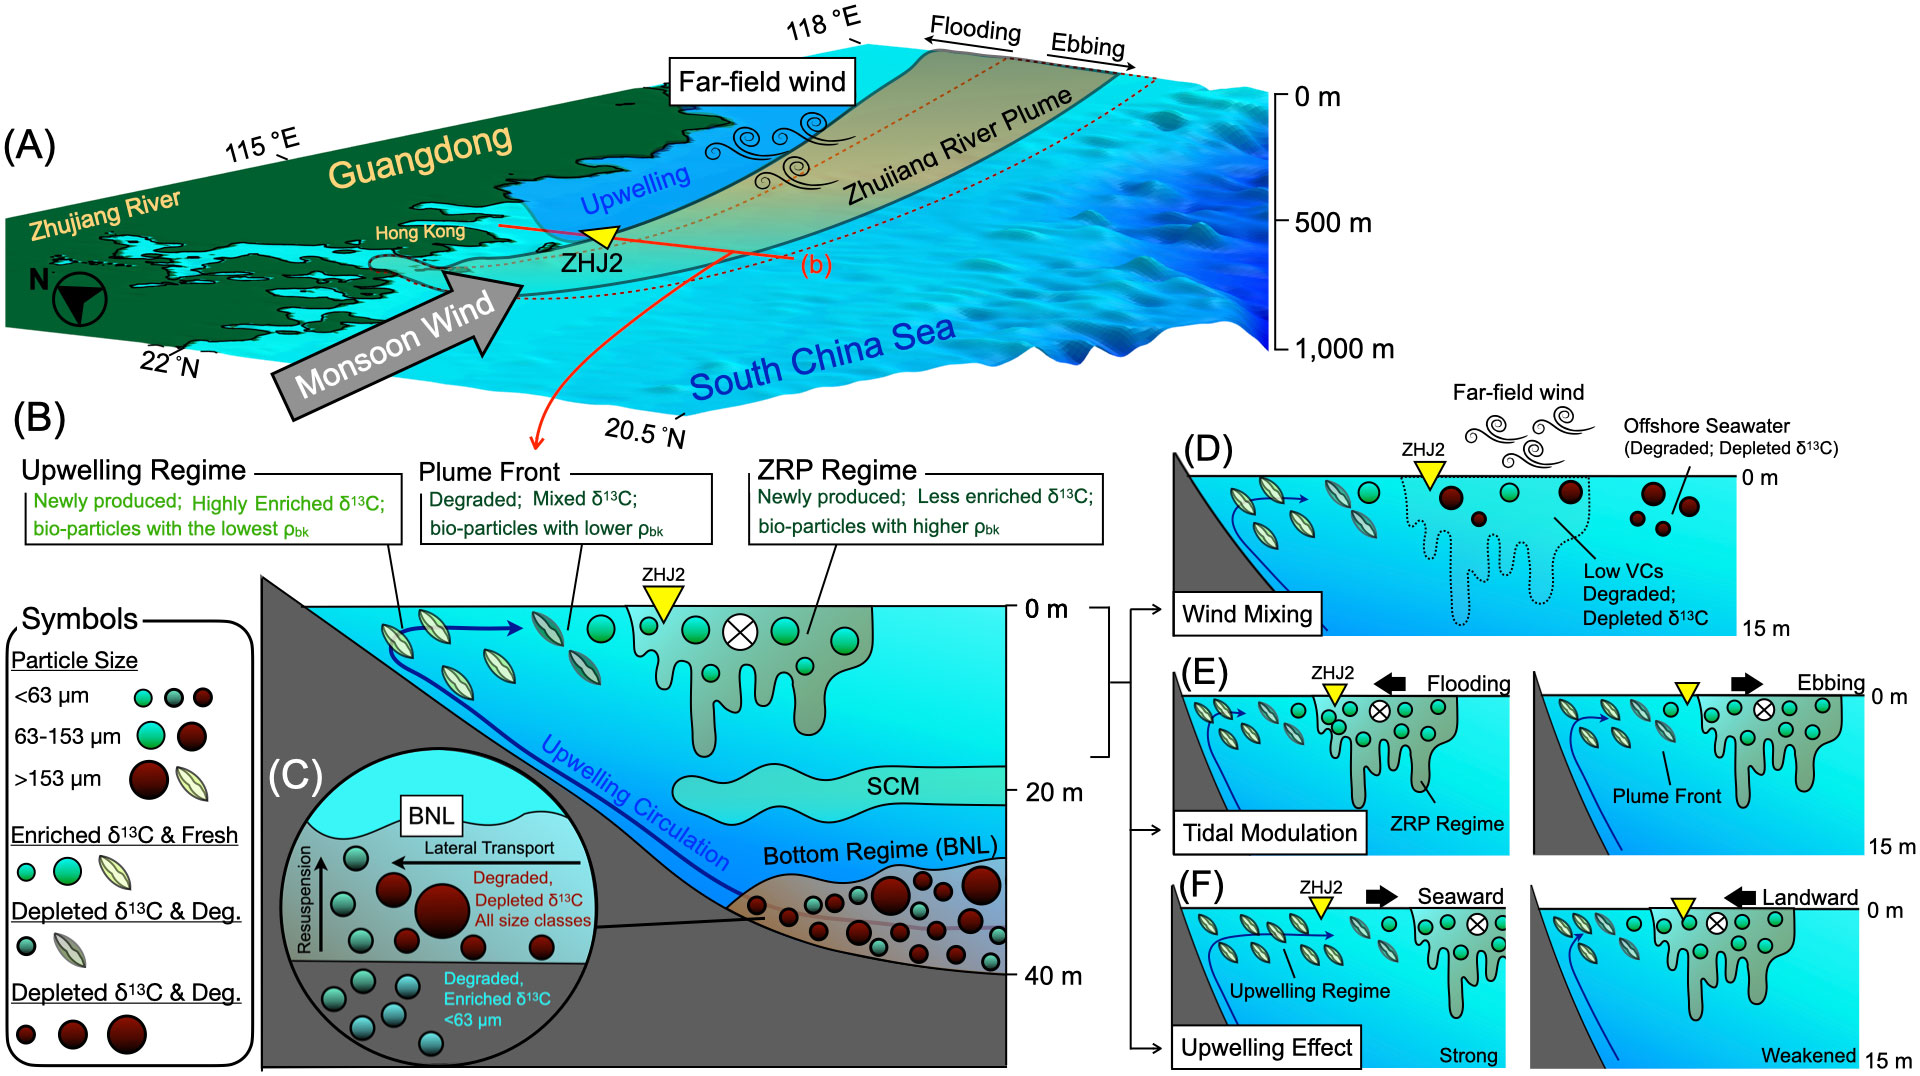
Figure 13 A schematic diagram illustrating process-response relationships among the physical forcing and types of SPs, including (A) The bird’s view of the physical forcing includes the southwesterly monsoon wind, tidal modulations, and far-field wind along the propagation pathway of the ZRP. (B) Along the transect in (A) shows regimes entraining SPs in the water column (the transect in (A) is marked “(B)”). The characteristic of each regime is described in the box above the (B). Different symbols on the left indicate the types of particles. (C) The circle shows an enlarged BNL. The cause-and-effectiveness between the physical forcing and SPs in the upper water column is on the right, such as (D) the mixing induced by the far field wind, (E) the tidal modulations, and (F) the upwelling-associated effect. The inverted yellow triangle indicates the location of ZHJ2. .
The corresponding POM in surface regimes was newly produced marine phytoplankton because the ZRP and upwelling delivered nutrients supporting the primary production (Figure 13B). In the lower water column, by contrast, the degraded POM was attributed to the particles entrained from the offshore and reworked surface sediments (Figures 13B, C). Therefore, the biogeochemical properties of the SP exhibited lighter particle bulk density and more enriched δ13CPOC at the surface (fluffy biogenic particles) than those in the lower water column (denser detrital materials having a depleted δ13CPOC; Figures 6E, F; Supplementary Figure 5).
The SPs showed size-fractionated nature in the water column, that there are coarser particles (>63 µm) at the surface but finer particles (<63 µm) at the bottom (Figures 5D, E). Regimes at the surface had diverse particle sizes among ZRP (<153 µm), the plume front (>153 µm), and the upwelling region (20-200 µm; Li et al., 2021), which was caused by the different bio-growing mechanisms and the mixing processes (Figures 5A-C; Supplementary Figure 4; Lee et al., 2016; Li et al., 2021). Furthermore, large particles were trapped below the pycnocline due to stratification caused by the ZRP (Figure 3B, 5C; Du and Liu, 2017; Liu et al., 2019).
5.6 Implications on the close coupling between physics and particle-related biogeochemistry on river-dominated continental shelves
Satellite images, in-situ observations, and numerical modeling have suggested the effluent exported from the Zhujiang is transported to the southern Taiwan Strait in summer (Chen, 2002; Gan et al., 2009b; Bai et al., 2015; Lee et al., 2021). However, our field measurements demonstrate that ZRP mainly consisted of marine-sourced POM instead of terrestrial POM (Figure 6). A similar POM composition was also found in the plumes of the Changjiang River (Gao et al., 2014) and the Amazon River (Weber et al., 2017), but not in the case of abundant riverine C3 sources in the Rhône River and Fly River (Goni et al., 2006; Harmelin-Vivien et al., 2010). The different source identification of SPs affects the evaluation of the OM budget on the pathway of ZRP. With the proportion of marine OM and the derived bulk density of SPs in the water column (Figure 7, Supplementary Figure 5), the transport and settling flux of OM can be precisely estimated on the inner shelf of the NSCS.
The EOF analysis provides a powerful tool to objectively differentiate the effects of non-tidal and tidal forcing on the associated water masses and diverse sources of particles in the sediment transport process. For example, the discrepancy in δ13CPOC between the bottom water mass (-26.37‰) and the surface sediment (-24‰ ~ -23‰) has been observed on the inner continental shelf of the NSCS (Yu et al., 2010; Guo et al., 2015; Cao et al., 2020), but the cause-and-effect is challenging to validate due to the complicated coupling of physical forcing. The EOF analysis demonstrates that the upwelling-associated landward transport delivered the degraded POM having depleted δ13CPOC to the nearshore, while the tide-related forcing entrains enriched δ13CPOC particles from sediment. The combination of physical processes resulted in a depletion of the overall δ13CPOC in the BNL. Without constraints of physical forcing, identifying the particle source based only on the biogeochemical properties of the SP might be misleading. Understanding the process-response nature of SPs in the upwelling-favorable environments helps to establish the source-to-sink (S2S) conceptual framework for biogeochemical cycles on the river-dominated continental shelf like the NSCS.
6 Conclusion
This study used an interdisciplinary approach to investigate the close coupling between physical processes and biogeochemical properties of SPs on the pathway of the ZRP in the NSCS. Although the water depth was only 41 m at our study site, distinct oceanographic regimes were present at the surface and bottom due to different physical forcing, including the wind field, coastal currents, tidal oscillations, and upwelling. (Figure 13). Water masses in the surface regime included cold upwelling water and the warm ZRP, with the plume front having mixed water mass in between. The dispersal of the ZRP was controlled by the monsoon wind, wind-driven currents, and tidal flows. The newly produced marine-sourced POM (enriched δ13CPOC) was generally observed in the surface. However, due to different bio-communities in the surface regime, the ZRP contained smaller particles (<153 µm) with higher bulk density and less enriched δ13CPOC. At the plume front, the POM was degraded and having large sizes (>153 µm).
Meanwhile, the bottom regime was affected by the coupling of upwelling-associated circulation and tidal oscillations (e.g., tidal flows), resulting in particle lateral transport and resuspension, respectively. Both mechanisms mainly entrained degraded particles finer than 63 µm. But the lateral transport carried more depleted δ13CPOC because of microbial reworking or degradation. Overall, the POM in BNL was composed of particles<63 µm, degraded, and with depleted δ13CPOC, which might be interpreted as the “terrestrial” source. With multivariable constraints, the source of SPs in the regime can be clearly differentiated. Our work avoided temporal aliasing in the cause-and-effective observations between physical processes and biogeochemical properties of SPs. These findings contributed to the fundamental understanding of the physical forcing aspect of the biogeochemical cycling in river-dominated continental shelf systems like the NSCS.
Data availability statement
The raw data supporting the conclusions of this article will be made available by the authors, without undue reservation.
Author contributions
JL participated in the field work and was in charge of the data processing and manuscript preparation. JTL conceived and designed the study, supervised the work, and co-wrote the manuscript. Y-SL contributed to the POM analyses and provided consultation on the POM interpretation. C-TC and B-SW handled the nutrient analysis. All authors contributed to the article and approved the submitted version.
Funding
This study was funded by the R.O.C. Ministry of Science and Technology (MOST) under the grant numbers MOST 104-2611-M-110-011, MOST 105-2119-M-110-006, and MOST 106-2611-M-110-005.
Acknowledgments
We thank the captain and crew of R/V Ocean Researcher I for their assistance in the fieldwork. The Ocean Data Bank of MOST provided EK60 data. We acknowledge the use of imagery from NASA’s Worldview application (https://worldview.earthdata.nasa.gov), which is part of the Earth Observing System Data and Information System (EOSDIS). We appreciate the help in analyzing , , , and from the staff and students of C-TC’s laboratory in the Department of Oceanography at National Sun Yat-sen University. We appreciate the work for analyses from the members of Taiwan Ocean Research Institute.
Conflict of interest
The authors declare that the research was conducted in the absence of any commercial or financial relationships that could be construed as a potential conflict of interest.
Publisher’s note
All claims expressed in this article are solely those of the authors and do not necessarily represent those of their affiliated organizations, or those of the publisher, the editors and the reviewers. Any product that may be evaluated in this article, or claim that may be made by its manufacturer, is not guaranteed or endorsed by the publisher.
Supplementary material
The Supplementary Material for this article can be found online at: https://www.frontiersin.org/articles/10.3389/fmars.2023.1156915/full#supplementary-material
References
Amiel D., Cochran J. K. (2008). Terrestrial and marine POC fluxes derived from 234Th distributions and δ13C measurements on the Mackenzie shelf. J. Geophys. Res. Ocean 113, C03S06. doi: 10.1029/2007JC004260
Aminot A., Kirkwood D. S., Kérouel R. (1997). Determination of ammonia in seawater by the indophenol-blue method: evaluation of the ICES NUTS I/C 5 questionnaire. Mar. Chem. 56, 59–75. doi: 10.1016/S0304-4203(96)00080-1
Asada T., Warner B., Aravena R. (2005). Effects of the early stage of decomposition on change in carbon and nitrogen isotopes in sphagnum litter. J. Plant Interact. 1, 229–237. doi: 10.1080/17429140601056766
Bai Y., Huang T.-H., He X., Wang S.-L. L., Hsin Y.-C., Wu C.-R., et al. (2015). Intrusion of the pearl river plume into the main channel of the Taiwan strait in summer. J. Sea Res. 95, 1–15. doi: 10.1016/j.seares.2014.10.003
Bauer J. E., Cai W.-J., Raymond P. A., Bianchi T. S., Hopkinson C. S., Regnier P. A. G. (2013). The changing carbon cycle of the coastal ocean. Nature 504, 61–70. doi: 10.1038/nature12857
Berhane I., Sternberg R. W., Kineke G. C., Milligan T. G., Kranck K. (1997). The variability of suspended aggregates on the Amazon continental shelf. Cont. Shelf Res. 17, 267–285. doi: 10.1016/S0278-4343(96)00033-7
Bianchi T. S., Wysocki L. A., Stewart M., Filley T. R., McKee B. A. (2007). Temporal variability in terrestrially-derived sources of particulate organic carbon in the lower Mississippi river and its upper tributaries. Geochim. Cosmochim. Acta 71, 4425–4437. doi: 10.1016/j.gca.2007.07.011
Bordovskiy O. K. (1965). Accumulation of organic matter in bottom sediments. Mar. Geol. 3, 33–82. doi: 10.1016/0025-3227(65)90004-6
Cai W.-J., Dai M., Wang Y., Zhai W., Huang T., Chen S., et al. (2004). The biogeochemistry of inorganic carbon and nutrients in the pearl river estuary and the adjacent northern south China Sea. Cont. Shelf Res. 24, 1301–1319. doi: 10.1016/j.csr.2004.04.005
Cao Z., Wang D., Zhang Z., Zhou K., Liu X., Wang L., et al. (2020). Seasonal dynamics and export of biogenic silica in the upper water column of a large marginal sea, the northern south China Sea. Prog. Oceanogr. 188, 102421. doi: 10.1016/j.pocean.2020.102421
Castillo C. R., Sarmento H., Álvarez-Salgado X. A., Gasol J. M., Marraséa C. (2010). Production of chromophoric dissolved organic matter by marine phytoplankton. Limnol. Oceanogr. 55, 446–454. doi: 10.4319/lo.2010.55.1.0446
Chen C.-T. A. (2002). Shelf-vs. dissolution-generated alkalinity above the chemical lysocline. Deep Sea Res. Part II Top. Stud. Oceanogr. 49, 5365–5375. doi: 10.1016/S0967-0645(02)00196-0
Chen Z., Gong W., Cai H., Chen Y., Zhang H. (2017). Dispersal of the pearl river plume over continental shelf in summer. Estuar. Coast. Shelf Sci. 194, 252–262. doi: 10.1016/j.ecss.2017.06.025
Chen Y., Zhao H. (2021). Spatial distribution of the summer subsurface chlorophyll maximum in the north south China Sea. PloS One 16, e0248715. doi: 10.1371/journal.pone.0248715
Chivas A. R., García A., van der Kaars S., Couapel M. J. J., Holt S., Reeves J. M., et al. (2001). Sea-Level and environmental changes since the last interglacial in the gulf of carpentaria, Australia: an overview. Quat. Int. 83–85, 19–46. doi: 10.1016/S1040-6182(01)00029-5
Cloern J. E., Canuel E. A., Harris D. (2002). Stable carbon and nitrogen isotope composition of aquatic and terrestrial plants of the San Francisco bay estuarine system. Limnol. Oceanogr. 47, 713–729. doi: 10.4319/lo.2002.47.3.0713
Close H. G., Henderson L. C. (2020). Open-ocean minima in δ13C values of particulate organic carbon in the lower euphotic zone. Front. Mar. Sci. 7. doi: 10.3389/fmars.2020.540165
Dagg M., Benner R., Lohrenz S., Lawrence D. (2004). Transformation of dissolved and particulate materials on continental shelves influenced by large rivers: plume processes. Cont. Shelf Res. 24, 833–858. doi: 10.1016/j.csr.2004.02.003
D’Croz L., O’Dea A. (2007). Variability in upwelling along the pacific shelf of Panama and implications for the distribution of nutrients and chlorophyll. Estuar. Coast. Shelf Sci. 73, 325–340. doi: 10.1016/j.ecss.2007.01.013
Dickson M.-L., Wheele P. A. (1995). Nitrate uptake rates in a coastal upwelling regime: a comparison of PN-specific, absolute, and chl a-specific rates. Limnol. Oceanogr. 40, 533–543. doi: 10.4319/lo.1995.40.3.0533
Du S., Ariful Islam G. M., Xiang R., Yang X. (2021). The dust deposition process and biogeochemical impacts in the northern south China Sea. Asia-Pacific J. Atmos. Sci. 57, 77–87. doi: 10.1007/s13143-019-00171-4
Du X., Liu J. T. (2017). Particle dynamics of the surface, intermediate, and benthic nepheloid layers under contrasting conditions of summer monsoon and typhoon winds on the boundary between the Taiwan strait and East China Sea. Prog. Oceanogr. 156, 130–144. doi: 10.1016/j.pocean.2017.06.009
Du X., Liu J. T., Lee J., Huang P. S., Yang R. J., Jue P. Z. (2022). Influence of sediment sources, water mass, and physical processes on the dynamics of flocs at a location between the mouth of a river and the head of a submarine canyon. Mar. Geol. 445, 106736. doi: 10.1016/j.margeo.2022.106736
Fanning K. A., Pilson M. (1973). On the spectrophotometric determination of dissolved silica in natural waters. Anal. Chem. 45, 136–140. doi: 10.1021/ac60323a021
Feng Y., Tang Q., Li J., Sun J., Zhan W. (2021). Internal solitary waves observed on the continental shelf in the northern south China Sea from acoustic backscatter data. Front. Mar. Sci. 8. doi: 10.3389/fmars.2021.734075
Gan J., Allen J. S. (2002). A modeling study of shelf circulation off northern California in the region of the coastal ocean dynamics experiment: response to relaxation of upwelling winds. J. Geophys. Res. Ocean. 107, 6–31. doi: 10.1029/2000JC000768
Gan J., Cheung A., Guo X., Li L. (2009a). Intensified upwelling over a widened shelf in the northeastern south China Sea. J. Geophys. Res. Ocean. 114, 1–15. doi: 10.1029/2007JC004660
Gan J., Li L., Wang D., Guo X. (2009b). Interaction of a river plume with coastal upwelling in the northeastern south China Sea. Cont. Shelf Res. 29, 728–740. doi: 10.1016/j.csr.2008.12.002
Gan J., Lu Z., Dai M., Cheung A. Y. Y., Liu H., Harrison P. (2010). Biological response to intensified upwelling and to a river plume in the northeastern south China Sea: a modeling study. J. Geophys. Res. Ocean. 115, 1–19. doi: 10.1029/2009JC005569
Gao C., Fu M., Song H., Wang L., Wei Q., Sun P., et al. (2018). Phytoplankton pigment pattern in the subsurface chlorophyll maximum in the south Java coastal upwelling system, Indonesia. Acta Oceanol. Sin. 37, 97–106. doi: 10.1007/s13131-018-1342-x
Gao L., Li D., Ishizaka J. (2014). Stable isotope ratios of carbon and nitrogen in suspended organic matter: seasonal and spatial dynamics along the changjiang (Yangtze river) transport pathway. J. Geophys. Res. Biogeosci. 119, 1717–1737. doi: 10.1002/2013JG002487
Gao S., Liu Y., Yang Y., Liu P. J., Zhang Y., Wang Y. P. (2015). Evolution status of the distal mud deposit associated with the pearl river, northern south China Sea continental shelf. J. Asian Earth Sci. 114, 562–573. doi: 10.1016/j.jseaes.2015.07.024
Garvine R. W., Monk J. D. (1974). Frontal structure of a river plume. J. Geophys. Res. 79, 2251–2259. doi: 10.1029/JC079i015p02251
Gibbs R. J. (1973). Mechanisms of trace metal transport in rivers. Science 180 (80), 71–73. doi: 10.1126/science.180.4081.71
Gibbs R. J. (1977). Distribution and transport of suspended particulate material of the Amazon river in the ocean. Ed. WILEY M.B.T.-E.P. (USA: Academic Press), 35–47. doi: 10.1016/B978-0-12-751802-2.50011-4
Gibbs R. J., Konwar L. (1986). Coagulation and settling of Amazon river suspended sediment. Cont. Shelf Res. 6, 127–149. doi: 10.1016/0278-4343(86)90057-9
Gireeshkumar T. R., Deepulal P. M., Chandramohanakumar N. (2013). Distribution and sources of sedimentary organic matter in a tropical estuary, south west coast of India (Cochin estuary): a baseline study. Mar. pollut. Bull. 66, 239–245. doi: 10.1016/j.marpolbul.2012.10.002
Gong F., Li G., Wang Y., Liu Q., Huang F., Yin K., et al. (2020). Spatial shifts in size structure, phylogenetic diversity, community composition and abundance of small eukaryotic plankton in a coastal upwelling area of the northern south China Sea. J. Plankton Res. 42, 650–667. doi: 10.1093/plankt/fbaa046
Goni M. A., Monacci N., Gisewhite R., Ogston A., Crockett J., Nittrouer C. (2006). Distribution and sources of particulate organic matter in the water column and sediments of the fly river delta, gulf of Papua (Papua new Guinea). Estuar. Coast. Shelf Sci. 69, 225–245. doi: 10.1016/j.ecss.2006.04.012
Goñi M. A., Yunker M. B., Macdonald R. W., Eglinton T. I. (2000). Distribution and sources of organic biomarkers in arctic sediments from the Mackenzie river and Beaufort shelf. Mar. Chem. 71, 23–51. doi: 10.1016/S0304-4203(00)00037-2
Gregory J. (1998). The role of floc density in solid-liquid separation. Filtr. Sep. 35, 366–367. doi: 10.1016/S0015-1882(97)87417-4
Guo W., Jia G., Ye F., Xiao H., Zhang Z. (2019). Lipid biomarkers in suspended particulate matter and surface sediments in the pearl river estuary, a subtropical estuary in southern China. Sci. Total Environ. 646, 416–426. doi: 10.1016/j.scitotenv.2018.07.159
Guo W., Ye F., Xu S., Jia G. (2015). Seasonal variation in sources and processing of particulate organic carbon in the pearl river estuary, south China. Estuar. Coast. Shelf Sci. 167, 540–548. doi: 10.1016/j.ecss.2015.11.004
Haines E. B. (1976). Stable carbon isotope ratios in the biota, soils and tidal water of a Georgia salt marsh. Estuar. Coast. Mar. Sci. 4, 609–616. doi: 10.1016/0302-3524(76)90069-4
Harmelin-Vivien M., Dierking J., Bănaru D., Fontaine M. F., Arlhac D. (2010). Seasonal variation in stable c and n isotope ratios of the Rhone river inputs to the Mediterranean Sea, (2004–2005). Biogeochemistry 100, 139–150. doi: 10.1007/s10533-010-9411-z
Harrison P. J., Yin K., Lee J. H. W., Gan J., Liu H. (2008). Physical–biological coupling in the pearl river estuary. Cont. Shelf Res. 28, 1405–1415. doi: 10.1016/j.csr.2007.02.011
Heise B., Bobertz B., Tang C., Harff J., Zhou D. (2013). Surface sediments of the pearl river estuary (South China Sea) – spatial distribution of sedimentological / geochemical properties and environmental interpretation. J. Coast. Res. 66, 34–48. doi: 10.2112/SI_66_4
Ho Q. N., Fettweis M., Spencer K. L., Lee B. J. (2022). Flocculation with heterogeneous composition in water environments: a review. Water Res. 213, 118147. doi: 10.1016/j.watres.2022.118147
Hong H., Zheng Q., Jianyu H. U., Chen Z., Chunyan L. I., Jiang Y., et al. (2009). Three-dimensional structure of a low salinity tongue in the southern Taiwan strait observed in the summer of 2005. Acta Oceanol. Sin. 28, 1–7.
Hoshika A., Tanimoto T., Mishima Y., Iseki K., Okamura K. (2003). Variation of turbidity and particle transport in the bottom layer of the East China Sea. Deep Sea Res. Part II Top. Stud. Oceanogr. 50, 443–455. doi: 10.1016/S0967-0645(02)00462-9
Hsu R. T., Liu J. T. (2010). In-situ Estimations of the density and porosity of flocs of varying sizes in a submarine canyon. Mar. Geol. 276, 105–109. doi: 10.1016/j.margeo.2010.07.003
Hu J., Peng P., Jia G., Mai B., Zhang G. (2006). Distribution and sources of organic carbon, nitrogen and their isotopes in sediments of the subtropical pearl river estuary and adjacent shelf, southern China. Mar. Chem. 98, 274–285. doi: 10.1016/j.marchem.2005.03.008
Huang W. J., Kao K. J., Lin Y. S., Arthur Chen C. T., Liu J. T. (2020). Daily to weekly impacts of mixing and biological activity on carbonate dynamics in a large river-dominated shelf. Estuar. Coast. Shelf Sci. 245, 106914. doi: 10.1016/j.ecss.2020.106914
Huang C., Lao Q., Chen F., Zhang S., Chen C., Bian P., et al. (2021). Distribution and sources of particulate organic matter in the northern south China Sea: implications of human activity. J. Ocean Univ. China 20, 1136–1146. doi: 10.1007/s11802-021-4807-z
Isobe A., Matsuno T. (2008). Long-distance nutrient-transport process in the changjiang river plume on the East China Sea shelf in summer. J. Geophys. Res. Ocean. 113, C04006. doi: 10.1029/2007JC004248
Ivančič I., Degobbis D. (1984). An optimal manual procedure for ammonia analysis in natural waters by the indophenol blue method. Water Res. 18, 1143–1147. doi: 10.1016/0043-1354(84)90230-6
Jarvis P., Jefferson B., Gregory J., Parsons S. A. (2005). A review of floc strength and breakage. Water Res. 39, 3121–3137. doi: 10.1016/j.watres.2005.05.022
Jeandel C. (2016). Overview of the mechanisms that could explain the ‘Boundary exchange’ at the land–ocean contact. Philos. Trans. R. Soc A Math. Phys. Eng. Sci. 374, 20150287. doi: 10.1098/rsta.2015.0287
Jia Y., Tian Z., Shi X., Liu J. P., Chen J., Liu X., et al. (2019). Deep-sea sediment resuspension by internal solitary waves in the northern south China Sea. Sci. Rep. 9, 1–8. doi: 10.1038/s41598-019-47886-y
Jiang Z., Chen J., Zhou F., Shou L., Chen Q., Tao B., et al. (2015). Controlling factors of summer phytoplankton community in the changjiang (Yangtze river) estuary and adjacent East China Sea shelf. Cont. Shelf Res. 101, 71–84. doi: 10.1016/j.csr.2015.04.009
JPL MUR MEaSUREs Project (2015). GHRSST level 4 MUR global foundation Sea surface temperature analysis (v4.1). (CA, USA: PO.DAAC). doi: 10.5067/GHGMR-4FJ04
Kämpf J., Chapman P. (2016). Seasonal wind-driven coastal upwelling systems BT - upwelling systems of the world: a scientific journey to the most productive marine ecosystems. Eds. Kämpf J., Chapman P. (Cham: Springer International Publishing), 315–361. doi: 10.1007/978-3-319-42524-5_8
Ko C.-Y., Hsin Y.-C., Jeng M.-S. (2020). Global distribution and cleanup opportunities for macro ocean litter: a quarter century of accumulation dynamics under windage effects. Environ. Res. Lett. 15, 104063. doi: 10.1088/1748-9326/abae29
Kuehl S. A., DeMaster D. J., Nittrouer C. A. (1986). Nature of sediment accumulation on the Amazon continental shelf. Cont. Shelf Res. 6, 209–225. doi: 10.1016/0278-4343(86)90061-0
Lacan F., Jeandel C. (2005). Neodymium isotopes as a new tool for quantifying exchange fluxes at the continent–ocean interface. Earth Planet. Sci. Lett. 232, 245–257. doi: 10.1016/j.epsl.2005.01.004
Lamb K. G., Warn-Varnas A. (2015). Two-dimensional numerical simulations of shoaling internal solitary waves at the ASIAEX site in the south China Sea. Nonlinear Process. Geophys. 22, 289–312. doi: 10.5194/npg-22-289-2015
Lamb A. L., Wilson G. P., Leng M. J. (2006). A review of coastal palaeoclimate and relative sea-level reconstructions using δ13C and C/N ratios in organic material. Earth-Sci. Rev. 75, 29–57. doi: 10.1016/j.earscirev.2005.10.003
Lee J., Liu J. T., Hung C. C., Lin S., Du X. (2016). River plume induced variability of suspended particle characteristics. Mar. Geol. 380, 219–230. doi: 10.1016/j.margeo.2016.04.014
Lee J., Liu J. T., Lee I.-H. H., Fu K.-H. H., Yang R. J., Gong W., et al. (2021). Encountering shoaling internal waves on the dispersal pathway of the pearl river plume in summer. Sci. Rep. 11, 999. doi: 10.1038/s41598-020-80215-2
Lee J., Yang R. J., Lin H.-L., Chen Y.-C., Cai-Li R.-Y., Ren H., et al. (2022). Sedimentary anthropogenic carbon signals from the Western pacific margin for the last century. Front. Earth Sci. 9. doi: 10.3389/feart.2021.795519
Li Q. P., Ge Z., Liu Z., Zhou W., Shuai Y., Wu Z. (2021). Transparent exopolymer particles in a coastal frontal zone of the northern south China Sea and the associated biogeochemical implications. J. Geophys. Res. Biogeosci. 126, e2020JG005893. doi: 10.1029/2020JG005893
Linders T., Infantes E., Joyce A., Karlsson T., Ploug H., Hassellöv M., et al. (2018). Particle sources and transport in stratified Nordic coastal seas in the anthropocene. Elem. Sci. Anthr. 6, 29. doi: 10.1525/elementa.149
Liu M., Hou L. J., Xu S. Y., Ou D. N., Yang Y., Yu J., et al. (2006). Organic carbon and nitrogen stable isotopes in the intertidal sediments from the Yangtze estuary, China. Mar. pollut. Bull. 52, 1625–1633. doi: 10.1016/j.marpolbul.2006.06.008
Liu J. T., Hsu R. T., Yang R. J., Wang Y. P., Wu H., Du X., et al. (2018). A comprehensive sediment dynamics study of a major mud belt system on the inner shelf along an energetic coast. Sci. Rep. 8, 4229. doi: 10.1038/s41598-018-22696-w
Liu J. T., Huang B., Chang Y., Du X., Liu X., Yang R. J., et al. (2019). Three-dimensional coupling between size-fractionated chlorophyll-a, POC and physical processes in the Taiwan strait in summer. Prog. Oceanogr. 176, 102129. doi: 10.1016/j.pocean.2019.102129
Liu J. T., Hung J.-J., Lin H.-L., Huh C.-A., Lee C.-L., Hsu R. T., et al. (2009). From suspended particles to strata: the fate of terrestrial substances in the gaoping (Kaoping) submarine canyon. J. Mar. Syst. 76, 417–432. doi: 10.1016/j.jmarsys.2008.01.010
Liu K.-K., Kao S.-J., Hu H.-C., Chou W.-C., Hung G.-W., Tseng C.-M. (2007). Carbon isotopic composition of suspended and sinking particulate organic matter in the northern south China Sea–from production to deposition. Deep Sea Res. Part II Top. Stud. Oceanogr. 54, 1504–1527. doi: 10.1016/j.dsr2.2007.05.010
Liu J. T., Lee J., Yang R. J., Du X., Li A., Lin Y.-S., et al. (2021). Coupling between physical processes and biogeochemistry of suspended particles over the inner shelf mud in the East China Sea. Mar. Geol. 442, 106657. doi: 10.1016/j.margeo.2021.106657
Liu J. H., Yang S. L., Zhu Q., Zhang J. (2014). Controls on suspended sediment concentration profiles in the shallow and turbid Yangtze estuary. Cont. Shelf Res. 90, 96–108. doi: 10.1016/j.csr.2014.01.021
Liu Z., Zhao Y., Colin C., Stattegger K., Wiesner M. G., Huh C.-A., et al. (2016). Source-to-sink transport processes of fluvial sediments in the south China Sea. Earth-Sci. Rev. 153, 238–273. doi: 10.1016/j.earscirev.2015.08.005
Lorthiois T., Doxaran D., Chami M. (2012). Daily and seasonal dynamics of suspended particles in the rhône river plume based on remote sensing and field optical measurements. Geo-Marine Lett. 32, 89–101. doi: 10.1007/s00367-012-0274-2
Lu Z., Gan J., Dai M., Cheung A. Y. Y. (2010). The influence of coastal upwelling and a river plume on the subsurface chlorophyll maximum over the shelf of the northeastern south China Sea. J. Mar. Syst. 82, 35–46. doi: 10.1016/j.jmarsys.2010.03.002
Malakoff D. (1998). Death by suffocation in the gulf of Mexico. Science 281, 190–192. doi: 10.1126/science.281.5374.190
McKee B. A., Aller R. C., Allison M. A., Bianchi T. S., Kineke G. C. (2004). Transport and transformation of dissolved and particulate materials on continental margins influenced by major rivers: benthic boundary layer and seabed processes. Cont. Shelf Res. 24, 899–926. doi: 10.1016/j.csr.2004.02.009
Meyers P. A. (1994). Preservation of elemental and isotopic source identification of sedimentary organic matter. Chem. Geol. 114, 289–302. doi: 10.1016/0009-2541(94)90059-0
Middelburg J. J., Nieuwenhuize J. (1998). Carbon and nitrogen stable isotopes in suspended matter and sediments from the schelde estuary. Mar. Chem. 60, 217–225. doi: 10.1016/S0304-4203(97)00104-7
Mittelstaedt E. (1991). The ocean boundary along the northwest African coast: circulation and oceanographic properties at the sea surface. Prog. Oceanogr. 26, 307–355. doi: 10.1016/0079-6611(91)90011-A
Murphy J., Riley J. P. (1962). A modified single solution method for the determination of phosphate in natural waters. Anal. Chim. Acta 27, 31–36. doi: 10.1016/S0003-2670(00)88444-5
Myklestad S. M. (2005). Dissolved organic carbon from phytoplankton. Mar. Chem. 5, 111–148. doi: 10.1007/10683826_5
Neumeier U., Ferrarin C., Amos C. L., Umgiesser G., Li M. Z. (2008). Sedtrans05: an improved sediment-transport model for continental shelves and coastal waters with a new algorithm for cohesive sediments. Comput. Geosci. 34, 1223–1242. doi: 10.1016/j.cageo.2008.02.007
Nittrouer C. A., DeMaster D. J. (1996). The Amazon shelf setting: tropical, energetic, and influenced by a large river. Cont. Shelf Res. 16, 553–573. doi: 10.1016/0278-4343(95)00069-0
O’Hara Murray R. B., Hodgson D. M., Thorne P. D. (2012). Wave groups and sediment resuspension processes over evolving sandy bedforms. Cont. Shelf Res. 46, 16–30. doi: 10.1016/j.csr.2012.02.011
Pai S.-C., Gong G.-C., Liu K.-K. (1993). Determination of dissolved oxygen in seawater by direct spectrophotometry of total iodine. Mar. Chem. 41, 343–351. doi: 10.1016/0304-4203(93)90266-Q
Passow U., de la Rocha C. L., Fairfield C., Schmidt K. (2014). Aggregation as a function of and mineral particles. Limnol. Oceanogr. 59, 532–547. doi: 10.4319/lo.2014.59.2.0532
Passow U., Shipe R. F., Murray A., Pak D. K., Brzezinski M. A., Alldredge A. L. (2001). The origin of transparent exopolymer particles (TEP) and their role in the sedimentation of particulate matter. Cont. Shelf Res. 21, 327–346. doi: 10.1016/S0278-4343(00)00101-1
Pawlowicz R., Beardsley B., Lentz S. (2002). Classical tidal harmonic analysis including error estimates in MATLAB using T_TIDE. Comput. Geosci. 28, 929–937. doi: 10.1016/S0098-3004(02)00013-4
Peterson B., Fry B., Hullar M., Saupe S., Wright R. (1994). The distribution and stable carbon isotopic composition of dissolved organic carbon in estuaries. Estuaries 17, 111–121. doi: 10.2307/1352560
Rabiner R. L., Gold B. (1975). Theory and application of digital signal processing (Englewood Cliffs, NJ: Prentice-Hall).
Ran Y., Zhang Y. (2015). “Sources, early diagenesis, and structure of organic matter in the pearl river delta,” in Labile org. matter–chemical compos. funct. significance soil environ (USA: SSSA Special Publications). doi: 10.2136/sssaspecpub62.2014.0047
Raymond P. A., Bauer J. E. (2001). Use of 14C and 13C natural abundances for evaluating riverine, estuarine, and coastal DOC and POC sources and cycling: a review and synthesis. Org. Geochem. 32, 469–485. doi: 10.1016/S0146-6380(00)00190-X
Rixen T., Gaye B., Emeis K.-C., Ramaswamy V. (2019). The ballast effect of lithogenic matter and its influences on the carbon fluxes in the Indian ocean. Biogeosciences 16, 485–503. doi: 10.5194/bg-16-485-2019
Schidlowski M., Hayes J. M., Kaplan I. R. (1983). Isotopic inferences of ancient biochemis-tries: Carbon, sulfur, hydrogen, and nitrogen. Earth’s Earliest Biosphere: Its Origin and Evolution, ed Schopf J. W. (New York: Princeton Univ Press), pp 149–186
Sherr E. B. (1982). Carbon isotope composition of organic seston and sediments in a Georgia salt marsh estuary. Geochim. Cosmochim. Acta 46, 1227–1232. doi: 10.1016/0016-7037(82)90007-2
Strickland J. D. H., Parsons T. R. (1972). A Practical Handbook of Seawater Analysis. 2nd edition. Ottawa, Canada, Fisheries Research Board of Canada, 310pp. (Bulletin Fisheries Research Board of Canada, Nr. 167 (2nd ed)). doi: 10.25607/OBP-1791.
Su L., Yuan Z., Fung J. C. H., Lau A. K. H. (2015). A comparison of HYSPLIT backward trajectories generated from two GDAS datasets. Sci. Total Environ. 506–507, 527–537. doi: 10.1016/j.scitotenv.2014.11.072
Thorne P. D., Davies A. G., Bell P. S. (2009). Observations and analysis of sediment diffusivity profiles over sandy rippled beds under waves. J. Geophys. Res. Ocean. 114, C02023. doi: 10.1029/2008JC004944
Tian Y., Huang W., Chen Z., Wang S., Zhu X., Yan W. (2022). Characteristics of sound speed in four seafloor sedimentary types in the south China Sea. Arab. J. Geosci. 15, 596. doi: 10.1007/s12517-022-09714-y
Tian Z., Liu Y., Zhang X., Zhang Y., Zhang M. (2022). Formation mechanisms and characteristics of the marine nepheloid layer: a review. Water 14, 678. doi: 10.3390/w14050678
Tolman H. L. (1991). A third-generation model for wind waves on slowly varying, unsteady, and inhomogeneous depths and currents. J. Phys. Oceanogr. 21, 782–797. doi: 10.1175/1520-0485(1991)021<0782:ATGMFW>2.0.CO;2
Turner A., Millward G. E. (2002). Suspended particles: their role in estuarine biogeochemical cycles. Estuar. Coast. Shelf Sci. 55, 857–883. doi: 10.1006/ecss.2002.1033
Van Rijn L. C. (1993). Principle of sediment transport in Rivers,Estuaries and coastal seas (Amsterdam: Aqua Publications).
Wang D., Shu Y., Xue H., Hu J., Chen J., Zhuang W., et al. (2014). Relative contributions of local wind and topography to the coastal upwelling intensity in the northern south China Sea. J. Geophys. Res. Ocean. 119, 2550–2567. doi: 10.1002/2013JC009172
Wang G., Zhou W., Cao W., Yin J., Yang Y., Sun Z., et al. (2011). Variation of particulate organic carbon and its relationship with bio-optical properties during a phytoplankton bloom in the pearl river estuary. Mar. pollut. Bull. 62, 1939–1947. doi: 10.1016/j.marpolbul.2011.07.003
Weber S. C., Carpenter E. J., Coles V. J., Yager P. L., Goes J., Montoya J. P. (2017). Amazon River influence on nitrogen fixation and export production in the western tropical north Atlantic. Limnol. Oceanogr. 62, 618–631. doi: 10.1002/lno.10448
Weeks A. R., Simpson J. H., Bowers D. (1993). The relationship between concentrations of suspended particulate material and tidal processes in the Irish Sea. Cont. Shelf Res. 13, 1325–1334. doi: 10.1016/0278-4343(93)90086-D
Wei B., Mollenhauer G., Hefter J., Grotheer H., Jia G. (2020). Dispersal and aging of terrigenous organic matter in the pearl river estuary and the northern south China Sea shelf. Geochim. Cosmochim. Acta 282, 324–339. doi: 10.1016/j.gca.2020.04.032
Welch P. (1967). The use of fast Fourier transform for the estimation of power spectra: a method based on time averaging over short, modified periodograms. IEEE Trans. Audio Electroacoust. 15, 70–73. doi: 10.1109/TAU.1967.1161901
Wen L.-S., Lee C.-P., Lee W.-H., Chuang A. (2018). An ultra-clean multilayer apparatus for collecting size fractionated marine plankton and suspended particles. J. Vis. Exp 134. doi: 10.3791/56811
Wright L. D., Coleman J. M. (1973). Variations in morphology of major river deltas as functions of ocean wave and river discharge Regimes1. Am. Assoc. Pet. Geol. Bull. 57, 370–398. doi: 10.1306/819A4274-16C5-11D7-8645000102C1865D
Wright L. D., Nittrouer C. A. (1995). Dispersal of river sediments in coastal seas: six contrasting cases. Estuaries 18, 494–508. doi: 10.2307/1352367
Wu C. S., Yang S., Huang S., Mu J. (2016). Delta changes in the pearl river estuary and its response to human activities, (1954–2008). Quat. Int. 392, 147–154. doi: 10.1016/j.quaint.2015.04.009
Wu C. S., Yang S. L., Lei Y. (2012). Quantifying the anthropogenic and climatic impacts on water discharge and sediment load in the pearl river (Zhujiang), china, (1954–2009). J. Hydrol. 452–453, 190–204. doi: 10.1016/j.jhydrol.2012.05.064
Xu Y., Dai M., Zhai W., Yuan D., Liu J., Sun Z., et al. (2009). Short-term dynamics of nutrients influenced by upwelling in a small oligotrophic coastal ecosystem, gan bay, in the northwest Philippines. Prog. Nat. Sci. 19, 595–601. doi: 10.1016/j.pnsc.2008.10.005
Xu J., Yin K., He L., Yuan X., Ho A. Y. T., Harrison P. J. (2008). Phosphorus limitation in the northern south China Sea during late summer: influence of the pearl river. Deep Sea Res. Part I Oceanogr. Res. Pap. 55, 1330–1342. doi: 10.1016/j.dsr.2008.05.007
Yang R. J., Liu J. T., Su C.-C., Chang Y., Xu J. J., Lui H.-K. (2021). Land-ocean interaction affected by the monsoon regime change in Western Taiwan strait. Front. Mar. Sci. 8. doi: 10.3389/fmars.2021.735242
Yin K. D., Qian P. Y., Wu M. C. S., Chen J. C., Huang L., Song X., et al. (2001). Shift from p to n limitation of phytoplankton growth across the pearl river estuarine plume during summer. Mar. Ecol. Prog. Ser. 221, 17–28. doi: 10.3354/meps221017
Yu X., Xu J., Long A., Li R., Shi Z., Li Q. P. (2020). Carbon-to-chlorophyll ratio and carbon content of phytoplankton community at the surface in coastal waters adjacent to the zhujiang river estuary during summer. Acta Oceanol. Sin. 39, 123–131. doi: 10.1007/s13131-020-1556-6
Yu F., Zong Y., Lloyd J. M., Huang G., Leng M. J., Kendrick C., et al. (2010). Bulk organic δ13C and C/N as indicators for sediment sources in the pearl river delta and estuary, southern China. Estuar. Coast. Shelf Sci. 87, 618–630. doi: 10.1016/j.ecss.2010.02.018
Zhang H., Cheng W., Chen Y., Yu L., Gong W. (2018). Controls on the interannual variability of hypoxia in a subtropical embayment and its adjacent waters in the guangdong coastal upwelling system, northern south China Sea. Ocean Dyn. 68, 923–938. doi: 10.1007/s10236-018-1168-2
Zhang J., Li H., Xuan J., Wu Z., Yang Z., Wiesner M. G., et al. (2019). Enhancement of mesopelagic sinking particle fluxes due to upwelling, aerosol deposition, and monsoonal influences in the northwestern south China Sea. J. Geophys. Res. Ocean. 124, 99–112. doi: 10.1029/2018JC014704
Zhang W., Mu S., Zhang Y., Chen K. (2012). Seasonal and interannual variations of flow discharge from pearl river into sea. Water Sci. Eng. 5, 399–409. doi: 10.3882/j.issn.1674-2370.2012.04.004
Zhang W., Zheng J., Xiaomei J., Hoitink A. J. F., van der Vegt M., Zhu Y. (2013). Surficial sediment distribution and the associated net sediment transport pattern retain–>in the pearl river estuary, south China. Cont. Shelf Res. 61–62, 41–51. doi: 10.1016/j.csr.2013.04.011
Zhao L., Gao L. (2019). Dynamics of dissolved and particulate organic matter in the changjiang (Yangtze river) estuary and the adjacent East China Sea shelf. J. Mar. Syst. 198, 103188. doi: 10.1016/j.jmarsys.2019.103188
Zhi H., Wu H., Wu J., Zhang W., Wang Y. (2022). River plume rooted on the Sea-floor: seasonal and spring-neap variability of the pearl river plume front. Front. Mar. Sci. 9. doi: 10.3389/fmars.2022.791948
Zhong Y., Chen Z., Li L., Liu J., Li G., Zheng X., et al. (2017). Bottom water hydrodynamic provinces and transport patterns of the northern south China Sea: evidence from grain size of the terrigenous sediments. Cont. Shelf Res. 140, 11–26. doi: 10.1016/j.csr.2017.01.023
Zu T., Gan J. (2015). A numerical study of coupled estuary–shelf circulation around the pearl river estuary during summer: responses to variable winds, tides and river discharge. Deep Sea Res. Part II Top. Stud. Oceanogr. 117, 53–64. doi: 10.1016/j.dsr2.2013.12.010
Keywords: Zhujiang River (Pearl River) plume, benthic nepheloid layer (BNL), far-field storm wind, tidal modulation, landward transport, PC ratio, particulate organic matter
Citation: Lee J, Liu JT, Lin Y-S, Chen C-TA and Wang B-S (2023) The contrast in suspended particle dynamics at surface and near bottom on the river-dominated northern South China Sea shelf in summer: implication on physics and biogeochemistry coupling. Front. Mar. Sci. 10:1156915. doi: 10.3389/fmars.2023.1156915
Received: 02 February 2023; Accepted: 17 April 2023;
Published: 28 April 2023.
Edited by:
Wei-Bo Chen, National Science and Technology Center for Disaster Reduction (NCDR), TaiwanReviewed by:
Huamao Yuan, Institute of Oceanology, Chinese Academy of Sciences (CAS), ChinaLimin Hu, Ocean University of China, China
Copyright © 2023 Lee, Liu, Lin, Chen and Wang. This is an open-access article distributed under the terms of the Creative Commons Attribution License (CC BY). The use, distribution or reproduction in other forums is permitted, provided the original author(s) and the copyright owner(s) are credited and that the original publication in this journal is cited, in accordance with accepted academic practice. No use, distribution or reproduction is permitted which does not comply with these terms.
*Correspondence: James T. Liu, amFtZXNAbWFpbC5uc3lzdS5lZHUudHc=