 Niels J. de Winter1,2*
 Sterre van Sikkeleras3
 Barbara Goudsmit-Harzevoort3,4Wim Boer5Lennart de Nooijer5Gert-Jan Reichart4,5
 Philippe Claeys2
 Rob Witbaard3
- 1Department of Earth Sciences, Vrije Universiteit Amsterdam, Amsterdam, Netherlands
- 2Analytical, Environmental and Geo-Chemistry Research Group, Vrije Universiteit Brussel, Brussels, Belgium
- 3Department of Estuarine and Coastal Systems, Royal Netherlands Institute for Sea Research, Texel, Netherlands
- 4Department of Earth Sciences, Utrecht University, Utrecht, Netherlands
- 5Department of Ocean Systems, Royal Netherlands Institute for Sea Research, Texel, Netherlands
Introduction: Growth experiments present a powerful tool for determining the effect of environmental parameters on growth and carbonate composition in biogenic calcifiers. For successful proxy calibration and biomineralization studies, it is vital to identify volumes of carbonate precipitated by these organisms at precise intervals during the experiment. Here, we investigate the use of strontium labelling in mollusc growth experiments.
Methods: Three bivalve species (Cerastoderma edule, Mytilus edulis and Ostrea edulis) were grown under monitored field conditions. The bivalves were regularly exposed to seawater with elevated concentrations of dissolved strontium chloride (SrCl2). In addition, the size of their shells was determined at various stages during the experiment using calliper measurements and digital photography. Trace element profiles were measured in cross sections through the shells of these molluscs using laser ablation ICPMS and XRF techniques.
Results: Our results show that doses of dissolved strontium equivalent to 7-8 times the background marine value (~0.6 mmol/L) are sufficient to cause reproducible peaks in shell-incorporated strontium in C. edule and M. edulis shells. No negative effects were observed on shell calcification rates. Lower doses (3-5 times background values) resulted in less clearly identifiable peaks, especially in M. edulis. Strontium spiking labels in shells of O. edulis are more difficult to detect, likely due to their irregular growth.
Discussion: Strontium spiking is a useful technique for creating time marks in cultured shells and a reproducible way to monitor shell size during the growing season while limiting physical disturbance of the animals. However, accurate reconstructions of growth rates at high temporal resolution require frequent spiking with high doses of strontium.
1 Introduction
Crystalline calcium carbonate is one of the most abundant marine biominerals and is produced by organisms ranging from microbes, coccolithophores, foraminifera and molluscs to corals and fishes (Crichton, 2019). Their fossil skeletons, shells and other biostructures are common in the archaeological and geological record because they preserve relatively well and therefore play an important role as archives for past climates (Lough and Barnes, 2000; Pages 2k consortium, 2017; Henkes et al., 2018; Marchegiano et al., 2019; Moss et al., 2021; Agterhuis et al., 2022) and environments (Sampei et al., 2005; Song et al., 2014; Auderset et al., 2022). Carbonate skeletons also preserve information about life histories (Gerringer et al., 2018; Mat et al., 2020; Posenato et al., 2022), ecological relationships between organisms (Fagerstrom, 1987; Mourguiart and Carbonel, 1994; Valchev, 2003), and past human interrelations (Gutiérrez-Zugasti, 2011; Haour et al., 2016; Burchell et al., 2018). Furthermore, the contribution of calcifiers (organisms that mineralize calcium carbonate) to the rock record is of great commercial interest, for example for the extraction of building materials, as source rocks for water and hydrocarbons and as a storage rock for CO2 (Hanshaw and Back, 1979; Izgec et al., 2008; Benavente et al., 2018; Tran et al., 2020).
Many carbonate-based reconstructions rely on analyses of their elemental or isotopic composition, the interpretation of which is anchored by modern growth experiments (Stoll et al., 2002; Sánchez-Román et al., 2008; de Winter et al., 2022a). In such experiments, calcifiers are cultured under controlled or monitored conditions with the aim to precisely study the effect of environmental changes on the composition of the precipitated carbonates. Such experiments require monitoring of the size of carbonate shells or skeletons, either by direct measurements or by a labelling approach. This ensures recognition of the parts that were deposited under specific experimental conditions or at specific times during the experiment, such that these parts can be sampled for chemical analysis. Existing labelling techniques include spiking the growth environment with (radiogenic) nuclides such as 14C (Kuzyakov et al., 2006), 13C (Wilmeth et al., 2018), 44Ca (Nehrke et al., 2013) and 86Sr (Houlbrèque et al., 2009), introducing to the growth environment fluorescent dyes which bind to the calcium carbonate formed during the experiment such as calcein (Markuszewski, 1979; Leips et al., 2001; Zhou et al., 2017; Fox et al., 2018), alizarin red S (Bashey, 2004; Zhou et al., 2017) and others (Day et al., 1995), and spiking the growth environment with elevated concentrations of trace elements (e.g. Mn or Sr; Lartaud et al., 2010; Geerken et al., 2022). The aim of these techniques is to introduce a mark or label that is clear and easy to locate in the carbonate, while avoiding interference with the process of calcification itself. For some of these methods (e.g. calcein dye) it has been demonstrated that they affect the calcification process in some organisms and therefore inadvertently influence the results of biomineralization studies (Magnabosco et al., 2018). Additionally, the differences in practical use, traceability and costs of the above-mentioned labels allow their use to be tailored to the desired experimental outcome.
In this study, we test the use of strontium (Sr) labelling in mollusc growth experiments. Strontium is a useful element for labelling in studies of marine carbonates because it is a highly soluble, conservative element in the ocean (Quinby-Hunt and Turekian, 1983). It is readily incorporated in the calcium carbonate because of its chemical similarity to Ca (Dodd, 1967). Differences in the mineral lattice cause Sr to be more readily taken up in aragonite than in calcite (Day and Henderson, 2013; Wassenburg et al., 2016). Experimental studies show that moderate incorporation of Sr does not significantly inhibit growth or affect the structural properties of calcite and aragonite (Wasylenki et al., 2005; Saito et al., 2020). In addition, the incorporation of Sr into biogenic carbonates is widely studied due to its potential as a proxy for carbonate mineralization rate or temperature (Stoll and Schrag, 2001; Lear et al., 2003; Elliot et al., 2009). It therefore presents a useful alternative to the pre-established Mn labelling technique (Lartaud et al., 2010; Geerken et al., 2022).
The bivalves Cerastoderma edule (common cockle), Mytilus edulis (blue mussel) and Ostrea edulis (European oyster) were selected as subjects in this study for several reasons: Firstly, these species exhibit different shell mineralogies, with the cockle shells consisting of aragonite, oyster shells predominantly of calcite and the mussels have both aragonite (inner) and calcite (outer) shell layers (Feng et al., 2014; Füllenbach et al., 2015; Nikolayev et al., 2019). This allows us to test how administered Sr peaks are taken up in these different shell minerals, which have varying affinity for the element (see above; Day and Henderson, 2013; Wassenburg et al., 2016). Secondly, all three species occur naturally in the area (Wadden Sea and North Sea), limiting risk to the success of growth experiments by ensuring optimal growing conditions as well as to the local ecosystem by not introducing invasive taxa to the Wadden Sea, which is a UNESCO World Heritage site (Beukema et al., 2001; Bennema et al., 2020). Thirdly, the species represent similar taxa from the fossil record which are used for paleoclimate and paleoenvironmental reconstructions, driving the need to better understand shell growth using growth experiments (Obelic et al., 1998; Huyghe et al., 2015; Wichern et al., 2022). Finally, all three species are (historically) commercially important, and growth experiments such as the ones described here may aid in understanding their growth to optimize aquaculture practices (Smaal and Lucas, 2000; Kraan et al., 2011; Colsoul et al., 2021). We thus investigated the potential for spiking the shells of these species with Sr to trace their growth during growth experiments.
2 Methods
2.1 Growth experiments
2.1.1 Description of growth experiments
Three bivalve species (the common cockle Cerastoderma edule, the blue mussel Mytilus edulis and the European oyster Ostrea edulis) were grown under monitored conditions in an outdoor growth setup in the harbour of the Royal Netherlands Institute for Sea Research (NIOZ, Texel, the Netherlands). Juvenile (<1 year old) O. edulis (hereafter: “oysters”) were sampled on March 2nd, 2020, from a brood stock in the Mokbaai (53°00’05.6”N, 4°45’48.5”E). Juvenile M. edulis (hereafter: “mussels”) were collected on February 24th, 2020, from a groin along the North Sea coast of Texel (53°01’17.8”N, 4°42’32.3”E). Juvenile C. edule (hereafter: “cockles”) were collected on March 6th, 2020, from a tidal flat located at the northern tip of the island. (53°09’18.3”N, 4°52’54.0”E). All specimens were individually labelled with Hallprint plastic shellfish tags (Hallprint Fish Tags, Hindmarch Valley, Australia), which were glued on the shell with cyanoacrylate glue. In this way specimens could be followed individually throughout the experiment.
The NIOZ harbour (53°00’19” N, 4°47’46” E) is located at the leeside of the island of Texel with its entrance to the Marsdiep tidal inlet, which connects the Wadden Sea to the North Sea. The harbour experiences the full tidal cycle and closely follows the water properties (temperature, salinity, water contents, etc.) of the Marsdiep (Hippler et al., 2013). At approximately 600-meter distance, these properties are continuously monitored at short (<1 minute) intervals by a neighbouring measurement station operated by the NIOZ (Van Aken, 2003; de Winter et al., 2021). The harbour is shielded from most severe wave action.
Growth experiments took place in a floating setup in which open (meshed), plastic crates (600 x 400 x 400 mm) are attached to glass fibre poles, which are part of a floating mooring (see Figure 1; see also description in Hippler et al., 2013). The crates were covered by a mesh to minimize predation by crabs and birds. The growth experiments took place between February and September 2020 and involved 69 oysters, 77 mussels and 106 cockles. Oysters and mussels were suspended in 100 x 200 mm nets hung on the floating construction inside the crates. The cockles were kept in three shoebox-sized (330 x 180 x 100 mm) plastic containers filled with sand placed on the bottom of the suspended crates. The difference in housing of species allows the animals to exhibit their natural behaviour (e.g. burrowing in sediment) as well as possible within the experiment. In the floating setup, all specimens were continuously submerged roughly 20-30 cm below the water surface during the entirety of the experiment.
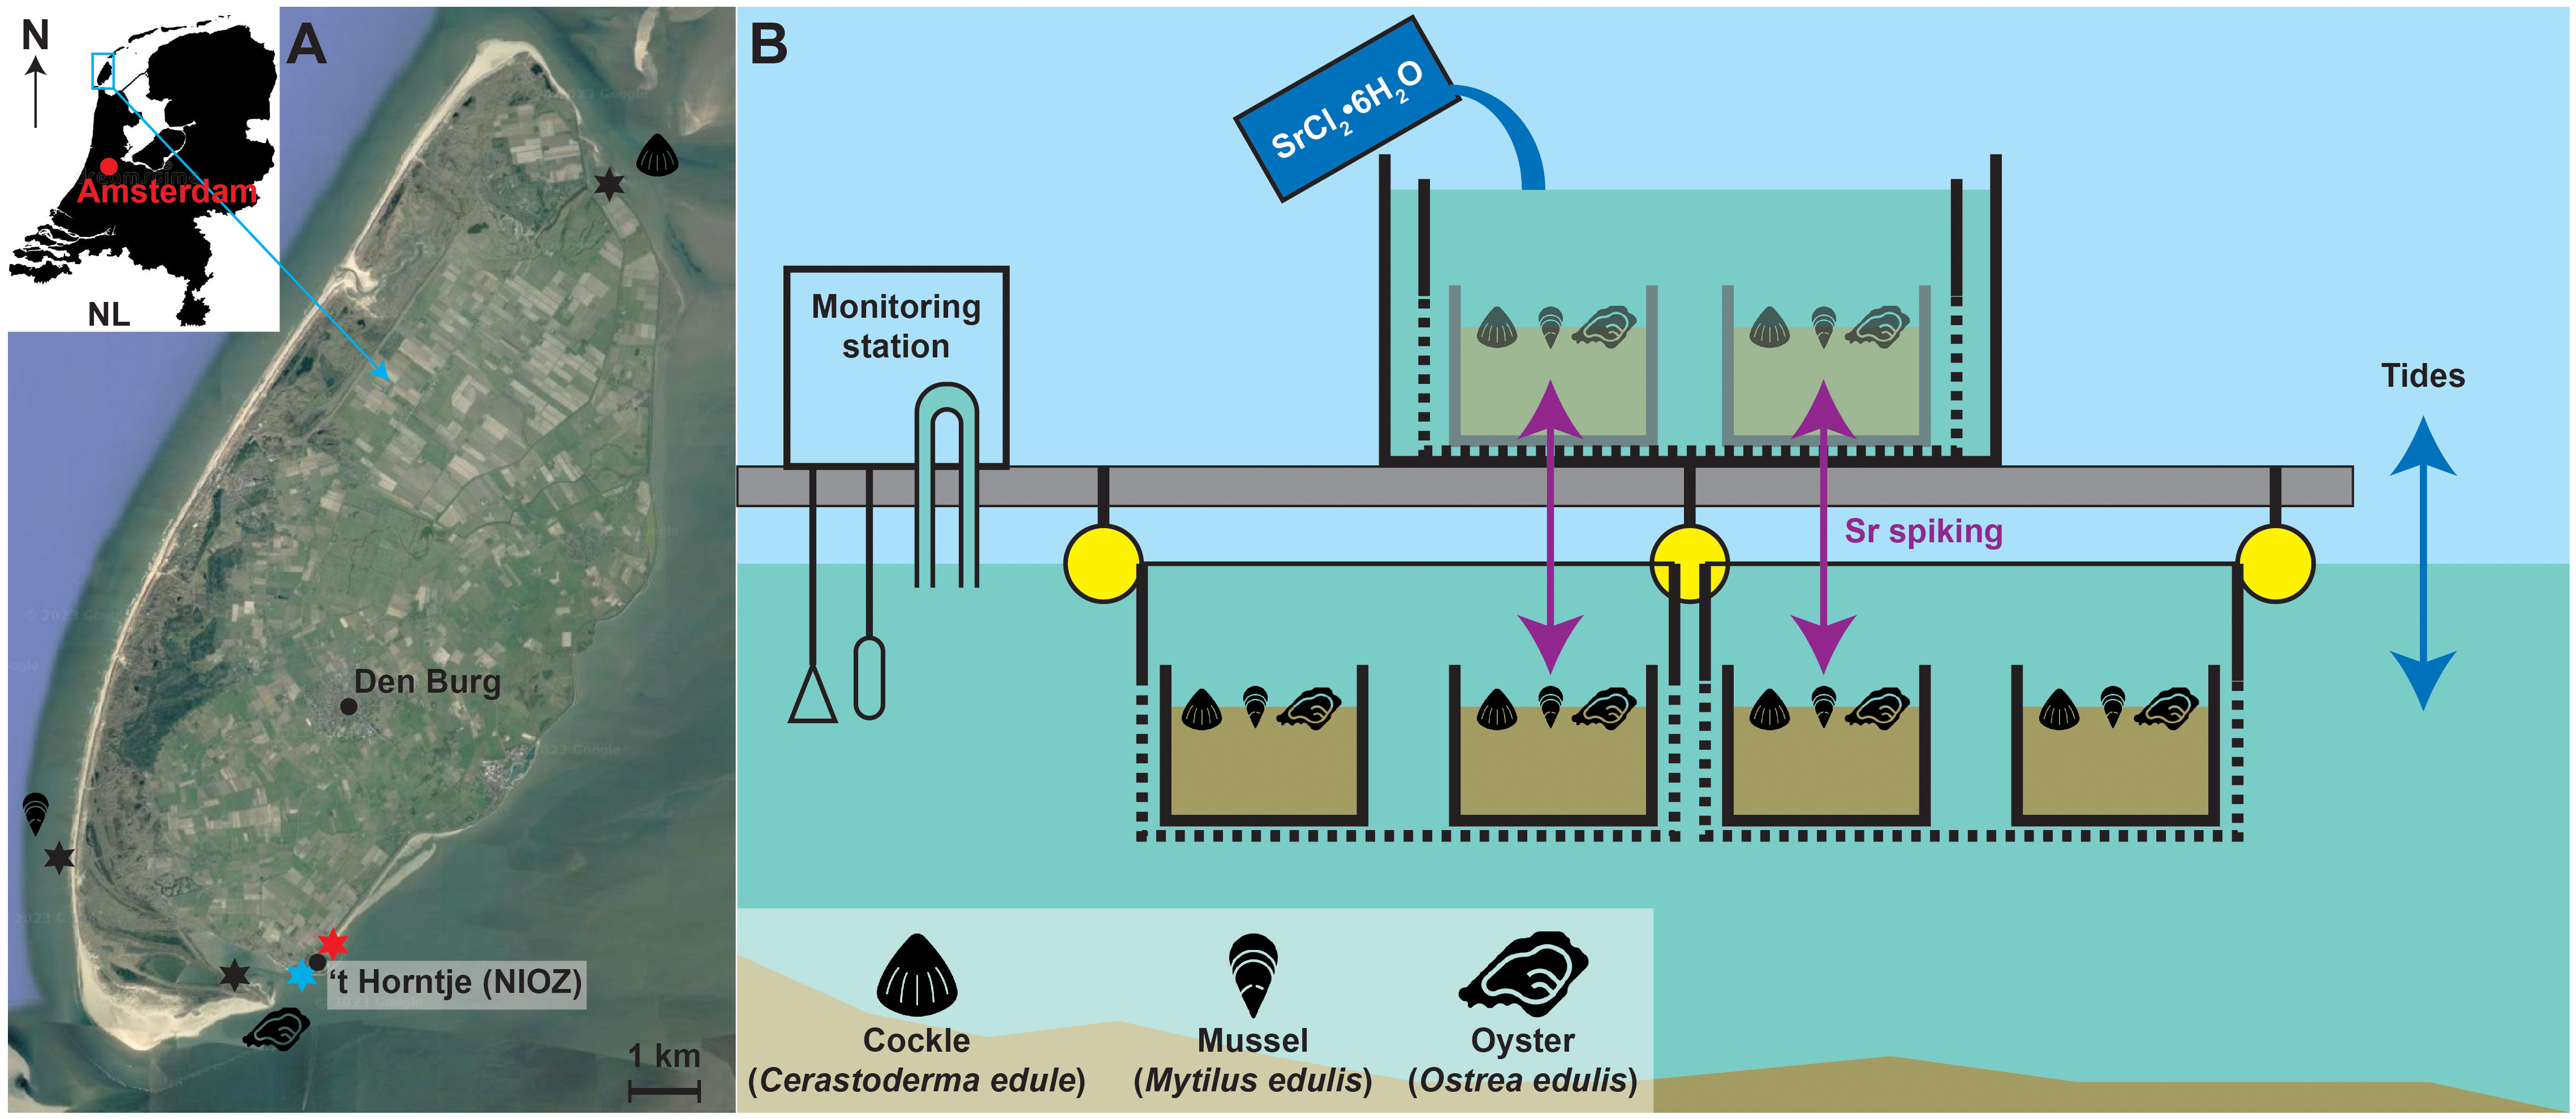
Figure 1 (A) Satellite image of Texel island (52°58’31”N, 4°41’05”E). Modified using Maps Data ©2023 Alphabet Inc., Mountain View, CA, USA. Round symbols indicate the location of named population centers. Stars indicate the origins of juvenile specimens (black; with symbols indicating the species), the location of the culture setup (red) and the location of the monitoring station (blue), ~600 meter away from the culturing locality. (B) Schematic overview of the experimental setup, with the floating jetty in grey, the crates in black and the buoys in yellow. Note that oysters and mussels were grown in nets attached to the side of the crates and not in the sand containers. Water depth is not to scale but was sufficient to keep the crates submerged even during the lowest tides. Purple arrows indicate the transfer of specimens to environments with elevated Sr concentrations during the spiking events.
2.1.2 Shell measurements
Sizes of all individuals were measured four times during the experiments. For cockles, the shell height, length, and width were measured while for mussels only the maximum shell length was measured with a digital calliper which reports precision at the 0.01 mm level (average measurement interval of calliper measurements was 53 days). Considering the irregular shape of oyster shells, especially when growing together, the size of oyster shells was measured by photographing the individuals in a direction perpendicular to the plane of occlusion of the two valves using a Nikon Coolpix (Nikon Corp., Minato, Tokyo, Japan) camera fixed to a stand. The length of the axis of maximum growth (maximum distance of the ventral margin away from the hinge) was determined from these pictures by calibrating distances relative to 10 mm grid paper on which the shells were photographed using ImageJ 1.53 (Schindelin et al., 2012). Measurements were carried out in batches so that within two days all shells were measured while minimizing aerial exposure and associated growth stress.
To estimate the uncertainty on shell size measurements using the digital calliper, repeated measurements of shell size were carried out on selected specimens of each of the three bivalve species. These measurements were carried out by three different persons, each measuring the length of the axis of maximum growth of each shell 10 separate times. This procedure included variability associated with the accuracy of the digital calliper as well as uncertainty associated with the personal choice of the researcher as to where the axis of maximum growth is located on the shell. Results of this test are provided in SI11. The standard deviation on separate shell size measurements using a hand-held digital calliper was 0.18 mm for C. edule shells and 0.21 mm for both M. edulis and O. edulis shells.
2.1.3 Strontium spiking
All individuals were spiked simultaneously with increased concentrations of Sr at multiple time intervals over the period of the experiment (see Table 1). A pre-weighed amount of hydrated strontium chloride (SrCl2·6H2O) was dissolved in a known volume of seawater in the culture setup to obtain elevated Sr concentrations of 0.58 mmol/L, 0.33 mmol/L and 0.21 mmol/L for high, medium, and low dose spikes, respectively. These concentrations amount to an approximately 7.7-fold, 4.4-fold and 2.8-fold increase with respect to the background concentration of dissolved Sr in the environment (0.075 mmol/L when corrected for a mean salinity of 28.5 over the growth period; see de Winter et al., 2021). The concentrations of Sr in the seawater under normal conditions as well as during a high dose Sr spike event were verified using ICP-MS measurements on filtered seawater samples taken during the growth experiments (see section 2.2). All individuals were simultaneously exposed to these doses by placing the nets and containers containing the bivalves in this tank for 24h (Figure 1). The tank was suspended in the floating mooring to facilitate thermal exchange with the ambient sea water and ensure no temperature differences occurred during the Sr spiking period. After 24h, the nets and trays with specimens were taken from the Sr enriched solution and returned to the open crates, returning them to sea water with a normal marine elemental composition. This procedure was repeated every 2-3 weeks with varying Sr concentrations (Table 1).
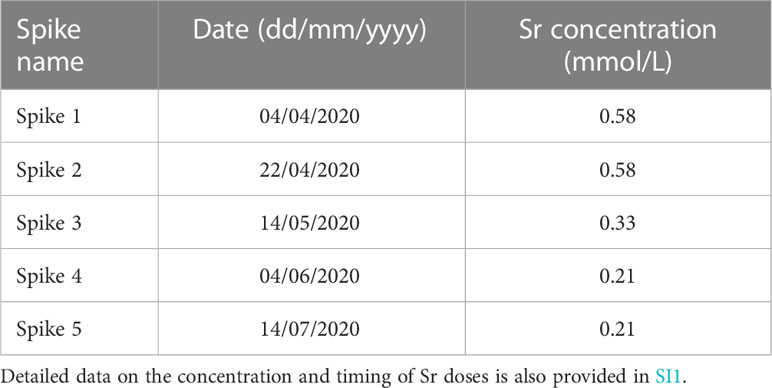
Table 1 Overview of dates and concentrations of Sr spikes administered to the cultured molluscs.
2.1.4 Specimen selection and treatment
Three cockles (specimens G003, G511 and G600) were found dead in the experiment on June 4th and were used to test if the Sr spiking led to enriched concentrations which could be traced back in the shell carbonate. These three individuals were exposed to three Sr spikes: a high dose on April 4th and April 22nd and a medium dose on May 14th. Their shell size was measured at the start of the experiment (March 16th), on May 1st and after they were found dead (June 4th). Of the individuals which survived the entire experimental period, three specimens of each species were selected on September 24th and euthanized for further analyses (see Table 2). Over the experimental period, the size of these 9 specimens was measured 4 times and they were exposed to 5 Sr spikes.
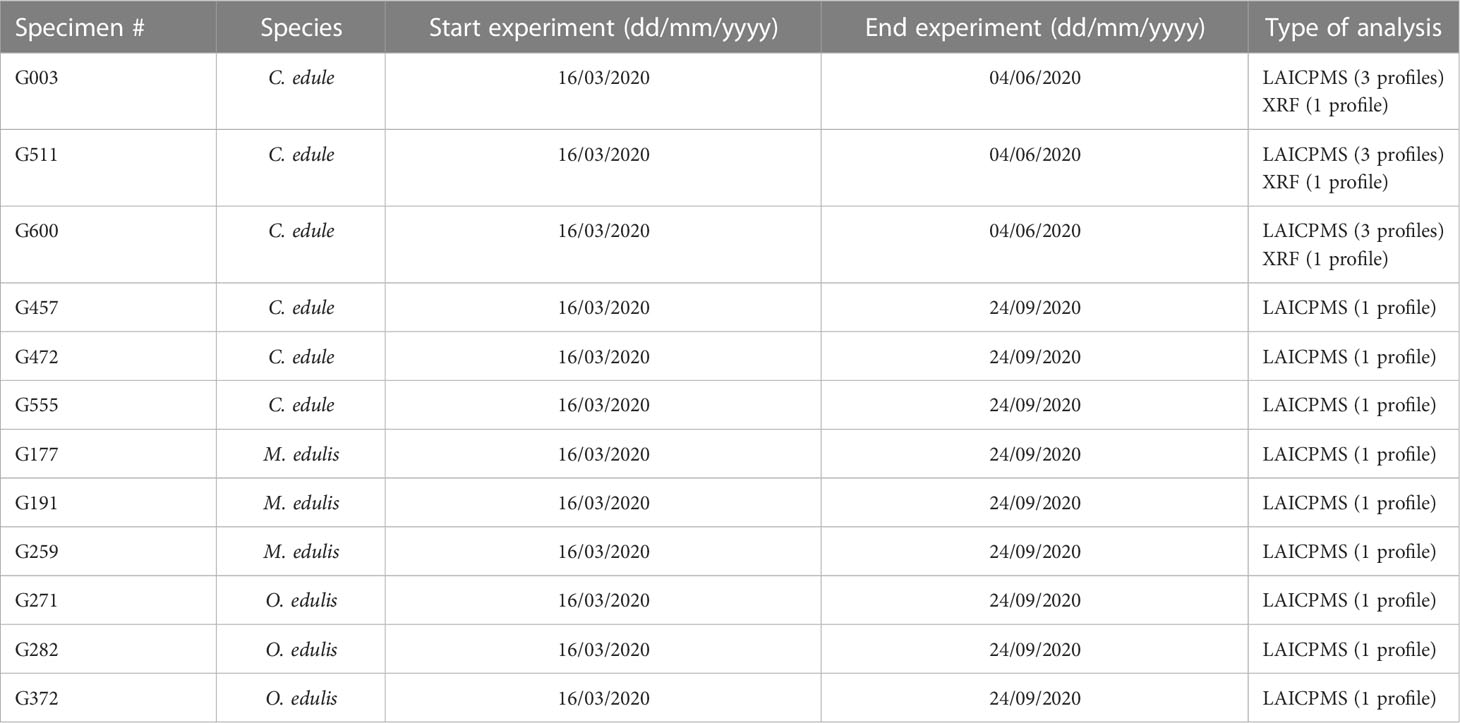
Table 2 Overview of specimens analysed in this study and the types of analyses carried out on their shells.
The soft tissue was removed from all individuals, and the shells were cleaned superficially with a soft brush and left to dry overnight at room temperature. Dried shells were embedded in epoxy resin (THV 500 with THV 155 hardener; Poly-Service BV, Amsterdam, the Netherlands). Shells were sectioned through the axis of maximum growth (the same axis along which shell length was measured with callipers, see section 2.1.2) using a slow rotating (250 rpm) Buehler IsoMet 1000 precision saw (Buehler, Chicago, USA) with a wafering-thin blade. Parallel cuts were subsequently made to produce 7 mm thick sections through the shells, which were polished using a Buehler Metaserv 2000 grinder-polisher machine and finished with a polycrystalline suspension (3μm; following Ballesta-Artero et al., 2018).
2.2 (LA)ICPMS analyses
Laser ablation – inductively coupled plasma mass spectrometry (LAICPMS) was used to analyse Mg/Ca, Mn/Ca, Sr/Ca and Ba/Ca (using the isotopes 25Mg, 43Ca, 55Mn, 88Sr and 138Ba) in all specimens. In addition, Na/Ca (based on 23Na and 43Ca) was analysed in shells of individuals collected at the end of the experiment on September 24th (Table 2). Measurements were carried out using an ESI NWR193UC laser system (Elemental Scientific, Omaha, NE, USA) coupled to an iCap-Q quadrupole ICP-MS (Thermo Fisher Scientific, Waltham, MA, USA) at the NIOZ. Only the shell portion mineralized during the growth experiment (easily recognized due to a difference in shell coloration; see Figure SI2) was analysed. Three parallel ablation lines were placed in the outer shell layer of the three cockle test specimens (G003, G511 and G600; found dead on June 4th) to test the repeatability of the results. Once reproducible results were obtained, single profiles were measured on representatives of all three species which survived the entire experiment. All ablation lines were placed within the outer shell layers of cockles and mussels. For the oyster shells, the lenses of chalky calcite (insofar as present) were avoided, and the ablation transects were placed exclusively on the foliated calcite.
Scan lines were ablated with a 100 * 20 µm rectangular laser spot oriented with the short side to the growth direction, resulting in an effective sampling resolution of 20 µm while ablating a large enough surface area to yield sufficient material for ICP-MS analyses (de Winter et al., 2022b). All lines were pre-ablated at high speed (40 µm/s) to remove surface contamination before being ablated a second time at 4 µm/s for final data collection.
Data were calibrated in Matlab using a modified version of the SILLS software (Signal Integration for Laboratory Laser Systems; Guillong et al., 2008), following the same protocol as de Winter et al. (2022b). Intensity ratios were calculated with 43Ca as an internal standard and calibrated against NIST610 (National Institute of Standards and Technologies; Gaithersburg, MD, USA) using preferred values from the GeoReM database (Jochum et al., 2005; Jochum et al., 2011). Drift corrections were applied by measuring NHFS-2-NP (Boer et al., 2022) four times after every fourth sample and standard. The reference materials BAS752 (Bureau of Analyzed Samples, Middlesbrough, UK), RS3, coral Porites JCp-1 and giant clam Tridacna gigas JCt-1 produced by the Japanese Geological Survey (Okai et al., 2002; Inoue et al., 2004), and NHFS-2-NP, were used for quality control. RS3, JCp-1, JCt-1 and NFHS-2 were nano-particulate powder pressed pellets (Garbe-Schönberg and Müller, 2014; Jochum et al., 2019). Details on the accuracy of the LAICPMS trace element results relative to preferred values is provided in SI12. Calibrated and drift corrected elemental to calcium ratio from LAICPMS measurements is provided in the supplementary information (SI3).
The Sr concentration (measured as 88Sr abundance) of filtered seawater samples taken from the culturing setup both under natural conditions and during a high dose Sr spike were analysed on the same iCap-Q quadrupole ICP-MS (Thermo Fisher Scientific, Waltham, MA, USA) at the NIOZ. The resulting seawater Sr concentrations are provided in SI3.
2.3 Micro-X-ray fluorescence analyses
As a pilot study, micro-X-ray fluorescence (µXRF) was used to analyse trace element profiles through the outer shell layers of cockle specimens G003, G511 and G600 (found dead halfway during the experiment; see Table 2). These analyses were carried out on a Bruker M4 Tornado micro-X-ray fluorescence scanner in point-by-point line scanning mode (following Vansteenberge et al., 2020), following recommendations in de Winter et al. (2017a) and standardization in Vellekoop et al. (2022). A detailed description of the μXRF setup is provided in de Winter and Claeys (2016) and details on the methodology are provided in SI4. Both the raw and calibrated XRF data for all points along the profiles are provided in the supplementary information (SI3).
2.4 Data processing
To test the utility of the Sr spiking routine to identify certain sections of shells mineralized at known time intervals, peaks in the LAICPMS and XRF Sr profiles through the shells were linked to spiked Sr doses during the experiment. The borders of Sr peaks in the profiles were visually identified as the first and last sample for which Sr concentration exceeded that of the surrounding shell material (the “background” value; see Figure 2B). The background values for Sr and other trace elements with respect to a peak were defined as the average of the 25 points before the first datapoint in the peak and the 25 points after the last datapoint in the peak in direction of measurement. Peak “height” of Sr (“[Srpeak]” and similarly for other elements) was defined as the average of the highest 10 datapoints within the peak, and average peak concentration (“[Srmean]”, and equivalent for other elements) was defined as the average of all datapoints within the peak (Figure 2B). The average position along the profile of the 10 datapoints with the highest Sr concentrations was used to define the position of the peak. Shell size at the time of deposition was calculated from the X and Y coordinates of the scan lines digitized on scans of cross sections through the shells after LAICPMS analyses. For each specimen, a reference point was defined at the umbo in cross section through the shell and the Euclidian distance between this point and the position on the scan line where the highest Sr value in the peak was measured was calculated as a proxy for shell size (Hspike) using Pythagorean Theorem (see Figure 2B):
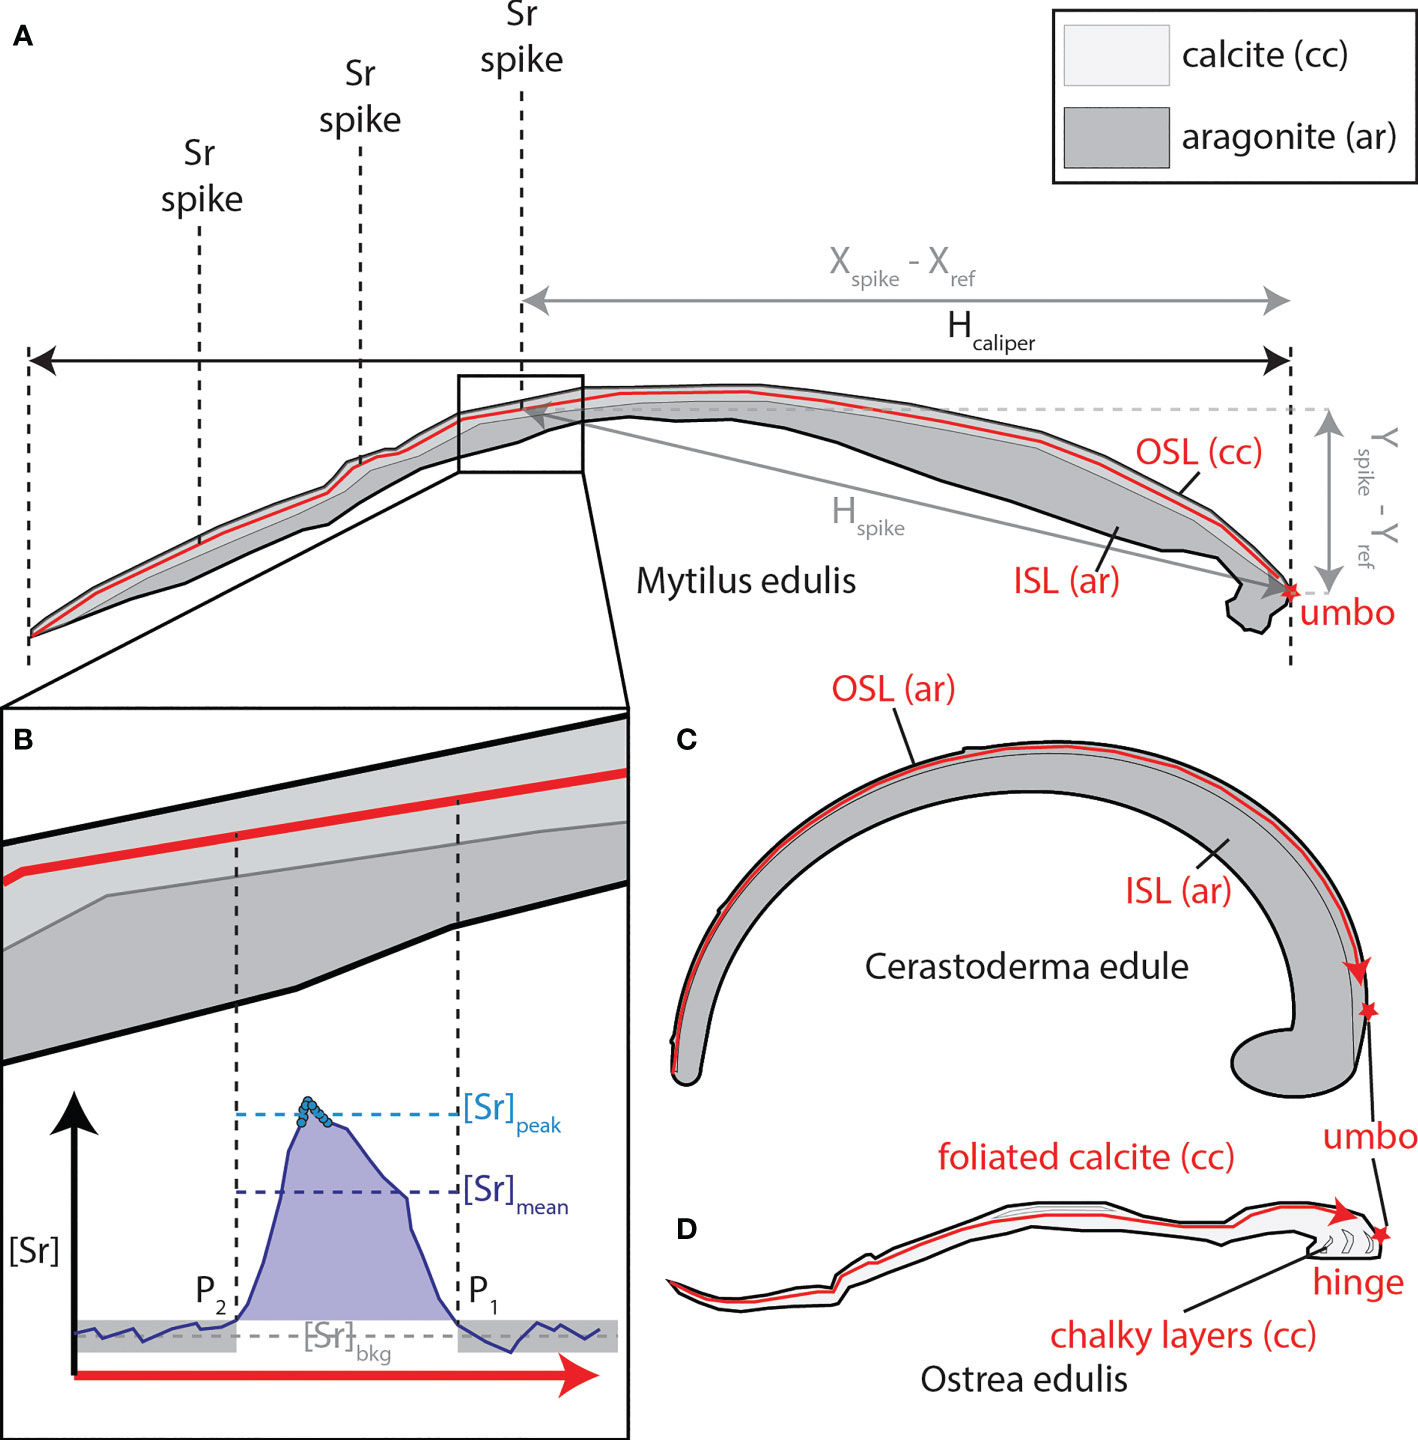
Figure 2 (A) Schematic representation of a cross section through a mussel shell and a LAICPMS profile measured through the calcitic outer shell layer (OSL) of this specimen (in red). Dashed lines show the locations of Sr peaks in the shell measured in the transect. Black and grey arrows indicate how shell size could be determined from the location of the Sr peaks (“Hspike”, in grey, calculated from Xspike – Xref and Yspike - Yref) and using calliper measurements of the entire shell (“Hcalliper”, in black). The red star indicates the reference position at the umbo used to determine shell size based on the position of Sr spikes. (B) Insert showing a typical Sr peak, with vertical dashed lines showing beginning (P1) and end (P2) of the peak in growth direction (note that LAICPMS scan direction is from left to right). [Sr]bkg = Background Sr concentration, [Sr]peak = peak Sr concentration (peak “height”), [Sr]mean = mean Sr concentration in the peak. (C) Schematic cross section through a cockle shell, showing aragonitic outer shell layer (OSL) and inner shell layer (ISL). Red arrowed line shows the path of a typical LAICPMS transect through this species. (D) Schematic cross section through oyster shell showing foliated and chalky calcite layers and the location of the hinge. Red arrowed line shows the path of a typical LAICPMS transect through this species, avoiding the chalky segments. cc, calcite, ar, aragonite.
To compare shell sizes determined from the position of Sr spikes with shell lengths measured during the experiment, shell lengths from calliper or photography measurements (section 2.1.2) were estimated at the times of administration of the Sr spike by linear interpolation between shell lengths measured before and after the Sr spike. Growth rates, defined as the increase in shell size per unit time, were calculated from the differences between successive shell size measurements and successive Sr spikes and averaged per month and per species to facilitate comparison between growth rates as determined using both methods. Note that this procedure for growth rate determination required extrapolation of growth rates before the first and after the last measurement or Sr spike for months where shell length was measured but individuals were not spiked.
3 Results
3.1 Strontium concentrations in seawater
Trace element measurements in seawater using ICP-MS (see section 2.2) reveal that the Sr concentration in ambient seawater at the culturing location was 86 ± 5 μmol/L (1σ). During a high dose Sr spike, the concentrations increased to 591 ± 36 μmol/L (1σ). These results confirm that the amount of strontium chloride added during a high dose spike indeed raises the Sr concentration by roughly 7 times, and the measured values are in close agreement with the target values for Sr concentration in the growth environment during Sr spiking. Raw ICP-MS results of these water samples are provided in S3.
3.2 Strontium peaks in LAICPMS records
Plots of Sr/Ca ratios measured by LAICPMS (Figure 3) show that most Sr doses are recognizable in the shells of cockles, mussels, and oysters. However, there are clear differences between species. Overall, cockles show the clearest effect of the Sr spiking (Figures 3A, B), especially for the spikes with high doses, which are represented by peaks exceeding 10 mmol/mol Sr/Ca ratios in the aragonite of cockles: A 5-fold increase with respect to background ratios of ~2 mmol/mol. Medium and low dose spikes also result in concentrations exceeding 3-4 mmol/mol, well above the background variability and easily detectable. Parallel scans on specimens G003, G511 and G600 (Figure 3A) demonstrate that Sr peaks are highly reproducible within and between specimens. While the difference between high Sr doses on the one hand and medium or low doses on the other hand is clearly distinguished in the cockle records, the small difference in Sr concentration between peaks associated with medium and low doses makes it hard to distinguish between these doses from the Sr/Ca records alone (Figure 3B).
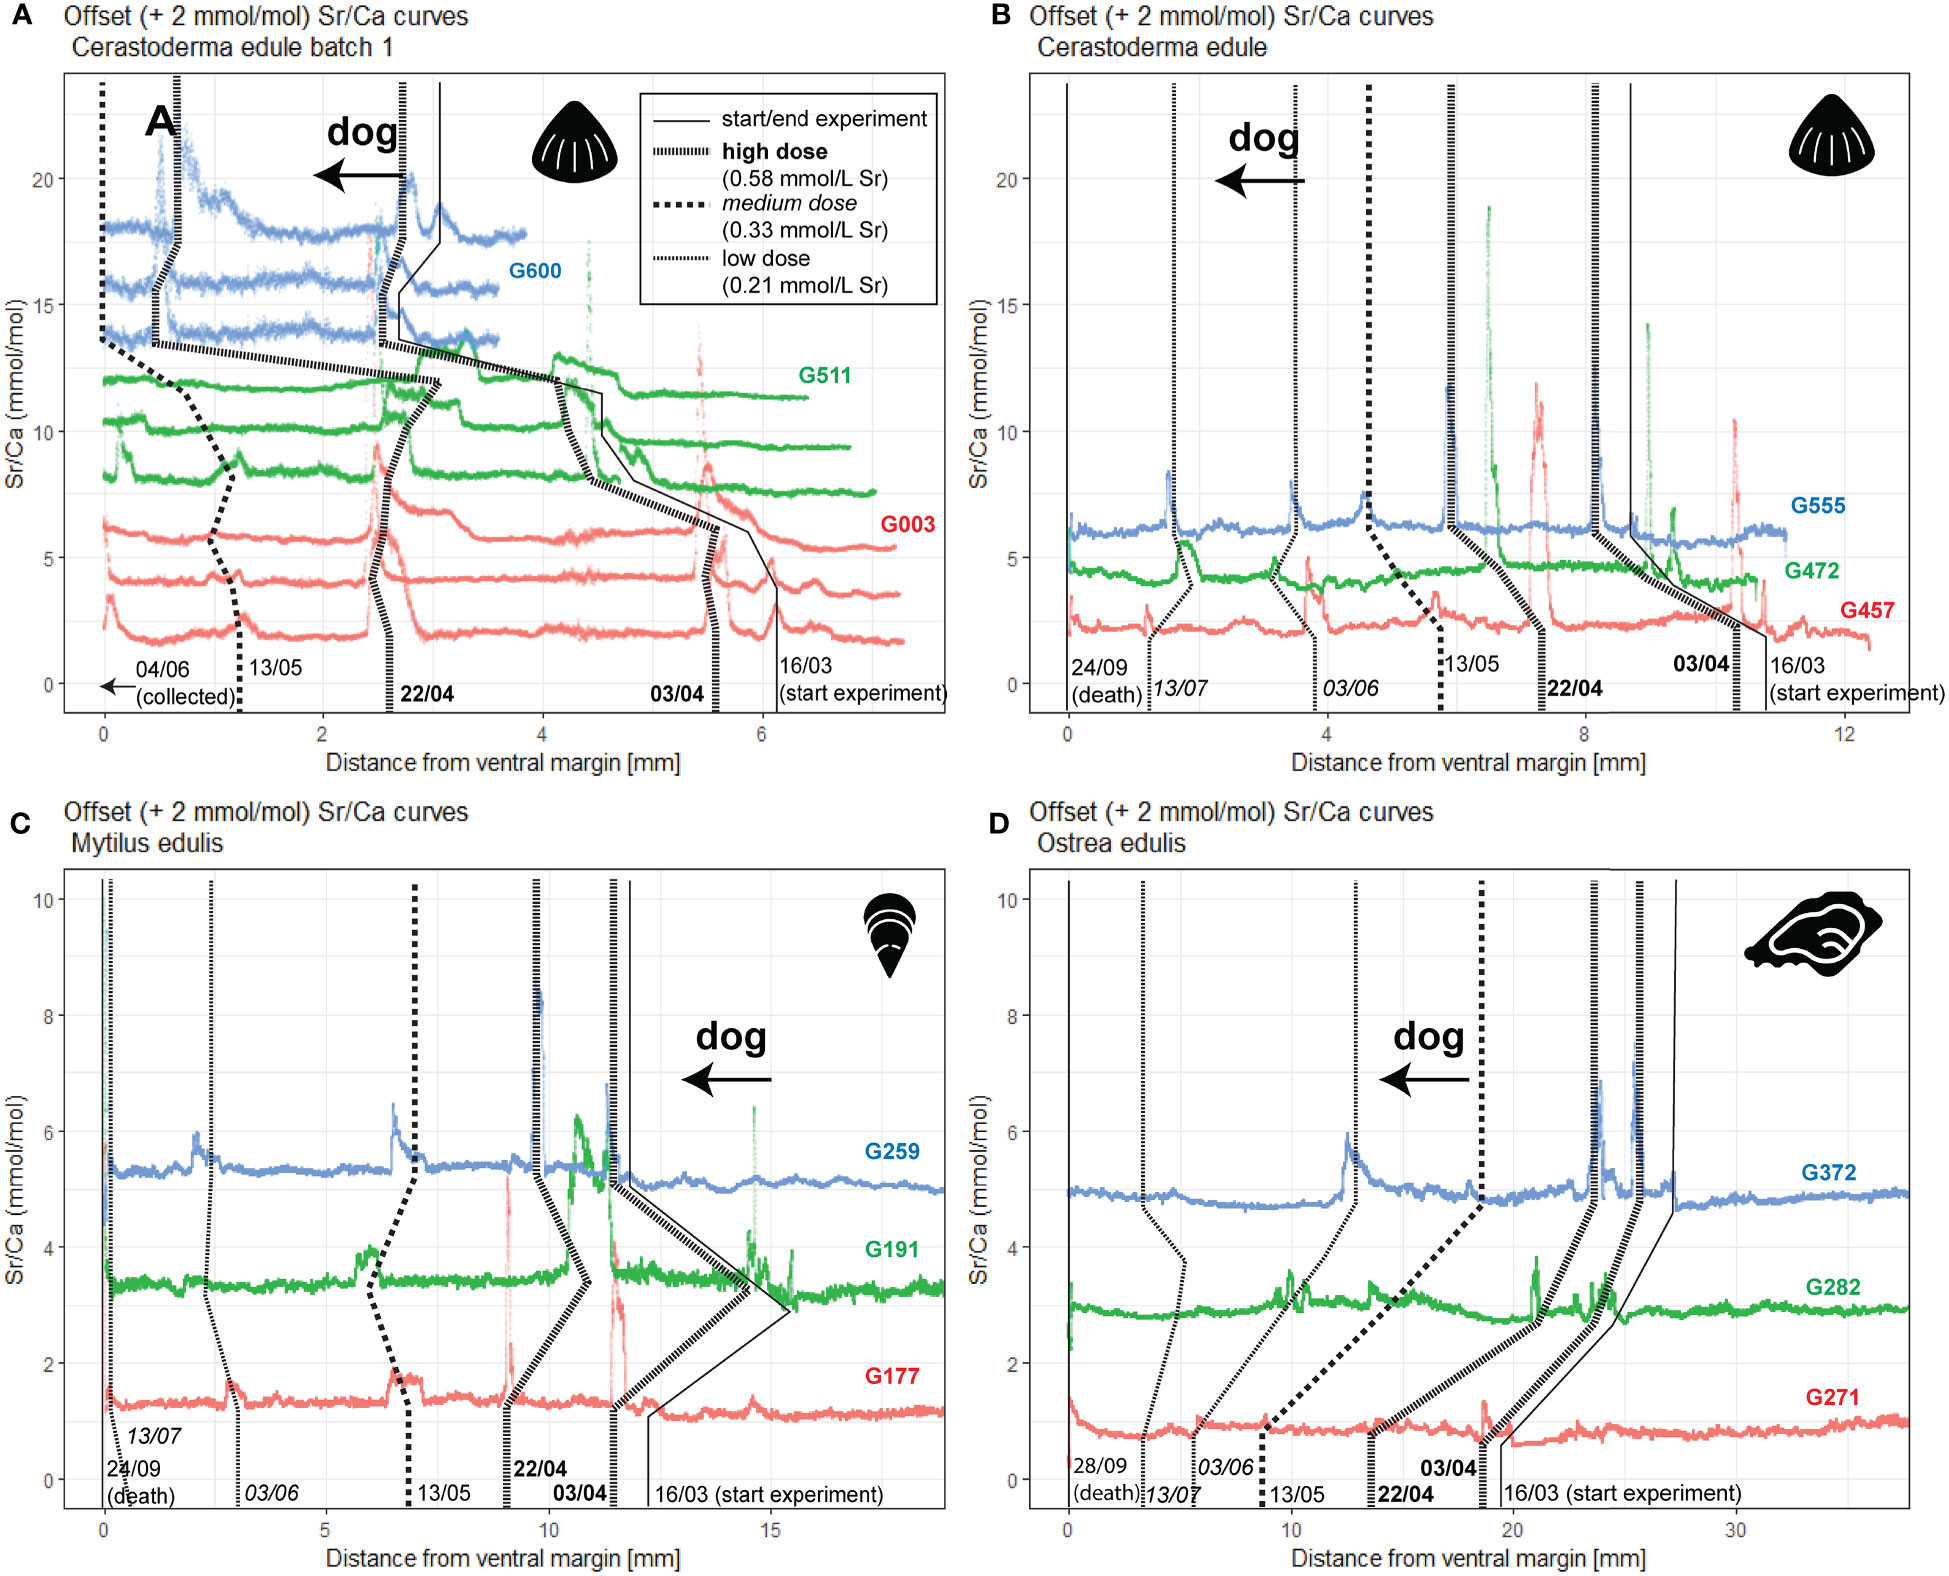
Figure 3 LA-ICP-MS Sr/Ca records through all aragonitic cockles (A, B), calcitic outer shell layers of mussels (C) and foliated calcite in oysters (D) considered in this work. Records from subsequent specimens are indicated in different colors and offset by 2 mmol/mol from each other to promote visibility, with the lowest record showing true Sr/Ca values in agreement with axis labels. Parallel profiles within the same specimen (A) are also offset by 2 mmol/mol, with profiles closer to the outside of the shell plotted below profiles farther towards the inside of the outer shell layer. Lines connecting records vertically mark the beginning and end of the experimental period as recorded in the shells and the location of Sr peaks, with numbers at the bottom listing the dates (dd/mm) of the events. Doses of Sr peaks are indicated with different lengths of line dashes (see legend in (A): high dose; 7.7-fold increase in [Sr]w; administered at 03/04 and 22/04; medium dose; 4.4-fold increase in [Sr]w; administered at 13/05; and low dose; 2.8-fold increase in [Sr]w; administered at 03/06 and 13/07). Distance on horizontal axes is measured in scan direction (growth direction from right to left). “dog” = direction of growth.
Records through the calcitic outer shell layer of the mussels (Figure 3C) and the foliated calcite of the oysters (Figure 3D) yield lower Sr/Ca ratios than those in the cockles (see also SI5). Sr peaks associated with high dose spikes (Sr/Ca of 3-5 mmol/mol in M. edulis and Sr/Ca 2-3 mmol/mol in oysters) generally exceed background Sr/Ca ratios of ~1 mmol/mol. In mussels these spikes can be recognized with confidence, but in oysters even some of the high dose spikes fail to yield clearly recognizable peaks in Sr/Ca records. Medium doses are still clearly recognized in mussels, but low dose spikes do not always produce useful peaks in Sr/Ca in this species. Interestingly, the peak height in mussels more closely reflects the size of the spiking dose than in cockles, with medium Sr doses yielding peaks that are recognizably higher than those associated with low doses and lower than those associated with high doses (Figure 3C). In oysters, the response to medium- and low-spike doses is much less predictable. Some low doses appear to produce surprisingly high Sr/Ca peaks (see e.g. the June 3 dose in specimen G372; Figure 3D), while other low doses and even medium or high dose spikes fail to produce recognizable peaks at all.
3.3 Strontium peaks in XRF profiles
X-ray fluorescence Sr/Ca profiles through the same cockle specimens G003, G511 and G600 (Figure 4) show that the high- and medium-dose peaks recorded in these shells are also detectable using μXRF (Figure 4). Background Sr/Ca values (~2 mmol/mol) are similar in μXRF profiles compared to the LAICPMS profiles through the same specimens (Figure 3A), showing that both methods independently reproduce the same Sr/Ca values. High dose spikes are clearly recorded as peaks in Sr/Ca in the μXRF records with values generally exceeding 6 mmol/mol, similar to the values obtained through LAICPMS. The medium dose spike administered on 13/05 is more elusive, partly because the initial part of the G003 record is missing due to technical issues with the measurements. In G511, the medium dose yields a clear spike in Sr/Ca towards maximum values of ~5 mmol/mol, but in G600 the peak barely rises above the background variability. Outside the spike-associated peaks, the Sr/Ca background in μXRF profiles is more variable than in the LA-ICP-MS transects.
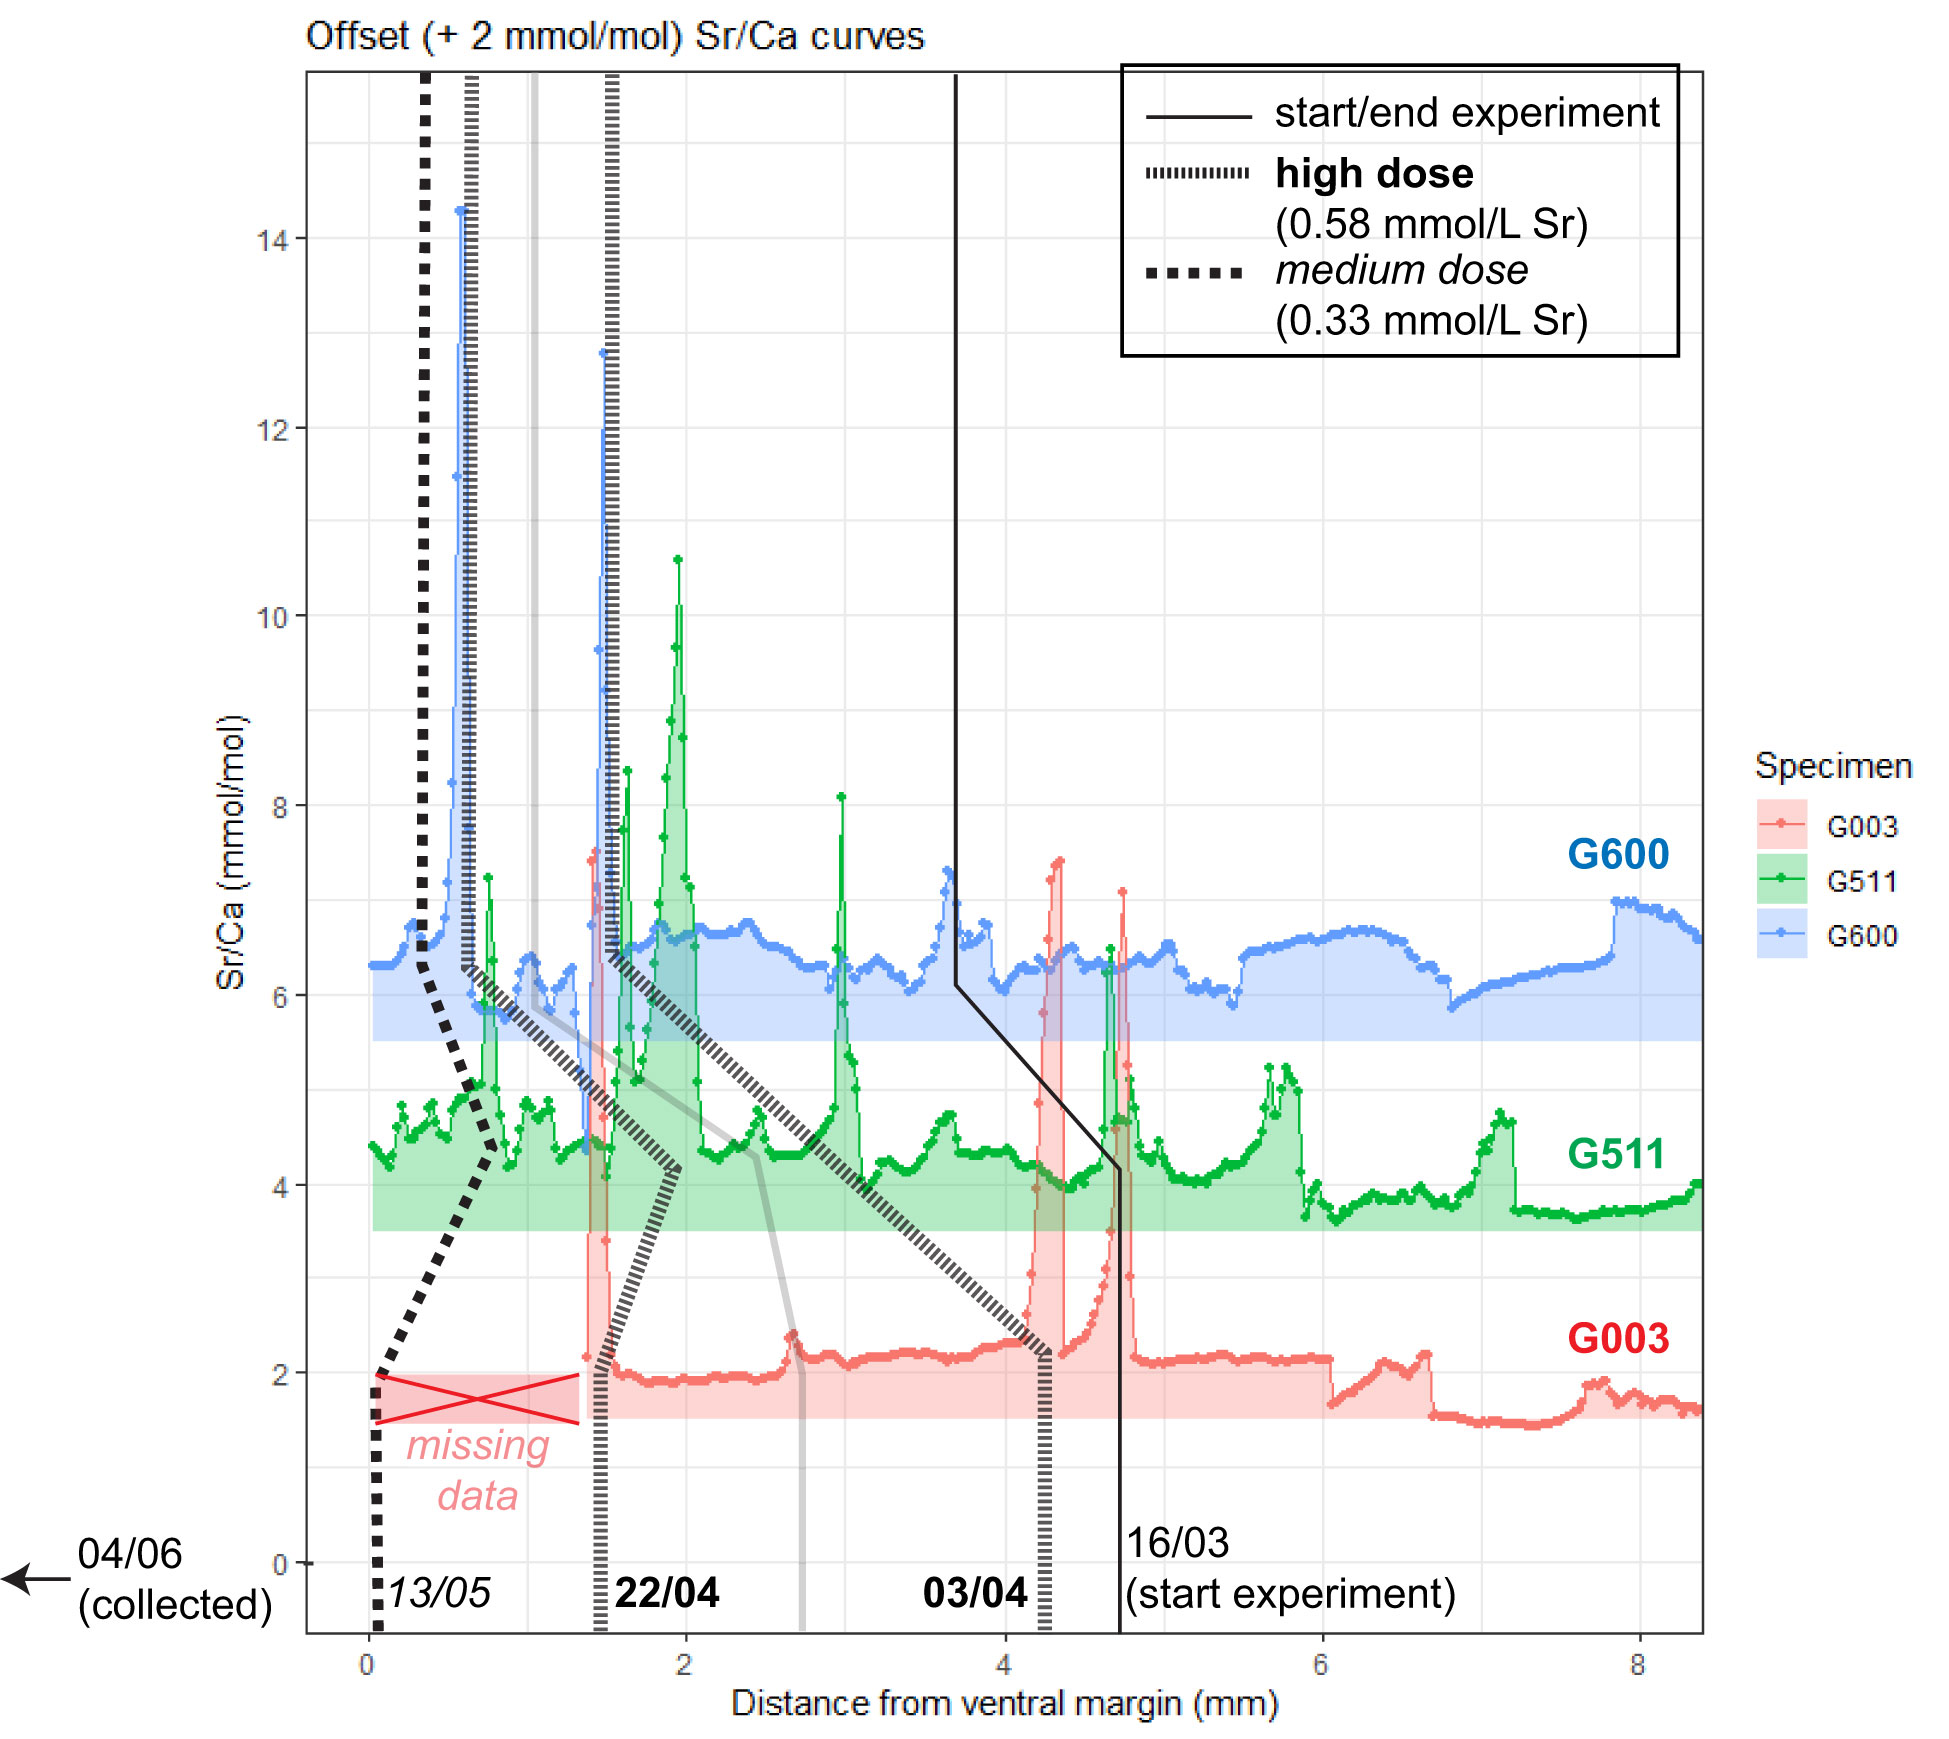
Figure 4 μXRF Sr/Ca records through aragonitic cockle specimens G003, G511 and G600. Records from subsequent specimens are offset by 2 mmol/mol from each other, with the lowest record showing original Sr/Ca values. Lines connecting records vertically mark the beginning of the experimental period as recorded in the shells and the location of Sr peaks, with numbers at the bottom listing the dates (dd/mm) of the events. Doses of Sr peaks are indicated with different lengths of line dashes (see legend in top right corner: high dose; 7.7-fold increase in [Sr]w; administered at 03/04 and 22/04; medium dose; 4.4-fold increase in [Sr]w; administered at 13/05). Distance on horizontal axis is measured in scan direction (growth direction from right to left). Note that due to issues with the cross-section surface, data from the first part of the record through specimen G003 was lost.
3.4 Shape of strontium peaks
LAICPMS data (Figure 3) reveal that the Sr peaks in all specimens exhibit a distinct shape when considered in growth direction: Sr/Ca ratios rise gradually at the onset of the peak (the point farthest away from the ventral margin to the right in Figures 3, 4), before falling sharply, resulting in a wide tail towards older parts of the shell. This asymmetry is clearest when considering the average position of the highest Sr values within the peak relative to the position within the peak, with 0 indicating the onset of the peak and 1 the end (Table 3). Mean symmetry indices, calculated as the distance between Sr/Ca peak value and the onset of the peak divided by the full width of the peak (onset to end), for all species exceed 0.5, confirming the observation that Sr peaks start gradually and end sharply. The asymmetry is largest in mussels and smallest in cockles. The average width of peaks typically increases from cockles (350 ± 190 μm; 1σ) to mussels (580 ± 300 μm; 1σ) to oysters (850 ± 390 μm; 1σ), but variability between peak heights in the same species are generally larger than variability between species (Table 3; SI6). Interestingly, some Sr/Ca peaks in the XRF profiles (Figure 4) seem to show an opposite pattern, with Sr/Ca ratios rising sharply at the onset of some Sr peaks before falling slowly in growth direction (most notably the high-dose peaks administered at 16/03 and 03/04 in specimen G003).
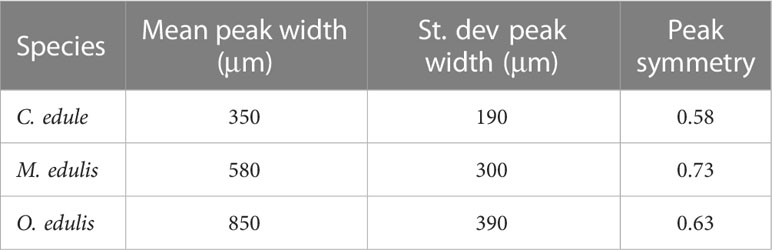
Table 3 Differences in width and shape of peaks between species. St. dev, standard deviation.
3.5 Behaviour of other trace elements during Sr spikes
Figure 5 highlights the differences between peak and background values for all measured trace elements for all specimens, showing how Sr spikes result in elevated concentrations of other elements (most notably Na and Ba). The occurrence of peaks in Sr/Ca (Figures 3, 4) coincides with peaks in other trace elements in about 70% of the Sr spikes (see Table 4 and SI7-9). This is especially visible in Na and Ba, and prevalent in oysters, where Mn and Mg also often exhibit highly elevated values compared to the background (see Table 4; Figure 5). Cockle records, showing clear Sr peaks (see sections 3.2 and 3.3) show the least covariance of other elements at Sr spiking moments. In general, concentrations of Sr and Ba are comparatively high in cockles, while mussel and oyster shells have higher relative concentrations of Na, Mg and Mn. Peak or mean values of other trace elements below the background during Sr peaks are rare (Figure 5). A summary of trace element concentrations measured in all shells during Sr spiking is provided in SI7. LAICPMS profiles showing details of the variability in other trace elements (Na, Mg, Mn and Ba) are provided in SI8.
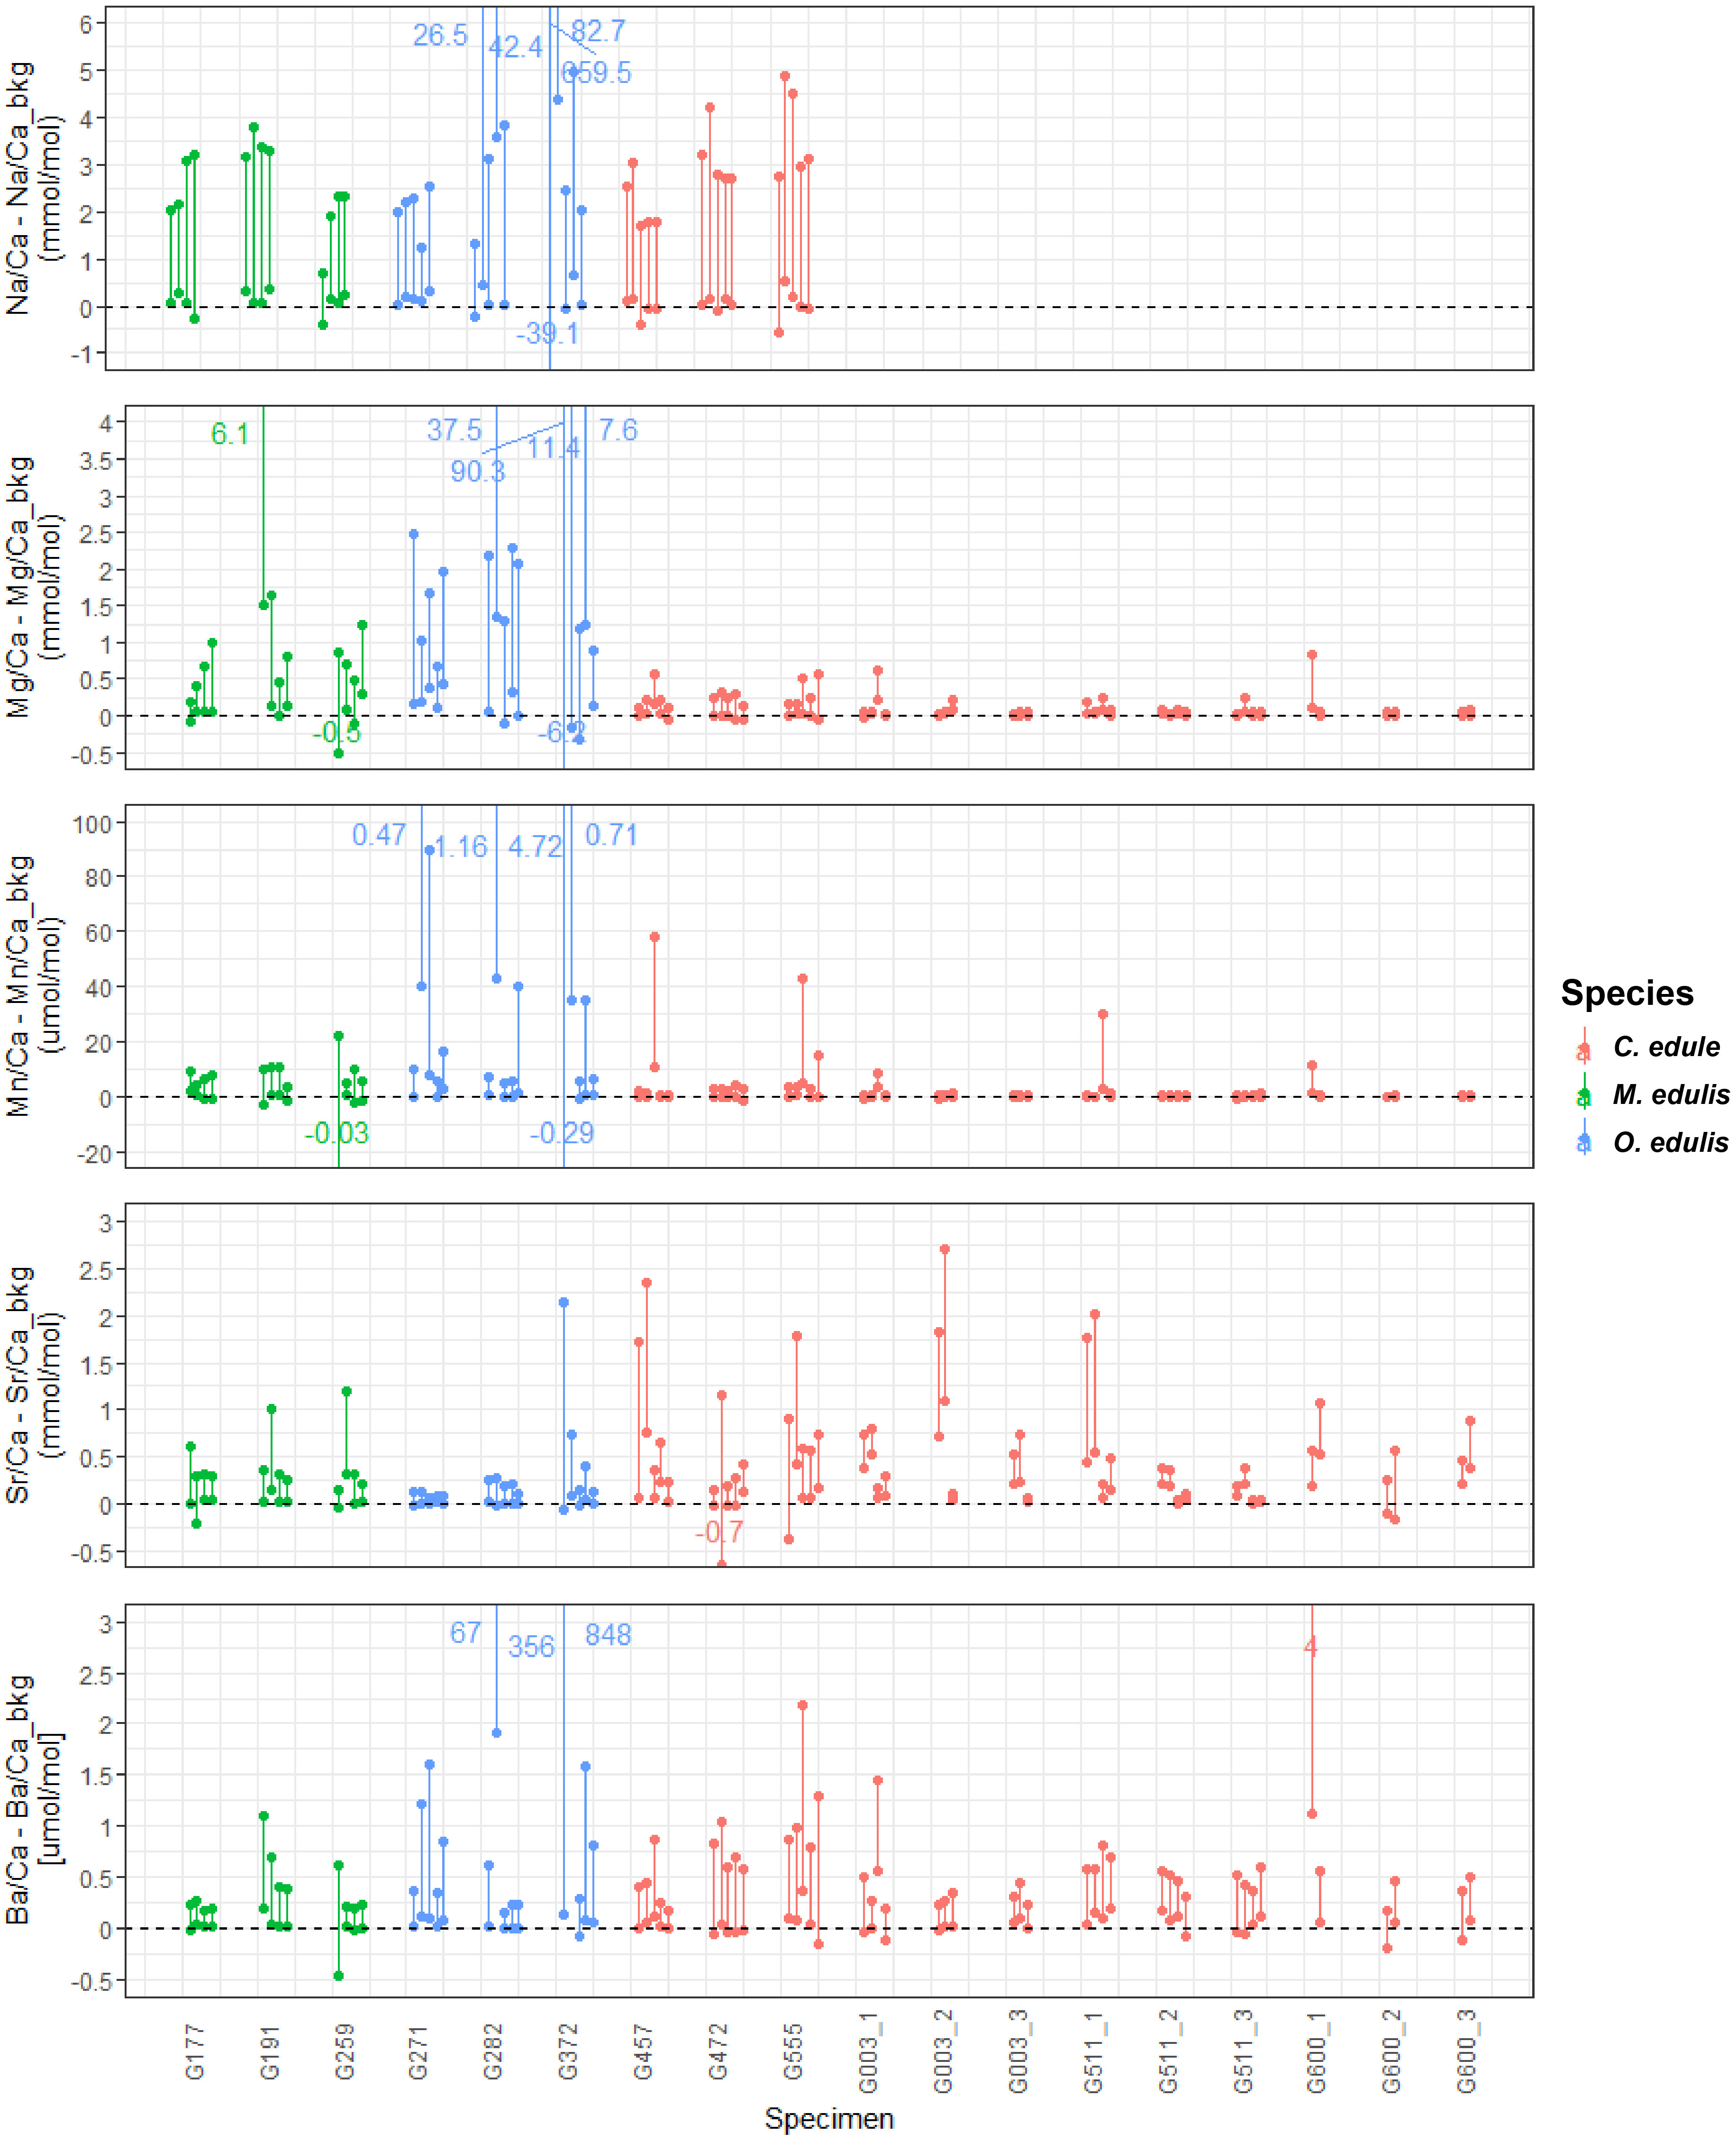
Figure 5 Plot showing trace element concentrations in all peaks in all specimens which lived through the entire growth experiment relative to their background values (dotted line). Lower dots show the average concentration within the peak while the higher dots (connected by a vertical line) show the average of the highest 10 measurements in the peak. Labels with subscripts (e.g. “G003_1”) indicate different profiles within the same specimen. Note that for specimens G003, G511 and G600 no Na concentrations were measured. Colours indicate different species.
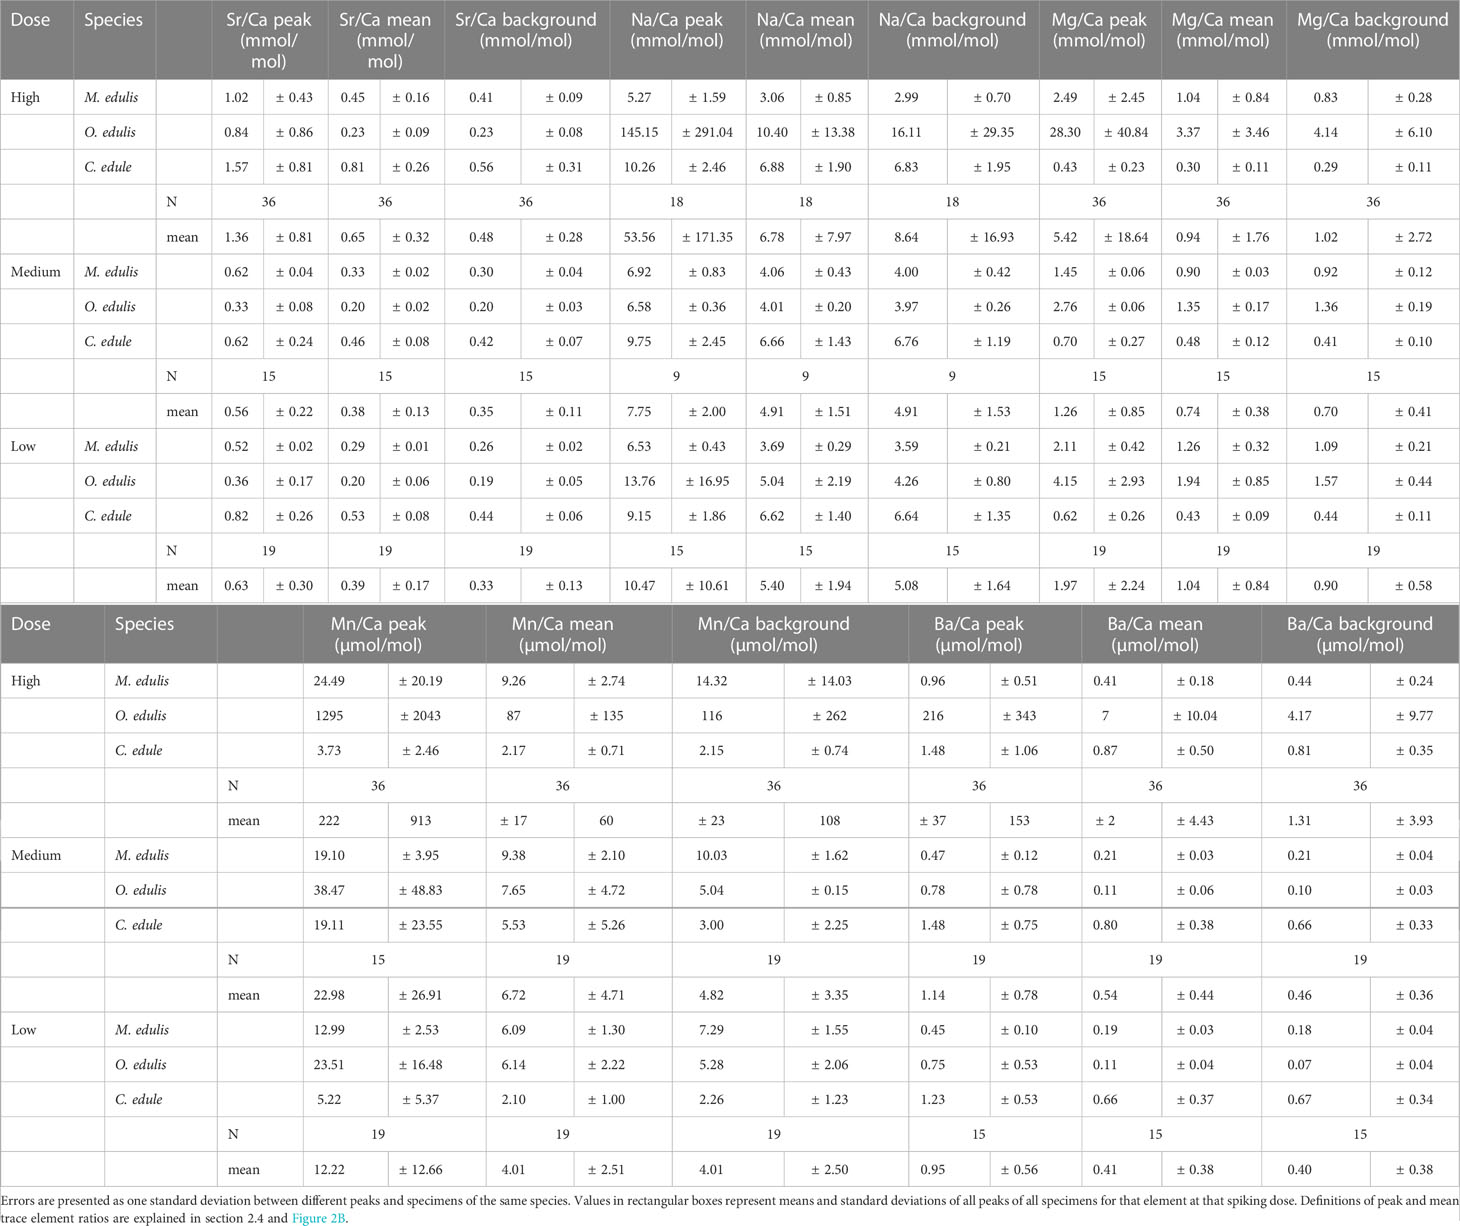
Table 4 Peak trace element ratios, mean trace element ratios within the entire peak, and background ratios of shell material mineralized before and after the peak for all specimens, organized by height of the spiking dose (high = 0.58 mmol/L, medium = 0.33 mmol/L, low = 0.21 mmol/L).
3.6 Effect of spike dose on peak height
There is a positive relationship between applied dose and measured peak concentrations in shell carbonate in all species. (Figure 6). This relationship is approximately linear in mussels, but non-linear in cockles and oysters. The data (Figure 6) also show that there is a large inter- and intra-species variability between the heights of Sr/Ca peaks (see also Figures 3, 4). This variability makes it hard to distinguish between peaks resulting from low and medium doses. However, in many cases the difference between high Sr doses and low or medium doses is large enough to produce significantly different peaks in the shells.
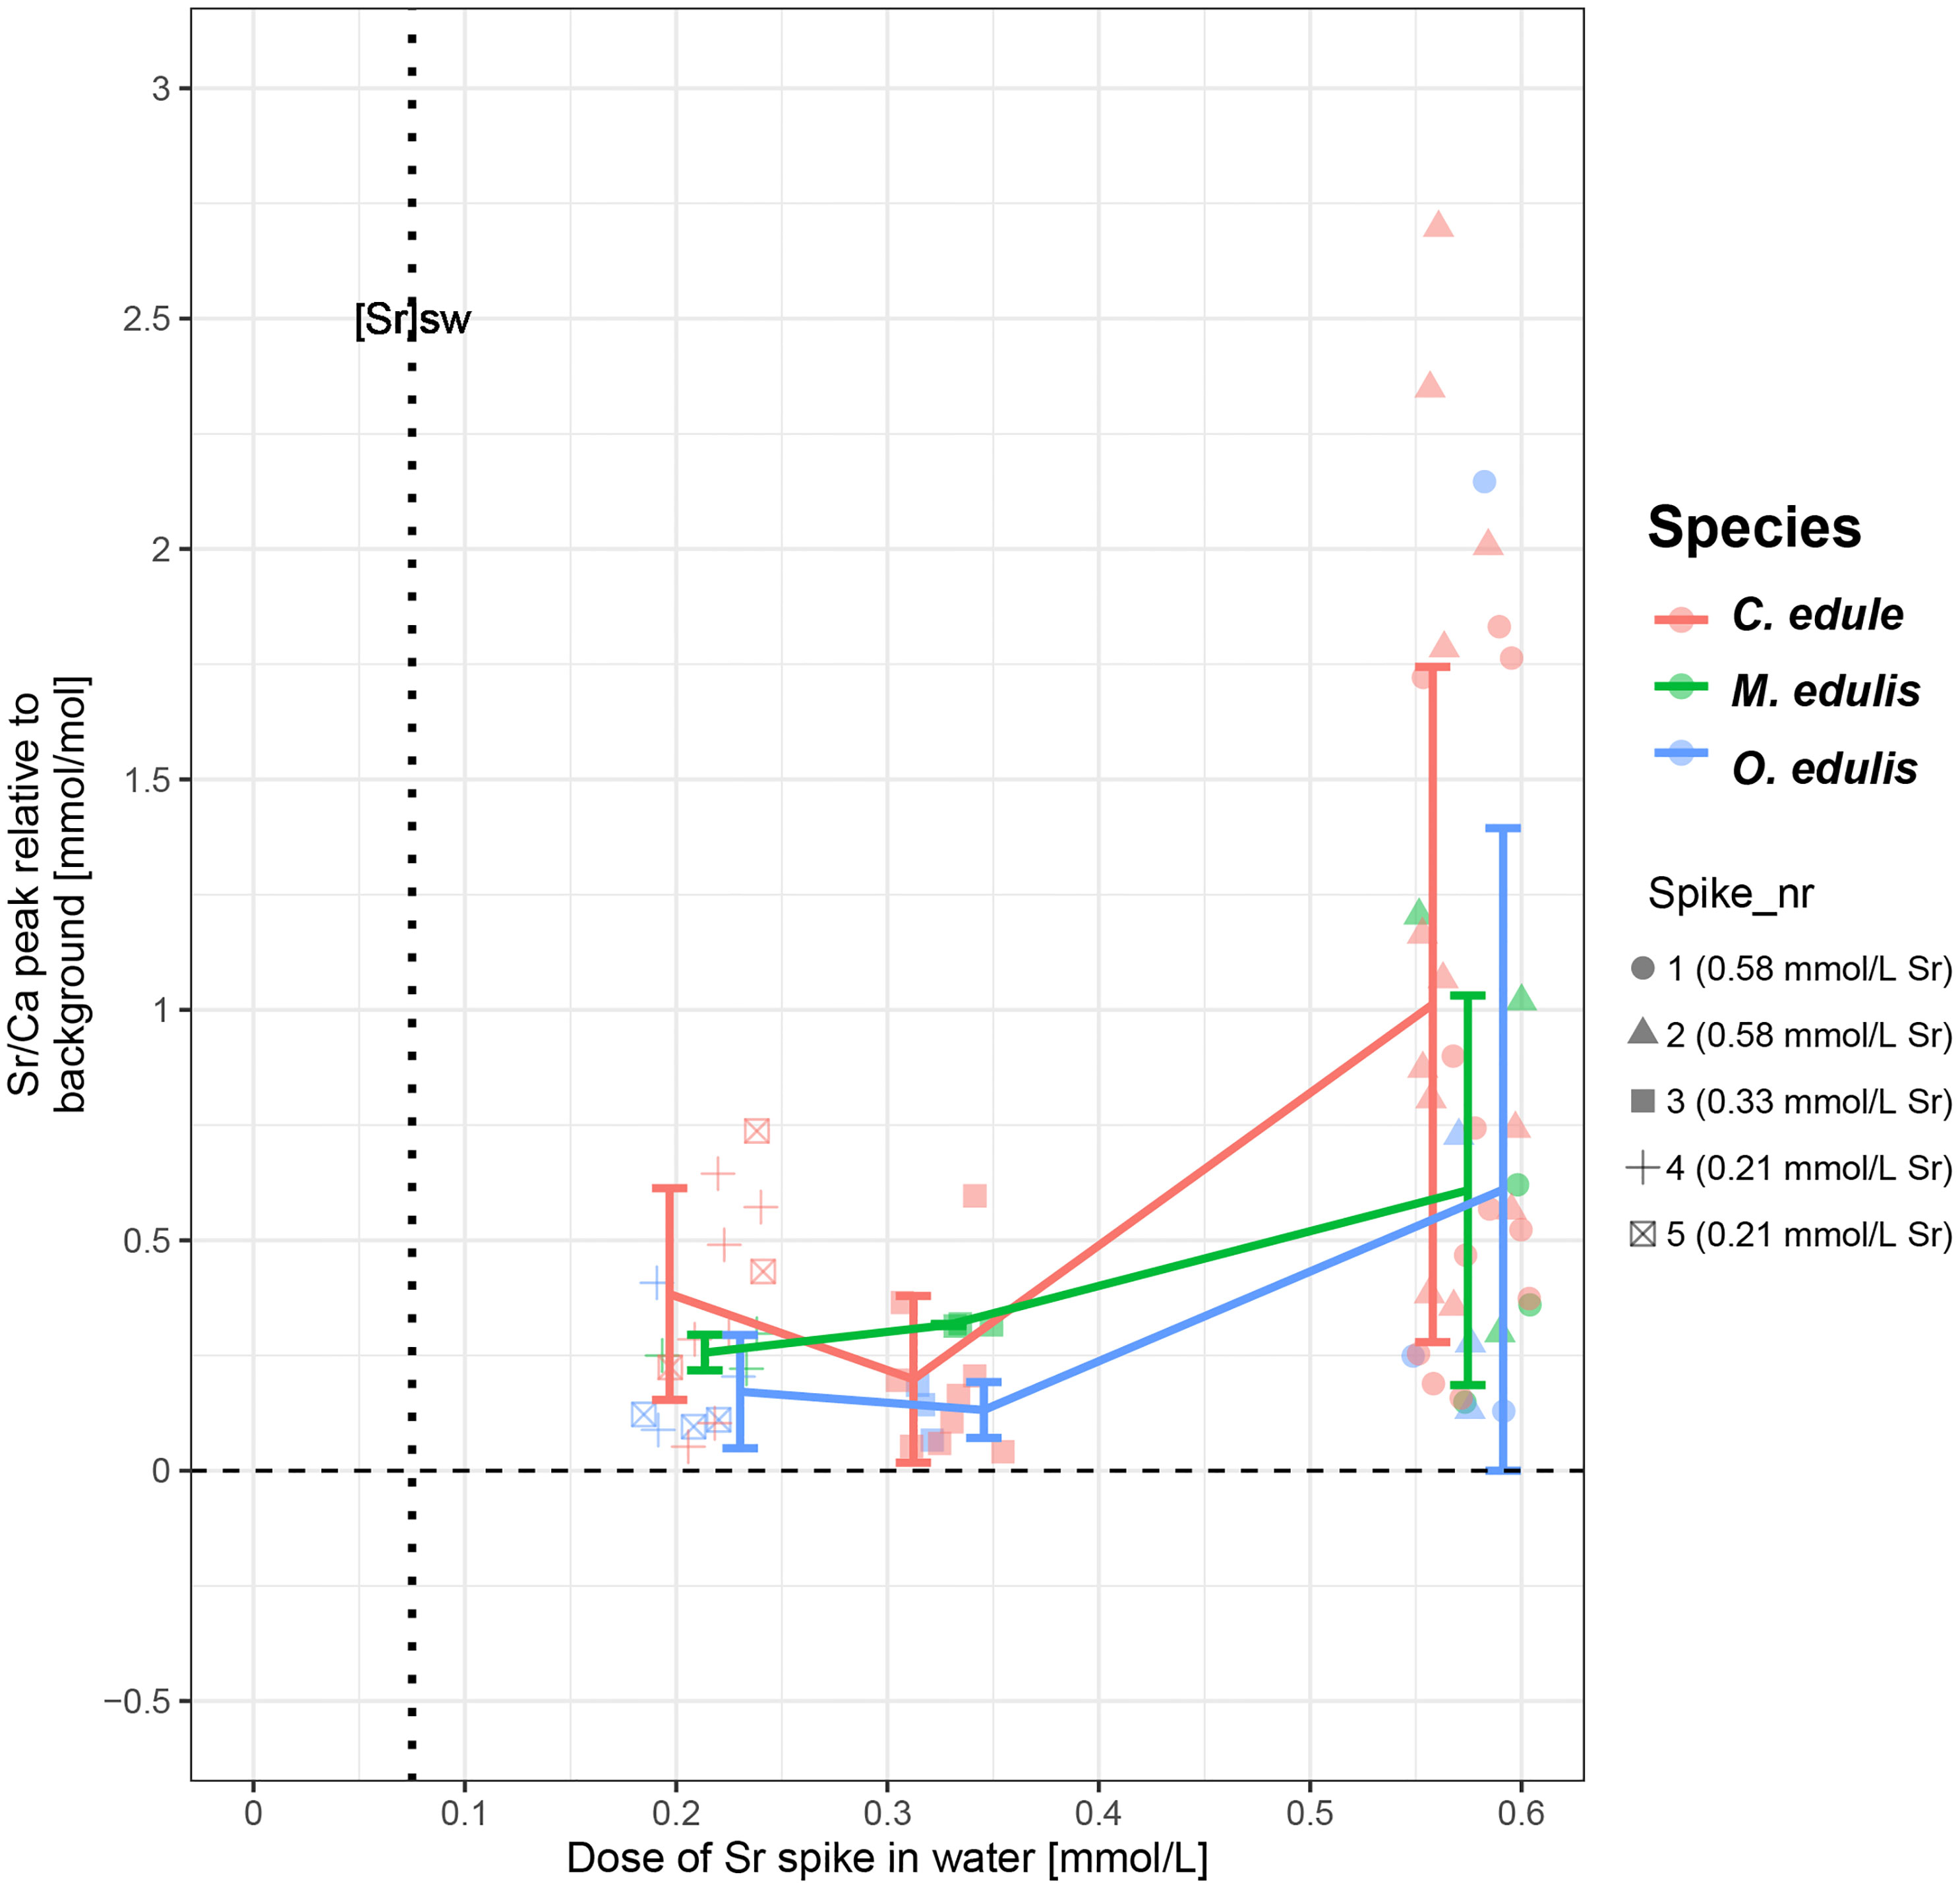
Figure 6 Plot showing the height of the Sr peak (in Sr/Ca ratio) relative to the background concentration ratio against the size of the elevated Sr dose for all species. Different symbols represent Sr spikes labelled in chronological order (spike 1 = 04/04/2020, spike 5 = 14/07/2020; see Table 1). Note that symbols and error bars of different species are artificially horizontally offset from each other, while the actual Sr dose was equal for all species. Detailed plots of the height of the concentration peak in other trace element plotted against spike dose are provided in SI9.
3.7 Growth curves
Shell length measurements on the outside of the shell and estimates of shell size from the position of Sr spikes were used to construct growth curves for each specimen (Figure 7). These curves demonstrate that the overall pattern of shell size over time based on actual shell size measurements is reproduced by the shell size estimates based on Sr peak positions. However, in cockles shell size based on position of Sr spike (see section 2.4) consistently underestimates shell height measured on the outside of the shell. In oysters, the shell sizes based on Sr spikes are in closer agreement with those measured on the shell pictures. In Figure 8F, shell sizes interpolated from measurements on the outside of the shell are directly compared to the shell sizes obtained from Sr peak position. In the mussels, the Sr spiking method underestimates shell size in smaller individuals, but the positive slope of the regression shows that estimates become better as the individuals grow (Figure 8F).
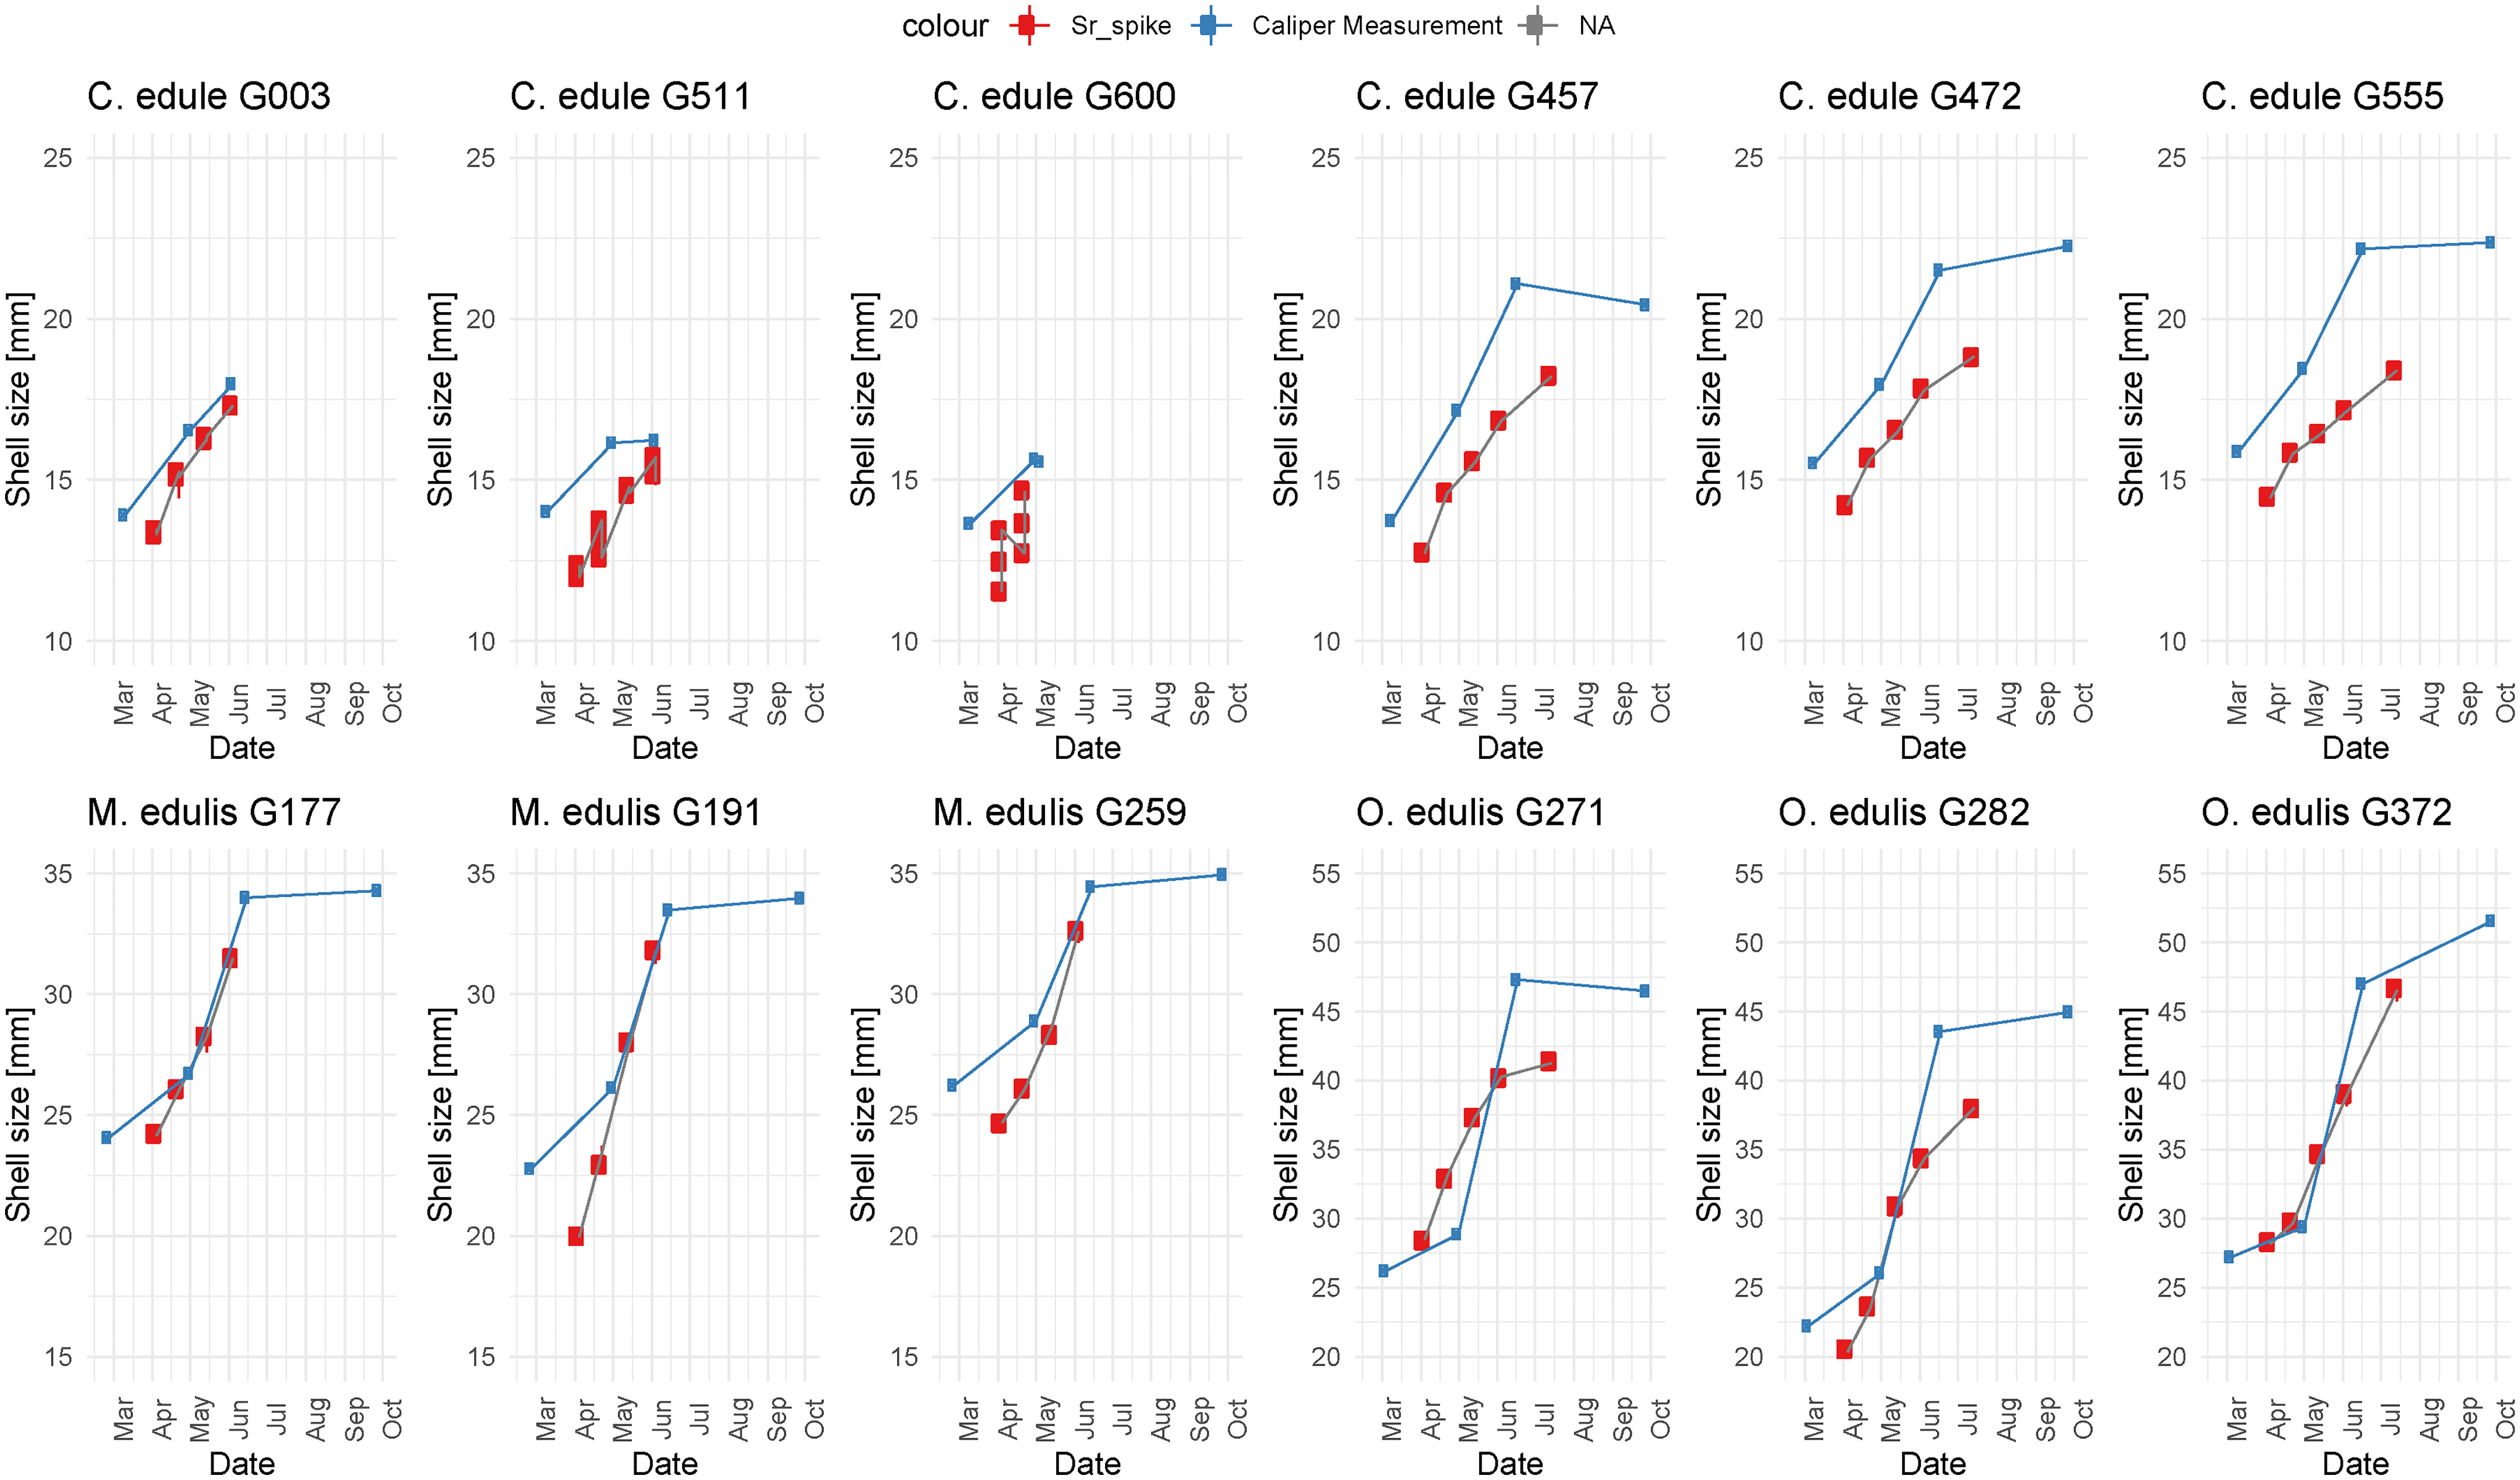
Figure 7 Plot showing measured shell size over time (in blue) and shell size over time inferred from the location of Sr spikes (in red) for all specimens. Vertical scales are constant between specimens of the same species, but different between species. Note that three parallel LAICPMS line scans were measured on cockle specimens G003, G511 and G600, resulting in multiple Sr spiking shell growth estimates at the same time of growth.
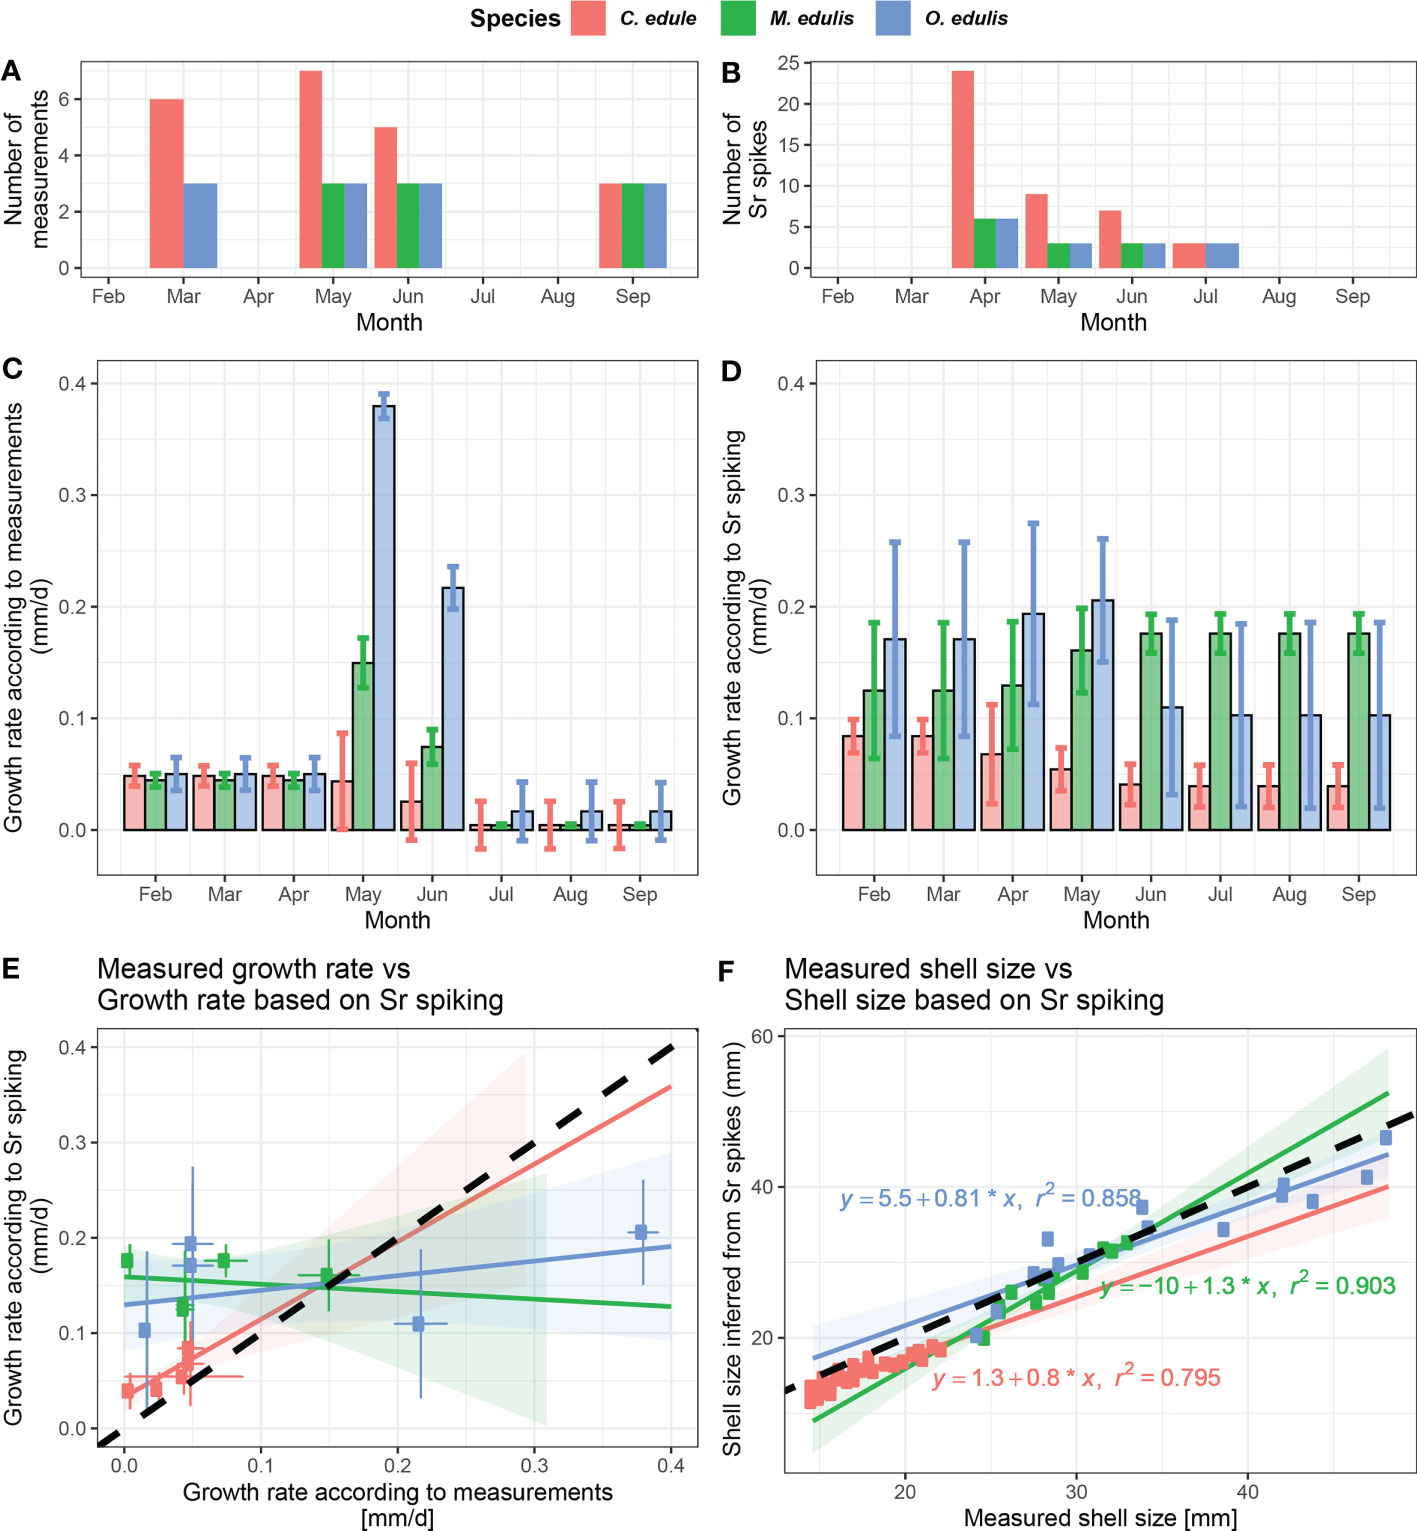
Figure 8 Comparison between shell sizes and growth rates calculated based on Sr spikes and shell length measurements. (A) Number of shell size measurements per month per species. (B) Number of Sr spikes per month per species. (C) Mean monthly growth rates calculated from shell size measurements per species. (D) Mean monthly growth rates calculated from positions of Sr spikes per species. (E) Cross plot showing growth rates calculated from shell size measurements against growth rates for the same month and the same species as calculated from the position of Sr peaks. The bold dashed line indicates equal growth rates between the two methods. (F) Cross plots showing measured shell size against shell size at the same time as determined from the position of Sr peaks. The bold dashed line indicates equal shell size estimates between the two methods.
Monthly growth rate estimates based on limited Sr peak positions are not a good predictor of growth rates in mussels and oysters based on measurements on the outside of the shell, while the technique performs better in cockles (Figures 8C–E). Figure 7 shows that this lack of agreement might be caused by the high variability in growth between specimens and through time.
4 Discussion
4.1 Reproducibility of Sr/Ca peaks
4.1.1 Within-specimen reproducibility
The similarity between parallel Sr/Ca profiles within the same cockle specimens (Figure 3A) demonstrate that peaks in Sr/Ca resulting from Sr spiking are reproducible within the shell. Peaks in profiles recorded farther away from the outside of the shell are generally lower (SI10). This pattern is robust when the mean Sr/Ca value within the peak is considered instead of the peak value (see Figure 2). As a result of the differences in peak shape (Figure 3A), mean Sr/Ca values belonging to the same Sr spike dose measured at different locations within the same specimen show less variability (<20% relative SD) than peak “height” values (typically >20% relative SD). Peak shape variability is more pronounced in high dose Sr spikes than medium or low dose spikes, likely because the effect of high dose spikes is detectible over a larger portion of the shells (i.e. the peaks are wider, see Figure 3). This observation places some uncertainty on the detection of the peak in labelled specimens, as the highest Sr value may be recorded at different places within the affected shell area within the same specimen. With the typical peak width of ~400 μm recorded in cockles (SI10) and a typical growth rate of 50-100 μm/d (Figure 8D) recorded in cockles in this experiment, the effect of these changes in peak shape could amount to an uncertainty of a few days in the identification of Sr peaks assuming the true peak Sr concentration can be found randomly within the affected shell area.
4.1.2 Method comparison
Our pilot measurements using µXRF scanning show that Sr/Ca peaks in cockles are detectable with this analytical method as well. The observation that peak height concentrations recorded by µXRF are similar to those measured by LAICPMS shows that these features can be retrieved from spiked shells using both methods. This is an advantage, since µXRF scanning is less destructive to the polished shell surface and would allow subsequent re-sampling or microscopic observation of the same surface without the need for repolishing (de Winter and Claeys, 2016). A disadvantage of the µXRF method is that it is sensitive to topographical differences of the scanned surface, and that the X-rays penetrate the sample further than LAICPMS ablation, causing smoothing of the peak signal (compare Figures 3, 4 and see discussion in section 4.3). Since the µXRF pilot measurements in this study were done after LAICPMS profiles were ablated on the samples, the resulting topographical features could not be avoided, and they visibly affect the Sr/Ca background in Figure 4 (see section 3.3). If µXRF scanning is used to locate trace element peaks in spiked specimens, we recommend carrying out this analysis before applying more destructive sampling methods to the shell surface.
4.1.3 Variability between species
The ease with which Sr peaks can be recognized in LAICPMS profiles decreases from cockles to mussels and oysters (Figure 3). Peaks in Sr/Ca induced by Sr spiking are much higher in cockles than in mussels and oysters, likely due to the mineralogical difference between the aragonitic outer shell layer of cockles and the calcitic layers targeted in mussels and oysters. Due to the difference in mineral structure, the partition coefficient of elements with a high ionic radius (e.g. Sr and Ba) into aragonite is higher than into calcite, explaining higher Sr concentrations in aragonitic cockle outer shell layers than in calcitic mussel and oyster shells grown under the same environmental conditions (Day and Henderson, 2013; Wassenburg et al., 2016). This effect of different partition coefficients between aragonite and calcite is also evident from the uptake of other trace elements during the Sr peak: elements with a relatively small ionic radius (Na, Mg, Mn) show stronger enrichments relative to the background value in calcitic mussel and oyster shells while larger elements (e.g. Ba) are more enriched in the aragonite of cockle shells (Figures 5; SI5).
The increase in concentration of other elements during Sr spiking could be a result of the “closed-sum effect”, which occurs because elevated Sr concentrations reduce Ca concentrations in the same shell section, thereby increasing the ratios of other trace elements to Ca (Van der Weijden, 2002). However, considering that the highest Sr/Ca peaks feature Sr/Ca ratios of at most 8 mmol/mol above a background ratio of ~2 mmol/mol in cockles (10 mmol/mol peak height, with lower peaks in mussels and oysters; Figure 3), the resulting decease in Ca concentration relative to the nominal Ca concentration in CaCO3 (1 mol/mol for pure aragonite) can only explain an increase of at most 0.8% (0.008/1.0 mol/mol) relative to the background value in other elemental ratios. Figure 5 shows that peaks in elemental ratios other than Sr/Ca is too large to be fully explained by the closed-sum effect.
This suggests that the uptake of different trace elements into the shells of all species studied here is linked by a common process. Differences between elemental concentrations are mainly driven by differences in the partitioning into different minerals, and increased element uptake happens simultaneously for all elements under study. This supports the hypothesis that processes affecting the concentration of trace elements in the extrapallial fluid of molluscs (e.g. through Ca-channels Hagiwara and Byerly, 1981) dominate over more element-specific processes that control the degree by which (trace) elements are built into the mineral structure (e.g. through an organic template for shell formation Gillikin et al., 2005). Our results therefore argue in favour of the biomineralization model put forward by (Carré et al., 2006).
While most Sr peaks are identified in oysters, Sr labelling produces much more easily identifiable peaks in mussels and cockles (Figure 3). This suggests that the success of Sr labelling does not depend only on shell mineralogy, but that the mode of shell growth and the location of measurement plays an important role. In contrast to cockles and mussels, oysters show highly irregular growth patterns with frequent changes in growth rate and direction (Carriker et al., 1980; Banker and Sumner, 2020). Furthermore, oysters may resorb parts of their shell to maintain pH within the extrapallial fluid during anaerobic respiration, which may affect the timeline recorded in their outer shell layers (Kent, 1992). This causes variability in growth rate along the ventral margin through cross sections of the shells (e.g. along LAICPMS; Figure 3). As a result, Sr/Ca peak height in oysters is expected to vary significantly within the shell depending on the orientation of the measured section because of these differences in local growth rate. Peak height is therefore not an ideal metric for comparing trace element compositions between shells and shell segments in oysters. For this reason, growth rates in oysters are often studied in the hinge area, which is less affected by these irregularities (e.g. Surge et al., 2001; Mouchi et al., 2013; Ullmann et al., 2013; Huyghe et al., 2019). However, the small width of oyster hinge plates, especially in young specimens, limits the temporal resolution of chemical profiles sampled in this area of the shell and therefore on the precision with which short-lived peaks in Sr concentration can be detected there. Alternative labels which can be detected at smaller scale, such as the use of fluorescent dyes or Mn labelling combined with cathodoluminescence microscopy (Huyghe et al., 2019) might be better suited for analyses in the hinge areas of oyster shells. In addition, administrating elevated concentrations of isotopically enriched strontium (e.g. 87Sr or 86Sr) could produce peaks with distinct isotopic signatures which would be simple to trace within the shell, albeit requiring multi-cup ICPMS or nanoSIMS techniques to detect (e.g. Houlbrèque et al., 2009). Note that a difference in the time lag of the incorporation of Sr (and other trace elements) into the shell may exist between species, or between individuals as a consequence of differences in individual growth rate or activity, which might explain part of the differences in the way Sr/Ca peaks are expressed in the shells of cockles, mussels and oysters.
4.1.4 Variability with spike timing or health
Another factor to consider when comparing the shape and height of Sr/Ca peaks is the timing of the peak relative to the growing season. Like most poikilothermic organisms, cockles, mussels, and oysters growing in temperate regions all show distinct seasonal patterns in growth rate related to changes in temperature and food availability (Bayne and Worrall, 1980; Hilbish, 1986; Richardson et al., 1993; Milano et al., 2017). Since growth rate during labelling is likely an important factor for determining the shape and height of Sr peaks (see sections 4.1.1 and 4.1.3), the timing of labelling relative to the growth season might determine whether Sr peaks can be successfully recognized, especially if growth is episodic instead of continuous. Connected to this, the health of individuals of these species is known to vary significantly over the growing season (Bayne and Worrall, 1980; Hilbish, 1986), which may affect how trace elements are taken up into the extrapallial fluid and therefore Sr concentrations in the shell (Carré et al., 2006). Comparing different Sr/Ca peaks in the same specimen associated with the same spiking dose shows that there is no clear relationship between the timing of the peak and peak height or shape (see Figures 3, 4). However, it must be noted that the period between consecutive spikes of the same dose is not very high, and experiments administering the same Sr dose at multiple different times during the growing season would be needed to fully constrain the effect of growth rate on the shape and height of Sr peaks recorded in the shells. In cockles and especially in mussels, peak height is a good indicator for Sr spiking dose (Figure 6), and Sr/Ca peaks belonging to the same dose but timed later in the growth season (e.g. high dose peaks on April 3rd and April 22nd; Figure 3) are similar in shape and size.
In addition, Sr peak shape and height in cockle specimens G003, G511 and G600 which did not survive through the full experimental period (Figure 3A) do not seem consistently different from those in cockles that lived through the full growing season (Figure 3B). From this it seems that the decreased health (as evident from their early death) of these three specimens did not affect how Sr labels are recorded in their shells. Therefore, we do not directly observe an effect of either health or spike timing relative to the growing season on the detection of Sr spiking peaks in our specimens. The caveat of this observation is that highly dosed Sr spikes were administered early in this experiment while lower doses were used later in the season, making it hard to disentangle the effect of seasonal variability in growth rate or health from our dataset. To more thoroughly check whether seasonal variability in these conditions affects Sr labelling, an experiment could be conducted in which Sr spikes of the same doses are administered further apart in time such that the evolution of Sr peak shape and size through the season can be observed independent of the dose.
4.2 Uncertainties related to Sr peak location
Variations in peak location between different profiles through the same cockle specimen reflect the uncertainty when estimating growth rates from Sr labelling. The distance in growth direction between two Sr peaks does not scale monotonously with the position of the profiles relative to the outer margin of the shell (Figure 3A), as would be expected due to the curvature of the shells (Milano et al., 2017). Differences in growth rate reconstructed from the locations of these Sr peaks can thus not be fully explained by the shape of the shell. The location where the Sr spikes are measured in the shell matters for the estimate of the growth rate and including estimates from different places within the shell causes greater uncertainty on shell size reconstructions (Figure 6). In addition, differences in the rate or timing of trace element uptake, or (sub-)daily variations in shell growth rate, between species cannot be excluded based on our experiment (see section 4.1.3). Such differences may place additional uncertainty on the shell growth rates reconstructed from Sr spikes.
The observation that trace element profiles measured at different locations within the same specimen (Figure 3A) differ in both height and (subtly) in location in the shell cross section shows that an environmental signal (in this case an increase in Sr concentration) is not recorded uniformly within new shell material precipitated by cockles. This corroborates the results of previous studies showing that local changes in shell extension rates or differences in shell microstructure and morphology can influence the uptake of trace elements into mollusc shell carbonate (Freitas et al., 2009; Marali et al., 2017). By extension, differences in Sr peak location and height between specimens of cockles, mussels and oysters grown under the same conditions (Figure 3) demonstrate that these variations contribute to uncertainty in trace element records when comparing multiple specimens from the same environment, as hypothesized in previous studies (Schöne et al., 2006; Freitas et al., 2008). These results place additional uncertainty on paleo-environmental reconstructions from trace element profiles through (fossil) mollusc shells, even when employing a multi-specimen approach (de Winter et al., 2017b; Fröhlich et al., 2022).
4.3 Peak shape
The asymmetry in Sr peaks is consistent between species but differs between methods (Figures 3, 4). Tails in Sr/Ca peaks are hundreds of micrometers long, an order of magnitude larger than the spot sizes of LAICPMS (20 µm) and XRF (25 µm). However, while LAICPMS measurements are based on ablation of a minimum amount of surface material from the cross sections through the shells (crater depth is typically less than spot size; Holá et al., 2011; Fehrenbacher et al., 2015), while X-ray fluorescence scanning produces a depth-integrated signal of which the reach depends on the excitation energy of the X-ray photons (Jablonski and Powell, 2020). Since strontium concentrations are analysed based on the Kα1 (14.16 keV) and Kβ1 (15.82 keV), the attenuation length of Sr in calcium carbonate measured by XRF is in the order of 400-500 μm, causing the XRF Sr/Ca profiles with this method to integrate over roughly 1 mm in depth (Henke et al., 1993). Considering that the X-ray beam in the Bruker M4 setup describes an angle of 39° with respect to the true perpendicular to the sample surface (de Winter and Claeys, 2016), this attenuation length in beam direction could easily translate to an averaging of the XRF signal over a few 100 μm in lateral direction. We therefore conclude that the observation of differences in Sr/Ca peak shape between LAICPMS and XRF profiles on the scale of 100s of μm likely results from the difference in depth signal integration between the methods. This caveat of the XRF method should be considered when using the method for detecting trace element peaks in mollusk shells, since it has the potential to place significant added uncertainty on the recognition of true peak location. The observed asymmetry in LAICPMS peak shape is not a methodological artefact (depending on either spot size or the washout during LAICPMS analysis), but instead a true expression of the Sr concentration in the shells.
The fact that mussels and oysters have broader peaks with more strongly tailed Sr distributions than cockles (Table 3) is perhaps counterintuitive, given the higher total amount of Sr being taken up by cockles due to a comparatively large affinity for Sr in aragonite (see above), which could cause peak area to increase. The difference in peak width in growth direction also suggests that there is a difference in the rate or timing by which the different species record elevated Sr concentrations in their shells. However, when controlled for mean growth rate, which varies between 50-100 μm/d in cockles, 120-180 μm/d in mussels and 100-200 μm/d in oysters (Figure 8D), the estimated amount of time contained within peaks remains relatively constant between species (4 - 5.5 days; SI6), suggesting that the difference in peak width is likely caused by differences in growth rates, not by differences in response or retention time of Sr within the organisms. However, as mentioned above, delays in the incorporation of Sr in response to elevated environmental Sr concentrations may still be different between species, especially considering the differences in body mass, gill and mantle surface between the three taxa (Richardson et al., 1980; Hilbish, 1986; Richardson et al., 1993). Moreover, the asymmetric shape of Sr peaks with a slow build-up of Sr concentration and a fast drop in Sr/Ca (see section 3.4) suggests that the incorporation of Sr into the shell is somehow buffered or delayed relative to the onset of the spiking event in all species. This suggests that the portion of the shell containing the peak Sr concentration might have mineralized later than the onset of the spiking event, or even after the end of the Sr spike. Unfortunately, changes in shell growth rates within the peaks cannot be reconstructed in this study, so this hypothesis cannot be tested with our dataset. Therefore, we cannot exclude the possibility that different behaviour of Sr incorporation into the shell as a function of species, shell mineralogy, physiological state or as a function of the size of the Sr dose might play a role in determining how Sr peaks are recorded in the shells and whether peak positions accurately mark the spiking event.
4.4 Estimating shell size from labelled individuals
Shell sizes determined from the umbo to the location of Sr peaks in cross sections through the shells consistently underestimate shell size measurements as taken from the outside of living individuals (Figures 7, 8). This is not surprising, because Sr spike-based distances in cross section are only measured from the umbo (reference point) to the location of the spike on the LAICPMS profile within the outer shell layer, while calliper measurements are taken along the outside of the shell (Figure 2). This effect is clear from the difference in shell size estimates based on Sr spikes for different LAICPMS transects through the same specimen, with profiles closer to the outer shell margin yielding larger shell sizes than the profile farther towards the inside of the shell (Figure 7). In addition, the curvature of the shell increases the width between the flat ends of the measurement calliper, which must move farther apart to accommodate a more curved shell. This effect of curvature is stronger in cockles than in mussels and oysters which show less curvature. Curvature also has a higher relative effect on smaller shells, explaining the trend towards closer agreement between Sr spike-based shell size estimates and calliper measurements in larger specimens (Figure 8F). Furthermore, the outside of cockle shells are ribs and grooves, causing measurements on the outside with callipers to always include the thicker ribs into the shell measurements, while cross sections may cut through grooves, reducing the measurement result. Finally, even though shell cross sections and calliper measurements were made through the axis of maximum growth, it is possible that the cross section is laterally offset from the exact direction in which the calliper measurement took place. This adds an additional offset between the measurements which should be consistent within shells of individuals.
There is also systematic uncertainty to consider in both methods of measurement: Uncertainty related to the position of Sr peaks within areas of shell affected by higher Sr concentrations is typically in the order of 0.3 mm (see sections 4.1.1 and 4.1.3). Calliper measurements are prone to human error (e.g. small variations in the way the calliper is positioned) which result in an uncertainty of ~0.2 mm (1σ; see section 2.1.2 and SI11), roughly on the same order of magnitude as variability in Sr spiking-based estimates. Together, these sources of uncertainty seem sufficient to explain most of the variability in shell size measurement within specimens, but they cannot explain the consistent offset between the two methods. Therefore, when combining labelling techniques and live measurements in growth experiments, we advise to calibrate the results of both techniques using spikes and live measurements performed at the same time during the growth experiment on the same individuals. Specimens exposed to the tidal cycle (intertidal specimens; as opposed to our subtidal setup; see Figure 1) could provide additional control on the timing of Sr spikes using tidal increment-based chronologies, removing some uncertainty related to peak width and growth rates.
4.5 Estimating growth rate from labelled individuals
Despite the offsets and uncertainties considered above, both Sr spiking and calliper measurements yield similar sigmoid-shaped shell size profiles through the growth season (Figure 7). This suggests that meaningful and reproducible information about the growth rate seasonality can be recovered from these measurements, since any consistent offsets between the methods should not affect the increase in shell size between two time intervals. However, Figures 8C–E shows that monthly averaged patterns in growth rate over time differ significantly between Sr spiking and calliper measurements. The reason for this difference is that both methods rely on a maximum of 4 or 5 datapoints per specimen which are offset from each other in time, making direct comparison of growth periods impossible. The attempt to circumvent this issue by linearly inter- and extrapolating based on shell size datapoints and aggregating results in monthly time bins did not successfully reconcile growth rate results between the methods (Figure 8E). The sparsity of shell measurements and Sr spikes (Figures 8A, B) necessitates much intra- and extrapolation to estimate average monthly growth rates. The latter likely explains deviating growth rate reconstructions, given that the growth rates calculated for cockles, for which twice the number of specimens and Sr spikes were measured, show better agreement between the methods than those of the other species.
In absence of a direct agreement between shell size estimates from the two methods, records based on our Sr spiking or calliper measurements alone clearly lack the resolution to characterize growth rate seasonality in the three species beyond a first order estimate of the months in which growth is fastest (May/June) and a reasonably accurate estimate of mean growth rates through the experimental period (see section 4.1.3). The overall timing of growth, shell size and growth rate found through our Sr spiking results are in good agreement with previous studies on the same species of cockles (e.g. Hilbish, 1986; Milano et al., 2017; Castrillejo et al., 2020), mussels (Page and Hubbard, 1987; Riisgaord et al., 2012) and oysters (Wilson, 1987; Richardson et al., 1993). Therefore, our data shows that detailed (monthly-scale) measurements of growth rate and shell size are possible based on Sr spiking if spikes are administered more frequently.
4.6 Outlook and recommendations
In this study, we show that, much like Mn (Mouchi et al., 2013), Sr can be used as a trace metal for spiking the shells of molluscs during growth experiments. However, our spiking experiments have varying success depending on the spike done and species. Since these issues are not fully explained by differences in mineralogy (and the resulting Sr partition coefficients Day and Henderson, 2013; Wassenburg et al., 2016) and growth rate variability, variations between species and specimens may be related to the way molluscs take up and store elements like Sr before they end up in their shells, or to short-term changes in shell growth rate within the spiking event (~24h). To control for these, more knowledge is needed of these processes, which can be obtained by specific growth experiments with populations of a species and in which the Sr concentrations in soft tissue and new shell material as well as shell growth is traced during and after a spiking event (pulse experiment). Culturing populations with and without spiking and changing spike durations while keeping the concentrations fixed could be useful for tracing growth and concentration of the spiking agent (e.g. Sr) during spikes and the effect of spike duration, especially when shells can be internally dated and sampled on timescales beyond the pulse length (e.g. through smaller LAICPMS spots or SIMS measurements or tidal growth laminae in cockles; Evans, 1972; Sano et al., 2012). Repeating experiments like the one described here on bivalve species with very different growth characteristics, such as symbiont-bearing tridacnids, fast-growing pectinids and long-lived species like Arctica islandica would be very useful to gauge the response of these taxa to spiking events. Finally, experimenting with varying dose heights (concentrations of Sr in the water) could be useful. However, very high trace element concentrations must be applied with care in growth experiments, as they may inhibit the formation of carbonate by calcifying organisms (de Nooijer et al., 2009).
Conclusion and outlook
Spiking water in mollusc growth experiments with elevated concentrations of strontium of 3-8 times the background concentration produces recognizable peaks in Sr/Ca ratio in the shells of cockles, mussels, and oysters. Overall, this technique presents a simple and cost-efficient means to label mollusc shells in growth experiments with minimal disturbance of the animals. Our dataset shows that higher Sr doses (7-8 times background value; ~0.6 mmol/L) ensure the formation of clearly recognizable peaks in cockles and mussels. Spiking of oyster shells is generally less reliable due to their irregular growth and potential shell resorption. The width of Sr peaks recovered in this study’s specimens (~400 µm) adds uncertainty on the exact placement of the peak which is equivalent to 3-5 days of growth if the full peak width is considered as opposed to the highest Sr values within the peak. In addition, multiple spiking events per month are necessary to accurately trace changes in growth rate through a growing season. Therefore, it seems fruitful to experiment with exposing specimens to high doses of elevated Sr concentrations frequently and for shorter time intervals (< 24 h) in an attempt to produce sharper, more easily recognizable peaks which can be used to trace shell growth in detail during experiments.
Data availability statement
The datasets presented in this study can be found in online repositories. The names of the repository/repositories and accession number(s) can be found below: https://doi.org/10.5281/zenodo.7477080. R scripts used to process data and generate figures for this study can be found in the online repository Zenodo: https://doi.org/10.5281/zenodo.7533763.
Ethical statement
Ethical review and approval was not required for the study on non-cephalopod molluscs in accordance with the local legislation in the Netherlands and institutional requirements.
Author contributions
NdW and RW designed the study. NdW, RW, and SvS carried out the growth experiments. WB, LN, GJR, and PC were responsible for the geochemical analyses. NJW, SvS, RW, and BG wrote the first draft of the manuscript. All authors contributed to the article and approved the submitted version.
Funding
This study is part of the UNBIAS project, jointly funded by a Flemish Research Foundation (FWO; 12ZB220N) post-doctoral fellowship (NdW) and a MSCA Individual Fellowship (H2020-MSCA-IF-2018; 843011 – UNBIAS; awarded to NdW). G-JR and LKD acknowledge funding from the Netherlands Earth System Science Center (NESSC; grant no. 024.002.001) from the Dutch Ministry for Education, Culture and Science (gravitation grant no. NWO 024.002.001). BG, NdW, RW and MZ acknowledge support from the Royal Netherlands Institute for Sea Research (NIOZ) and Utrecht University under a NIOZ-UU collaboration grant.
Conflict of interest
The authors declare that the research was conducted in the absence of any commercial or financial relationships that could be construed as a potential conflict of interest.
Publisher’s note
All claims expressed in this article are solely those of the authors and do not necessarily represent those of their affiliated organizations, or those of the publisher, the editors and the reviewers. Any product that may be evaluated in this article, or claim that may be made by its manufacturer, is not guaranteed or endorsed by the publisher.
Supplementary material
The Supplementary Material for this article can be found online at: https://www.frontiersin.org/articles/10.3389/fmars.2023.1157929/full#supplementary-material
References
Agterhuis T., Ziegler M., de Winter N. J., Lourens L. J. (2022). Warm deep-sea temperatures across Eocene thermal maximum 2 from clumped isotope thermometry. Commun. Earth Environ. 3, 1–9. doi: 10.1038/s43247-022-00350-8
Auderset A., Moretti S., Taphorn B., Ebner P.-R., Kast E., Wang X. T., et al. (2022). Enhanced ocean oxygenation during Cenozoic warm periods. Nature 609, 77–82. doi: 10.1038/s41586-022-05017-0
Ballesta-Artero I., Zhao L., Milano S., Mertz-Kraus R., Schöne B. R., van der Meer J., et al. (2018). Environmental and biological factors influencing trace elemental and microstructural properties of arctica islandica shells. Sci. Total Environ. 645, 913–923. doi: 10.1016/j.scitotenv.2018.07.116
Banker R. M. W., Sumner D. Y. (2020). Structure and distribution of chalky deposits in the pacific oyster using x-ray computed tomography (CT). Sci. Rep. 10, 12118. doi: 10.1038/s41598-020-68726-4
Bashey F. (2004). A comparison of the suitability of alizarin red s and calcein for inducing a nonlethally detectable mark in juvenile guppies. Trans. Am. Fish. Soc 133, 1516–1523. doi: 10.1577/T03-073.1
Bayne B., Worrall C. (1980). Growth and production of mussels mytilus edulis from two populations. Mar. Ecol. Prog. Ser. 3, 317–328. doi: 10.3354/meps003317
Benavente D., Martinez-Martinez J., Cueto N., Ordoñez S., Garcia-del-Cura M. A. (2018). Impact of salt and frost weathering on the physical and durability properties of travertines and carbonate tufas used as building material. Environ. Earth Sci. 77, 147. doi: 10.1007/s12665-018-7339-0
Bennema F. P., Engelhard G. H., Lindeboom H. (2020). Ostrea edulis beds in the central north Sea: delineation, ecology, and restoration. ICES J. Mar. Sci. 77, 2694–2705. doi: 10.1093/icesjms/fsaa134
Beukema J. J., Dekker R., Essink K., Michaelis H. (2001). Synchronized reproductive success of the main bivalve species in the wadden Sea: causes and consequences. Mar. Ecol. Prog. Ser. 211, 143–155. doi: 10.3354/meps211143
Boer W., Nordstad S., Weber M., Mertz-Kraus R., Hönisch B., Bijma J., et al. (2022). New calcium carbonate nano-particulate pressed powder pellet (NFHS-2-NP) for LA-ICP-OES, LA-(MC)-ICP-MS and µXRF. Geostand. Geoanalytical Res. 46, 411–432. doi: 10.1111/ggr.12425
Burchell M., Stopp M. P., Cannon A., Hallmann N., Schöne B. R. (2018). Determining seasonality of mussel collection from an early historic Inuit site, Labrador, Canada: Comparing thin-sections with high-resolution stable oxygen isotope analysis. J. Archaeol. Sci. Rep. 21, 1215–1224. doi: 10.1016/j.jasrep.2018.02.016
Carré M., Bentaleb I., Bruguier O., Ordinola E., Barrett N. T., Fontugne M. (2006). Calcification rate influence on trace element concentrations in aragonitic bivalve shells: Evidences and mechanisms. Geochim. Cosmochim. Acta 70, 4906–4920. doi: 10.1016/j.gca.2006.07.019
Carriker M. R., Palmer R. E., Prezant R. S. (1980). Functional ultramorphology of the dissoconch valves of the oyster crassostrea virginica. Proc. Natl. Shellfisheries Assoc. 46, 139–183. doi: 10.1016/0022-0981(80)90036-2
Castrillejo M., Witbaard R., Casacuberta N., Richardson C. A., Dekker R., Synal H.-A., et al. (2020). Unravelling 5 decades of anthropogenic 236U discharge from nuclear reprocessing plants. Sci. Total Environ. 717, 137094. doi: 10.1016/j.scitotenv.2020.137094
Colsoul B., Boudry P., Pérez-Parallé M. L., Bratoš Cetinić A., Hugh-Jones T., Arzul I., et al. (2021). Sustainable large-scale production of European flat oyster (Ostrea edulis) seed for ecological restoration and aquaculture: a review. Rev. Aquac. 13, 1423–1468. doi: 10.1111/raq.12529
Crichton R. (2019). “Chapter 19 - biomineralization,” in Biological inorganic chemistry (Third edition). Ed. Crichton R. (Cambridge, Massachusetts, United States: Academic Press), 517–544. doi: 10.1016/B978-0-12-811741-5.00019-9
Day C. C., Henderson G. M. (2013). Controls on trace-element partitioning in cave-analogue calcite. Geochim. Cosmochim. Acta 120, 612–627. doi: 10.1016/j.gca.2013.05.044
Day R. W., Williams M. C., Hawkes G. P. (1995). A comparison of fluorochromes for marking abalone shells. Mar. Freshw. Res. 46, 599–605. doi: 10.1071/mf9950599
de Nooijer L. J., Toyofuku T., Kitazato H. (2009). Foraminifera promote calcification by elevating their intracellular pH. Proc. Natl. Acad. Sci. 106, 15374–15378. doi: 10.1073/pnas.0904306106
de Winter N. J., Claeys P. (2016). Micro X-ray fluorescence (μXRF) line scanning on Cretaceous rudist bivalves: A new method for reproducible trace element profiles in bivalve calcite. Sedimentology 64, 231–251. doi: 10.1111/sed.12299
de Winter N. J., Dämmer L. K., Falkenroth M., Reichart G.-J., Moretti S., Martínez-García A., et al. (2021). Multi-isotopic and trace element evidence against different formation pathways for oyster microstructures. Geochim. Cosmochim. Acta 308, 326–352. doi: 10.1016/j.gca.2021.06.012
de Winter N. J., Goderis S., Dehairs F., Jagt J. W., Fraaije R. H., Van Malderen S. J., et al. (2017b). Tropical seasonality in the late campanian (late cretaceous): Comparison between multiproxy records from three bivalve taxa from Oman. Palaeogeogr. Palaeoclimatol. Palaeoecol. 485, 740–760. doi: 10.1016/j.palaeo.2017.07.031
de Winter N. J., Killam D., Fröhlich L., de Nooijer L., Boer W., Schöne B. R., et al. (2022b). Ultradian rhythms in shell composition of photosymbiotic and non-photosymbiotic mollusks. EGUsphere 32, 1–61. doi: 10.5194/egusphere-2022-576
de Winter N., Sinnesael M., Makarona C., Vansteenberge S., Claeys P. (2017a). Trace element analyses of carbonates using portable and micro-X-ray fluorescence: Performance and optimization of measurement parameters and strategies. J. Anal. At. Spectrom. 32, 1211–1223. doi: 10.1039/C6JA00361C
de Winter N. J., Witbaard R., Kocken I. J., Müller I. A., Guo J., Goudsmit B., et al. (2022a). Temperature dependence of clumped isotopes (Δ47) in aragonite. Geophys. Res. Lett. 49, e2022GL099479. doi: 10.1029/2022GL099479
Dodd J. R. (1967). Magnesium and strontium in calcareous skeletons: a review. J. Paleontol. 41, 1313–1329.
Elliot M., Welsh K., Chilcott C., McCulloch M., Chappell J., Ayling B. (2009). Profiles of trace elements and stable isotopes derived from giant long-lived tridacna gigas bivalves: potential applications in paleoclimate studies. Palaeogeogr. Palaeoclimatol. Palaeoecol 280, 132–142. doi: 10.1016/j.palaeo.2009.06.007
Evans J. W. (1972). Tidal growth increments in the cockle clinocardium nuttalli. Science 176, 416–417. doi: 10.1126/science.176.4033.416
Fagerstrom J. A. (1987). The evolution of reef communities (New York, NY, USA: John Wiley and Sons Inc.).
Fehrenbacher J. S., Spero H. J., Russell A. D., Vetter L., Eggins S. (2015). Optimizing LA-ICP-MS analytical procedures for elemental depth profiling of foraminifera shells. Chem. Geol. 407–408, 2–9. doi: 10.1016/j.chemgeo.2015.04.007
Feng W., Casteel R. C., Banner J. L., Heinze-Fry A. (2014). Oxygen isotope variations in rainfall, drip-water and speleothem calcite from a well-ventilated cave in Texas, USA: Assessing a new speleothem temperature proxy. Geochim. Cosmochim. Acta 127, 233–250. doi: 10.1016/j.gca.2013.11.039
Fox E., Meyer E., Panasiak N., Taylor A. R. (2018). Calcein staining as a tool to investigate coccolithophore calcification. Front. Mar. Sci. 5. doi: 10.3389/fmars.2018.00326
Freitas P. S., Clarke L. J., Kennedy H. A., Richardson C. A. (2008). Inter-and intra-specimen variability masks reliable temperature control on shell Mg/Ca ratios in laboratory and field cultured mytilus edulis and pecten maximus (bivalvia). Biogeosciences 5, 531–572. doi: 10.5194/bg-5-1245-2008
Freitas P. S., Clarke L. J., Kennedy H., Richardson C. A. (2009). Ion microprobe assessment of the heterogeneity of Mg/Ca, Sr/Ca and Mn/Ca ratios in pecten maximus and mytilus edulis (bivalvia) shell calcite precipitated at constant temperature. Biogeosciences 6, 1267. doi: 10.5194/bg-6-1209-2009
Fröhlich L., Siebert V., Walliser E. O., Thébault J., Jochum K. P., Chauvaud L., et al. (2022). Ba/Ca profiles in shells of pecten maximus – a proxy for specific primary producers rather than bulk phytoplankton. Chem. Geol. 593, 120743. doi: 10.1016/j.chemgeo.2022.120743
Füllenbach C. S., Schöne B. R., Mertz-Kraus R. (2015). Strontium/lithium ratio in aragonitic shells of cerastoderma edule (Bivalvia)–a new potential temperature proxy for brackish environments. Chem. Geol. 417, 341–355. doi: 10.1016/j.chemgeo.2015.10.030
Garbe-Schönberg D., Müller S. (2014). Nano-particulate pressed powder tablets for LA-ICP-MS. J. Anal. At. Spectrom. 29, 990–1000. doi: 10.1039/C4JA00007B
Geerken E., de Nooijer L., Toyofuku T., Roepert A., Middelburg J. J., Kienhuis M. V. M., et al. (2022). High precipitation rates characterize biomineralization in the benthic foraminifer Ammonia beccarii. Geochim. Cosmochim. Acta 318, 70–82. doi: 10.1016/j.gca.2021.11.026
Gerringer M. E., Andrews A. H., Huss G. R., Nagashima K., Popp B. N., Linley T. D., et al. (2018). Life history of abyssal and hadal fishes from otolith growth zones and oxygen isotopic compositions. Deep Sea Res. Part Oceanogr. Res. Pap. 132, 37–50. doi: 10.1016/j.dsr.2017.12.002
Gillikin D. P., Lorrain A., Navez J., Taylor J. W., André L., Keppens E., et al. (2005). Strong biological controls on Sr/Ca ratios in aragonitic marine bivalve shells. Geochem. Geophys. Geosystems 6, 1–16. doi: 10.1029/2004GC000874
Guillong M., Meier D. L., Allan M. M., Heinrich C. A., Yardley B. W. D. (2008). SILLS: A Matlab-based program for the reduction of laser ablation ICP–MS data of homogenous materials and inclusions. Mineral. Assoc. Can. Short Course 40, 328–333. Vancouver, B.C., Canada.
Gutiérrez-Zugasti I. (2011). Coastal resource intensification across the pleistocene–Holocene transition in northern Spain: Evidence from shell size and age distributions of marine gastropods. Quat. Int. 244, 54–66. doi: 10.1016/j.quaint.2011.04.040
Hagiwara S., Byerly L. (1981). Calcium channel. Annu. Rev. Neurosci. 4, 69–125. doi: 10.1016/0166-2236(83)90084-X
Hanshaw B. B., Back W. (1979). Major geochemical processes in the evolution of carbonate–aquifer systems. J. Hydrol., 43, 287–312. doi: 10.1016/0022-1694(79)90177-X
Haour A., Christie A., Jaufar S. (2016). “Tracking the cowrie shell: Excavations in the Maldives,” in Nyame akuma, (Houston, Texas, United States) vol. 85. , 69–77. Available at: https://safa.rice.edu/Default.aspx?id=2147485729.
Henke B. L., Gullikson E. M., Davis J. C. (1993). X-Ray interactions: Photoabsorption, scattering, transmission, and reflection at e = 50-30,000 eV, z = 1-92. At. Data Nucl. Data Tables 54, 181–342. doi: 10.1006/adnd.1993.1013
Henkes G. A., Passey B. H., Grossman E. L., Shenton B. J., Yancey T. E., Pérez-Huerta A. (2018). Temperature evolution and the oxygen isotope composition of phanerozoic oceans from carbonate clumped isotope thermometry. Earth Planet. Sci. Lett. 490, 40–50. doi: 10.1016/j.epsl.2018.02.001
Hilbish T. J. (1986). Growth trajectories of shell and soft tissue in bivalves: Seasonal variation in mytilus edulis l. J. Exp. Mar. Biol. Ecol. 96, 103–113. doi: 10.1016/0022-0981(86)90236-4
Hippler D., Witbaard R., van Aken H. M., Buhl D., Immenhauser A. (2013). Exploring the calcium isotope signature of arctica islandica as an environmental proxy using laboratory- and field-cultured specimens. Palaeogeogr. Palaeoclimatol. Palaeoecol. 373, 75–87. doi: 10.1016/j.palaeo.2011.11.015
Holá M., Kalvoda J., Nováková H., Škoda R., Kanický V. (2011). Possibilities of LA-ICP-MS technique for the spatial elemental analysis of the recent fish scales: Line scan vs. depth profiling. Appl. Surf. Sci. 257, 1932–1940. doi: 10.1016/j.apsusc.2010.09.029
Houlbrèque F., Meibom A., Cuif J.-P., Stolarski J., Marrocchi Y., Ferrier-Pagès C., et al. (2009). Strontium-86 labeling experiments show spatially heterogeneous skeletal formation in the scleractinian coral porites porites. Geophys. Res. Lett. 36, 1–5. doi: 10.1029/2008GL036782
Huyghe D., de Rafelis M., Ropert M., Mouchi V., Emmanuel L., Renard M., et al. (2019). New insights into oyster high-resolution hinge growth patterns. Mar. Biol. 166, 48. doi: 10.1007/s00227-019-3496-2
Huyghe D., Lartaud F., Emmanuel L., Merle D., Renard M. (2015). Palaeogene climate evolution in the Paris basin from oxygen stable isotope (δ18O) compositions of marine molluscs. J. Geol. Soc 172, 576–587. doi: 10.1144/jgs2015-016
Inoue M., Nohara M., Okai T., Suzuki A., Kawahata H. (2004). Concentrations of trace elements in carbonate reference materials coral JCp-1 and giant clam JCt-1 by inductively coupled plasma-mass spectrometry. Geostand. Geoanalytical Res. 28, 411–416. doi: 10.1111/j.1751-908X.2004.tb00759.x
Izgec O., Demiral B., Bertin H., Akin S. (2008). CO2 injection into saline carbonate aquifer formations I: laboratory investigation. Transp. Porous Media 72, 1–24. doi: 10.1007/s11242-007-9132-5
Jablonski A., Powell C. J. (2020). Effective attenuation lengths for different quantitative applications of X-ray photoelectron spectroscopy. J. Phys. Chem. Ref. Data 49, 033102. doi: 10.1063/5.0008576
Jochum K. P., Garbe-Schönberg D., Veter M., Stoll B., Weis U., Weber M., et al. (2019). Nano-powdered calcium carbonate reference materials: Significant progress for microanalysis? Geostand. Geoanalytical Res. 43, 595–609. doi: 10.1111/ggr.12292
Jochum K. P., Weis U., Stoll B., Kuzmin D., Yang Q., Raczek I., et al. (2011). Determination of reference values for NIST SRM 610–617 glasses following ISO guidelines. Geostand. Geoanalytical Res. 35, 397–429. doi: 10.1111/j.1751-908X.2011.00120.x
Jochum K. P., Willbold M., Raczek I., Stoll B., Herwig K. (2005). Chemical characterisation of the USGS reference glasses GSA-1G, GSC-1G, GSD-1G, GSE-1G, BCR-2G, BHVO-2G and BIR-1G using EPMA, ID-TIMS, ID-ICP-MS and LA-ICP-MS. Geostand. Geoanalytical Res. 29, 285–302. doi: 10.1111/j.1751-908X.2005.tb00901.x
Kent R. W. (1992). Making dead oysters talk: Techniques for analyzing oysters from archaeological sites: Maryland historical trust, historic st. mary's city, Jefferson Patterson park and museum (Crownsville, MD: Maryland Historical and Cultural Publications).
Kraan C., Dekinga A., Piersma T. (2011). Now an empty mudflat: past and present benthic abundances in the western Dutch wadden Sea. Helgol. Mar. Res. 65, 51–58. doi: 10.1007/s10152-010-0200-9
Kuzyakov Y., Shevtzova E., Pustovoytov K. (2006). Carbonate re-crystallization in soil revealed by 14C labeling: Experiment, model and significance for paleo-environmental reconstructions. Geoderma 131, 45–58. doi: 10.1016/j.geoderma.2005.03.002
Lartaud F., De Rafélis M., Ropert M., Emmanuel L., Geairon P., Renard M. (2010). Mn Labelling of living oysters: artificial and natural cathodoluminescence analyses as a tool for age and growth rate determination of c. gigas (Thunberg 1793) shells. Aquaculture 300, 206–217. doi: 10.1016/j.aquaculture.2009.12.018
Lear C. H., Elderfield H., Wilson P. A. (2003). A Cenozoic seawater Sr/Ca record from benthic foraminiferal calcite and its application in determining global weathering fluxes, earth planet. Sci. Lett. 208, 69–84. doi: 10.1016/S0012-821X(02)01156-1
Leips J., Baril C. T., Rodd F. H., Reznick D. N., Bashey F., Visser G. J., et al. (2001). The suitability of calcein to mark poeciliid fish and a new method of detection. Trans. Am. Fish. Soc 130, 501–507. doi: 10.1577/1548-8659(2001)130<0501:TSOCTM>2.0.CO;2
Lough J. M., Barnes D. J. (2000). Environmental controls on growth of the massive coral porites. J. Exp. Mar. Biol. Ecol. 245, 225–243. doi: 10.1016/S0022-0981(99)00168-9
Magnabosco G., Polishchuk I., Erez J., Fermani S., Pokroy B., Falini G. (2018). Insights on the interaction of calcein with calcium carbonate and its implications in biomineralization studies. CrystEngComm 20, 4221–4224. doi: 10.1039/C8CE00853A
Marali S., Schöne B. R., Mertz-Kraus R., Griffin S. M., Wanamaker A. D., Butler P. G., et al. (2017). Reproducibility of trace element time-series (Na/Ca, Mg/Ca, Mn/Ca, Sr/Ca, and Ba/Ca) within and between specimens of the bivalve arctica islandica – a LA-ICP-MS line scan study. Palaeogeogr. Palaeoclimatol. Palaeoecol. 484, 109–128. doi: 10.1016/j.palaeo.2016.11.024
Marchegiano M., Francke A., Gliozzi E., Wagner B., Ariztegui D. (2019). High-resolution palaeohydrological reconstruction of central Italy during the Holocene. Holocene 29, 481–492. doi: 10.1177/0959683618816465
Markuszewski R. (1979). Structure, fluorescence, and chelating properties of calcein (Iowa City: University of Iowa). Theses and Dissertations. doi: 10.31274/rtd-180813-2317
Mat A. M., Sarrazin J., Markov G. V., Apremont V., Dubreuil C., Eché C., et al. (2020). Biological rhythms in the deep-sea hydrothermal mussel bathymodiolus azoricus. Nat. Commun. 11, 3454. doi: 10.1038/s41467-020-17284-4
Milano S., Schöne B. R., Witbaard R. (2017). Changes of shell microstructural characteristics of cerastoderma edule (Bivalvia) — a novel proxy for water temperature. Palaeogeogr. Palaeoclimatol. Palaeoecol. 465, 395–406. doi: 10.1016/j.palaeo.2015.09.051
Moss D. K., Ivany L. C., Jones D. S. (2021). Fossil bivalves and the sclerochronological reawakening. Paleobiology 47, 551–573. doi: 10.1017/pab.2021.16
Mouchi V., De Rafélis M., Lartaud F., Fialin M., Verrecchia E. (2013). Chemical labelling of oyster shells used for time-calibrated high-resolution Mg/Ca ratios: a tool for estimation of past seasonal temperature variations. Palaeogeogr. Palaeoclimatol. Palaeoecol. 373, 66–74. doi: 10.1016/j.palaeo.2012.05.023
Mourguiart Ph., Carbonel P. (1994). A quantitative method of palaeolake-level reconstruction using ostracod assemblages: an example from the Bolivian altiplano. Hydrobiologia 288, 183–193. doi: 10.1007/BF00006241
Nehrke G., Keul N., Langer G., de Nooijer L. J., Bijma J., Meibom A. (2013). A new model for biomineralization and trace-element signatures of foraminifera tests. Biogeosciences 10, 6759–6767. doi: 10.5194/bg-10-6759-2013
Nikolayev D., Lychagina T., Pakhnevich A. (2019). Experimental neutron pole figures of minerals composing the bivalve mollusc shells. SN Appl. Sci. 1, 344. doi: 10.1007/s42452-019-0355-1
Obelic B., Álvarez A., Argullós J., Piana E. L. (1998). “Determination of water palaeotemperature in the beagle channel (Argentina) during the last 6000 yr through stable isotope composition of mytilus edulis shells,” in Quaternary of south America and Antarctica peninsula 1998 (Abington-on-Thames, UK: Routledge, Taylor and Francis Group), ISBN: ISBN: 9780203741429.
Okai T., Suzuki A., Kawahata H., Terashima S., Imai N. (2002). Preparation of a new geological survey of Japan geochemical reference material: Coral JCp-1. Geostand. Newsl. 26, 95–99. doi: 10.1111/j.1751-908X.2002.tb00627.x
Page H. M., Hubbard D. M. (1987). Temporal and spatial patterns of growth in mussels mytilus edulis on an offshore platform: relationships to water temperature and food availability. J. Exp. Mar. Biol. Ecol. 111, 159–179. doi: 10.1016/0022-0981(87)90053-0
Pages 2k consortium. (2017). A global multiproxy database for temperature reconstructions of the common era. Sci. Data 4, 170088. doi: 10.1038/sdata.2017.88
Posenato R., Crippa G., de Winter N. J., Frijia G., Kaskes P. (2022). Microstructures and sclerochronology of exquisitely preserved lower Jurassic lithiotid bivalves: Paleobiological and paleoclimatic significance, palaeogeogr. Palaeoclimatol. Palaeoecol. 602, 111162. doi: 10.1016/j.palaeo.2022.111162
Quinby-Hunt M. S., Turekian K. K. (1983). Distribution of elements in sea water. Eos Trans. Am. Geophys. Union 64, 130–130. doi: 10.1029/EO064i014p00130
Richardson C. A., Collis S. A., Ekaratne K., Dare P., Key D. (1993). The age determination and growth rate of the European flat oyster, ostrea edulis , in British waters determined from acetate peels of umbo growth lines. ICES J. Mar. Sci. 50, 493–500. doi: 10.1006/jmsc.1993.1052
Richardson C. A., Crisp D. J., Runham N. W., Gruffydd L. D. (1980). The use of tidal growth bands in the shell of Cerastoderma edule to measure seasonal growth rates under cool temperate and sub-arctic conditions. J. Mar. Biol. Assoc. U. K. 60, 977–989. doi: 10.1017/S002531540004203X
Riisgaord H. U., Boettiger L., Pleissner D. (2012). Effect of salinity on growth of mussels, Mytilus edulis, with special reference to great belt (Denmark). Open J. Mar. Sci. 02, 167. doi: 10.4236/ojms.2012.24020
Saito A., Kagi H., Marugata S., Komatsu K., Enomoto D., Maruyama K., et al. (2020). Incorporation of incompatible strontium and barium ions into calcite (CaCO3) through amorphous calcium carbonate. Minerals 10, 270. doi: 10.3390/min10030270
Sampei Y., Matsumoto E., Dettman D. L., Tokuoka T., Abe O. (2005). Paleosalinity in a brackish lake during the Holocene based on stable oxygen and carbon isotopes of shell carbonate in nakaumi lagoon, southwest Japan. Palaeogeogr. Palaeoclimatol. Palaeoecol. 224, 352–366. doi: 10.1016/j.palaeo.2005.04.020
Sánchez-Román M., Vasconcelos C., Schmid T., Dittrich M., McKenzie J. A., Zenobi R., et al. (2008). Aerobic microbial dolomite at the nanometer scale: Implications for the geologic record. Geology 36, 879–882. doi: 10.1130/G25013A.1
Sano Y., Kobayashi S., Shirai K., Takahata N., Matsumoto K., Watanabe T., et al. (2012). Past daily light cycle recorded in the strontium/calcium ratios of giant clam shells. Nat. Commun. 3, 761. doi: 10.1038/ncomms1763
Schindelin J., Arganda-Carreras I., Frise E., Kaynig V., Longair M., Pietzsch T., et al. (2012). Fiji: an open-source platform for biological-image analysis. Nat. Methods 9, 676–682. doi: 10.1038/nmeth.2019
Schöne B. R., Rodland D. L., Fiebig J., Oschmann W., Goodwin D., Flessa K. W., et al. (2006). Reliability of multitaxon, multiproxy reconstructions of environmental conditions from accretionary biogenic skeletons. J. Geol. 114, 267–285. doi: 10.1086/501219
Smaal A. C., Lucas L. (2000). Regulation and monitoring of marine aquaculture in the Netherlands. J. Appl. Ichthyol. 16, 187–191. doi: 10.1046/j.1439-0426.2000.00266.x
Song H., Tong J., Tian L., Song H., Qiu H., Zhu Y., et al. (2014). Paleo-redox conditions across the permian-Triassic boundary in shallow carbonate platform of the nanpanjiang basin, south China. Sci. China Earth Sci. 57, 1030–1038. doi: 10.1007/s11430-014-4843-2
Stoll H. M., Klaas C. M., Probert I., Encinar J. R., Garcia Alonso J. I. (2002). Calcification rate and temperature effects on Sr partitioning in coccoliths of multiple species of coccolithophorids in culture. Glob. Planet. Change 34, 153–171. doi: 10.1016/S0921-8181(02)00112-1
Stoll H. M., Schrag D. P. (2001). Sr/Ca variations in Cretaceous carbonates: relation to productivity and sea level changes. Palaeogeogr. Palaeoclimatol. Palaeoecol. 168, 311–336. doi: 10.1016/S0031-0182(01)00205-X
Surge D., Lohmann K. C., Dettman D. L. (2001). Controls on isotopic chemistry of the American oyster, crassostrea virginica: implications for growth patterns. Palaeogeogr. Palaeoclimatol. Palaeoecol. 172, 283–296. doi: 10.1016/S0031-0182(01)00303-0
Tran E. L., Reimus P., Klein-BenDavid O., Teutsch N., Zavarin M., Kersting A. B., et al. (2020). Mobility of radionuclides in fractured carbonate rocks: Lessons from a field-scale transport experiment. Environ. Sci. Technol. 54, 11249–11257. doi: 10.1021/acs.est.0c03008
Ullmann C. V., Böhm F., Rickaby R. E., Wiechert U., Korte C. (2013). The giant pacific oyster (Crassostrea gigas) as a modern analog for fossil ostreoids: isotopic (Ca, O, c) and elemental (Mg/Ca, Sr/Ca, Mn/Ca) proxies. Geochem. Geophys. Geosystems 14, 4109–4120. doi: 10.1002/ggge.20257
Valchev B. (2003). On the potential of small benthic foraminifera as paleoecological indicators: recent advances. Ann. UMG 46, 51–56.
Van Aken H. M. (2003). 140 years of daily observations in a tidal inlet (Marsdiep). ICES Mar. Sci. Symp 219, 359–361.
Van der Weijden C. H. (2002). Pitfalls of normalization of marine geochemical data using a common divisor. Mar. Geol. 184, 167–187. doi: 10.1016/S0025-3227(01)00297-3
Vansteenberge S., de Winter N. J., Sinnesael M., Xueqin Z., Verheyden S., Claeys P. (2020). Benchtop μXRF as a tool for speleothem trace elemental analysis: Validation, limitations and application on an eemian to early weichselian (125–97ka) stalagmite from Belgium. Palaeogeogr. Palaeoclimatol. Palaeoecol. 538, 109460. doi: 10.1016/j.palaeo.2019.109460
Vellekoop J., Kaskes P., Sinnesael M., Huygh J., Déhais T., Jagt J. W. M., et al. (2022). A new age model and chemostratigraphic framework for the maastrichtian type area (southeastern Netherlands, northeastern Belgium). Newsl. Stratigr. 55, 479–501. doi: 10.1127/nos/2022/0703
Wassenburg J. A., Scholz D., Jochum K. P., Cheng H., Oster J., Immenhauser A., et al. (2016). Determination of aragonite trace element distribution coefficients from speleothem calcite–aragonite transitions. Geochim. Cosmochim. Acta 190, 347–367. doi: 10.1016/j.gca.2016.06.036
Wasylenki L. E., Dove P. M., Wilson D. S., De Yoreo J. J. (2005). Nanoscale effects of strontium on calcite growth: An in situ AFM study in the absence of vital effects. Geochim. Cosmochim. Acta 69, 3017–3027. doi: 10.1016/j.gca.2004.12.019
Wichern N. M. A., de Winter N. J., Johnson A. L. A., Goolaerts S., Wesselingh F., Hamers M. F., et al. (2022). The fossil bivalve <em>Angulus benedeni benedeni</em>: a potential seasonally resolved stable isotope-based climate archive to investigate pliocene temperatures in the southern north Sea basin. EGUsphere, 1–53. doi: 10.5194/egusphere-2022-951
Wilmeth D. T., Johnson H. A., Stamps B. W., Berelson W. M., Stevenson B. S., Nunn H. S., et al. (2018). Environmental and biological influences on carbonate precipitation within hot spring microbial mats in little hot creek, CA. Front. Microbiol. 9. doi: 10.3389/fmicb.2018.01464
Wilson J. H. (1987). Environmental parameters controlling growth of ostrea edulis l. and pecten maximus l. in suspended culture. Aquaculture 64, 119–131. doi: 10.1016/0044-8486(87)90348-6
Keywords: mollusk (mollusc), growth experiment, trace element, shell, proxy development
Citation: de Winter NJ, van Sikkeleras S, Goudsmit-Harzevoort B, Boer W, de Nooijer L, Reichart G-J, Claeys P and Witbaard R (2023) Tracing timing of growth in cultured molluscs using strontium spiking. Front. Mar. Sci. 10:1157929. doi: 10.3389/fmars.2023.1157929
Received: 03 February 2023; Accepted: 14 March 2023;
Published: 05 April 2023.
Edited by:
Johan Schijf, University of Maryland, College Park, United StatesReviewed by:
Donna Surge, University of North Carolina at Chapel Hill, United StatesDavid Moss, Sam Houston State University, United States
Diana Thatcher, Iowa State University, United States
Copyright © 2023 de Winter, van Sikkeleras, Goudsmit-Harzevoort, Boer, de Nooijer, Reichart, Claeys and Witbaard. This is an open-access article distributed under the terms of the Creative Commons Attribution License (CC BY). The use, distribution or reproduction in other forums is permitted, provided the original author(s) and the copyright owner(s) are credited and that the original publication in this journal is cited, in accordance with accepted academic practice. No use, distribution or reproduction is permitted which does not comply with these terms.
*Correspondence: Niels J. de Winter, bi5qLmRlLndpbnRlckB2dS5ubA==