 Bingqing Liu1
 Eurico J. D’Sa2*
 Francesca Messina1
 Melissa M. Baustian3
 Kanchan Maiti2
 Victor H. Rivera-Monroy2
 Wei Huang4
 Ioannis Y. Georgiou1
- 1Department of Coastal Ecology, The Water Institute of the Gulf, Baton Rouge, LA, United States
- 2Department of Oceanography and Coastal Science, Louisiana State University, Baton Rouge, LA, United States
- 3U.S. Geological Survey, Wetland and Aquatic Research Center, Baton Rouge, LA, United States
- 4Climate Change Science Institute and Environmental Science Division, Oak Ridge National Lab, Oak Ridge, TN, United States
Transport of riverine and wetland-derived dissolved organic carbon (DOC) spanning tidal wetlands, estuaries, and continental shelf waters functionally connects terrestrial and aquatic carbon reservoirs, yet the magnitude and ecological significance of this variable and its spatiotemporal linkage remains uncertain for coastal deltaic regions, such as Mississippi River Delta Plain, which includes Mississippi (MR) and Atchafalaya (AR) rivers and estuaries with vast expanses of wetlands and coastal forests. We examined DOC dynamics and fluxes in this large river-dominated wetland-estuarine system for the period between 2019 and 2021 that included an extreme river flood event in 2019, two major hurricanes (Barry in 2019 and Ida in 2021), and cold front passage using an improved adaptive quasi-analytical algorithm (QAA-AD) applied to multi-satellite sensors (Sentinel 3A/B OLCI, Landsat-8/OLI and Sentinel-2A/B MSI) with varying spectral and spatial (10/30/300 m) resolutions. The DOC estimates from multi-satellite sensors in combination with water fluxes were used to assess DOC fluxes from two large rivers (MR and AR) and small channels across the delta plain. Overall, this system delivered a total of 6.7 Tg C yr-1 (1 Tg = 1012g) into the estuarine zone and the northern Gulf of Mexico (nGoM) during 2019. High DOC fluxes from the AR (1.3 Tg C yr-1) and MR (4.5 Tg C yr-1) were associated with the extreme flood event in 2019. Hurricanes that occurred in the study period also contributed to the wetland and estuarine DOC fluxes into continental shelf waters; for example, the passage of Hurricane Barry in July 2019, delivered over a 3-day period ~1.33 ×10⁹ g DOC from Barataria Basin into the nGoM. Sentinel 2-MSI land and water classification revealed that Hurricane Ida eroded a total of 1.34×10⁸ m2 of marshes in middle Barataria Basin, converting those habitats into open water with 3.0 m inundation depth and high DOC concentrations (16.4 mg L-1), a potentially large DOC source to the coastal waters. Overall, storms and flood events are major sources of DOC flux that facilitate transport of upstream carbon as well as transformation of carbon in the wetlands, through the conversion of vegetated wetland to open water.
1 Introduction
Dissolved organic carbon (DOC) accounts for the largest fraction of dissolved organic matter (DOM) and plays a critical role in the functioning of an ecosystem as it fuels aquatic food webs and serves as a key component of the carbon cycle due to its wide range of chemical reactivity (Jaffé et al., 2008; Spencer et al., 2012). Within the coastal zone, rivers, estuaries, and wetlands contribute to the transport and transformation of carbon as water flows drive carbon cycling across the terrestrial-aquatic continuum (Hedges et al., 1997; Ward et al., 2017; Bauer et al., 2013). Worldwide, rivers deliver approximately 0.25 to 0.36 Pg (1 Pg = 1015 g) DOC to the global ocean each year (Bianchi and Allison, 2009; Raymond and Spencer, 2015). This riverine transport of terrestrial carbon strongly influences coastal biogeochemical processes and carbon budgets (Ward et al., 2017). Further, terrestrial carbon reaches the continental shelf where it can be entrained in large scale ocean circulation for assimilation or potential long-term storage in deep ocean waters (Opsahl and Benner, 1997). While large rivers contribute significantly to global DOC export fluxes (Spencer et al., 2013; Cai et al., 2015), ecotone regions like lagoon-estuarine systems and wetlands can also export large quantities of DOC to the coastal ocean (Mannino et al., 2016; Signorini et al., 2019; Cao and Tzortziou, 2021).
Terrestrial DOC flowing into estuaries can be further transformed or removed through complex processes (e.g., biological uptake and decomposition, photodegradation, flocculation, and burial) prior to being exported to the coastal ocean (Uher et al., 2001; Hernes & Benner, 2003; Moody and Worrall, 2017). Coastal systems are often fringed with tidal wetlands (McLusky & Elliott, 2004), where tidal-driven outwelling contributes DOC to the coastal ocean (Bogard et al., 2020). Recent studies on wetland-estuary coastal carbon budgets along the East Coast of U.S. estimated that tidal wetlands can contribute up to 33 ± 8% of the organic carbon into estuaries via tidal water exchanges during a tidal cycle (Cai, 2011; Herrmann et al., 2015; Najjar et al., 2018; Windham-Myers et al., 2018). Further, a large fraction of wetland-derived DOC entering estuaries is more resistant to microbial degradation with higher molecular weight compared to phytoplankton-derived DOC (Tzortziou et al., 2008; Baustian et al., 2021), thus increasing its longevity and likelihood of transport to the coastal ocean. However, the carbon budget at the land/coastal ocean interface has been poorly quantified due to the complex physical and biogeochemical processes at this interface.
The Mississippi (MR) and Atchafalaya (AR) rivers are globally among the highest loading due to its large watershed extension and extensive wetland spatial distribution. The MR contributes about 0.8% of the global riverine flux of DOC (Raymond and Spencer, 2015) and potentially exports ~3.95 Tg C to the northern Gulf of Mexico (nGoM) during high flow conditions as estimated in the period 2015-2018 (Reiman and Xu, 2019). Additionally, these highly productive delta-estuarine systems (e.g., Barataria Basin, and Terrebonne Basin) are losing wetlands due to both anthropogenic (e.g., artificial canals) and natural (e.g., sea level rise, storms and hurricanes) disturbances. To restore wetlands and to prevent flooding, freshwater diversions from MR (e.g., Davis Pond and Caernarvon Diversions, Bonnet Carré Spillway) were constructed to re-introduce riverine water rich in sediments and nutrients; therefore, carbon transformations and pathways are more complex in this highly modified coastal region (Bianchi, 2011). Further, the role of nutrients and organic carbon cycling of these estuarine systems on hypoxia along the Louisiana coast (one of the largest in the world) has been debated (Bianchi et al., 2010; Das et al., 2011). The classic concept that nutrient-rich freshwaters from the Mississippi River stimulates algal bloom leading to the development of large recurring hypoxic events is often applied to this region (Rabalais et al., 2002). Though the contribution of carbon by the Barataria estuary has been found to be relatively small compared to the Mississippi River (Das et al., 2011), it was nonetheless noted that episodic storm events on carbon export were not considered in the study. Bianchi et al. (2009) reported that DOC from estuaries and marshes represent significant sources to the inner Louisiana shelf (surface and bottom waters), which could fuel hypoxia in certain regions of the shelf. Although attempts have been made to determine carbon fluxes and estimate carbon budgets in this coastal ecosystem (Windham-Myers et al., 2018; Arellano et al., 2019), constraining carbon budgets is complicated by increasing anthropogenic impacts, climate change and variability linked to extreme events (e.g., droughts, precipitation and hurricanes) (Bianchi et al., 2004; Bianchi et al., 2009; Tao et al., 2014; Lønborg et al., 2020).
A potential consequence of climate change is increased extreme precipitation events and the frequency and intensity of hurricanes (Lehman et al., 2015; Kossin et al., 2017). The lower MR watershed has been impacted by increasing extreme precipitation since 2000, thus causing higher annual nitrogen load (~30%) to the coastal zone in years with extreme river flow when compared to the long-term median (Lu et al., 2020). However, there is still a limited understanding of how carbon transport affects water quality and carbon cycling in the nGoM, especially during high river flood events. It is expected that this impact will be exacerbated further by changes in the local hydrology and hydroperiod represented by extensive channels, navigational outlets, existing freshwater diversions and future sediment diversions across the Louisiana delta plain. Furthermore, the nGoM has been regularly impacted by hurricanes and only few studies have evaluated their impacts on coastal carbon cycling (Chambers et al., 2007; Dahal et al., 2014; D’Sa et al., 2018; D’Sa et al., 2019; Yan et al., 2020). During extreme high-energy events, storm surge, marsh inundation, and water exchange between coastal systems and the ocean is higher, often transporting increased terrestrial DOC into the coastal ocean over relatively short time periods with implications to coastal biogeochemical processes (Huntington et al., 2016; Hounshell et al., 2019). In addition, marsh plant mortality and soil carbon loss from hurricane-induced marsh collapse can be decomposed to greenhouse gases (GHGs) to the atmosphere, and part can be buried, or lost as DOC and DIC in aquatic pools (Lane et al., 2016; Stagg et al., 2021). This is especially important under future climate scenarios, in which, extreme weather events are expected to increase (Seneviratne et al., 2012; Kunkel et al., 2022; Baustian et al., 2023).
The spatial and temporal covariations between DOC concentration and water flow (e.g., both across the mouth of an estuary and freshwater discharge into estuaries) regulate net carbon fluxes among wetlands, estuaries, and the coastal ocean (Kolka et al., 2008; Mannino et al., 2016; Signorini et al., 2019). However, continuous field observations of DOC fluxes are generally not practical at regional scales since it requires complex and expensive field sampling effort and equipment deployments to quantify water flow and DOC concentrations. Remote sensing has been contributing to more accurate estimates of DOC fluxes by alleviating these spatiotemporal challenges (Joshi et al., 2017; D’Sa et al., 2018; D’Sa et al., 2019; Signorini et al., 2019). Colored dissolved organic matter (CDOM), the optically active DOM constituent which strongly absorbs in the UV-blue part of the electromagnetic spectrum, has been used to map the CDOM absorption coefficient, ag(λ), remotely from satellite data based on empirical regional algorithms (D’Sa et al., 2006; Tehrani et al., 2013; Kutser et al., 2016; Liu et al., 2019a), and semi-analytical models (Lee et al., 2007; D’Sa et al., 2018; D’Sa et al., 2019). CDOM absorption coefficients between 300 and 440 nm have been frequently considered as a reliable proxy for DOC in various empirical models developed for coastal areas (Del Castillo & Miller, 2008; Tehrani et al., 2013; Fichot et al., 2014; Liu et al., 2019a; Cao and Tzortziou, 2021). To estimate the potential spatiotemporal magnitude of DOC fluxes from rivers and tidal wetlands to estuarine-coastal carbon pools, reliable estimates of DOC concentrations across multiple satellite sensors are needed to increase the spatiotemporal resolutions of DOC observations in highly dynamic fluvial–marine transition zones. Recent studies have demonstrated the ability of Ocean and Land Color Instrument (OLCI) on Sentinel-3 to monitor the bio-optical characteristic in estuarine-coastal regions with its wide swath (~1270 km), medium spatial (300 m) and temporal resolution (revisit every 3 days) (Toming et al., 2017; Liu et al., 2021). Further, tandem satellite sensors, such as Sentinel-2A/2B and Landsat-8/9 can offer a two to three-day revisit (Pahlevan et al., 2019) at high spatial resolution (10 to 60 m); this capability potentially allows an improved long-term monitoring to determine the controlling role of intense, episodic forcing events and regular ebb/flood tidal cycles on DOC dynamics across the wetland-estuary ecosystem (Cao and Tzortziou, 2021).
Here, we report on a comprehensive study of DOC dynamics along the MR delta plain including adjacent continental shelf waters. This study combined direct field measurements in 2019 and multi-scale satellite imagery between 2019 and 2021 that included extreme events (e.g., river flooding, hurricanes and cold fronts). The major goals of this study are: i) describe an improved estuarine-tuned quasi-analytical algorithm (QAA-AD; Joshi and D’Sa, 2018) used in combination with empirical relationships to estimate CDOM absorption and DOC concentrations in a turbid estuarine-ocean continuum using multi-satellite sensors (Sentinel 3-OLCI, Landsat 8/9-OLI and Sentinel 2-MSI), ii) examine CDOM optical properties (absorption coefficients and spectral slope) and DOC dynamics in waters impacted by the 2019 MR and AR flood event, iii) estimate DOC fluxes from large rivers (e.g., MR and AR), small channels adjacent to tidal wetlands and inlets connecting estuaries to the nGoM in an extreme flood year (2019), and iv) to assess the impact of hurricanes on estuarine DOC dynamics and fluxes.
2 Data and method
2.1 Study area
The MR watershed is the fourth largest (10,359 km2) in the world that delivers nutrient- and sediment-rich freshwaters from 40% of the continental U.S. (Kesel, 1989). The MR is part of the delta plain in coastal Louisiana, where the delta cycle and dynamic geomorphic changes result in a diversity of lagoon, bays and estuarine-coastal systems characterized by high net primary productivity in the nGoM (Figure 1). These coastal systems are shallow and inhabited by extensive marshes that are hydrologically connected to the nGoM through tidal channels and tidal inlets of different dimensions along new and drowned delta lobes as part of the active delta cycle (Figure 1). The Louisiana delta plain is under significant and sustained human- and climate-driven threats that have contributed to wetland loss at a rate of 75 km2 yr-1 (Jankowski et al., 2017). Additionally, this region is strongly impacted by hurricanes and frequent cold fronts among other events (Georgiou et al., 2005; Howes et al., 2010). The study area is characterized by salinity gradient along a continuum of river-estuarine-coastal system that includes two large rivers (MR and AR; Liang et al., 2021) and four large estuaries (Breton-Chandeleur Sound, Lake Pontchartrain, Terrebonne and Barataria Basins, and Atchafalaya River Delta Estuary; Figure 1); these systems seasonally receive freshwater from the MR and AR directly or through small natural channels and man-made diversions.
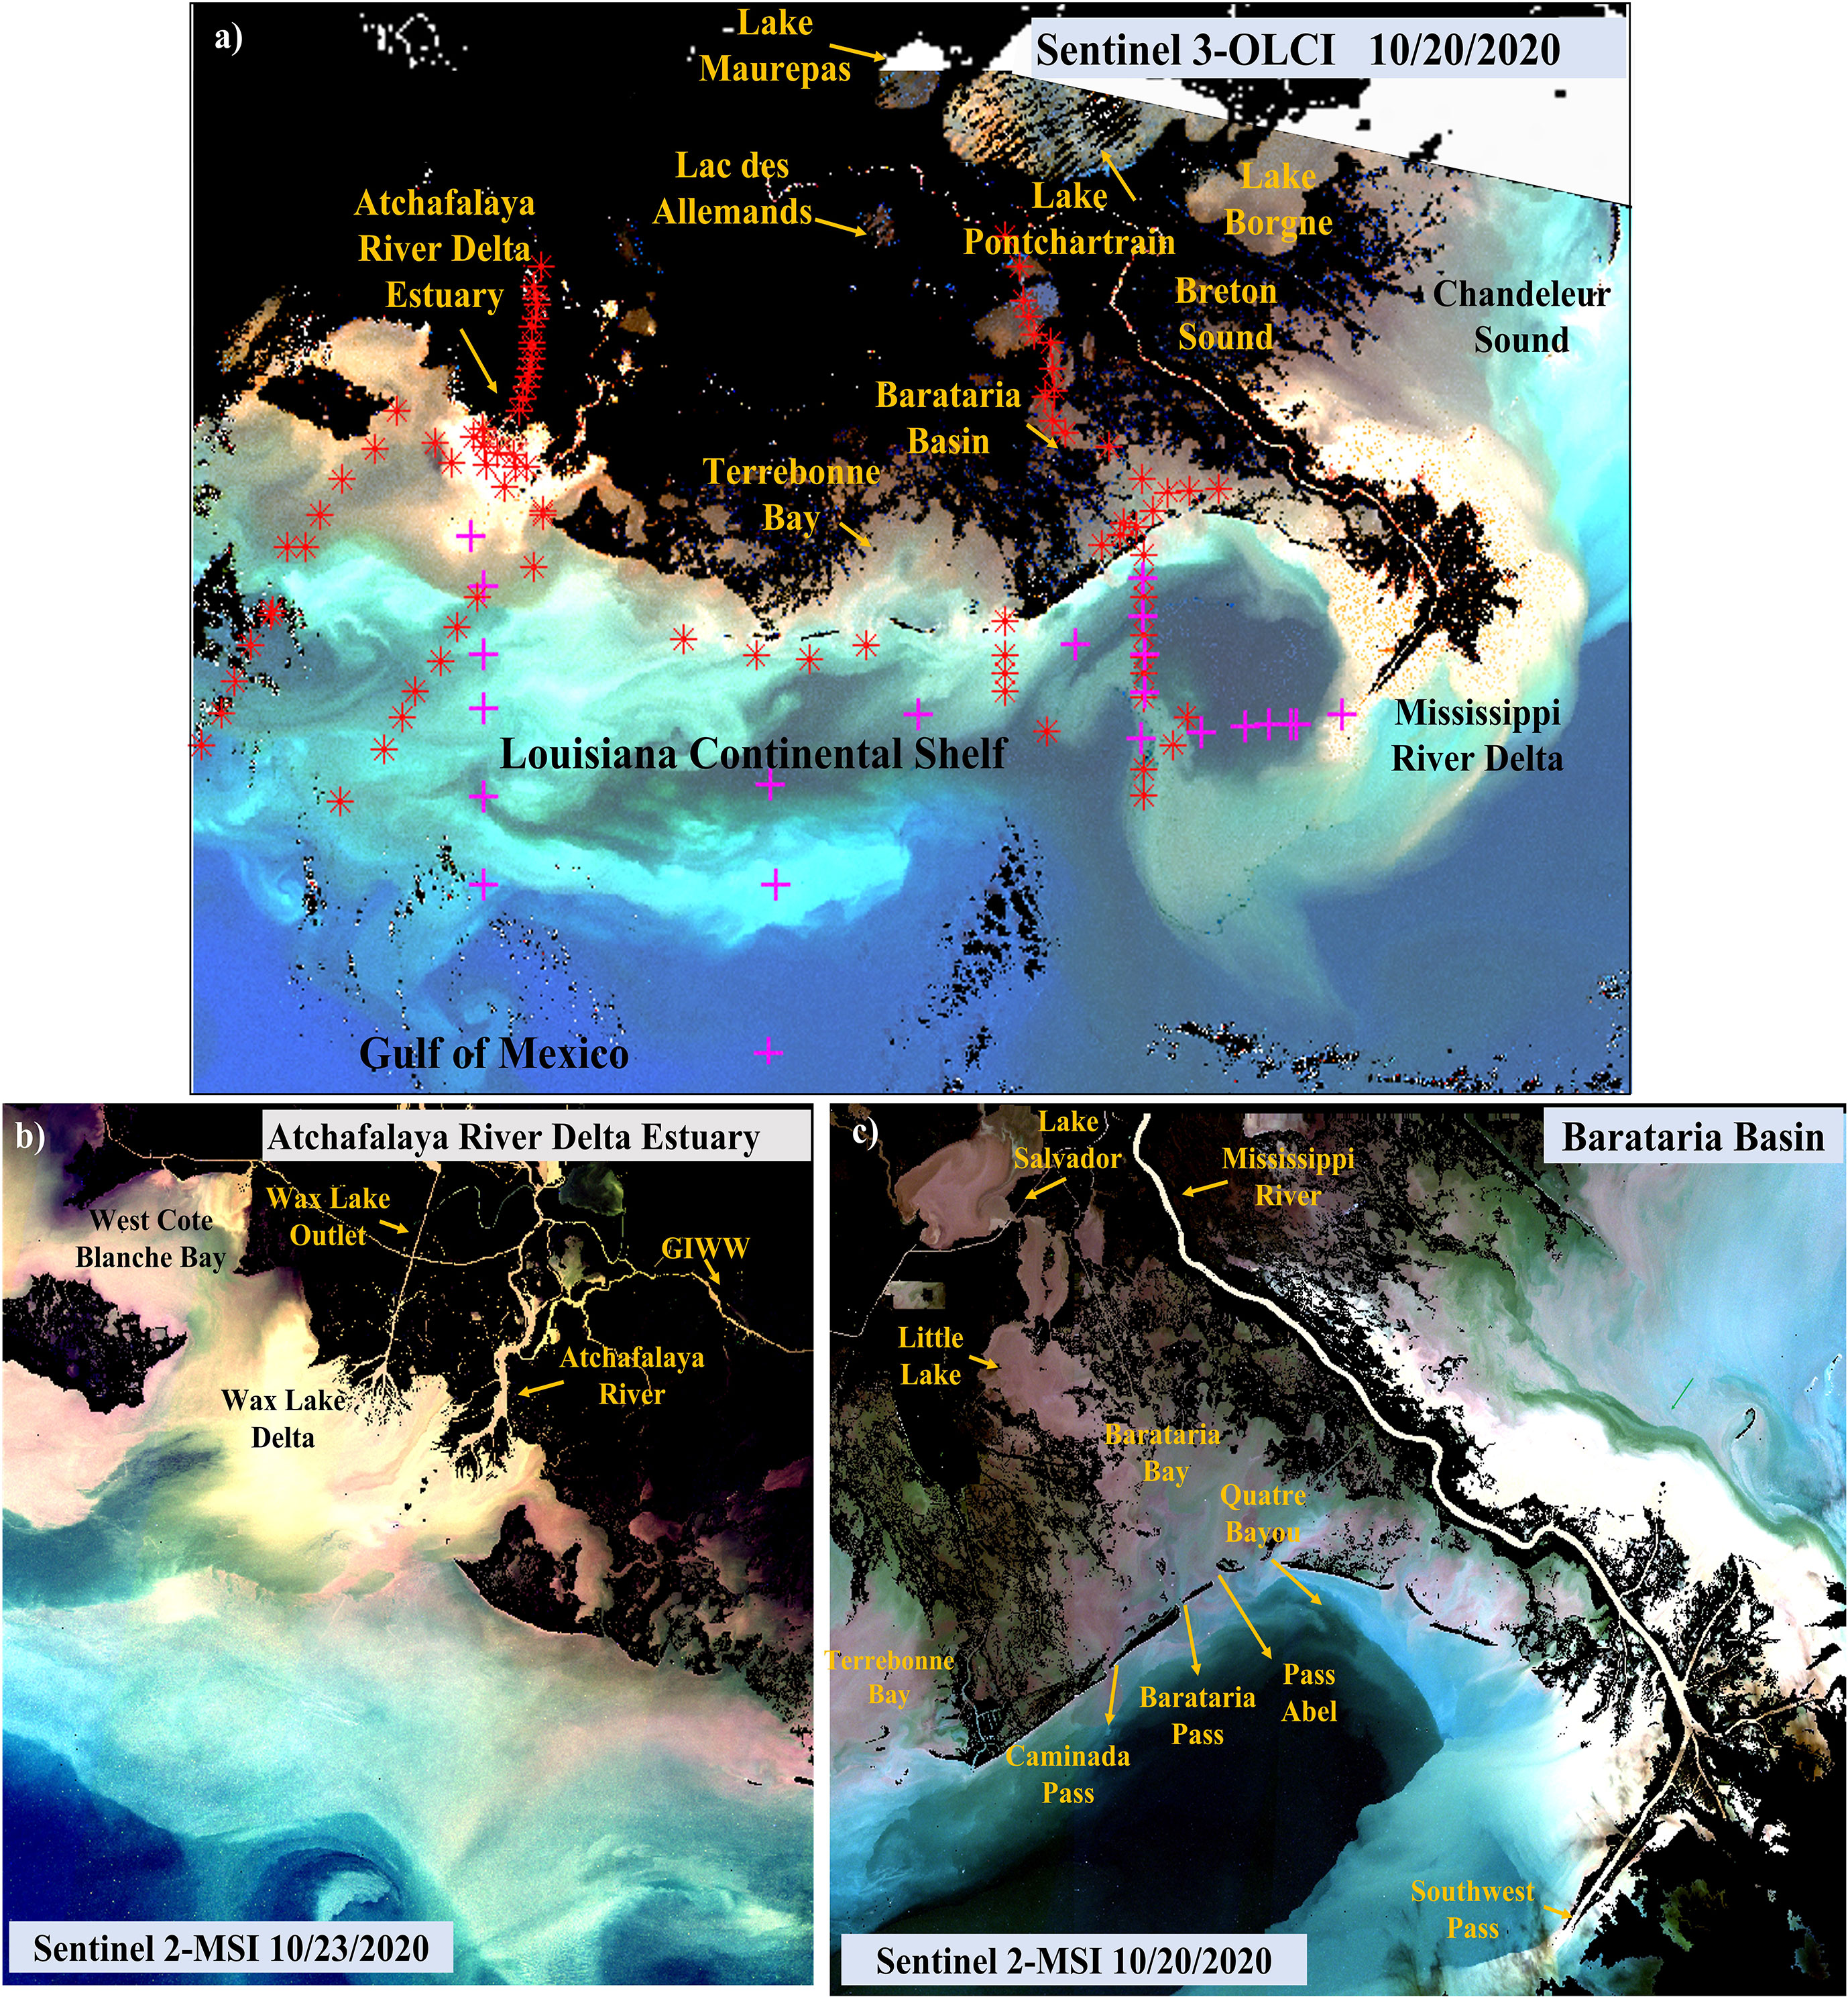
Figure 1 (A) Sentinel 3A-OLCI image acquired on 20 October 2020 of the Mississippi-Atchafalaya River deltaic region showing locations of sampling sites. Sentinel 2-MSI images with 10 m resolution of (B) Atchafalaya River Delta Estuary (ARDE) and (C) Barataria Basin and shelf. In situ sampling symbols: red stars – estuarine-coastal waters; pink pluses – Louisiana coast with R/V Pelican).
The Atchafalaya River Delta Estuary (ARDE) is a shallow and fluvially-dominated system mainly influenced by the AR and the Wax Lake Outlet (WLO), which is a dredged canal west of the AR delta (Roberts and Doty, 2015). With constant delivery of sediment into basin, ARDE has been the only instance of land-building area in the northern Gulf with growing deltas in Atchafalaya Bay and Wax Lake (nearly 5000 km2) since 1984 (NASA, 2015). The Gulf Intracoastal Waterway cuts through the WLO and AR and delivers river water into Barataria Basin (Swarzenski and Perrien, 2015; Sweet et al., 2022).
The Terrebonne and Barataria Basins are broad shallow estuaries with an average depth of 2.2 m (Engle et al., 2007) that have experienced rapid wetland loss (Couvillion et al., 2011) linked to significant reduction in riverine inputs, sediment supply, subsidence, and expanding tidal prism (Penland et al., 1988; Miner et al., 2009). Most of the freshwater that flows into the Terrebonne Basin is being supplied from AR via the Gulf Intracoastal Waterway (Swarzenski and Perrien, 2015). Barataria Basin receives minor riverine inflows through Davis Pond Freshwater Diversion, and man-made siphons (e.g., Naomi and West Pointe a la Hache) with a network of smaller bays (e.g., Lac des Allemands, Lake Salvador and Little Lake) in the northern part and separated from the Gulf of Mexico by barrier islands. Terrebonne Bay and Barataria Bay are well mixed and strongly impacted by wind- and tidal-driven exchanges with nGoM (Bianchi et al., 2009; Li et al., 2019).
Breton Basin, located to the east of the Mississippi River is shallow (average depth ~3.3 m), with its upper basin supplied by freshwater through the Caernarvon Freshwater Diversion (Riekenberg et al., 2015), while the mid and lower part of the basin receives freshwater from several natural passes and crevasses along the lower MR. The combined Breton-Chandeleur Sound is open to Gulf waters with Chandeleur Islands and seagrass beds serving as a buffer to the inland area.
2.2 Field and in-situ data collection
A total of 171 surface water samples (colored symbols; Figure 1A) were collected along the Louisiana coast with the R/V Pelican (pink symbols; N=19; 16-21 July 2019), and in the estuarine-coastal waters of Barataria Basin (N=5 for June 18-19, N=24 on 09 July 2019, N=15 for 10-11 September 2019 and N= 22 for 12 September 2019) and Atchafalaya River Delta Estuary (N=20 for 13-14 June, N=20 for 22 June 2019, N=24 for 12 August, N=22 for 15-16 August and 13-14 September 2019) on the R/V Acadiana (Supplementary Table S1-1). The July field campaign on the R/V Pelican was conducted immediately following the passage of Hurricane Barry that made landfall as a category 1 hurricane on 13 July 2019.
At each location, surface water samples were filtered using pre-rinsed 0.2-μm Nuclepore membrane filters (Whatman GmbH) for absorption spectroscopic analysis and DOC concentrations. Light absorption by suspended particulate matter (total – atnw and non-algal –adg) were measured on a Perkin-Elmer Lambda 850 spectrophotometer fitted with a 15-cm diameter integrating sphere (Naik and D’Sa, 2012) using the internally mounted sample in the IS-mode (Stramski et al., 2015; IOCCG Protocol Series, 2018; Liu et al., 2021). CDOM absorbance (ag) spectra (250–750 nm) were measured using a 1-cm pathlength quartz cuvette on a Perkin Elmer Lambda-850 UV/Visible spectrophotometer at 2 nm intervals (Liu et al., 2019a).
Profiles of salinity, temperature, and pressure were obtained using a conductivity–temperature–depth recorder (SBE 19plus V2; Sea-Bird Scientific) at each station. The above-water reflectance at 33 of 171 stations were collected using a GER 1500 512iHR spectroradiometer in the 350–1050 nm spectral range and processed as detailed in Liu et al. (2019b) to obtain in-situ remote sensing reflectance (Rrs_insitu).
In addition to these in-situ data from coastal Louisiana, we also utilized other in-situ measurements for algorithm development and validation that include backscattering and absorption coefficients collected in Galveston Bay (GB; N=34; 29 September and 29-30 October, 2017), and archived datasets in the SeaWiFS Bio-optical Archive and Storage System (SeaBASS) for shelf and offshore waters of coastal Louisiana (GOMEX_2013) conducted by the GEO-stationary Coastal and Air Pollution Events (GEO-CAPE) team, were also included.
2.3 Water volume flux measurements
2.3.1 River discharges
Riverine discharges were obtained, where available, from the United States Geological Survey (USGS) or the United States Army Corps of Engineers (USACE) stations (Supplementary Table S1-2). The Mississippi River discharge at Belle Chasse was obtained from USGS station 07374525, and the discharge at lower Atchafalaya River was obtained from USGS station at Morgan City (USGS 07381600). For remaining freshwater diversions in the lower Mississippi River (e.g., Bonnet Carré Spillway, Caernarvon and Davis Pond freshwater diversions), natural crevasses (e.g., Mardi Grass Pass or Fort St. Philip), and flows through the Mississippi River Delta distributaries, USGS and USACE datasets were used when available. Otherwise, relationships with the Mississippi River upstream discharge, which were developed using the most recent available datasets were utilized in this study (see details on Supplementary Table S1-2). For all these rivers and outlets, the annual average discharge was calculated and used for the carbon budget.
2.3.2 Water flux during Hurricane Barry
Investigation of water flow through a total of nine tidal inlets of the Barataria Basin was conducted by Water Institute of the Gulf and Coastal Restoration and Protection Authority (CPRA) in 2019 by deploying fixed instruments at tidal inlets (Barataria Pass, Quatre Bayou Pass, and Fontanelle Pass) and conducting vessel-based surveys at all inlets for flow velocity measurements (15 January - 26 September, 2019) available at CPRA Coastal Information Management System (Ramatchandirane et al., 2019). Meanwhile, the water volume flux through four tidal inlets (Caminada Pass, Barataria Pass, Pass Abel, and Quatre Bayou Pass) was estimated from a finite volume community ocean model (FVCOM) by integrating along channel velocity at different layers through the cross-sectional area and further validated with observational data collected in 2019 with more details documented in Huang and Li (2020).
2.3.3 Estimation of DOC fluxes
The riverine DOC fluxes were estimated as a product of river discharges (section 2.3.1) and satellite-estimated DOC concentrations (as stated in Eq. 1). The DOC fluxes from estuaries into continental shelf waters through tidal inlets are complex compared to river fluxes due to the compounding effects of tides and currents. The water volume flux (section 2.3.2) was first calculated based on channel velocity at different water depths of the inlet cross-sectional area. The model-estimated water fluxes through the four passes of Barataria Bay were then combined with satellite-derived estimates of DOC to calculate DOC fluxes during Hurricane Barry (13-17 July2019):
2.4 Satellite data processing
A total of 215 satellite scenes (1 January 2019 – 31 December 2021) were acquired that included 140 Sentinel 3A/B-OLCI images, 22 Landsat 8/9-OLI images and 53 Sentinel 2A/B-MSI images. All satellite data were geometrically corrected and cropped/mosaicked to the study area (28.6N-28.6N; 88.7W-92.5W).
2.4.1 Sentinel 3A/B-OLCI preprocessing
Cloud-free level-1 Sentinel 3-OLCI data were downloaded from the ESA website (https://coda.eumetsat.int/#/home) for the Louisiana coast. A total of eight OLCI images corresponding to research cruise days on 13 June, 19 June, 16-19 July, 15 August, 4 September, and 14 September, respectively, were identified and selected (Supplementary Table S1-1). Level-1 OLCI images were preprocessed through the Sentinel-3 Toolbox within the Sentinel Application Platform (SNAP), and further atmospherically corrected using Case 2 Regional Coast Color (C2RCC) to obtain a calibrated remote sensing reflectance (Rrs_OLCI) (Figure 2). More details regarding the C2RCC atmosphere correction can be found in (Liu et al., 2019b; Liu et al., 2021).
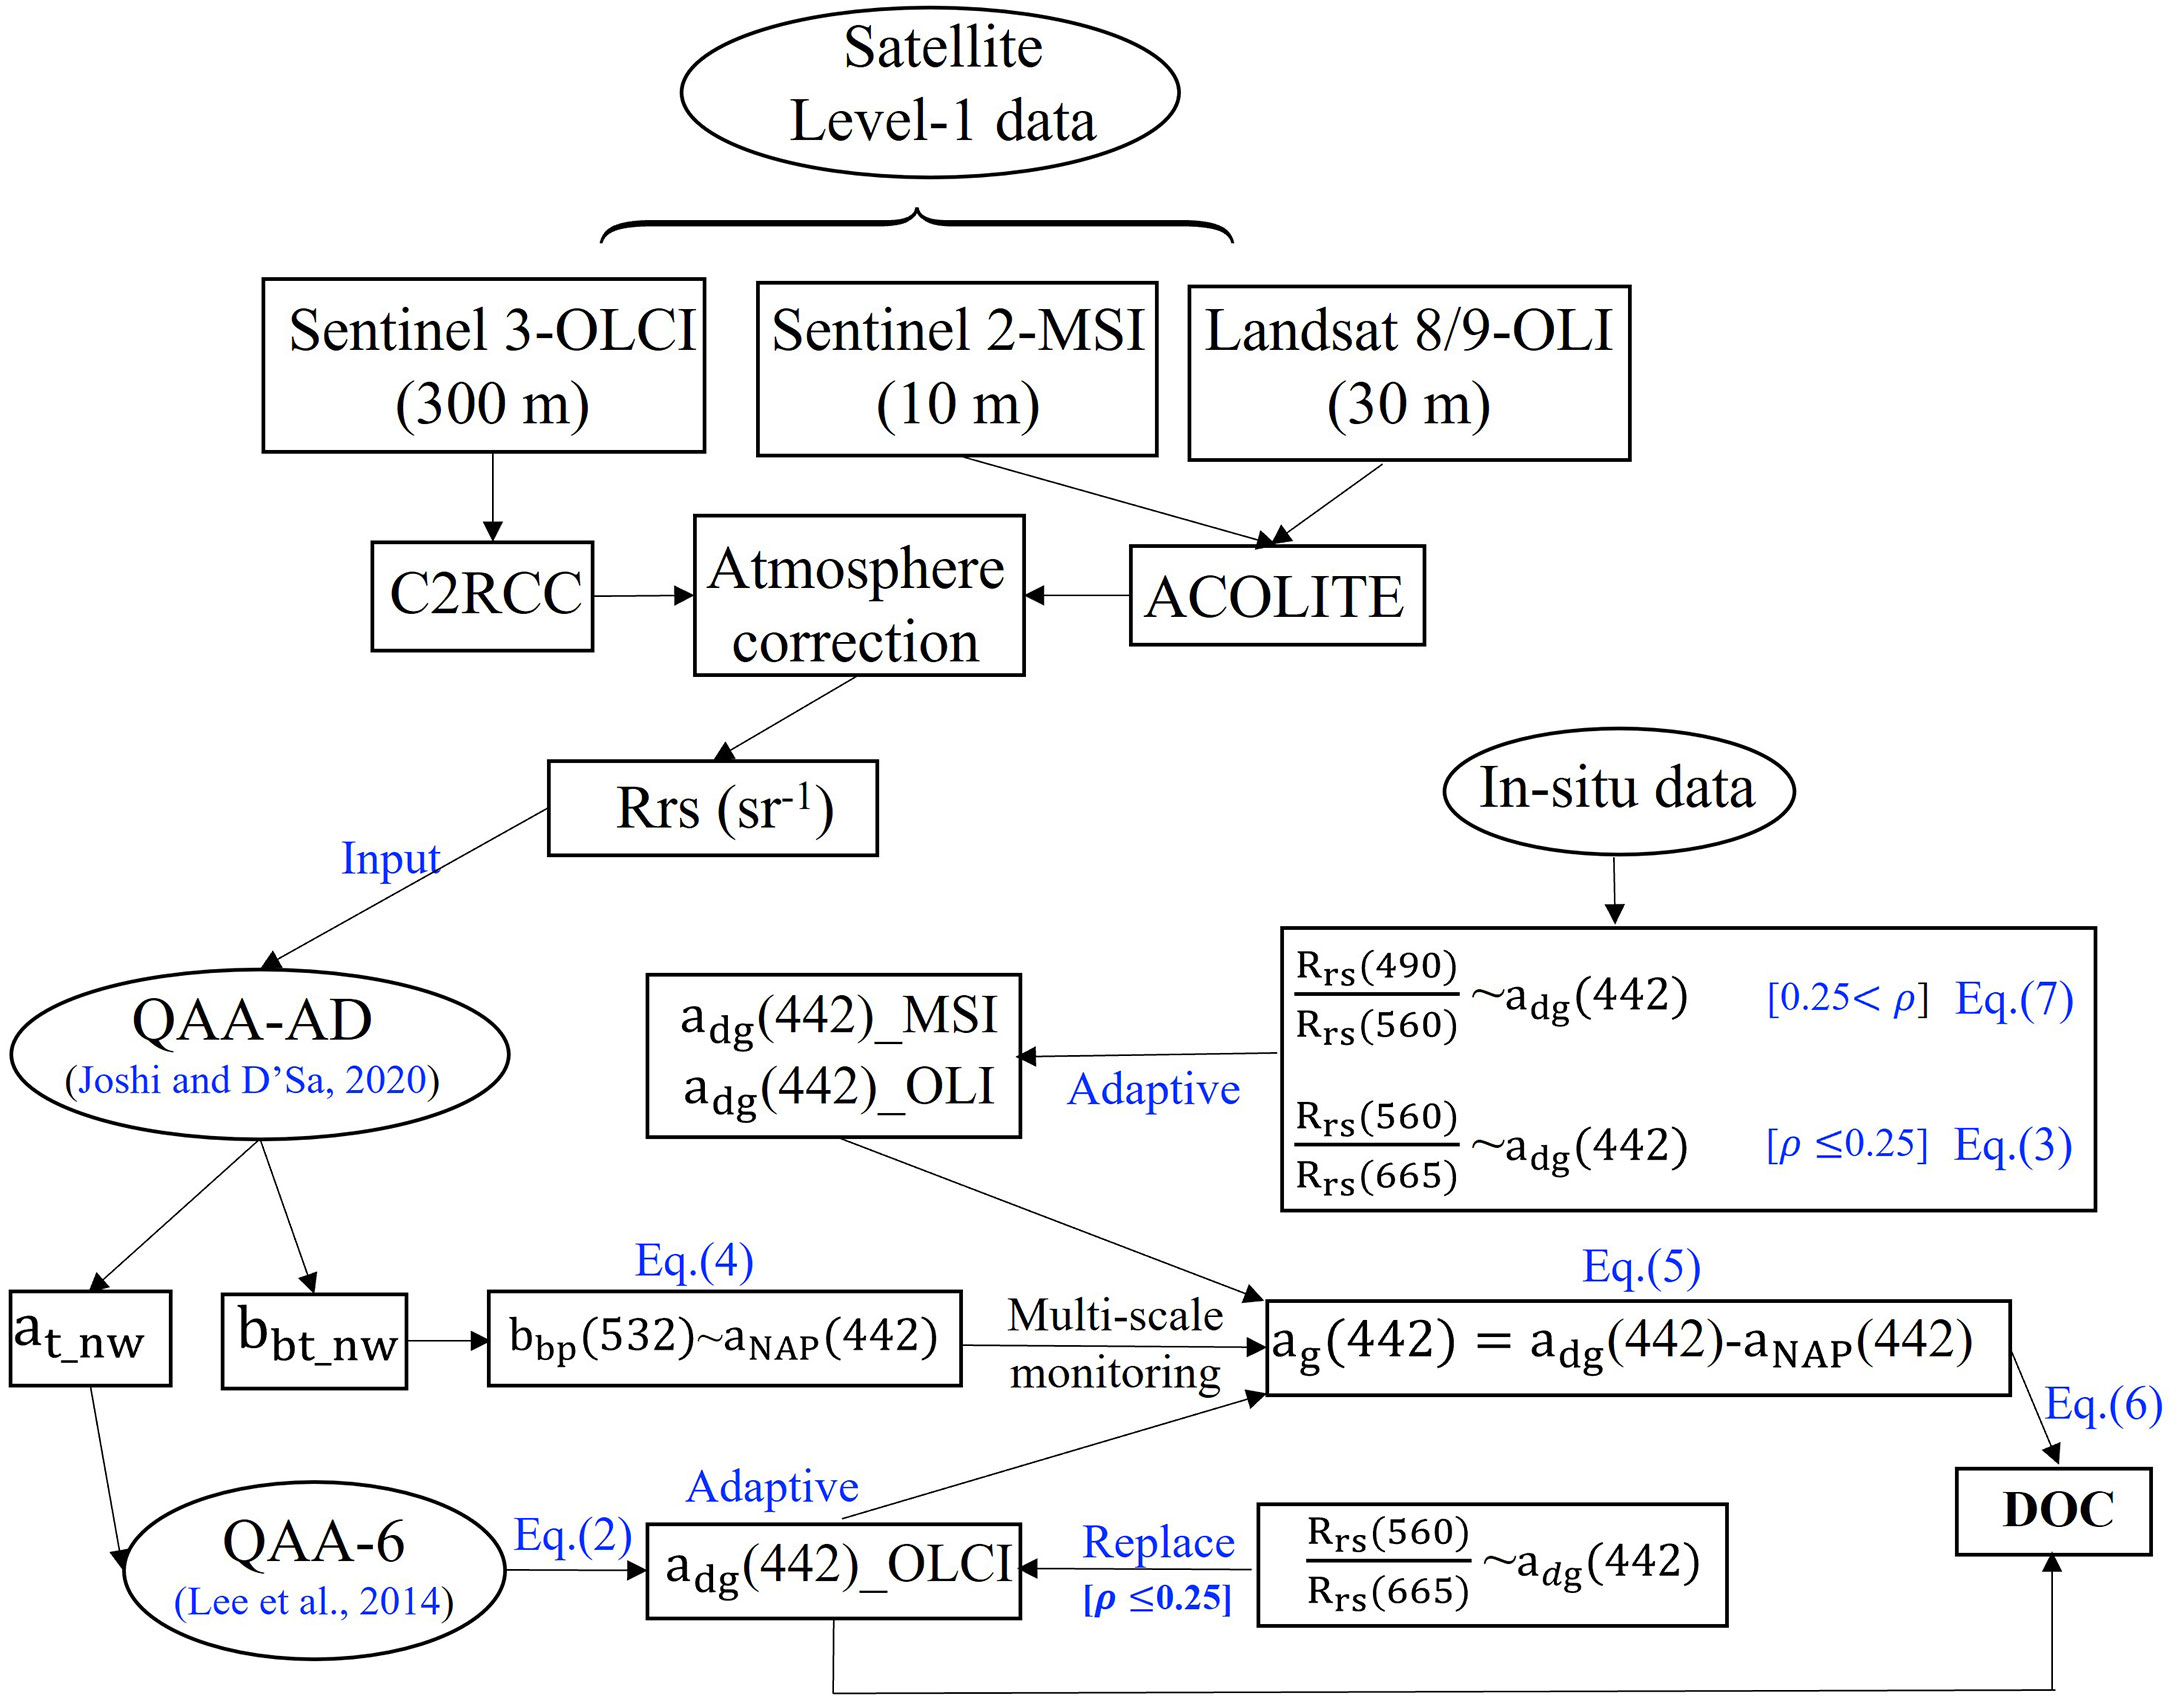
Figure 2 Analytical framework showing the major processing steps that include: i) atmospheric-correction, ii) estimation of total absorption and backscattering coefficients (at_nw and bbt_nw) from QAA-AD and iii) adaptive procedure for estimating adg(442) and DOC for OLCI, OLI and MSI. Reference section 2.5 for additional details.
2.4.2 Sentinel 2-MSI and Landsat 8/9-OLI
Level-1 Sentinel 2-MSI and Landsat 8/9-OLI data were obtained from Copernicus Open Access Hub (https://scihub.copernicus.eu/dhus/#/home) and USGS Earth Explorer (https://earthexplorer.usgs.gov/), respectively. A total of 46 MSI and 19 OLI level-1 cloudless scenes were further processed with ACOLITE, which is an atmospheric correction processor for coastal and inland waters developed by the Management Unit of the Mathematical Model of the North Sea (MUMM) (Vanhellemont, 2019); atmosphere contributions were thus removed from top-of-atmosphere reflectance (TOA) in ACOLITE to generate remote sensing reflectance (Rrs_MSI and Rrs_OLCI) (Figure 2)
2.5 Improved adaptive QAA-V procedures
The standard quasi-analytical algorithm QAA (Lee et al., 2002) was tuned as QAA-V (Joshi and D’Sa, 2018) to improve its performance in retrieving IOPs in optically-complex estuarine-coastal waters and was first optimized for the Visible Infrared Imaging Radiometer Suite onboard National Polar-orbiting Partnership (SNPP-VIIRS); QAA-V was also calibrated for other satellite sensors, including Sentinel 3-OLCI, Sentinel2-MSI, and Landsat 8/9-OLI, and showed overall better estimation of total absorption and backscattering coefficients (at_nw and bbt_nw) compared to the standard QAA algorithm (Joshi and D’Sa, 2018).
A significant improvement in QAA-V is the use of thresholds (ρ) based on the green/red band ratio (e.g., ρ≤0.25 indicates estuarine waters) defined for various water types from turbid to clear open ocean (Joshi and D’Sa, 2018). Further, an adaptive concept (QAA-AD; Joshi and D’Sa, 2020), that combined the QAA-V5 (Lee et al., 2002) and QAA-V (Joshi and D’Sa, 2018) was applied to obtain merged and optimized retrievals of total absorption and backscattering coefficients across different water types in the river-dominated nGoM waters.
In this study, QAA-AD was first applied to atmospheric-corrected OLCI, MSI and OLI remote sensing reflectance (Rrs) to obtain of total absorption and backscattering coefficients (at_nw and bbt_nw) (Figure 2).
Next, the combined CDOM and non-algal particle absorption coefficient at 442 nm (adg442) was estimated for OLCI from the standard QAA algorithm using at at 412 and 442 nm as (Lee et al., 2009):
where at is the total absorption coefficients estimated from QAA-AD; ζ and ξ are coefficients related to the ratio of remote sensing reflectance just below water surface (rrs) at blue (442) to green (555) wavelength (for further details, see Lee et al., 2009).
Although adg(442) estimates based on the blue to green ratio perform well for open ocean, it generally fails in optically-complex estuarine waters; thus, an empirical algorithm based on the power law relationship between Rrs560/Rrs674 OLCI green to red band ratio (in-situ) and adg(442) was applied for a threshold for turbid waters (ρ≤0.25):
Then, a linear relationship between absorption of non-algal particle (NAP) at 442 nm (aNAP442) and particulate backscattering coefficient at 532 nm (bbp532) was used to estimated aNAP442 based on QAA-AD estimated bbp532 using data collected in Galveston Bay (D’Sa et al., 2018) and Barataria Basin and shelf waters:
Subsequently, ag(442) was estimated by subtracting aNAP(442) from adg442:
DOC concentration was then obtained from ag(442) based on field data and the relationship:
The same procedure as described for OLCI to obtain at_nw and bbt_nw was also applied to MSI and OLI; however, QAA-5 cannot be used to estimate adg(442) in open ocean due to the absence of 412 nm band. Therefore, an alternate adaptive procedure was adopted to first estimate adg(442) based on Rrs ratio of green to red for estuarine area (ρ≤0.25) as in Eq. (3) and then blue to green ratio in shelf waters (ρ>0.25) given by:
Similarly, ag(442) is estimated using Eq. (4) and further linked to DOC concentrations based on relationship obtained from field data using Eq. (6).
2.6 Investigate hurricane-induced wetland loss
Land loss caused by an extreme storm event (e.g., Hurricane Ida) could deliver a large amount of carbon as DOC into the aquatic pool, especially when tidal wetlands get converted to open water habitats. To assess DOC concentrations in wetland loss area caused by Hurricane Ida, Sentinel 2-MSI obtained before and after Hurricane Ida was used to generate a modified normalized difference water index (MNDWI) based on green to shortwave infrared band ratio to extract Ida-induced wetland loss aerial extent. Meanwhile, the inundation depth in the wetland loss area on 29 August 2021 was predicted by the advanced circulation (ADCIRC) storm surge mode, which is a system of computer programs developed through the Coastal Resilience Center, a Department of Homeland Security (DHS) Center of Excellence. ADCIRC has been used for all U.S. landfalling hurricanes on the East and Gulf Coasts for the past decade, with results available at CERA (https://cera.coastalrisk.live/).
3 Results and discussion
3.1 Surface salinity and CDOM/DOC properties from field observations
Salinity and CDOM optical properties (absorption coefficients and spectral slope) and DOC concentrations in surface waters are examined for the Atchafalaya and Barataria estuarine and shelf waters (Figures 1A, 3, 4). In this study, we used ag(442) to be consistent with satellite-estimates of CDOM, since 442 nm is the only common blue band in the OLCI, MSI and OLI sensors. However, as most previous studies in this deltaic region have reported absorption at 355 and 412 nm (D’Sa et al., 2006; Singh et al., 2010a; Naik et al., 2011; Liu et al., 2019a), we also show ag(355) and ag(412) (mean ± std. dev.) (Table 1). Overall, values of CDOM absorption coefficient were consistent to earlier studies in the Barataria Bay and shelf waters for similar salinities observed in the spring/summer during high discharge of MR and AR under normal flow conditions (D’Sa and DiMarco, 2009; Naik et al., 2011; Joshi and D’Sa, 2015). Abundance of CDOM in the shelf waters off the Barataria bay/bird foot delta during summer (Table 1) show significantly greater values in comparison to earlier studies conducted during spring and fall under low flow discharge conditions of the Mississippi River (D’Sa and Miller, 2003) indicating the elevated influx of CDOM into the shelf waters even during the summer of 2019.
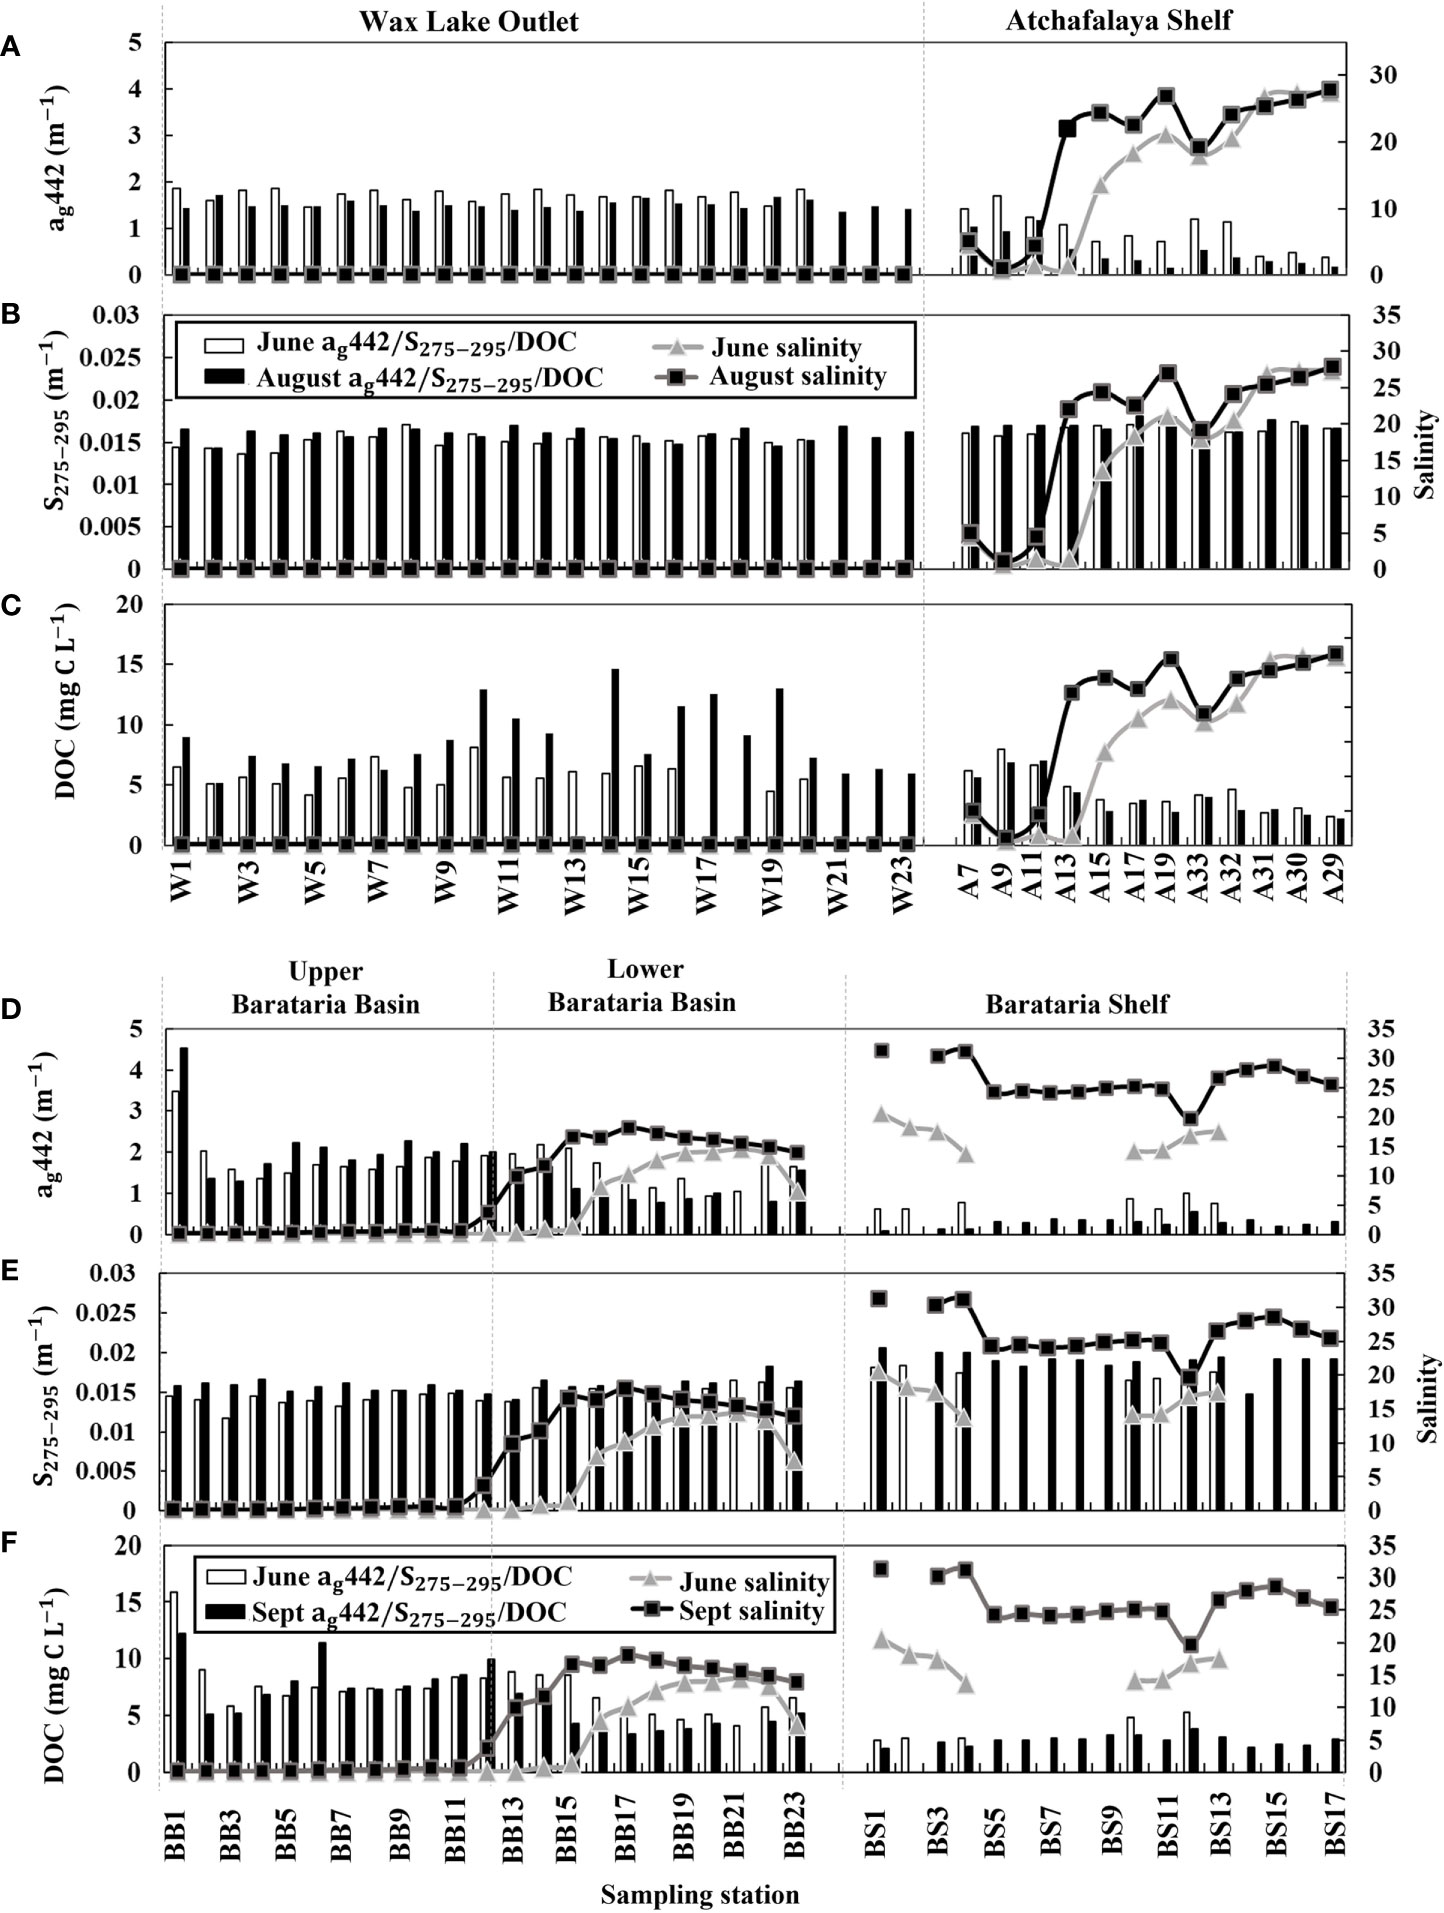
Figure 3 CDOM (A) ag(442), (B) S275–295 and (C) DOC concentrations in ARDE and shelf; (D) ag(442), (E) S275–295 and (F) DOC in Barataria Basin and shelf waters. White/black bars represents in-situ measurements of ag(442), S275–295 and DOC concentrations obtained in June and August/September 2019 with square/triangle lines for salinity along the transect measured in June and August/September 2019, respectively.
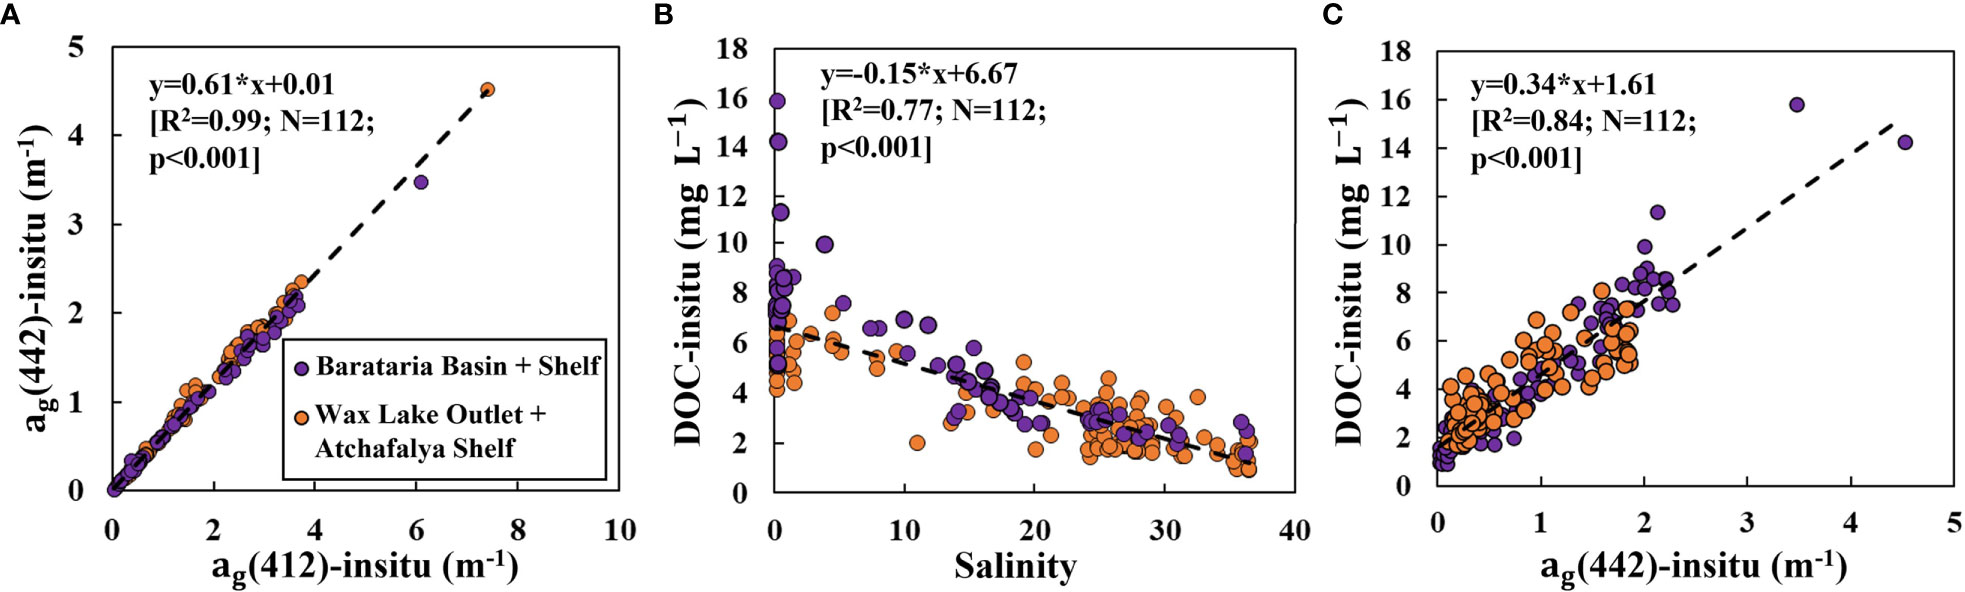
Figure 4 Relationships between (A) ag(412) and ag(442), (B) salinity and DOC, and (C) ag(442)) and DOC concentrations for the Atchafalaya delta, Barataria Basin and the shelf, respectively. *, multiplication.
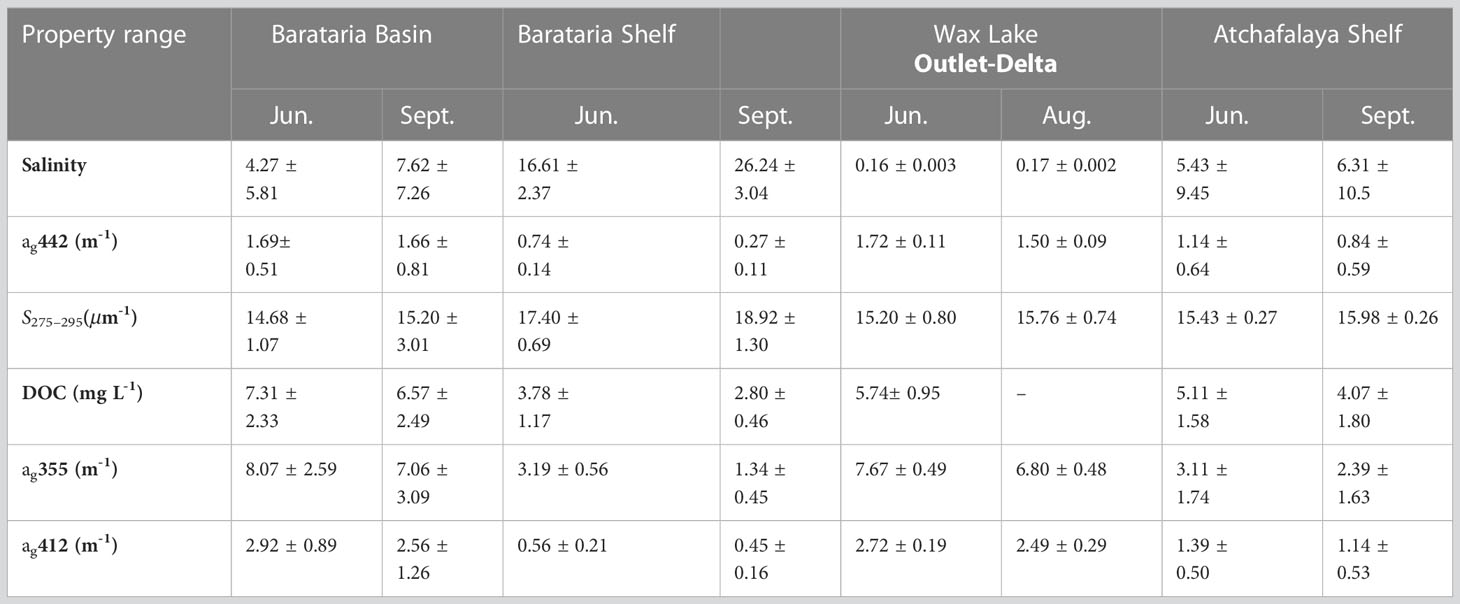
Table 1 Salinity, CDOM absorption coefficients at 355, 412 and 442 nm, spectral slope S275-295, and DOC concentration (mean± standard deviation) from fields measurements at study sites (Figure 1).
3.1.1 Atchafalaya river delta estuary and adjacent shelf
Discharge from the MR and AR were anomalously high during the field campaigns (25,400 m3 s-1 in 2019 compared to an average of 15,309 m3 s-1 for the years 2010 to 2018 measured at the MR gauge station at Tarbert Landing, MS; Supplementary Figure S2-1). In June and August-September 2019, average salinity of ~0.16 at the WLO Delta (stations W1-W23; Supplementary Figure S2-2) suggested the presence of fresh river water in the ARDE and low salinity nearshore that increased with distance from shore in the Atchafalaya shelf (5.43 ± 9.45 in June and 6.31 ± 10.5 in September) (Figure 3; Table 1). ag(442) showed minor spatial variations in WLO (1.72 ± 0.11 m-1 in June and 1.50 ± 0.09 m-1 in August-September), with a decreasing trend with distance offshore and decreasing later in the summer (average: 1.14 ± 0.64 m-1 in June and 0.84 ± 0.59 m-1 in September) with decreasing river discharge. Similarly, the spectral slope S275–295 also showed minor variations in WLO (15.20 ± 0.80 μm-1 in June and 15.76 ± 0.74 μm-1 in September) and slightly greater values in the shelf (Table 1); these indicate only minor effects due to photo-oxidation at the freshwater end member (Moran et al., 2000) and is consistent with an earlier study wherein photo-oxidation effects were observed mainly at higher salinities (D’Sa and DiMarco, 2009). DOC similarly exhibited small variations from Wax Lake Delta (5.74 ± 0.95 mg C L-1) to Atchafalaya shelf waters in June (5.11 ± 1.58 mg C L-1) and into September (4.07 ± 1.80 mg C L-1) (Figure 3C). DOC in Wax Lake Delta area was in the range of 4.8-7.8 mg C L-1 in June; however, relatively higher DOC concentrations were observed at some stations (e.g., 10, 11, 12, 13, 14, 17, 19) in August-September 2019 that were not reflected in elevated ag(442) or S275–295 patterns suggesting greater contribution by non-chromophoric DOM to the DOC pool. Most of these stations were located at the mouth of the delta, with highest value observed at station W13 (23.6 mg C L-1) which was also close to the Belle Isle Lake distributary channel outlet. These stations are also close to the distributary outlets of the Atchafalaya River delta (Figure S2-2) and tides or winds could have transported these waters into the sampling region. With the WLO providing a more direct route than the adjacent Atchafalaya distributaries which drain very different areas, DOM fractions could be quite different between these distributaries and future work should be conducted to characterize DOM bio-optical properties in these two adjacent delta regions. This is particularly important as these stations with elevated DOC do not conform to the general positive relationship observed between CDOM and DOC for the other field samples across the study area (Figure 4); these high DOC values were thus excluded from further analysis for remote sensing algorithm development. Overall, the anomalously high discharge from the Atchafalaya River resulted in freshwater dominating the delta region and low salinity waters in the shelf region that contributed to the high CDOM absorption and low spectral slope values in the delta and shelf waters. For comparison, ag412 (m-1) at similar Atchafalaya shelf locations (salinity 29.51) measured in July 2005 under normal discharge conditions was about five-fold lower (0.225 m-1) (D’Sa, 2008).
3.1.2 Barataria basin and adjacent shelf
Salinity along a transect (Figure 1A, Supplementary Figure S2-2) from the upper (BB1 – BB11) to lower (BB12 – BB17) and across the lower boundary of the Barataria Basin (BB18 – BB23) showed greater influence of freshwater in June (mean 4.27 ± 5.81) than in September (7.62 ± 7.26) (Figure 3D). The upper basin includes the freshwater lake Lac des Allemands and the brackish Lake Salvador with main freshwater sources being rainfall, local runoff and the Gulf Intercoastal Waterway; in addition, river inflow from the Davis Pond Diversion and MR siphons at Port Sulphur, Naomi and West Pointe a la Hache are generally higher during high MR stages that contribute to lower salinity in the basin. The lower basin which is close to the MR can also be strongly influenced by the magnitude of MR discharge, wind regime and tidal cycles (Wiseman et al., 1990); the reduced salinity in the lower basin (Figure 3D) appears coherent to MR discharge as previously shown (Liu et al., 2019a). Previous field studies in the Barataria Basin have documented greater abundance of CDOM in the upper basin compared to the lower basin, with large variability in the upper basin linked to enhanced biological activity, presence of allochthonous DOM derived from terrestrial sources and leaching from soil derived humic acid (Singh et al., 2010a, b). Station BB1 in upper basin and adjacent to Davis Pond freshwater diversion showed highest ag(442) (>3.0 m-1) compared to other stations (mean 1.69 ± 0.15 m-1 in June and 1.66 ± 0.81 m-1 in September). Spectral slope S275–295 also varied across the transects being generally lower in the upper basin than the lower basin (Figure 3E) with overall mean values of 14.68 ± 1.07 μm-1 in June and 15.20 ± 3.01 μm-1 in September (Table 1); similar patterns were previously reported under high flow conditions in the basin (Singh et al., 2010a) that suggest some mixing with the marine waters in the lower basin. The DOC pattern of distribution was similar to ag(442) with highest concentration at BB1 and higher levels in the upper than the lower basin; an overall mean DOC of 7.31 ± 2.33 mg C L-1 in June, decreased to 6.57 ± 2.49 mg C L-1 into September (Figure 3F; Table 1) that appeared to be linked to higher salinity waters later into summer. In addition, instances of elevated values of organic carbon observed in the upper Barataria Basin were attributed to phytoplankton production linked to runoff from agricultural catchments and other point discharges (Singh et al., 2010b) suggesting similar influences may have contributed to elevated DOC observed at some locations in this study (Figure 3F). Compared to non-flood year (Joshi and D’Sa, 2015), salinity was overall lower during the 2019 extreme flood event concomitant with higher CDOM absorption and lower spectral slope, which indicates the strong role of salinity in determining CDOM optical properties.
In the continental shelf waters off Barataria Basin (Figure 1A and Figure S2-2), salinity levels were much greater in September (26.24 ± 3.04) than June (16.61 ± 2.37) due to decreasing MR discharge (Figure 3D; Table 1). CDOM also decreased significantly in the shelf waters from June (mean 0.74 ± 0.14 m-1) into September (mean 0.27 ± 0.11m-1) in the higher salinity waters (Figure 3D). S275–295 also showed increasing trends with increasing salinity, being highest (mean 18.92 ± 1.30 μm-1) in September (Figure 3E; Table 1) suggesting increasing effects of photo-oxidation. The spectral slope S275–295(Figures 3B, E; Table 1) likely reflect the different sources of DOM, mixing of the riverine-marine end members, differences in residence times and photo-oxidation state of waters in the two estuaries. Similar S275–295 in ARDE and Barataria Basin were likely associated with higher riverine inputs, while elevated S275–295 in continental shelf waters appear to be linked to higher salinity waters and thus greater mixing with the marine end member subjected to greater photo-oxidation through the summer (Chaichitehrani et al., 2014). In comparison to Barataria Basin, DOC concentrations in the adjacent shelf waters were lower in June (3.78 ± 1.17 mg C L-1) and September (2.80 ± 0.46 mg C L-1) (Figure 3F) and is consistent with previous studies that show decreasing DOC levels with increasing salinity (Tehrani et al., 2013; Fichot et al., 2014).
3.1.3 CDOM, DOC and salinity relationships
CDOM absorption coefficient at 442 nm (ag442) was used as a proxy to estimate DOC concentration from remote sensing; ag442 was also highly correlated to ag(412) (R2 = 0.99; Figure 4A), the more commonly reported wavelength (Joshi et al., 2017). A generally negative relationship observed between DOC and salinity (Figure 4B; except at few stations in upper Barataria Basin with salinity lower than 0.6) indicated strong DOC inputs from rivers and channels (e.g., MR, AR, Davis Pond and Wax Lake Outlet). DOC was also significantly related to CDOM (R2 = 0.84; Figure 4C) suggesting mixing between river and marine end members to be important in the distribution of both DOC and CDOM; similar relationships were also previously reported for field measurements in the shelf waters (D’Sa and DiMarco, 2009; Tehrani et al., 2013).
3.2 Sentinel-2/3 and Landsat-8 algorithm performance
3.2.1 QAA-AD algorithm validation
The inherent optical properties of absorption and backscattering coefficients, including at_nw and bbt_nw were estimated from a combination of the adaptive semi-analytic algorithm (QAA-AD) and field observations in the estuarine-coastal continuum of the nGoM (Figures 2, 5; Section 2.5). Satellite-estimates of at_nw(442) agreed well with field measurements for the three satellite sensors (R2 = 0.86; Figure 5C), with QAA-AD showing slight overestimation at higher values. Next, using the estuary/coastal index (ρ) developed in Joshi and D’Sa (2018), regional algorithms for adg(442) based on green to red ratio (Rrs560/Rrs665) for estuaries (Figure 5A) and blue to green ratio (Rrs490/Rrs556) for offshore waters (Figure 5B) were developed. A power-law relationship between adg(442) and Rrs(560/665) (R2 = 0.89; Figure 5A) was applied in estuaries where ρ was smaller than 0.25. Part of the “GOMEX-2013” field data collected in coastal Louisiana waters were used to develop the adg(442) algorithm for ρ > 0.25 which appeared well correlated in power-law relationship with Rrs(490/556) (Figure 5B).
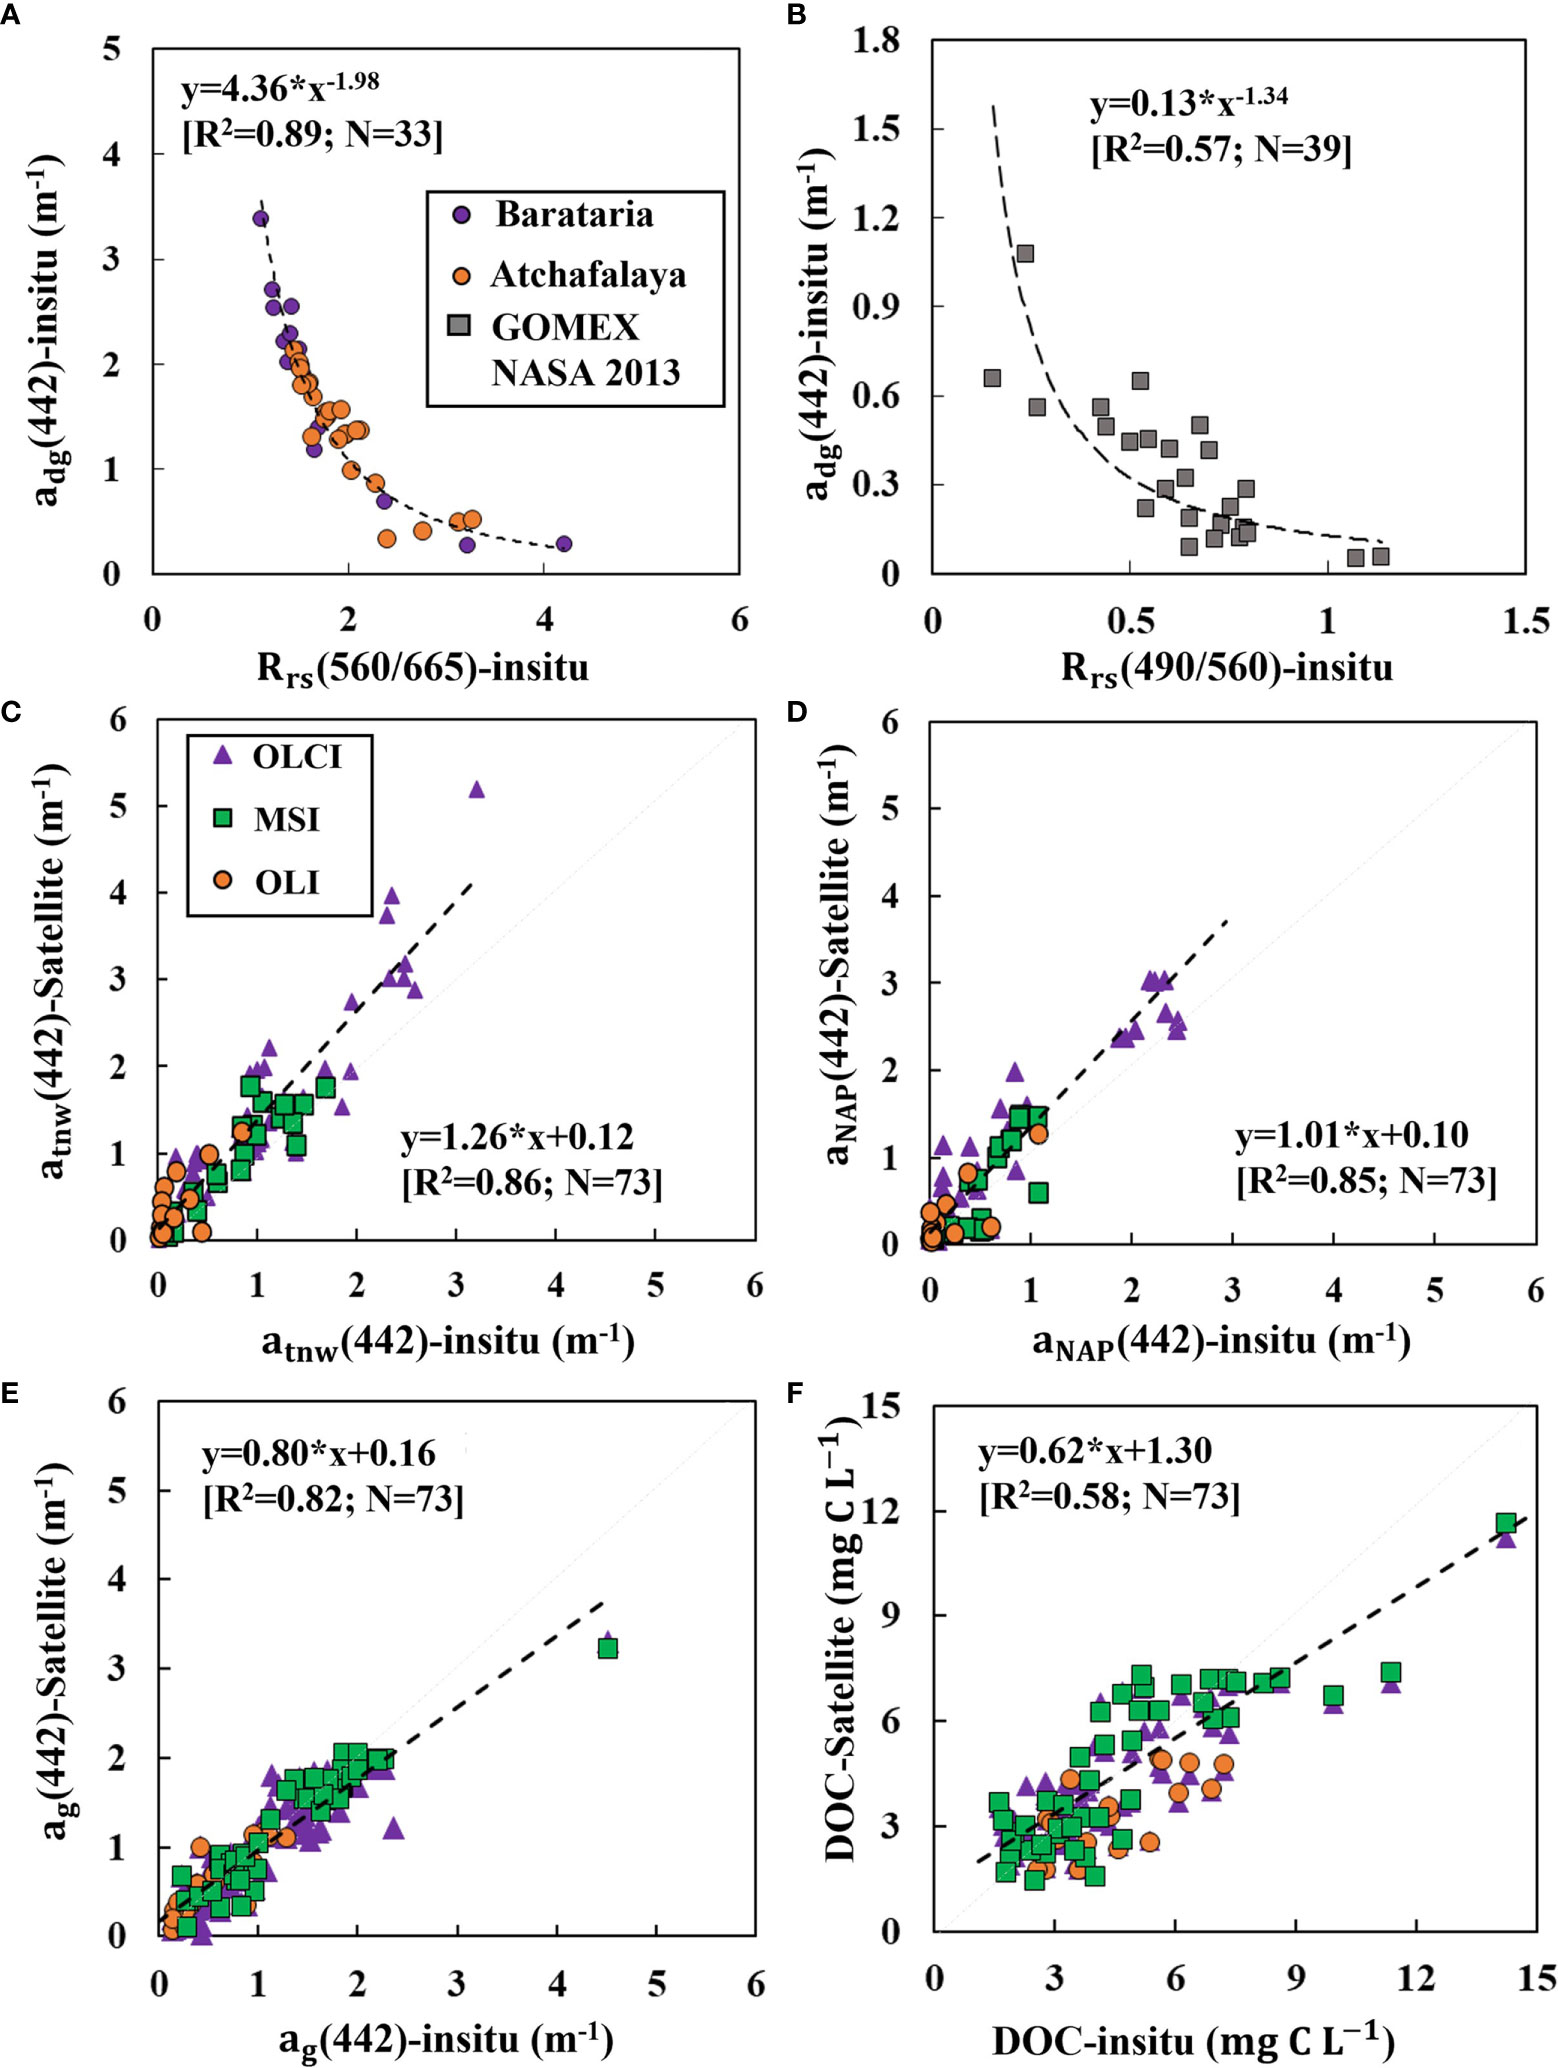
Figure 5 Relationships between adg(442) and band ratios (A) Rrs(560/665) for estuarine, and (B) Rrs(490/560) for shelf waters (in situ). In-situ validation of satellite-derived (C) atnw(442), (D) aNAP(442), (E) ag(442) and (F) DOC concentration.
An empirical model that related aNAP to bbp(532) based on in-situ measurement obtained in Galveston Bay (Joshi and D’Sa, 2018) and in Barataria Bay and shelf waters was used to derive satellite aNAP. Satellite-estimates of aNAP agreed well (R2 = 0.85) with in-situ measured bbp(532) (Figure 5D). The ag(442) was then estimated from the difference between adg(442) and aNAP (Eq. 5). The adaptive procedure incorporated into QAA-AD successfully predicted ag(442) (R2 = 0.82; Figure 5E). These inherent optical properties (e.g., at_nw and bbt_nw) estimated from QAA-AD can be easily applied in other regions because the algorithm was developed using a suite of synthetic data and in situ measurements in optically complex and shallow estuarine waters (Joshi and D’Sa, 2018). The ag(442)-DOC relationship (Eq. 6) was then used to adaptively convert satellite-estimates of ag(442) to DOC maps. Validation of satellite-derived DOC against in-situ data collected within +/- 3 days of satellite pass (eight OLCI, three MSI and one OLI imagery, respectively; Supplementary Table S1-1) showed reasonable performance (Figure 5F; R2 = 0.58; 0.05<p<0.001). However, the empirical components in QAA-AD (e.g., adg442-Rrs and to bbp- to aNAP) can be influenced by different environmental factors (e.g., flooding, and cold front events; Liu et al., 2019a), and may need to be tuned before being implemented to other regions for DOC estimation.
In this study, satellite-estimates of inherent optical properties (at_nw, aNAP, and ag at 442 nm) from QAA-AD had better accuracy (R2 between 0.82 to 0.86; Figures 5C–E) compared to DOC estimates (Figure 5F) which could be attributed to the dynamic DOC-ag442 relations; CDOM optical properties which are affected by different hydrologic, geographical, climatic, landscape characteristics, and soil type could significantly affect the performance of DOC-ag442 model over a large study area, such as coastal Louisiana with diverse habitats and two contrasting estuaries, the ARDE and Barataria Basin. Nonetheless, overall positive correlations between CDOM absorption coefficients ag442 and DOC were observed in both ARDE and Barataria Basin (R2 = 0.84; Figure 4C). ARDE with dynamic environment and shorter residence time receives DOC mainly from the AR, with substantial DOC inputs from freshwater wetland (e.g., Taxodium distichum) with relatively high-molecular-weight CDOM (Shen et al., 2012). In Barataria Basin, marsh-derived DOC could be one major source since flood protection levees along the MR has considerably reduced DOC-rich freshwater inflows. Remote sensing retrieval of CDOM is generally focused on CDOM absorption at 355 or 412 nm wavelengths. In this study, CDOM absorption coefficient ag442 was selected to enable the QAA-AD implementation to multi-sensors. The correlations between CDOM absorption coefficients and satellite remote sensing reflectance could be weakened with increasing wavelength because of overlapped pigment absorption at longer wavelengths (Bricaud et al., 2010; Spencer et al., 2012), which could also contribute to the uncertainties of satellite-estimates of DOC. Lastly, the time difference (+/- 3 days) between field data and satellite sensing dates accounts for part of uncertainties of DOC-estimates in this highly dynamic estuarine environment.
3.2.2 Consistency in algorithm performance (adg442 and DOC) for OLCI, MSI and OLI
The OLCI-estimates of adg442 derived from the standard procedure in QAA-6 (Lee et al., 2009) generally overestimated in turbid waters as shown for example in imagery on October 20, 2019 with extremely high values in the estuaries (e.g., ARDE and MR delta estuary and upper Barataria Basin - up to 11.4 m-1; Figure 6A). In comparison, adg442 estimated from the adaptive procedure incorporated into QAA-AD depicted reasonable range and performance (Figures 6B, 5C), with adg442 in Barataria Bay (2.2 m-1) lower than in ARDE (3.6 m-1) (Figure 6B).
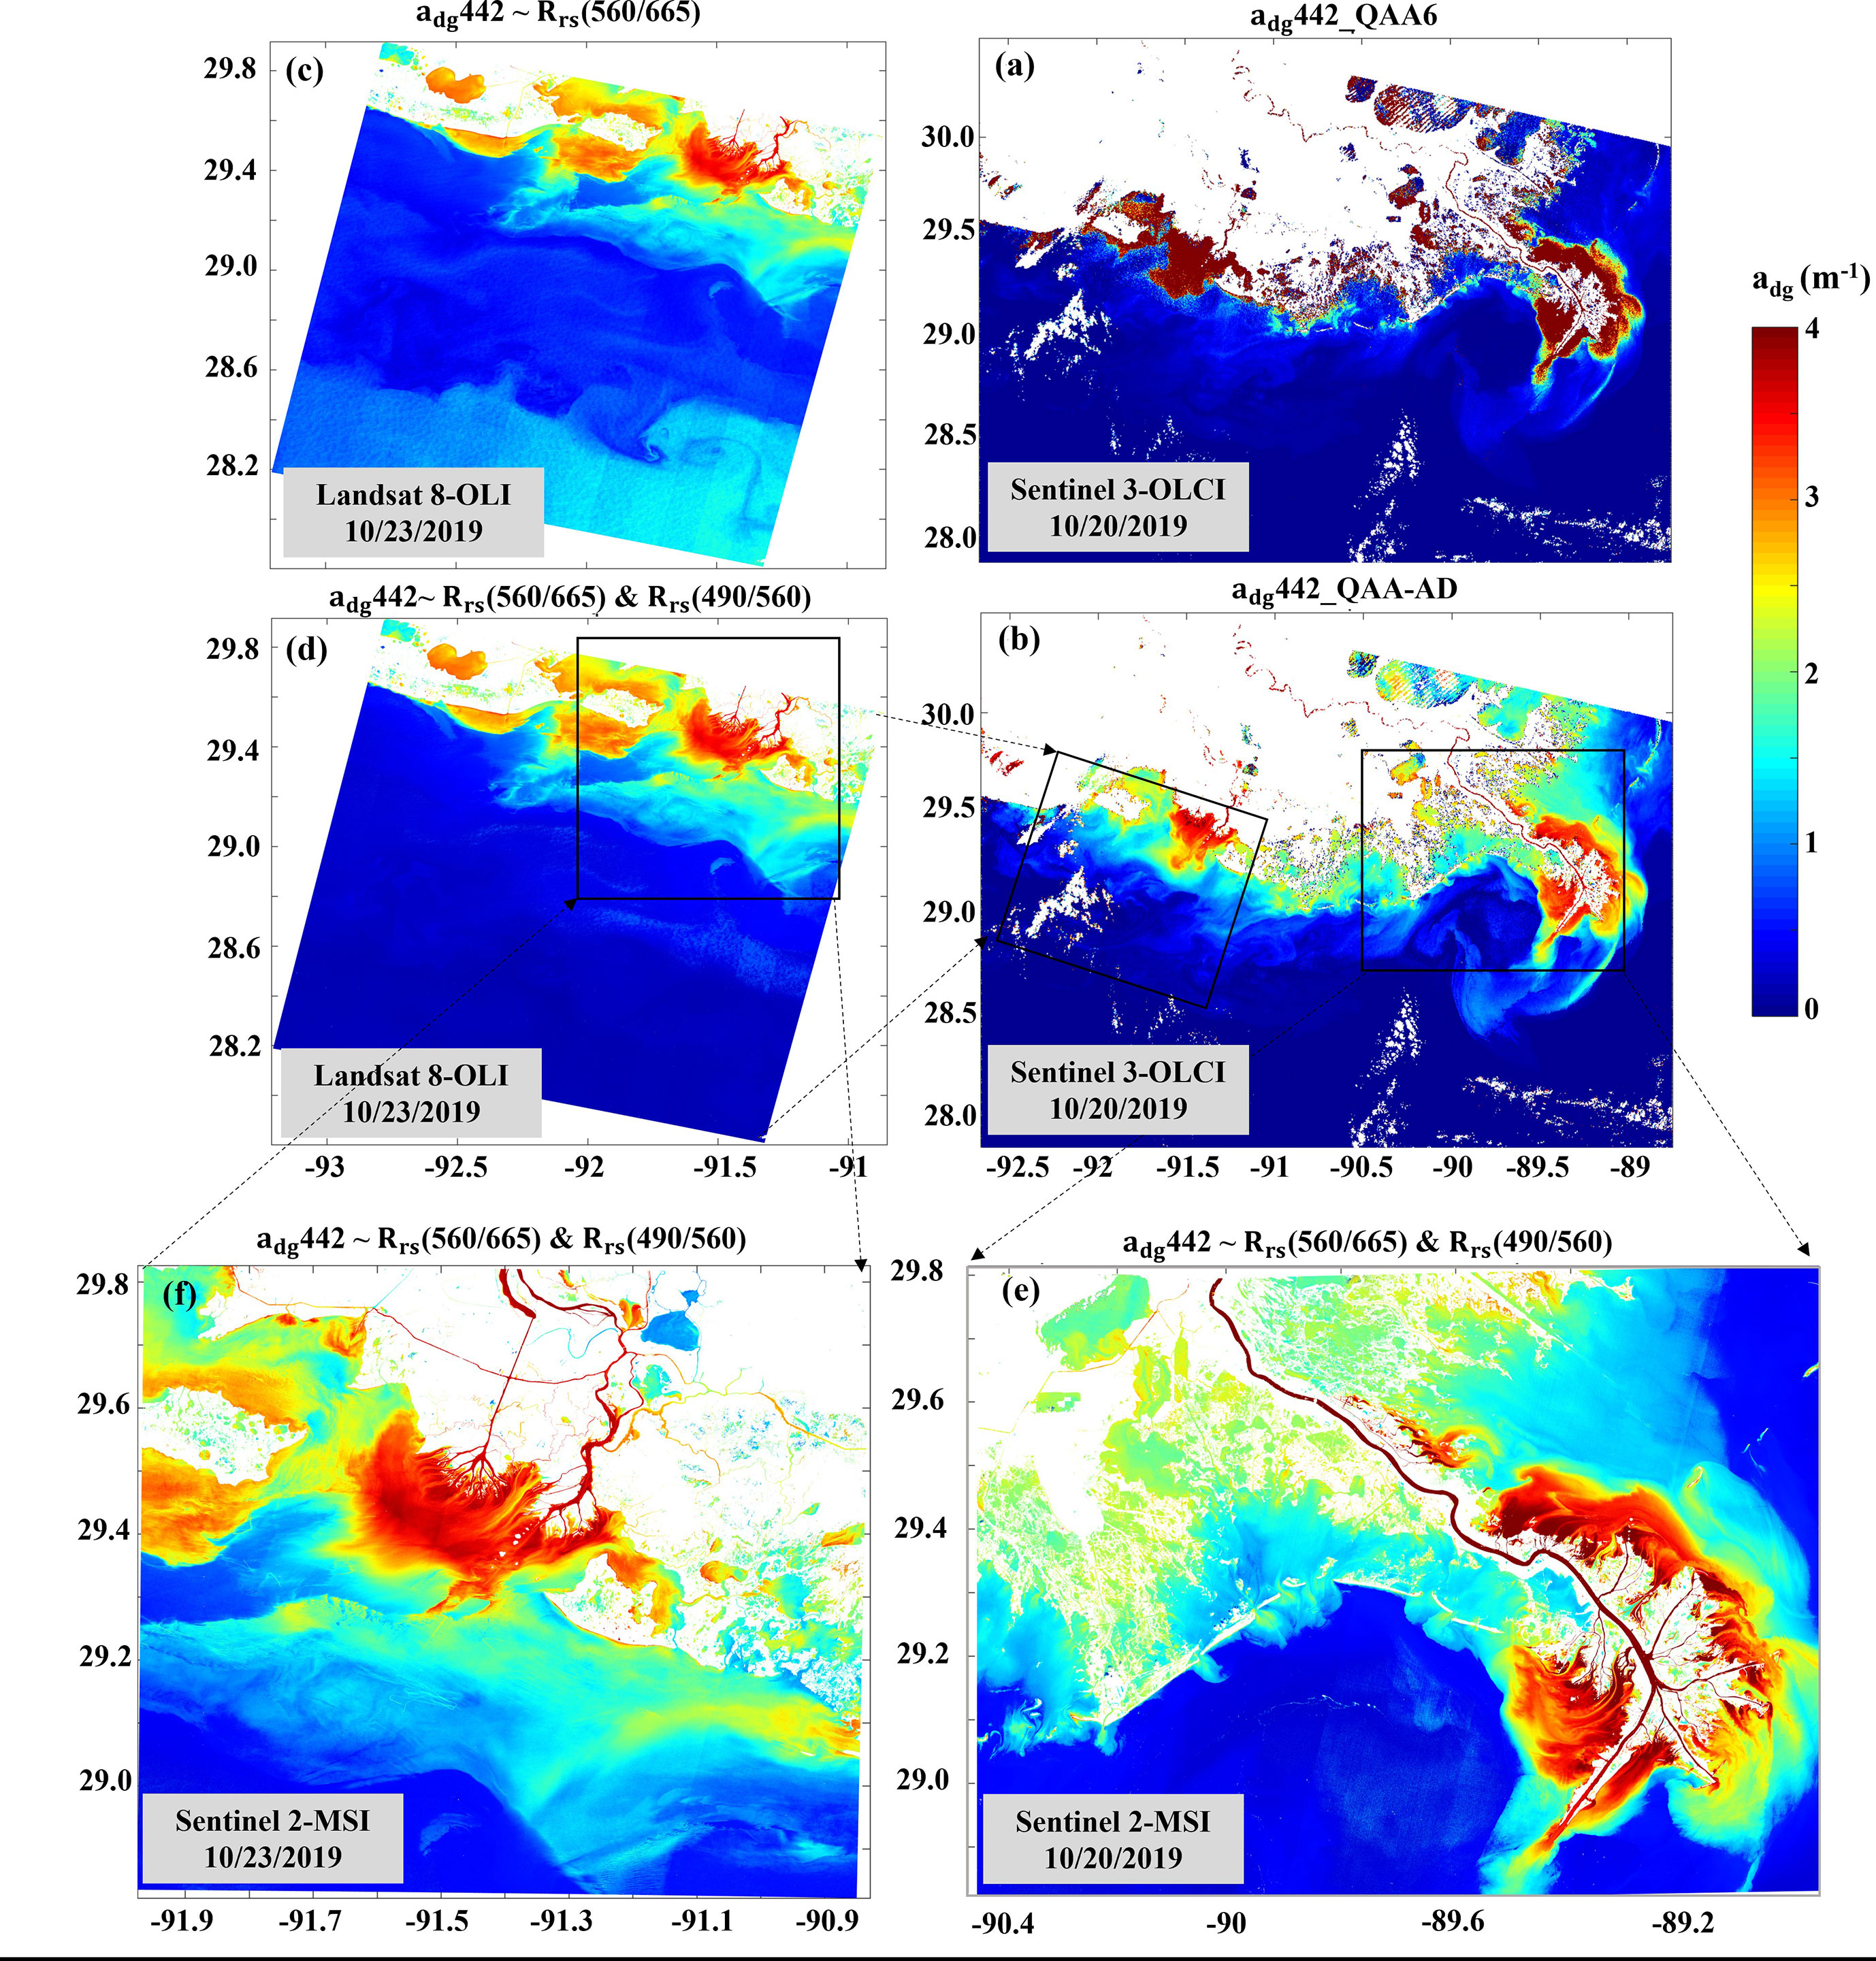
Figure 6 Sentinel 3-OLCI adg442 on 20 October 2019 from (A) QAA-6 (Lee et al., 2014), and (B) QAA-AD; Landsat 8-OLI adg442 on 23 October 23 2019 with (C) Rrs(560/665) and (D) an adaptive procedure with Rrs(560/665) for estuaries and Rrs(490/560)) for shelf waters; Sentinel 2-MSI adg442 for (E) 20 October 2019 and (F) 23 October 2019.
Landsat 8-OLI imagery acquired on 23 October 2019 three days following OLCI, displayed same range of adg442 in the estuary, but overestimated in shelf waters, which was based on the green to red ratio (Figure 6C). With the adoption of adaptive procedure, adg442 estimates based on blue to green ratio (Eq. 7) and using the ρ threshold was used to replace adg442 in shelf waters (Figure 6D). Further, higher resolution adg442 estimated from Sentinel2-MSI (10 m) obtained on the same day as OLI (Figure 6F) showed identical distribution patterns with OLI-adg442 in ARDE and shelf (Figure 6D). In Barataria Bay, MSI-adg442 revealed consistent distribution patterns compared to OLCI-adg442 for same day imageries on Oct. 20, 2019 (Figures 6E, C), demonstrating reliable performance of the adaptive QAA-AD in predicting adg442 across different satellite sensors with different spatial resolutions (e.g., OLCI - 300 m, OLI - 30m, and MSI -10m). For example, a difference map of adg442 (m-1) between Landsat 8-OLI (Figure 6D) and Sentinel 2-MSI (Figure 6F) acquired on 23 October, 2019 showed negligible difference in the overlapping images in the highly turbid estuarine to coastal ocean waters (Supplementary Figure S2-3). The identical spatial patterns of adg442 distribution in the estuary enables long-term monitoring of DOC concentrations with higher temporal resolution, particularly, MSI at 10m resolution, which largely facilitated the assessment of DOC fluxes from small streamflows and tidal wetlands to estuaries and coastal ocean.
3.3 Spatiotemporal patterns of DOC distribution in the estuarine-coastal system (2019-2021)
Satellite-derived DOC were used to examine (i) seasonal patterns in the estuaries and shelf waters of coastal Louisiana (Figure 7), (ii) time series in the major inland lakes/estuaries and rivers (Figure 8), (iii) impacts of a cold front (Figure 9) and hurricane passage (Figure 10), and (iv) and assess DOC fluxes during the extreme river discharge year and the passage of hurricane Barry in 2019 (Figures 11, 12).
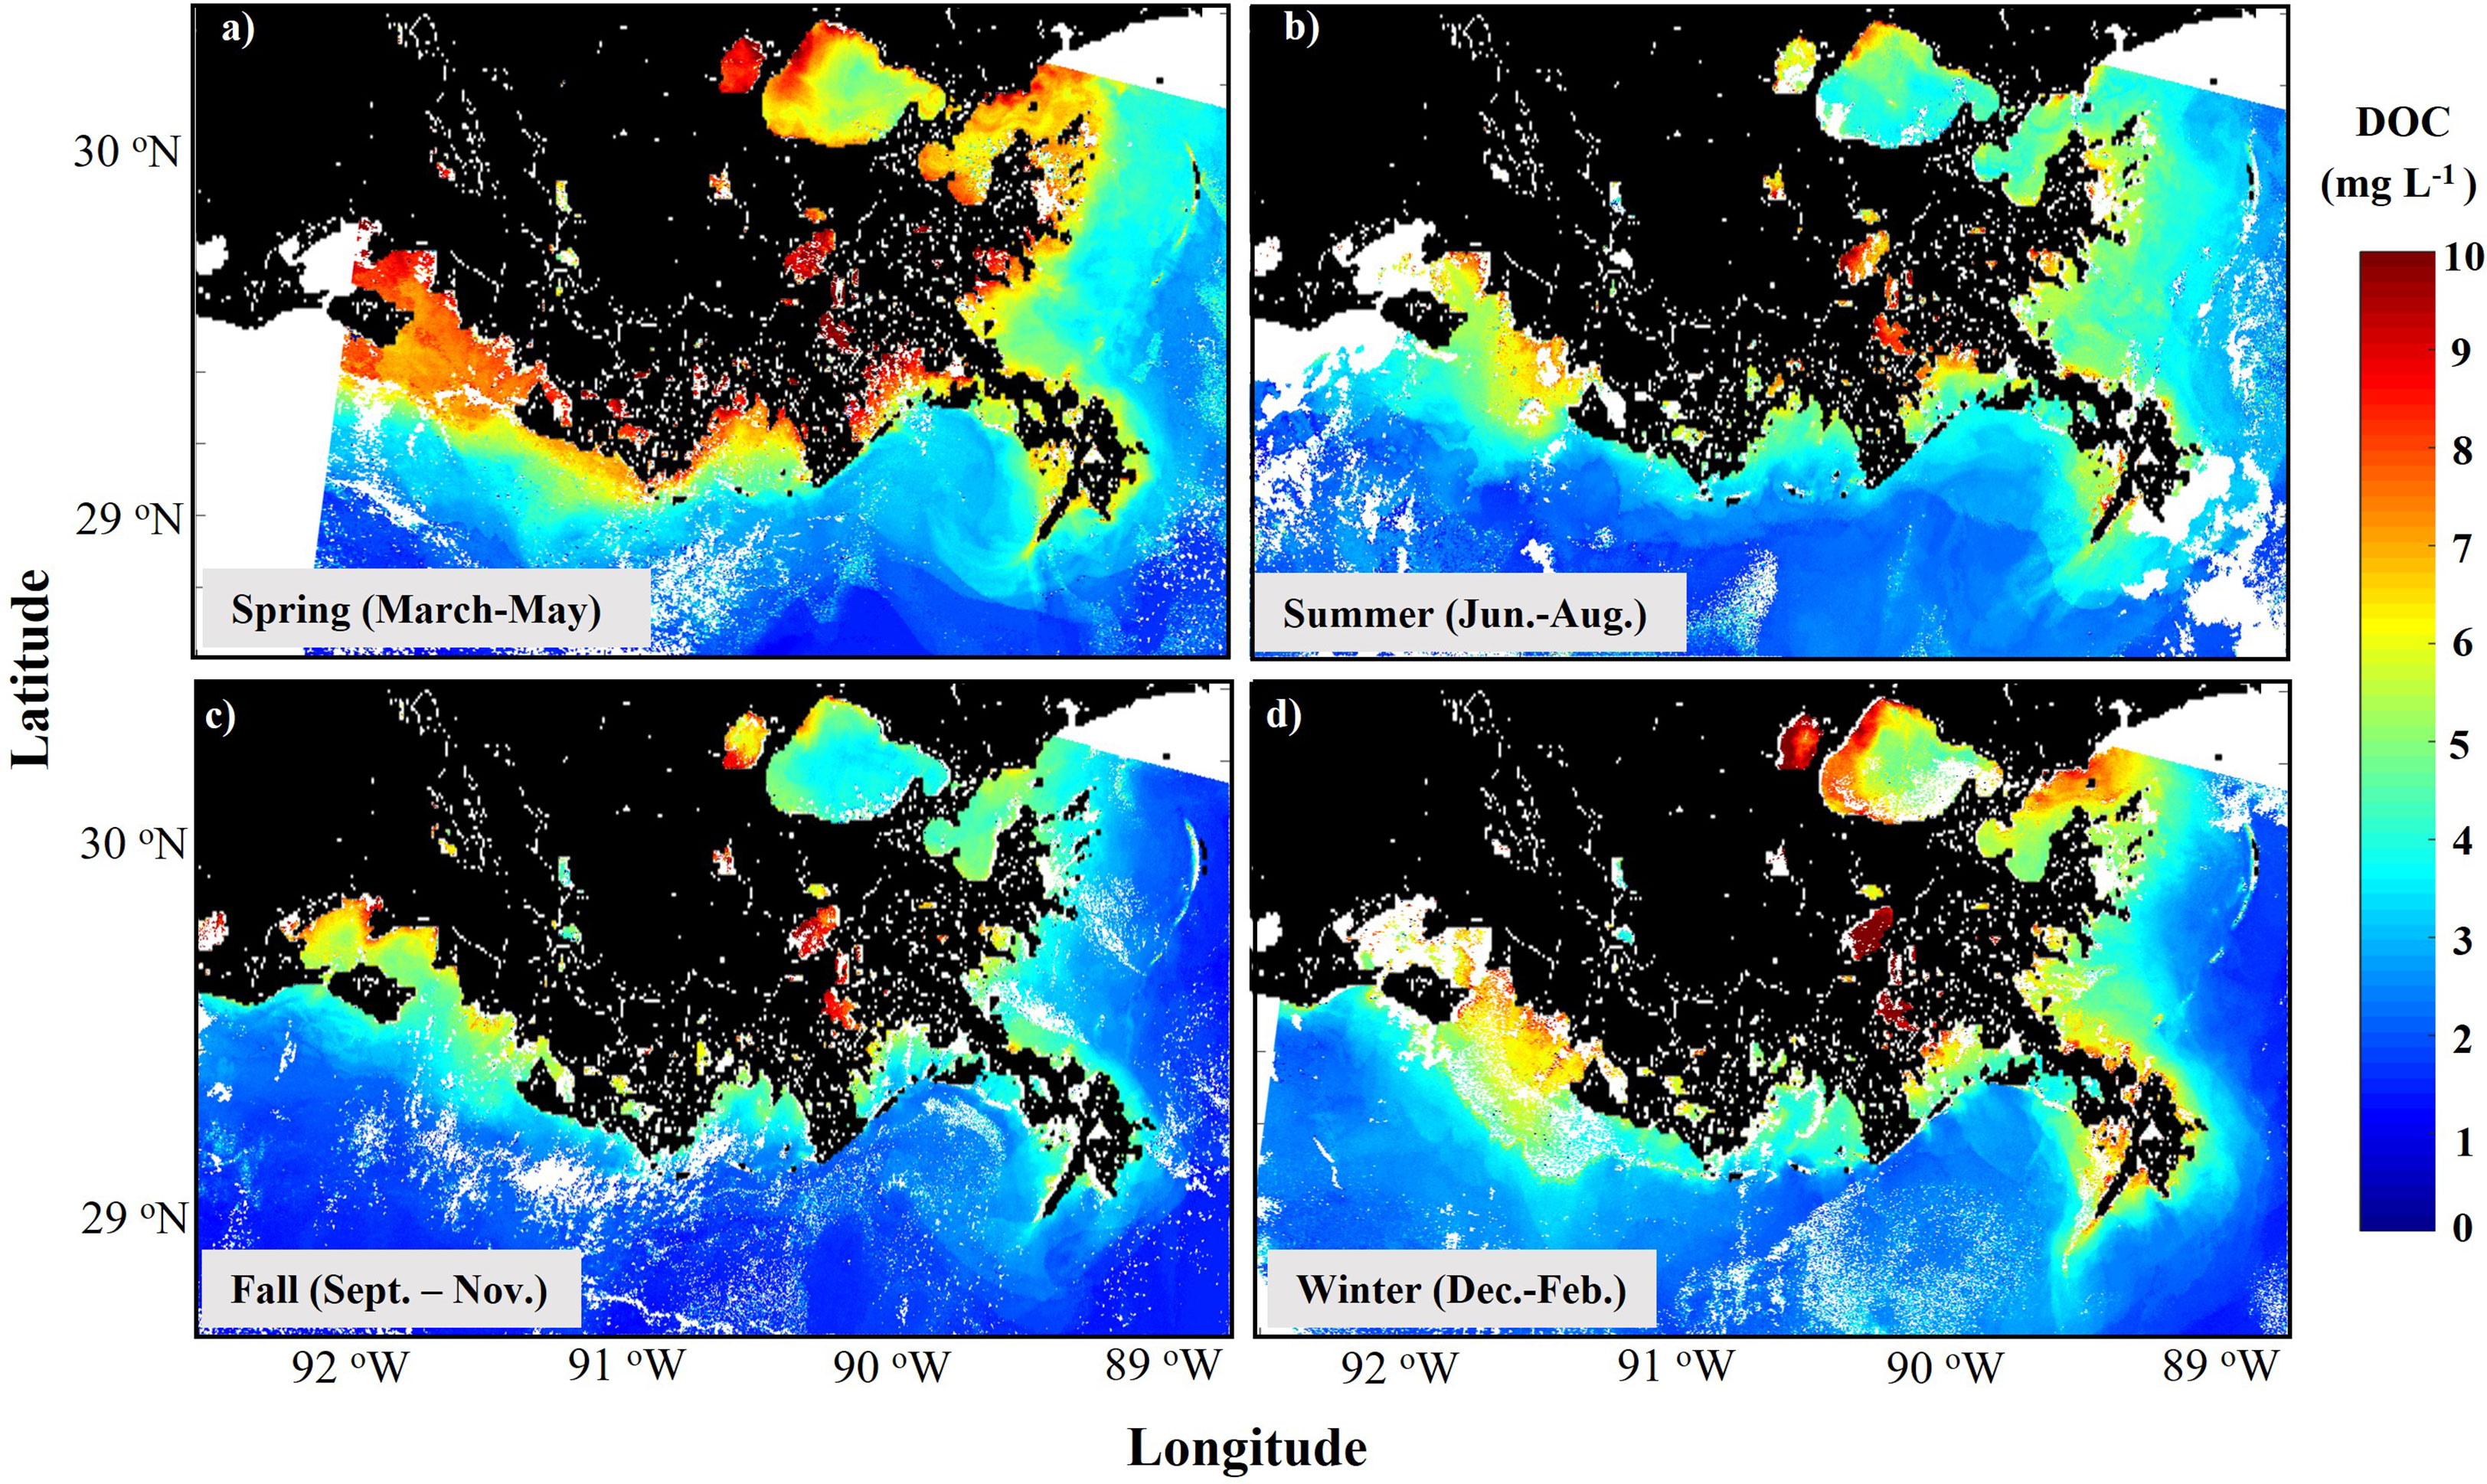
Figure 7 Seasonally-averaged DOC concentrations in (A) spring (March–May), (B) summer (June–August), (C) fall (September–November) and (D) winter (December–February) in coastal Louisiana.
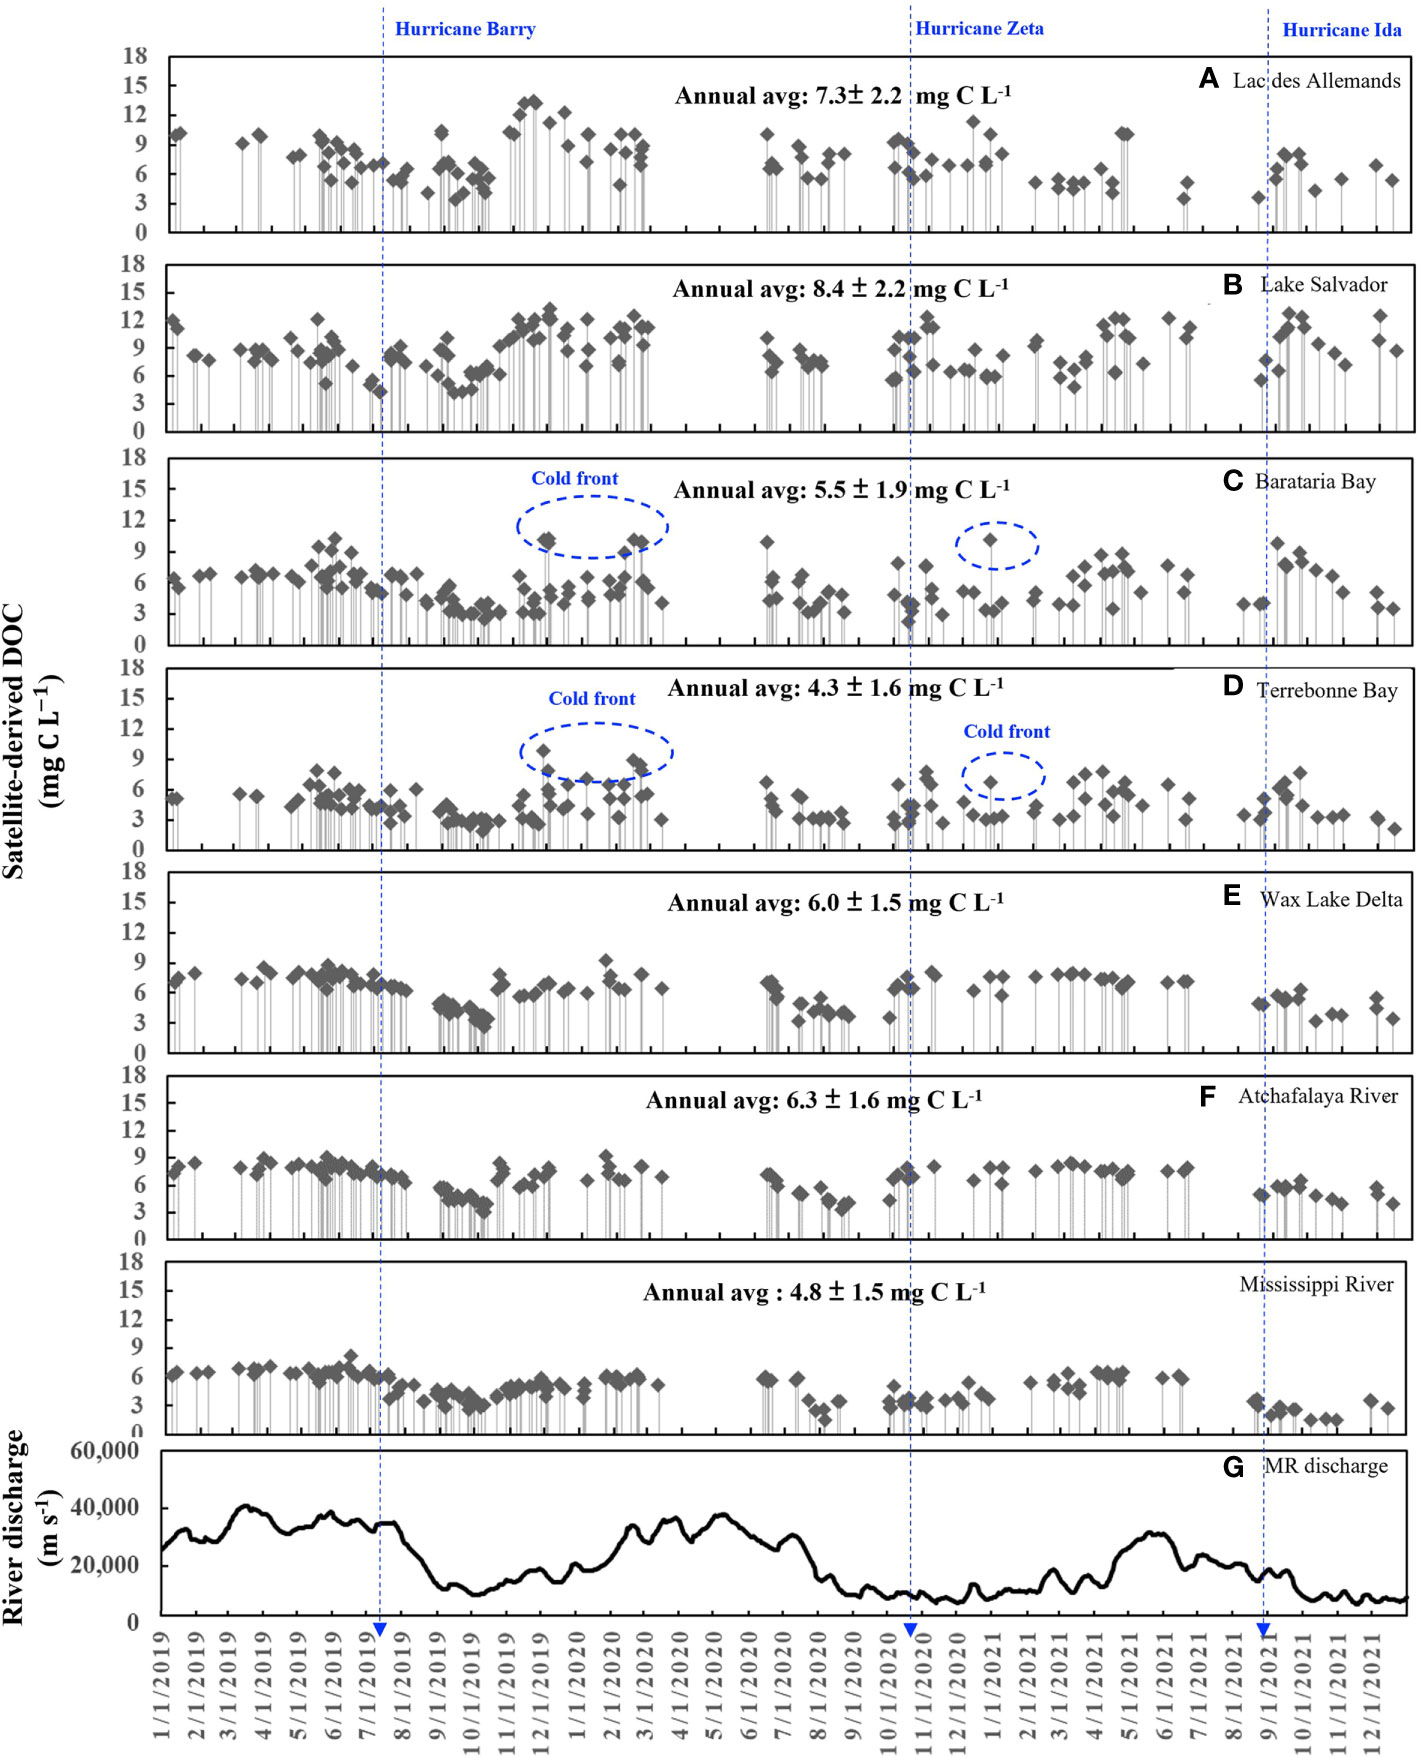
Figure 8 Time series DOC concentrations (01 January 2019 to 31 December 2021) generated from multi-satellites for major inland lakes/estuaries and rivers in coastal Louisiana: (A) Lac des Allemands, (B) Lake Salvador, (C) Barataria Bay, (D) Terrebonne Bay, (E) Wax Lake Delta, (F) Atchafalaya River, and (G) Mississippi River. (H) illustrates daily averaged Mississippi River discharge at Tarbert Landing, Louisiana (U.S. Army Corps of Engineers Gauge# 01100Q).
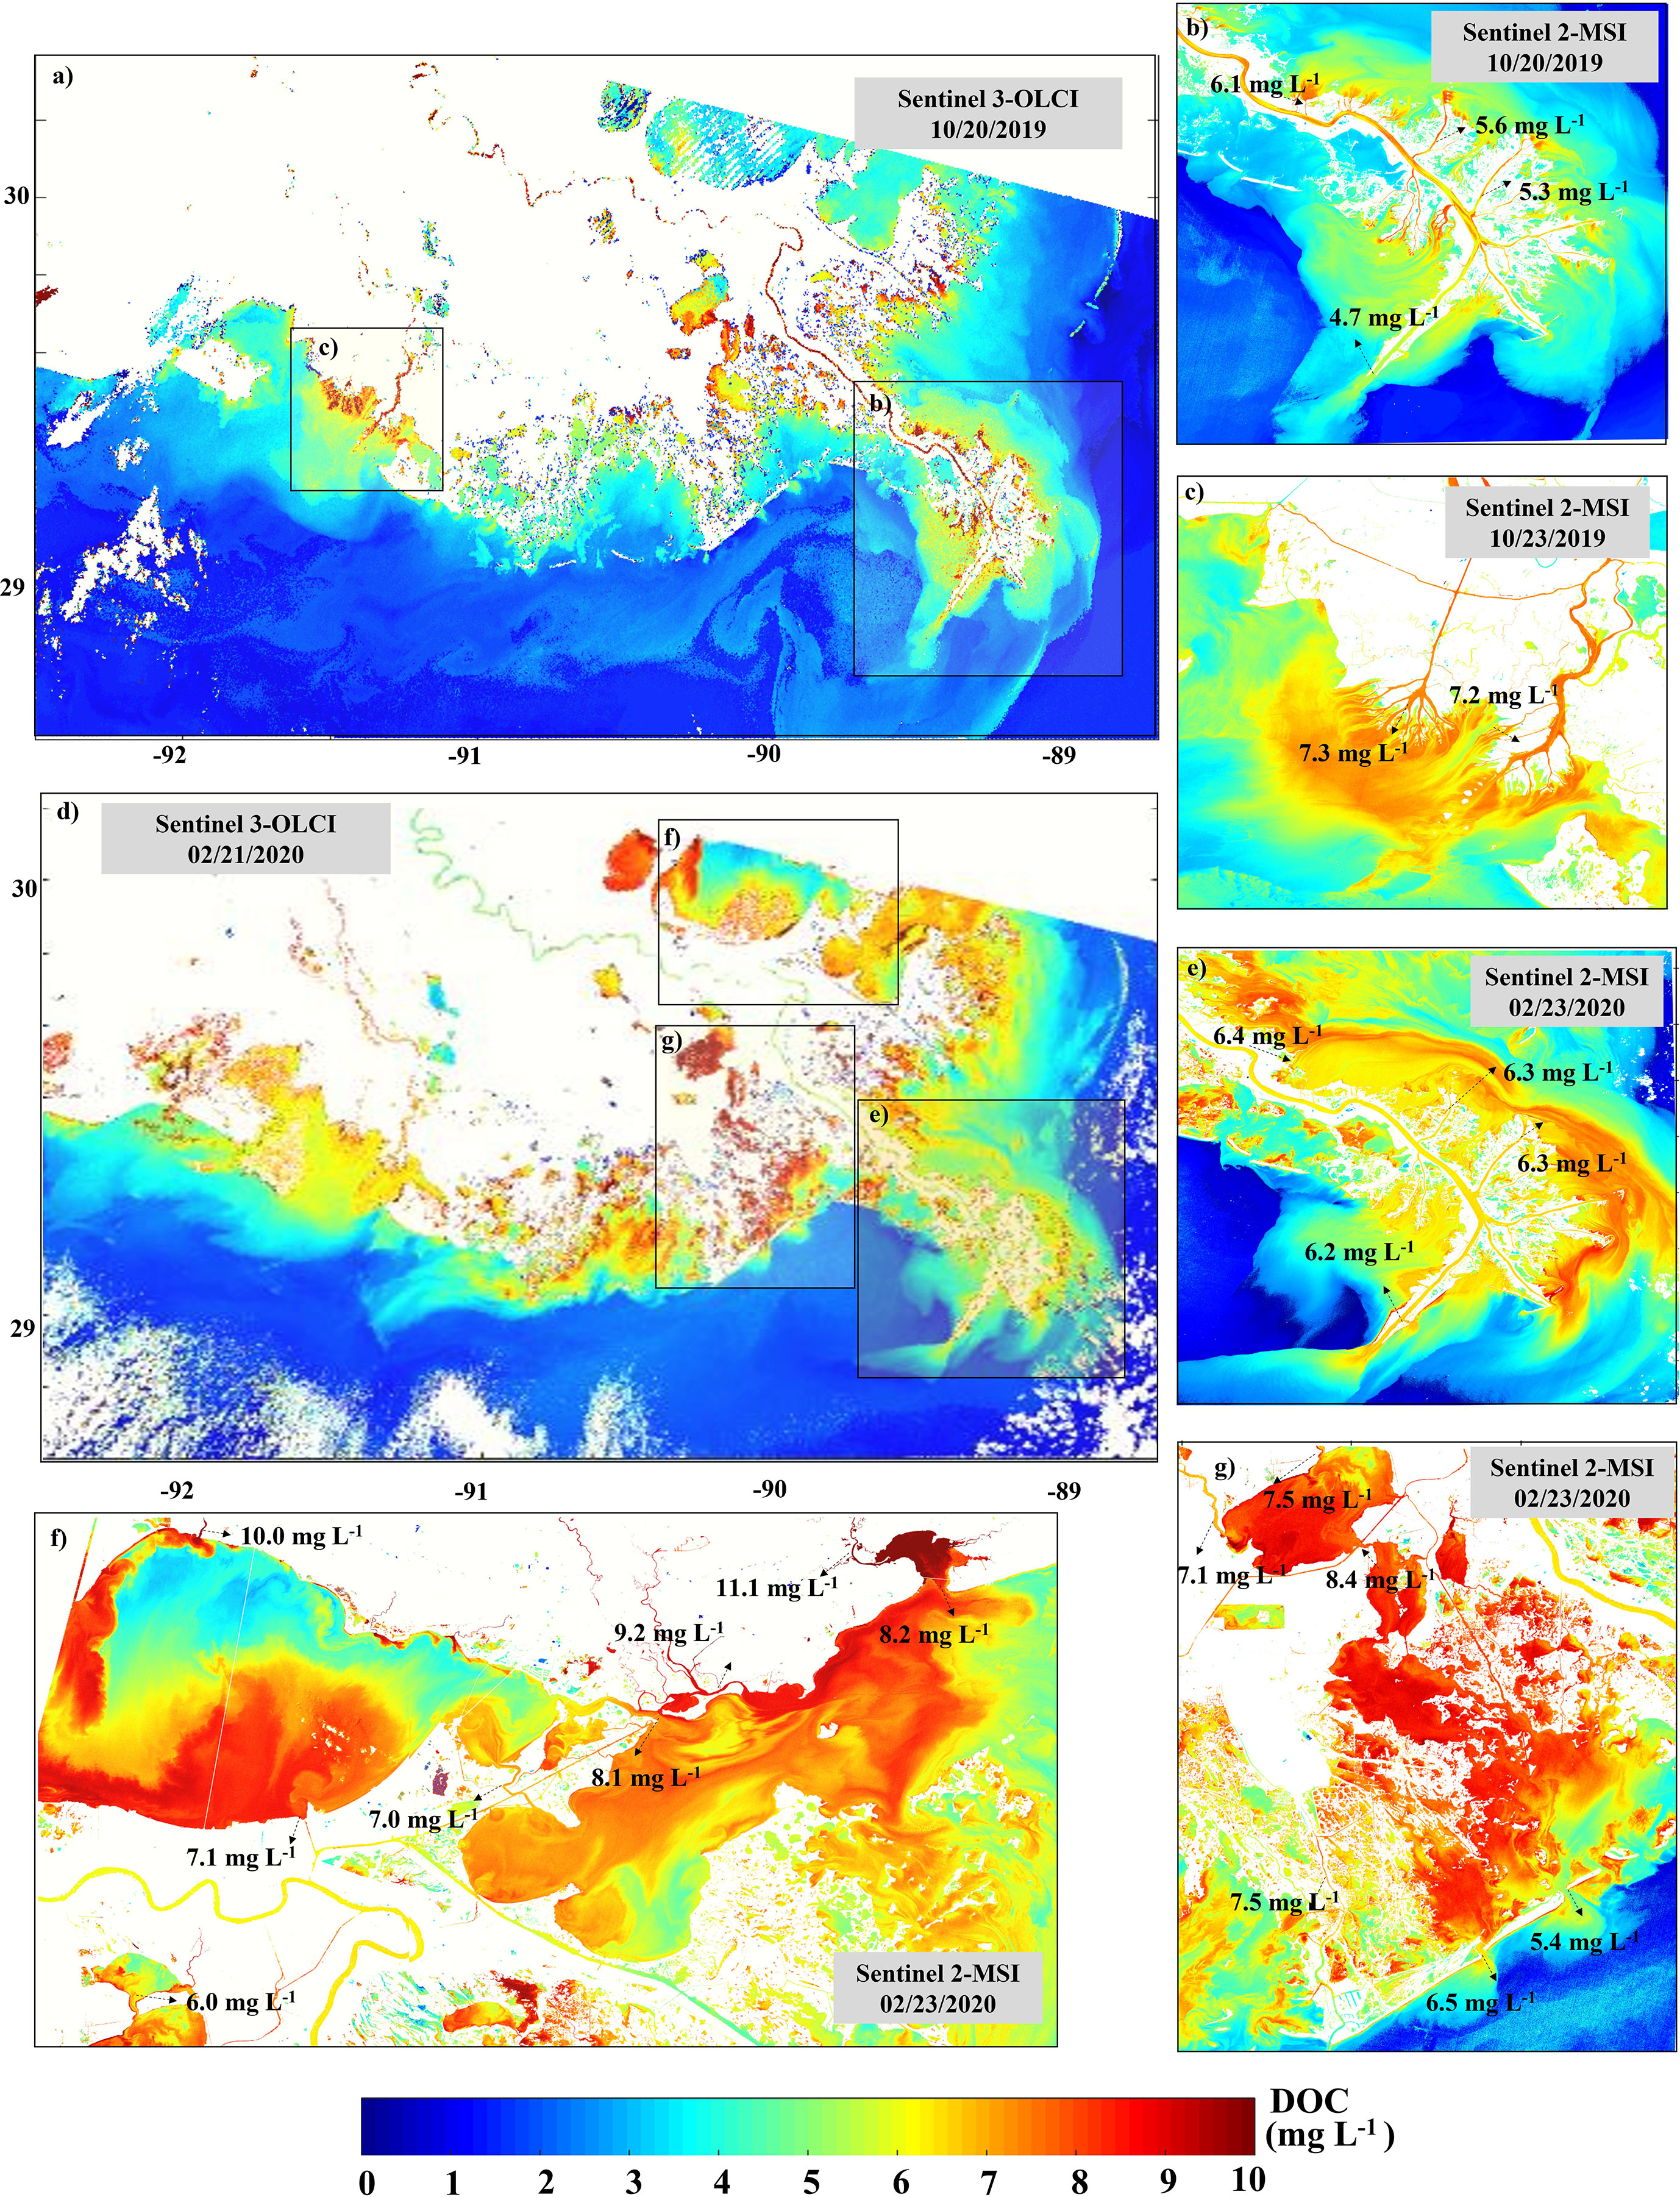
Figure 9 DOC concentrations estimated from QAA-AD for multi-satellite sensors: (A) OLCI-DOC, and (B, C) MSI-DOC acquired on 20-23 October 2019 under normal conditions; (D) OLCI-DOC, (E, F) MSI-DOC, and (G) OLI-DOC obtained on 22-23 February 2020 following a frontal passage.
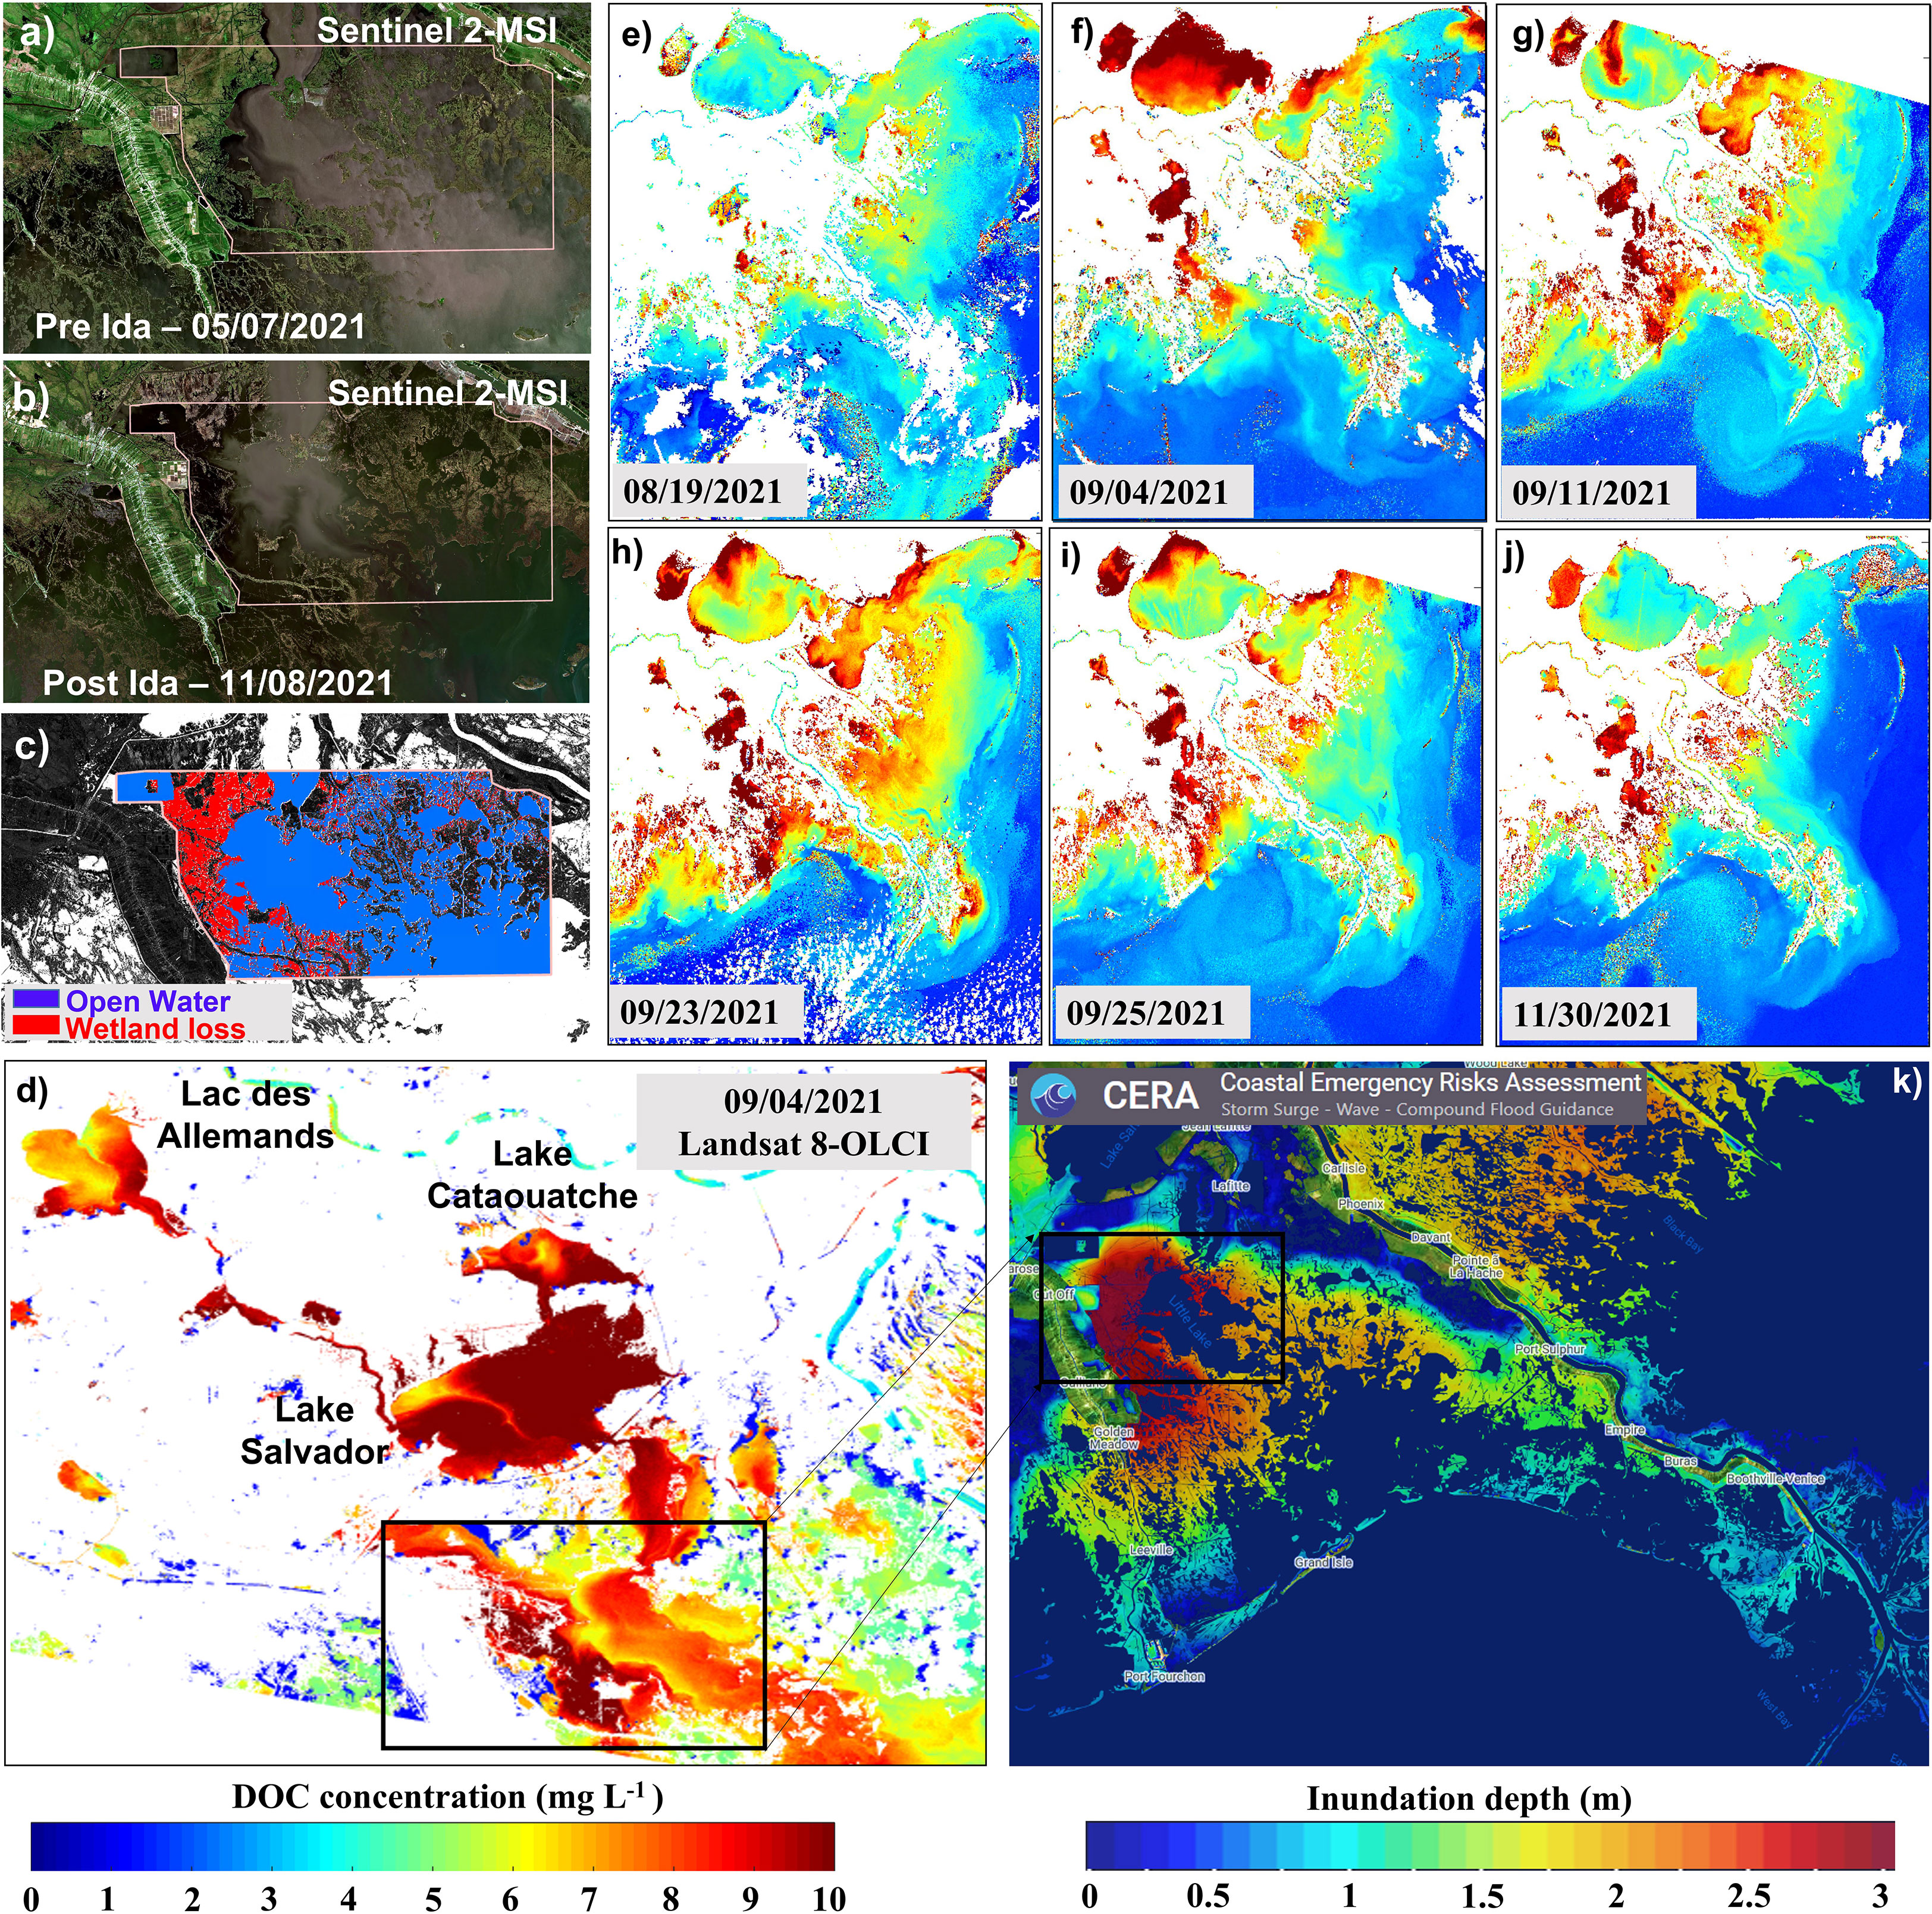
Figure 10 Wetland loss, DOC dynamics and inundation caused by Hurricane Ida. (A–C) wetland loss from Sentinel 2-MSI pre- and post-Ida. (D) DOC on 04 September 2021 estimated from Landsat 8-OLI. (E–J) DOC estimated from a sequence of Sentinel 3-OLCI imagery before and following Hurricane Ida. (K) Inundation depth caused by Ida on 29 September 2021 (publicly available on the Coastal Emergency Risks Assessment (CERA) website).
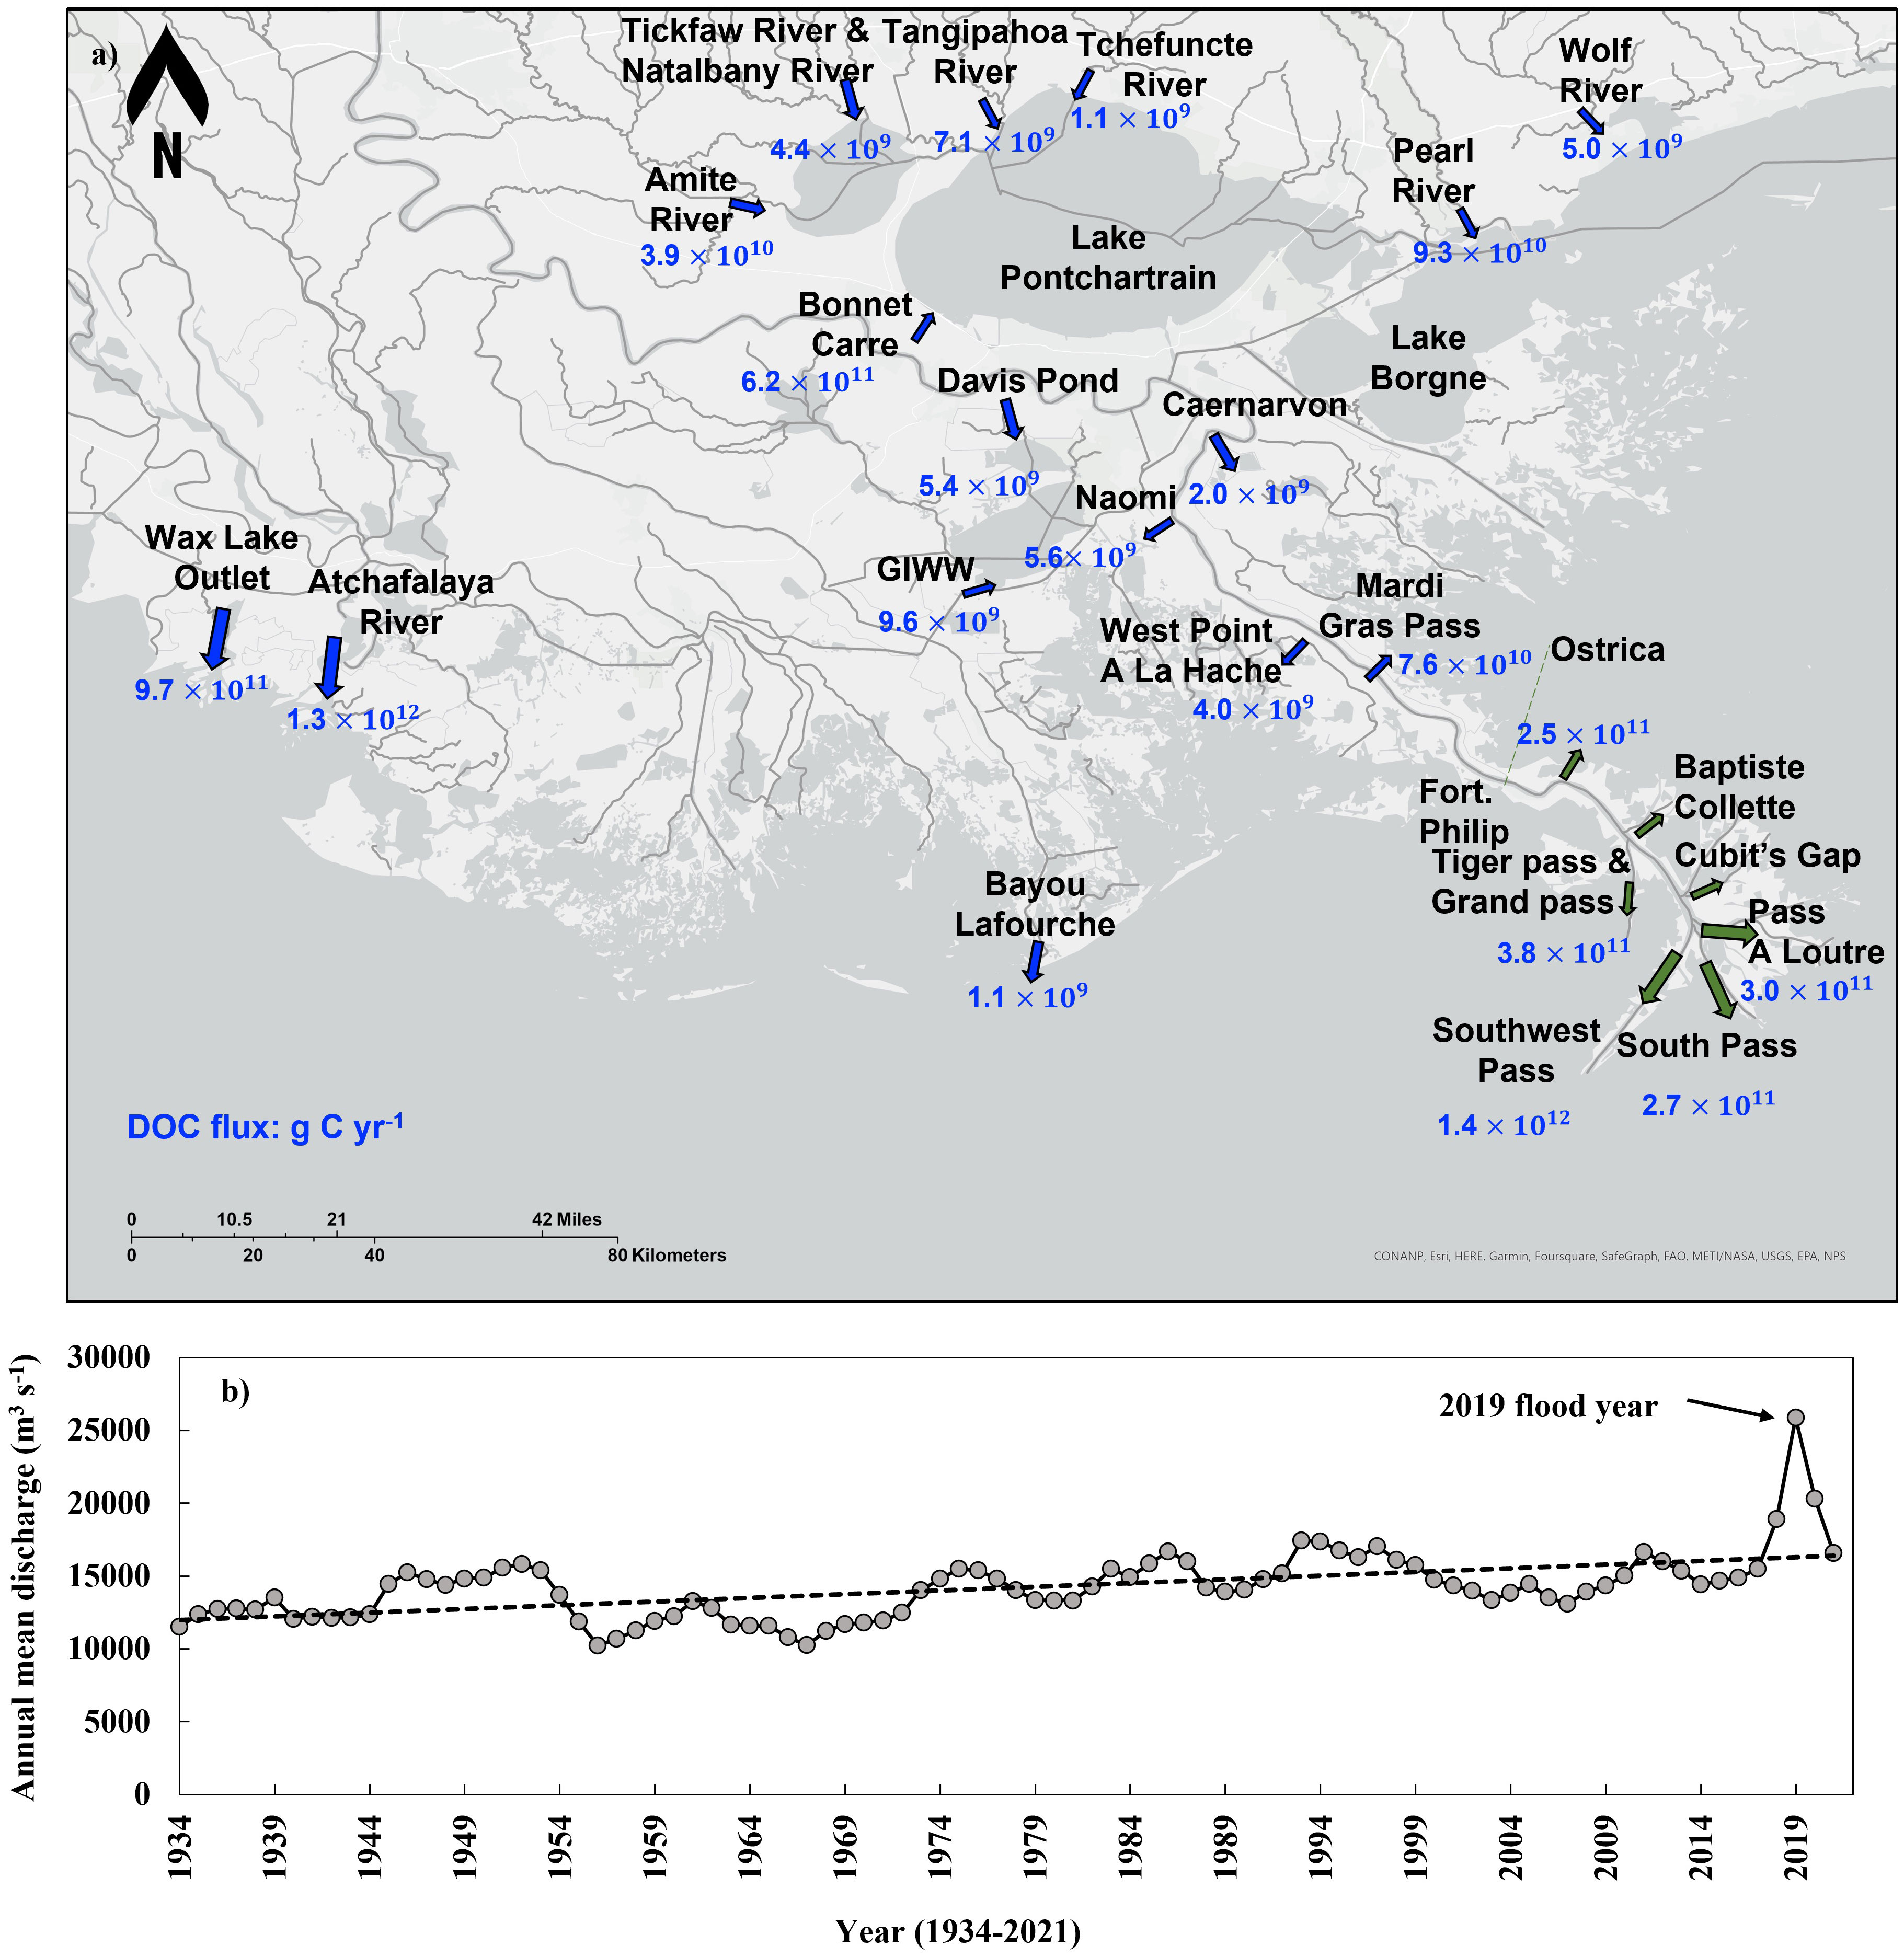
Figure 11 (A) DOC fluxes from channels and rivers into inland-estuarine and shelf waters inferred from observations and remote sensing. Solid blue/green arrows denote DOC fluxes. Mean water fluxes were estimated from daily discharge measured at USGS station, or relationships with the Mississippi River discharge at Tarbert Landing or Belle Chasse. (B) Long-term discharge trend (1934-2021) of lower Mississippi River observed at Tarbert Landing, Louisiana (U.S. Army Corps of Engineers Gauge# 01100Q).
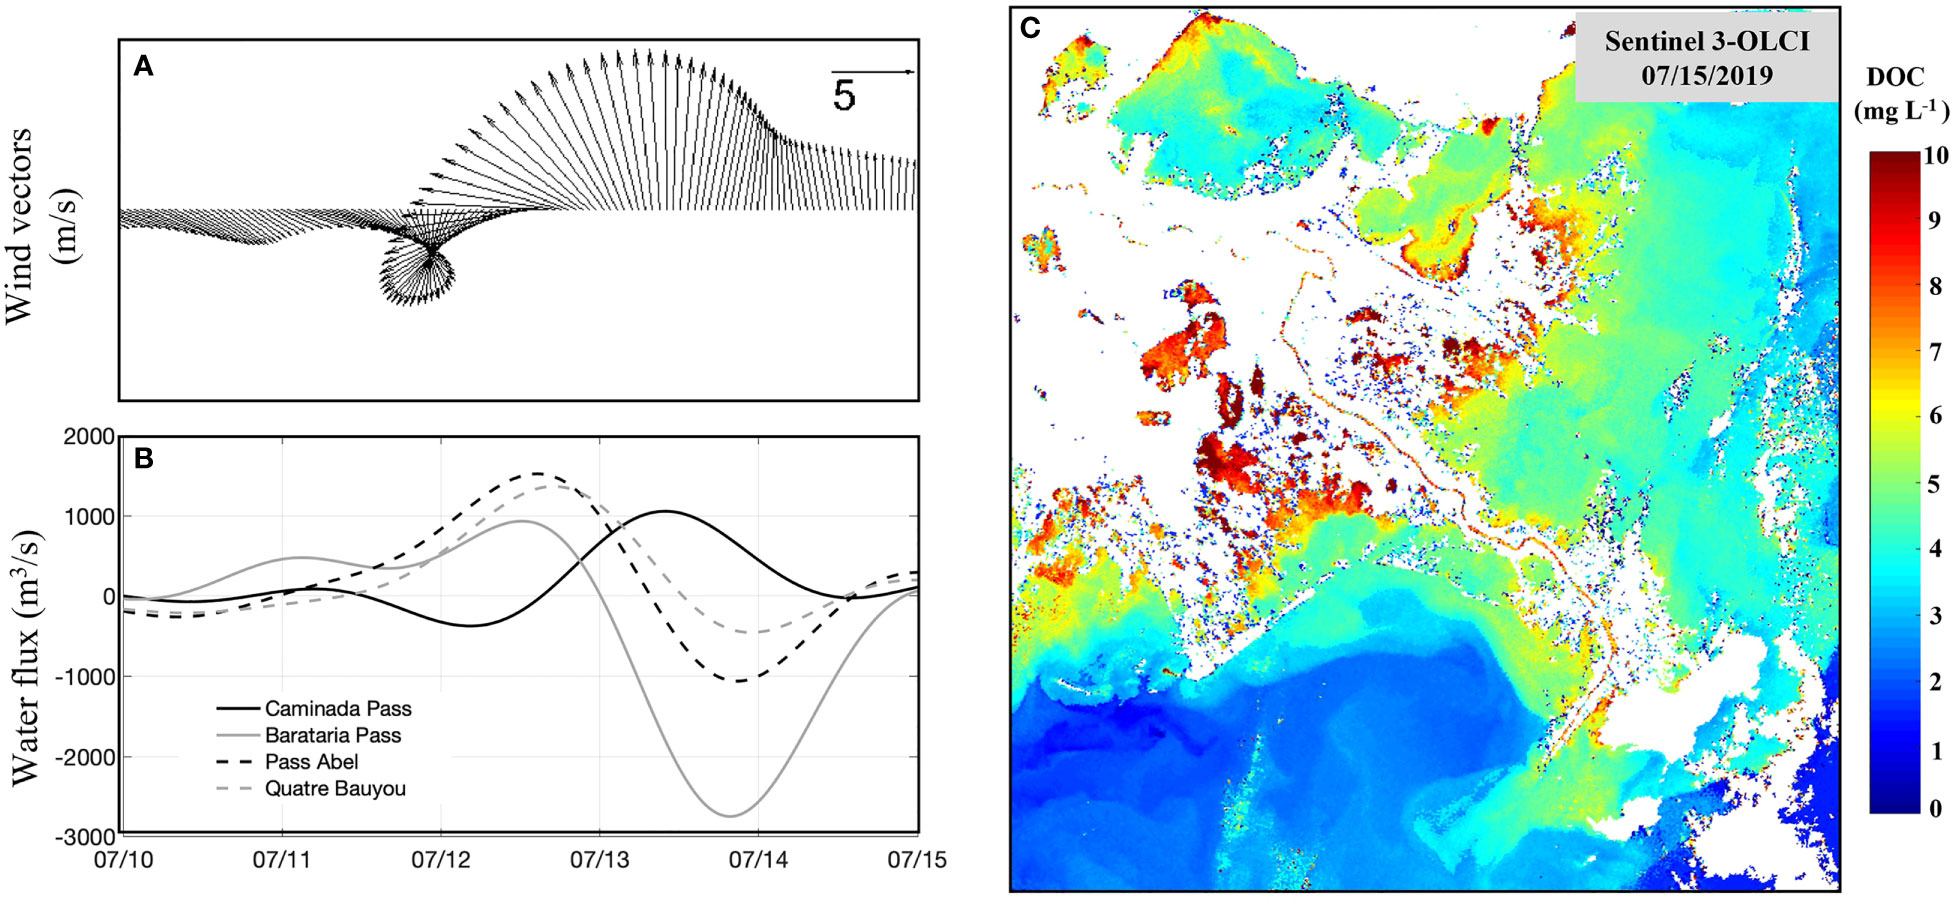
Figure 12 (A) Wind vectors during Hurricane Barry (10 – 15 July 2019) with max wind magnitude of 14.5 m/s); (B) volume flux (positive/negative into/out of bay) estimated from FVCOM through four inlets connecting Barataria Basin to shelf waters during Hurricane Barry (Huang and Li, 2020). (C) OLCI-derived DOC obtained on 15 July 2019.
3.3.1 Seasonal trends and multi-year patterns
OLCI-DOC obtained between January 2019 to December 2021 were clustered and averaged into seasons - spring (March-May), summer (June-August), fall (September-November) and winter (December-February) (Figure 7). Overall, highest DOC was observed across inland-estuarine-coastal waters in spring, with a decreasing trend in the summer and fall followed by an increase in the winter (Figure 7). In spring, DOC varied in the range 6.5-9.9 mg L-1 in the estuaries (e.g., upper Barataria Basin and Wax Lake Delta). DOC was lowest in summer (range: 3.5-8.0 mg L-1) with Barataria Basin displaying relatively higher values (~8.1 mg L-1; Figure 8B) compared for example, to Breton/Chandeleur Sound located east of the MR, (average ~ 5.0 mg L-1 in Chandeleur Sound), being slightly higher in summer than during fall and winter and generally showing smaller gradients across the estuary. The elevated DOC levels may be attributed to fresh inflows from Bonnet Carré spillway into Lake Pontchartrain, and from Caernarvon into Breton Sound, which were opened during spring/summer 2019 MR flood. During the fall season, DOC in ARDE, Terrebonne Bay, Barataria Bay and Breton/Chandeleur Sound showed the lowest values compared to other seasons. The exception was the upper Barataria Basin (e.g., Lake Salvador, and Little Lake), which showed a higher value (8.5 mg L-1) compared to summer months. In winter, it was observed that DOC in the shallow upper Barataria Basin showed the highest value (~ 11.8 mg L1; Figure 7D) compared to other estuaries and seasons; these elevated surface DOC values in spring and winter are likely linked to extreme weather events such as strong northerly winds that have been shown to have signatures from either resuspended material or increased lateral flux from the marshes (Arellano et al., 2019). In addition, extensive submerged aquatic vegetation (SAV) habitat in upper and middle Barataria Basin (Hillmann et al., 2020) could also potentially be a source of DOC; for example, Demarty and Prairie (2009) demonstrated that DOC release rates from SAV habitats ranging from undetectable to 9.7 mg C·m-2·h-1 in southern Quebec lakes. In shelf waters, DOC was highest during spring (2.9 ± 1.2 mg L-1) and lowest in the fall (1.8 ± 0.5 mg L-1) (Figure 7). These decreasing trends in surface DOC concentrations in the Louisiana shelf waters have been attributed to biomineralization, enhanced biomineralization of photochemically transformed terrestrial DOC, and direct photomineralization of the MR and AR derived DOC with spring-summer months contributing the most to these processes (Fichot et al., 2014).
Time series DOC concentrations were examined in major inland lakes, estuaries and the MR and AR using a combination of medium (OLCI A/B) and high (MSI and OLI) resolution satellite-derived DOC estimates (Figures 8A–G) with corresponding discharge from the MR (Figure 8H) shown to provide context of river conditions during the study period (2019 to 2021). The upper Barataria Basin inland lake - Lac des Allemands showed slight variation through the seasons (7.3 ± 2.2 mg L-1) with very high DOC (nearly 13.3 mg L-1) observed a few times in winter following cold front events (Figure 8A). Similarly, winter storms contributed to elevated DOC concentrations in Lake Salvador and the Barataria and Terrebone estuaries (Figures 8B–D). Lake Salvador, located in the mid-Barataria Basin (Figure 1C) show discernable seasonal patterns with higher DOC in spring and winter compared to summer and fall (Figure 8B). The impact of three hurricanes, namely, Barry in 2019, Zeta in 2020 and Ida in 2021 induced apparent increase of DOC in Barataria Basin (Figure 8C), and to a lesser extent in Terrebonne Bay (Figure 8D). Elevated DOC concentration was observed post-Ida lasting for about two months. In general, DOC concentration in Terrebonne Bay (annual average ~4.3 mg L-1) was lower compared to Barataria Bay (5.5 ± 2.0 mg L-1), which could be attributed to more tidal water exchanges between Terrebonne Bay and the nGoM as the inlets of Terrebonne Bay are much wider compared to those of Barataria Bay.
In ARDE, DOC in WLO (Figure 8E) showed very similar patterns as AR (annual mean range of 5.9-6.2 mg C L-1). Annual mean DOC in AR 6.3 ± 1.6 mg C L−1 (Figure 8F) with higher DOC concentrations corresponding to high flow conditions (e.g., January-July 2019 and April-June 2021) and passage of cold fronts (e.g., January – February 2021). Mean DOC concentration for AR was slightly higher compared to earlier studies (range from 4.6 ± 1.3 to 6.4 ± 2.1 mg C L−1; Leenheer, 1982; Lambou and Hern, 1983; Shen et al., 2012), likely due to the extreme flooding in 2019 (Figures 8H, 10C) that could have mobilized additional organic matter in the Atchafalaya floodplains. Relatively lower mean annual DOC was observed in MR (4.8 ± 1.5 mg L-1; Figure 8G) but with similar seasonal variability as AR with DOC higher in the winter-spring and lower during summer-fall season.
3.3.2 Impact of a cold front on DOC distribution
The DOC from OLCI, MSI and OLI acquired +/- 3 days under normal (October 20-23, 2019) and cold front conditions (February 22-23, 2020) are compared at multiple spatial scales in the MR and AR delta region (Figure 9); overall, a clear increase in surface DOC concentrations were observed following the cold front passage (Figures 9A, D). Under normal condition (e.g., calm winds ~2.3 m s-1 and low discharge from Mississippi River ~12,378 m3 s-1), DOC in Barataria Basin (Figure 9A), showed a clear decreasing gradient from upper (~6.5-8.9 mg L-1) to lower basin (~3.2-5.3 mg L-1). MSI-DOC at 10m spatial resolution further revealed patterns of DOC in small channels and rivers in MR delta (Figure 9B) and ARDE (Figure 9C). MSI detected a decreasing trend in DOC along the MR from 6.1 mg L-1 near Belle Chasse to 4.7 mg L-1 near Southwest Pass (Figure 9B). DOC in WLO (7.3 mg L-1) and AR (7.2 mg L-1) were similar but greater than MR.
In response to a cold front event (22-23 February 2020), DOC showed overall higher concentrations with large plumes extending offshore from the delta and the estuaries suggesting estuarine flushing into the nGoM (Figure 9D). Further, the high-resolution Sentinel 2-MSI clearly detected DOC at the inlets and narrow channels connecting marshes and estuaries showing overall higher levels compared to normal condition, (e.g., Figure 9F - Lake Pontchartrain, and Figure 9G – Barataria Bay), with highest levels (10.0 mg L-1) detected at Madisonville Point Fault into Lake Pontchartrain (Figure 9F). In Barataria Basin, DOC in the small channel that connects Lake Salvador and Little Lake was around 8.4 mg L-1 (Figure 9G). In comparison to the natural channels, it was observed that channels delivering river waters from man-made infrastructure, such as Davis Pond Freshwater Diversion and Gulf Intracoastal Waterway delivered DOC-rich waters (6.0-7.1 mg L-1) into small inland lakes of Barataria Basin (Figure 9F). Further, the Rigolets (8.1 mg L-1) and Pearl River (9.2 mg L-1) were two significant DOC sources into Lake Borgne, which connects Lake Pontchartrain to the nGoM (Figure 9G), while DOC delivered through MR following a cold front event was also much higher than under normal conditions (Figures 9B, E).
3.3.3 DOC response to three hurricane passages – Barry, Zeta and Ida
During the study period (2019-2021), three hurricanes, namely, Barry in 2019, Zeta in 2020 and Ida in 2021 made landfall along the Louisiana coast and appeared to have the greatest impact on DOC distributions and carbon cycling in the Barataria Basin. Hurricane Barry made landfall as a Category 1 hurricane on Marsh Island, Louisiana with maximum reported storm-total rainfall of 0.58 m near Ragley, Louisiana (Huang and Li, 2020). A step increase in DOC concentration following the hurricane passage was mainly observed in Lake Salvador, Barataria and Terrebone bays (Figure 8), with elevated DOC concentrations (7.9-10.2 mg L-1) observed in the upper Barataria Basin; we further examine DOC fluxes from the bay into the shelf following the hurricane passage (section 3.4.3). Hurricane Zeta was a late season (28 October 2020) major category 3 hurricane that made landfall at Cocodrie, Louisiana. An average increase of 4.1 and 4.6 mg C L-1 was observed in Terrebone and Barataria bays, respectively (Figure 8).
Another major hurricane that impacted the study region was Ida, which made landfall on 29 August 2021 near Port Fourchon as a major category 4 hurricane with maximum sustained winds of 240 km/h, intense precipitation and a near 3.6 m storm surge that flooded wide swaths of coastal Mississippi and Louisiana (Hanchey et al., 2021), and damaged vast wetlands in middle Barataria Basin. DOC increase was observed in all water bodies post-Ida (Figures 10E, F) indicating runoff, resuspension or wetland loss as significant DOC sources. Hurricane Ida significantly damaged marshes by scouring and eroding the sediments in middle Barataria Basin, which was dominated by Spartina patens (a species belonging to brackish marsh; Couvilion, 2017). The modified normalized difference water index (MNDWI) based on the MSI green and shortwave infrared bands was used to generate land/water maps before and after Hurricane Ida (pink polygon; Figures 10A, B). It was observed that marsh areas south of Lake Salvador, east of Delta Farms and Clovelly Farms and west of Little Lake had converted into open water habitats (10b). According to Coastal Emergency Risks Assessment (CERA)’s estimates, storm surge from Ida reached a maximum height of 3 m near the lost wetlands. Through “pixel-to-pixel” comparison, area of wetland loss was estimated at about 1.34×10⁸ m2 (red area; Figure 10C). Concurrently, a dramatic increase of DOC concentration was observed in the wetland-loss area (16.4 mg C L-1; Figures 10D, F) on 4 September four days after Ida, a value almost 3 times greater than the annual-average of 6.5 mg C L-1 reported for the middle Barataria area (Liu et al., 2019a). Meanwhile, the inundation depth on 29 August 2021 predicted by the advanced circulation (ADCIRC) storm surge model showed ~ 3.0 m inundation at wetland loss area. When eroding wetlands are converted to open water, wetland biomass and organic carbon sequestrated in soil can be partially lost as DOC into adjacent aquatic pools (Lane et al., 2016; Sapkota and White, 2019). Thus, the high DOC concentration observed post Ida could be associated with storms surge water inundating the marsh and bringing out DOC from surface organic layer and porewater when it recedes as well as higher leaching ability of salt water; it was observed that the high DOC concentration in wetland-loss area in middle Barataria Basin on 04 September 2021 (Figure 10F) was flushed into Barataria Bay as observed in the DOC map on 11 September 2021 (Figure 10G). The DOC-rich waters (11.4 mg L-1) were further delivered to the coastal ocean mainly through the Caminada Pass (13.2 mg C L-1; Figure 10G) rather than Barataria Pass (5.8 mg C L-1; Figure 10G). Hurricane-induced carbon export from wetland-estuary to coastal ocean are complicated and determined by compounding factors including hydrodynamic conditions, type and location of estuaries, lability and the composition of terrigenous DOC, as well as intensity, track and forward speed of storms. Ida had much longer influence (2 months) across the wetland-estuary system in Barataria Basin with high DOC concentrations dropping to normal level by the end of November (Figure 10J). Given that hurricane intensity and frequency are projected to increase due to climate change (Kunkel et al., 2022), increase in DOC export flux may be critical enough to change the coastal waters as net source of CO2 to the atmosphere.
3.4 DOC fluxes into nGoM during an extreme flood year (2019)
3.4.1 Quantification of MR and AR DOC fluxes into nGoM
The year 2019 was a significant flood year with river stages exceeding flood stage at most sampling sites along the lower Mississippi River between December 2018-February 2019 and remaining elevated through late summer 2019 (Figure 8H; USACE). DOC time-series from OLCI, OLI, and MSI (Figures 8E–G) of MR, AR and WLO were further used to investigate flooding impacts on DOC fluxes for the year 2019. Bi-weekly mean DOC and river discharge were further calculated for MR, AR and Wax Lake Delta based on 2019 time-series. Averaged bi-weekly mean DOC for MR (5.5± 1.3 mg C L-1; Table 2) exhibited higher level compared to the averaged values of 2019-2021time-series (5.0 mg C L-1; Figure 8G), which was also at the higher end of previously reported values that ranged from 3.5-5.8 mg C L-1 (Shen et al., 2012). It was reported that the duration of flooding at Belle Chasse, Louisiana exceeded the records since the Great Mississippi Flood of 1927, with gauge records above flood stage for 211 days from 6 January to 4 August 2019 (USACE). The long-term annual mean MR discharge at Tarbert Landing, Louisiana (U.S. 458 Army Corps of Engineers Gauge# 01100Q), which is nearly 275 river kilometers upstream of Belle Chasse station (USGS 07374525) with the longest flow records for the lower MR revealed an increasing discharge trend from 1934 to 2021 (Figure 11B). The annual-mean discharge rate at USACE gauge station at Tarbert Landing (USACE # 01100Q) discharged 25,800 m3 s-1, approximately 2-3 to times the historical records (Figures 11B, S2-1). The combined elevated DOC and discharge levels in 2019 obtained bi-weekly under extreme flooding conditions (24,200 m3 s-1) at Belle Chasse resulted in a mean DOC flux of 4.5 Tg C yr−1for the MR; this estimate was significantly greater than previous DOC flux estimates (0.85–3.98 Tg C yr−1) that were based on discrete or short-term sampling (Leenheer, 1982; Shen et al., 2012; Duan et al., 2013; Spencer et al., 2013; Cai et al., 2015; Reiman and Xu, 2019) under relatively lower river discharges (13,900 – 17,400 m3 s-1). For example, the 15-yr (1996–2010) averaged DOC flux from the Mississippi River was 1.75 Tg C yr−1 (Shen et al., 2012) while the annual mean river discharge was 15,400 m3 s-1.
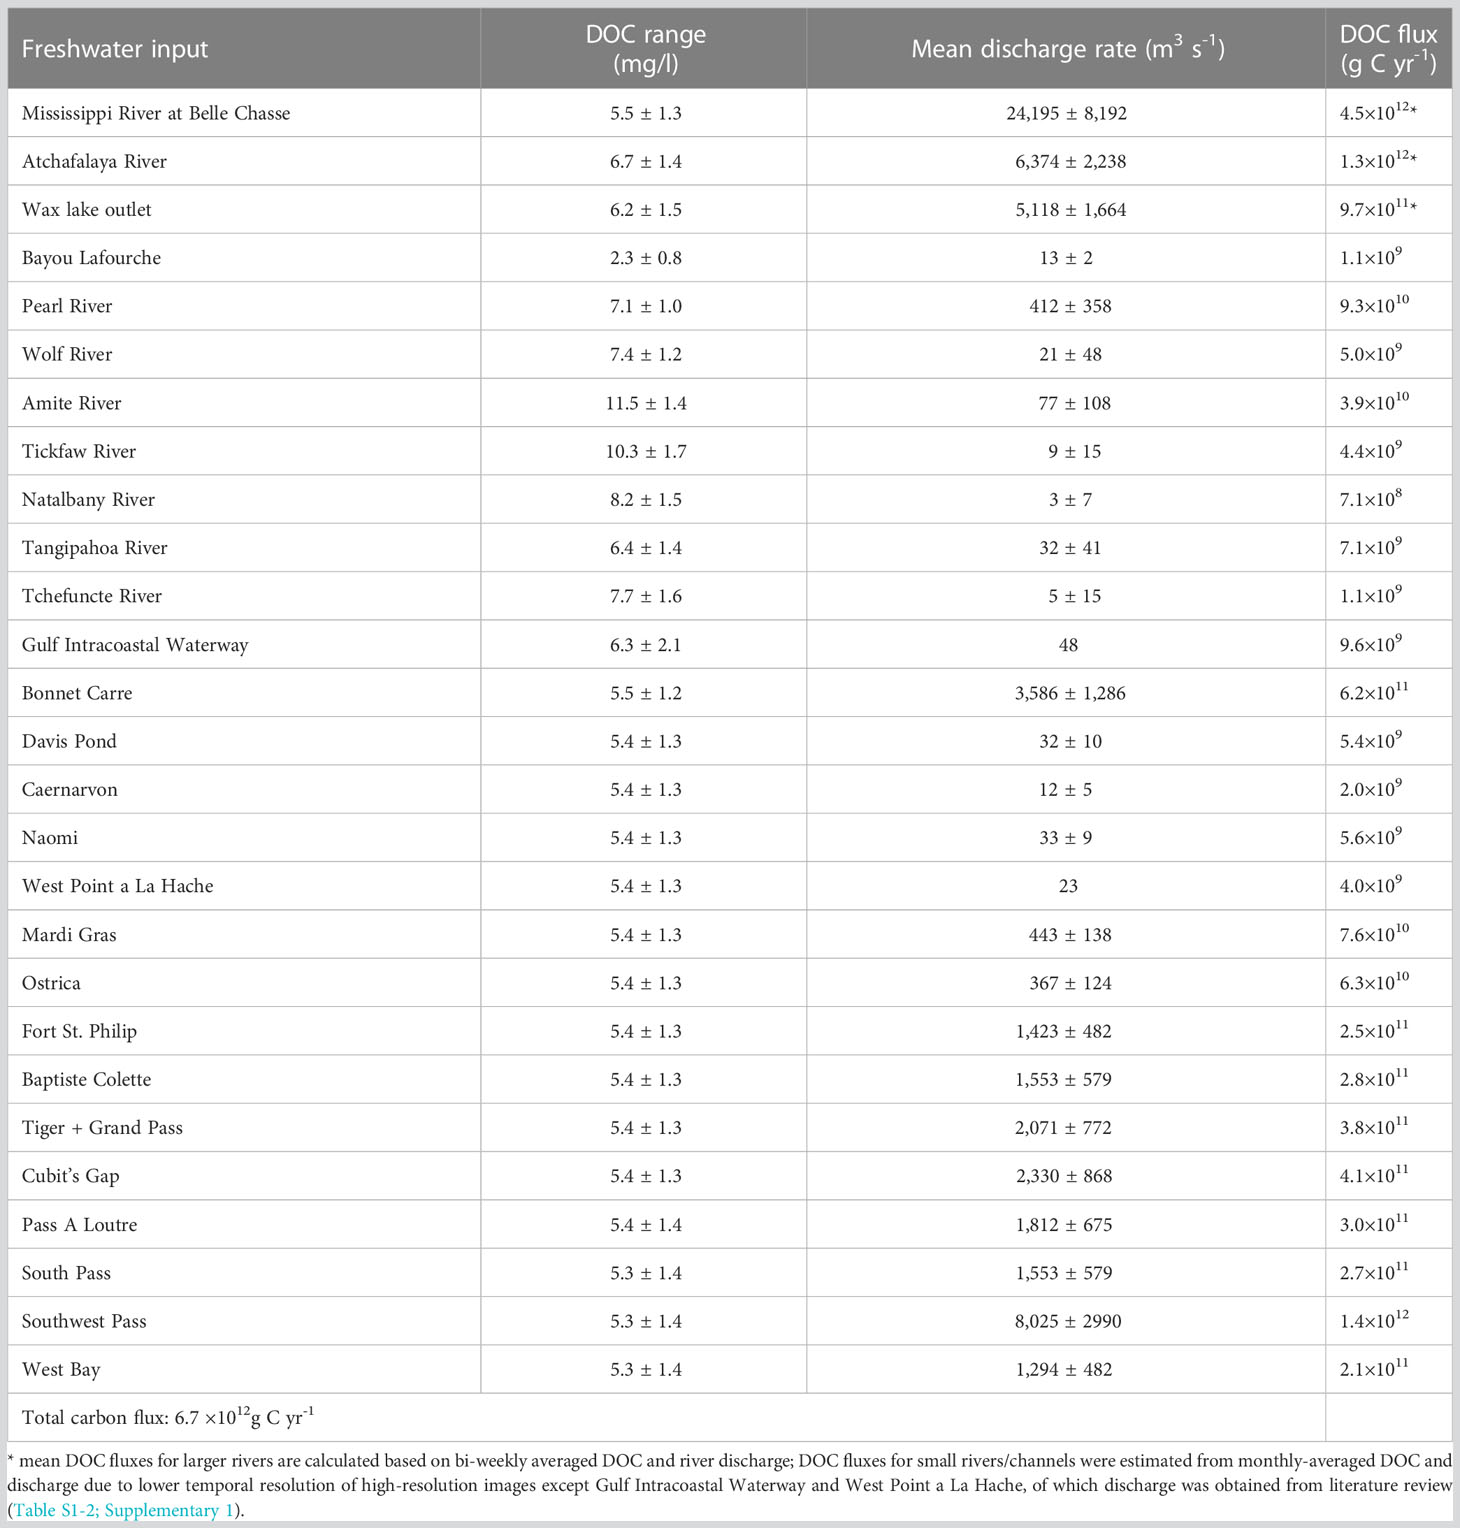
Table 2 Annual average (2019) water and carbon fluxes from channels and rivers into inland-estuarine and shelf waters.
Further, in more recent studies, DOC fluxes from the MR during 2006–2008 (1.88 Tg C yr-1; Cai et al., 2015) and during 2008-2010 (1.92 Tg C yr-1; Hanley et al., 2013) were similar to the average annual DOC flux (1.72 Tg C yr-1) estimated based on samples collected in 1969 by Malcolm and Durum (1976). This likely indicates DOC flux in the lower MR have been less variable or have increased only slightly over the last four decades. However, it was also reported that DOC flux was significantly correlated with discharge in the MR, which is projected to increase by 11-60% by the end of 21st century (Tao et al., 2014). For example, Reiman and Xu (2019) reported second highest annual DOC flux (3.98 Tg C yr-1) under high flow conditions with a continued increase of river discharges and several flood events observed between 2015-2018. In addition, the lower MR floods appear to occur more frequently in the winter and spring, and thus unlikely to overlap with the Atlantic hurricane season. However, in 2019, the storm surge and heavy precipitation caused by Hurricane Barry propagating up the MR increased the already high river discharge (Figure 11B).
Similarly, the averaged bi-weekly mean DOC in AR in 2019 (6.7 mg C L-1; Table 2) was observed to be greater than the 3-year averaged DOC for 2019-2021 (6.5 mg C L-1; Figure 8F). Shen et al. (2012) also demonstrated a relatively lower DOC level (4.6-6.6 mg C L-1) for AR across different years compared to DOC estimated for 2019 in this study (Table 2). The AR acting as the second largest carbon source to the nGoM delivered approximately 1.3 Tg C yr-1 into the coastal ocean in 2019 (Figure 11A; Table 2). This estimate was reasonably higher than most of the AR DOC fluxes (0.46-1.39 Tg C yr-1) reported in previous studies (Shen et al., 2012). The WLO discharged slightly less freshwater (5,118 m3 s-1) than AR during 2019 (Table 2). Bi-weekly mean DOC concentrations displayed overall lower concentrations in comparison to AR, and thus, serving as the third largest DOC source (9.7×10¹¹ g C yr-1) into the nGoM. DOC fluxes from MR, AR and WLO delivered a total of 6.7 Tg C to shelf waters during 2019. Previous research indicated that a significantly higher quantity of leached soil DOC could have been released into headwater catchments due to increased runoff volume and localized flooding (Raymond and Saiers, 2010). Therefore, the extremely high DOC flux observed in year 2019 could be associated with a combination of greater river discharge and precipitation producing higher DOC concentrations, which strongly support the hypothesis of future projection of increasing carbon exports.
3.4.2 DOC fluxes from various outlets into Louisiana estuaries
Downstream of Belle Chasse, the MR discharge is further distributed through natural passes/crevasses (e.g., Mardi Gras and Fort St. Philip) and man-made diversions (e.g., Davis Pond and Caernarvon) (Allison et al., 2012; Esposito et al., 2020; Sorourian et al., 2022) (Figure 11A). The ability of Landsat 8/9-OLI and Sentinel 2-MSI to detect these small distributaries is critical for improving coastal carbon estimates, especially for those regions comparable to MR delta with extensive wetland habitats delivering significant amount DOC into adjacent watershed (Bogard et al., 2020; Najjar et al., 2018). In this study, averaged monthly-mean DOC concentration in channels/passes extracted from MSI-DOC and OLI-DOC as well as monthly-mean water fluxes obtained from specific USGS stations or estimated with rating curves for 2019 were used to estimate DOC fluxes from small passes/distributaries to inland lakes and estuaries in coastal Louisiana and the nGoM (Figure 11A).
Combining all the fluxes, an estimated total of 3.6 Tg C yr-1 was released through the lower bird foot delta passes to the nGoM, while the remaining 0.9 Tg C yr-1 was likely delivered into the Breton and Barataria Basins and not through the bird foot delta distributaries, with implications on the role of these basins on carbon cycling during extreme river discharge periods. To the west, Bell Pass, connecting Bayou Lafourche near Port Fourchon was observed as another DOC source of 1.1×10⁹ g C yr-1 into nGoM. To the east, Pearl River and Wolf River provided 9.4×10¹⁰ g C DOC loading into Chandeleur Sound. Thus, the total DOC flux from channels/rivers was estimated by summing up all sources, which provided a total of 6.7 Tg C yr-1 into the coastal Louisiana aquatic DOC pool. The largest DOC fluxes to the coastal ocean are typically associated with major river systems such as the MR and AR system - the seventh largest of the world river by discharge and is consistent with other coastal regions worldwide; for example, DOC flux from the Amazon River was nearly 25.5 Tg C yr-1 (Drake et al., 2021). The Congo River was estimated to export around 12.5 Tg C yr-1 of DOC to the Atlantic Ocean (Spencer et al., 2016) while the Yangtze River delivered approximately 11 Tg C yr-1 of DOC to the East China Sea (Duan et al., 2013). Improving these combined estimates is critical in refining the global riverine DOC flux to the ocean, and to establish robust baselines to adequately assess the impact of future climate change.
3.4.3 DOC fluxes from Barataria basin due to Hurricane Barry
Hurricane Barry which made landfall as a Category 1 hurricane on Marsh Island, Louisiana on 13 July 2019 was examined with respect to DOC fluxes exiting Barataria Bay. Hurricane Barry resulted in elevated DOC concentrations throughout the estuarine-coastal waters (Figure 12B). With broader observations from remote sensing DOC maps, carbon flux from tidal inlets to coastal oceans can be estimated. However, hydrodynamics is complex at inlets of Barataria Bay due to river discharge, wind and tidal variations, which further influences the net transport of fresh water and sediment to the nGoM. The quantification of the fluxes requires the knowledge of water velocities and constituent concentrations. It was observed that the northerly winds changed to southerly winds during Hurricane Barry, reaching to its maximum 14.5 m/s at the Grand Isle station near Barataria Bay after its landfall (Figure 12A). Accordingly, the water volume flux into the bay by southerly winds through the three inlets including Barataria Pass, Pass Abel, and Quatre Bayou (Figure 1C) before Barry’s landfall on 13 July 2019, was followed by the flushing out of the bay through these same three inlets (Figure 12A). Opposite condition was observed for Caminada Pass, where water was flowing out first and then into the bay after Barry’s landfall (Figure 12A). It was estimated that the total outward flux after Barry’s landfall was 1500 m3/s between 13-15 July, with Barataria Pass reaching the largest outward flux of 2500 m3/s after Barry’s landfall. Thus, the highest DOC flux was observed at Barataria Pass on 13 July after Barry’s landfall, which reached to 13.0 kg/s (2500 m3/s × 5.0 mg L-1) on 13 July 2019. The total DOC flux flushing out of Barataria Bay from the four passes was roughly estimated by Eq. (1), which was approximately 0.65×10⁹ g per day (1500m3/s × 5.0 mgL-1×86400). Thus, a total of 1.33 × 10⁹ g DOC was exported during/post Hurricane Barry between 13-15 July 2019. Compared to previous study (Li et al., 2011), the net transport of water flux out of Barataria Bay over a tidal cycle during summer is 380 m3 s-1, which was nearly three times lower compared to Barry-induced outward flushing during July 13-15, 2019, thus, hurricane-induced DOC fluxes could largely alter DOC dynamics and CO2 air-sea exchange in the nGoM shelf waters post hurricanes (Medeiros and Moreira, 2022; Yan et al., 2020). Bianchi et al. (2013) demonstrated the large amount of DOC consumption following the extreme flooding event in the Mississippi River basin in the summer of 2011 which temporarily altered shelf waters in the nGoM from a net sink to a net source of CO2 to the atmosphere. Compared to other major hurricanes in the nGoM, Barry-induced DOC export was relatively lower than the DOC export of 21.6×10⁹ g C from Galveston Bay into nGoM over 10 days post Hurricane Harvey (D’Sa et al., 2018). However, hurricane-induced effects on net CO2 exchange and carbon budgets continue to challenge present understanding and need to be quantified further in future investigations.
4 Summary
Multi-satellite monitoring with high spatiotemporal resolution is critical for highly dynamic and heterogeneous inland and estuarine environments such as in coastal Louisiana and other coastal regions worldwide. This study demonstrated the utility of QAA-AD implementation in predicting reliable DOC concentrations across different satellite sensors including Sentinel 3A/B-OLCI, Sentinel 2A/B-MSI and Landsat 8/9-OLI. Consistency in OLI-, MSI- and OLCI-DOC products as well as the agreement with field observations across various environmental conditions demonstrates the potential of this algorithm to be successfully implemented for other marsh-estuarine ecosystems. Combining data from multiple satellite sensors further enabled characterization of spatiotemporal dynamics of DOC in major estuaries, rivers as well as small natural/man-made diversions for multiple years (2019-2021) covering different seasons and extreme events. DOC time-series generated from multi-satellites for major inland lakes, estuaries and large rivers revealed clear seasonal patterns with highest/lowest DOC concentration observed in spring/fall across the Louisiana estuaries to the coastal ocean. The MSI- and OLI-DOC at fine spatial scales were further used to study DOC fluxes in small channels and passes. Here, for the first time, a comprehensive analysis of DOC fluxes/loadings from rivers and channels were estimated that contributed a total 6.7×10¹² g C yr-1 into Louisiana estuaries and the nGoM during an extreme flood year (2019). In this study, estimated DOC flux from MR (4.5×10¹² g C yr-1; at Belle Chasse) in 2019 was two to three times higher than previously reported DOC fluxes under normal flow conditions. Part of MR DOC fluxes (0.9×10¹² g C yr-1) were however delivered into estuaries directly through man-made diversions or natural crevasses along the MR before reaching nGoM through the bird foot delta. In addition, DOC fluxes from Atchafalaya River (1.3×10¹² g C) and Wax Lake Outlet (9.7×10¹¹ g C) were the other two major DOC sources delivering into the nGoM. In addition, two hurricane case studies were conducted to estimate DOC dynamics or export from estuaries into the nGoM. A total of 1.33 ×10⁹ g DOC was exported from Barataria Basin into the nGoM through Barataria Pass post-Hurricane Barry during 13-15 July 2019. Hurricane Ida substantially altered approximately 1.34×10⁸ m2 of marshes in the middle Barataria Basin, which were converted into open water with 3.0 m depth. A concurrent three-fold increase in DOC concentration (16.4 mg L-1) compared to pre-hurricane condition was observed in the wetland-loss area four days after Ida on 4 September 2021. Given that hurricane intensity and frequency are projected to increase due to climate (Paerl et al., 2019), increase of DOC export flux may be critical enough to change the coastal waters as net source of CO2 to the atmosphere. Thus, it is important to extend beyond DOC to POC and pCO2 to better quantify carbon loss when wetlands are converted to open water habitats. Future investigations are clearly needed to focus on the composition of the added DOC pre- and post-extreme events and its bio- and photo-lability and how and why they may be different among coastal systems.
Data availability statement
The raw data supporting the conclusions of this article will be made available by the authors, without undue reservation.
Author contributions
BL and ED’S designed the study and worked on the initial drafts of the manuscript. All authors contributed to and reviewed the final draft. BL, ED’S, VR-M and KM acquired and processed the field/in-situ data. BL processed all satellite data and estimated DOC concentrations. FM and MB analyzed river discharge data and estimated DOC fluxes. WH performed model simulations and estimated water fluxes induced by Hurricane Barry. All authors contributed to the article and approved the submitted version.
Funding
Funding for this work was provided by NASA/EPSCoR (80NSSC118M002) and NASA (80NSSC22K0357) grants.
Acknowledgments
The authors would like to thank NASA Ocean Biology Processing Group (OBPG) for maintaining SeaDAS software package and the SeaBASS public repository of in situ oceanographic data. The authors would also like to thank the European Space Agency (ESA) and the European Organization for Meteorological Satellites (EUMETSAT) for providing access to the Sentinel-3 OLCI A/B and MSI satellite data and the Sentinel-3 Toolbox Kit Module (S3TBX) version 5.0.1 in Sentinel Application Platform (SNAP). The authors also thank Camille Stagg for reviewing earlier drafts. Any use of product names is for descriptive purposes only and does not imply endorsement by the U.S. Government.
Conflict of interest
The authors declare that the research was conducted in the absence of any commercial or financial relationships that could be construed as a potential conflict of interest.
Publisher’s note
All claims expressed in this article are solely those of the authors and do not necessarily represent those of their affiliated organizations, or those of the publisher, the editors and the reviewers. Any product that may be evaluated in this article, or claim that may be made by its manufacturer, is not guaranteed or endorsed by the publisher.
Supplementary material
The Supplementary Material for this article can be found online at: https://www.frontiersin.org/articles/10.3389/fmars.2023.1159367/full#supplementary-material
References
Allison M. A., Demas C. R., Ebersole B. A., Kleiss B. A., Little C. D., Meselhe E. A., et al. (2012). A water and sediment budget for the lower Mississippi–atchafalaya river in flood years 2008–2010: implications for sediment discharge to the oceans and coastal restoration in Louisiana. J. Hydrol. 432–433, 84–97. doi: 10.1016/j.jhydrol.2012.02.020
Arellano A. R., Bianchi T. S., Osburn C. L., D’Sa E. J., Ward N. D., Oviedo-Vargas D., et al. (2019). Mechanisms of organic matter export in estuaries with contrasting carbon sources. J. Geophys. Res.: Biogeosci. 124 (10), 3168–3188. doi: 10.1029/2018JG004868
Bauer J. E., Cai W.-J., Raymond P. A., Bianchi T. S., Hopkinson C. S., Regnier P. A. G. (2013). The changing carbon cycle of the coastal ocean. Nature 504 (7478), 61–70.
Baustian M. M., Liu B., Moss L. C., Dausman A., Pahl J. W. (2023). Climate change mitigation potential of louisiana’s coastal area: current estimates and future projections. Ecol. Appl. e2847.
Baustian M. M., Stagg C. L., Perry C. L., Moss L., Carruthers T. (2021). Long-term carbon sinks in marsh soils of the Mississippi river deltaic plain are at risk to wetland loss. J. Geophys. Res.: Biogeosci. 126 (3), e2020JG005832.
Bianchi T. S. (2011). The role of terrestrially derived organic carbon in the coastal ocean: a changing paradigm and the priming effect. Proc. Natl. Acad. Sci. 108 (49), 19473–19481.
Bianchi T. S., Allison M. A. (2009). Large-River delta-front estuaries as natural “recorders” of global environmental change. Proc. Natl. Acad. Sci. 106 (20), 8085–8092. doi: 10.1073/pnas.0812878106
Bianchi T. S., DiMarco S. F., Smith R. W., Schreiner K. M. (2009). A gradient of dissolved organic carbon and lignin from terrebonne–timbalier bay estuary to the Louisiana shelf (USA). Mar. Chem. 117 (1), 32–41. doi: 10.1016/j.marchem.2009.07.010
Bianchi T. S., Filley T., Dria K., Hatcher P. G. (2004). Temporal variability in sources of dissolved organic carbon in the lower Mississippi river. Geochimica Cosmochimica Acta 68 (5), 959–967. doi: 10.1016/j.gca.2003.07.011
Bianchi T. S., Wysocki L. A., Schreiner K. M., Filley T. R., Corbett D. R., Kolker A. S. (2010). Sources of terrestrial organic carbon in the Mississippi plume region: evidence for the importance of coastal marsh inputs. Aquat. Geochem. 17, 431–456. doi: 10.1007/s10498-010-9110-3
Bianchi T. S., Garcia-Tigreros F., Yvon-Lewis S. A., Shields M., Mills H. J., Butman D., et al. (2013). Enhanced transfer of terrestrially derived carbon to the atmosphere in a flooding event. Geophys. Res. Lett. 40 (1), 116–122.
Bricaud A., Babin M., Claustre H., Ras J., Tieche F. (2010). Light absorption properties and absorption budget of southeast pacific waters. J. Geophys. Res. 115, C08009. doi: 10.1029/2009JC005517
Bogard M. J., Bergamaschi B. A., Butman D. E., Anderson F., Knox S. H., Windham-Myers L. (2020). Hydrologic export is a major component of coastal wetland carbon budgets. Global Biogeochem. Cycles 34 (8), e2019GB006430.
Cai W.-J. (2011). Estuarine and coastal ocean carbon paradox: CO2 sinks or sites of terrestrial carbon incineration? Annu. Rev. Mar. Sci. 3, 123–145. doi: 10.1146/annurev-marine-120709-142723
Cai Y., Guo L., Wang X., Aiken G. (2015). Abundance, stable isotopic composition, and export fluxes of DOC, POC, and DIC from the lower Mississippi river during 2006–2008. J. Geophys. Res.: Biogeosci. 120 (11), 2273–2288. doi: 10.1002/2015JG003139
Cao F., Tzortziou M. (2021). Capturing dissolved organic carbon dynamics with landsat-8 and sentinel-2 in tidally influenced wetland–estuarine systems. Sci. Total Environ. 777, 145910. doi: 10.1016/j.scitotenv.2021.145910
Chaichitehrani N., D’Sa E. J., Ko D. S., Walker N. D., Osburn C. L., Chen R. F. (2014). Colored dissolved organic matter dynamics in the northern gulf of Mexico from ocean color and numerical model results. J. Coast. Res. 30 (4), 800–814. doi: 10.2112/JCOASTRES-D-13-00036.1
Chambers J. Q., Fisher J. I., Zeng H., Chapman E. L., Baker D. B., Hurtt G. C. (2007). Hurricane katrina’s carbon footprint on U.S. gulf coast forests. Science 318 (5853), 1107–1107.
Couvilion B. R. (2017). 2017 coastal master plan: attachment C3-27: landscape data (Version final) (Baton Rouge, LA: Coastal Protection and Restoration Authority), 1–84.
Couvillion B. R., Barras J. A., Steyer G. D., Sleavin W., Fischer M., Beck H., et al. (2011). Land area change in coastal Louisiana from 1932 to 2010: U.S. geological survey scientific investigations map 3164, scale 1:265,000. 12 p, pamphlet.
Dahal D., Liu S., Oeding J. (2014). The carbon cycle and hurricanes in the united states between 1900 and 2011. Sci. Rep. 4 (1), 5197.
Das A., Justic D., Swenson E., Turner R. E., Inoue M., Park D. (2011). Coastal land loss and hypoxia: the `outwelling’ hypothesis revisited. Environ. Res. Lett. 6 (2), 025001. doi: 10.1088/1748-9326/6/2/025001
Del Castillo C. E., Miller R. L. (2008). On the use of ocean color remote sensing to measure the transport of dissolved organic carbon by the Mississippi river plume. Remote Sens. Environ. 112 (3), 836–844. doi: 10.1016/j.rse.2007.06.015
Demarty M., Prairie Y. T. (2009). In situ dissolved organic carbon (DOC) release by submerged macrophyte–epiphyte communities in southern Quebec lakes. Can. J. Fish. Aquat. Sci. 66 (9), 1522–1531. doi: 10.1139/F09-099
Drake T. W., Hemingway J. D., Kurek M. R., Peucker-Ehrenbrink B., Brown K. A., Holmes R. M., et al. (2021). The pulse of the Amazon: fluxes of dissolved organic carbon, nutrients, and ions from the world’s largest river. Global Biogeochem. Cycles 35 (4), e2020GB006895. doi: 10.1029/2020GB006895
D’Sa E. J. (2008). Colored dissolved organic matter in coastal waters influenced by the atchafalaya river, USA: effects of an algal bloom. J. Appl. Remote Sens. 2, 023502. doi: 10.1117/1.2838253
D’Sa E. J., DiMarco S. F. (2009). Seasonal variability and controls on chromophoric dissolved organic matter in a large river-dominated coastal margin. Limnol. Oceanogr. 54 (6), 2233–2242.
D’Sa E. J., Joshi I., Liu B. (2018). Galveston Bay and coastal ocean optical-geochemical response to hurricane Harvey from VIIRS ocean color. Geophys. Res. Lett. 45 (19), 10,579–10,589.
D’Sa E. J., Joshi I. D., Liu B., Ko D. S., Osburn C. L., Bianchi T. S. (2019). Biogeochemical response of Apalachicola bay and the shelf waters to hurricane Michael using ocean color semi-analytic/inversion and hydrodynamic models. Front. Mar. Sci. 6.
D’Sa E. J., Miller R. L. (2003). Bio-optical properties in waters influenced by the Mississippi river during low flow conditions. Remote Sens. Environ. 84, 538–549. doi: 10.1016/S0034-4257(02)00163-3
D’Sa E. J., Miller R. L., Del Castillo C. (2006). Bio-optical properties and ocean color algorithms for coastal waters influenced by the Mississippi river during a cold front. Appl. Optics 45 (28), 7410–7428.
Duan S., Allison M. A., Bianchi T. S., McKee B. A., Shiller A. M., Guo L., et al. (2013). “Sediment, organic carbon, nutrients, and trace elements: sources, transport, and biogeochemical cycles in the lowermost Mississippi river,” in Biogeochemical dynamics at major river-coastal interfaces: linkages with global climate change (Cambridge University Press), 397–420. doi: 10.1017/CBO9781139136853.021
Engle V. D., Kurtz J. C., Smith L. M., Chancy C., Bourgeois P. (2007). A classification of U.S. estuaries based on physical and hydrologic attributes. Environ. Monit. Assess. 129 (1), 397–412.
Esposito C. R., Georgiou I. Y., Straub K. M. (2020). Flow loss in deltaic distributaries: impacts on channel hydraulics, morphology, and stability. Water Resour. Res. 56 (5), e2019WR026463. doi: 10.1029/2019WR026463
Fichot C. G., Lohrenz S. E., Benner R. (2014). Pulsed, cross-shelf export of terrigenous dissolved organic carbon to the gulf of Mexico. J. Geophys. Res.: Oceans 119 (2), 1176–1194. doi: 10.1002/2013JC009424
Georgiou I., FitzGerald D., Stone G. W. (2005). The impact of physical processes along the Louisiana coast. J. Coast. Res. 21, 72–89.
Hanchey A., Schnall A., Bayleyegn T., Jiva S., Khan A., Siegel V., et al. (2021). Notes from the field: deaths related to hurricane Ida reported by media [[/amp]]mdash; nine states, august 29–September 9, 2021. Morbid. Mortal. Weekly Rep. 70 (39), 1385–1386.
Hanley K. W., Wollheim W. M., Salisbury J., Huntington T., Aiken G. (2013). Controls on dissolved organic carbon quantity and chemical character in temperate rivers of north America. Global Biogeochem. Cycles 27 (2), 492–504. doi: 10.1002/gbc.20044
Hedges J. I., Keil R. G., Benner R. (1997). What happens to terrestrial organic matter in the ocean? Organic Geochem. 27 (5), 195–212.
Hernes P. J., Benner R. (2003). Photochemical and microbial degradation of dissolved lignin phenols: implications for the fate of terrigenous dissolved organic matter in marine environments. J. Geophys. Res.: Oceans 108 (C9).
Herrmann M., Najjar R. G., Kemp W. M., Alexander R. B., Boyer E. W., Cai W.-J., et al. (2015). Net ecosystem production and organic carbon balance of U.S. East coast estuaries: a synthesis approach. Global Biogeochem. Cycles 29 (1), 96–111.
Hillmann E. R., Rivera-Monroy V. H., Nyman J. A., La Peyre M. K. (2020). Estuarine submerged aquatic vegetation habitat provides organic carbon storage across a shifting landscape. Sci. Total Environ. 717, 137217.
Hounshell A. G., Rudolph J. C., Van Dam B. R., Hall N. S., Osburn C. L., Paerl H. W. (2019). Extreme weather events modulate processing and export of dissolved organic carbon in the neuse river estuary, NC. Estuarine Coast. Shelf Sci. 219, 189–200. doi: 10.1016/j.ecss.2019.01.020
Howes N. C., FitzGerald D. M., Hughes Z. J., Georgiou I. Y., Kulp M. A., Miner M. D., et al. (2010). Hurricane-induced failure of low salinity wetlands. Proc. Natl. Acad. Sci. 107 (32), 14014–14019. doi: 10.1073/pnas.0914582107
Huang W., Li C. (2020). Contrasting hydrodynamic responses to atmospheric systems with different scales: impact of cold fronts vs. that of a hurricane. J. Mar. Sci. Eng. 8 (12), 979. doi: 10.3390/jmse8120979
Huntington T. G., Balch W. M., Aiken G. R., Sheffield J., Luo L., Roesler C. S., et al. (2016). Climate change and dissolved organic carbon export to the gulf of Maine. J. Geophys. Res.: Biogeosci. 121 (10), 2700–2716. doi: 10.1002/2015JG003314
IOCCG Protocol Series. (2018). “Inherent optical property measurements and protocols: Absorption coefficient,” in IOCCG ocean optics and biogeochemistry protocols for satellite ocean colour sensor validation. Eds. Neeley A. R., Mannino A.. Dartmouth, NS, Canada: IOCCG, vol. 1.0.
Jaffé R., McKnight D., Maie N., Cory R., McDowell W. H., Campbell J. L. (2008). Spatial and temporal variations in DOM composition in ecosystems: the importance of long-term monitoring of optical properties. J. Geophys. Res.: Biogeosci. 113 (G4).
Jankowski K. L., Törnqvist T. E., Fernandes A. M. (2017). Vulnerability of louisiana’s coastal wetlands to present-day rates of relative sea-level rise. Nat. Commun. 8, 14792. doi: 10.1038/ncomms14792
Joshi I., D’Sa E. J. (2015). Seasonal variation of colored dissolved organic matter in barataria bay, Louisiana, using combined landsat and field data. Remote Sens. 7 (9), 12478–12502. doi: 10.3390/rs70912478
Joshi I. D., D’Sa E. J. (2018). An estuarine-tuned quasi-analytical algorithm (QAA-v): assessment and application to satellite estimates of SPM in Galveston bay following hurricane Harvey. Biogeosciences 15, 4065–4086. doi: 10.5194/bg-15-4065-2018
Joshi I., D’Sa E. J. (2020). Optical properties using adaptive selection of NIR/SWIR reflectance correction and quasi- analytic algorithms for the MODIS-aqua in estuarine-ocean continuum: application to the northern gulf of Mexico. IEEE Trans. Geosci. Remote Sens. 58 (9), 6088–6105. doi: 10.1109/TGRS.2020.2973157
Joshi I. D., D’Sa E. J., Osburn C. L., Bianchi T. S., Ko D. S., Oviedo-Vargas D., et al. (2017). Assessing chromophoric dissolved organic matter (CDOM) distribution, stocks, and fluxes in Apalachicola bay using combined field, VIIRS ocean color, and model observations. Remote Sens. Environ. 191, 359–372. doi: 10.1016/j.rse.2017.01.039
Kesel R. H. (1989). The role of the Mississippi river in wetland loss in southeastern Louisiana, U.S.A. Environ. Geol. Water Sci. 13 (3), 183–193. doi: 10.1007/BF01665368
Kolka R., Weishampel P., Fröberg M. (2008). “Measurement and importance of dissolved organic carbon,” in Field measurements for forest carbon monitoring. Ed. Hoover C. M. (Dordrecht: Springer Netherlands), 171–176.
Kossin J., Hall T., Knutson T., Kunkel K., Trapp R., Waliser D., et al. (2017). “Extreme storms,” in Climate science special report: a sustained assessment activity of the U.S. global change research program. Eds. Wuebbles D. J., Fahey D. W., Hibbard K. A., Dokken D. J., Stewart B. C., Maycock T. K. (Washington, DC, USA: U.S. Global Change Research Program), 375–404.
Kunkel K. E., Yin X., Sun L., Champion S. M., Stevens L. E., Johnson K. M. (2022). Extreme precipitation trends and meteorological causes over the laurentian great lakes. Front. Water 4. doi: 10.3389/frwa.2022.804799
Kutser T., Casal Pascual G., Barbosa C., Paavel B., Ferreira R., Carvalho L., et al. (2016). Mapping inland water carbon content with landsat 8 data. Int. J. Remote Sens. 37 (13), 2950–2961. doi: 10.1080/01431161.2016.1186852
Lambou V. W., Hern S. C. (1983). Transport of organic carbon in the atchafalaya basin, Louisiana. Hydrobiologia 98 (1), 25–34.
Lane R. R., Mack S. K., Day J. W., DeLaune R. D., Madison M. J., Precht P. R. (2016). Fate of soil organic carbon during wetland loss. Wetlands 36 (6), 1167–1181. doi: 10.1007/s13157-016-0834-8
Lee Z., Carder K. L., Arnone R. A. (2002). Deriving inherent optical properties from water color: a multiband quasi-analytical algorithm for optically deep waters. Appl. Optics 41 (27), 5755–5772. doi: 10.1364/AO.41.005755
Lee Z., Carder K., Arnone R., He M. (2007). Determination of primary spectral bands for remote sensing of aquatic environments. Sensors 7 (12), 3428–3441. doi: 10.3390/s7123428
Lee Z., Lubac B., Werdell J., Arnone R. (2009). An update of the quasi-analytical algorithm (QAA_v5), 9. International Ocean Color Group Software Report, 1-9.
Lee Z., Lubac B., Werdell J., Arnone R. (2014). Update of the quasi-analytical algorithm (QAA_v6). Int. Ocean color group software Rep. [2013-04-03]. Available at: http://wwwioccg,org/groups/software-OCA/OAA_,5.
Leenheer J. (1982). “United states geological survey data information service,” in Transport of carbon and minerals in major world rivers, part 1. Ed. Degens E. T. (Geologisch-Palaontologischen Institution, University of Hamburg, Mitteilungen Geologisch-Paläontologischen Institute, University Hamburg, Hamburg), 355–356.
Lehman J., Coumou D., Frieler K. (2015). Increased record-breaking precipitation events under global warming. Climate Change 132, 501–515. doi: 10.1007/s10584-015-1434-y
Li C., Huang W., Milan B. (2019). Atmospheric cold front–induced exchange flows through a microtidal multi-inlet bay: analysis using multiple horizontal ADCPs and FVCOM simulations. J. Atmospheric Oceanic Technol. 36 (3), 443–472. doi: 10.1175/JTECH-D-18-0143.1
Li C., White J. R., Chen C., Lin H., Weeks E., Galvan K., et al. (2011). Summertime tidal flushing of barataria bay: transports of water and suspended sediments. J. Geophys. Res.: Oceans 116 (C4), C04009.
Lindstedt D. M. (2005). Renewable resources at stake: barataria-terrebonne estuarine system in southeast Louisiana. J. Coast. Res. 162–175.
Liang J. H., Liu J., Benfield M., Justic D., Holstein D., Liu B., et al. (2021). Including the effects of subsurface currents on buoyant particles in Lagrangian particle tracking models: model development and its application to the study of riverborne plastics over the Louisiana/Texas shelf. Ocean Model. 167, 101879. doi: 10.1016/j.ocemod.2021.101879
Liu B., D’Sa E. J., Joshi I. (2019a). Multi-decadal trends and influences on dissolved organic carbon distribution in the barataria basin, Louisiana from in-situ and Landsat/MODIS observations. Remote Sens. Environ. 228, 183–202. doi: 10.1016/j.rse.2019.04.023
Liu B., D’Sa E. J., Joshi I. D. (2019b). Floodwater impact on Galveston bay phytoplankton taxonomy, pigment composition and photo-physiological state following hurricane Harvey from field and ocean color (Sentinel-3A OLCI) observations. Biogeosciences 16 (9), 1975–2001. doi: 10.5194/bg-16-1975-2019
Liu B., D’Sa E. J., Maiti K., Rivera-Monroy V. H., Xue Z. (2021). Biogeographical trends in phytoplankton community size structure using adaptive sentinel 3-OLCI chlorophyll a and spectral empirical orthogonal functions in the estuarine-shelf waters of the northern gulf of Mexico. Remote Sens. Environ. 252, 112154. doi: 10.1016/j.rse.2020.112154
Lønborg C., Carreira C., Jickells T., Álvarez-Salgado X. A. (2020). Impacts of global change on ocean dissolved organic carbon (DOC) cycling. Front. Mar. Sci. 7.
Lu C., Zhang J., Tian H., Crumpton W. G., Helmers M. J., Cai W.-J., et al. (2020). Increased extreme precipitation challenges nitrogen load management to the gulf of Mexico. Commun. Earth Environ. 1, 21. doi: 10.1038/s43247-020-00020-7
Malcolm R. L., Durum W. H. (1976). Organic carbon and nitrogen concentrations and annual organic carbon load of six selected rivers of the united states (No. 1817- f). water supply paper. For sale by the Supt. of Docs., U.S. Govt. Print. Off. doi: 10.3133/wsp1817F
Mannino A., Signorini S. R., Novak M. G., Wilkin J., Friedrichs M. A. M., Najjar R. G. (2016). Dissolved organic carbon fluxes in the middle Atlantic bight: an integrated approach based on satellite data and ocean model products. J. Geophys. Res.: Biogeosci. 121 (2), 312–336. doi: 10.1002/2015JG003031
McLusky D. S., Elliott M. (2004). The estuarine ecosystem: ecology, threats and management. 3rd ed (Oxford: Oxford University Press).
Medeiros D. L., Moreira Í. T. A. (2022). Microalgae biomass production from cultivation in availability and limitation of nutrients: the technical, environmental and economic performance. J. Cleaner Production 370, 133538.
Miner M. D., Kulp M. A., FitzGerald D. M., Flocks J. G., Weathers H. D. (2009). Delta lobe degradation and hurricane impacts governing large-scale coastal behavior, south-central Louisiana, USA. Geo-Marine Lett. 29 (6), 441–453. doi: 10.1007/s00367-009-0156-4
Moody C. S., Worrall F. (2017). Modeling rates of DOC degradation using DOM composition and hydroclimatic variables. J. Geophys. Res.: Biogeosci. 122 (5), 1175–1191. doi: 10.1002/2016JG003493
Moran M. A., Sheldon W. M. Jr., Zepp R. G. (2000). Carbon loss and optical property changes during long-term photochemical and biological degradation of estuarine dissolved organic matter. Limnol. Oceanogr. 45 (6), 1254–1264. doi: 10.4319/lo.2000.45.6.1254
Naik P., D’Sa E. J. (2012). Phytoplankton light absorption of cultures and natural samples: comparisons using two spectrophotometers. Optics Express 20 (5), 4871–4886. doi: 10.1364/OE.20.004871
Naik P., D’Sa E. J., Grippo M., Condrey R., Fleeger J. (2011). Absorption properties of shoal-dominated waters in the atchafalaya shelf, Louisiana, USA. Int. J. Remote Sens. 32 (15), 4383–4406. doi: 10.1080/01431161.2010.486807
Najjar R. G., Herrmann M., Alexander R., Boyer E. W., Burdige D. J., Butman D., et al. (2018). Carbon budget of tidal wetlands, estuaries, and shelf waters of Eastern north America. Global Biogeochem. Cycles 32 (3), 389–416. doi: 10.1002/2017GB005790
NASA (2015). World of change: growing deltas in atchafalaya bay. Available at: https://earthobservatory.nasa.gov/world-of-change/WaxLake.
Opsahl S., Benner R. (1997). Distribution and cycling of terrigenous dissolved organic matter in the ocean. Nature 386 (6624), 480–482.
Pahlevan N., Chittimalli S. K., Balasubramanian S. V., Vellucci V. (2019). Sentinel-2/Landsat-8 product consistency and implications for monitoring aquatic systems. Remote Sens. Environ. 220, 19–29.
Paerl H. W., Hall N. S., Hounshell A. G., Luettich R. A., Rossignol K. L., Osburn C. L., et al. (2019). Recent increase in catastrophic tropical cyclone flooding in coastal north Carolina, USA: long-term observations suggest a regime shift. Sci. Rep. 9 (1), 1–9. doi: 10.1038/s41598-019-46928-9
Penland S., Boyd R., Suter J. R. (1988). Transgressive depositional systems of the Mississippi delta plain; a model for barrier shoreline and shelf sand development. J. Sediment. Res. 58 (6), 932–949.
Rabalais N. N., Turner R. E., Wiseman W. J. Jr. (2002). Gulf of Mexico hypoxia, aka “The dead zone”. Annu. Rev. Ecol. Syst. 33 (1), 235–263.
Ramatchandirane C. G., Courtois A., Di Leonardo D. R., Eckland A. C., Miner M. D., Yocum T. E. (2019). Investigation of flow and water constituent fluxes through the tidal inlets of the barataria basin (No. task order 55) (Baton Rouge, LA: The Water Institute of the Gulf. Prepared for and funded by the Coastal Protection and Restoration Authority), 91. Available at: https://cims.coastal.louisiana.gov/RecordDetail.aspx?Root=0&sid=23888.
Raymond P. A., Saiers J. E. (2010). Event controlled DOC export from forested watersheds. Biogeochemistry 100 (1), 197–209. doi: 10.1007/s10533-010-9416-7
Raymond P. A., Spencer R. G. M. (2015). “Chapter 11 - riverine DOM,” in Biogeochemistry of marine dissolved organic matter, 2nd ed. Eds. Hansell D. A., Carlson C. A. (Boston: Academic Press), 509–533.
Reiman J. H., Xu Y. J. (2019). Dissolved carbon export and CO2 outgassing from the lower Mississippi river – implications of future river carbon fluxes. J. Hydrol. 578, 124093. doi: 10.1016/j.jhydrol.2019.124093
Riekenberg J., Bargu S., Twilley R. (2015). Phytoplankton community shifts and harmful algae presence in a diversion influenced estuary. Estuaries Coasts 38 (6), 2213–2226. doi: 10.1007/s12237-014-9925-z
Roberts B. J., Doty S. (2015). Spatial and temporal patterns of benthic respiration and net nutrient fluxes in the atchafalaya river delta estuary. Estuaries Coasts. 38, 1918–1936. doi: 10.1007/s12237-015-9965-z
Sapkota Y., White J. R. (2019). Marsh edge erosion and associated carbon dynamics in coastal Louisiana: a proxy for future wetland-dominated coastlines world-wide. Estuarine Coast. Shelf Sci. 226, 106289. doi: 10.1016/j.ecss.2019.106289
Seneviratne S. I., Nicholls N., Easterling D., Goodess C. M., Kanae S., Kossin J., et al. (2012). “Changes in climate extremes and their impacts on the natural physical environment,” in Managing the risks of extreme events and disasters to advance climate change adaptation. A Special Report of Working Groups I and II of the Intergovernmental Panel on Climate Change (IPCC). Eds. Field C. B., Barros V., Stocker T. F., Dahe Q. (Cambridge, UK, and New York, NY, USA: Cambridge University Press), 109–230. Available at: https://academiccommons.columbia.edu/doi/10.7916/d8-6nbt-s431.
Shen Y., Fichot C. G., Benner R. (2012). Floodplain influence on dissolved organic matter composition and export from the Mississippi–atchafalaya river system to the gulf of Mexico. Limnol. Oceanogr. 57 (4), 1149–1160. doi: 10.4319/lo.2012.57.4.1149
Signorini S., Mannino A., Friedrichs M., St-Laurent P., Wilkin J., Tabatabai A., et al. (2019). Estuarine dissolved organic carbon flux from space: with application to Chesapeake and Delaware bays. J. Geophys. Res.: Oceans 124 (6), 3755–3778.
Singh S., D’Sa E., Swenson E. (2010a). Seasonal variability in CDOM absorption and fluorescence properties in barataria basin, Louisiana, USA. J. Environ. Sci. 22 (10), 1481–1490. doi: 10.1016/S1001-0742(09)60279-5
Singh S., D’Sa E. J., Swenson E. M. (2010b). Chromophoric dissolved organic matter (CDOM) variability in barataria basin using excitation–emission matrix (EEM) fluorescence and parallel factor analysis (PARAFAC). Sci. Total Environ. 408 (16), 3211–3222. doi: 10.1016/j.scitotenv.2010.03.044
Sorourian S., Huang H., Xu K., Justic D., D’Sa E. J. (2022). A modeling study of water and sediment flux partitioning through the major passes of Mississippi birdfoot delta and their plume structures. Geomorphology 401, 108109. doi: 10.1016/j.geomorph.2022.108109
Spencer R. G. M., Aiken G. R., Dornblaser M. M., Butler K. D., Holmes R. M., Fiske G., et al. (2013). Chromophoric dissolved organic matter export from U.S. rivers. Geophys. Res. Lett. 40 (8), 1575–1579. doi: 10.1002/grl.50357
Spencer R. G. M., Butler K. D., Aiken G. R. (2012). Dissolved organic carbon and chromophoric dissolved organic matter properties of rivers in the USA. J. Geophys. Res.: Biogeosci. 117 (G3).
Spencer R. G., Hernes P. J., Dinga B., Wabakanghanzi J. N., Drake T. W., Six J. (2016). Origins, seasonality, and fluxes of organic matter in the Congo river. Global Biogeochem. Cycles 30 (7), 1105–1121. doi: 10.1002/2016GB005427
Stagg C. L., Osland M. J., Moon J. A., Feher L. C., Laurenzano C., Lane T. C., et al. (2021). Extreme precipitation and flooding contribute to sudden vegetation dieback in a coastal salt marsh. Plants 10 (09), 1841. doi: 10.3390/plants10091841
Stramski D., Reynolds R. A., Kaczmarek S., Uitz J., Zheng G. (2015). Correction of pathlength amplification in the filterpad technique for measurements of particulate absorption coefficient in the visible spectral region. Appl. Optics 54 (22), 6763–6782. doi: 10.1364/AO.54.006763
Swarzenski C. M., Perrien S. M. (2015). Discharge, suspended sediment, and salinity in the gulf intracoastal waterway and adjacent surface waters in south-central Louisiana 1997–2008 (USGS numbered series no. 2015–5132) (Reston, VA: U.S. Geological Survey).
Sweet J. A., Bargu S., Morrison W. L., Parsons M., Pathare M. G., Roberts B. J., et al. (2022). Phytoplankton dynamics in Louisiana estuaries: building a baseline to understand current and future change. Mar. pollut. Bull. 175, 113344. doi: 10.1016/j.marpolbul.2022.113344
Tao B., Tian H., Ren W., Yang J., Yang Q., He R., et al. (2014). Increasing Mississippi river discharge throughout the 21st century influenced by changes in climate, land use, and atmospheric CO 2: factorial analyses of river discharge. Geophys. Res. Lett. 41 (14), 4978–4986. doi: 10.1002/2014GL060361
Tehrani N. C., D’Sa E. J., Osburn C. L., Bianchi T. S., Schaeffer B. A. (2013). Chromophoric dissolved organic matter and dissolved organic carbon from sea-viewing wide field-of-view sensor (SeaWiFS), moderate resolution imaging spectroradiometer (MODIS) and MERIS sensors: case study for the northern gulf of Mexico. Remote Sens. 5, 1439–1464. doi: 10.3390/rs5031439
Toming K., Kutser T., Uiboupin R., Arikas A., Vahter K., Paavel B. (2017). Mapping water quality parameters with sentinel-3 ocean and land colour instrument imagery in the Baltic Sea. Remote Sens. 9 (10), 1070. doi: 10.3390/rs9101070
Tzortziou M., Neale P. J., Osburn C. L., Megonigal J. P., Maie N., JaffÉ R. (2008). Tidal marshes as a source of optically and chemically distinctive colored dissolved organic matter in the Chesapeake bay. Limnol. Oceanogr. 53 (1), 148–159. doi: 10.4319/lo.2008.53.1.0148
Uher G., Hughes C., Henry G., Upstill-Goddard R. C. (2001). Non-conservative mixing behavior of colored dissolved organic matter in a humic-rich, turbid estuary. Geophys. Res. Lett. 28 (17), 3309–3312. doi: 10.1029/2000GL012509
USACE Spillway operational effects (New Orleans District: US Army Corps of Engineers) (Accessed 10 August 2019).
Vanhellemont Q. (2019). Adaptation of the dark spectrum fitting atmospheric correction for aquatic applications of the landsat and sentinel-2 archives. Remote Sens. Environ. 225, 175–192. doi: 10.1016/j.rse.2019.03.010
Ward N. D., Bianchi T. S., Medeiros P. M., Seidel M., Richey J. E., Keil R. G., et al. (2017). Where carbon goes when water flows: carbon cycling across the aquatic continuum. Front. Mar. Sci. 4. doi: 10.3389/fmars.2017.00007
Windham-Myers L., Cai W.-J., Alin S., Andersson A., Crosswell J., Dunton K., et al. (2018). Second state of the carbon cycle report: chapter 15 tidal wetlands and estuaries. In Second State of the Carbon Cycle Report (SOCCR2): A Sustained Assessment Report. Eds. Cavallaro N., Shrestha G., Birdsey R., Mayes M. A., Najjar R. G., S. C, et al. U.S. Global Change Research Program, pp. 596–648. doi: 10.7930/SOCCR2.2018.Ch15
Wiseman W. J., Swenson E. M., Power J. (1990). Salinity trends in Louisiana estuaries. Estuaries 13, 265–271.
Keywords: DOC, fluxes, coastal, extreme flood, hurricanes, Mississipi River, Atchafalaya River, ocean color
Citation: Liu B, D’Sa EJ, Messina F, Baustian MM, Maiti K, Rivera-Monroy VH, Huang W and Georgiou IY (2023) Dissolved organic carbon dynamics and fluxes in Mississippi-Atchafalaya deltaic system impacted by an extreme flood event and hurricanes: a multi-satellite approach using Sentinel-2/3 and Landsat-8/9 data. Front. Mar. Sci. 10:1159367. doi: 10.3389/fmars.2023.1159367
Received: 05 February 2023; Accepted: 31 May 2023;
Published: 27 June 2023.
Edited by:
Jamie Shutler, University of Exeter, United KingdomReviewed by:
Andrew M. Fischer, University of Tasmania, AustraliaMarcus W. Beck, Tampa Bay Estuary Program, United States
Copyright © 2023 Liu, D’Sa, Messina, Baustian, Maiti, Rivera-Monroy, Huang and Georgiou. This is an open-access article distributed under the terms of the Creative Commons Attribution License (CC BY). The use, distribution or reproduction in other forums is permitted, provided the original author(s) and the copyright owner(s) are credited and that the original publication in this journal is cited, in accordance with accepted academic practice. No use, distribution or reproduction is permitted which does not comply with these terms.
*Correspondence: Eurico J. D’Sa, ZWpkc2FAbHN1LmVkdQ==