 E. Jerusalén-Lleó
 M. Nieto-Cid
 I. Fuentes-Santos
 Thorsten Dittmar
 X. A. Álvarez-Salgado
- 1Laboratorio de Geoquímica Orgánica, Instituto de Investigacións Mariñas (IIM), Consejo Superior de Investigaciones Científicas (CSIC), Vigo, Spain
- 2PhD Program in Marine Science, Technology and Management (DOMAR), Universidade de Vigo, Vigo, Spain
- 3Centro Oceanográfico de A Coruña, Centro Nacional Instituto Español de Oceanografía (IEO), Consejo Superior de Investigaciones Científicas (CSIC), A Coruña, Spain
- 4Research Group for Marine Geochemistry (ICBM-MPI Bridging Group), Institute for Chemistry and Biology of the Marine Environment (ICBM), University of Oldenburg, Oldenburg, Germany
- 5Helmholtz Institute for Functional Marine Biodiversity (HIFMB), University of Oldenburg, Oldenburg, Germany
Our current knowledge of the chemical composition of ocean dissolved organic matter (DOM) is limited, mainly because of its extreme molecular diversity, low concentration of individual compounds and the elevated ionic strength of ocean waters. As a result, many analytical methods require a previous extraction step. The efficiency and selectivity of the extraction method defines the representativeness of the extracted DOM fraction. Nowadays, the most widespread procedure for concentrating DOM is solid phase extraction (SPE) using styrene divinyl benzene polymer cartridges (PPL). Here, we investigate the effect of SPE-PPL on DOM elemental and optical properties to assess the efficiency and selectivity of this extraction method on water samples from the main intermediate and deep water masses of Arctic, Mediterranean and Antarctic origin present in the Cape Vert Frontal Zone (CVFZ, NW Africa). Furthermore, North and South Atlantic Central waters converge in this area and coastal DOM is injected by the giant upwelling filament of Cape Blanc. On one side, the colored fraction of DOM (CDOM) presented extraction efficiencies comparable to that of the bulk dissolved organic carbon (DOC), but decreased significantly with increasing wavelength, suggesting an affinity of PPL cartridges for low molecular weight organic compounds. While the protein-like fluorescent fraction of DOM (FDOM) was also extracted with the same efficiency than DOC, the extraction efficiency of the humic-like fraction was comparatively much higher. On the other side, dissolved organic nitrogen (DON) extraction efficiencies were about half that of DOC. These contrasting extraction efficiencies of the different DOM pools indicated that the extracts were enriched in N-poor, low molecular weight and recalcitrant DOM, therefore showing less variability than the corresponding bulk DOM. Furthermore, DOC, DON, CDOM and FDOM extracted were not homogeneous through the water column but displayed certain significant differences among water masses in both efficiency and selectivity.
1 Introduction
Dissolved organic matter (DOM) is a key component of biogeochemical cycles in marine ecosystems (Carlson and Hansell, 2015). DOM constitutes one of the largest organic carbon pool on Earth with 662 Pg C (Hansell et al., 2009a), comparable to the CO2 atmospheric pool (828 Pg C) (Joos et al., 2013). Despite its size and importance, little is still known about its chemical composition and structure (Dittmar, 2015; Repeta, 2015). To characterize DOM, an assortment of analytical techniques are currently used. The bulk elemental, optical and isotopic characterization of DOM can be applied directly to natural seawater samples (Mopper et al., 2007; Hansell et al., 2009b; Stedmon and Nelson, 2015; Álvarez-Salgado et al., 2022). Conversely, other approaches, such as the molecular characterization of DOM by nuclear magnetic resonance spectroscopy, ultrahigh resolution mass spectrometry or pyrolysis-gas chromatography-mass spectrometry, require concentration and desalinization of the sample before analysis (Mopper et al., 2007; Raeke et al., 2016; Amaral et al., 2020; Álvarez-Salgado et al., 2022). Each DOM characterization analysis provides information on different analytical windows, which partially overlap. This hinders the direct comparison of results obtained with different techniques (Mopper et al., 2007). Analytical schemes usually involve comparisons between bulk and extracted DOM, but the effects of the extraction process are not adequately quantified yet (Wünsch et al., 2018).
The most popular marine DOM isolation techniques at present are: i) solid phase extraction (SPE); ii) ultrafiltration (UF) and iii) reverse osmosis coupled with electrodialysis (RO/ED). The latter is able to isolate more than 64% of DOC, but it is an expensive and time-consuming method (Koprivnjak et al., 2009; Helms et al., 2015) that has been used only by few research groups. UF is based on the separation of DOM in two size fractions, high and low molecular weight (HMW and LMW, respectively), commonly using a 1 kDa cutoff membrane. There are different UF approaches, mainly based on the concentration factor (CF), depending on the objective of the study: DOM isolation or HMW quantification. For the first objective, cross-flow ultrafiltration systems equipped with membrane coils (Guo et al., 2000) are used to process large-volume samples (hundreds of liters of seawater), with recoveries of 10-30% in marine samples. Regarding the second objective, high-performance stirred UF cells are used, operated with membrane filters to process samples of lower volume (2-5 L), where the extraction efficiency is 35-55% (Simjouw et al., 2005; Martínez-Pérez et al., 2017a). UF and RO/ED procedures do not completely desalt the sample (Dittmar et al., 2008). On the other hand, SPE methodology implies using a solid phase (sorbent/resin) to adsorb the DOM of the liquid phase (sample), as most of the organic compounds (analyte) present a greater affinity for this solid phase. A solvent is then used to elute the analyte from the sorbent. Initially, this technique used silica chemically bonded with various groups (like C18 and C8), based on hydrophobic interactions between the analyte and the resin, but these first studies yielded low extraction recoveries of polar compounds (Fontanals et al., 2005). Other sorbents tested in marine samples were existing forms of carbon, like carbon blacks (GCBs) and porous graphitic carbon (PGC). The disadvantage of these resins is that DOM retention was excessive and sometimes irreversible (Masqué et al., 1998). Later on, XAD resins were also used for marine DOM extraction, reaching a 65% retention efficiency of phytoplankton-derived DOM (Lara and Thomas, 1994), but nowadays they are no longer manufactured. Currently, the most widely used resins are PPLs (styrene divinyl benzene polymer cartridges) due to their practicality, convenience and extraction efficiency, which are characterized by presenting a highly polar sorbent. PPLs are capable of extracting more than 60% of DOC in coastal and open deep and surface ocean waters (Green et al., 2014; Osterholz et al., 2014; Medeiros et al., 2015).
The isolation of dissolved organic nitrogen (DON) is still a difficult task. Since currently there are no specific efficient methods, the same extraction procedures as for DOC are used, resulting in low extraction efficiencies (Sipler and Bronk, 2015). Only a few studies discussing marine DOM extraction have provided information on nitrogen recovery. Hertkorn et al. (2013) employing PPL-resins in the South Atlantic obtained 24.8%, 28.3%, 11.3% and 10.2% of nitrogen recoveries for samples from depths of 5, 48, 200 and 5446 m, indicating that the extraction efficiency of deep-ocean samples was lower than surface. By contrast, the DOC extraction efficiency of the same samples were 37%, 44%, 40% and 43%, indicating that N extraction was much less efficient than C. DON discrimination by PPL is therefore denoted by high C:N molar ratios (Sipler and Bronk, 2015), which can increase up to 25 after extraction (Hertkorn et al., 2013). This trend was also observed in Osterholz et al. (2021) in South Pacific ocean samples, where C:N ranged from 19 to 27 for extracted DOM.
Besides C and N elemental analysis, absorption and fluorescence measurements are widely used to characterize the colored DOM fraction (CDOM) (Green and Blough, 1994) as these simple, unexpensive and quick methods can be used as indicators of the DOM structure (Helms et al., 2008; Boyle et al., 2009; Martínez-Pérez et al., 2017b). The absorption coefficients at certain wavelengths, the ratios of the absorption coefficients and the spectral slopes are used to provide information about the origin, molecular weight and aromaticity of DOM (Coble, 2007; Helms et al., 2008). For instance, the absorption coefficient at 254 nm (a254) is a proxy to the concentration of conjugated C double bonds and revealed as a good tracer for DOC (Lønborg and Álvarez-Salgado, 2014) and the absorption coefficients at 325 nm and 365 nm (a325 and a365) are proxies to aromatic compounds (Helms et al., 2008; Nelson and Siegel, 2013). Fluorescent DOM (FDOM) is the fraction of CDOM that is capable of emitting part of the absorbed light at longer wavelengths (Coble, 1996; Coble, 2007). FDOM intensity maxima are observed at excitation wavelengths < 400 nm, characteristic of protein-like substances and > 400 nm, characteristic of humic-like substances (Coble, 2007; Stedmon and Nelson, 2015; Álvarez-Salgado et al., 2022).
A small number of previous studies have attempted to assess the representativeness of the extracted materials by comparing the optical properties of the bulk and extracted samples. Green and Blough (1994) studied the impact of SPE extraction with C18 sorbents on the optical properties of fresh water DOM samples. They observed that extracted DOM showed lower CDOM spectral slopes than the bulk DOM, which means that the long wavelength absorbing material was extracted more efficiently. FDOM was consistent with CDOM results. Later, Boyle et al. (2009) using the same sorbent confirmed this trend for CDOM and FDOM in both fresh and marine water samples. More recently, Andrew et al. (2016) in riverine, estuarine and marine samples using C18 sorbents supported the preferential extraction of longer wavelength CDOM, associated with the HMW-DOM pool. Despite this result, a parallel molecular structure between natural and extracted samples was suggested as they exhibited comparable optical properties and also similar optical changes after NaBH4 reduction. In the same period, Chen et al. (2016) using PPL-resins in DOM samples from various sources (algae, leaf litter and marine surface samples) observed a decrease of UV absorbance after extraction, implying the preferential loss of more aromatic components. FDOM components recoveries were extracted unequally, with relatively higher humic-like extraction efficiency than the protein-like. In addition, marine samples exhibited a decrease in average molecular weight after extraction, suggesting that the biopolymer fraction of DOM might be the most affected by fractionation after extraction. Wünsch et al. (2018) quantified the impact of SPE-PPL in the optical properties of samples from contrasting Arctic fjords, obtaining that long-wavelength absorbing CDOM was extracted poorly. FDOM extraction efficiency from different fluorescence components was also unequal and some optical indices, as the slope of the short wavelength range 275-295 nm decreased while others, as the slope of the large wavelength range 350-400 nm, increased with extraction. This fact indicated a qualitative selection of SPE-PPL, that results in the homogenization of the extracted DOM. In addition to these works, focused on the optical properties of DOM, recent studies have examined the constraints of SPE-PPL using others methodologies. For instance, Dulaquais et al. (2023) used size exclusion chromatography and stable carbon isotopes in estuarine samples and found that PPL strongly size fractionates DOM. Hydrophobic compounds (included in the LMW pool) showed a high DOC extraction recovery and a successful recovery of the stable isotopic carbon composition. However, the extraction efficiency of hydrophilic compounds (contained within the HMW fraction) was poorer and the stable isotopic carbon composition was underestimated. In addition, N-rich compounds were also poorly extracted and the extraction efficiency was significantly affected by the quality of the DOM, rather than the salinity of the sample. In the same line Volikov et al. (2023) observed the same trends on a commercial fulvic acid (dissolved in ultrapure water), using size exclusion chromatography and optical properties.
Therefore, there are very few studies investigating how SPE using PPL resins affects DOM beyond DOC extraction and, to the best of our knowledge, the studies that examined the effects of optical properties (Chen et al., 2016; Wünsch et al., 2018; Volikov et al., 2023) did not relate these effects to DOC and DON extraction and did not study open ocean waters. Furthermore, these papers did not compare different water types and water masses, which contain distinct DOM fractions (hydrophilic vs hydrophobic, HMW vs LMW, and labile vs refractory compounds). To address this lack of knowledge, here we study the efficiency and selectivity of SPE-PPL in extracting various colored and fluorescence fractions of marine DOM isolated from the Cape Verde Frontal Zone (CVFZ, NW Africa) and we relate the results to the DOC and DON yields. Furthermore, we test whether the observed differences in the extraction efficiencies of DOC, DON, CDOM and FDOM among samples are related to the variety of surface, central, intermediate and deep water bodies of contrasting origin that meet in the CVFZ.
2 Material and methods
2.1 Study area
The CVFZ (Figure 1), a term proposed by Zenk et al. (1991) to define the southeastern boundary of the subtropical gyre in the North Atlantic Ocean, is located at about 20° N, off the Mauritanian upwelling. It is a very dynamic area as a result of the interaction of the Mauritanian upwelling with the Cape Verde front (CVF) (Zenk et al., 1991; Pastor et al., 2015). While the Mauritanian Current (MC) transports tropical waters northwards, the Canary (CC) and Canary Upwelling Current (CUC) transport subtropical waters southwards (Figure 1), converging at the CVF. In addition, the Poleward Undercurrent (PUC) flows northwards along the continental slope towards the Gulf of Cadiz (Pelegrí and Benazzouz, 2015). Convergence at the front together with the offshore export of coastal upwelled waters, generate the Cape Blanc giant filament (CBGF; Van Camp et al., 1991; Zenk et al., 1991).
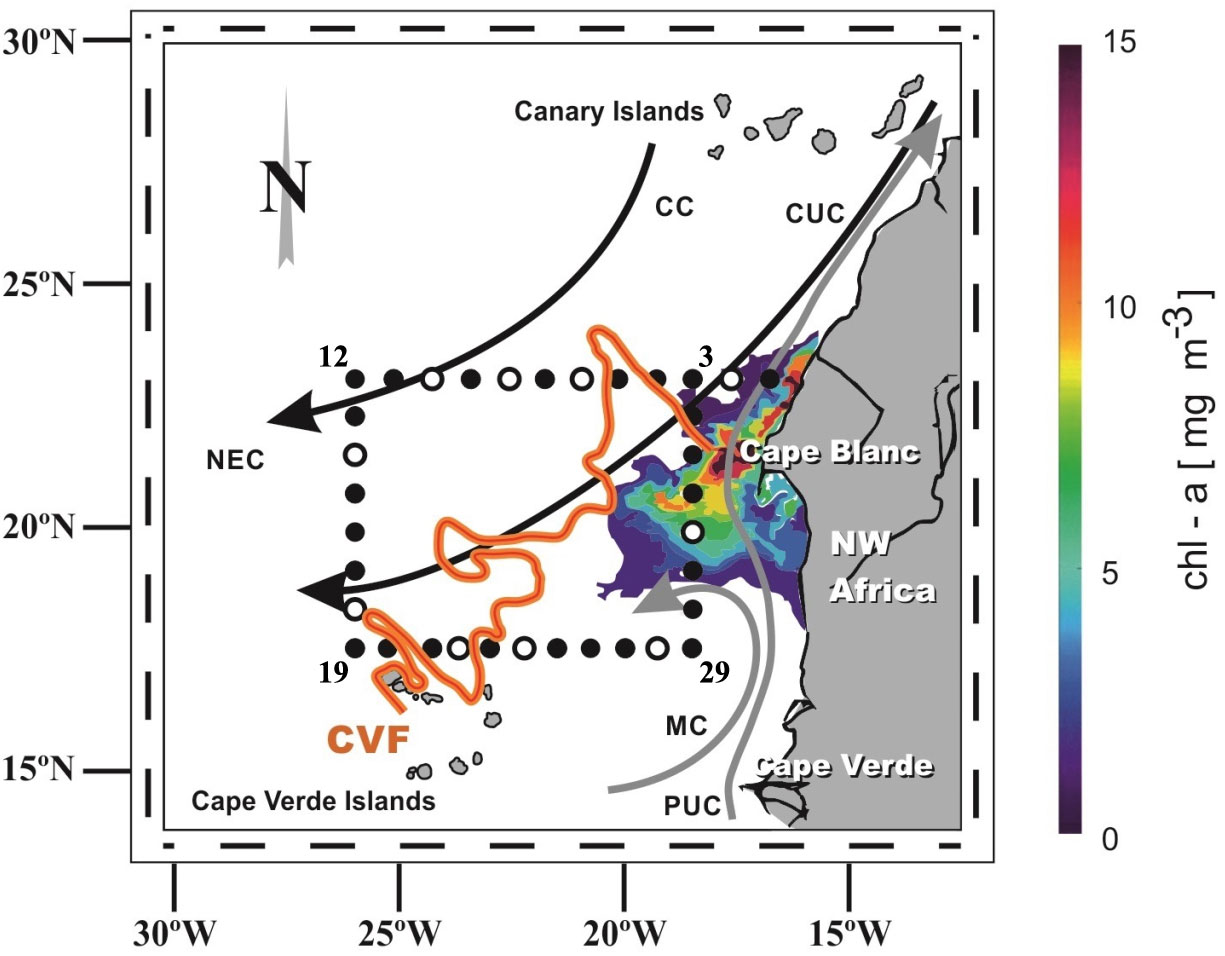
Figure 1 Map of the study area and the hydrographic stations sampled during the FLUXES I cruise (modified from Valiente et al., 2022). Numbers indicate station number; black circles represent the stations where SPE samples were collected and white circles represent stations where SPE samples where not collected. The main currents are represented with arrows: The Canary Current (CC), the Canary Upwelling Current (CUC), the North Equatorial Current (NEC), the Mauritania Current (MC) and the Poleward Undercurrent (PUC). The concentration of chlorophyll a, related to the Cape Blanc giant filament (CBGF), is illustrated with color contours near the coast.
Water masses from different origins meet in the study area (Figure 2). Surface waters, above 100 dbar, are characterized by low nutrient concentrations and high temperature, salinity and dissolved oxygen. During winter, subduction of these surface waters leads to the formation of mode waters, which are considered as precursors of central waters (Pastor et al., 2008; Álvarez et al., 2014; Pastor et al., 2015). Central waters are located between 100 and 700 dbar, and are differentiated according to their origin into East North Atlantic Central Water (ENACW, formed in the North Atlantic Ocean), and South Atlantic Central Water (SACW, formed in the South Atlantic Ocean) (Pérez-Rodríguez et al., 2001; Álvarez and Álvarez-Salgado, 2009; Locarnini et al., 2013; Pastor et al., 2015; Figure 2). These two water masses occupy the same density range, allowing the warm, salty and oxygen-rich ENACW to meet, interleave and mix with the colder, less salty and oxygen-poor SACW (Meunier et al., 2012). The encounter of these two water masses generates strong mesoscale activity in the form of intrusions, meanders, and eddies (Zenk et al., 1991; Pastor et al., 2015).
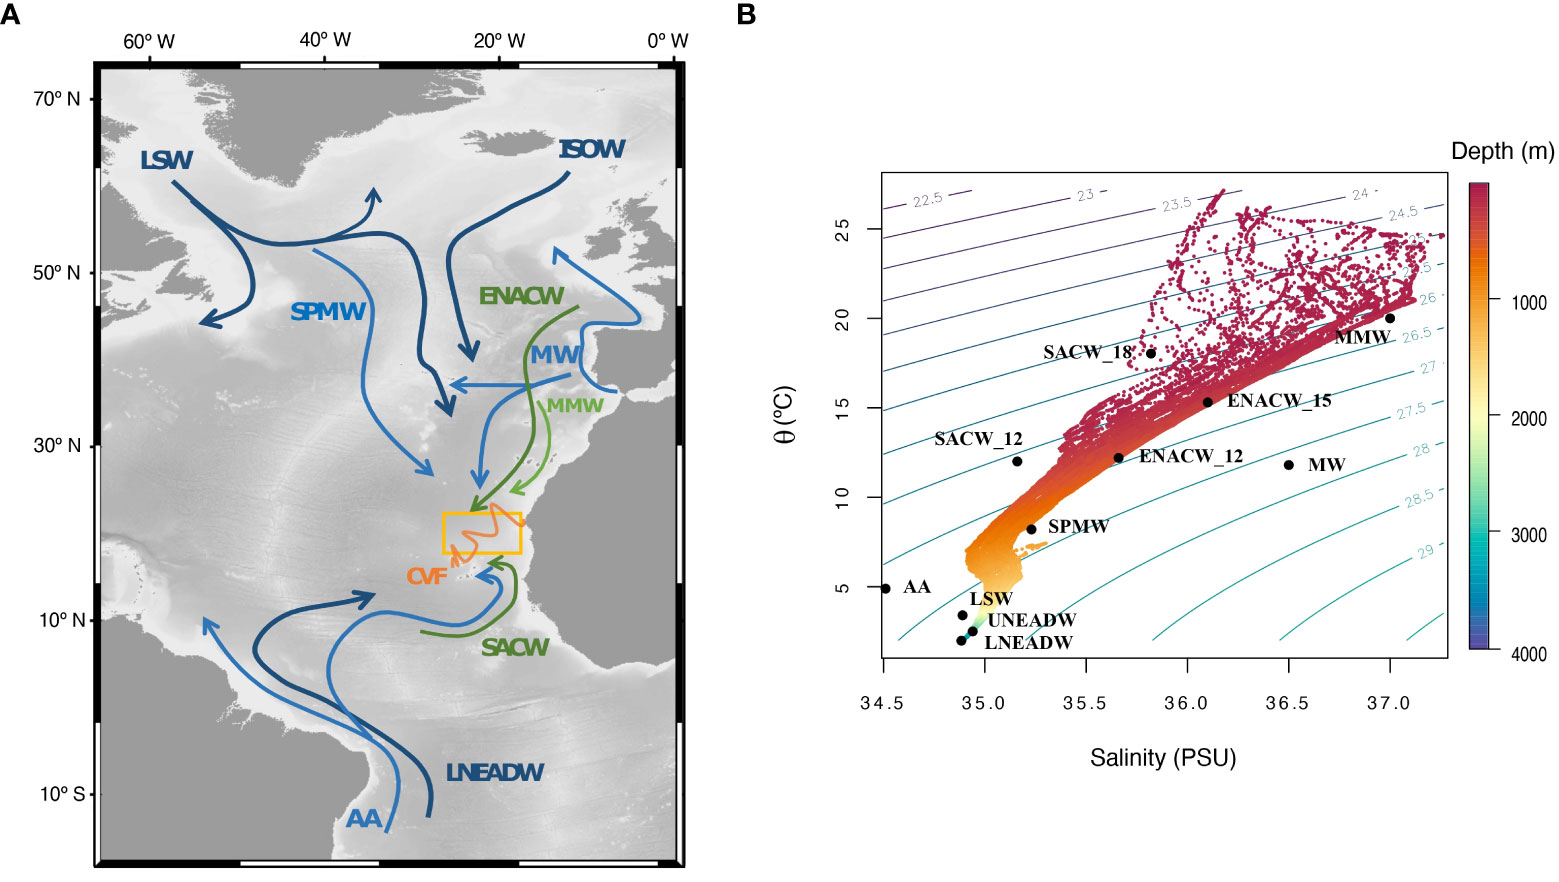
Figure 2 (A) Main water masses present in the CVFZ and (B) Potential temperature (θ°C) versus salinity (PSU) plot for the identification of the water masses intercepted during the FLUXES I cruise. In (A) arrows indicate the direction from its formation areas, corresponding to: Labrador Sea Water (LSW), Iceland Scotland Overflow Water (ISOW), Subpolar Mode Water (SPMW), Eastern North Atlantic Central Water (ENACW), Mediterranean Water (MW), Madeira Mode Water (MMW), Southern Atlantic Central Water (SACW), Antarctic Intermediate Water (AA) and Lower North East Atlantic Deep Water (LNEADW). The thickness and the color of the arrows indicates the bathymetric layer of each water mass. MMW: light green thin lines. Central waters: dark green thin lines. Intermediate waters: light blue thick lines. Deep waters: thicker dark blue lines. The yellow square represents the study area and the orange zigzag line is the position of the CVF at the time of sampling (taken from Burgoa et al., 2020). In (B) data was obtained from the continuous CTD profiles (1 salinity-temperature pair per meter). Contour isolines are sigma-theta values and the color indicates depth (dbar). Black dots represent the salinity and temperature of the pure water masses at their respective formation sites: Madeira Mode Water (MMW), Eastern North Atlantic Central Water of 15°C (ENACW_15) and 12°C (ENACW_12), Southern Atlantic Central Water of 18°C (SACW_18) and 12°C (SACW_12), Subpolar Mode Water (SPMW), Antarctic Intermediate Water (AA), Mediterranean Water (MW), Labrador Sea Water (LSW) and the Upper and Lower North East Atlantic Deep Water (UNEADW and LNEADW).
Intermediate waters occupy the water column between 700 and 1500 dbar. The shallowest intermediate water mass is the Subpolar Mode Water (SPMW), which is formed by the mixing of near-surface waters in the eastern Subpolar gyre of the North Atlantic (Pérez-Rodríguez et al., 2001; Álvarez and Álvarez-Salgado, 2009; de Boisséson et al., 2012). Below SPMW, the Antarctic Intermediate (AA) and Mediterranean (MW) waters are found (Figure 2). AA originates in the sub-Antarctic region, expanding from there to the Atlantic, Pacific and Indian oceans. In the Atlantic Ocean it reaches higher latitudes following the South Atlantic subtropical gyre, and is mainly characterized by low salinities (Suga and Talley, 1995; Locarnini et al., 2013). MW originates from the mixing of the Mediterranean Overflow Water (MOW) that spill at the Strait of Gibraltar and the ENACW in the Gulf of Cadiz, and it is characterized by being very salty, warm and dense (Pérez-Rodríguez et al., 2001; Álvarez and Álvarez-Salgado, 2009; Sánchez-Leal et al., 2017).
Beneath the intermediate waters, the deep layer is occupied by North East Atlantic Deep Water (NEADW), which extends from 1500 dbar to the bottom. NEADW results from the mixing of different waters, including the Iceland Scotland Overflow Water (ISOW), the Labrador Sea Water (LSW), the MW and the Antarctic Bottom Water (AABW) (Dickson and Brown, 1994; Pérez-Rodríguez et al., 2001; Lønborg and Álvarez-Salgado, 2014). ISOW is formed in the Nordic Seas due to winter convection in the Greenland Sea. From its formation area it expands to the eastern North Atlantic mainly through the Faroe-Shetland Channel and in a lower proportion by the Iceland-Faroe Ridge (Zou et al., 2017) and it is distinguished by being relatively salty and oxygen-rich (Swift, 1984). LSW is formed in the Labrador Sea, from where it expands southward in large tongues and it is characterized by low salinity and high oxygen concentrations (Talley and McCartney, 1982; Pérez-Rodríguez et al., 2001; Álvarez and Álvarez-Salgado, 2009). AABW is the name given to the mixture of water masses formed around Antarctica, mainly Weddell Sea Deep Water and Lower Circumpolar Deep Water (Álvarez et al., 2014; Ferreira et al., 2017), from where they expand to the rest of the oceans, reaching the North Atlantic Ocean through the Vema fracture after mixing with the NEADW (Dickson and Brown, 1994). Thus, NEADW is classified into Upper and Lower North East Atlantic Deep Water (UNEADW and LNEADW). UNEADW results from the mixing of ISOW with LSW and MW (Pérez-Rodríguez et al., 2001; Johnson, 2008; Lønborg and Álvarez-Salgado, 2014) and is characterized by its high salinity. LNEADW is composed mainly of ISOW and AABW, being characterized by its high oxygen concentration (Dickson and Brown, 1994; Pérez-Rodríguez et al., 2001; Lønborg and Álvarez-Salgado, 2014).
The CBGF transports large amounts of coastal dissolved (DOM) and suspended organic matter (POM) originated in the Mauritanian coast to the adjacent oligotrophic open ocean (Gabric et al., 1993; Ohde et al., 2015). In surface and central waters, the distribution of DOM and POM is dictated by the position of the CVF and associated meanders and eddies (Álvarez-Salgado and Arístegui, 2015; Campanero et al., 2022; Valiente et al., 2022). In intermediate and deep waters, POM and DOM distribute according to water mass mixing and large-scale remineralization of these materials from the water mass formation areas to the CVFZ (Campanero et al., 2022; Valiente et al., 2022). The organic matter that is mineralized in the intermediate and deep layers of the CVFZ is primarily sinking POM, which is less susceptible to lateral transport in the surface layer, so it sinks fast into the deeper layer (Fischer et al., 2009; Álvarez-Salgado and Arístegui, 2015; Campanero et al., 2022; Valiente et al., 2022).
2.2 Sampling strategy
Water samples were collected during the FLUXES I cruise on board R/V Sarmiento de Gamboa in July-August 2017. The cruise consisted on a hydrographic box embracing the CVFZ with 35 stations, 50 nautical miles apart, distributed around 4 transects: North and South of CVF, East (continental slope) and West (open ocean). Figure 1 shows the stations (black dots) sampled for DOM characterization during the cruise in each transect. A total of 133 samples were collected from 25 stations. A SBE 38 rosette sampler with 24 Niskin bottles of 12 L was used to collect the water samples. A SBE 911 plus CTD probe, an SBE-43 oxygen sensor and a Seapoint fluorometer were attached to the rosette to obtain continuous vertical profiles of conductivity, temperature, pressure, dissolved oxygen (DO) and Chl-fluorescence. The calibration of the sensors was carried out as detailed in Valiente et al. (2022).
For DOM characterization, 5 L of water was collected per sample in acid-cleaned polycarbonate carboys and refrigerated at 4°C until filtration. To remove the POM, the water sample was filtered under positive N2 pressure through a combusted (450°C, 4 h) Whatman GF/F filter. Thirty mL of the filtrate was transferred to combusted (450°C, 12 hours) amber glass vials for DOC and total dissolved nitrogen (TDN), 20 mL was transferred to polyethylene vials for nutrients analysis and 50 mL to determine the optical properties of DOM. While DOC/TDN and nutrient vials were stored frozen at -20°C until analysis, absorbance and fluorescence of DOM were measured immediately on board.
2.3 PPL extraction and sample preparation
Isolation of the DOM in 4-4.5 L of the filtrate was performed on board by solid phase extraction (SPE) using styrene divinyl benzene polymer cartridges (PPL) following the procedure of Dittmar et al. (2008). Prior to SPE, the filtered samples were acidified with HCl (37%, p.a., Merck), adding 1 mL per liter of sample. After extraction, PPL cartridges were desalinated with Milli-Q water at pH 2 (HCl 37%, p.a., Merck), dried with pure N2 and then stored at -20°C until elution in the base laboratory. Once in the laboratory, the cartridges were defrosted and DOM from the resin was eluted with 9 mL of methanol. These extracts were stored in combusted (450°C, 12 h) 10 mL amber glass vials and refrigerated at -20°C. In order to analyze the DOC/TDN and the optical properties of the extracts (SPE-DOM), 500 μL of each extract was evaporated at 40°C to eliminate the methanol, and then redissolved in Milli-Q water.
Differences in CDOM absorption and fluorescence intensities due to the inorganic matrix effect caused by redissolving the extracted DOM in milli-Q rather than in seawater were tested in a selected group of samples covering the water column from the surface to 4000 m. Samples were dissolved in low molecular weight seawater from the study area (with low absorbance and fluorescence intensities) and in Milli-Q water. The inter-matrix variation of the tested samples was lower than ±10%. Therefore, no matrix correction was applied when comparing bulk and extracted DOM samples.
2.4 Analytical methods
2.4.1 Dissolved organic carbon and total dissolved nitrogen
Determinations of DOC and TDN in the DOM and SPE-DOM samples were performed by high temperature oxidation. Samples were acidified to pH <2 with H3PO4 (85%, p.a., Merck), sparged with high-purity N2 gas to remove CO2 and analyzed in a Shimadzu TOC-V organic carbon analyzer in-line with a TNM-1 unit for nitrogen determination by chemiluminescence. The instruments were calibrated daily with potassium hydrogen phthalate (99.95–100.05%, p.a., Merck) and glycine (99.7%, p.a., Merck). The accuracy of the analyzer was ±1 μmol L−1 of carbon and ±0.2 μmol L−1 of nitrogen. The performance of the instrument was verified daily with the Carbon Reference Materials provided by D. A. Hansell lab (University of Miami, USA).
2.4.2 Inorganic nutrients and dissolved organic nitrogen
The dissolved inorganic nutrients (NO3-, NO2-, NH4+, PO4 and SiO4H4) were determined by segmented flow analysis following the colorimetric methods proposed by Grasshoff et al. (1999), except for NH4+ which was determined fluorometrically (Kérouel and Aminot, 1997). DON was calculated as the difference between TDN and NO3- + NO2- + NH4+.
2.4.3 Absorption of dissolved organic matter
Absorption measurements of bulk CDOM were performed on board while those of SPE-CDOM were performed at the base laboratory after elution. A Jasco V-750 spectrophotometer was used in both instances. DOM samples, with low absorption, were determined using 10-cm length quartz cuvettes, while SPE-DOM samples, hundreds of times more concentrated, were measured in 1-cm length quartz cuvettes. Measurements were performed at constant room temperature and the absorption spectra were recorded from 700 to 250 nm. To obtain the Naperian absorption coefficient (m-1) the absorbance was multiplied by 2.303 and divided by the length of the quartz cuvettes (Braslavsky, 2007; Stedmon and Nelson, 2015). CDOM recoveries were obtained from measurements of the absorption coefficients at 254 nm (a254), 325 nm (a325), and 365 nm (a365) of the DOM and SPE-DOM samples.
2.4.4 Fluorescence of dissolved organic matter
FDOM was measured on board while SPE-FDOM was measured in the base laboratory after elution. Both series of measurements were performed with a Perkin Elmer LS55 luminescence spectrometer operated at a constant room temperature. Excitation/Emission wavelengths of the fluorescence humic-like peak M (320 nm/410 nm) and the protein-like peak T (280 nm/350 nm) (Coble, 2007; Stedmon and Nelson, 2015) were obtained from the DOM and SPE-DOM samples. The measurements were performed using slit widths of 10 nm in a 1 cm quartz cuvette. Inner filter correction was avoided as absorbance values of the samples (using 1-cm cuvettes) did not exceed the limit value of 0.042 absorbance units (Kothawala et al., 2013). Milli-Q water was used as the reference blank. The instrument was calibrated daily in Raman units using a Milli-Q water sealed cell (Perkin Elmer). Performance of the instrument in the protein-like region was tested using a Strana p-terphenyl methacrylate block and in the humic-like region with a Strana tetraphenyl butadiene methacrylate block. Fluorescence values were first corrected by subtracting the values obtained with the Milli-Q water blank from the raw analytical values. In a second step, the corrected fluorescence intensities were normalized and expressed in Normalized Fluorescence Intensity Units (NFIU) using a solution of quinine sulphate dihydrate (≥99.0%, purity valid for fluorescence, Fluka) and tryptophan (≥99.0%, Fluka) standards in H2SO4 0.05 M (95-97%, p.a., Merck) following Nieto-Cid et al. (2005). Fluorescence recoveries of all the peaks were calculated.
2.4.5 Water bodies in the study area
We extracted the DOM of 133 samples, 50 of them corresponded to the surface layer and included surface and deep chlorophyl maximum (DCM) samples. The other 83 samples corresponded to the central, intermediate and deep waters present in the CVFZ. The 50 samples of the surface layer were classified into five water bodies based on three conditions. First, their location relative to the CVF (as defined by Burgoa et al., 2020): samples were classified as waters north or south of the CVF (Figure 1). Second, samples affected by the presence of the Cape Blanc Giant Filament, as detected from the distribution of satellite-derived surface chlorophyll a concentration (Valiente et al., 2022; Figure 1). Last, samples were classified according to their depth into surface and DCM. In summary, the identified water bodies were: Surface North (SUP_N), DCM North (DCM_N), Surface South (SUP_S), DCM South (DCM_S) and The Cape Blanc Giant Filament (CBGF).
To classify the 83 samples from the ocean interior, we applied a multiparameter water type analysis. A water type (WT) is a body of water with characteristic thermohaline and chemical properties originated in a particular ocean area (Tomczak, 1999). The WTs sampled in the present study have been identified using the analysis conducted by Valiente et al. (2022), where the variables potential temperature (θ), salinity (S), silicate (SiO4H4) and NO (conservative chemical parameter; NO = O2 + 9.3·NO3-; Broecker, 1974); were used to determine the WT contributions. The thermohaline and chemical characteristics of each WT are summarized in Table S1. Eleven WTs were identified by (Valiente et al., 2022): Madeira Mode Water (MMW), Eastern North Atlantic Central Water of 12°C (ENACW_12) and 15°C (ENACW_15), South Atlantic Central Water of 12°C (SACW_12) and 18°C (SACW_18), Subpolar Mode Water (SPMW), Antarctic Intermediate Water (AA), Mediterranean Water (MW), Labrador Sea Water (LSW) and the Upper (UNEADW) and Lower North East Atlantic Deep Water (LNEADW). In order to represent better each water body distribution, we defined the dominant WT on each sample as that with the largest contribution. Table S2 summarizes the contribution of each WT to the samples where they were present and to those where they were the dominant WT. In order to show the results, WTs were organized into 4 layers: colder central waters (ENACW_15, SACW_12 and ENACW_12), intermediate waters (SPMW, AA and MW) and deep waters (LSW, UNEADW and LNEADW). As SACW_18 and MW did not have samples where they dominate, their DOM concentrations were not calculated. Furthermore, as MMW and SACW_12 contribution was minimal in all samples, we did not consider them for the analysis of the results. The WT analysis was not applied to the surface layer because of the nonconservative behavior of chemical variables in the surface ocean.
2.4.6 Statistical analysis
We used Kruskal-Wallis tests followed by post-hoc Wilcoxon tests with Bonferroni correction to test for differences between layers and within the different water bodies of each layer. Linear orthogonal distance regression (ODR) was applied to analyze the relationship between elemental and optical DOM and SPE-DOM properties. The Shapiro-Wilk normality test was applied to the residuals of the fitted models. The statistical T-test was used to compare the DOC and DON concentrations found in our study with those from Valiente et al. (2022), and also to compare the intercept and the slope between the ODR equations. The Statistical Software R.4.1.3 (R Core Team, 2022) was used to conduct these analyses.
3 Results
3.1 DOC/DON and SPE-DOC/DON
The mean (SD) DOC and SPE-DOC of all samples collected in the CVFZ were 59.2 (14.7) µM-C and 29.9 (6.1) µM-C, respectively, with a mean extraction efficiency of 52 (8)%. In contrast, for DON and SPE-DON they were 5.1 (1.5) µM-N and 1.4 (0.3) µM-N respectively, resulting in a mean extraction efficiency of only 28 (7)%. Consequently, the mean (SD) C:N molar ratio of DOM and SPE-DOM were 12.2 (2.9) and 22.4 (2.1), respectively. The specific values of DOC, SPE-DOC, DON, SPE-DON and the corresponding ratios and extraction efficiencies for each layer (surface, warm and cold central, intermediate and deep) and water body (surface water bodies and water types) are summarized in Table S3 and illustrated in Figure 3. Examination of these box-whisker plots reveals that concentration and extraction efficiency values varied between layers and within the different water bodies of each layer.
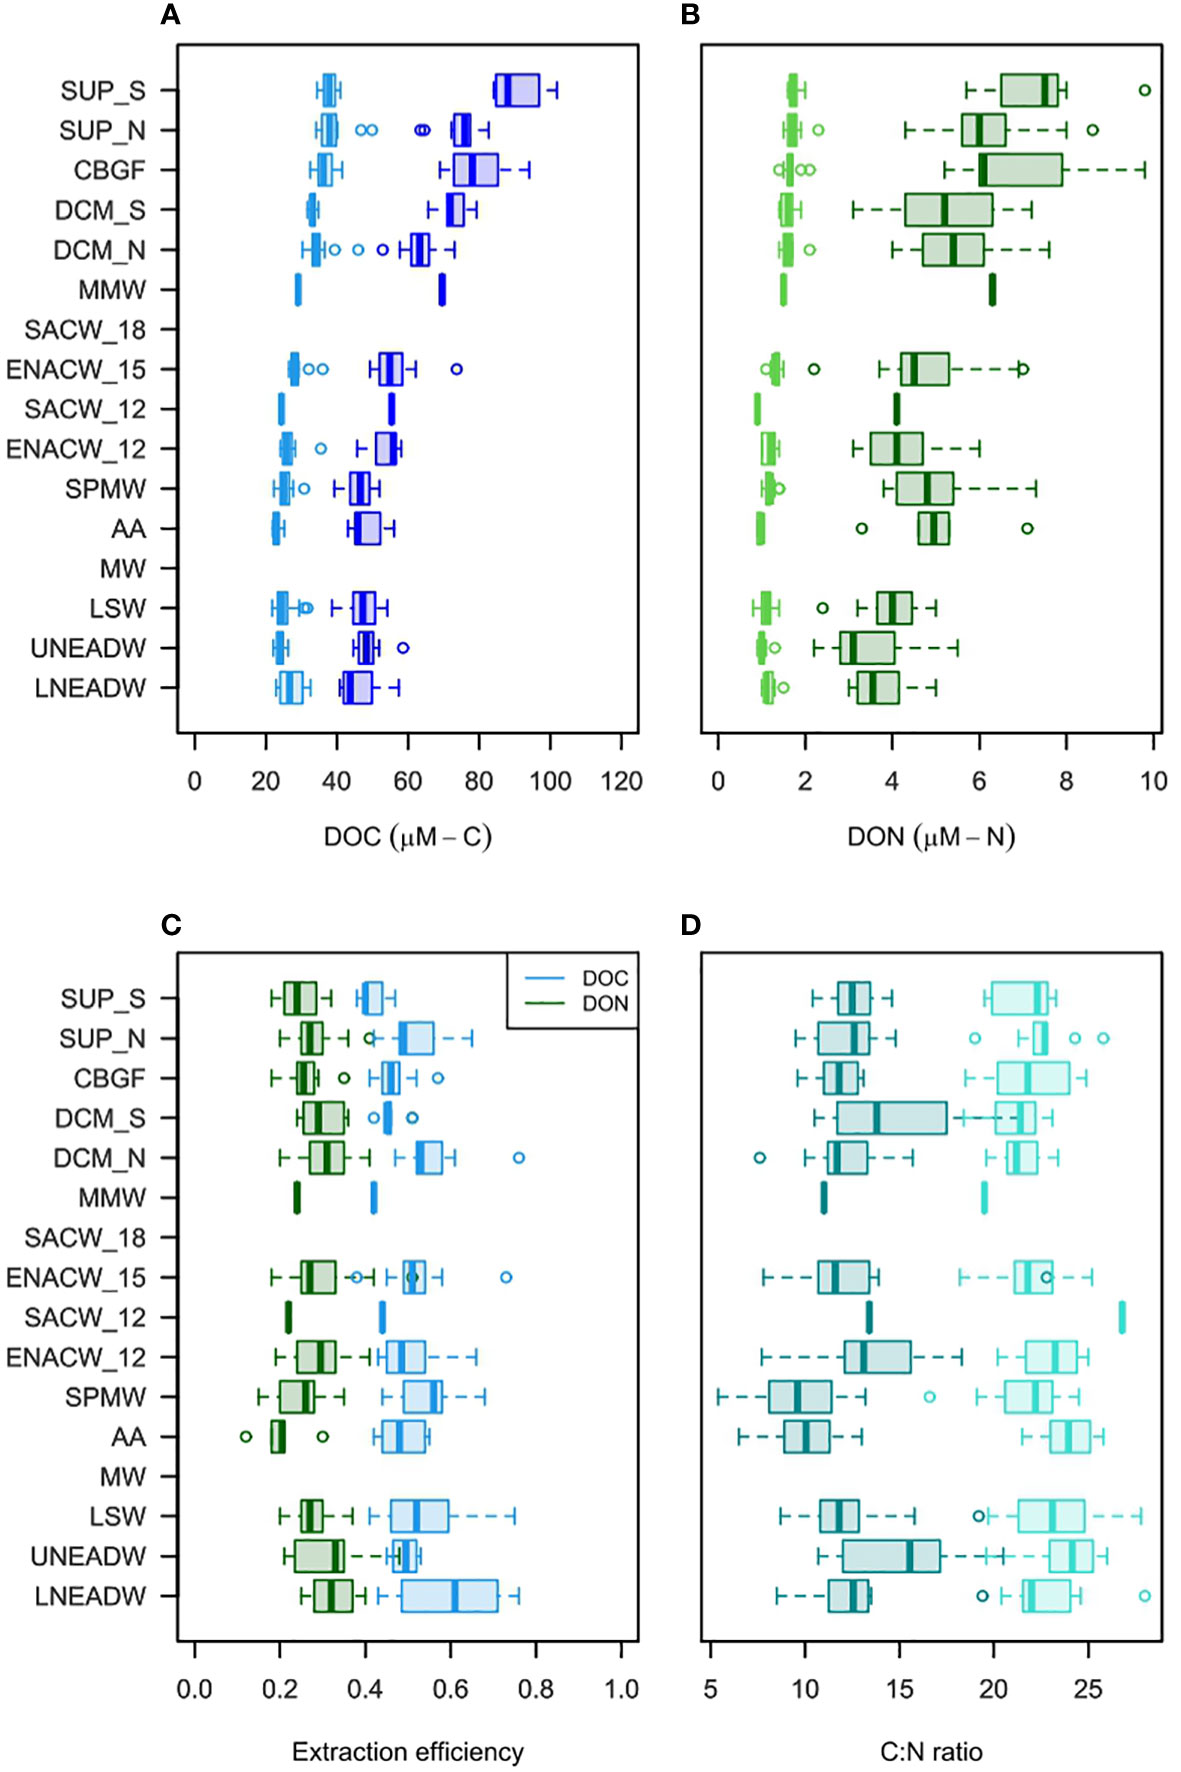
Figure 3 (A) DOC, (B) DON, (C) extraction efficiency for DOC (blue) and DON (green), and (D) C:N ratio, for each water body. Dark and light box-whisker plots represent bulk and SPE values, respectively. The boxes represent the interquartile range of the data, where the dark line represents the median. The whiskers represent the minimum and maximum values of the range, excluding the outliers, which are represent by dots. The y-axis represents the water bodies and WTs, water bodies were ordered by its position from the CVF: Waters south of CVF and Water north of CVF, while WTs were ordered by depth (Table S1) to obtain the water column profile. Water bodies were: Surface North (SUP_N, 5.1 ± 0.4 Dbar), DCM North (DCM_N, 80.1 ± 17.0 Dbar), Surface South (SUP_S, 4.7 ± 0.7 Dbar), DCM South (DCM_S, 35.2 ± 15.0 Dbar) and The Cape Blanc Giant Filament (CBGF, 16.5 ± 15.9 Dbar). WTs were: Madeira Mode Water (MMW, 55.2 ± 21.2 Dbar), Eastern North Atlantic Central Water of 12°C (ENACW_12, 462.0 ± 63.1 Dbar) and 15°C (ENACW_15, 298.2 ± 14.4 Dbar), South Atlantic Central Water of 12°C (SACW_12, 345.3 ± 61.6 Dbar) and 18°C (SACW_18, 99.2 ± 55.8 Dbar), Subpolar Mode Water (SPMW, 749.3 ± 18.6 Dbar), Antarctic Intermediate Water (AA, 910.3 ± 101.4 Dbar), Mediterranean Water (MW, 1498.1 ± 54.5 Dbar), Labrador Sea Water (LSW, 1519.9 ± 44.5 Dbar) and the Upper (UNEADW, 3048.9 ± 141.4 Dbar) and Lower North East Atlantic Deep Water (LNEADW, 3822.6 ± 114.4 Dbar).
Figures 3A, B and Table S3 show that DOC and DON decreased with depth. The highest DOC values were found in the surface layer (p < 0.03), followed by the cold central waters, with higher DOC values than the intermediate and deep waters (p < 0.0004), whereas significant differences between the latter were not found. The same pattern was found for SPE-DOC. The highest DON and SPE-DON values were found in the surface layer (p < 0.001). The cold central (p < 0.05) and intermediate (p < 0.0003) waters had higher DON values than deep waters, but significant differences between them were not found. After extraction, only cold central waters showed higher values of SPE-DON compared to deep waters (p < 0.01). Although SPE-DOC and SPE-DON represented quite well the variability of bulk DOC and DON between layers, within the layers, they were unable to capture all the variability. Pairwise comparisons within the surface waters (Figure 3A) revealed that bulk DOC values were higher in the surface than at the DCM, and also higher south than north of the CVF. This variability was not captured by SPE-DOC, where only DCM_S was lower than SUP_S and SUP_N (p < 0.03). In contrast, DON and SPE-DON values (Figure 3B) were homogeneous through the water bodies of the surface layer. Below the surface waters, cold central, intermediate and deep waters showed no significant differences within each layer in DOC and DON concentrations, but for SPE-DOC and SPE-DON, SPMW was higher than AA (p < 0.01) and only for SPE-DON ENACW_15 was higher than ENACW_12 (p < 0.01).
How representative SPE-DOM was of bulk DOM can also be studied by observing variations in the extraction efficiency through the water column (Table S3; Figure 3C). If adequately represented, the extraction efficiency should be nearly constant. Within the layers, differences occurred only in the surface waters, as SUP_S, CBGF and DCM_S presented lower values than DCM_N (p < 0.01), and also SUP_S lower than SUP_N (p < 0.01), while in the water column only SUP_S presented lower extraction efficiency than the intermediate waters (p < 0.02). Thus, the DOC extraction efficiency in the surface waters fluctuated with the water bodies, but below the surface waters it did not vary significantly. With respect to DON extraction efficiency between and within the layers, there were no significant difference. Consequently, the C:N molar ratio was quite homogeneous through the layers (Figure 3D), and only the intermediate waters presented lower values than cold central waters and UNEADW (p < 0.03). After extraction, only AA presented larger values than SPMW (p < 0.02) and an increase in the C:N ratio from the original to the extracted one was observed.
3.2 CDOM and SPE-CDOM
The mean (SD) a254 and SPE-a254 of all samples were 1.18 (0.33) m–1 and 0.57 (0.15) m–1, respectively, with an extraction efficiency of 49 (8)%. For a325 and SPE-a325 the mean values were 0.24 (0.09) m–1 and 0.10 (0.04) m–1, respectively, with an extraction efficiency of 44 (17)%. Moreover, a365 and SPE-a365 mean values were 0.13 (0.06) m–1 and 0.05 (0.03) m–1, respectively, with 42 (21)% of extraction efficiency (Figure 4). Thus, the CDOM extraction efficiency of a254 was comparable with the extraction efficiency of DOC, but for a325 and a365 were significantly lower (Figures 4D–F). The specific values of a254, a325 and a365 and the corresponding a254/a365 ratio and the extraction efficiency for each layer and water body are summarized in Table S4.
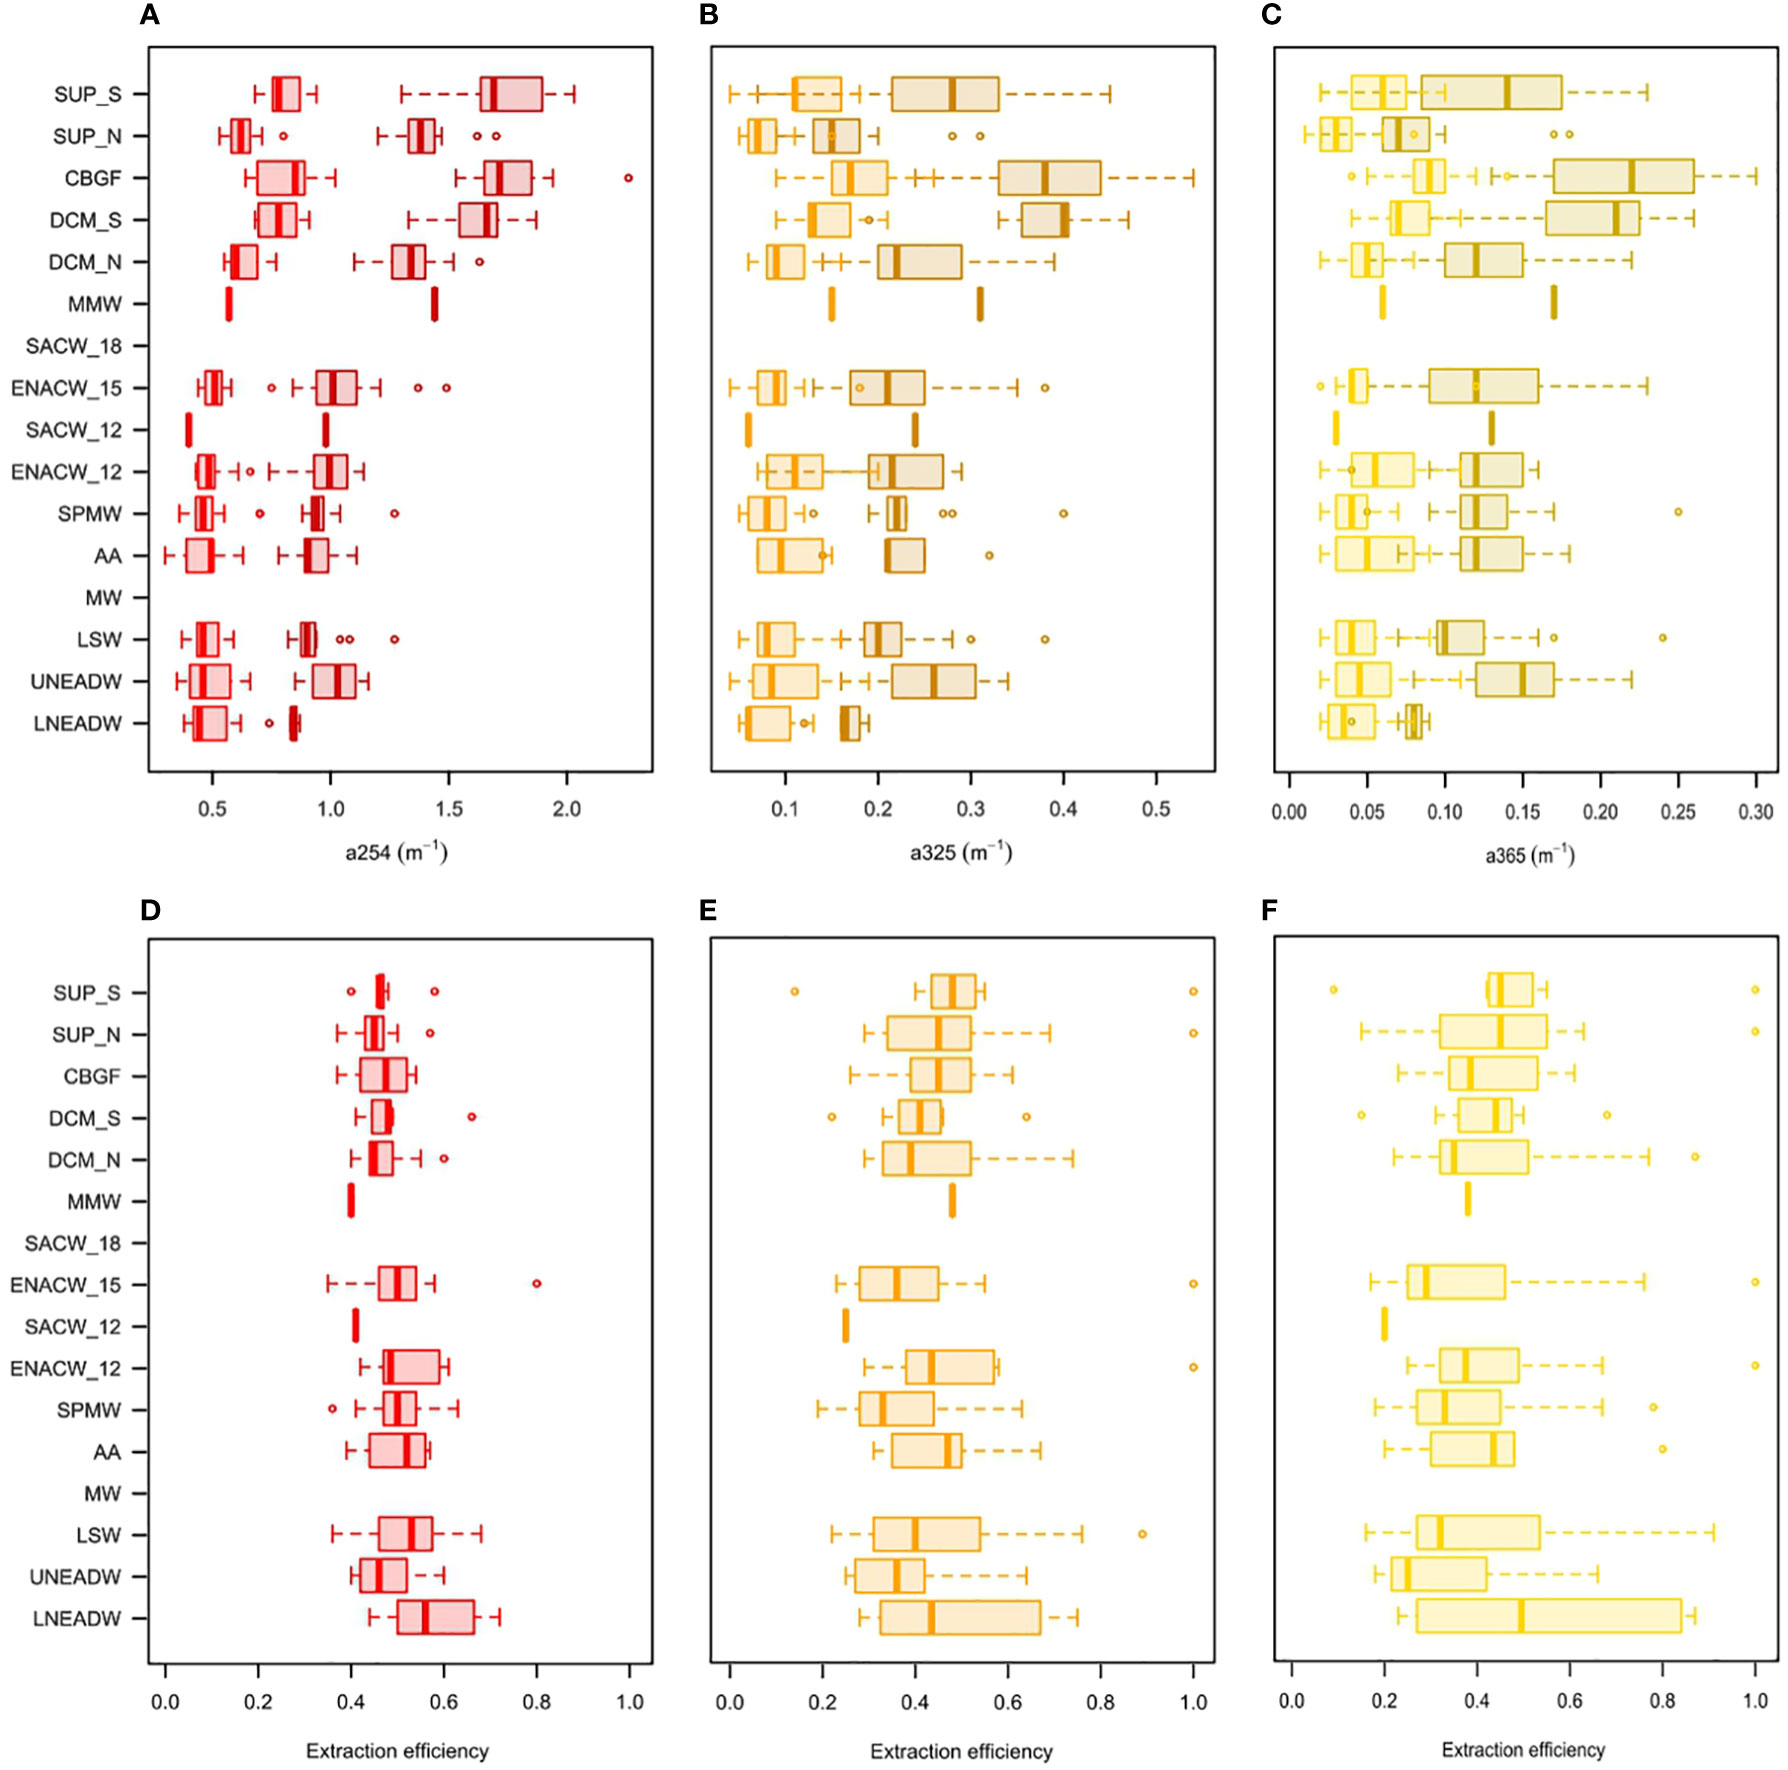
Figure 4 (A) a254, (B) a325 and (C) a365 of the bulk and SPE samples and (D) a254, (E) a325, (F) a365 extraction efficiency, for each water body. Dark and light values represent bulk and SPE values, respectively. The boxes represent the interquartile range of the data, where the dark line represents the median. The whiskers represent the minimum and maximum values of the range, excluding the outliers, which are represent by dots. The y-axis represents the water bodies and WTs, water bodies were ordered by its position from the CVF: Waters south of CVF and Water north of CVF, while WTs were ordered by depth (Table S1) to obtain the water column profile. Water bodies were: Surface North (SUP_N, 5.1 ± 0.4 Dbar), DCM North (DCM_N, 80.1 ± 17.0 Dbar), Surface South (SUP_S, 4.7 ± 0.7 Dbar), DCM South (DCM_S, 35.2 ± 15.0 Dbar) and The Cape Blanc Giant Filament (CBGF, 16.5 ± 15.9 Dbar). WTs were: Madeira Mode Water (MMW, 55.2 ± 21.2 Dbar), Eastern North Atlantic Central Water of 12°C (ENACW_12, 462.0 ± 63.1 Dbar) and 15°C (ENACW_15, 298.2 ± 14.4 Dbar), South Atlantic Central Water of 12°C (SACW_12, 345.3 ± 61.6 Dbar) and 18°C (SACW_18, 99.2 ± 55.8 Dbar), Subpolar Mode Water (SPMW, 749.3 ± 18.6 Dbar), Antarctic Intermediate Water (AA, 910.3 ± 101.4 Dbar), Mediterranean Water (MW, 1498.1 ± 54.5 Dbar), Labrador Sea Water (LSW, 1519.9 ± 44.5 Dbar) and the Upper (UNEADW, 3048.9 ± 141.4 Dbar) and Lower North East Atlantic Deep Water (LNEADW, 3822.6 ± 114.4 Dbar).
For a254 and SPE-a254 (Table S4; Figure 4A), all the surface water bodies showed the highest values (p < 0.05). The surface waters south of the CVF presented higher values than to the north of the CVF. The CBGF presented significantly higher values (p < 0.004) than all the surface waters north of the CVF and also SUP_S larger than DCM_N (p < 0.05). SPE-a254 presented the same distribution pattern as a254, but in this case all the surface waters south of the CVF were higher than those to the north (p < 0.05). Below the surface waters, there were no significant differences for a254, except for LNEADW, which had the lowest values of all layers (p < 0.04). This difference was lost with the extraction, where cold central, intermediate and deep waters presented similar values.
Longer-wave absorption coefficients measured in the bulk samples (Table S4; Figures 4B, C) presented higher standard deviations so that differences between layers and within the water bodies of each layer were less evident. Thus, for a325 and SPE-325, only CBGF presented higher values than cold central waters, intermediate waters, LSW and LNEADW (p < 0.05). Within the surface layer, CBGF and DCM_S presented higher a325 values than SUP_N (p < 0.01) and also CBGF larger than DCM_N (p < 0.01). This variability was also captured after extraction. But within the deep waters, while LNEADW presented the lowest a325 values (p < 0.02), after extraction this difference was lost. a365 distributed as a325, but in this case LNEADW also presented lower values than the intermediate waters (p < 0.02). However, after extraction, LNEADW presented similar values than the rest of water bodies.
Thus, CDOM results showed that the surface waters to the south of the CVF presented higher values than to the north, a pattern that was also captured by SPE-CDOM. Furthermore, CDOM results showed that LNEADW presented the lowest values for all of the coefficients studied (p < 0.02). This difference was lost after extraction. SPE-CDOM represented the variability of CDOM reasonably well, since the variation of the extraction efficiency with depth for the all the CDOM measurements (Figures 4D–F), did not differ significantly between and within the layers.
In addition, as an indicator of the quality of the bulk and extracted CDOM material, we calculated the ratio a254/a365 in CDOM and SPE-CDOM, serving as proxies for the inverse of the average molecular weight of DOM. We observed that the SPE procedure caused this index to shift towards higher values in all water bodies and water types (Table S4). The mean (SD) ratios of bulk and extracted a254/a365 were 10.88 (7.63) and 13.34 (7.22) respectively. Before extraction, SUP_N and SUP_S presented the highest values (p < 0.05). The rest of the water bodies and water types presented homogeneous values, with the exception of LNEADW, which presented higher values than intermediate waters, LSW and UNEADW (p < 0.05). After extraction, variability increased, losing part of the differences found: only SUP_N presented higher values than CBGF and DCM_S (p < 0.05).
3.3 FDOM and SPE-FDOM
The mean (SD) peak M, SPE-peak M, peak T and SPE-peak T were 2.47 (0.82), 2.09 (0.64), 3.78 (2.19) and 1.78 (0.64) NFIU, respectively (Figure 5), resulting in average extraction efficiencies of 87 (12)% and 54 (20)%, for peak M and peak T, respectively (Figure 5C). FDOM, SPE-FDOM and the extraction efficiency for each layer and water body are summarized in Table S5.
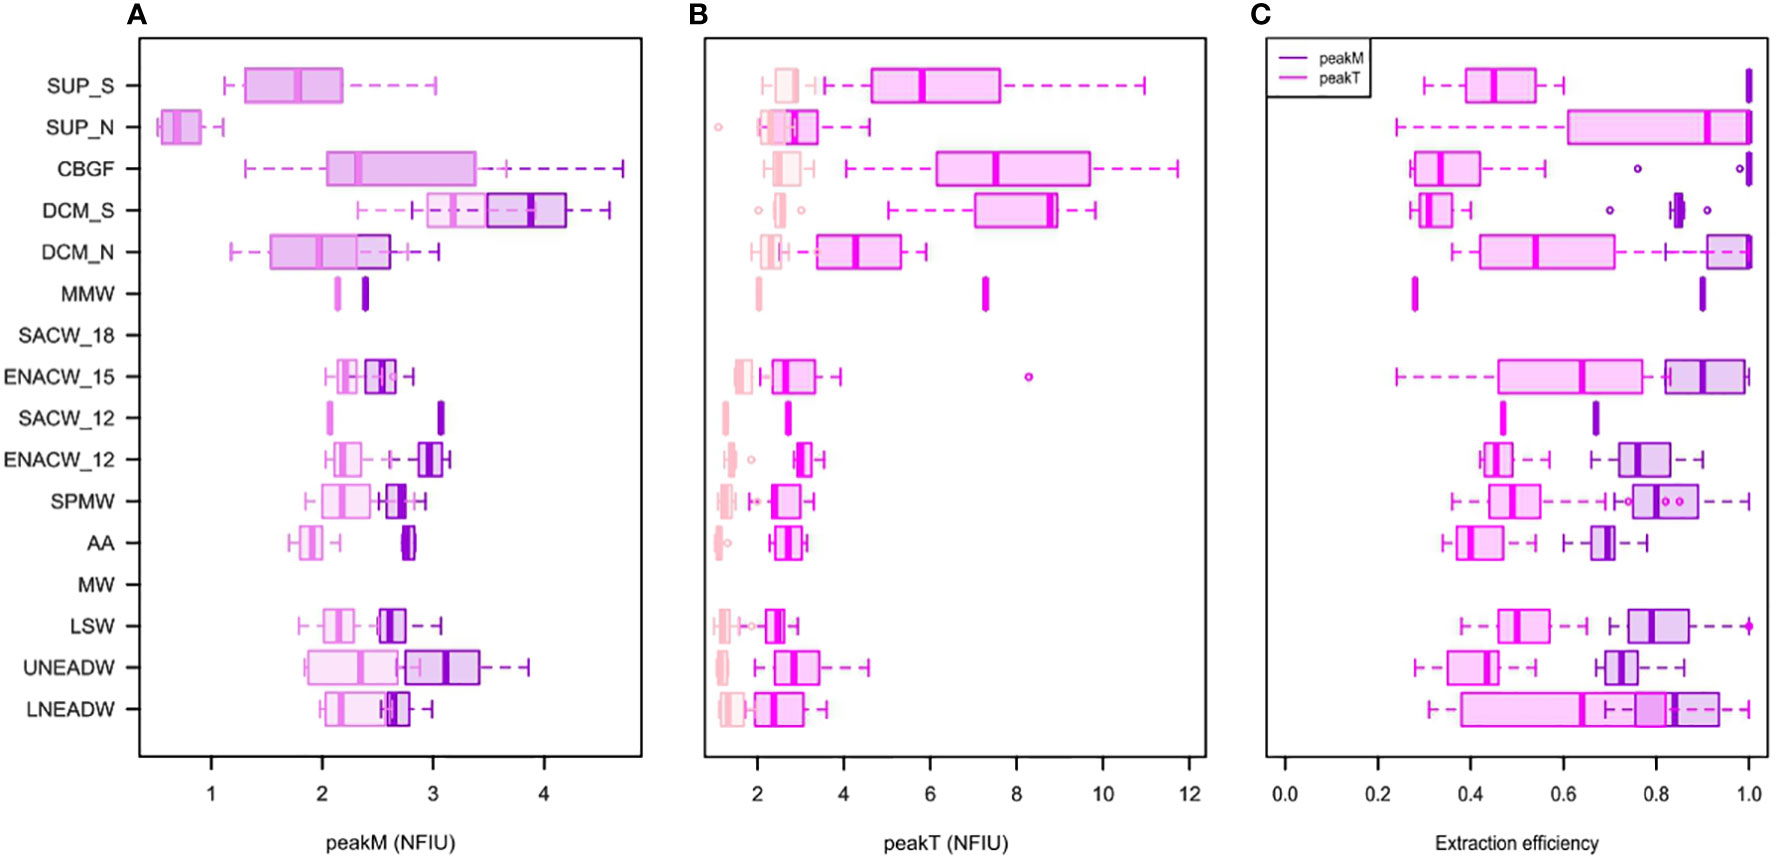
Figure 5 (A) peak M, and (B) peak T fluorescence intensity of the bulk and SPE samples, and (C) the peak M and peak T extraction efficiency, for each water body. Dark and light values represent bulk and SPE values, respectively. The boxes represent the interquartile range of the data, where the dark line represents the median. The whiskers represent the minimum and maximum values of the range, excluding the outliers, which are represent by dots. The y-axis represents the water bodies and WTs, water bodies were ordered by its position from the CVF: Waters south of CVF and Water north of CVF, while WTs were ordered by depth (Table S1) to obtain the water column profile. Water bodies were: Surface North (SUP_N, 5.1 ± 0.4 Dbar), DCM North (DCM_N, 80.1 ± 17.0 Dbar), Surface South (SUP_S, 4.7 ± 0.7 Dbar), DCM South (DCM_S, 35.2 ± 15.0 Dbar) and The Cape Blanc Giant Filament (CBGF, 16.5 ± 15.9 Dbar). WTs were: Madeira Mode Water (MMW, 55.2 ± 21.2 Dbar), Eastern North Atlantic Central Water of 12°C (ENACW_12, 462.0 ± 63.1 Dbar) and 15°C (ENACW_15, 298.2 ± 14.4 Dbar), South Atlantic Central Water of 12°C (SACW_12, 345.3 ± 61.6 Dbar) and 18°C (SACW_18, 99.2 ± 55.8 Dbar), Subpolar Mode Water (SPMW, 749.3 ± 18.6 Dbar), Antarctic Intermediate Water (AA, 910.3 ± 101.4 Dbar), Mediterranean Water (MW, 1498.1 ± 54.5 Dbar), Labrador Sea Water (LSW, 1519.9 ± 44.5 Dbar) and the Upper (UNEADW, 3048.9 ± 141.4 Dbar) and Lower North East Atlantic Deep Water (LNEADW, 3822.6 ± 114.4 Dbar).
As seen in Table S5 and Figure 5A, DCM_S presented higher peak M values than ENACW_15 (p < 0.04), the intermediate waters (p < 0.02) and LSW (p < 0.01), while SUP_N presented the lowest values of all layers (p < 0.02). The rest of the water bodies and water types presented similar values. Within the surface water bodies, larger values of peak M were found at the DCM than in the surface and also larger to the south than to the north of the CVF, showing DCM_S the highest fluorescence intensities (p < 0.01), but without significant differences with CBGF. The same trend was observed for SPE-peak M. Within the layers below the surface waters, larger peak M values were found in ENACW_12 than in ENACW_15 (p < 0.001), while in the deep layer, UNEADW presented the highest values (p < 0.03). For SPE-peak M only SPMW was significantly higher than AA (p < 0.01).
Peak T (Table S5; Figure 5B) displayed larger values in the surface water bodies south of the CVF than in cold central, intermediate and deep waters (p < 0.05), except for UNEADW which did not present differences with SUP_S. While for SPE-peak T, only ENACW_15 presented significantly higher values than the intermediate and deep waters (p < 0.05), but without differences with LNEADW. Within the surface layer, Peak T presented larger values to the south of the CVF than to the north. The latter showed differences with CBGF and DCM_S (p < 0.005). No differences between surface and DCM were found. This variability was not captured through SPE-PPL. Pairwise comparison within layers far from the surface showed that peak T was distributed homogeneously along the cold central, intermediate and deep waters. However, for SPE-peak T, ENACW_15 presented higher values than ENACW_12 (p < 0.004) and also SPMW was higher than AA (p < 0.01).
FDOM extraction efficiencies (Table S5; Figure 5C) were not constant across the water column, presenting variations in relation to water bodies. SUP_S, SUP_N, CBGF and DCM_N presented higher peak M extraction efficiency than cold central, intermediate and deep waters (p < 0.05). Within the surface layer, only DCM_S differed by presenting the lowest peak M yield (p < 0.05). Below surface waters, ENACW_15 presented higher peak M yield than AA (p < 0.05) and AA lower than SPMW (p < 0.01). Likewise, for peak T extraction efficiency, SUP_N and DCM_S differed from the cold central waters, intermediate waters and LSW, by presenting the highest (p < 0.05) and the lowest (p < 0.02) yields respectively. Within the surface layer, SUP_N presented higher values than SUP_S, CBGF and DCM_S (p < 0.04), and DCM_N larger than CBGF and DCM_S (p < 0.04). Below the surface, ENACW_15 presented higher peak T yield than ENACW_12 (p < 0.01) and AA lower than SPMW (p < 0.04).
3.4 Link between elemental and optical DOM and SPE-DOM properties
In order to study the link between the elemental and optical characteristics of the bulk and extracted DOM, linear orthogonal distance regressions (ODR) were performed between the optical properties and the DOC and DON concentrations before and after extraction of each water body (n = 14). Results showed that there was a linear relationship between DOC and a254 (DOC = 7 (5) + 44 (4) a254; R2 = 0.92; p < 0.001), but the intercept was marginally significant (p = 0.06). Upon extraction, the correlation coefficient decreased, but the intercept became significant and the slopes and intercepts of both linear regressions were not significantly different (SPE-DOC = 7 (4) + 40 (6) SPE-a254; R2 = 0.76; p < 0.01), indicating that the relation between DOC and a254 was maintained after extraction. The intercept of the DOC-a254 relationship represented 11.8 (8.7)% of the average DOC concentration, while after extraction it became 23.4 (13.8)% of the average SPE-DOC. Both values were not significantly different. Peak T and SPE-peak T also correlated with DOC and SPE-DOC, and neither did their slopes differ (DOC = 33 (7) + 7 (2) peak T; R2 = 0.62; p < 0.001; SPE-DOC = 13 (2) + 9 (1) SPE-peak T; R2 = 0.90; p < 0.001). Thus, the goodness of fit (R2) improved after extraction, although the residuals of both fits were not independent (Shapiro-Wilk: p < 0.002). The intercept of the DOC-peak T relationship represented 55.7 (13.0)% of the bulk DOC, while after extraction it became 43.5 (7.5)% of SPE-DOC, which were not significantly different. Peak T and SPE-peak T explained alone DON and SPE-DON variability, improving the R2 after extraction (DON = 2.8 (0.8) + 0.6 (0.2) peak T; R2 = 0.49; p < 0.005; SPE-DON = 0.4 (0.1) + 0.5 (0.0) SPE-peak T; R2 = 0.93; p < 0.001). The slopes did not differ significantly. The intercept of the DON-peak T relationship represented 54.9 (17.1)% of the average bulk DON, while the intercept of the SPE-DOM-SPE peak T relationship 28.5 (6.3)% of the average SPE-DON. The linear correlation of DOC, DON, SPE-DOC and SPE-DON with peak M and SPE-peak M, a325 and SPE-a325, a365 and SPE-a365, respectively, were not significant.
4 Discussion
4.1 Elemental and optical characterization of the natural samples
The present study includes selected stations and depths from the complete data set of 419 samples analyzed by Valiente et al. (2022), but sample preparation was not exactly the same in both studies. Valiente et al. (2022) estimated their DOC and DON concentrations from unfiltered samples, collected directly from the Niskin bottles into 25 mL amber glass vials, whereas we filtered >4 L of seawater through pre-combusted Whatman GF/F filters to remove particulate organic matter before SPE-DOM extraction. It would be expected that manipulation would lead to slightly higher concentrations in our samples, but they followed the same trend without significant differences except for LSW, which was slightly higher in our samples (p < 0.05). Consequently, the distributions of the bulk DOC and DON observed in this study generally agree with the description provided in Valiente et al. (2022): i) higher DOM concentrations in surface water bodies, particularly accentuated to the south of the CVF, and in the CBGF, affected by the offshore export of DOM from the Mauritanian upwelling; and ii) DOM concentrations decreased with depth generally following the apparent oxygen utilization (AOU) pattern.
a254 and DOC showed parallel distribution, confirming that this optical index is a good proxy for the variability of DOC in these ocean waters. a254 is not directly affected by the incident solar UV radiation as few photons with wavelengths shorter than 295 nm reach the Earth’s surface (Fichot and Benner, 2011). Therefore, molecules absorbing at 254 nm can accumulate at the surface as DOC. Our linear regression of DOC with a254 (DOC = 7 (5) + 44 (4) a254; R2 = 0.92; p < 0.001), presented an intercept and a slope similar to previous studies, such as Lønborg and Álvarez-Salgado (2014) (DOC = 10 (1) + 40 (1) a254; R2 = 0.80) in the North East Atlantic and Catalá et al. (2018) (DOC = 9 (1) + 46 (1) a254; R2 = 0.87) in the Mediterranean Sea. The slight differences in the coefficients of the linear equations among different studies could be related to specificities of each study area.
Molecular weight and photodegradation was evaluated in our samples using the a254/a365 ratio, as previous studies (De Haan and De Boer, 1987; Peuravuori and Pihlaja, 1997; Helms et al., 2008) have demonstrated that the ratio of the absorption coefficients at 250nm and 365nm was a proxy of the average molecular weight of CDOM. In the surface waters north and south of the CVF it was very high (about 21) as a consequence of the photochemical decomposition of the aromatic molecules that absorb light at wavelengths >300 nm (Fichot and Benner, 2011). Then, the ratio decreased with depth to 8-9, except for the LNEADW, which presented an average value close to 11.5. LNEADW is the oldest water body in the study area, with the lowest values of DOC and a254, consistent with the results found in previous studies such as that of Lønborg and Álvarez-Salgado (2014). The relatively high value of the ratio a254/a365, suggested that the CDOM fraction in LNEADW may be enriched in LMW compounds. Since previous studies have related even not so high values of the ratio to a major proportion of LMW compounds (Helms et al., 2008), which have been shown to be older and more refractory than HMW compounds (Guo et al., 1996; Walker et al., 2014).
The distribution of humic-like fluorescence intensity through the water column is generally explained by photodegradation of biological products at the surface and microbial degradation and/or condensation at depth (Nieto-Cid et al., 2006; Jørgensen et al., 2011; Catalá et al., 2015). However, in the particular case of the CVFZ, the CBGF and DCM_S, presented the highest humic-like fluorescence intensity, in parallel to DOC and DON concentrations and CDOM absorption coefficients. This indicates that the surface waters south of the CVF constitute an area with prominent DOM loads, likely due to the offshore transport of high concentrations of coastal DOM by of the Cape Blanc filament (Valiente et al., 2022).
The surface accumulation of protein-like compounds is explained by the fact that they are relatively resistant to photodegradation and, when produced at a high rate, tend to accumulate (Jørgensen et al., 2011). Moreover, in our study we have observed that the fluorescence intensity varies more in the epipelagic than in the bathypelagic layer. This was also observed in prior studies suggesting that these compounds are linked to surface primary production and have a labile or semi-refractory nature (Yamashita and Tanoue, 2003; Jørgensen et al., 2011; Helms et al., 2013). The high fluorescence intensity of protein-like compounds observed at the DCM, especially south of the CVF, is also consistent with previous works (Jørgensen et al., 2011; Timko et al., 2015; Catalá et al., 2016). The decrease of protein-like fluorescence compounds with depth is consistent with the microbial degradation of the fresh and labile portion of the DOM in the meso- and bathypelagic layers (Stedmon and Cory, 2014).
Regarding the link between peak T with DON and DOC, our results showed that there was a significant linear regression between protein fluorescence and DON variability. Similarly, a significant linear relationship was observed in Yamashita and Tanoue (2003) between total amino acids (portion of DON) and peak T fluorescence (R2 = 0.83, p < 0.001). In addition, the fluorescence of peak T was also linearly correlated with DOC, but in this case peak T alone was not able to explain the entire variability of DOC, as the residual errors of the regression were not independent.
4.2 PPL-DOM extraction efficiency and selectivity
The overall extraction yields of DOC and DON using PPL resins were in accordance with previous studies that used the same cartridges, such as Hertkorn et al. (2013) in Atlantic Ocean samples (C: 37-43% and N: 10-28%), Martínez-Pérez et al., (2017c) in the Mediterranean Sea (C: 37-53%) and Osterholz et al. (2021) in the South Pacific (C: 15-52% and N: 2-40%; yields were calculated from the data in the Supplementary Material, N extraction efficiency was calculated using the bulk total dissolved nitrogen as they do not calculated the DON). These recoveries were slightly lower than the values around 60% or above obtained by other authors (e.g., Green et al., 2014; Osterholz et al., 2014; Medeiros et al., 2015). A likely reason for this difference is that we passed about 2 mg C per gram of PPL sorbent (4-4.5 L of water), while these authors passed not more than 1 mg C per gram of sorbent, which seems to improve the recovery of DOM compounds. This assumption aligns with Kong et al. (2021), who shown that increasing DOC loads led to lower DOC, absorbance and fluorescence extraction efficiencies. Furthermore, differences between studies could be due to location and/or DOM quality and quantity.
The C:N molar ratio of SPE-DOM increased compared to the C:N ratio of the bulk DOM in the present study (from 12 to 22) as seen also in Osterholz et al. (2021) and in Hertkorn et al. (2013). Thus, our results show that the extraction procedure using the PPL sorbents fractionates the C and N contents of the DOM differently, potentially leading to an underestimation of a large number of N-rich compounds, including LMW labile compounds residing in the DON pool as well as HMW biomolecules as proteins (Sipler and Bronk, 2015). This SPE-DOM fractionation was consistent with (Dulaquais et al., 2023; Volikov et al., 2023).
DOC extraction yield in the surface layer varied between water bodies in relation to the bulk DOC concentration of the samples. Surface waters south of the CVF, where DOC concentrations were higher, showed lower C extraction yields, whilst in surface waters north of the CVF, higher yields were obtained. Below the surface layer, DOC extraction efficiency varied slightly around 50% between water types. It has previously been shown that the extraction yield on PPL sorbents was higher for LMW than for HMW DOM, e.g. Chen et al. (2016); Dulaquais et al. (2023); Volikov et al. (2023), since SPE leads to a preferential isolation of more refractory organic compounds (Raeke et al., 2016; Arellano et al., 2018), which mostly belong to the LMW DOM pool (Amon and Benner, 1994; Walker et al., 2014). These findings are consistent with our observations of lower extraction efficiency at higher bulk DOM concentrations in the surface waters south of CVF, considering that in the surface layers there is a higher proportion of HMW compounds (Chen et al., 2016). The different extraction efficiencies found here could be related to the origin, composition, total concentration and DOM quality of each water body. Despite the variations in the yields, SPE-DOM presented a parallel distribution to DOM, suggesting that the variability of SPE-DOM represented a large part of the bulk DOM variability.
SPE-CDOM also presented a parallel distribution to bulk CDOM measurements, suggesting that the PPL sorbent had an affinity for colored organic molecules. Our mean value of a254 recovery, 49 (8)%, was very similar to average DOC recovery 52 (8)%, and also analogous to previous studies such as Andrew et al. (2016) with C18 resin for a250 recovery. Furthermore, the slope and intercept of the lineal regression of SPE-DOC with SPE-a254 did not differ to those of the linear fit of bulk DOC-a254. Thus, this result indicated that the relation between DOC and a254 was maintained after extraction.
As CDOM wavelengths increased, a decrease in extraction recoveries was observed. This meant that the ratio a254/a365 was higher in the extracted than in the natural samples, implying that the extracts had lower proportion of HMW compounds (Helms et al., 2008; Chen et al., 2016; Raeke et al., 2016). This was also perceived using PPL by Wünsch et al. (2018) in Arctic fjords and Volikov et al. (2023) on a commercial fulvic acid (dissolved in ultrapure water). Contrary, when using C18 resins, it was found that extraction yields increased at longer wavelengths (Green and Blough, 1994; Boyle et al., 2009; Andrew et al., 2016). The different extraction yields using both resins suggests that each one exhibits different affinities toward certain DOM fractions. C18 seems to isolate more efficiently the aromatic compounds, associated with the HMW, while PPL isolate more refractory compounds, related to LMW compounds (Helms et al., 2008; Wünsch et al., 2018).
Likewise DOC, DON and CDOM yields, there was a decrease in SPE-FDOM intensity relative to the bulk FDOM, affecting differently the humic- and protein-like components of the extracted material. While humic-like materials were extracted with an efficiency of 87 (12)%, protein-like materials were extracted at 54 (20)%. In this regard, Martínez-Pérez et al. (2017a) showed that the humic-like fluorophores presented about 3-fold fluorescence intensity per unit of carbon in the LMW than the HMW fraction of DOM. This is consistent with the high recoveries of humic-like substances by PPL cartridges, that have more affinity for LMW molecules. Although protein-like substances also concentrate in the LMW fraction of DOM (Martínez-Pérez et al., 2017a), the much lower recovery efficiency is consistent with the lower affinity of PPL by N compounds. While SPE-peak M represented properly the variability of peak M, SPE-peak T showed a much higher dispersion of the recovery efficiency (C.V., 37%) and was not able to capture the variability of peak T. Thus, SPE-PPL was revealed to be selective for the humic-like fluorescent compounds in agreement with Chen et al. (2016) using PPLs. The differing extraction efficiencies among classes of fluorescent compounds was also in agreement with Green and Blough (1994) using C18 resins and Wünsch et al. (2018) using PPLs. However, our extraction efficiency of humic compounds was considerably higher than that of the previously mentioned studies. These differences may have been due to different factors, such as the type of samples, the extraction method used or the matrix where the DOM extracts were redissolved: milli-Q water (used in this study), oligotrophic seawater (Green and Blough, 1994), methanol (Chen et al., 2016) or ammonium acetate (Wünsch et al., 2018).
Samples located south of the CVF presented a lower protein-like yield in relation to the samples north of the CVF, which is consistent with the idea that the DOM north of the CVF was more degraded and therefore more suited to the selectivity of the resin, while it was fresher to the south of the CVF. This parallelism found between the recoveries of DOC and peak T could also be observed in the DOC vs peak T linear regressions before and after extraction. The slopes of the regressions, 7 (2) μM NFIU–1 for DOC-peak T and 9 (1) μM NFIU–1 for SPE-DOC-SPE-peak T, did not differ between them, which means that the relation of peak T with DOC was maintained after extraction. The origin intercepts of both fits, which represent the fraction of DOC that do not correlate with peak T, were 33 (7) and 13 (2) μM respectively, but when referred to the average bulk and SPE-DOC concentrations, they were not significantly different. Likewise, the slopes of the lineal fits of DON-peak T, 0.6 (0.2) μM NFIU–1, and SPE-DON-SPE-peak T, 0.5 (0.0) μM NFIU–1, did not differ from each other either as well as the origin intercepts when referred to the bulk and SPE-DON and peak T levels.
5 Conclusions
Elemental and optical analysis of natural samples showed that 1) surface waters south of CVF presented significantly higher DOM levels, due to a positive balance between in situ production, inputs through the Cape Blanc giant filament and removal by photodegradation and 2) at depth, WTs were far distant from their formation zones, thus being older and containing a higher concentration of refractory DOM. SPE-DOC and SPE-DON distributed similarly to the bulk DOC and DON, but with the caveat that 1) extraction led to reduce the variability relative to bulk DOM; 2) extraction was selective on nitrogen-poor compounds, increasing the C:N ratio, and 3) extraction yields of DOC in the surface layer were not constant, depending on the DOM quantity and quality of each water body.
Optical analysis of CDOM suggested that 1) CDOM extraction efficiency was constant in the water column, resulting in SPE-CDOM adequately representing the bulk CDOM distribution, but with a loss in their variability; 2) a254 proved to be a proxy for DOC after extraction, and 3) SPE-PPL led to a selective isolation of compounds from the LMW pool, as indicated by the a254/a365 ratio. Regarding the FDOM analysis, we observed that 1) SPE-peak M represented the variability of peak M, but missed some differences between water bodies within layers; 2) SPE-peak T was not able to represent peak T appropriately; 3) SPE-PPL selectively isolated humic- better than protein-like fluorophores; 4) FDOM recoveries from this study were dependent on water bodies in relation to DOM characteristics and 5) how peak T represented DOC and DON was maintained after extraction.
With the results obtained in this study, we want to highlight the importance of combining different analytical techniques for characterizing the bulk DOM as elemental and optical analysis. Future studies on the sorption and elution steps of SPE-PPL are needed to understand what happens during the extraction process. Furthermore, more selective techniques for the extraction of HMW compounds as well as N-rich compounds need to be developed in order to further characterize the DON.
Data availability statement
The raw data supporting the conclusions of this article will be made available by the authors, without undue reservation.
Author contributions
MN-C and XAA-S designed the study and collected the samples. MN-C and EJ-Ll extracted the samples, obtained the data and processed them IF-S analyzed the data. EJ-Ll wrote the manuscript. MN-C, XAA-S and TD review and corrected the manuscript. All authors contributed to the article and approved the submitted version.
Funding
This work was financed by the project FLUXES (grant number CTM2015-69392-C3-2-R), which was co-financed with FEDER funds. A pre-doctoral scholarship of the Xunta de Galicia (grant number IN606A-2019/026) and a contract associated to the project (e-IMPACT, PID2019-109084RB-C22) for: supported EJ-Ll. MN-C was supported by the project FERMIO (MINECO, CTM2014-57334-JIN) co-financed with FEDER funds.
Acknowledgments
Special thanks to M.J. Pazó and V. Vieitez for their help with the DOC, DON, nutrients and optical analysis. The authors are grateful to the captain, crew, technicians and scientists aboard the R/V Sarmiento de Gamboa during the FLUXES-I cruise for their support during the cruise.
Conflict of interest
The authors declare that the research was conducted in the absence of any commercial or financial relationships that could be construed as a potential conflict of interest.
Publisher’s note
All claims expressed in this article are solely those of the authors and do not necessarily represent those of their affiliated organizations, or those of the publisher, the editors and the reviewers. Any product that may be evaluated in this article, or claim that may be made by its manufacturer, is not guaranteed or endorsed by the publisher.
Supplementary material
The Supplementary Material for this article can be found online at: https://www.frontiersin.org/articles/10.3389/fmars.2023.1159762/full#supplementary-material
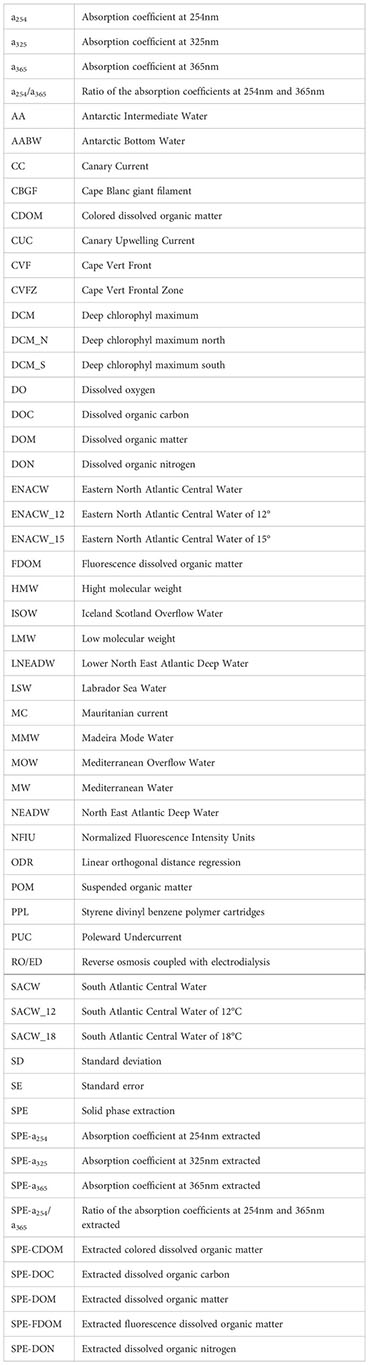
Glossary
References
Álvarez M., Álvarez-Salgado X. (2009). Chemical tracer transport in the eastern boundary current system of the north Atlantic. Cienc. Mar. 35, 123–139. doi: 10.7773/cm.v35i2.1438
Álvarez M., Brea S., Mercier H., Álvarez-Salgado X. A. (2014). Mineralization of biogenic materials in the water masses of the south Atlantic ocean. I: Assessment and results of an optimum multiparameter analysis. Prog. Oceanogr. 123, 1–23. doi: 10.1016/j.pocean.2013.12.007
Álvarez-Salgado X. A., Arístegui J. (2015). Organic matter dynamics in the canary current. In: Vald L., Déniz-González I. Eds. Oceanographic and biological features in the canary large marine ecosystem. (Paris: IOC-UNESCO) 115, 151–159. (IOC Tech. Ser. No. 115).
Álvarez-Salgado X. A., Nieto-Cid M., Rossel P. E. (2022). Dissolved Organic Matter. In Marine Analytical Chemistry. (Cham: Springer International Publishing), 39–102. doi: 10.1007/978-3-031-14486-8_2
Amaral V., Romera-Castillo C., García-Delgado M., Gómez-Parra A., Forja J. (2020). Distribution of dissolved organic matter in estuaries of the southern Iberian Atlantic basin: Sources, behavior and export to the coastal zone. Mar. Chem. 226, 103857. doi: 10.1016/J.MARCHEM.2020.103857
Amon R. M. W., Benner R. (1994). Rapid cycling of high-molecular-weight dissolved organic matter in the ocean. Nature 369 (6481), 549–552. doi: 10.1038/369549a0
Andrew A. A., Del Vecchio R., Zhang Y., Subramaniam A., Blough N. V. (2016). Are extracted materials truly representative of original samples? Impact of C18 extraction on CDOM optical and chemical properties. Front. Chem. 4, 4. doi: 10.3389/fchem.2016.00004
Arellano A. R., Bianchi T. S., Hutchings J. A., Shields M. R., Cui X. (2018). Differential effects of solid-phase extraction resins on the measurement of dissolved lignin-phenols and organic matter composition in natural waters. Limnol. Oceanogr. Methods 16 (1), 22–34. doi: 10.1002/lom3.10224
Boyle E. S., Guerriero N., Thiallet A., Del Vecchio R., Blough N. V. (2009). Optical properties of humic substances and CDOM: Relation to structure. Environ. Sci. Technol. 43 (7), 2262–2268. doi: 10.1021/es803264g
Braslavsky S. E. (2007). Glossary of terms used in photochemistry 3rd edition: (IUPAC recommendations 2006). Pure Appl. Chem. 79, 293–465. doi: 10.1351/pac200779030293
Broecker W. S. (1974). “NO”, a conservative water-mass tracer. Earth Planet. Sci. Lett. 23 (1), 100–107. doi: 10.1016/0012-821X(74)90036-3
Burgoa N., Machín F., Angeles M. D., Angel R. S., Martínez-Marrero A., Arístegui J., et al. (2020). Mass, nutrients and dissolved organic carbon (DOC) lateral transports off northwest Africa during fall 2002 and spring 2003. Ocean Sci. 16 (2), 483–511. doi: 10.5194/os-16-483-2020
Campanero R., Burgoa N., Fernández-Castro B., Valiente S., Nieto-Cid M., Martínez-Pérez A. M., et al. (2022). High-resolution variability of dissolved and suspended organic matter in the cape Verde frontal zone. Front. Mar. Sci. 9, 1006432. doi: 10.3389/fmars.2022.1006432
Carlson C. A., Hansell D. A. (2015). “DOM sources, sinks, reactivity, and budgets”, in Biogeochemistry of marine dissolved organic matter, 2nd ed.; Hansell D. A., Carlson C. A. (Eds). (Boston: Academic Press) 3, 65–126. doi: 10.1016/B978-0-12-405940-5.00003-0
Catalá T. S., Álvarez-Salgado X. A., Otero J., Iuculano F., Companys B., Horstkotte B., et al. (2016). Drivers of fluorescent dissolved organic matter in the global epipelagic ocean. Limnol. Oceanogr. 61 (3), 1101–1119. doi: 10.1002/lno.10281
Catalá T. S., Martínez-Pérez A. M., Nieto-Cid M., Álvarez M., Otero J., Emelianov M., et al. (2018). Dissolved organic matter (DOM) in the open Mediterranean Sea. I. Basin–wide distribution and drivers of chromophoric DOM. Prog. Oceanogr. 165, 35–51. doi: 10.1016/j.pocean.2018.05.002
Catalá T. S., Reche I., Álvarez M., Khatiwala S., Guallart E. F., Benítez-Barrios V. M., et al. (2015). Water mass age and aging driving chromophoric dissolved organic matter in the dark global ocean. Global Biogeochem. Cycles 29. doi: 10.1002/2014GB005048
Chen M., Kim S., Park J. E., Jung H. J., Hur J. (2016). Structural and compositional changes of dissolved organic matter upon solid-phase extraction tracked by multiple analytical tools. Anal. Bioanal. Chem. 408, 6249–6258. doi: 10.1007/s00216-016-9728-0
Coble P. G. (1996). Characterization of marine and terrestrial DOM in seawater using excitation-emission matrix spectroscopy. Mar. Chem. 51 (4), 325–346. doi: 10.1016/0304-4203(95)00062-3
Coble P. G. (2007). Marine optical biogeochemistry: The chemistry of ocean color. Chem. Rev. 107 (2), 402–418. doi: 10.1021/cr050350+
de Boisséson E., Thierry V., Mercier H., Caniaux G., Desbruyères D. (2012). Origin, formation and variability of the subpolar mode water located over the reykjanes ridge. J. Geophys. Res. Ocean. 117, n/a–n/a. doi: 10.1029/2011jc007519
De Haan H., De Boer T. (1987). Applicability of light absorbance and fluorescence as measures of concentration and molecular size of dissolved organic carbon in humic lake tjeukemeer. Water Res. 21 (6), 731–734. doi: 10.1016/0043-1354(87)90086-8
Dickson R. R., Brown J. (1994). The production of north Atlantic deep water: sources, rates, and pathways. J. Geophys. Res. 99 (C6), 12319–12341. doi: 10.1029/94jc00530
Dittmar T. (2015). “Reasons behind the long-term stability of dissolved organic matter,” in Biogeochemistry of marine dissolved organic matter, 2nd ed.; Hansell D. A., Carlson C. A. (Eds). (Boston: Academic Press) 7, 369–388. doi: 10.1016/B978-0-12-405940-5.00007-8
Dittmar T., Koch B., Hertkorn N., Kattner G. (2008). A simple and efficient method for the solid-phase extraction of dissolved organic matter (SPE-DOM) from seawater. Limnol. Oceanogr. Methods 6, 230–235. doi: 10.4319/lom.2008.6.230
Dulaquais G., Fourrier P., Maguer J. F., Denis C., Waeles M., Riso R. (2023). Size exclusion chromatography and stable carbon isotopes reveal the limitations of solid phase extraction with PPL to capture autochthonous DOM production. Mar. Chem. 249, 104213. doi: 10.1016/j.marchem.2023.104213
Ferreira M. L., de C., Kerr R. (2017). Source water distribution and quantification of north Atlantic deep water and Antarctic bottom water in the Atlantic ocean. Prog. Oceanogr. 153, 66–83. doi: 10.1016/j.pocean.2017.04.003
Fichot C. G., Benner R. (2011). A novel method to estimate DOC concentrations from CDOM absorption coefficients in coastal waters. Geophys. Res. Lett. 38 (3). doi: 10.1029/2010GL046152
Fischer G., Reuter C., Karakas G., Nowald N., Wefer G. (2009). Offshore advection of particles within the cape blanc filament, Mauritania: Results from observational and modelling studies. Prog. Oceanogr. 83 (1-4), 322–330. doi: 10.1016/j.pocean.2009.07.023
Fontanals N., Marcé R. M., Borrull F. (2005). New hydrophilic materials for solid-phase extraction. TrAC - Trends Anal. Chem. 24, 394–406. doi: 10.1016/j.trac.2005.01.012
Gabric A. J., Garcia L., Van Camp L., Nykjaer L., Eifler W., Schrimpf W. (1993). Offshore export of shelf production in the cape blanc (Mauritania) giant filament as derived from coastal zone color scanner imagery. J. Geophys. Res. 98, 4697–4712. doi: 10.1029/92jc01714
Grasshoff K., Kremlingl Manfred Ehrhardt K., Anderson L. G., Behrends B., van den Berg C., Brugmann L., et al. (1999). Determination of nutrients. In: Brügmann L., Kremling K. (Eds.). Methods of Seawater Analysis. WILEY–VCH Verlag GmbH, 159–228.
Green S. A., Blough N. V. (1994). Optical absorption and fluorescence properties of chromophoric dissolved organic matter in natural waters. Limnol. Oceanogr. 39, 1903–1916. doi: 10.4319/lo.1994.39.8.1903
Green N. W., Perdue E. M., Aiken G. R., Butler K. D., Chen H., Dittmar T., et al. (2014). An intercomparison of three methods for the large-scale isolation of oceanic dissolved organic matter. Mar. Chem. 161, 14–19. doi: 10.1016/J.MARCHEM.2014.01.012
Guo L., Santschi P. H., Cifuentes L. A., Trumbore S. E., Southon J. (1996). Cycling of high-molecular-weight dissolved organic matter in the middle Atlantic bight as revealed by carbon isotopic (13C and 14C) signatures. Limnol. Oceanogr. 41 (6), 1242–1252. doi: 10.4319/lo.1996.41.6.1242
Guo L., Wen L. S., Tang D., Santschi P. H. (2000). Re-examination of cross-flow ultrafiltration for sampling aquatic colloids: Evidence from molecular probes. Mar. Chem. 69, 75–90. doi: 10.1016/S0304-4203(99)00097-3
Hansell D. A., Carlson C. A., Repeta D. J., Schlitzer R. (2009a). Dissolved organic matter in the ocean a controversy stim ulates new insights. Oceanography 22, 202–211. doi: 10.5670/oceanog.2009.109
Hansell D. A., Carlson C. A., Repeta D. J., Schlitzer R., Bauer J. E., Haddad R. I., et al. (2009b). Advanced instrumental approaches for characterization of marine dissolved organic matter: Extraction techniques, mass spectrometry, and nuclear magnetic resonance spectroscopy. Mar. Chem. 177, 3758–3769. doi: 10.1039/c4em00062e
Helms J. R., Mao J., Chen H., Perdue E. M., Green N. W., Hatcher P. G., et al. (2015). Spectroscopic characterization of oceanic dissolved organic matter isolated by reverse osmosis coupled with electrodialysis. Mar. Chem. 177, 278–287. doi: 10.1016/j.marchem.2015.07.007
Helms J. R., Stubbins A., Perdue E. M., Green N. W., Chen H., Mopper K. (2013). Photochemical bleaching of oceanic dissolved organic matter and its effect on absorption spectral slope and fluorescence. Mar. Chem. 155, 81–91. doi: 10.1016/j.marchem.2013.05.015
Helms J. R., Stubbins A., Ritchie J. D., Minor E. C., Kieber D. J., Mopper K. (2008). Absorption spectral slopes and slope ratios as indicators of molecular weight, source, and photobleaching of chromophoric dissolved organic matter. Limnol. Oceanogr. 53 (3), 955–969. doi: 10.4319/lo.2008.53.3.0955
Hertkorn N., Harir M., Koch B. P., Michalke B., Schmitt-Kopplin P. (2013). High-field NMR spectroscopy and FTICR mass spectrometry: Powerful discovery tools for the molecular level characterization of marine dissolved organic matter. Biogeosciences 10, 1583–1624. doi: 10.5194/bg-10-1583-2013
Jørgensen L., Stedmon C. A., Kragh T., Markager S., Middelboe M., Søndergaard M. (2011). Global trends in the fluorescence characteristics and distribution of marine dissolved organic matter. Mar. Chem. 126, 139–148. doi: 10.1016/j.marchem.2011.05.002
Johnson G. C. (2008). Quantifying Antarctic bottom water and north Atlantic deep water volumes. J. Geophys. Res. Ocean. 113, 1–13. doi: 10.1029/2007JC004477
Joos F., Roth R., Fuglestvedt J. S., Peters G. P., Enting I. G., Von Bloh W., et al. (2013). Carbon dioxide and climate impulse response functions for the computation of greenhouse gas metrics: A multi-model analysis. Atmos. Chem. Phys. 13, 2793–2825. doi: 10.5194/acp-13-2793-2013
Kérouel R., Aminot A. (1997). Fluorometric determination of ammonia in sea and estuarine waters by direct segmented flow analysis. Mar. Chem. 57 (3-4), 265–275. doi: 10.1016/S0304-4203(97)00040-6
Kong X., Jendrossek T., Ludwichowski K. U., Marx U., Koch B. P. (2021). Solid-phase extraction of aquatic organic matter: Loading-dependent chemical fractionation and self-assembly. Environ. Sci. Technol. 55 (22), 15495–15504. doi: 10.1021/acs.est.1c04535
Koprivnjak J. F., Pfromm P. H., Ingall E., Vetter T. A., Schmitt-Kopplin P., Hertkorn N., et al. (2009). Chemical and spectroscopic characterization of marine dissolved organic matter isolated using coupled reverse osmosis-electrodialysis. Geochim. Cosmochim. Acta 73, 4215–4231. doi: 10.1016/j.gca.2009.04.010
Kothawala D. N., Murphy K. R., Stedmon C. A., Weyhenmeyer G. A., Tranvik L. J. (2013). Inner filter correction of dissolved organic matter fluorescence. Limnol. Oceanogr. Methods 11 (12), 616–630. doi: 10.4319/lom.2013.11.616
Lønborg C., Álvarez-Salgado X. A. (2014). Tracing dissolved organic matter cycling in the eastern boundary of the temperate north Atlantic using absorption and fluorescence spectroscopy. Deep. Res. Part I Oceanogr. Res. Pap. 85, 35–46. doi: 10.1016/j.dsr.2013.11.002
Lara R. J., Thomas D. N. (1994). XAD-fractionation of “new” dissolved organic matter: is the hydrophobic fraction seriously underestimated? Mar. Chem. 47 (1), 93–96. doi: 10.1016/0304-4203(94)90016-7
Locarnini R. A., Mishonov A. V., Antonov J. I., Boyer T. P., Garcia H. E., Baranova M. M., et al. (2013). World ocean atlas. NOAA Atlas 73, 40. doi: 10.7289/V55X26VD
Martínez-Pérez A. M., Álvarez-Salgado X. A., Arístegui J., Nieto-Cid M. (2017a). Deep-ocean dissolved organic matter reactivity along the Mediterranean Sea: Does size matter. Sci. Rep. 7 (1), 5687. doi: 10.1038/s41598-017-05941-6
Martínez-Pérez A. M., Osterholz H., Nieto-Cid M., Álvarez M., Dittmar T., Álvarez-Salgado X. A. (2017c). Molecular composition of dissolved organic matter in the Mediterranean Sea. Limnology Oceanograp 62 (6), 2699–2712. doi: 10.1002/lno.10600
Martínez-Pérez A. M., Nieto-Cid M., Osterholz H., Catalá T. S., Reche I., Dittmar T., et al. (2017b). Linking optical and molecular signatures of dissolved organic matter in the Mediterranean Sea. Sci. Rep. 7 (1), 3436. doi: 10.1038/s41598-017-03735-4
Masqué N., Marcé R. M., Borrull F. (1998). New polymeric and other types of sorbents for solid-phase extraction of polar organic micropollutants from environmental water. TrAC - Trends Anal. Chem. 17 (6), 384–394. doi: 10.1016/S0165-9936(98)00019-3
Medeiros P. M., Seidel M., Powers L. C., Dittmar T., Hansell D. A., Miller W. L. (2015). Dissolved organic matter composition and photochemical transformations in the northern north pacific ocean. Geophys. Res. Lett. 42, 863–870. doi: 10.1002/2014GL062663
Meunier T., Barton E. D., Barreiro B., Torres R. (2012). Upwelling filaments off cap blanc: Interaction of the NW african upwelling current and the cape verde frontal zone eddy field? J. Geophys. Res. Ocean. 117 (C8). doi: 10.1029/2012JC007905
Mopper K., Stubbins A., Ritchie J. D., Bialk H. M., Hatcher P. G. (2007). Advanced instrumental approaches for characterization of marine dissolved organic matter: Extraction techniques, mass spectrometry, and nuclear magnetic resonance spectroscopy. Chem. Rev. 107, 419–442. doi: 10.1021/cr050359b
Nelson N. B., Siegel D. A. (2013). The global distribution and dynamics of chromophoric dissolved organic matter. Ann. Rev. Mar. Sci. 5, 447–476. doi: 10.1146/annurev-marine-120710-100751
Nieto-Cid M., Álvarez-Salgado X. A., Gago J., Pérez F. F. (2005). DOM fluorescence, a tracer for biogeochemical processes in a coastal upwelling system (NW Iberian peninsula). Mar. Ecol. Prog. Ser. 297, 33–50. doi: 10.3354/meps297033
Nieto-Cid M., Álvarez-Salgado X. A., Pérez F. F. (2006). Microbial and photochemical reactivity of fluorescent dissolved organic matter in a coastal upwelling system. Limnol. Oceanogr. 51 (3), 1391–1400. doi: 10.4319/lo.2006.51.3.1391
Ohde T., Fiedler B., Körtzinger A. (2015). Spatio-temporal distribution and transport of particulate matter in the eastern tropical north Atlantic observed by argo floats. Deep. Res. Part I Oceanogr. Res. Pap. 102, 26–42. doi: 10.1016/j.dsr.2015.04.007
Osterholz H., Dittmar T., Niggemann J. (2014). Molecular evidence for rapid dissolved organic matter turnover in Arctic fjords. Mar. Chem. 160, 1–10. doi: 10.1016/J.MARCHEM.2014.01.002
Osterholz H., Kilgour D. P. A., Storey D. S., Lavik G., Ferdelman T. G., Niggemann J., et al. (2021). Accumulation of DOC in the south pacific subtropical gyre from a molecular perspective. Mar. Chem. 231, 103955. doi: 10.1016/j.marchem.2021.103955
Pastor M. V., Pelegrí J. L., Hernández-Guerra A., Font J., Salat J., Emelianov M. (2008). Water and nutrient fluxes off Northwest Africa. Cont. Shelf Res. 28, 915–936. doi: 10.1016/J.CSR.2008.01.011
Pastor M., Vélez-Belchí P., Hernández-Guerra A. (2015). Water masses in the canary current Large marine ecosystem. In: Vald L., Déniz-González I. Eds. Oceanographic and biological features in the canary large marine ecosystem. (Paris: IOC-UNESCO) 115, 73–79. (IOC Tech. Ser. No. 115).
Pelegrí J. L., Benazzouz A. (2015). Coastal Upwelling off North-West Africa. In Valdés L., Déniz-González I. (Eds.), Oceanographic and biological features in the Canary Current Large Marine Ecosystem. . (Paris: IOC-UNESCO), 93–103. (IOC Tech. Ser. No. 115).
Pérez-Rodríguez P., Pelegrí J. L., Marrero-Díaz A. (2001). Dynamical characteristics of the cape Verde frontal zone. Sci. Mar. 65, 241–250. doi: 10.3989/scimar.2001.65s1241
Peuravuori J., Pihlaja K. (1997). Molecular size distribution and spectroscopic properties of aquatic humic substances. Anal. Chim. Acta 337 (2), 133–149. doi: 10.1016/S0003-2670(96)00412-6
R Core Team (2022). R: A language and environment for statistical computing. (Vienna, Austria: R Foundation for Statistical Computing). Available at: https://www.R-project.org/.
Raeke J., Lechtenfeld O. J., Wagner M., Herzsprung P., Reemtsma T. (2016). Selectivity of solid phase extraction of freshwater dissolved organic matter and its effect on ultrahigh resolution mass spectra. Environ. Sci. Process. Impacts 18, 918–927. doi: 10.1039/c6em00200e
Repeta D. J. (2015). “Chemical Characterization and Cycling of Dissolved Organic Matter”, in: Biogeochemistry of marine dissolved organic matter, 2nd ed.; Hansell D. A., Carlson C. A. (Eds.). (Boston: Academic Press) 2, 21–63. doi: 10.1016/B978-0-12-405940-5.00002-9
Sánchez-Leal R. F., Bellanco M. J., Fernández-Salas L. M., García-Lafuente J., Gasser-Rubinat M., González-Pola C., et al. (2017). The Mediterranean overflow in the gulf of cadiz: A rugged journey. Sci. Adv. 3 (11), eaao0609. doi: 10.1126/sciadv.aao0609
Simjouw J. P., Minor E. C., Mopper K. (2005). Isolation and characterization of estuarine dissolved organic matter: Comparison of ultrafiltration and C18 solid-phase extraction techniques. Mar. Chem. 96, 219–235. doi: 10.1016/j.marchem.2005.01.003
Sipler R. E., Bronk D. A. (2015). “Dynamics of dissolved organic nitrogen”, in Biogeochemistry of marine dissolved organic matter, 2nd ed.; Hansell D. A., Carlson C. A. (Eds), (Boston: Academic Press) Chapter 4, 127–232. doi: 10.1016/B978-0-12-405940-5.00004-2
Stedmon C. A., Cory R. M. (2014). “Biological origins and fate of fluorescent dissolved organic matter in aquatic environments,” in Coble P., Lead J., Baker A., Reynolds D., Spencer R. (Eds.), Aquatic Organic Matter Fluorescence (Cambridge Environmental Chemistry Series, 278-300). (Cambridge: Cambridge University Press). doi: 10.1017/cbo9781139045452.013
Stedmon C. A., Nelson N. B. (2015). “The optical properties of DOM in the ocean,” in Biogeochemistry of marine dissolved organic matter, 2nd ed.; Hansell D. A., Carlson C. A. (Eds). (Boston: Academic Press) 10, 481–508. doi: 10.1016/B978-0-12-405940-5.00010-8
Suga T., Talley L. D. (1995). Antarctic Intermediate water circulation in the tropical and subtropical south Atlantic. J. Geophys. Res. 100 (C7), 13441–13453. doi: 10.1029/95jc00858
Swift J. H. (1984). The circulation of the Denmark strait and Iceland-Scotland overflow waters in the north Atlantic. Deep Sea Res. Part A Oceanogr. Res. Pap. 31, 1339–1355. doi: 10.1016/0198-0149(84)90005-0
Talley L. D., McCartney M. S. (1982). Distribution and circulation of Labrador Sea water. J. Phys. Oceanogr. 12 (11), 1189–1205. doi: 10.1175/1520-0485(1982)012<1189:dacols>2.0.co;2
Timko S. A., Maydanov A., Pittelli S. L., Conte M. H., Cooper W. J., Koch B. P., et al. (2015). Depth-dependent photodegradation of marine dissolved organic matter. Front. Mar. Sci. 2, 66. doi: 10.3389/fmars.2015.00066
Tomczak M. (1999). Some historical, theoretical and applied aspects of quantitative water mass analysis. J. Mar. Res. 57 (2), 275–303. doi: 10.1357/002224099321618227
Valiente S., Fernández-Castro B., Campanero R., Marrero-Díaz A., Rodríguez-Santana A., Nieto-Cid M., et al. (2022). Dissolved and suspended organic matter dynamics in the cape Verde frontal zone (NW Africa). Prog. Oceanogr. 201, 102727. doi: 10.1016/j.pocean.2021.102727
Van Camp L., Nykjaer L., Mittelstaedt E., Schlittenhardt P. (1991). Upwelling and boundary circulation off Northwest Africa as depicted by infrared and visible satellite observations. Prog. Oceanogr. 26, 357–402. doi: 10.1016/0079-6611(91)90012-B
Volikov A. B., Sobolev N. A., Khreptugova A. N., Perminova I. V. (2023). Static and dynamic sorption of DOM on bond elute PPL and bondesil PPL sorbents: physical-chemical characteristics. Sep. Sci. Technol. 58, 642–653. doi: 10.1080/01496395.2022.2145224
Walker B. D., Guilderson T. P., Okimura K. M., Peacock M. B., McCarthy M. D. (2014). Radiocarbon signatures and size-age-composition relationships of major organic matter pools within a unique California upwelling system. Geochim. Cosmochim. Acta 126, 1–17. doi: 10.1016/j.gca.2013.10.039
Wünsch U. J., Geuer J. K., Lechtenfeld O. J., Koch B. P., Murphy K. R., Stedmon C. A. (2018). Quantifying the impact of solid-phase extraction on chromophoric dissolved organic matter composition. Mar. Chem. 207, 33–41. doi: 10.1016/j.marchem.2018.08.010
Yamashita Y., Tanoue E. (2003). Chemical characterization of protein-like fluorophores in DOM in relation to aromatic amino acids. Mar. Chem. 82, 255–271. doi: 10.1016/S0304-4203(03)00073-2
Zenk W., Klein B., Schroder M. (1991). Cape Verde frontal zone. Deep Sea Res. Part A. Oceanogr. Res. Pap. 38, S505–S530. doi: 10.1016/s0198-0149(12)80022-7
Keywords: dissolved organic carbon (DOC), dissolved organic nitrogen (DON), colored dissolved organic matter (CDOM), fluorescent dissolved organic matter (FDOM), solid phase extraction, PPL, extraction recovery, cape vert frontal zone
Citation: Jerusalén-Lleó E, Nieto-Cid M, Fuentes-Santos I, Dittmar T and Álvarez-Salgado XA (2023) Solid phase extraction of ocean dissolved organic matter with PPL cartridges: efficiency and selectivity. Front. Mar. Sci. 10:1159762. doi: 10.3389/fmars.2023.1159762
Received: 06 February 2023; Accepted: 28 March 2023;
Published: 17 April 2023.
Edited by:
Christina Zeri, Hellenic Centre for Marine Research (HCMR), GreeceReviewed by:
Urban J. Wünsch, Technical University of Denmark, DenmarkFrancois L. L. Muller, National Sun Yat-sen University, Taiwan
Copyright © 2023 Jerusalén-Lleó, Nieto-Cid, Fuentes-Santos, Dittmar and Álvarez-Salgado. This is an open-access article distributed under the terms of the Creative Commons Attribution License (CC BY). The use, distribution or reproduction in other forums is permitted, provided the original author(s) and the copyright owner(s) are credited and that the original publication in this journal is cited, in accordance with accepted academic practice. No use, distribution or reproduction is permitted which does not comply with these terms.
*Correspondence: E. Jerusalén-Lleó, ZWplcnVzYWxlbkBpaW0uY3NpYy5lcw==