 Yong Hwa Oh
 Jeonghyun Kim
 Guebuem Kim
 Tae-Hoon Kim
- 1Department of Convergence Study on the Ocean Science and Technology, Korea Maritime and Ocean University, Busan, Republic of Korea
- 2Department of Earth and Marine Sciences, College of Ocean Sciences, Jeju National University, Jeju, Republic of Korea
- 3School of Earth and Environmental Sciences/Research Institute of Oceanography, Seoul National University, Seoul, Republic of Korea
- 4Department of Oceanography, Faculty of Earth Systems and Environmental Sciences, Chonnam National University, Gwangju, Republic of Korea
The concentrations of 222Rn and dissolved inorganic nutrients in river water at a fixed station of the Nakdong River estuary which has an artificial barrage were continuously measured from October 2014 to May 2015. Monthly benthic 222Rn flux from the river bottom was estimated using a simple mass balance model, taking into account 222Rn sources and sinks. The estimated benthic 222Rn flux shows a significant correlation with groundwater level, suggesting that groundwater level can be used as a representative of the groundwater input. Based on correlation analyses, the concentration of dissolved inorganic nitrogen (DIN) was found to be dependent primarily on river water input. In contrast, the concentrations of dissolved inorganic phosphorus (DIP) and dissolved inorganic silicate (DSi) were predominantly controlled by groundwater input. Our results suggest that groundwater input may be an important source of DIP, especially under P-limited condition, which can affect marine primary production and ecological problems such as eutrophication and algal blooms in the coastal zones.
1 Introduction
Estuaries are important pathways for transporting terrestrial materials (e.g. nutrients, trace metals, and carbon) to the oceans (Meybeck, 1982; Brunskill et al., 2003; Smith et al., 2003; Swarzenski et al., 2004; Colbert and McManus, 2005; Paerl, 2006). In estuaries, the physical properties and chemical composition of river water are significantly altered. This is due to the mixing of freshwater and seawater, which causes various biogeochemical processes, including adsorption/desorption, precipitation/dissolution, sedimentation, and complexation (Turekian, 1977; Bryan and Langston, 1992; Charette et al., 2005). In addition, estuarine zones are characterized by high biodiversity and primary productivity due to a range of different habitats and heavy nutrient loadings (Day et al., 1989; Lirman et al., 2008). Over the past decades, the amount of river-derived dissolved inorganic nitrogen (DIN) and dissolved inorganic phosphorus (DIP) transported into the oceans has increased considerably. For example, between the 1970s and the 1990s, river-derived DIN and DIP fluxes to the oceans had increased three folds, due to a rapid increase in the use of artificial fertilizers (Smith et al., 2003). This increases in anthropogenic nutrient flux has caused serious environmental problems in estuarine environments, including eutrophication, subsurface acidification, and deoxygenation (Moncheva et al., 2001; Ruhl and Rybicki, 2010; Cai et al., 2011; Sunda and Cai, 2012).
During the last century, dams and barrages have been constructed across many estuaries throughout the world to preserve reservoir capacity and prevent seawater intrusion into swamps, wetlands, and coastal aquifers. These constructions have significantly altered the biogeochemical, hydrological, ecological, and oceanographic conditions of estuarine environments (Talley, 2000; Kim et al., 2005; Jang and Kim, 2006). For example, declines in river water and sediment discharges were observed following the construction of a large dam across the Yangtze River, China (Yang et al., 2015). In addition, reservoirs upstream of river and hydroelectric dams have been recognized as significant sources of greenhouse gases (CO2 and CH4) because these gases can be produced by the decomposition of organic matter in reservoirs’ water (St. Louis et al., 2000). Dam and barrage construction also affects the changes in nutrient fluxes (Duan et al., 2007).
Fluvial runoff is considered, in general, to be the most important transport pathway for nutrients into coastal waters. However, groundwater has also been recognized recently as an important source of nutrients in coastal zones (Burnett et al., 2003; Slomp and Van Cappellen, 2004; Moore, 2006). On the other hand, nutrients derived from submarine groundwater discharge (SGD) play a significant role in primary production (Lapointe, 1997; Hwang et al., 2005a; Lee and Kim, 2007; Kim et al., 2011) and benthic production (Hwang et al., 2005b; Waska and Kim, 2010) in coastal areas because nutrient concentrations in groundwater are often higher than those in coastal waters (Slomp and Van Cappellen, 2004; Moore et al., 2006; Kim et al., 2008).
Radon (222Rn; half-life 3.8 days) has been used as a natural radioactive tracer to estimate groundwater inflow rate or water flow through SGD because it is often higher in groundwater than surface water (e.g., lake water, seawater, river water). In previous research, groundwater discharge was estimated based on a 222Rn mass balance model, which considers sources and sinks of 222Rn in aquatic systems such as rivers, lagoons, and coastal zones (Peterson et al., 2010; Cartwright and Gilfedder, 2015; Sadat-Noori et al., 2015).
The aim of this study is to examine the role of river versus groundwater input in the fluxes of nutrients into the Nakdong River estuary, downstream of a barrage. In order to achieve this goal under a dynamic estuarine condition, 222Rn (a tracer of groundwater input) and the concentrations of nutrients were continuously measured at a fixed station in the estuary.
2 Materials and methods
2.1 Study area
The Nakdong River is the longest (535 km) and the second largest catchment area (total area 24,000 km2) in Korea (Figure 1). Mean annual precipitation is 1,150 mm over the last 30 years with heavy rain in summer (Jeong et al., 2007). Mean annual temperature is 12–16°C in this region. The river estuary is micro-tidal, with semi-monthly and semi-diurnal tidal variations ranging from 0.5 m at neap tide and ~2 m at spring tide. The deltaic environment of this river estuary changed to barrier islands after the construction of the Nakdong River barrage, and the bedrock consists of granite, andesite, and rhyolite. The sediments of the estuary are composed of clay, sand, and gravel to a depth of 60–90 m (Chung et al., 2016).
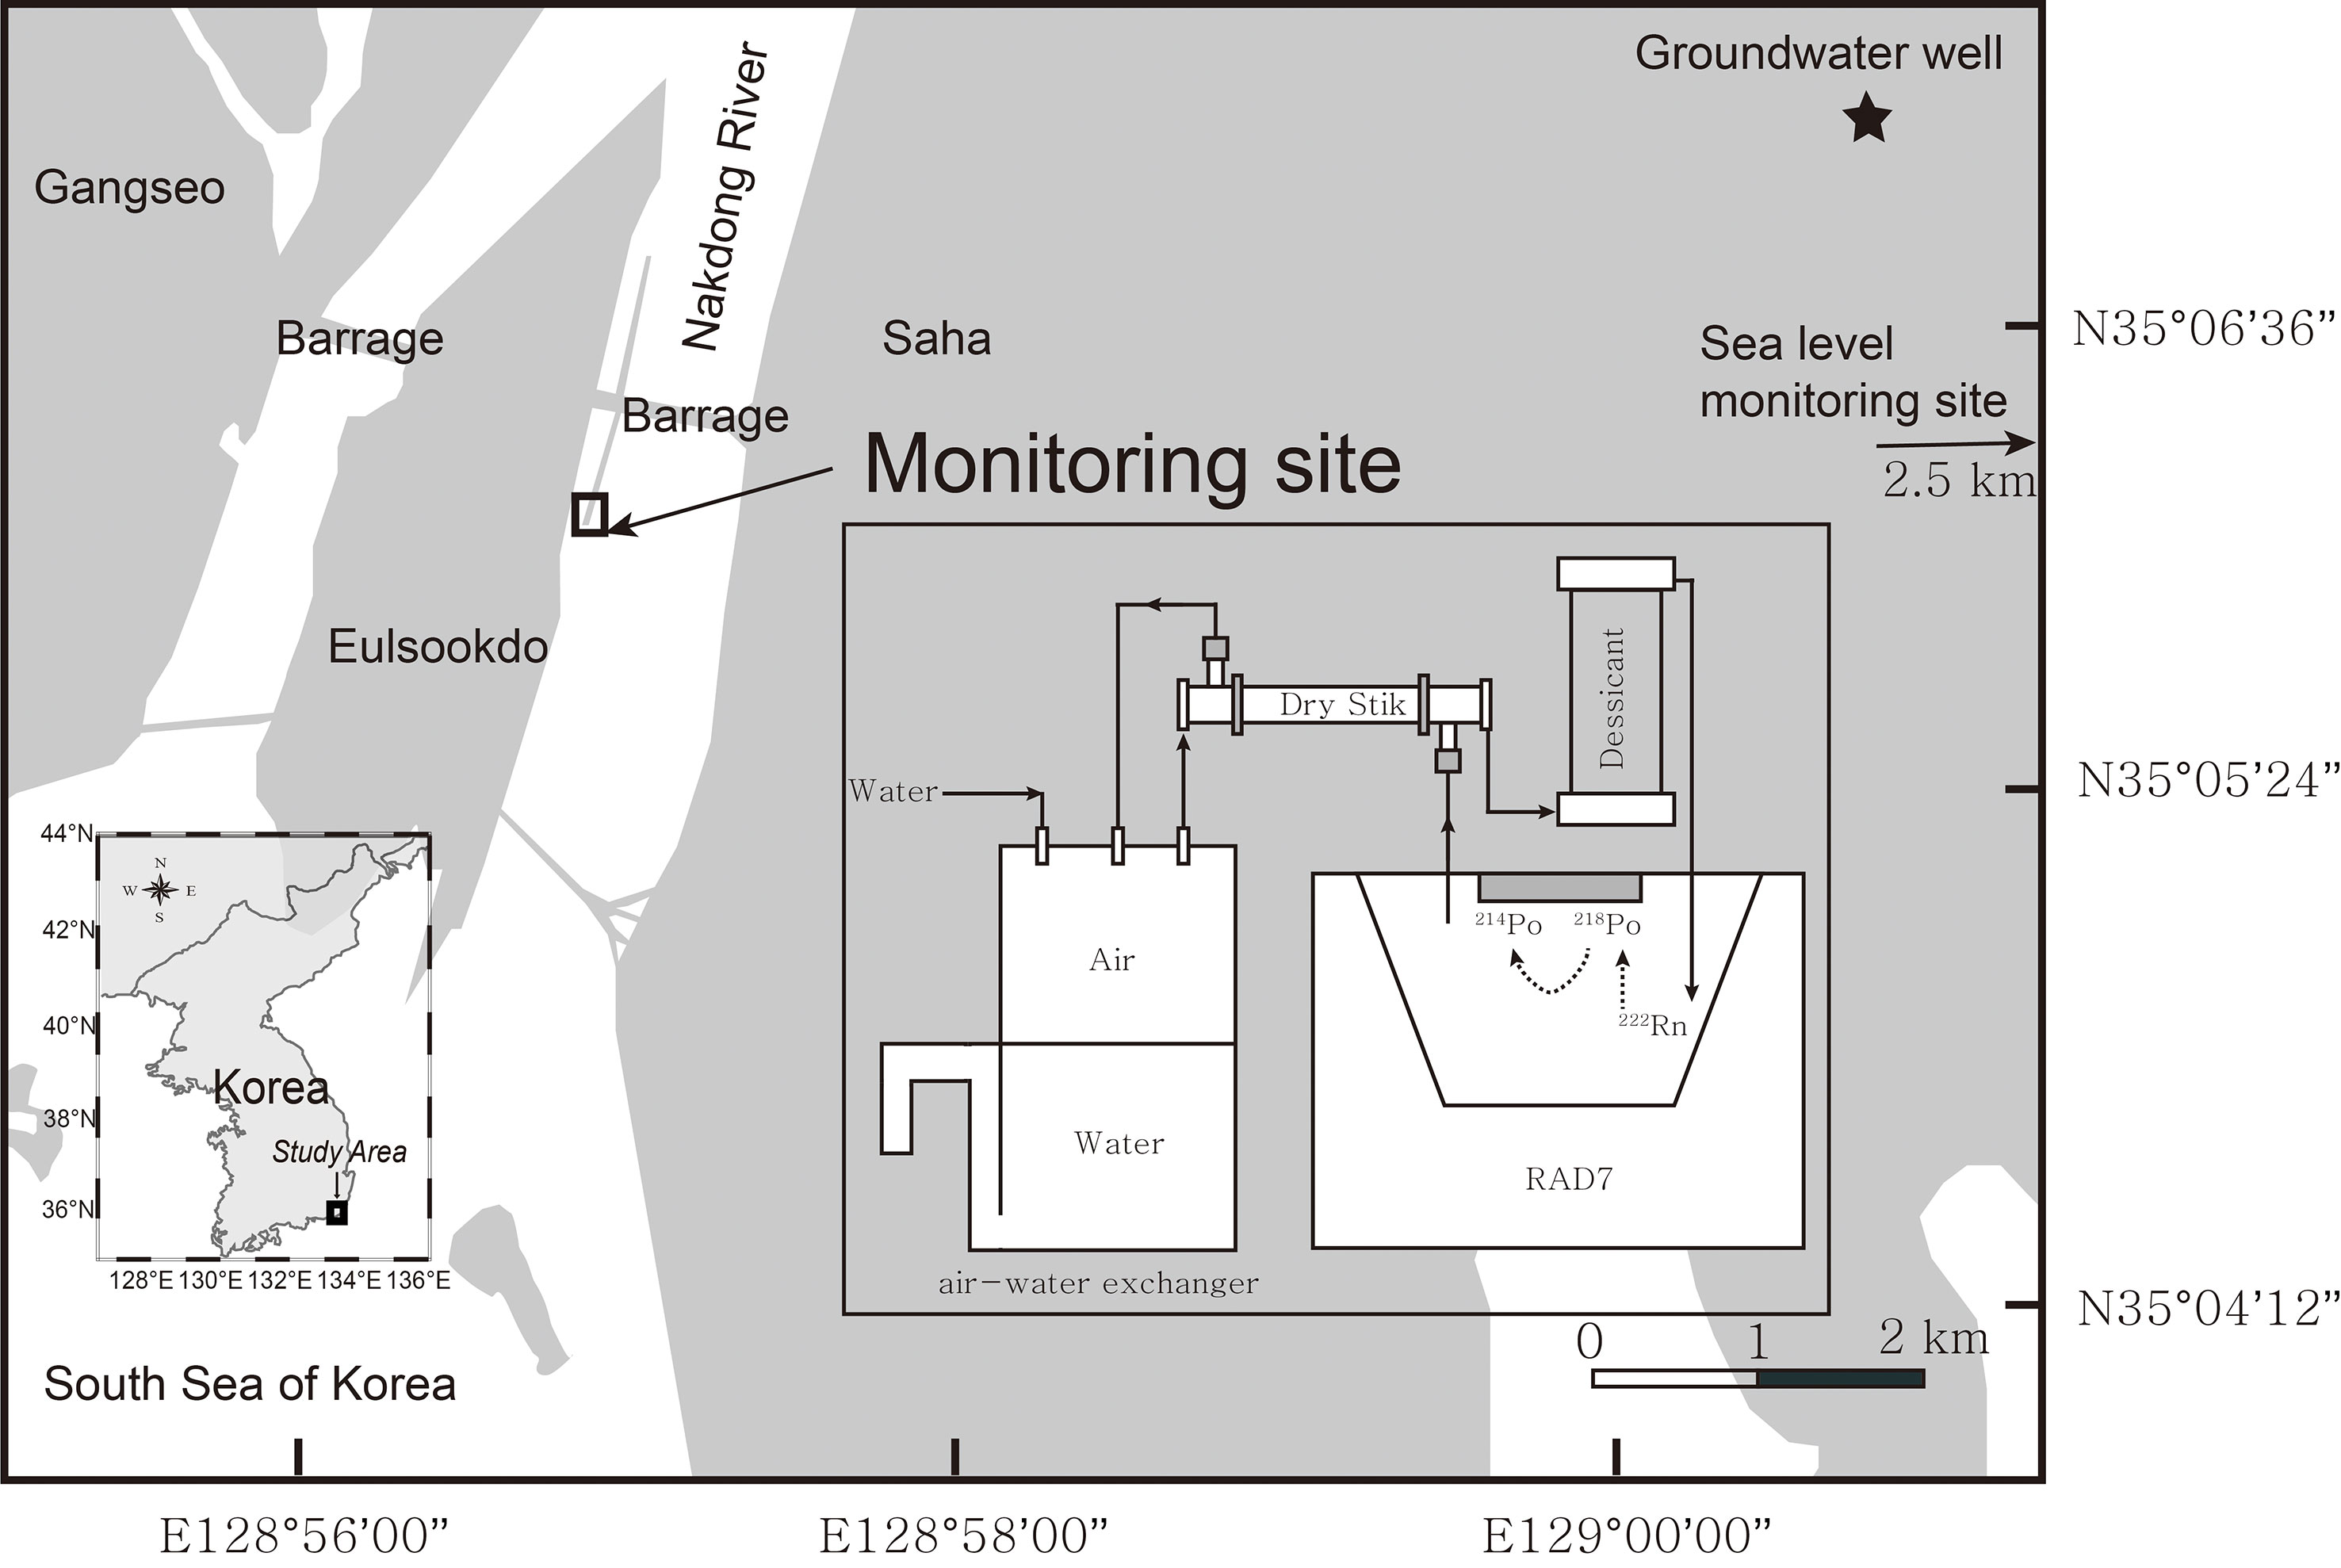
Figure 1 Locations of the 222Rn and nutrient monitoring site (square) in the Nakdong River estuary and the groundwater level monitoring station (star). A schematic diagram of the measurement system, which uses a radon monitor (RAD7) and air-water exchanger, is also shown.
Multi-purpose dams and river barrage were constructed across the Nakdong River. These barriers control the water flow and level to supply industrial and agricultural water and prevent seawater intrusion. The Nakdong River barrage is located approximately 7 km away from open ocean, and is equipped with four regulating gates and six main gates (550 m long). All the gates can discharge river water using underflow and overflow. The barrage also has a closed section (1,720 m long) with a navigation lock and a fish ladder (Ji et al., 2011). After construction of the barrage built in 1987, water quality and various ecosystems within the Nakdong River estuary have changed. For example, the estuary has experienced blooms of cyanobacteria and diatoms due to river-derived anthropogenic input of nutrients (Kim et al., 1998; Ha et al., 1999).
The monitoring station was ~600 m away from the Nakdong River barrage, and the sampling intake was located ~1 m below the water surface. The monitoring systems were maintained by Ministry of Oceans and Fisheries and Korea Marine Environment Management Corporation (KOEM).
2.2 Water properties and environmental parameters
Temperature, salinity, wind speed, and nutrient concentrations data in the river water were obtained from Marine Environment Information System (MEIS, https://www.meis.go.kr). Auto nutrient analyzers (RoboChem S-NH4, NO2, NO3, PO4, SiO2, Centennial Technology) recorded the concentrations of inorganic nutrients every five minutes. DIN is defined as the sum of , , and , DIP as , and DSi as Si(OH)4. The detection limits of the analyzers for DIN, DIP, and DSi were 0.2 μM, 0.03 μM, and 0.1 μM, respectively. The instruments were checked every week to validate the monitoring results. Data could not be obtained when there was a loss of power or during problems with water pumping.
Korea Hydrographic and Oceanographic Administration (KHOA) provided sea level data at Pusan tidal station, located approximately 8 km away from the monitoring station. Data on the level of groundwater of a well located 5 km away from the monitoring site (Figure 1) were obtained from National Groundwater Information Center (www.gims.go.kr). Information on the level of river water upstream of the barrage and river water discharge was obtained from K-water.
2.3 Continuous 222Rn monitoring
At the monitoring station, the water flow rate to the radon monitoring system was maintained constantly at 1–2 L min–1. Activity of 222Rn in the water was continuously measured using an automated radon-in-air monitor (RAD7; Durridge Co.) (Burnett et al., 2001). RAD7 can record radon activity in the air within the closed loop of an air-water exchanger (Burnett et al., 2001; Lane-Smith et al., 2002). To maintain low internal humidity (< 10%), RAD7 was coupled with a desiccant and a moisture exchanger (PASSIVE DRYSTIK, 12 model, Durridge Co.) (Oh and Kim, 2011). The desiccant was replaced every month. 222Rn data collected during periods of high relative humidity (> 10%) or when water was not flowing were discarded.
To avoid potentially underestimating 222Rn activity, the activities of 222Rn were corrected for humidity effects using Capture software (Durridge Co.). Without this correction, the activities of 222Rn could be about 5% underestimated. The corrected 222Rn activity was then converted to activity in water using the water/air partition coefficient of radon. This is calculated from the relationships between water temperature, salinity, and the Bunsen coefficient (Schubert et al., 2012). Since generally salinity changes sharply in estuaries, the activities should be carefully corrected for the salinity effects.
3 Results
3.1 Environmental parameters
During the entire measurement period, sea level ranged from -0.1 to 1.5 m with semi-diurnal and semi-monthly fluctuations (Figure 2A). Sea level was slightly lower during the dry season (December 2014–February 2015) than the wet seasons (October and November 2014, March–May 2015). Daily average wind speed varied between 1.7 and 6.4 m s–1, with slightly higher values during the day and during periods of significant rainfall (Figure 2A). The water level upstream of the barrage was slightly lower during the wet seasons than the dry season, ranging from 0.5 to 0.9 m (Figure 2B). The relative groundwater level, which is obtained by subtracting an average (105.2 m) of all groundwater level data, varied between -1.4 and 1.9 m (Figure 2B). This is a much larger range than change in the water level upstream of barrage. Relative groundwater level was highest during October 2014 due to significant rainfall events during the summer months of 2014. River water discharge ranged from 30 to 1,690 m3 s–1, showing higher discharge, due to large rainfall, during the wet seasons (average: 312 ± 57 m3 s–1) than the dry season (average: 78 ± 11 m3 s–1).
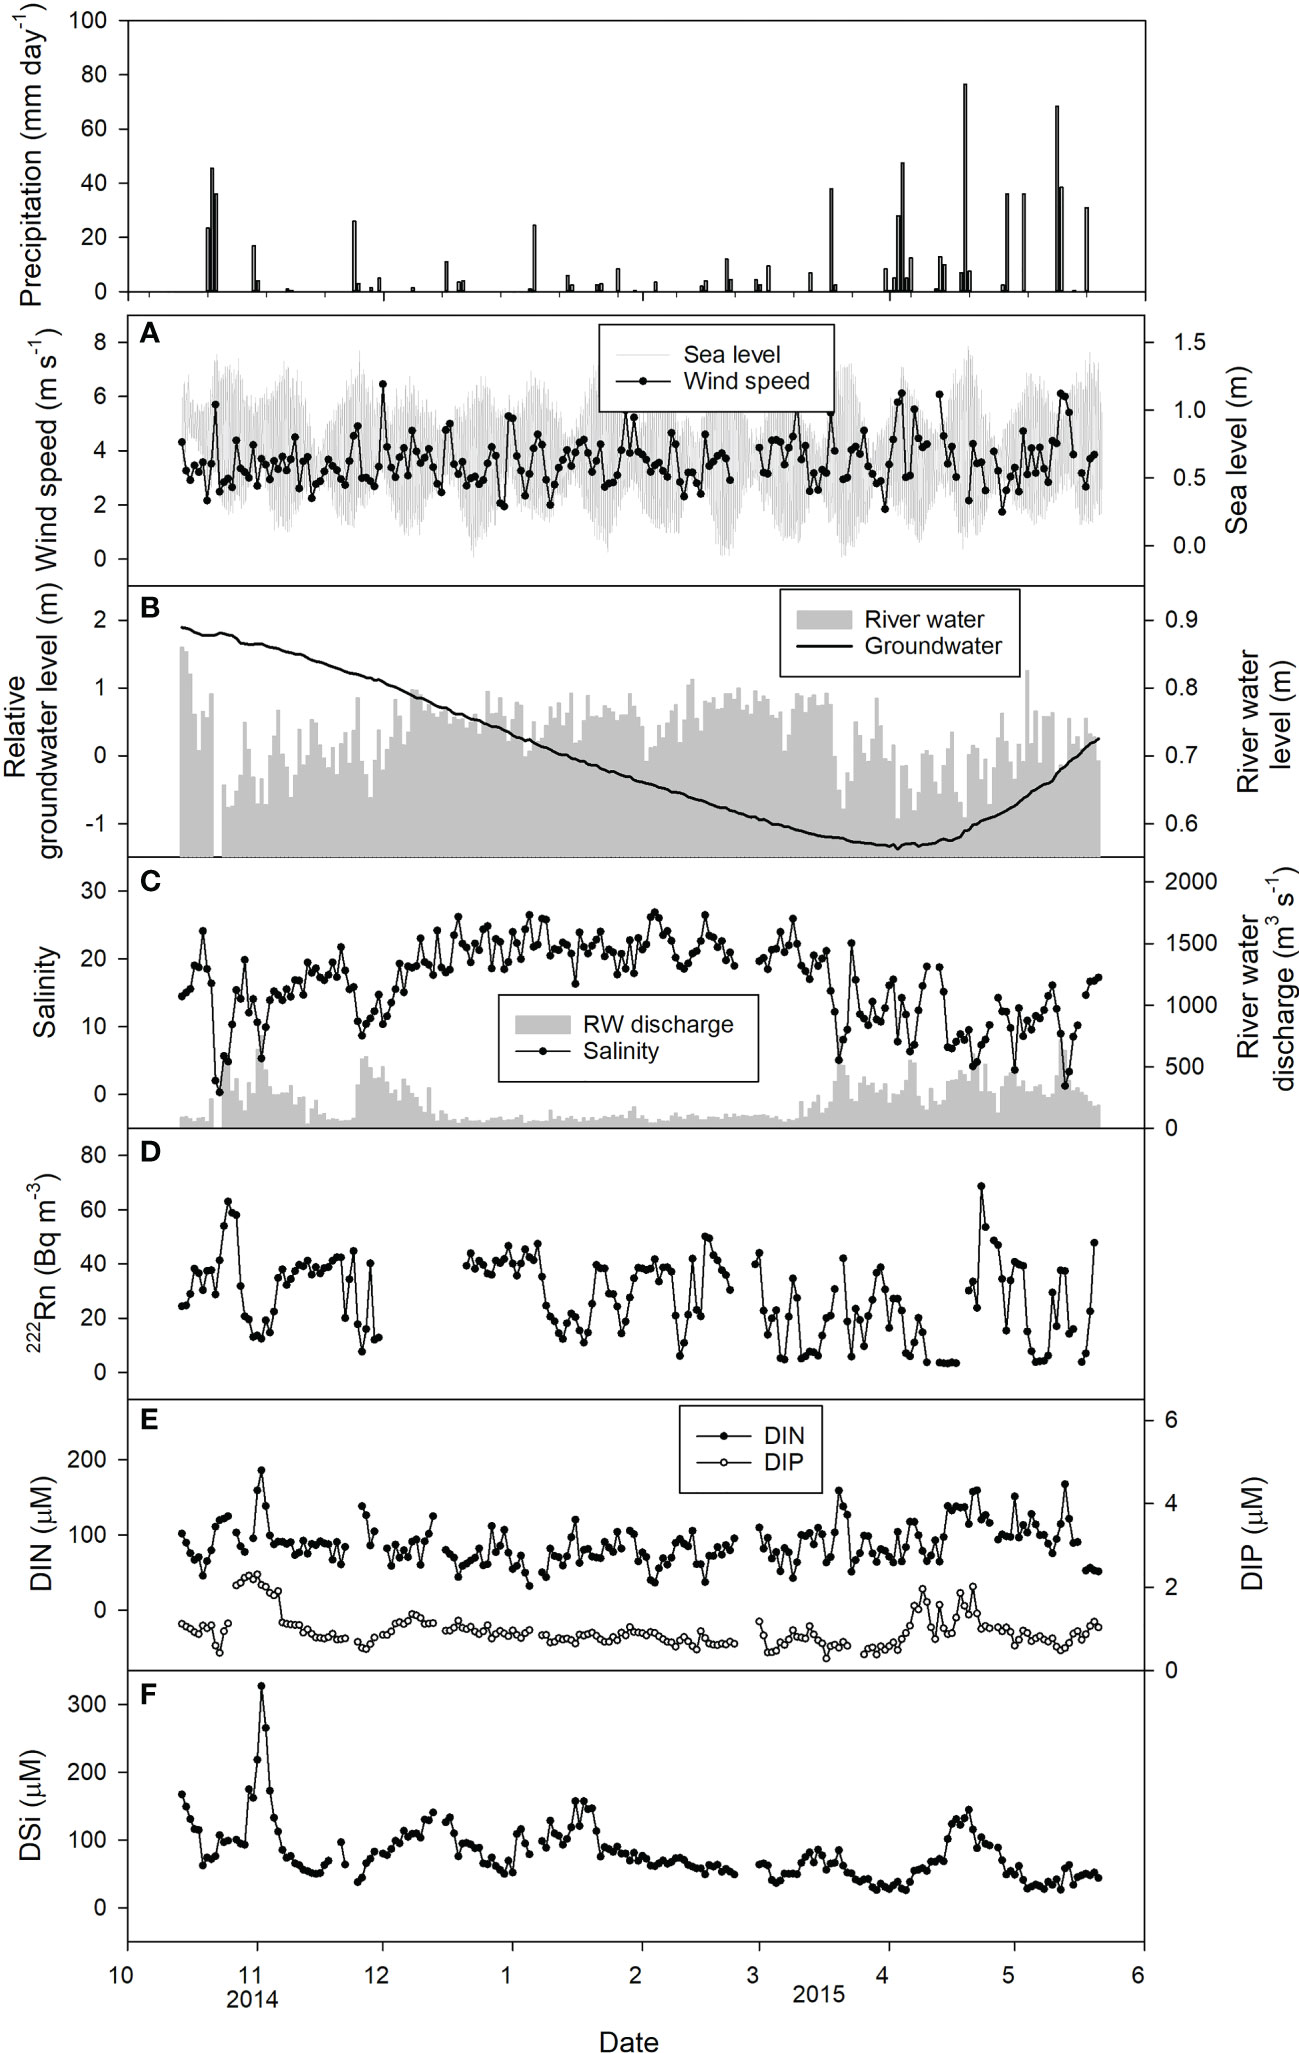
Figure 2 Time series measurement results of the daily averages for (A) wind speed and sea level, (B) relative groundwater level and river water level, (C) salinity and river water discharge rate, (D) 222Rn activity, (E) DIN (closed circle) and DIP (open circle) concentrations, and (F) DSi concentration from October 2014 to May 2015.
3.2 Salinity, 222Rn, and nutrients
Salinity ranged from 0 to 27, showing diurnal and seasonal variations. Salinities were lower during the wet seasons than the dry season (Figure 2C). During the dry season, salinity showed a clear semi-diurnal variation. Daily average 222Rn activity ranged from 3 to 69 Bq m–3 (Figure 2D), with slightly higher activities during the dry season (32 ± 11 Bq m–3) than the wet seasons (26 ± 15 Bq m–3). Daily average concentrations of DIN, DIP, and DSi were in the range of 32–186 μM, 0.3–2.3 μM, and 26–327 μM, respectively (Figures 2E, F). The daily average N:P ratio ranged from 33 to 226 over the entire monitoring period (data not shown).
4 Discussion
4.1 Effect of salinity, wind speed, and tides on nutrient levels
Data measured every five minutes for nutrient concentrations and every two hours for 222Rn activity were averaged per day to minimize the effect of hourly variation in wind speed and tides. The daily average salinity showed a significant correlation (r = -0.87, p <0.001) with the river water discharge (Figure 3A), except for two days in November 2014 when the river water discharge was very high due to significant rainfall (1,690 m3 s–1 and 1,310 m3 s–1) (Figure 2C). This suggests that changes in salinity reflect variation in the river water discharge in this estuary. As expected, salinity decreased to <1 during the wet seasons when the river water discharge was high, but increased to >25 during the dry season when the discharge was much lower.
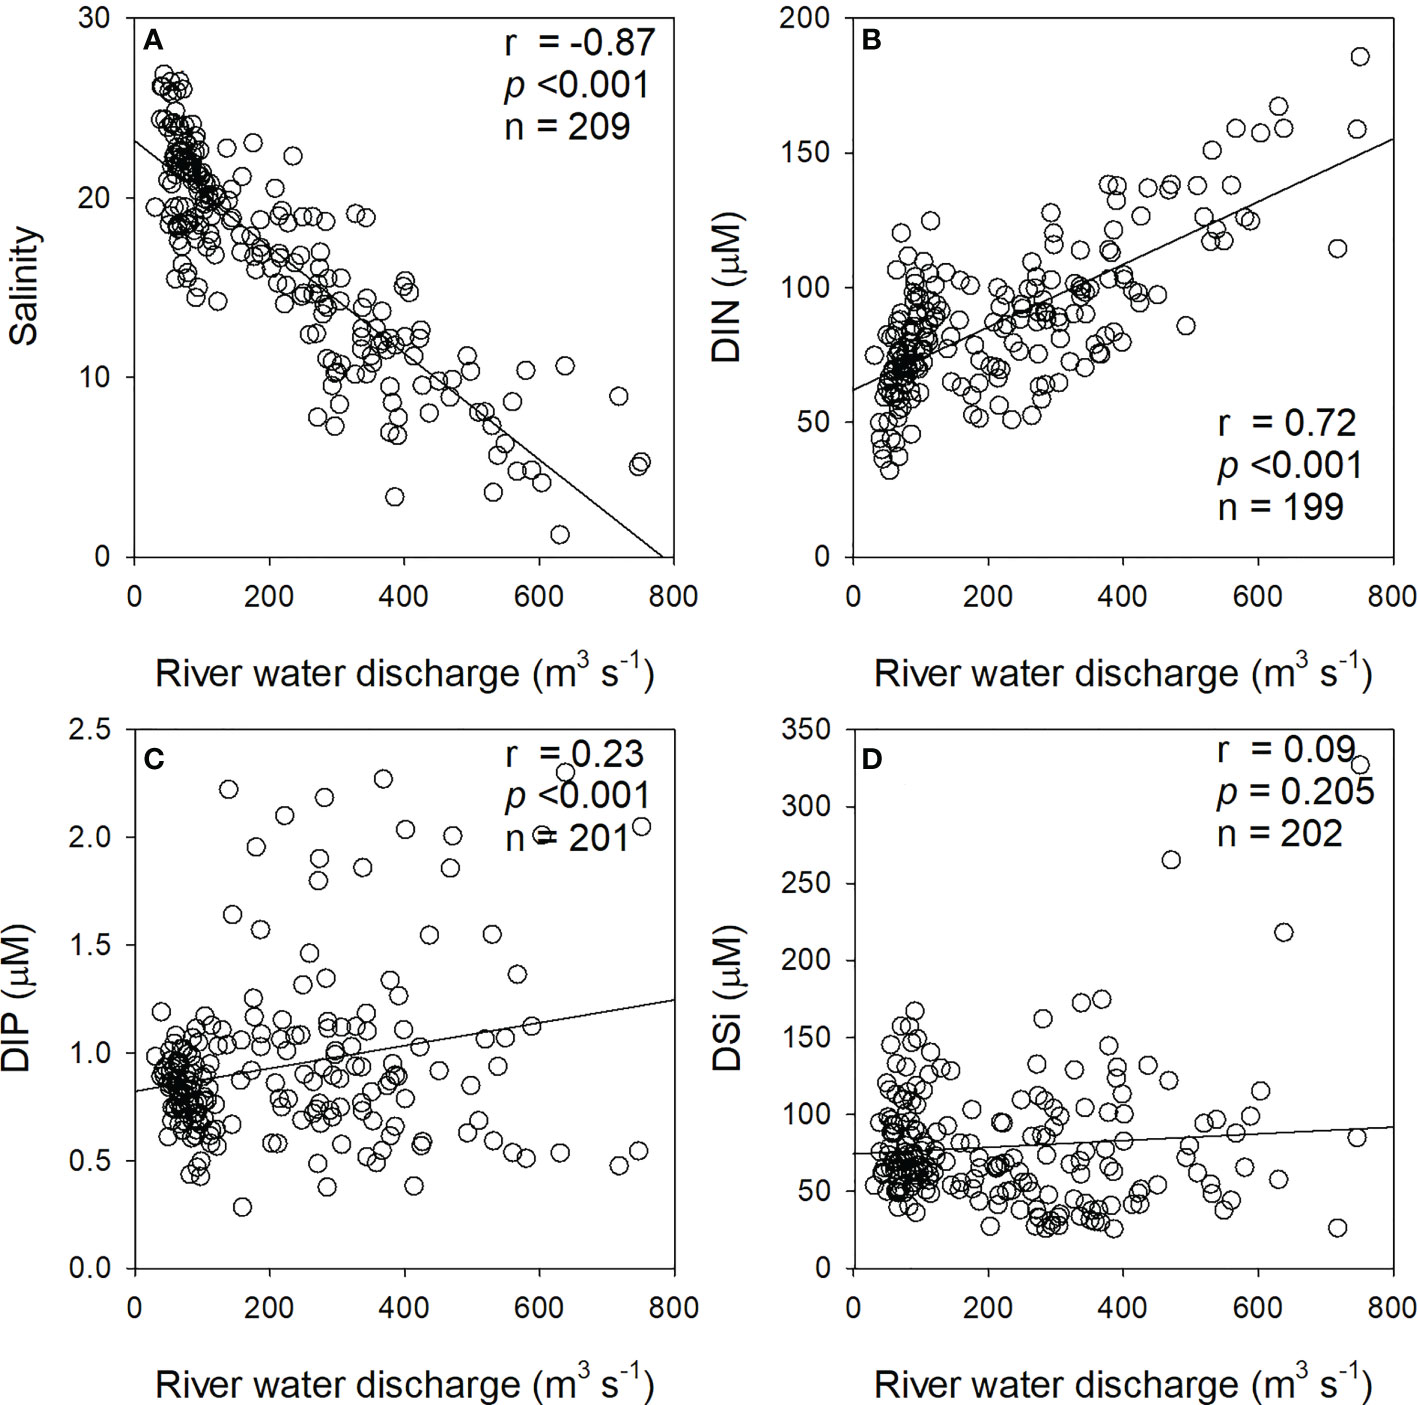
Figure 3 Plots of the daily averaged river water discharge versus (A) salinity, (B) DIN, (C) DIP, and (D) DSi during the entire measurement period except for two days in November 2014. The solid lines represent the regression lines.
The concentration of DIN showed a significant correlation (r = 0.72, p <0.001) against the river water discharge, indicating that the river-derived DIN is a main source of DIN in this estuary, and that DIN is quite conservative in this river water-seawater mixing zone (Figure 3B). The average DIN concentration in the fresh river water (salinity <2) during large rainfall periods was approximately 130 μM. This is four to five times higher than concentrations in open ocean water (~25 μM). These results suggest that the DIN input from the river significantly influence on DIN budget in this mixing zone. However, DIP and DSi showed weak or no correlations against the river water discharge (r = 0.23, p <0.001 for DIP and r = 0.08, p = 0.205 for DSi) (Figures 3C, D), indicating that the concentrations of DIP and DSi may be significantly influenced by other environmental factors such as wind speed, river water level, tides, or groundwater input. However, open ocean sources for DIP and DSi seem to be insignificant as DIP and DSi concentrations were low in the high salinity (25–27) water.
The daily averages of nutrient concentrations did not correlate significantly with wind speed (r < 0.01, p <0.979 for DIN, r <0.01, p = 0.976 for DIP, and r = -0.1, p = 0.181 for DSi) during the entire measurement period (Supplementary Figure 1). This suggests that vertical water mixing at the monitoring station does not significantly affect the nutrient concentrations. In addition, nutrient concentrations did not show a similar trend with tidal fluctuations (Figure 2). To remove the effects of large discharge events on the correlation analyses, we selected a period of low river water discharge (16 December 2014–10 March 2015, <150 m3 s–1). During this period, no significant correlation was found between DIP and DSi, and salinity, similar to the entire measurement period (Supplementary Figures 2A–C). In addition, the wind speeds also showed no significant correlations with the nutrient concentrations (Supplementary Figures 2D–F). Therefore, these relationships demonstrate that while DIN is mainly controlled by the river water discharge as mentioned above, DIP and DSi may be more influenced by other processes, such as groundwater input, rather than by the river water discharge, wind speed, and tidal fluctuation.
4.2 Effect of groundwater on nutrient levels
Since groundwater has been recognized as an important source of nutrients in rivers and estuaries (Moore, 2010; Kim et al., 2011), we attempt to link groundwater and nutrients (DIP and DSi) in estuarine water using correlation analyses. We obtained two independent groundwater parameters, groundwater level and benthic 222Rn flux. The seasonal trend in groundwater level at the monitoring well was found to be similar to that of another well located ~12 km away from the monitoring station (r = 0.92 for October 2014–March 2015 and r = 0.91 for April–May 2015, data not shown). This suggests that the groundwater level at the monitoring well seems to represent the regional trend of groundwater level. Therefore, groundwater level was utilized in this study as a hydraulic gradient index for the estuary. Compared with the variation in groundwater level (maximum: 3.5 m), the change in river water level upstream of the barrage (maximum: 0.4 m) was much smaller, indicating that the hydraulic gradient driven by the river water level is relatively insignificant in this region.
On the other hand, in this study, the groundwater inputs of nutrients are traced by 222Rn monitoring results. Benthic 222Rn flux reflects groundwater input because: (1) the level of 222Rn in groundwater is 1–2 orders of magnitude higher than that in seawater, (2) 222Rn is conservative in water, (3) the time scale of 222Rn decay is suitable for tracing groundwater in coastal waters, which have a few days of residence time generally, and (4) the diffusive fluxes of 222Rn from bottom sediments are often negligible compared with groundwater input (Tait et al., 2013).
In this study, 222Rn data is integrated for each month to minimize the effect of episodic variations in the daily averaged data which are influenced by many environmental parameters such as the tide, wind speed, river water discharge, and groundwater input in the estuary. The assumptions made for this calculation are, that: (1) the sources of 222Rn are groundwater and ingrowth from 226Ra, and the sinks are evasion to the atmosphere and radioactive decay, and (2) the water was vertically homogeneous throughout the entire water column at the monitoring station (average depth: 5 m). At a steady-state condition, 222Rn mass balance can be expressed as follows:
where Fben is the 222Rn flux from the river bottom, Feva is the 222Rn evasion flux to the atmosphere, Fdec is the 222Rn decay flux, and Fing is the radioactive ingrowth flux from 226Ra. The unit of the flux is Bq m–2 month–1. Feva is calculated for the daily averaged data and then combined into a month. We used the equations presented by Macintyre et al. (1995) and Turner et al. (1996) to estimate Feva using the wind speed, gas transfer coefficient, and daily averaged radon activity. The activity of 222Rn in the atmosphere is assumed to be 10 Bq m–3. Fdec is calculated by multiplying the daily averaged 222Rn activity by the decay constant (0.182 day–1) and water volume (5 m3). Fing is calculated using the 222Rn decay constant and water volume. The activity of 226Ra is assumed to be 1.3 Bq m–3 from a previous study (Yang et al., 2002).
The calculated evasion and decay fluxes ranged from 240 to 560 Bq m–2 month–1 and 550 to 1,100 Bq m–2 month–1, respectively (Figure 4). The input flux from 226Ra decay was approximately 36 Bq m–2 month–1, which is much lower (<5% of the total loss) than the other terms. Using Eq. (1), the benthic 222Rn fluxes ranged from 760 to 1,500 Bq m–2 month–1, with an average of 1,100 ± 270 Bq m–2 month–1. The benthic fluxes were relatively lower in the spring season (March, April, and May) compared with the other seasons. The diffusion flux (50 Bq m–2 month–1) was negligible (<10% of the minimum benthic flux), even when the maximum 222Rn diffusion rate (1.6 Bq m–2 d–1) is assumed (Hwang, 2005c).
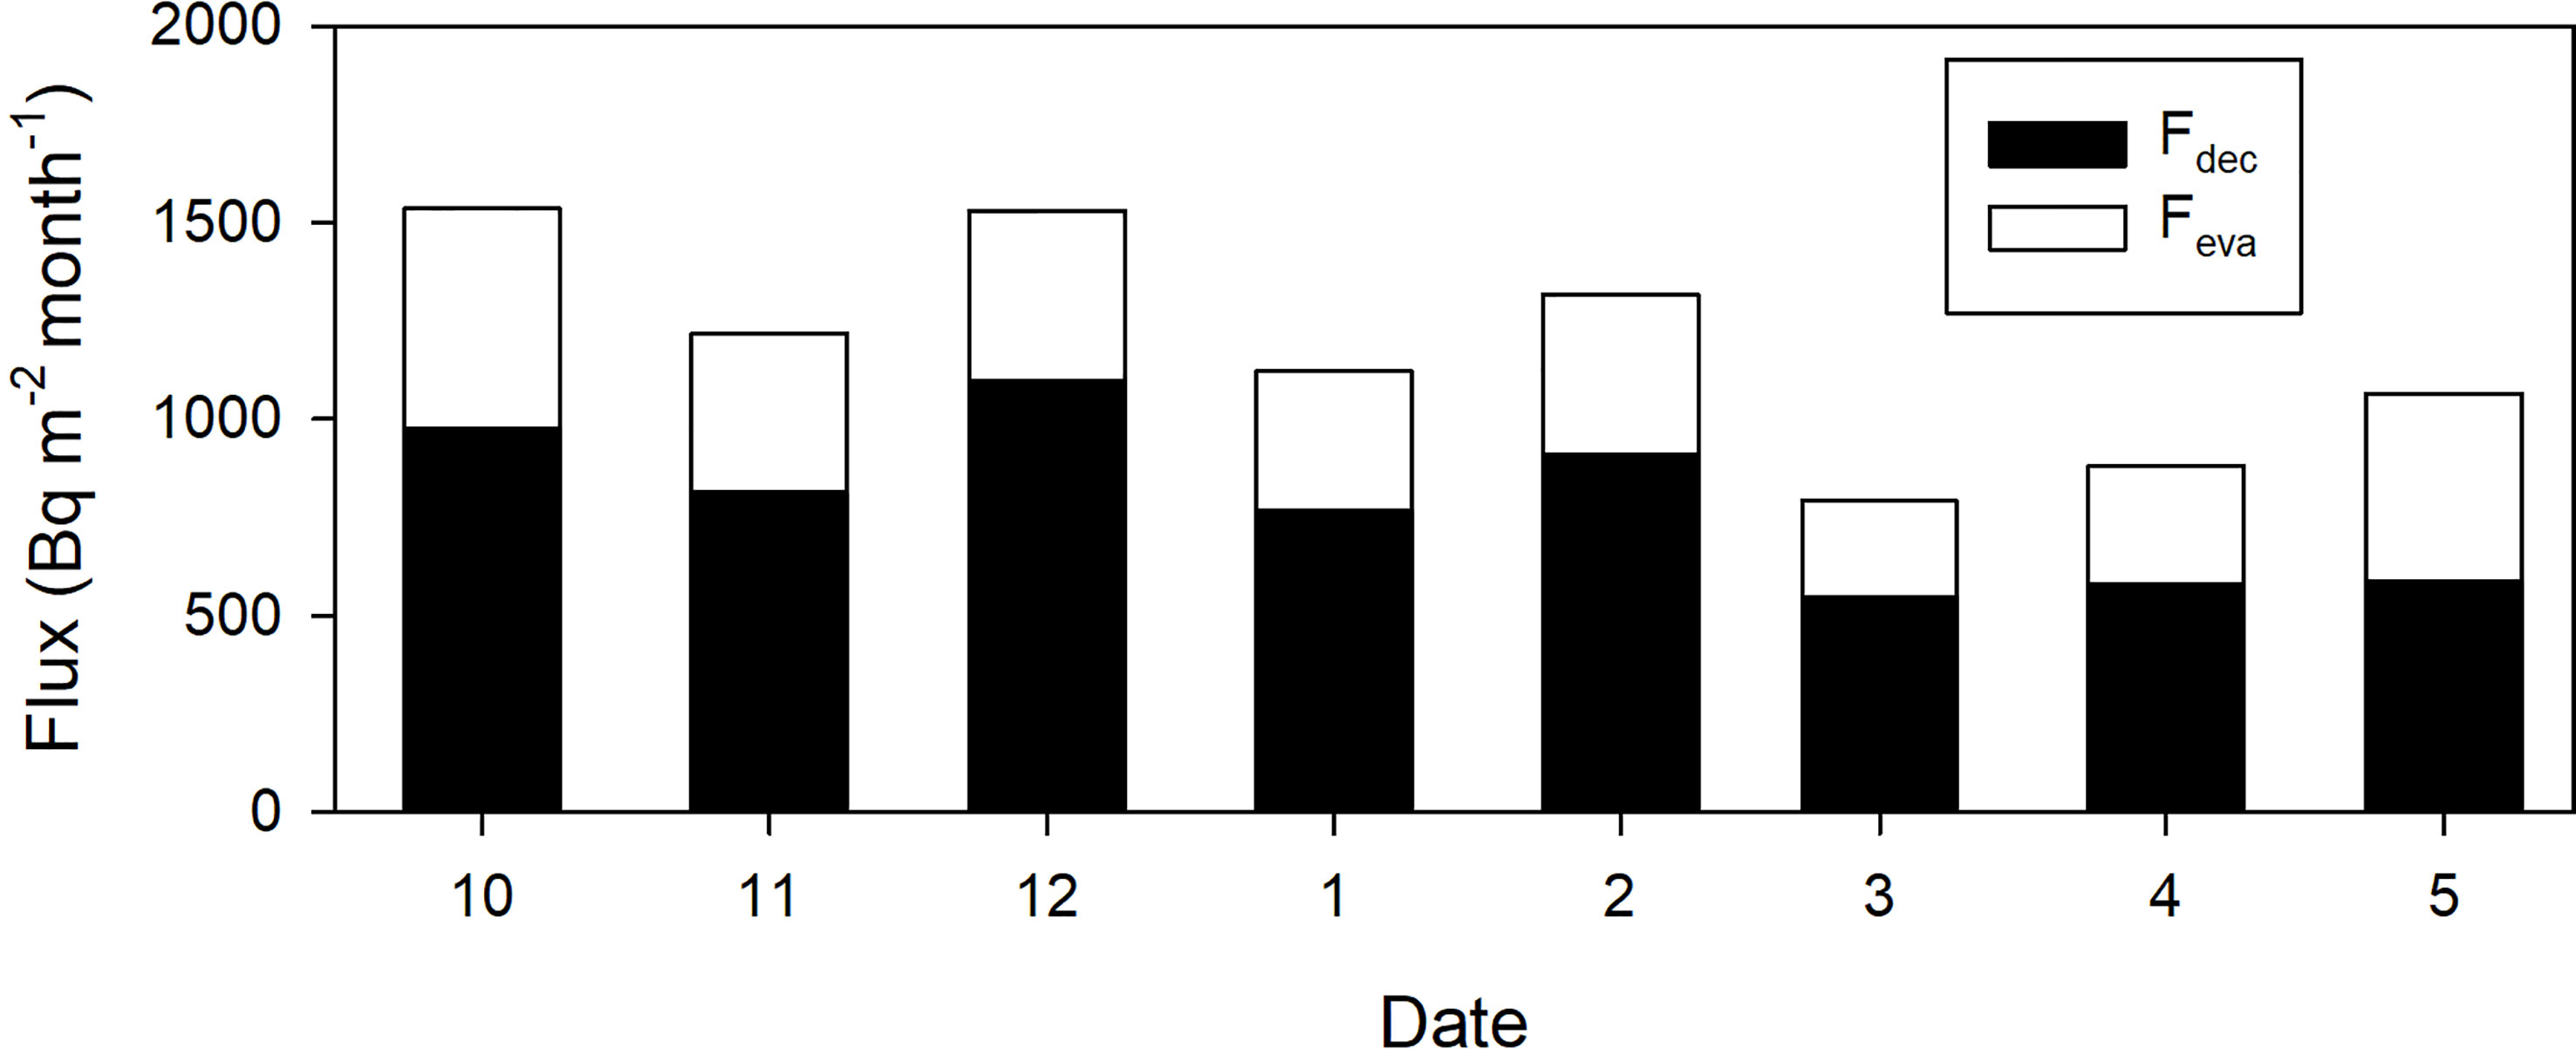
Figure 4 Histogram showing monthly-integrated 222Rn fluxes through evasion and decay.
The monthly-integrated benthic 222Rn flux showed a significant relationship (r = 0.78, p = .023) with the monthly average relative groundwater level (Figure 5A), suggesting that groundwater level can be used as a representative of the groundwater input (high hydraulic gradient leads to an increase in groundwater input) in this estuary. Furthermore, groundwater seeping zone cannot be differentiated using correlation analyses. Therefore, the benthic flux of 222Rn may trace groundwater-driven nutrient fluxes from any areas, including upstream rivers, estuarine zones, and open ocean waters (Burnett and Dulaiova, 2003; Kim et al., 2011; Santos et al., 2015). In addition, we cannot quantify groundwater flux or groundwater-borne nutrient fluxes since the endmember values of 222Rn and dissolved nutrients in groundwater are unknown.
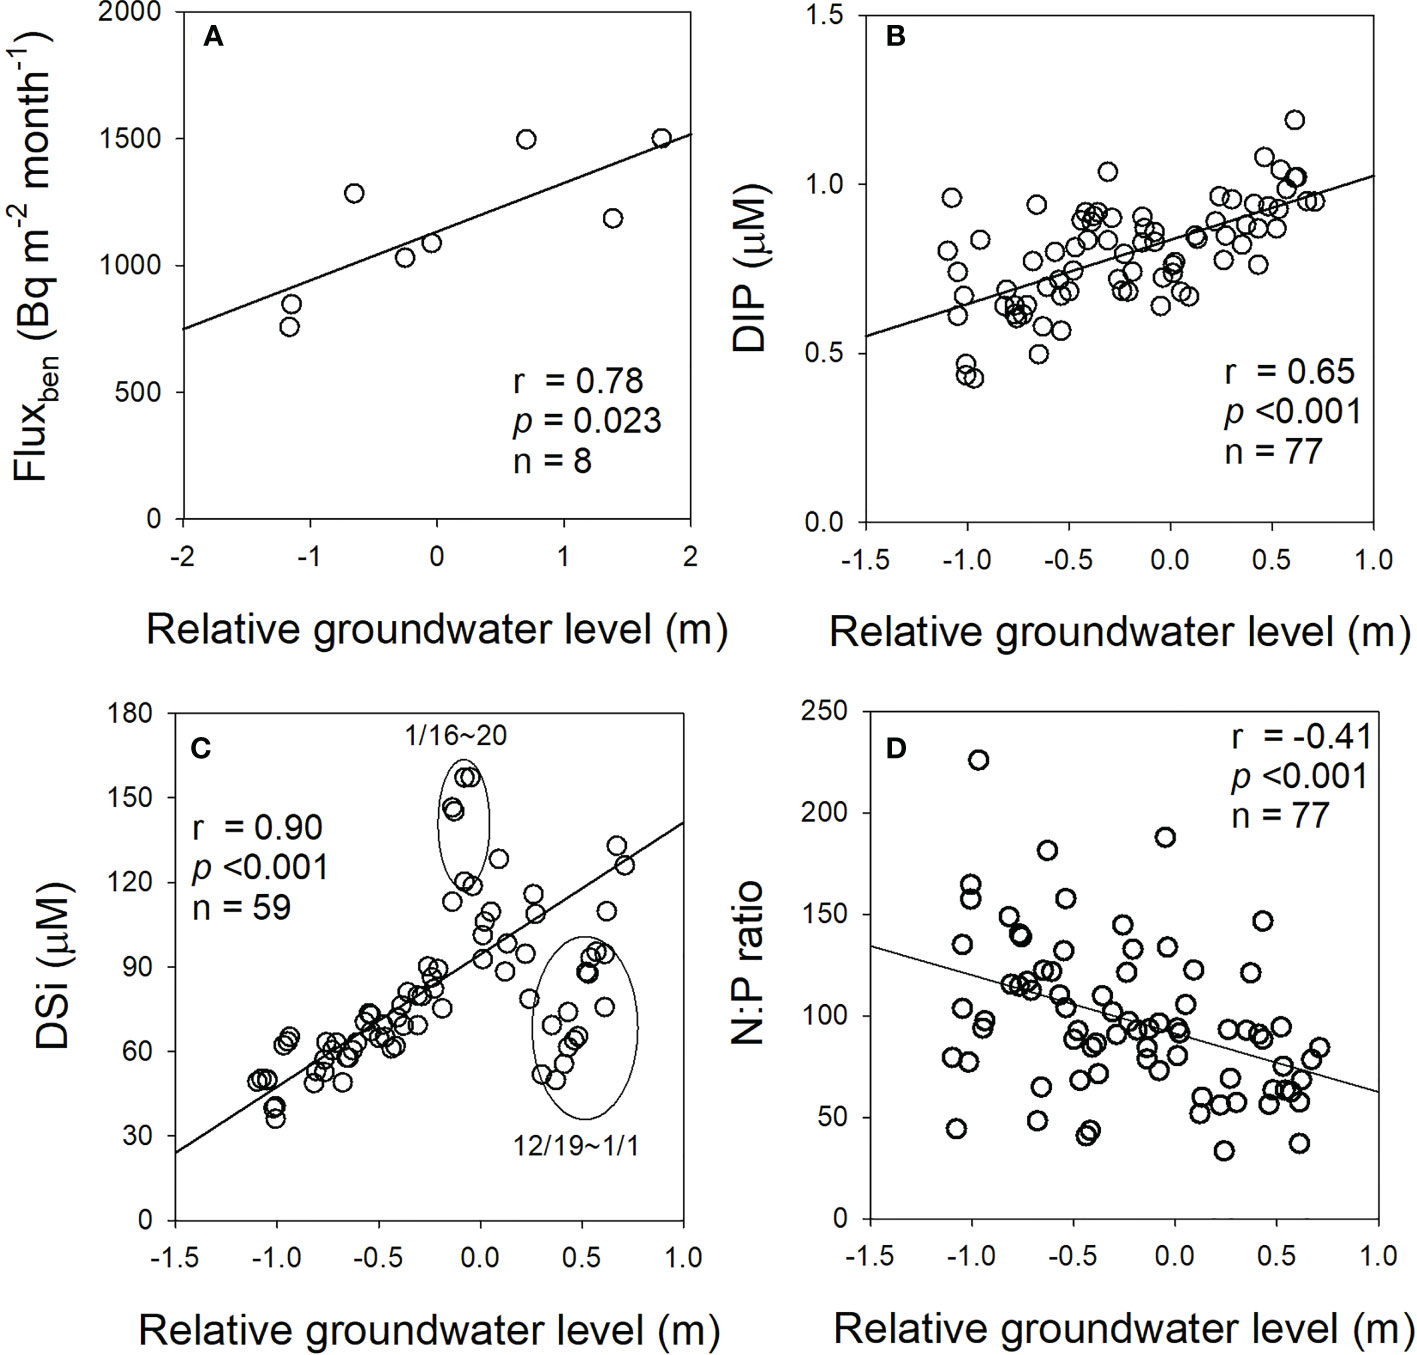
Figure 5 Plots of groundwater levels versus (A) benthic flux, (B) DIP, (C) DSi, and (D) N:P ratio. The values used for (A) are the monthly averages during the entire measurement period; the daily averages for (B–D) are from 16 December 2014 to 10 March 2015. The two circles in (C) are excluded from the regression line (solid line).
In order to investigate the link between groundwater input and the concentrations of DSi and DIP, we have to remove the data for significant river water discharge period. During the period of low river water discharge, the relative groundwater level showed no significant correlation against DIN concentration (r = -0.05, p = .496, data not shown), as expected from a significant correlation between DIN and salinity. However, the change in relative groundwater level showed significant correlations against the change in the concentration of DIP (r = 0.65, p <0.001) and DSi (r = 0.90, p <0.001) (Figures 5B, C). We excluded some DSi data for anomalously high and low concentrations, perhaps due to biological processes, in this plot. These results indicate that groundwater input does not significantly influence DIN concentration, however, DIP and DSi concentrations are controlled by groundwater input at least during low river water discharge period in this estuary. Also, the observed N:P ratios (33 to 226), which were higher than Redfield ratio (16), indicated that the river water was under P-limited condition and showed a significant correlation (r = -0.41, p <0.001) with the relative groundwater level (Figure 5D). Therefore, our results suggest that groundwater input may be an important source of an ecologically limiting nutrient (DIP) which controls biological productivity in this estuary.
5 Conclusions
High resolution time series observations of nutrients and 222Rn were conducted over eight months to examine the factors controlling DIN, DIP, and DSi in the Nakdong River estuary. On the basis of the correlations between the daily average nutrient concentrations and environmental parameters such as salinity, river water discharge, wind speeds, tide, river water level, and groundwater level (benthic flux), the main source of DIN is found to be river water but the main source of DIP and DSi is groundwater. Our results suggest that groundwater driven DIP, which is a limiting nutrient in this estuary, may control the biological production of this estuary. Thus, more extensive studies are necessary to quantify the input of groundwater-borne nutrients into estuaries over the world.
Data availability statement
The original contributions presented in the study are included in the article/Supplementary Material. Further inquiries can be directed to the corresponding author.
Author contributions
YO and TH-K conceived and designed the study. JK and TH-K collected the samples and performed the sample analyses. YO, JK, GK, and TH-K conducted the statistical data analysis. YO wrote the original draft. GK and TH-K reviewed and commented on the manuscript. All authors discussed the results. All authors contributed to the article and approved the submitted version.
Funding
This work was supported by the National Research Foundation of Korea (NRF) grant funded by the Korea government (MSIT) (NRF-2021R1A4A3029447, 2022M3I6A1085692, and 2022R1C1C1012901).
Acknowledgments
We thank members of Environmental and Marine Biogeochemistry Laboratory for their assistance with the installation of the radon monitoring system and data analyses.
Conflict of interest
The authors declare that the research was conducted in the absence of any commercial or financial relationships that could be construed as a potential conflict of interest.
Publisher’s note
All claims expressed in this article are solely those of the authors and do not necessarily represent those of their affiliated organizations, or those of the publisher, the editors and the reviewers. Any product that may be evaluated in this article, or claim that may be made by its manufacturer, is not guaranteed or endorsed by the publisher.
Supplementary material
The Supplementary Material for this article can be found online at: https://www.frontiersin.org/articles/10.3389/fmars.2023.1162164/full#supplementary-material
References
Brunskill G. J., Zagorskis I., Pfitzner J. (2003). Geochemical mass balance for lithium, boron, and strontium in the gulf of Papua, Papua new Guinea (project TROPICS). Geochim. Cosmochim. Acta 67, 3365–3383. doi: 10.1016/S0016-7037(02)01410-2
Bryan G. W., Langston W. J. (1992). Bioavailability, accumulation and effects of heavy metals in sediments with special reference to united kingdom estuaries: a review. Environ. Pollution 76 (2), 89–131. doi: 10.1016/0269-7491(92)90099-V
Burnett W. C., Bokuniewicz H., Huettel M., Moore W. S., Taniguchi M. (2003). Groundwater and pore water inputs to the coastal zone. Biogeochemistry 66 (1), 3–33. doi: 10.1023/B:BIOG.0000006066.21240.53
Burnett W. C., Dulaiova H. (2003). Estimating the dynamics of groundwater input into the coastal zone via continuous radon-222 measurements. J. Environ. Radioactivity 69, 21–35. doi: 10.1016/S0265-931X(03)00084-5
Burnett W. C., Kim G., Lane-Smith D. (2001). A continuous monitor for assessment of 222Rn in the coastal ocean. J. Radioanalytical Nucl. Chem. 249 (1), 167–172. doi: 10.1023/A:1013217821419
Cai W.-J., Hu X., Huang W.-J., Murrell M. C., Lehrter J. C., Lohrenz S. E., et al. (2011). Acidification of subsurface coastal waters enhanced by eutrophication. Nat. Geosci. 4, 766–770. doi: 10.1038/ngeo1297
Cartwright I., Gilfedder B. (2015). Mapping and quantifying groundwater inflows to deep creek (Maribyrnong catchment, SE Australia) using 222Rn, implications for protecting groundwater-dependant ecosystems. Appl. Geochem. 52, 118–129. doi: 10.1016/j.apgeochem.2014.11.020
Charette M. A., Sholkovitz E. R., Hansel C. M. (2005). Trace element cycling in a subterranean estuary: Part 1. geochemistry of the permeable sediments. Geochim. Cosmochim. Acta 69 (8), 2095–2109. doi: 10.1016/j.gca.2004.10.024
Chung S. Y., Jonathan M. P., Venk S. (2016). Evaluation of physico-chemical parameters in water and total heavy metals in sediments at nakdong river basin, Korea. Environ. Earth Sci. 75, 50. doi: 10.1007/s12665-015-4836-2
Colbert D., McManus J. (2005). Importance of seasonal variability and coastal processes on estuarine manganese and barium cycling in a pacific Northwest estuary. Continental Shelf Res. 25 (11), 1395–1414. doi: 10.1016/j.csr.2005.02.003
Day J. W. Jr., Hall C. A. S., Kemp W. M., Yanez-Arancibia A. (1989). Estuarine ecology (New York: Wiley), 558.
Duan S.-W., Xu F., Wang L.-J. (2007). Long-term changes in nutrient concentrations of the changjiang river and principal tributaries. Biogeochemistry 85, 215–234. doi: 10.1007/s10533-007-9130-2
Ha K., Cho E. A., Kim H. W., Joo G. J. (1999). Microcystis bloom formation in the lower nakdong river in south Korea: Importance of hydrodynamics and nutrient loading. Mar. Freshw. Res. 50 (1), 89–94. doi: 10.1071/MF97039
Hwang D. W. (2005c). Magnitudes and mechanisms of submarine groundwater discharge (SGD) in the south Sea of Korea (Pukyong Natl Univ), 151.
Hwang D.-W., Kim G., Lee Y.-W., Yang H.-S. (2005a). Estimating submarine inputs of groundwater and nutrients to a coastal bay using radium isotopes. Mar. Chem. 96, 61–71. doi: 10.1016/j.marchem.2004.11.002
Hwang D.-W., Lee Y.-W., Kim G. (2005b). Large Submarine groundwater discharge and benthic eutrophication in bangdu bay on volcanic jeju island, Korea. Limnol. Oceanogr. 50 (5), 1393–1403. doi: 10.4319/lo.2005.50.5.1393
Jang S. T., Kim K. C. (2006). Change of oceanographic environment in the nakdong estuary. Sea 11 (1), 11–20.
Jeong K.-S., Kim D.-K., Joo G.-J. (2007). Delayed influence of dam storage and discharge on the determination of seasonal proliferations of microcystis aeruginosa and stephanodiscus hantzschii in a regulated river system of the lower nakdong river (South Korea). Water Res. 41, 1269–1279. doi: 10.1016/j.watres.2006.11.054
Ji U., Julien P., Park S. (2011). Sediment flushing at the nakdong river estuary barrage. J. Hydraulic Engineering 137 (11), 1522–1535. doi: 10.1061/(ASCE)HY.1943-7900.0000395
Kim K.-H., Heo W.-M., Kim B. (1998). Spatial and temporal variabilities in nitrogen and phosphorous in the nakdong river system, Korea. Water Air Soil Pollution 102 (1), 37–60. doi: 10.1023/A:1004973616860
Kim G., Kim J.-S., Hwang D.-W. (2011). Submarine groundwater discharge from oceanic islands standing in oligotrophic oceans: Implications for global biological production and organic carbon fluxes. Limnol. Oceanogr. 56 (2), 673–682. doi: 10.4319/lo.2011.56.2.0673
Kim G. Y., Lee C. W., Yoon H. S., Joo G. J. (2005). Changes of distribution of vascular hydrophytes in the nakdong river estuary and growth dynamics of schoenoplectus triqueter, waterfowl food plant. Korean J. Ecol. 28 (5), 335–345. doi: 10.5141/JEFB.2005.28.5.335
Kim G., Ryu J.-W., Hwang D.-W. (2008). Radium tracing of submarine groundwater discharge (SGD) and associated nutrient fluxes in a highly-permeable bed coastal zone, Korea. Mar. Chem. 109, 307–317. doi: 10.1016/j.marchem.2007.07.002
Lane-Smith D. R., Burnett W. C., Dulaiova H. (2002). Continuous radon-222 measurements in the coastal zone. Sea Technol. 43 (10), 37–45.
Lapointe B. E. (1997). Nutrient thresholds for bottom-up control of macroalgal blooms on coral reefs in Jamaica and southeast Florida. Limnol. Oceanogr. 42, 1119–1131. doi: 10.4319/lo.1997.42.5_part_2.1119
Lee Y.-W., Kim G. (2007). Linking groundwater-borne nutrients and dinoflagellate red-tide outbreaks in the southern sea of Korea using a Ra tracer. Estuarine Coast. Shelf Sci. 71, 309–317. doi: 10.1016/j.ecss.2006.08.004
Lirman D., Deangelo G., Serafy J., Hazra A., Hazra D. S., Herlan J., et al. (2008). Seasonal changes in the abundance and distribution of submerged aquatic vegetation in a highly managed coastal lagoon. Hydrobiologia 596, 105–120. doi: 10.1007/s10750-007-9061-x
Macintyre S., Wanninkhof R., Chanton J. P. (1995). “Trace gas exchange across the air-sea interface in freshwater and coastal marine environments,” in Biogenic trace gases: Measuring emissions from soil and water, vol. 408 . Eds. Matson P. A., Harris R. C. (Oxford, United Kingdom: Blackwell Science Ltd).
Meybeck M. (1982). Carbon, nitrogen, and phosphorus transport by world rivers. Am. J. Sci. 282, 401–450. doi: 10.2475/ajs.282.4.401
Moncheva S., Gotsis-Skretas O., Pagoub K., Krasteva A. (2001). Phytoplankton blooms in black Sea and Mediterranean coastal ecosystems subjected to anthropogenic eutrophication: Similarities and differences. Estuarine Coast. Shelf Sci. 53 (3), 281–295. doi: 10.1006/ecss.2001.0767
Moore W. S. (2006). The role of submarine groundwater discharge in coastal biogeochemistry. J. Geochem. Exploration 88, 389–393. doi: 10.1016/j.gexplo.2005.08.082
Moore W. S. (2010). The effect of submarine groundwater discharge on the ocean. Annu. Rev. Mar. Sci. 2, 59–88. doi: 10.1146/annurev-marine-120308-081019
Moore W. S., Blanton J. O., Joye S. B. (2006). Estimates of flushing times, submarine groundwater discharge, and nutrient fluxes to okatee estuary, south Carolina. J. Geophys. Res. 111, C09006. doi: 10.1029/2005JC003041
Oh Y., Kim G. (2011). Factors controlling the air ventilation of a limestone cave revealed by 222Rn and 220Rn tracers. Geosci. J. 15, 115–119. doi: 10.1007/s12303-011-0010-3
Paerl H. W. (2006). Assessing and managing nutrient-enhanced eutrophication in estuarine and coastal waters: Interactive effects of human and climatic perturbations. Ecol. Engineering 26 (1), 40–54. doi: 10.1016/j.ecoleng.2005.09.006
Peterson R. N., Santos I. R., Burnett W. C. (2010). Evaluating groundwater discharge to tidal rivers based on a Rn-222 time-series approach. Estuarine Coast. Shelf Sci. 86, 165–178. doi: 10.1016/j.ecss.2009.10.022
Ruhl H. A., Rybicki N. B. (2010). Long-term reductions in anthropogenic nutrients link to improvements in Chesapeake bay habitat. Proc. Natl. Acad. Sci. United States America 107 (38), 16566–16570. doi: 10.1073/pnas.1003590107
Sadat-Noori M., Santos I. R., Sanders C. J., Sanders L. M., Maher D. T. (2015). Groundwater discharge into an estuary using spatially distributed radon time series and radium isotopes. J. Hydrol. 528, 703–719. doi: 10.1016/j.jhydrol.2015.06.056
Santos I. R., Beck M., Brumsack H.-J., Maher D. T., Dittmar T., Waska H., et al. (2015). Porewater exchange as a driver of carbon dynamics across a terrestrial-marine transect: Insights from coupled 222Rn and pCO2 observations in the German wadden Sea. Mar. Chem. 171 (20), 10–20. doi: 10.1016/j.marchem.2015.02.005
Schubert M., Paschke A., Lieberman E., Burnett W. C. (2012). Air–water partitioning of 222Rn and its dependence on water salinity. Environ. Sci. Technol. 46 (7), 3905–3911. doi: 10.1021/es204680n
Slomp C. P., Van Cappellen P. (2004). Nutrient inputs to the coastal ocean through submarine groundwater discharge: controls and potential impact. J. Hydrol. 295, 64–86. doi: 10.1016/j.jhydrol.2004.02.018
Smith S. V., Swaney D. P., Talaue-Mcmanus L., Bartley J. D., Sandhei P. T., McLaughlin C. J., et al. (2003). Humans, hydrology, and the distribution of inorganic nutrient loading to the ocean. BioScience 53 (3), 235–245. doi: 10.1641/0006-3568(2003)053[0235:HHATDO]2.0.C
St. Louis V. L., Kelly C. E., Duchemin E., Rudd J. W. M., Rosenberg D. M. (2000). Reservoir surface as sources of greenhouse gases to the atmosphere: A global estimate. Bioscience 20, 766–775. doi: 10.1641/0006-3568(2000)050[0766:RSASOG]2.0.C
Sunda W. C., Cai W.-J. (2012). Eutrophication induced CO2-acidification of subsurface coastal waters: Interactive effects of temperature, salinity, and atmospheric PCO2. Environ. Sci. Technol. 46 (19), 10651–10659. doi: 10.1021/es300626f
Swarzenski P., Campbell P., Porcelli D., McKee B. (2004). The estuarine chemistry and isotope systematics of 234,238U in the Amazon and fly rivers. Continental Shelf Res. 24 (19), 2357–2372. doi: 10.1016/j.csr.2004.07.025
Tait D. R., Santos I. R., Erler D. V., Befus K. M., Cardenas M. B., Eyre B. D. (2013). Estimating submarine groundwater discharge in a south pacific coral reef lagoon using different radioisotope and geophysical approaches. Mar. Chem. 156 (20), 49–60. doi: 10.1016/j.marchem.2013.03.004
Talley D. M. (2000). Ichthyofaunal utilization of newly-created versus natural salt marsh creeks in mission bay, California. Wetlands Ecol. Management 8 (2), 117–132. doi: 10.1023/A:1008436301041
Turekian K. K. (1977). The fate of metals in the oceans. Geochim. Cosmochim. Acta 41 (8), 1139–1144. doi: 10.1016/0016-7037(77)90109-0
Turner S. M., Malin G., Nightingale P. D., Liss P. S. (1996). Seasonal variation of dimethyl sulphide in the north Sea and an assessment of fluxes to the atmosphere. Mar. Chem. 54, 245–262. doi: 10.1016/0304-4203(96)00028-X
Waska H., Kim G. (2010). Differences in microphytobenthos and macrofaunal abundances associated with groundwater discharge in the intertidal zone. Mar. Ecol. Prog. Series 407, 159–172. doi: 10.3354/meps08568
Yang H.-S., Hwang D.-W., Kim G. (2002). Factors controlling excess radium in the nakdong river estuary, Korea: submarine groundwater discharge versus desorption from riverine particles. Mar. Chem. 78, 1–8. doi: 10.1016/S0304-4203(02)00004-X
Keywords: estuaries, groundwater, nutrients, Rn-222, benthic flux, Nakdong River
Citation: Oh YH, Kim J, Kim G and Kim T-H (2023) Groundwater as a source of phosphorus and silicate in an estuarine zone: results from continuous monitoring of nutrients and 222Rn. Front. Mar. Sci. 10:1162164. doi: 10.3389/fmars.2023.1162164
Received: 09 February 2023; Accepted: 31 March 2023;
Published: 14 April 2023.
Edited by:
Martin F. Soto-Jimenez, Institute of Marine Science and Limnology, National Autonomous University of Mexico, MexicoReviewed by:
Min-Seob Kim, National Institute of Environmental Research, Republic of KoreaHenry Bokuniewicz, The State University of New York (SUNY), United States
Copyright © 2023 Oh, Kim, Kim and Kim. This is an open-access article distributed under the terms of the Creative Commons Attribution License (CC BY). The use, distribution or reproduction in other forums is permitted, provided the original author(s) and the copyright owner(s) are credited and that the original publication in this journal is cited, in accordance with accepted academic practice. No use, distribution or reproduction is permitted which does not comply with these terms.
*Correspondence: Tae-Hoon Kim, dGhraW04MEBqbnUuYWMua3I=