 Shangjun Cai
 Chao Wang
 Qingmei Zhu
 Qibin Lao
- 1College of Ocean and Meteorology, Guangdong Ocean University, Zhanjiang, China
- 2Laboratory for Coastal Ocean Variation and Disaster Prediction, College of Ocean and Meteorology, Guangdong Ocean University, Zhanjiang, China
- 3Key Laboratory of Climate, Resources and Environment in Continental Shelf Sea and Deep Sea of Department of Education of Guangdong Province, Guangdong Ocean University, Zhanjiang, China
- 4Key Laboratory of Space Ocean Remote Sensing and Application, Ministry of Natural Resources, Beijing, China
Both dissolved and particulate organic matters (DOM and POM) provide a reduced carbon pool of considerable size in coastal ecosystems, and the two are closely linked. Currently, however, the integrated study of DOM and POM remains limited, precluding a more in-depth understanding of their interaction in coastal regions. In April 2021, 13 surface water samples were collected from Qinzhou Bay, in the northern Beibu Gulf. The DOM samples were characterized using dissolved organic carbon (DOC) analysis and UV-visible and fluorescence spectroscopy techniques. We determined the POM for the particulate organic carbon and nitrogen (POC and PN) and also isotopic composition (δ13C and δ15N). The weak to negligible relationships found between the DOC, colored and fluorescent DOM, salinity, and chlorophyll a together suggested that DOM’s distribution in Qinzhou Bay is concurrently shaped by various processes, namely, hydrological and in situ biological processes. A high C/N ratio of ~17, high POC/chlorophyll a ratio (253 ± 112), and depleted δ13C (−25.7 ± 1.6‰) confirmed that POM is highly degraded and originates mainly from allochthonous input, to which the terrigenous organic matter and freshwater phytoplankton each contributes 35%. The total organic carbon (TOC = DOC + POC) was positively correlated with the humic-like peak M, revealing the transformation of labile DOM and POM into recalcitrant DOM components. The in situ production efficiency of peak M in surface waters of Qinzhou Bay is one order of magnitude greater than that in inland waters or open oceans, indicating that not only temperature but also the activity of substrate is a key factor controlling the in situ production of recalcitrant DOM in Qinzhou Bay. High levels of TOC and humic-like fluorescent DOM suggest the mass coexistence of organic matter differing in its reactivity, highlighting the large potential for photochemical as well as microbial degradation in the future.
1 Introduction
Although coastal regions comprise less than 10% of the global ocean surface area, they play a disproportionately large role in primary production, carbon production, transformation, degradation, and burial (Gattuso et al., 1998; Castillo et al., 2010). Furthermore, coastal regions receive tremendous amounts of allochthonous organic matter (OM) via various sources, such as river runoff (Raymond and Spencer, 2015; Liu et al., 2020), atmospheric deposition (Willey et al., 2000), and submarine groundwater discharge (McDonough et al., 2022). This allochthonous OM delivered to coastal regions varies greatly in terms of its size, level, composition, and biogeochemical reactivity, resulting in distinct fates with profound implications for coastal ecosystems (Carlson and Hansell, 2015). The autochthonous sources, including phytoplankton production and microbial metabolism, can also make considerable contributions to the OM pool in coastal environments because of the high productivity supported by the sufficient supply of nutrients (Bauer et al., 2013). Moreover, global climate change (e.g., warming and extreme climatic events) and continued human pressures (e.g., agriculture, industry, and aquaculture) have drastically altered the hydrological and environmental contexts, thereby affecting the sources, sinks, and cycling dynamics of OM in coastal ecosystems (Diaz and Rosenberg, 2008; Doney, 2010; Liu et al., 2020). Yet, the key processes controlling OM transformation in coastal regions remain poorly understood or quantified, limiting our knowledge of how the coastal ocean affects the ocean carbon cycle and atmospheric CO2.
Unlike the dominance of dissolved OM (DOM) in reduced carbon pools of open ocean (Gardner et al., 2006, Hansell et al., 2009), particulate OM (POM) accounts for a considerable proportion of total OM in coastal regions due to large external inputs and substantial in situ phytoplankton production (Ji et al., 2021). Focusing on either the DOM or POM in coastal regions, with respect to its composition, sources, and sinks has led to them to being well understood, largely by applying key techniques such as elemental analyses, isotopic data and analysis (Sarma et al., 2014; Huang et al., 2020), optical properties (Stedmon et al., 2000, Guo et al., 2014), and molecular characterization (Wu et al., 2022). Yet, studies that simultaneously investigate POM and DOM in coastal ecosystems are still rare despite their likely active linkages, for example, regarding their sources, composition, and transformation (Li et al., 2018).
Examining optical properties (absorption and fluorescence spectrum) is an effective way to identify the origin of DOM in coastal ecosystems with various material sources (Stedmon et al., 2000, Guo et al., 2007; Guo et al., 2014, Zhu et al., 2018). Absorption coefficients at a certain wavelength (e.g., 254, 325 nm) and fluorescence intensities of several distinctive peaks (e.g., peak A, C, M, T) are commonly used as quantitative indicators of DOM components (Coble, 1996; Guo et al., 2007). The corresponding qualitative parameters, namely, spectral slope, specific absorbance, fluorescence index (FI), humification index (HIX), and biological index (BIX), provide a great deal of valuable information on the composition, sources, and reactivity of DOM (Ohno, 2002; Weishaar et al., 2003; Cory and McKnight, 2005; Helms et al., 2008; Huguet et al., 2009). The intensity of humic-like DOM always shows a positive relationship with apparent oxygen utilization (AOU) across the land–ocean aquatic continuum (Thottathil et al., 2013; Tanaka et al., 2014; Catalá et al., 2015; Catalá et al., 2016). This implies these DOM fractions are bio-recalcitrant and produced during microbial activity, accompanied by the consumption of oxygen. The in situ production efficiency of recalcitrant DOM per unit consumption of oxygen, this quantified as the slope of a linear regression between humic-like DOM and AOU, is known to be tightly linked to temperature in inland reservoirs, lakes, marginal basins, and the open ocean (Wang C. et al., 2021; Qu et al., 2022). Accordingly, we may infer that temperature is a key factor shaping the microbial-driven transformation of labile OM into recalcitrant carbon. Yet, this transformation in coastal OM cycling has received little attention when compared with inland and oceanic waters (Wang C. et al., 2021; Qu et al., 2022).
Stable isotopes of carbon (δ13C) and nitrogen (δ15N) are widely used in the tracing and source analysis of POM in coastal environments (Wu et al., 2003; Ye et al., 2017; Sarma et al., 2020; Gao et al., 2021). POM originates from various sources and has correspondingly different values of δ13C, offering the good opportunity to reliably identify the sources of POM in coastal regions. For example, the δ13C value of C3 plants in terrestrial ecological environments ranges from −32 to −23‰, whereas C4 plants have relatively less negative δ13C values (−17 to −9‰). Marine-derived OM tends to have moderate δ13C values ranging from −22 to −19‰ (Boutton, 1991; Meyers, 1994; Meyers, 1997). Similarly, the δ15N of POM from different sources takes on specific end-member values; hence, it is another robust tracer for identifying OM sources, especially for the signal of sewage (Kendall, 1998; Maksymowska et al., 2000; Lu et al., 2021). In addition, the C/N ratio and ratio of particulate organic carbon to chlorophyll a (POC/Chl a) have been applied widely to distinguish the POM sources (marine vs. terrestrial, fresh vs. degraded) (Cifuentes et al., 1988). Therefore, knowing the distribution and variation in not only the δ13C and δ15N but also the C/N and POC/Chl a ratios is crucial to elucidate the sources of POM and potential interactions occurring between POM and DOM in coastal ecosystems.
Qinzhou Bay, in the northern Beibu Gulf, has undergone several decades of rapid economic growth, receiving from anthropogenic activities vast material inputs, such as nutrients (Lai et al., 2014), heavy metals (Zhu and Zheng, 2013), organic pollutants (Lao et al., 2021), and microplastics (Zhu et al., 2019; Zhu et al., 2022b). Not surprisingly, the cycling and budget of OM has changed as well. This provides an ideal marine region to learn more about the sources, compositions, and transformations of OM in coastal ecosystems under high pressure from human activities. This study had three objectives: (1) to determine the levels and distributions of DOM and POM in Qinzhou Bay based on DOM optical parameters and POM elemental and isotopic analyses; (2) to clarify the sources of various DOM and POM fractions according to basic hydrological, chemical, and biological parameters; (3) to understand the interaction between POM and DOM and quantify the in situ production efficiency of recalcitrant DOM. Altogether, the findings should provide further insight into the turnover of OM in coastal ecosystems.
2 Materials and methods
2.1 Study area
Qinzhou Bay is one of the important bays in the middle part of Guangxi inshore in the northern Beibu Gulf. It is a typical drowned valley-type, semi-enclosed bay covering about 400 km2 of water. The whole bay is gourd-shaped and its overall composition consists primarily of an inner bay (Maowei Sea) and outer bay. This study mainly focuses on the area of intense water exchange in the outer bay (Figure 1). Two major rivers flow into Qinzhou Bay, the Qin and Maoling Rivers, whose runoff discharge is up to 1.49 × 10¹¹ m3 yr-1, or ~45% of total river discharge flowing into the northern Beibu Gulf. More than 80% of the water discharge occurs in the wet season (i.e., April to October) (Lai et al., 2014). Qinzhou Bay is a crucial fishing ground and aquaculture base in the Beibu Gulf given its the year-round warm temperatures and rich nutrients. Additionally, the Qinzhou port and city strongly impact the biogeochemistry and ecology of Qinzhou Bay and the northern Beibu Gulf.
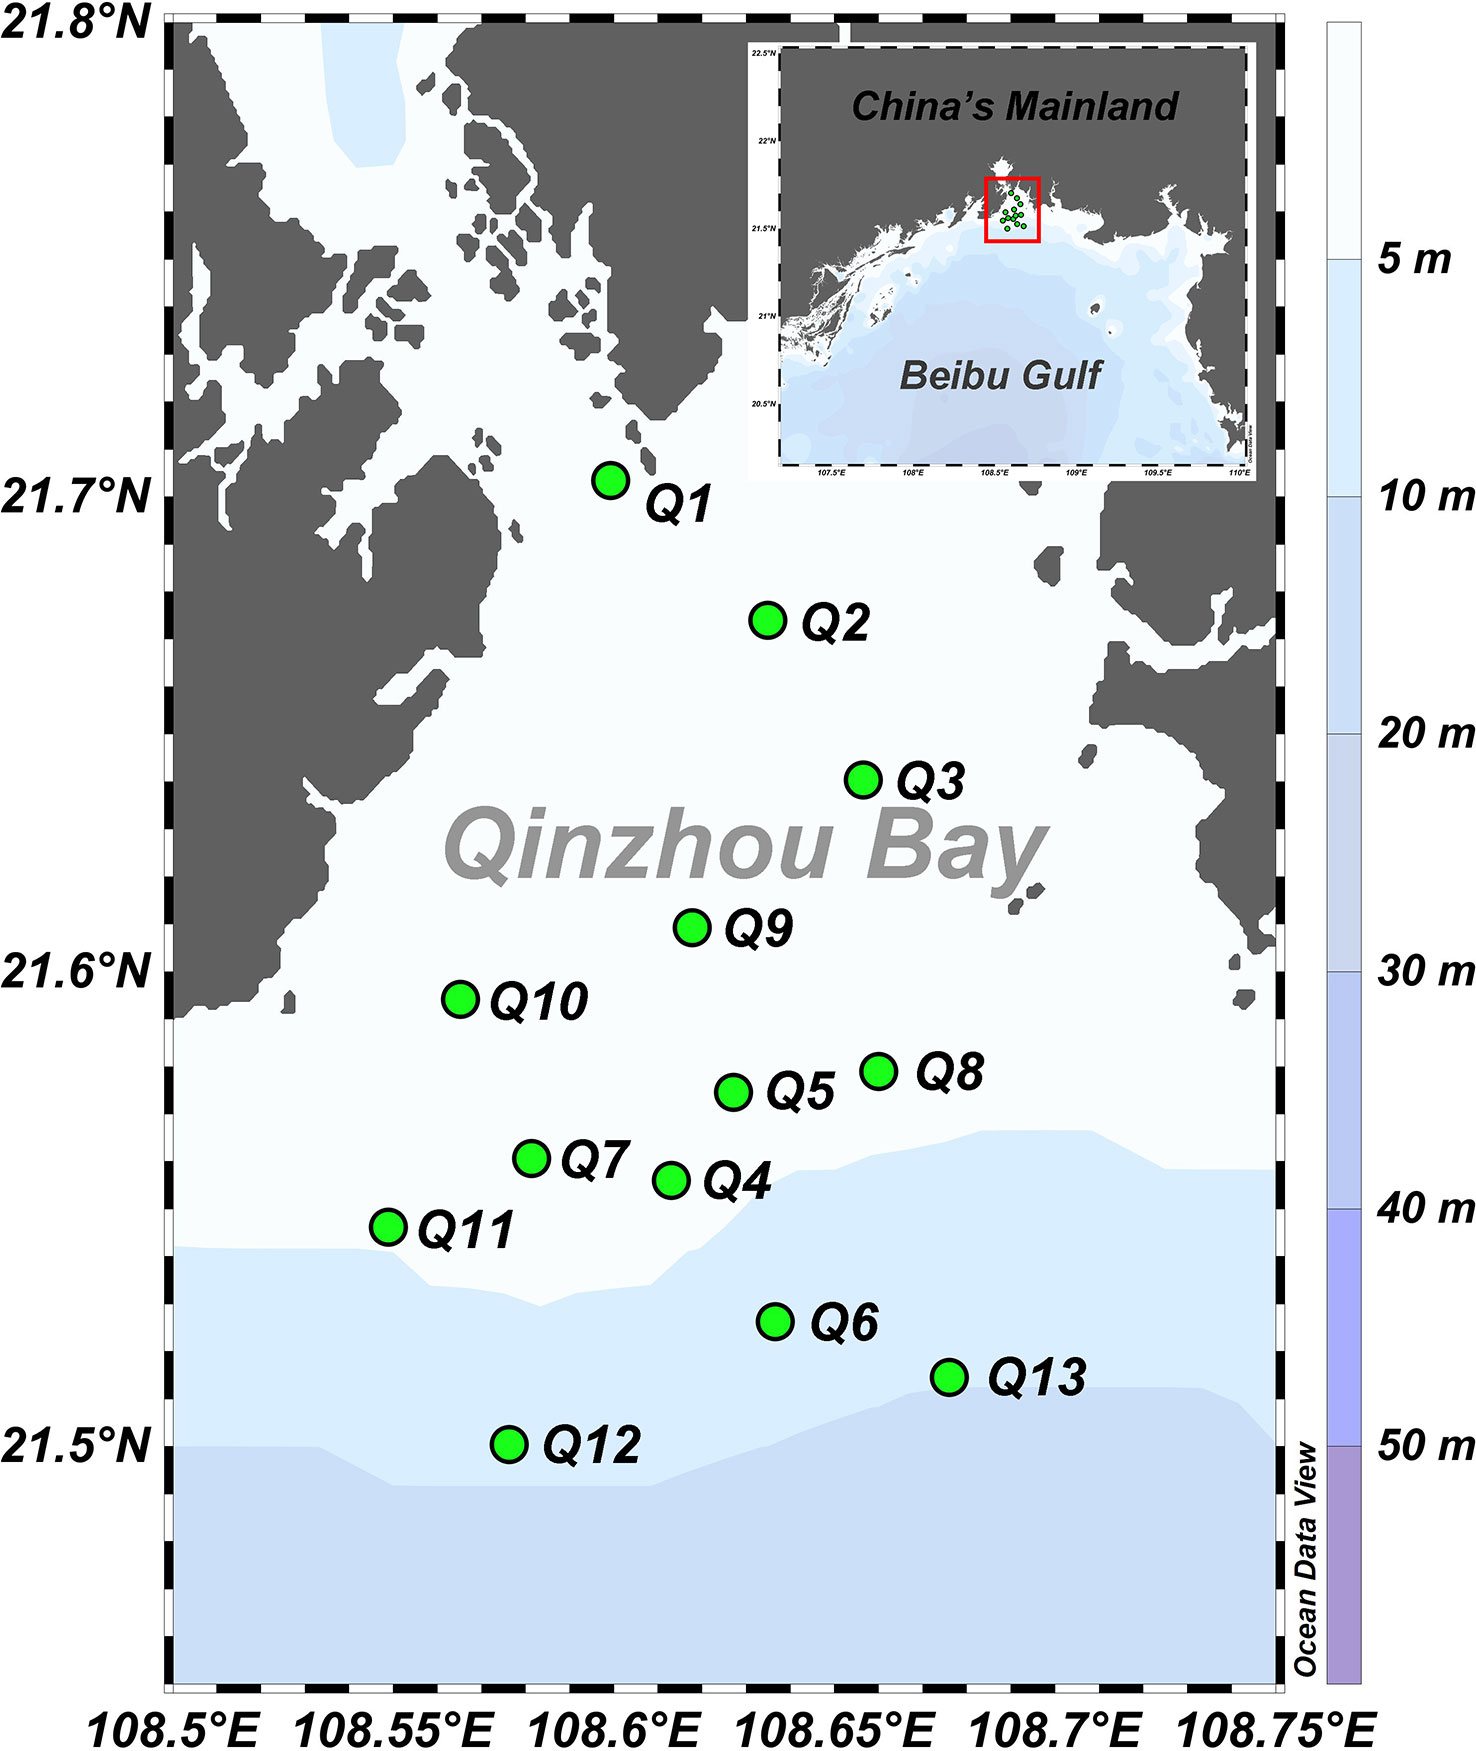
Figure 1 Map showing the locations of the 13 surface water sampling stations in Qinzhou Bay, northern Beibu Gulf.
2.2 Sampling and pretreatments
A field-sampling cruise across the Qinzhou Bay, northern Beibu Gulf, South China Sea, was conducted on 8 April 2021. The water temperature and salinity at 13 stations were measured using a calibrated SBE911 conductivity-temperature-depth (CTD) system (Sea-Bird, Bellevue, Washington, USA). At all stations, surface seawater samples were collected using a Niskin bottle at a depth of ~0.5 m below the water surface (Figure 1). The original seawater was sampled for its dissolved oxygen (DO). After their collection, the samples were filtered through pre-cleaned MF-Millipore™ filters (pore size: 0.45 μm) and stored in pre-heated (500°C, 5h) glass vials. All samples were kept frozen until analyzed for nitrate, nitrite, phosphate, colored DOM (CDOM), and fluorescent DOM (FDOM). Samples for the dissolved organic carbon (DOC), total suspended matter (TSM), chlorophyll a (Chl a), POC, PN, δ13CPOC, and δ15NPN analyses were then immediately filtered through pre-heated (500°C, 5h) GF/F filters (Whatman, nominal pore size = 0.7 μm). Acidified filtrate (H3PO4, pH< 2) was likewise stored in pre-heated glass vials with Teflon-lined caps and kept frozen until the DOC analysis. Filter membranes for the analyses of particulate parameters (i.e., TSM, Chl a, POC PN, δ13CPOC, and δ15NPN) were stored frozen as well. The analyses of DO were completed within 8h, and other analyses were finished within 3 days since sampling.
2.3 Measurements of environmental parameters
The DO was immediately measured using the Winkler titration method (Carpenter, 1965), with a precision of 0.07 mg liter-1, and its saturation calculated using the salinity and potential temperature (Benson and Krause, 1984). The AOU was calculated as the difference between the calculated saturation and measured DO concentration. Chl a was extracted using 90% aqueous acetone in the dark for 24h at 4°C and then measured by a Turner Trilogy fluorometer (Welschmeyer, 1994). The concentrations of nitrate (NO3-N), nitrite (NO2-N), and soluble reactive phosphate (SRP) were determined using a San++ continuous flow analyzer (Skalar, Netherlands), while the NH4-N concentration was measured by spectrophotometry. Dissolved inorganic nitrogen (DIN) was calculated as the sum of NO3-N, NO2-N and NH4-N concentration values. Quality control was conducted based on the detection limits for DIN and SRP, which were 0.1 and 0.03 μmol liter-1, respectively. The N/P was calculated as the ratio of DIN and SRP.
2.4 Measures of dissolved organic matter parameters
The DOC concentrations were measured on an Elementar Vario TOC Cube in the high-temperature catalytic oxidation mode (Wang C. et al., 2021). A five-point standard curve was generated using KHP (potassium hydrogen phthalate). For the running blank, it was determined as the average peak area of the Milli-Q water acidified with H3PO4. Next, DOC concentrations were obtained by subtracting that running blank from the average peak area of the samples (injected two to three times) and dividing by the slope of the standard curve. The analytical precision of the DOC analysis was< 3%; this based on deep sea water (DSR) provided by the Hansell Lab at the University of Miami (https://hansell-lab.rsmas.miami.edu/consensus-referencematerial/index.html).
Absorbance spectra for CDOM were obtained using a Shimadzu UV-1780 dual beam spectrophotometer and 10-cm quartz cuvettes at room temperature (Wang C. et al., 2021). Absorbance (Aλ) was quantified from 800 to 240 nm at a 0.5-nm interval. The fresh Milli-Q water spectrum was scanned to provide the blank. Absorbance was corrected accordingly by subtracting the blank of Milli-Q water and then converting to a Napierian absorption coefficient, aλ (m-1) using this equation:
Absorption coefficients at 254 and 325 nm are reported here, because both have been widely used for quantifying CDOM in marine environments (Benson and Krause, 1984; Nelson et al., 2010; Wang C. et al., 2021). The spectral slope over the range of 275–295 nm (S275-295, nm-1) was calculated from a linear regression of the natural log-transformed absorption spectra (Helms et al., 2008). The specific ultraviolet absorbance at 254 nm (SUVA254, m2 g-1 C) was calculated by dividing the decadal absorption coefficient (i.e., A254/0.1) by the DOC concentration in units of mg C liter-1 (Bergamaschi et al., 2003).
To obtain the fluorescence excitation–emission matrices (EEMs), a Hitachi F-7100 fluorescence spectrofluorometer was used with a 1-cm quartz cuvette when the sample is at room temperature (Wang C. et al., 2021). Briefly, emission (em) scans from 280 to 600 nm were recorded at 2-nm intervals with excitation (ex) wavelengths ranging from 240 to 450 nm at 5-nm intervals (the slit widths were set to 5 nm). To apply the inner filter correction, an absorbance-based approach was used (Kothawala et al., 2013). The EEMs were blank-corrected and normalized by respectively using the EEMs and Raman spectra of freshly generated Milli-Q water; hence, fluorescence intensity is reported in Raman units (RUs) (Lawaetz and Stedmon, 2009).
Based on contour plots, we determined two humic-like components (peak C, ex/em: 260/450 nm and peak M, ex/em: 300/400 nm) and one protein-like component (peak T, ex/em: 275/340 nm); all three are ubiquitous in marine environments (Coble, 1996). In addition to this, three common fluorescence parameters based on the EEMs were derived to infer the sources, composition, and properties of DOM (Wang C. et al., 2021). The FI was calculated as the ratio of the emission intensity at 470 nm to that at 520 nm when excited at 370 nm (Cory and McKnight, 2005). The HIX was calculated as the integrated emission spectra area at 435–480 nm divided by the summed 300–340 nm plus 435–480 nm emission areas, obtained via excitation at 254 nm (Ohno, 2002). The BIX was calculated as the ratio of fluorescence intensity emitted at 380 nm to the intensity emitted at 430 nm, upon excitation at 310 nm (Huguet et al., 2009).
2.5 Measures of particulate organic matter parameters
To obtain the concentration of TSM, the dry weight difference between the pre-weighed and re-weighed values was divided by the filtration volume (Zhou et al., 2021). The filters used for analysis of the concentrations of POC and PN and the values of δ13CPOC and δ15NPN were tightly packed into a tin cup, and those response variables quantified with an element analyzer coupled to a stable isotope ratio mass spectrometer (EA Isolink-253 Plus, Thermo Fisher Scientific, Bremen, Germany). Before running the analysis, the filters were exposed to a concentrated HCl vapor for at least 48h to remove any carbonate, after which the HCl was removed in a caustic soda dryer for at least 48h (Sato et al., 2006; Ke et al., 2019). The references for δ13C and δ15N are Vienna Pee Dee Belemnite (VPDB) and atmospheric N2, respectively. The average standard deviation of POC or PN concentrations was ±0.1%, and that of δ13CPOC or δ15NPN was ± 0.2‰. The ratio of POC to PN (C/N) and that of POC to Chl a (POC/Chl a) are reported in this study.
2.6 Estimation of proportional contributions of particulate organic matter
To quantify the contribution of various sources to the POC pool in the northern Beibu Gulf, an isotope mixing model “Stable Isotope Analysis in R (SIAR)” was used (http://cran.rproject.org/; Parnell, 2008). This model has been successfully used elsewhere to estimate the proportional contributions of major sources to POM in coastal ecosystems (Krishna et al., 2013; Sarma et al., 2014; Huang et al., 2020). The selection of the end-member values is pivotal for obtaining reliable estimates of the respective proportion of possible sources. Here, six end-members were used in the model processing, as suggested by previous studies (Table 1).
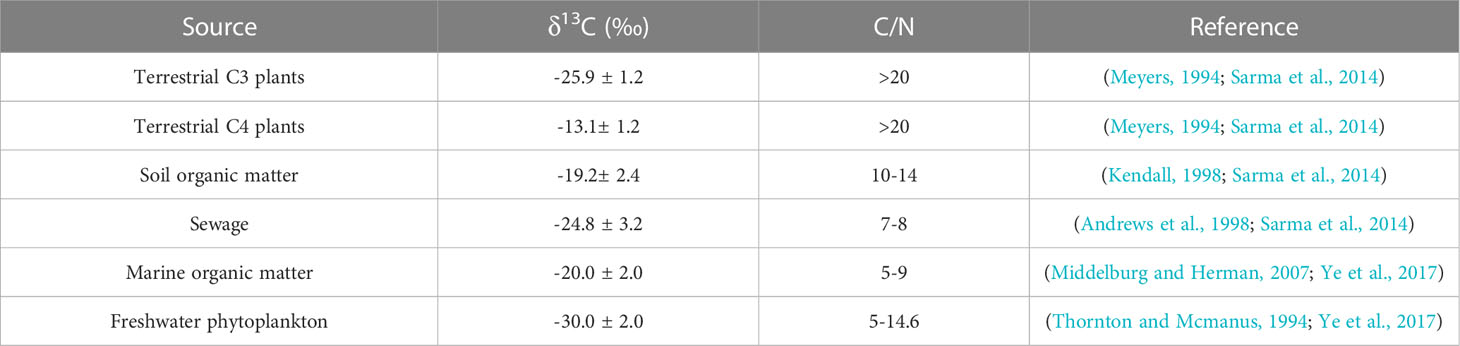
Table 1 The end-member values of δ13CPOC and C/N for the potential POM sources used in this study.
2.7 Statistical analyses
Pearson correlation analyses among the environmental variables, DOM, and POM parameters were performed using OriginPro 2022b software, for which the significance level (p-value) was determined by a two-tailed test.
3 Results
3.1 Hydrographic and environmental properties
The salinity and temperature of surface waters in Qinzhou Bay varied over a small range of 29.89–31.53°C and 24.4–26.0°C, respectively (Figures 2A, B). High salinity was recorded in the offshore waters of Qinzhou Bay (Figure 2A). The concentrations of DO changed over a minimal range of 6.4–7.0 mg liter-1, with higher values at the inshore stations (Figure 2C). The DO saturation changed from 93% to 102% while the AOU varied from −0.18 to 0.49 mg L-1 with an average value ± SE of 0.24 ± 0.19 mg L-1 (Figure 2D). Positive AOU values were found for 11 stations, the exceptions being two offshore stations (Q11 and Q13). For DIN, its concentration was highly variable, ranging between 2.38 and 21.19 μmol liter-1, whereas the SRP concentration fell within a narrow range of 0.15–1.06 μmol L-1. However, DIN and SRP shared a similar distribution pattern, in that their concentrations gradually decrease from inshore to offshore waters (Figures 2E, F). Yet, the difference in concentration of DIN between the three inshore stations (Q1, Q2, and Q3) and other offshore stations was much larger than that of SRP (Figures 2E, F). Thus, the N/P varied largely within the range of 6.9– 36.1. High N/P-values (> 16) were found at the inshore stations (Figure 2G). The concentration of Chl a ranged from 1.7 to 4.5 µg L-1, averaging 2.45 µg L-1. Apart from the maximum Chl a concentration found at station Q7, Chl a concentration varied little (Figure 2H).
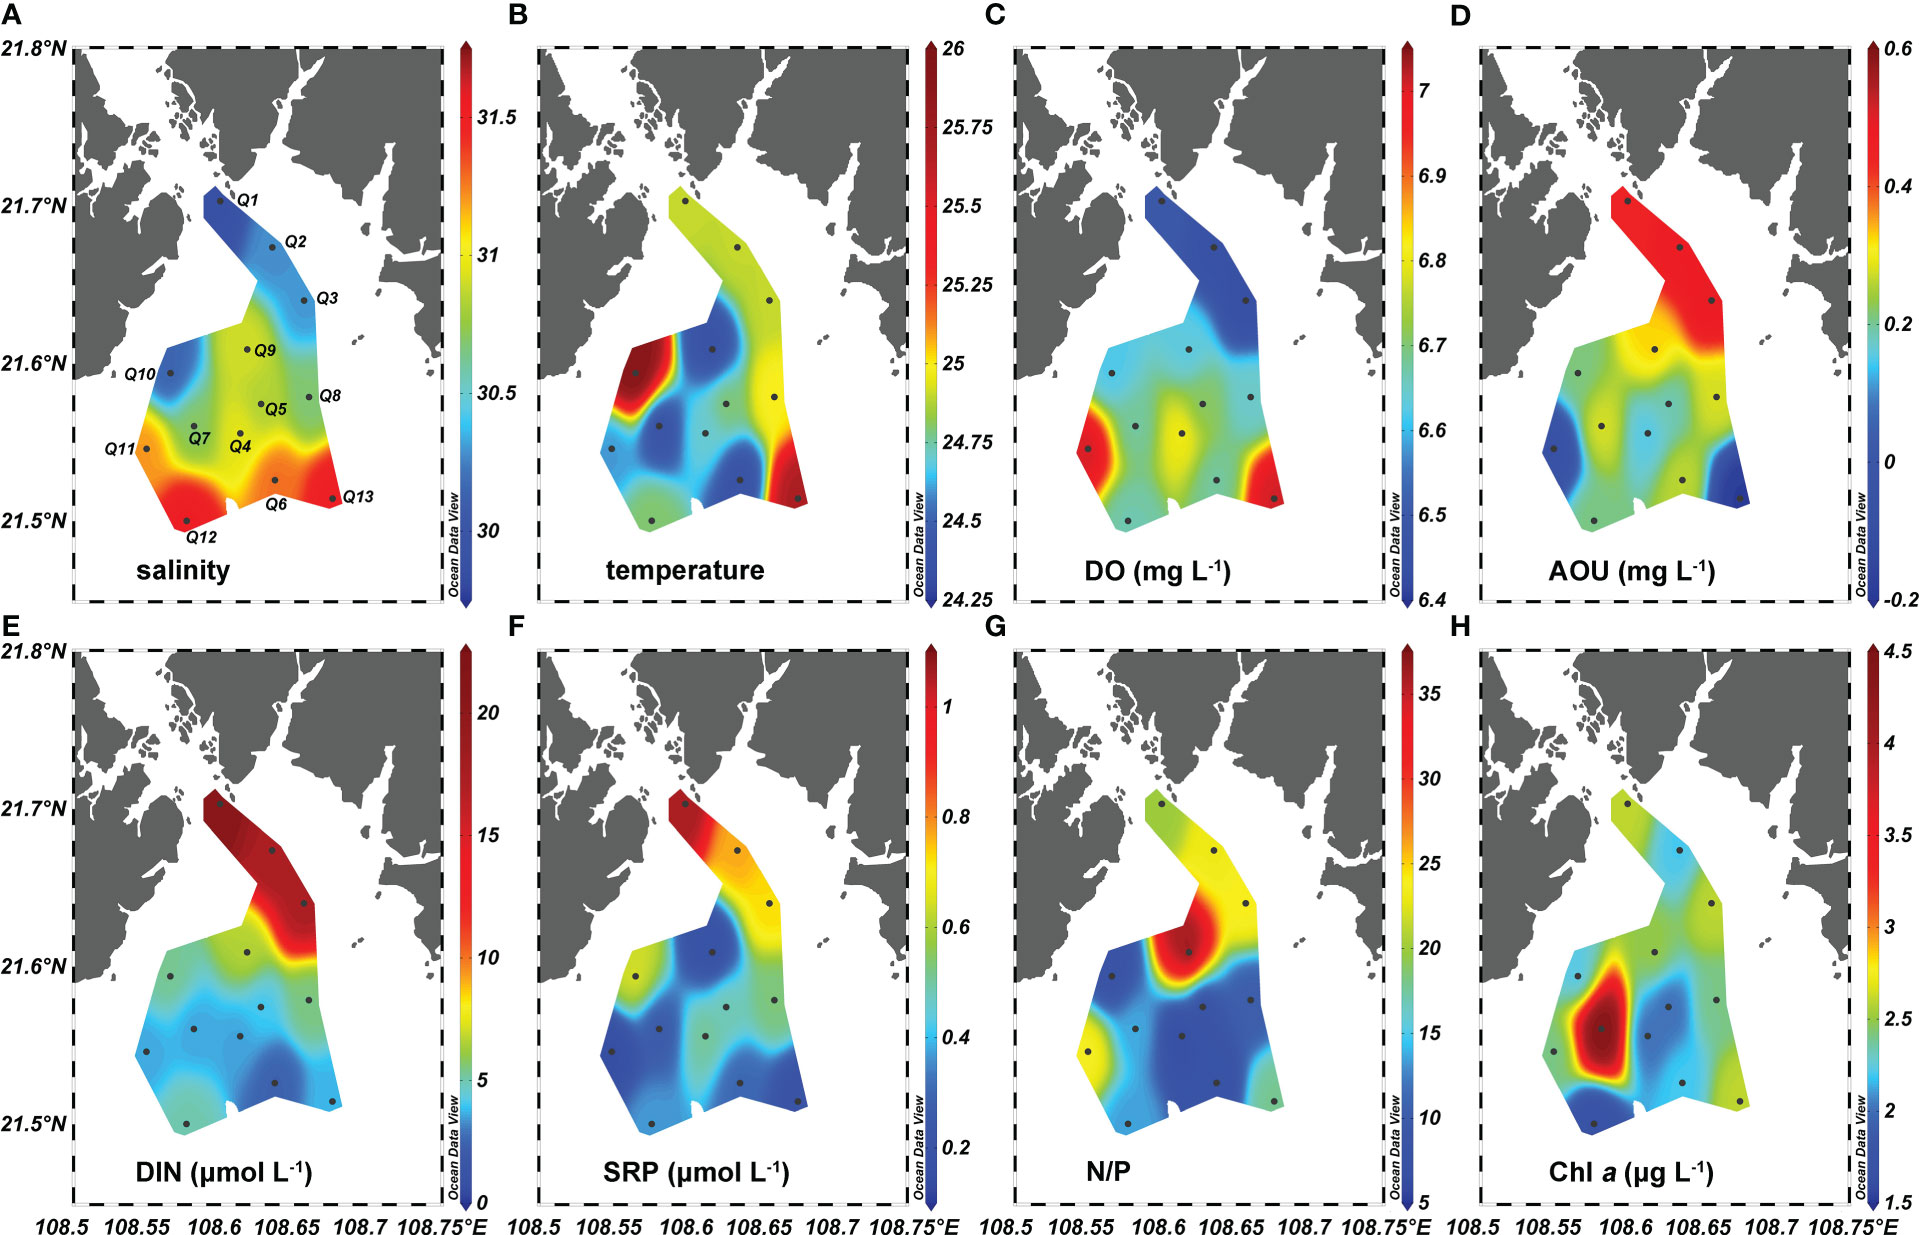
Figure 2 Spatial distributions of (A) salinity, (B) temperature, (C) dissolved oxygen (DO), (D) apparent oxygen utilization (AOU), (E) dissolved inorganic nitrogen (DIN), (F) soluble reactive phosphate (SRP), (G) the ratio of DIN and SRP (N/P), and (H) chlorophyll a (Chl a) in the surface water of Qinzhou Bay. Black dots show the sampling stations and are labeled in (A).
3.2 Distributions and correlations of dissolved organic matter parameters
The DOC concentration varied from 75.8 to 154.2 μmol L-1 and averaged 113.9 ± 23.1 μmol L-1 (Figure 3A). There was a strong positive correlation between the absorption coefficient at 254 nm (a254) and 325 nm (a325) (r = 0.98, p< 0.001, n = 13). Hence, for simplicity, we report only the a325 results. The a325 ranged from 0.41 to 0.81 m-1 (Figure 3B). The intensity of humic-like peaks C and M, respectively, spanned 1.18 to 2.28 × 10⁻² RU and 3.21 to 6.27 ×10⁻² RU (Figures 3C, D), whereas the protein-like peak T varied over a large range of 3.96–9.56 × 10⁻² RU (Figure 3E). DOC had moderate positive correlations with a325 (r = 0.59, p = 0.03, n = 13), peak M (r = 0.59, p = 0.03, n = 13), and peak T (r = 0.82, p< 0.001, n = 13), but was not correlated with the intensity of peak C (p > 0.05). Regarding a325, it showed significant relationships with the intensities of peak C (r = 0.82, p< 0.001, n = 13), peak M (r = 0.82, p< 0.001, n = 13), and peak T (r = 0.82, p = 0.003, n = 13). Accordingly, the three FDOM peaks had significantly correlated intensities (p< 0.05, Table 2).
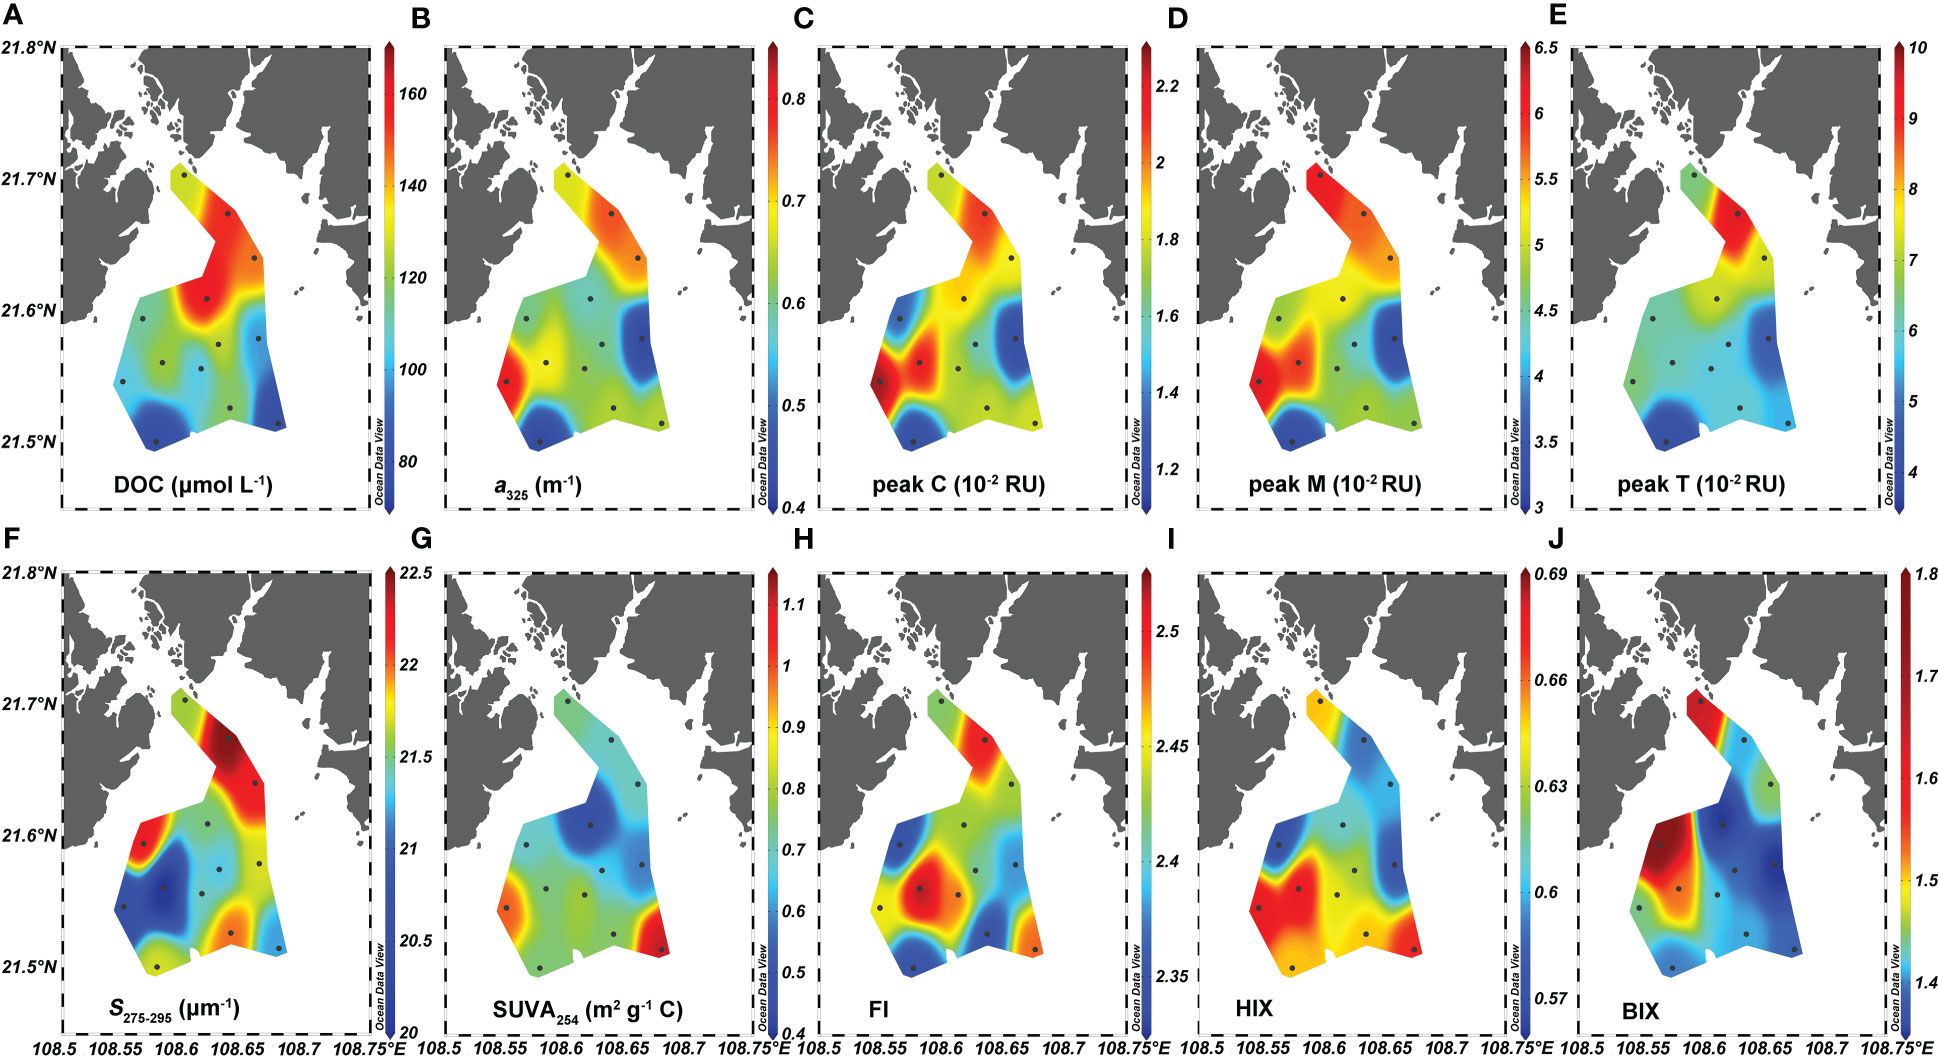
Figure 3 Distributions of (A) dissolved organic carbon (DOC), (B) absorption coefficient at 325 nm (a325), (C) peak C, (D) peak M, (E) peak T, (F) spectral slope (S275-295), (G) specific ultraviolet absorbance at 254 nm (SUVA254), (H) fluorescence index (FI), (I) humification index (HIX), and (J) biological index (BIX) in the surface water of Qinzhou Bay.
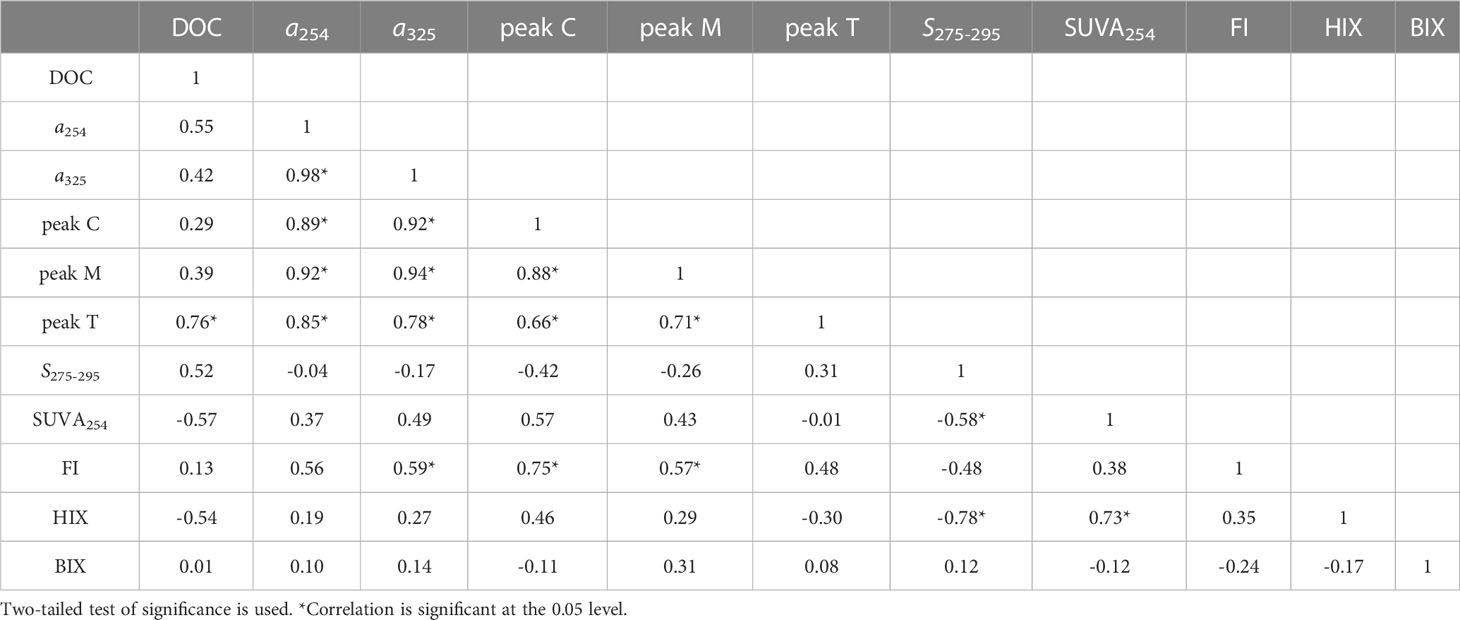
Table 2 Coefficients (r values) of Pearson correlations between DOM parameters.
The spectral slope, S275-295, varied minimally from 20.0 to 22.5 μm -1 (Figure 3F). The variation in SUVA254 was more than twofold, spanning 0.45 to 1.11 m2 g-1 C (Figure 3G); FI ranged between 2.35 and 2.50 (Figure 3H); and HIX and BIX varied from 0.58 to 0.68 and 1.35 to 1.79, respectively (Figures 3I, J). The S275-295 was negatively correlated with HIX (r = −0.76, p = 0.003, n = 13), as was SUVA254 with the DOC concentration (r = −0.62, p = 0.02, n = 13) although it positively correlated with HIX (r = 0.67, p = 0.01, n< 13). FI had significant correlations with a325 in addition to peak C, and peak M (r = 0.56–0.75, p< 0.05, n = 13). By contrast, BIX was not significantly correlated with DOM’s other quantitative and qualitative parameters (p > 0.05).
3.3 Distributions and correlations of particulate organic matter parameters
The concentration of TSM ranged from 13.7 to 30.8 mg L-1 at 10 offshore stations (except for Q1, Q2, and Q3), being highest at station Q12 and lowest at station Q10 (Figure 4A). The concentrations of POC and PN ranged fourfold from 27.9 to 122.0 μmol L-1 (51.1 ± 26.5 μmol L-1) and from 0.9 to 4.0 μg L-1 (2.8 ± 0.9 μmol L-1), respectively (Figures 4B, C). A high POC concentration was found at stations Q1 and Q8, while other stations featured low and similar POC values. Compared with that of POC, the spatial distribution of PN was more complex and unstable. Low PN values (< 1.5 μnol L-1) characterized two offshore stations (Q10 and Q12), while all other stations showed high and comparable PN values.
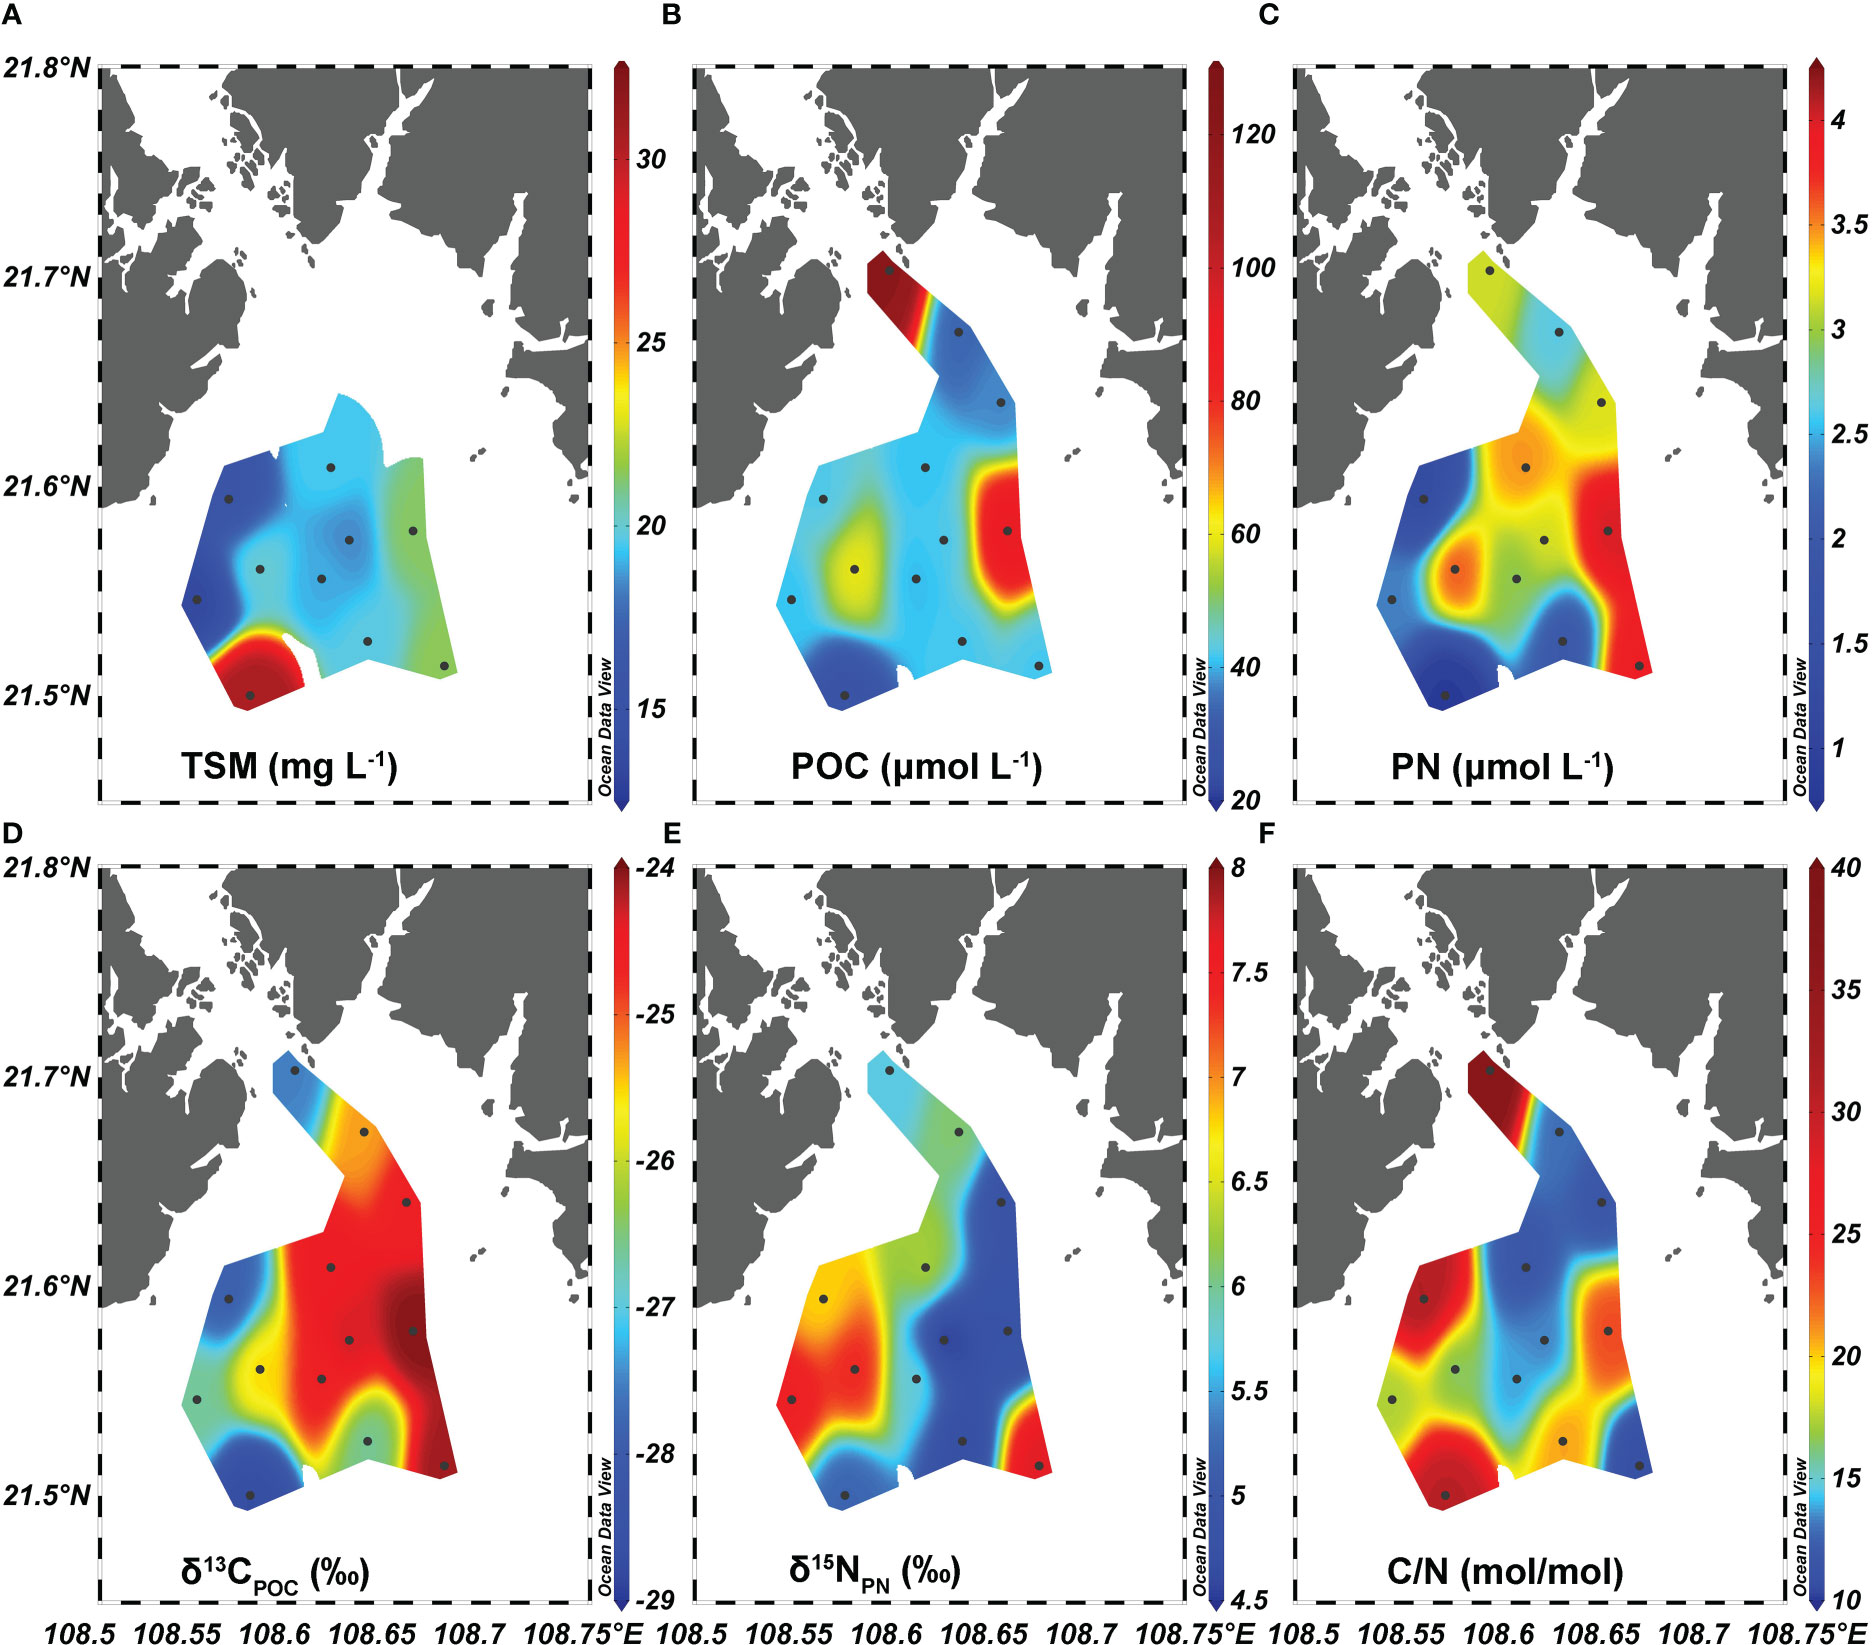
Figure 4 Distributions of (A) total suspended matter (TSM), (B) particulate organic carbon (POC), (C) particulate nitrogen (PN), (D) δ13CPOC, (E) δ15NPN, and (F) C/N ratio in the surface water of Qinzhou Bay.
Negligible correlations were found between TSM, POC, and PN in this region (p > 0.05). The δ13CPOC varied from −28.7 to −24.0‰, with an average of −25.7 ± 1.6‰. The δ13CPOC was strongly correlated with the PN concentration (r = 0.84, p< 0.001, n = 13) and followed a similar distribution pattern to PN (Figures 4C, D). Isotopically heavy δ15NPN ranged from 4.5 to 7.7‰ (6.0 ± 1.1‰, Figure 4E), but it was apparently not associated with other POM parameters (p > 0.05). The C/N ratio (mol/mol) varied over a large range of 10.8 to 33.3, with an average of 16.7 ± 17.8 (Figure 4F).
4 Discussion
4.1 Microbial reprocessing dominates the dissolved organic matter pool in Qinzhou Bay
The water and material sources of coastal ecosystems (e.g., water mass movement, in situ primary productivity, and external inputs) constrain their various possible DOM sources (e.g., autochthonous, terrestrial, and anthropogenic sources) and distribution patterns (e.g., conservative, net additional, and net removal pattern) (Stedmon et al., 2000; Guo et al., 2007; Guo et al., 2014). Previous studies have demonstrated that optical parameters could provide valuable information concerning the source, composition, and transformation of DOM in marine environments (Yang et al., 2015; Zhu et al., 2018; Zhu et al., 2022a). Here, optical parameters clearly revealed the major source of DOM in the surface waters of Qinzhou Bay. The range of FI (2.35–2.50), it widely used to classify DOM sources with FI values of > 1.9 as autochthonous (i.e., microbial- or phytoplankton-derived), suggested the dominance of autochthonous input on the DOM in Qinzhou Bay (Figure 3) (Fellman et al., 2010). The values of S275-295 (20.0–22.5 μm-1) and HIX (0.57–0.69) also indicated that DOM originated from a dominant source with a narrow range for molecular weight, aromaticity, and humification degree (Figure 3). In terms of this autochthonous input, phytoplankton-derived DOM is rich in labile molecules (e.g., dissolved amino acids), which would increase S275-295 (Fenchel et al., 2012). However, microbial processes can shift S275-295 opposite to those caused by primary production (Moran et al., 2000; Helms et al., 2008; Fenchel et al., 2012). We found that S275-295 values on par with those in the aphotic oceanic waters, where DOM is highly reworked by microbial communities (Wang et al., 2017). Meanwhile, the positive values of AOU (7.4 ± 6.1 μmol liter-1) were observed in the surface waters of Qinzhou Bay, even though oxygen could be replenished via the air–sea interface exchange process and net primary production. Taken together, these results confirmed that DOM in Qinzhou Bay mainly arises from in situ microbial activities. Such low S275-295 values also suggest a great potential of DOM for photochemical degradation, accompanied by the rapid release of CO2 (Helms et al., 2008).
Considering the distinct distribution patterns observed among bulk DOC, CDOM, and humic-like FDOM (Figures 3A–F) and the weak correlations between these parameters (Table 2), we may infer that, once produced by phytoplankton photosynthesis, their distributions are subject to multiple biogeochemical processes (Carlson and Hansell, 2015). That, a significant relationship was found only between DOC, and salinity suggests the former’s distribution is mainly determined by the mixing of water masses (Figure 5A). The R2 value of 0.52 for the linear fit of DOC versus salinity suggests that other factors (e.g., primary production and microbial degradation) may considerably affect the distribution of DOC in the study region. However, the negligible relationships between CDOM, FDOM, and salinity indicated that biogeochemical processes could be driving the distributions of CDOM and FDOM, and not the conservative mixing of water masses (Figures 5B–D). There were also no noteworthy correlations between DOC, CDOM, FDOM, and Chl a (p > 0.05), suggesting these do not directly originate from phytoplankton production. This is consistent with the above result that DOM in Qinzhou Bay is highly reprocessed by microbial communities. Other research has shown that the labile protein-like peak T and a small amount of humic-like FDOM could come from growing phytoplankton, while the recalcitrant humic-like materials are mostly produced microbially, with the consumption of oxygen and labile organic materials (Rochelle-Newall and Fisher, 2002; Stedmon and Markager, 2005; Raymond and Saiers, 2010; Xiao et al., 2021). The transition from labile OM to recalcitrant DOM as mediated by heterotrophic microbes could be facilitated under the conditions of warm temperature (~25°C), sufficient nutrients, and high productivity (Figure 2; Carlson et al., 2007). Their confluence could be the major factor responsible for the uncoupling between DOC, CDOM, and FDOM and the various correlations between DOM and salinity (Table 2, Figure 5).
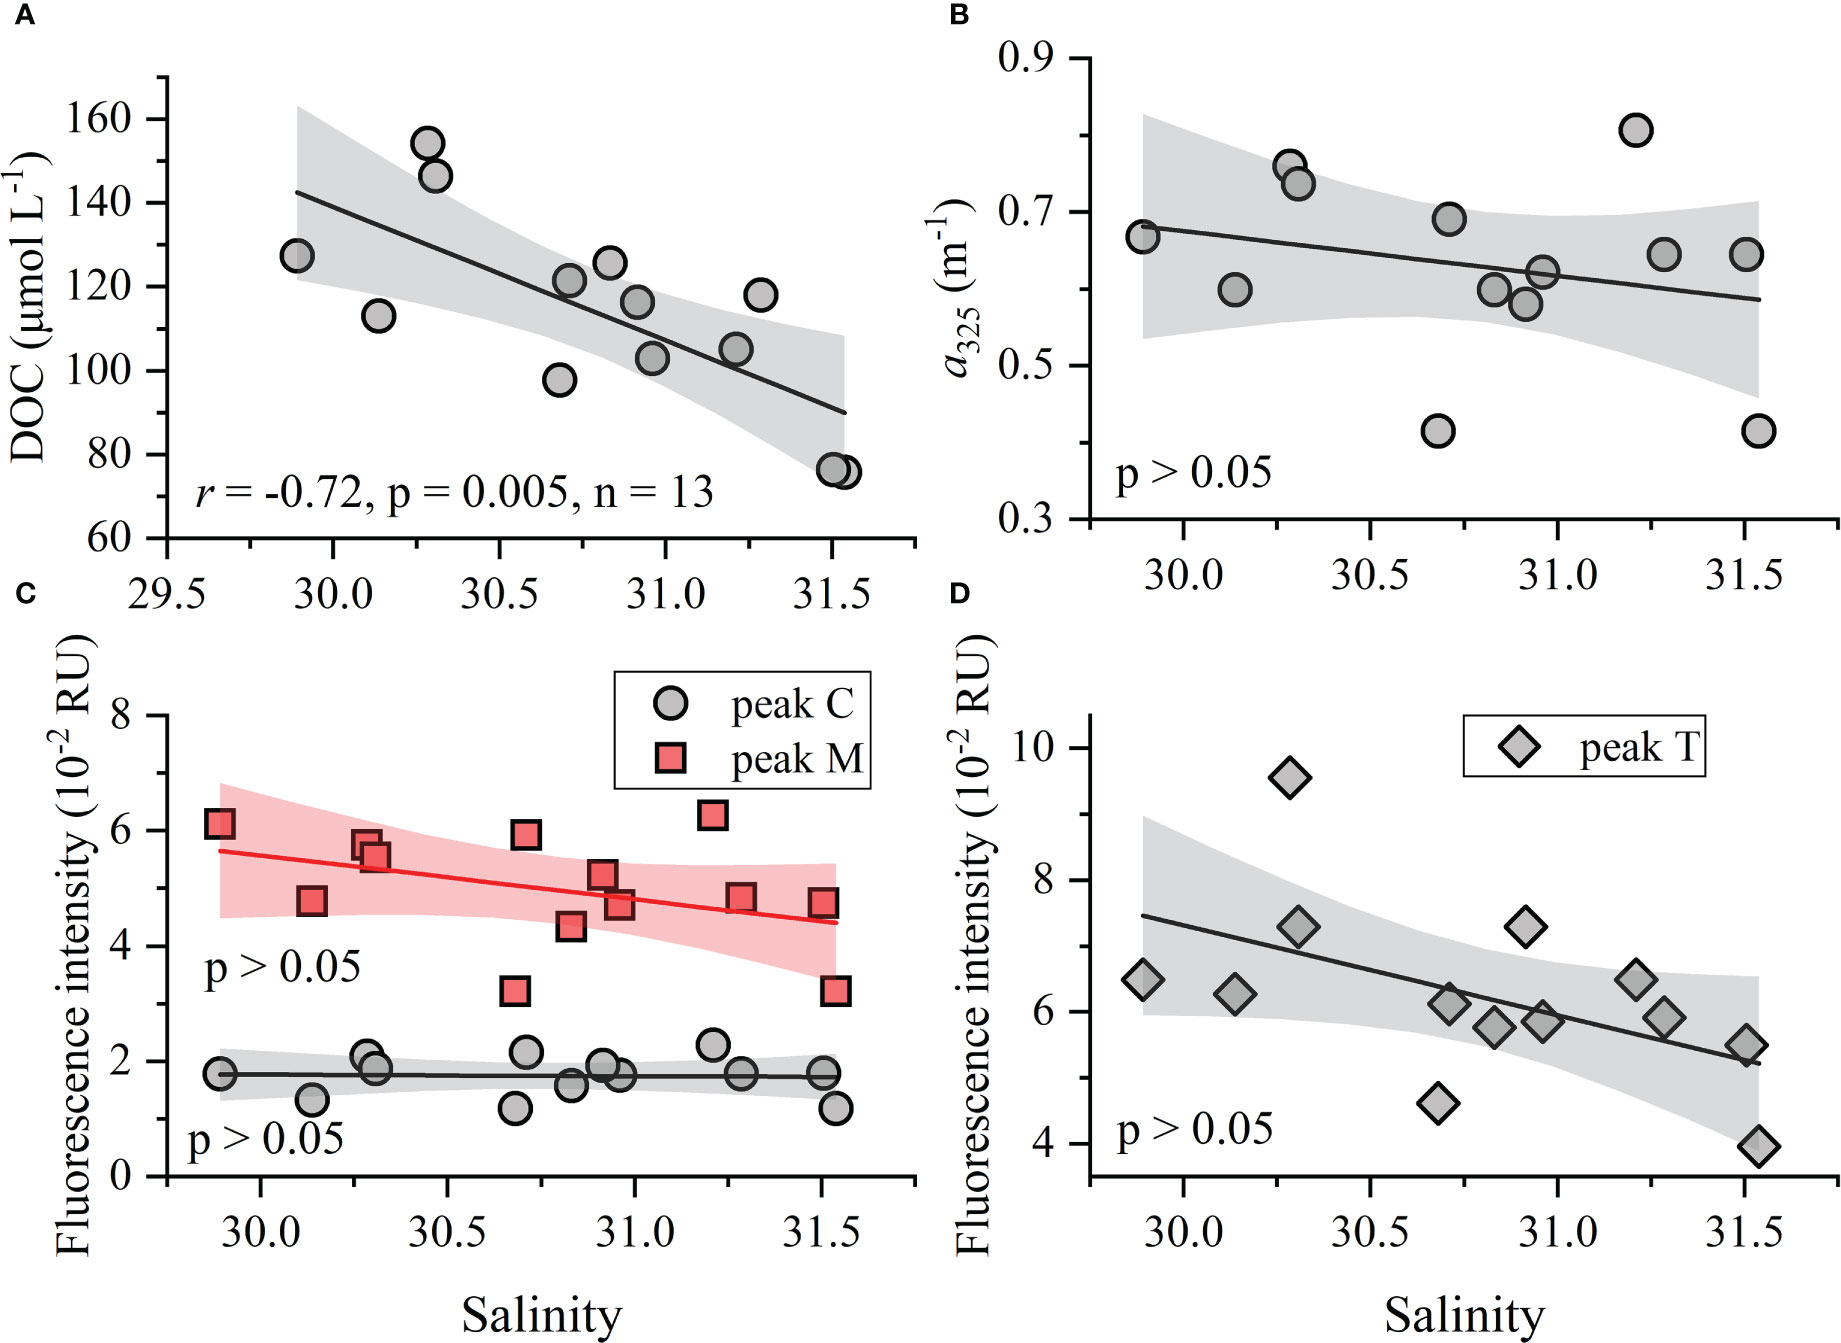
Figure 5 Relationships between DOC, CDOM, FDOM, and salinity. Shading represents the 95% confidence bands for the fitting regression lines.
4.2 Multiple sources of POC and PN
The POM in marine environments can originate from allochthonous sources and the in situ biological processes (Ye et al., 2016). In our study, POC and PN are not correlated (p > 0.05), which differs from the linear relationships found in the marine POM dominated by phytoplankton (Zhou et al., 2021). The POC shows no correlation with Chl a (p > 0.05), whereas the PN is significantly related to Chl a when the outlying high Chl a value of 4.5 μg liter-1 is excluded (Figures 6A, B). This would seem to indicate that POC and PN are dominated by different source; a low contribution from in situ phytoplankton production to the POC is perhaps tenable. This finding contrasts with general trends in high-productivity estuarine and coastal environments (e.g., Pearl River estuary, Daya Bay), where POC mainly stems from phytoplankton production (Ke et al., 2017; Huang et al., 2020).
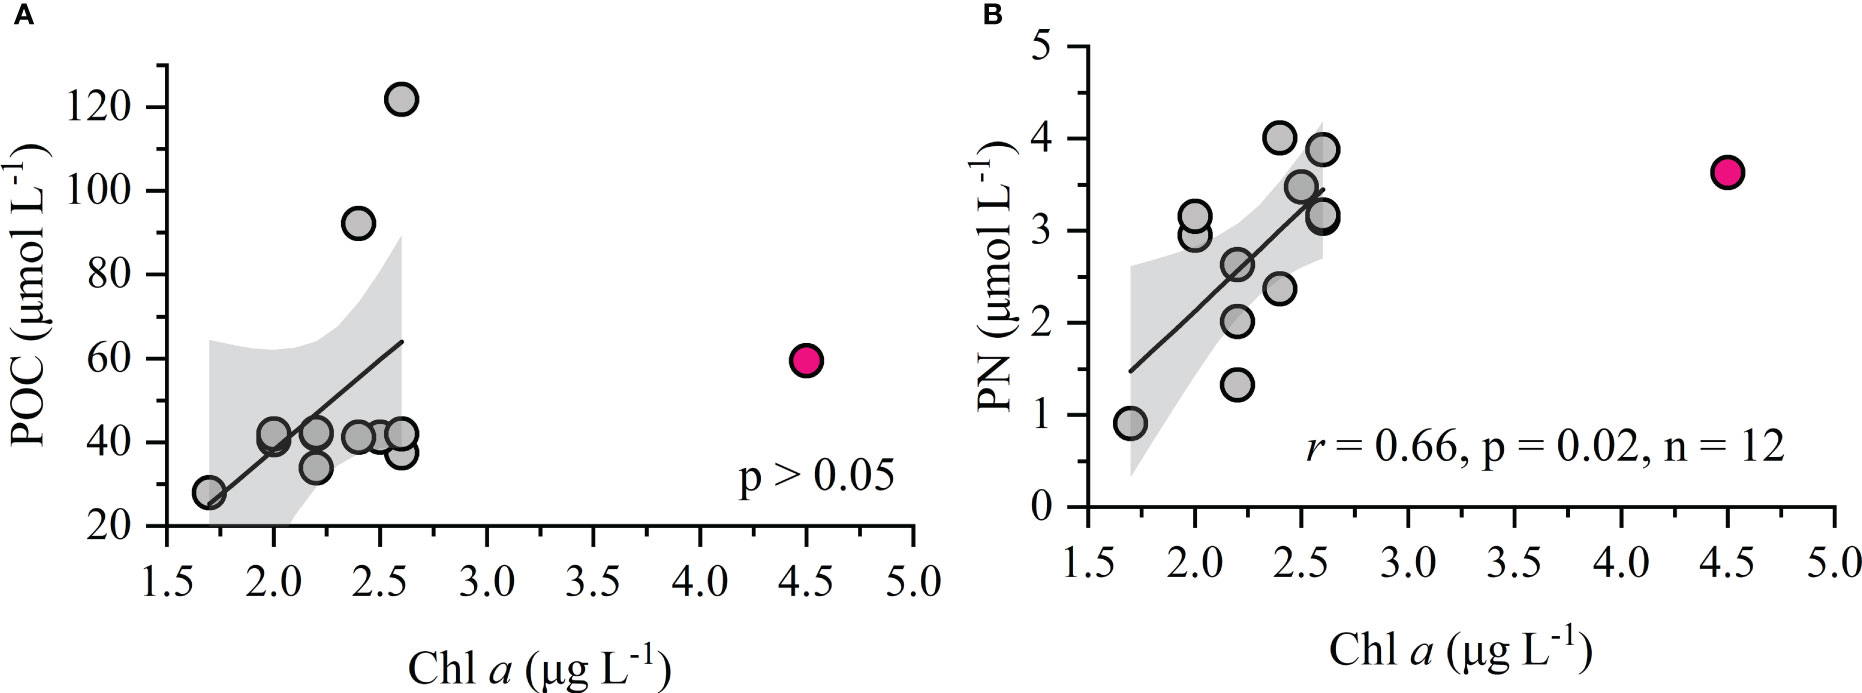
Figure 6 Relationships between POC, PN, and Chl a. (A) Relationship between POC and Chl a; (B) Relationship between PN and Chl a. The red point is an abnormal value (outlier) that was excluded from linear fitting. Gray shading represents the 95% confidence bands for the fitted regression lines.
The OM originating from terrigenous sources is usually characterized by a C/N ratio of > 20, whereas fresh marine phytoplankton-derived OM typically presents a C/N ratio of 5–8 (O'Leary, 1988; Meyers, 1994; Savoye et al., 2003). Thus, the ratio of C/N is a reliable indicator of the POM source in coastal ecosystems (Twichell et al., 2002; Zhou et al., 2021). In the present study, the C/N ratio (16.7 ± 7.8) lies between the terrigenous and marine OM endmember values, being closer to that of terrestrial organic water (Table 1). Combined with a higher POC/Chl a ratio (253 ± 112) and more depleted δ13CPOC value (−25.7 ± 1.6‰) measured in this study, we speculate that POC is highly degraded and has predominately terrigenous origins. Due to the relatively high salinity (Figure 2A), shallow water depth (Figure 1), and insignificant correlation between POC and salinity (p > 0.05), the surface sediment may be a key source of POC in this region besides the river runoff of terrestrial OM. The lack of evidence for TSM and POC being correlated (p > 0.05) indicates that in situ phytoplankton production also contributes markedly to POM in the study region.
Quantifying the relative contribution to POM from its various sources is critical for understanding the carbon and nitrogen dynamics in coastal marine environments. To assess the relative contribution of terrigenous, sewage, freshwater phytoplankton, and marine sources to the POM pool, we use the SIAR model (Parnell, 2008; Huang et al., 2020). The resulting estimates of these sources in the studied coastal region of northern Beibu Gulf are summarized in Figure 7. Evidently, the contribution from terrigenous organic materials (including C3, C4 plants, and soil OM) is ~35%, while marine OM accounts for only 9.5% of the POM pool. This divergence is consistent with our above conclusion that the allochthonous input dominates the POM pool in the study region. Notably, the contribution of freshwater phytoplankton to POM (34.8%) is comparable to that of terrigenous OM. The sampling time corresponded to the onset of the flood season of the rivers (Qin River and Maoling River) flowing into bay. The enhanced nutrient levels of river waters (DIN > 100 μmol liter-1) due to human activities could have resulted in the rapid production and accumulation of freshwater phytoplankton-derived POM (Lao et al., 2020). Part of the freshwater phytoplankton POM could have escaped the in situ microbial mineralization for later delivery into the coastal waters of northern Beibu Gulf. Moreover, the sewage source made an ~20.6% contribution to the POM in the study region. This is a reasonable result given the numerous developing ports, cities, fishing grounds, and aquaculture (e.g., oyster culture) surrounding the studied bay (Wang R. et al., 2021). A recent study found that intensive human activities have led to the high loading of organic pollutants in the coastal Beibu Gulf (Lao et al., 2021).
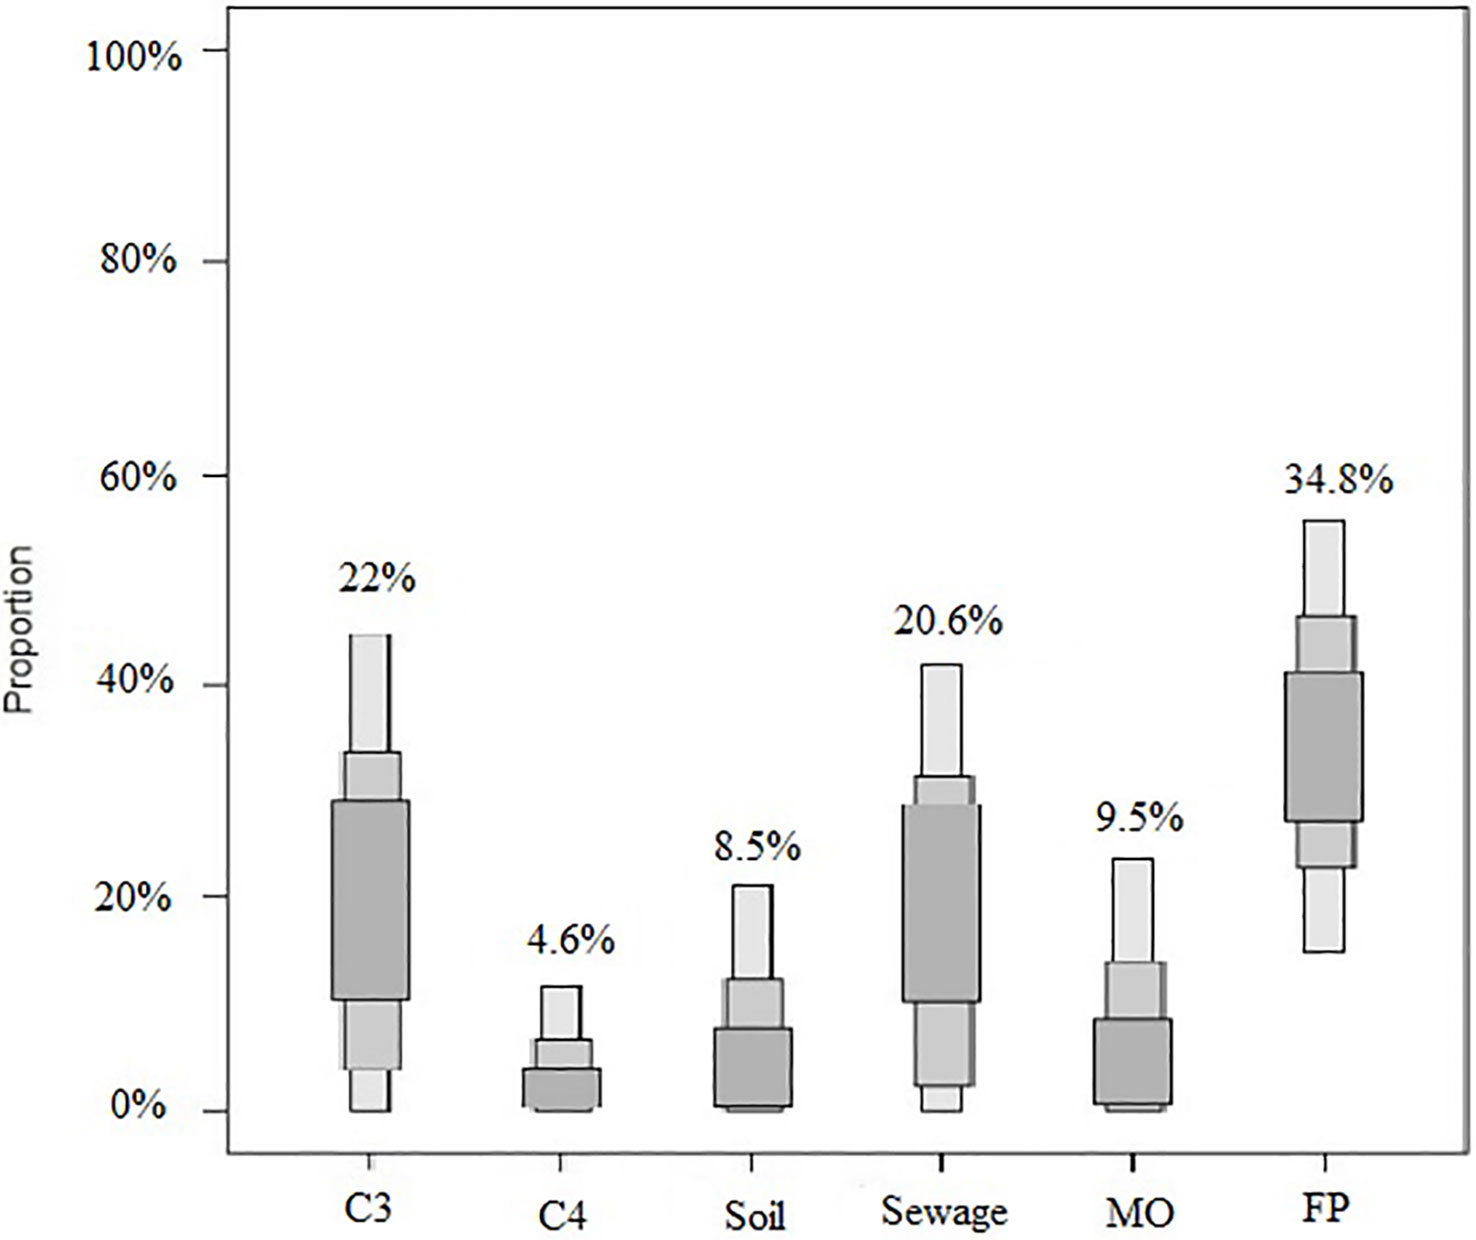
Figure 7 Relative contribution of potential POM sources in the northern Beibu Gulf. The credibility intervals of the model (95, 75, and 25%) are shown in dark, medium, and light gray coloring, respectively. MO, marine organic matter; FP, freshwater phytoplankton.
4.3 Particulate organic matter as the substrate for the production of recalcitrant dissolved organic matter
The proportion of total organic carbon (i.e., DOC plus POC) that consisted of DOC is 70 ± 9%, which is far lower than the > 90% for the oceanic environment (Hung et al., 2007; Wu et al., 2015), but still exceeding that of inland rivers of China’s mainland (42 ± 19%, Liu et al., 2020). The seaward increase in the DOC proportion clearly reflects the transformation from POM to DOM along the river-coastal sea-open ocean continuum. Marine humic-like peak M is recognized as being a useful proxy for tracing the microbial-derived recalcitrant DOM compounds (Rochelle-Newall and Fisher, 2002). In our study, the TOC concentration increased with the intensity of peak M (Figure 8A), while the single DOC or POC seems unrelated to peak M (p > 0.05, Figure 8B). These results suggest that both the POC and labile DOC could serve as substrates for vast heterotrophic microbial populations and support the formation of recalcitrant humic-like components as a byproduct of microbial activities (Lønborg et al., 2010; Yang et al., 2016). That oxygen consumed is supported by the positive relationship between peak M and AOU, when omitting those negative AOU values at stations Q11 and Q13 (Figure 8C). This accords with reported field observations in an inland reservoir (Qu et al., 2022), lake (Thottathil et al., 2013), marginal basins (Tanaka et al., 2014; Martínez–Pérez et al., 2019; Wang C. et al., 2021), and open oceans (Catalá et al., 2015). As part of that process, nutrients are regenerated and released into waters and a linear correlation would be expected (Yamashita et al., 2007); however, the intensity of peak M has no discernible correlation with DIN (Figure 8D). A reasonable explanation for this is that the allochthonous sources, such as river runoff discharge, supply large amounts of nutrients into Qinzhou Bay (Lao et al., 2020). Notably, although the “terrestrial” peak C is a better indicator of microbial-mediated remineralization in the open ocean due to the most pronounced correlation between peak C and AOU (Yamashita and Tanoue, 2008; Catalá et al., 2015; Wang C. et al., 2021), the poor relationships between peak C, TOC, and AOU in this study suggest that it is ill suited for tracing the in situ production of recalcitrant carbon in coastal environments where the allochthonous inputs may make a considerable contribution to the peak C pool. Finally, the high level of TOC reveals the characteristic low molecular weight and humification degree, as seen in the negative correlations between TOC, SUVA254, and HIX (p< 0.05). Hence, the existing OM in the study region also harbors much potential for microbial consumption and could be a major CO2 source in future warmer coastal ecosystems.
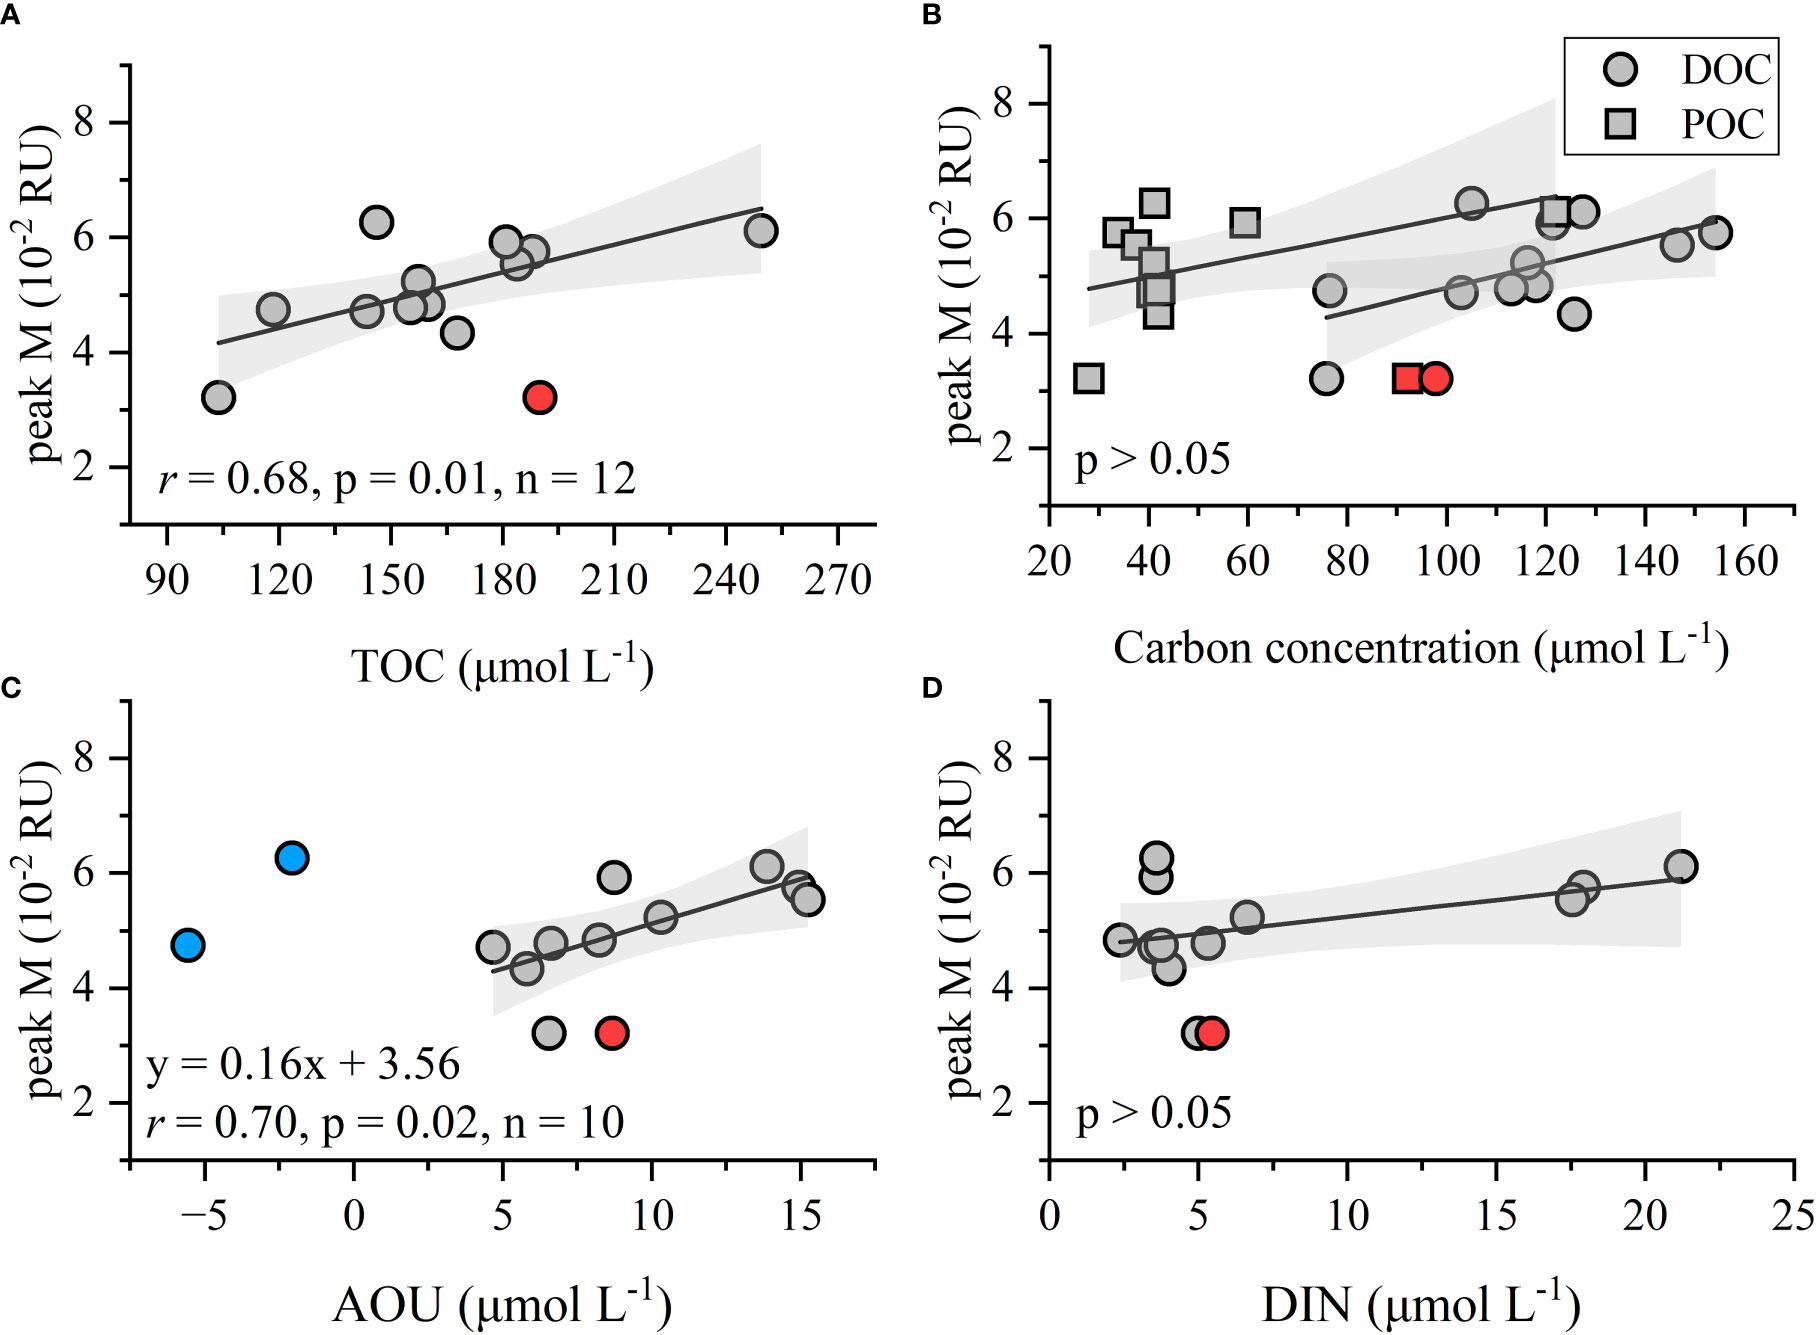
Figure 8 Relationships between the intensity of humic-like peak M versus TOC, DOC, POC, AOU, and DIN. The red point is an abnormal value (outlier) that was excluded from linear fitting. Blue points are the negative AOU values also excluded from linear fitting. Gray shading shows the 95% confidence bands for the fitted regression lines. (A) Relationships between peak M and TOC; (B) Relationships between peak M and DOC; (C) Relationships between peak M and AOU; (D) Relationships between peak M and DIN.
4.4 High in situ production efficiency of recalcitrant humic-like materials
The slope of a linear regression between humic-like component and AOU offers a good opportunity to quantify the in situ production efficiency of recalcitrant humic-like materials per unit oxygen consumption in inland waters (Thottathil et al., 2013) or marginal basins (Tanaka et al., 2014; Martínez–Pérez et al., 2019; Wang C. et al., 2021) and even open oceans (Castillo et al., 2010; Carlson and Hansell, 2015). Given our focus on how microbial metabolism affects the production of peak M, the data points for which primary production rates prevail over respiration rates (i.e., AOU< 0 μmol liter-1) were excluded from this regression analysis (Figure 8C). In this way, the effect of primary production and exchange with the atmosphere on the AOU is minimized. The in situ production efficiency of peak M in Qinzhou Bay [1.6 ± 0.6 × 10⁻³ RU (μmol kg-1)-1] surpasses that in the Shuikou Reservoir, China [3.6–13.0 × 10⁻⁵ RU (μmol kg-1)-1; Qu et al., 2022], Lake Biwa, Japan [4.7×10⁻³ RU (μmol kg-1)-1; Thottathil et al., 2013], marginal basins (South China Sea, Japan Sea, and Mediterranean Sea, 2.2–3.5 × 10⁻⁵ RU (μmol kg-1)-1, (Wang C. et al., 2021) and the global ocean [2.6 ± 0.2×10⁻⁵ RU (μmol kg-1)-1; Catalá et al., 2015], as well as the euphotic global ocean [5.3 ± 0.7×10⁻⁵ RU (μmol kg-1)-1; Catalá et al., 2016]. Findings from inland waters, marginal basins, and open oceans demonstrate the major temperature regulation of deoxygenation-related microbial production of RDOM components (Figure 9). Meanwhile, the evidence from the intermediate Japan Sea, Lake Biwa, and Shuikou Reservoir (Summer 2017, 2020) also suggest that the supply of labile carbon could alter the in situ production efficiency of RDOM (Figure 9; Wang C. et al., 2021; Qu et al., 2022). The enormous positive shift of the slope (i.e., in situ production efficiency) in Qinzhou Bay is likely the result of a combination of two factors, warm temperature and ample supply of labile OM (Figures 3, 4; Wang C. et al., 2021). Although there are no data on the oxygen utilization rate, we are confident that the turnover of OM (production and degradation) in surface waters of Qinzhou Bay is quite fast. This result clearly implies that the coastal region, such as the Qinzhou Bay, functions as a hotspot for the microbial production of recalcitrant carbon in aquatic systems.
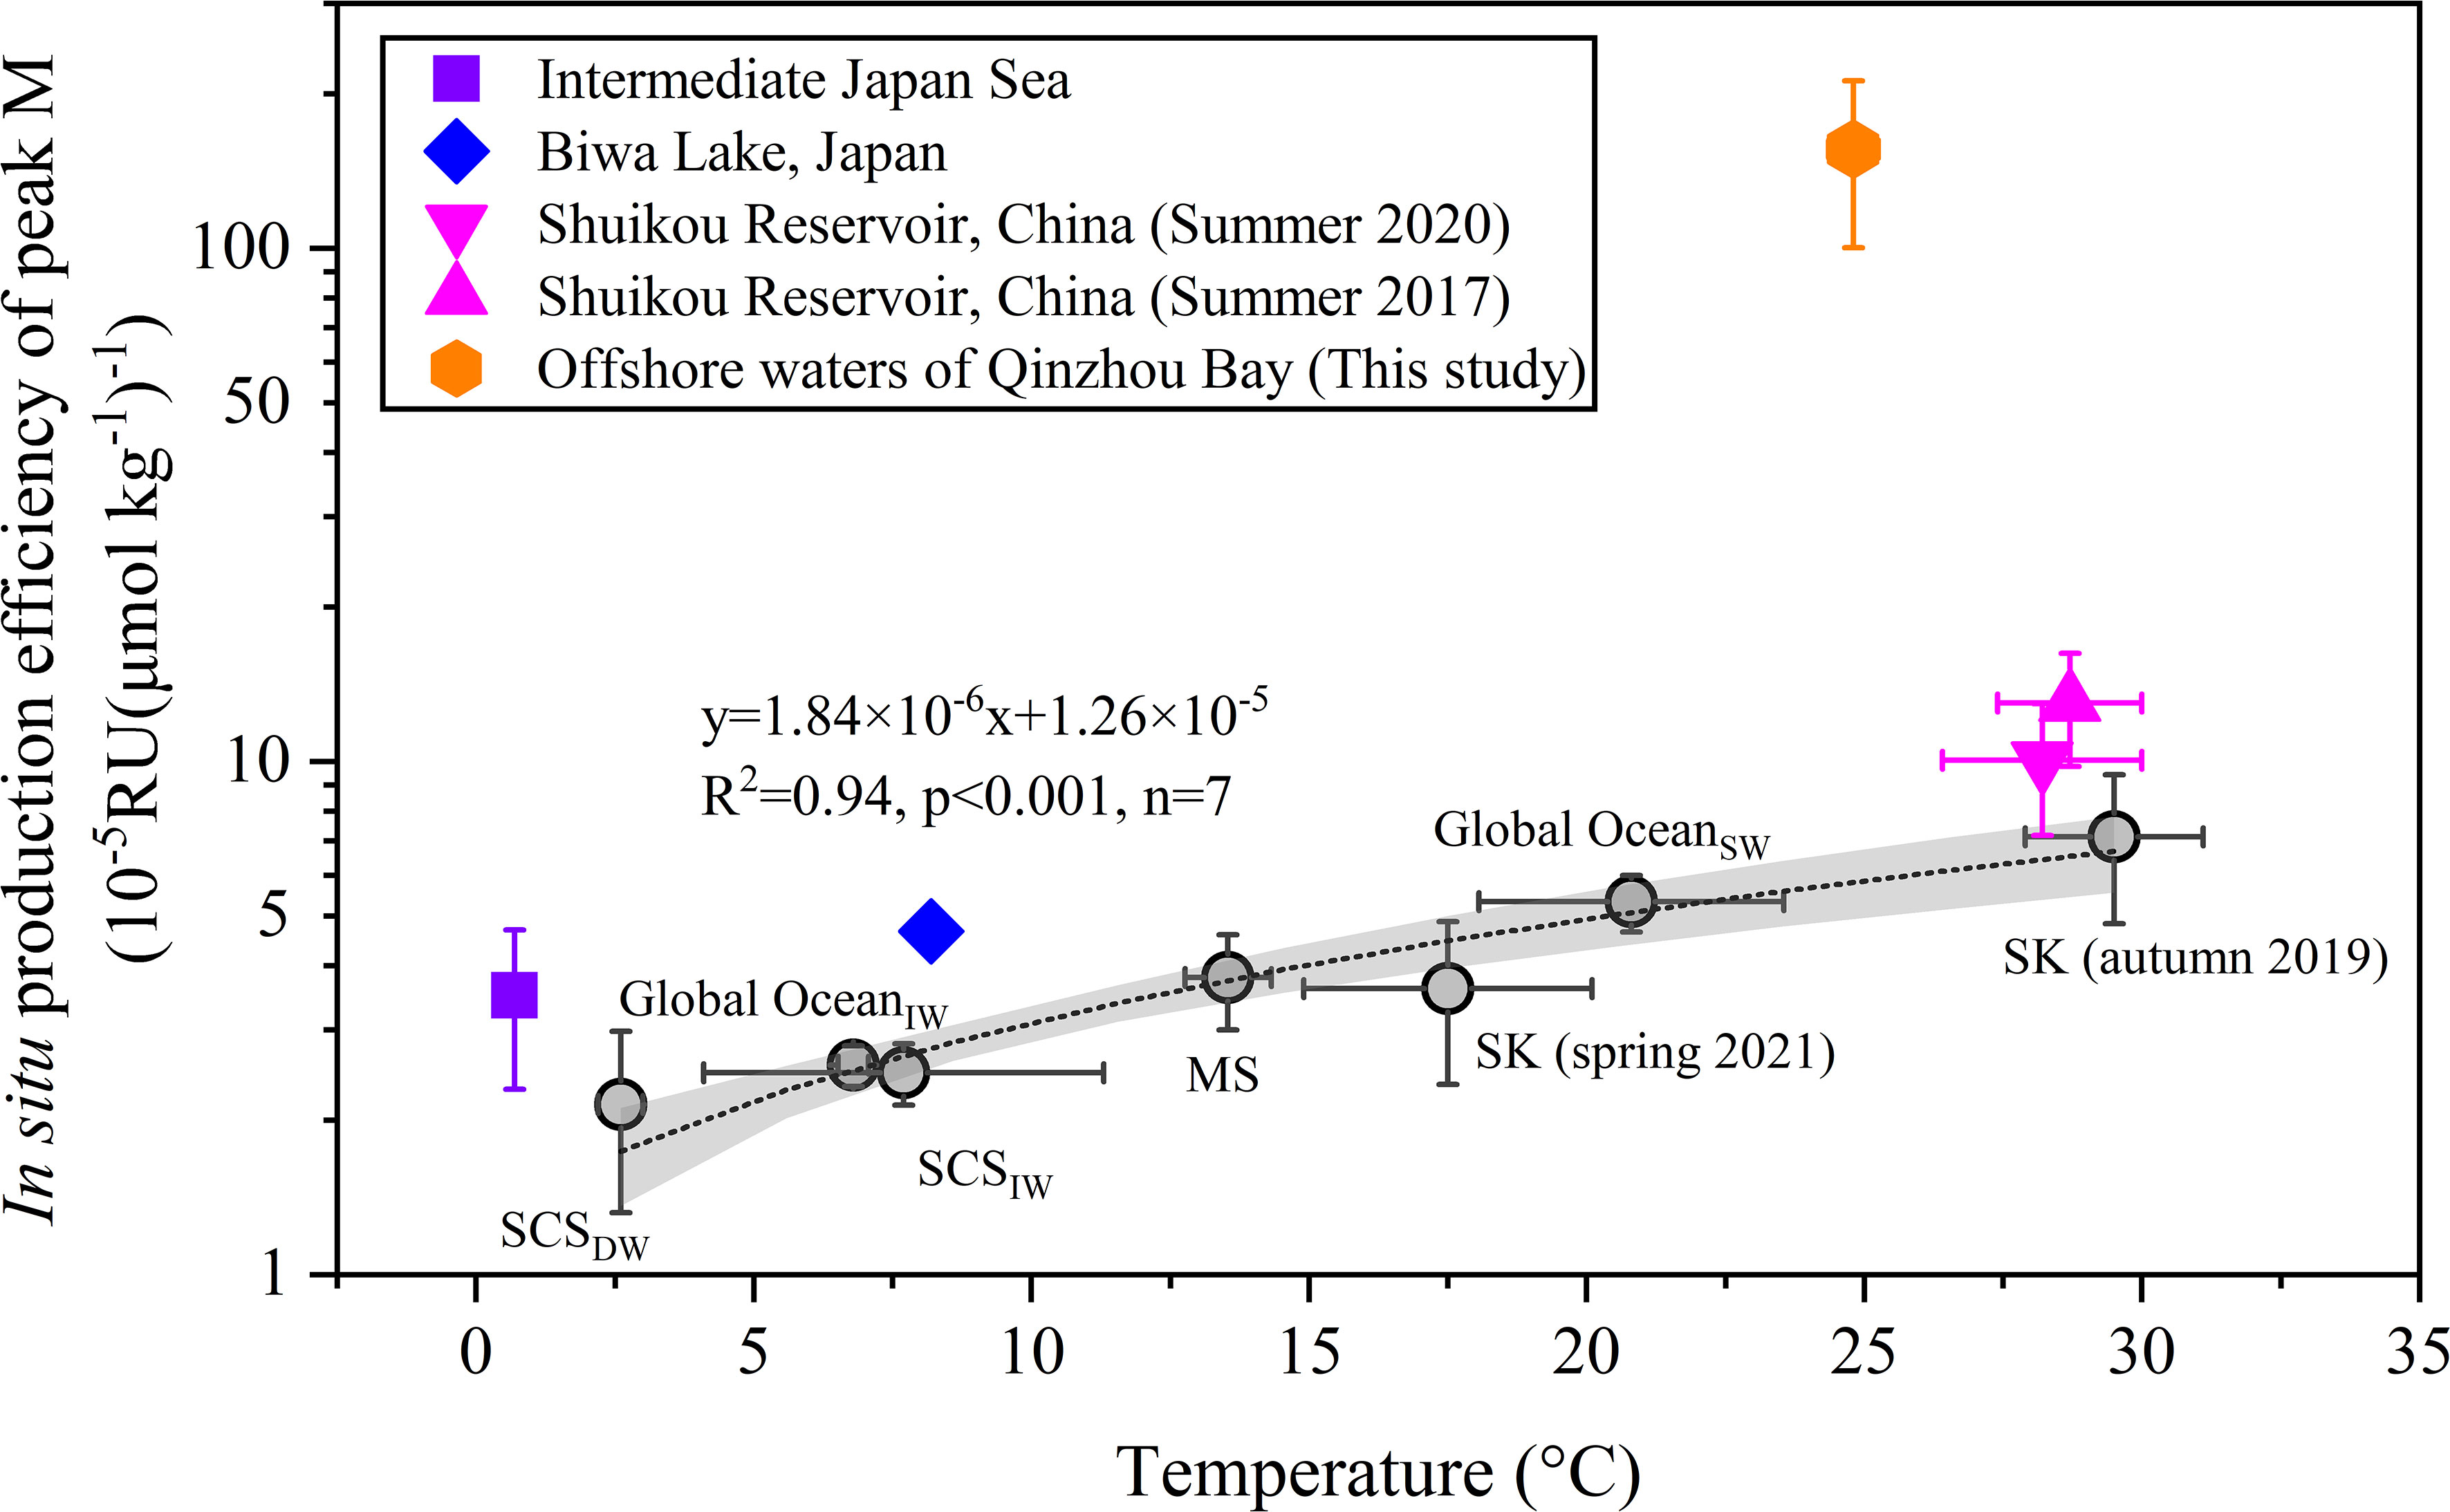
Figure 9 Assessing the relationship between the in situ production efficiency of peak M (i.e., the slope of linear regressions between peak M and AOU) and temperature across inland and marine systems. Gray circles indicate the data used for the linear regression and labeled accordingly. Gray shading shows the 95% confidence bands. SCSIW, intermediate water of the South China Sea (200–1000 m); SCSDW, deep water of the South China Sea (> 1000 m); Global OceanSW, surface water of the global ocean (0–200 m); Global OceanIW, intermediate water of the global ocean (200–1000 m); MS, dark Mediterranean Sea (> 200 m); SK, Shuikou Reservoir. Data on SCS, MS, Japan Sea, and Global OceanIW came from Wang R. et al. (2021). Data on the Shuikou Reservoir came from Qu et al. (2022). Data from Lake Biwa and Global OceanSW were recalculated from the results reported by Thottathil et al. (2013) and Catalá et al. (2016), respectively.
5 Conclusions
In this work, we studied in detail the sources, distributions, and transformations of DOM and POM present in surface waters of Qinzhou Bay in the early wet season based on various parameters (DOC, CDOM, FDOM, POC, PN, δ13C, and δ15N). The weak relationships between DOC, CDOM, and FDOM suggest that their distributions are subjected to different processes. DOC is mainly controlled by water mass mixing, as indicated by the significant correlation between it and salinity. The lack of discernible correlations between DOC, CDOM, FDOM, and Chl a together demonstrate that the primary production is not the major source of DOM in the studied region. High FI values of > 1.9 and lower S275-295 values of< 22 μm-1 further suggest that DOM is being highly degraded by microbial activity. That POC and PN lacked evidence for correlation between them seems to reflect their different sources. PN correlates well with Chl a, whereas POC appears unrelated Chl a. Furthermore, the high C/N ratio, POC/Chl a ratio, and depleted δ13C values strongly support the inference that POC is also being highly degraded and not directly sourced from in situ phytoplankton. That finding is consistent with the SIAR result, where marine OM is responsible for only a 9.5% contribution to the POM pool. The TOC concentration had a positive correlation with the intensity of peak M, while neither the single DOC nor POC do. This suggests the transformation of POM and labile DOM into recalcitrant DOM. The in situ production efficiency of humic-like peak M exceeds that in both the inland waters and open ocean, suggesting the rapid accumulation of recalcitrant carbon supported by warm temperatures and a sufficient supply of labile carbon. Further studies are required to determine the molecular formulas of POM and DOM, to better understand the mechanistic interaction and transformation of OM of different sizes, and to elucidate the principal factors shaping the rapid turnover of OM in coastal environments.
Data availability statement
The original contributions presented in the study are included in the article/supplementary material. Further inquiries can be directed to the corresponding author.
Author contributions
CW designed the study. SC and QL participated in the field sampling. SC, QL, and QZ analyzed the sample. SC and CW carried out the data processing and analysis. SC and CW prepared and wrote the manuscript. All authors contributed to the article and approved the submitted version.
Funding
This work was supported by the Guangdong Basic and Applied Basic Research Foundation (2022A1515110946); an open grant from the Guangxi Key Laboratory of Beibu Gulf Marine Resources, Environment and Sustainable Development (MRESD-2002-B01); a Guangdong Provincial College Innovation Team Project (2019KCXTF021); the First-class Discipline Plan of Guangdong Province (080503032101, 231420003) the program for scientific research start-up funds of Guangdong Ocean University (060302032009); and the Guangxi Natural Science Foundation of China (2020GXNSFBA297065).
Acknowledgments
The authors thank Xuan Lu for his assistance in DOC analysis. We gratefully thank two reviewers for their insightful comments and suggestions.
Conflict of interest
The authors declare that the research was conducted in the absence of any commercial or financial relationships that could be construed as a potential conflict of interest.
Publisher’s note
All claims expressed in this article are solely those of the authors and do not necessarily represent those of their affiliated organizations, or those of the publisher, the editors and the reviewers. Any product that may be evaluated in this article, or claim that may be made by its manufacturer, is not guaranteed or endorsed by the publisher.
References
Andrews J., Greenaway A., Dennis P. (1998). Combined carbon isotope and C/N ratios as indicators of source and fate of organic matter in a poorly flushed, tropical estuary: Hunts bay, Kingston harbour, Jamaica. Estuarine Coast. Shelf Sci. 46, 743–756. doi: 10.1006/ecss.1997.0305
Bauer J. E., Cai W.-J., Raymond P. A., Bianchi T. S., Hopkinson C. S., Regnier P. A. (2013). The changing carbon cycle of the coastal ocean. Nature 504, 61–70. doi: 10.1038/nature12857
Benson B. B., Krause D. Jr. (1984). The concentration and isotopic fractionation of oxygen dissolved in freshwater and seawater in equilibrium with the atmosphere 1. Limnol. oceanogr. 29, 620–632. doi: 10.4319/lo.1984.29.3.0620
Bergamaschi B., Fram M., Fujii R., Mopper K. (2003). Evaluation of specific ultraviolet absorbance as an indicator of the chemical composition and reactivity of dissolved organic carbon. Environ. Sci. Technol. 37, 4702. doi: 10.1021/es030360x
Boutton T. W. (1991). Stable carbon isotope ratios of natural materials: 2. atmospheric, terrestrial, marine, and freshwater environments. Carbon isotope techniques, 173–185. doi: 10.1016/B978-0-12-179730-0.50016-3
Carlson C. A., Del Giorgio P. A., Herndl G. J. (2007). Microbes and the dissipation of energy and respiration: from cells to ecosystems. Oceanography 20, 89–100. doi: 10.5670/oceanog.2007.52
Carlson C. A., Hansell D. A. (2015). DOM sources, sinks, reactivity, and budgets. Biogeochemistry Mar. dissolved organic matter, 65–126. doi: 10.1016/B978-0-12-405940-5.00003-0
Carpenter J. H. (1972). The Chesapeake Bay Institute technique for the Winkler dissolved oxygen method. Limnology & Oceanography 10 (1), 141–143.
Castillo C. R., Sarmento H., Álvarez-Salgado X. A., Gasol J. M., Marraséa C. (2010). Production of chromophoric dissolved organic matter by marine phytoplankton. Limnol. Oceanogr. 55, 446–454. doi: 10.1002/lno.10281
Catalá T., Álvarez-Salgado X., Otero J., Iuculano F., Companys B., Horstkotte B., et al. (2016). Drivers of fluorescent dissolved organic matter in the global epipelagic ocean. Limnol. Oceanogr. 61, 1101–1119. doi: 10.1002/lno.10281
Catalá T. S., Reche I., Fuentes-Lema A., Romera-Castillo C., Nieto-Cid M., Ortega-Retuerta E., et al. (2015). Turnover time of fluorescent dissolved organic matter in the dark global ocean. Nat. Commun. 6, 5986. doi: 10.1038/ncomms6986
Cifuentes L. A., Sharp J. H., Fogel M. L. (1988). Stable carbon and nitrogen isotope biogeochemistry in the Delaware estuary. Limnol. and Oceanogr. 33, 1115. doi: 10.4319/lo.1988.33.5.1102
Coble P. G. (1996). Characterization of marine and terrestrial DOM in seawater using excitation-emission matrix spectroscopy. Mar. Chem. 51, 325–346. doi: 10.1016/0304-4203(95)00062-3
Cory R. M., McKnight D. M. (2005). Fluorescence spectroscopy reveals ubiquitous presence of oxidized and reduced quinones in dissolved organic matter. Environ. Sci. Technol. 39, 8142–8149. doi: 10.1021/es0506962
Diaz R. J., Rosenberg R. (2008). Spreading dead zones and consequences for marine ecosystems. science 321, 926–929. doi: 10.1126/science.1156401
Doney S. C. (2010). The growing human footprint on coastal and open-ocean biogeochemistry. SCIENCE 328, 1512–1516. doi: 10.1126/science.1185198
Fellman J. B., Hood E., Spencer R. G. M. (2010). Fluorescence spectroscopy opens new windows into dissolved organic matter dynamics in freshwater ecosystems: a review. Limnol. and Oceanogr. 55 (6), 2452–2462. doi: 10.4319/lo.2010.55.6.2452
Fenchel T., Blackburn H., Blackburn T. H., King G. M. (2012). Bacterial biogeochemistry: the ecophysiology of mineral cycling (Academic press).
Gao C., Yu F., Chen J., Huang Z., Jiang Y., Zhuang Z., et al. (2021). Anthropogenic impact on the organic carbon sources, transport and distribution in a subtropical semi-enclosed bay. Sci. Total Environ. 767, 145047. doi: 10.1016/j.scitotenv.2021.145047
Gardner W. D., Mishonov A. V., Richardson M. J. (2006). Global POC concentrations from in-situ and satellite data. DEEP-SEA Res. Part II-TOPICAL Stud. IN OCEANOGR. 53, 718–740. doi: 10.1016/j.dsr2.2006.01.029
Gattuso J.-P., Frankignoulle M., Wollast R. (1998). Carbon and carbonate metabolism in coastal aquatic ecosystems. Annu. Rev. Ecol. Systematics 29, 405–434. doi: 10.1146/annurev.ecolsys.29.1.405
Guo W., Stedmon C. A., Han Y., Wu F., Yu X., Hu M. (2007). The conservative and non-conservative behavior of chromophoric dissolved organic matter in Chinese estuarine waters. Mar. Chem. 107, 357–366. doi: 10.1016/j.marchem.2007.03.006
Guo W., Yang L., Zhai W., Chen W., Osburn C. L., Huang X., et al. (2014). Runoff-mediated seasonal oscillation in the dynamics of dissolved organic matter in different branches of a large bifurcated estuary-the changjiang estuary. J. Geophys. Res.: Biogeosciences 119, 776–793. doi: 10.1002/2013jg002540
Hansell D. A., Carlson C. A., Repeta D. J., Schlitzer R. (2009). Dissolved organic matter in the ocean a controversy stimulates new insights. Oceanography 22 (4), 202–211. doi: 10.5670/oceanog.2009.109
Helms J. R., Stubbins A., Ritchie J. D., Minor E. C., Kieber D. J., Mopper K. (2008). Absorption spectral slopes and slope ratios as indicators of molecular weight, source, and photobleaching of chromophoric dissolved organic matter. Limnol. Oceanogr. 53, 955–969. doi: 10.4319/lo.2008.53.3.0955
Huang C., Chen F., Zhang S., Chen C., Meng Y., Zhu Q., et al. (2020). Arbon and nitrogen isotopic composition of particulate organic matter in the pearl river estuary and the adjacent shelf. Estuar. Coast. AND SHELF Sci. 246, 107003. doi: 10.1016/j.ecss.2020.107003
Huguet A., Vacher L., Relexans S., Saubusse S., Froidefond J. M., Parlanti E. (2009). Properties of fluorescent dissolved organic matter in the gironde estuary. Organic Geochemist. 40, 706–719. doi: 10.1016/j.orggeochem.2009.03.002
Hung J. J., Wang S. M., Chen Y. L. (2007). Biogeochemical controls on distributions and fluxes of dissolved and particulate organic carbon in the northern south China Sea. DEEP-SEA Res. Part II-TOPICAL Stud. IN OCEANOGR. 54, 1486–1503. doi: 10.1016/j.dsr2.2007.05.006
Ji C.-X., Chen Y., Yang G.-P. (2021). Seasonal variation, degradation, and bioavailability of dissolved organic matter in the changjiang estuary and its adjacent East China Sea. J. of geopghys. Research-oceans 126, e2020JC016648. doi: 10.1029/2020JC016648
Ke Z., Tan Y., Huang L., Liu J., Xiang C., Zhao C., et al. (2019). Significantly depleted n-15 in suspended particulate organic matter indicating a strong influence of sewage loading in daya bay, China. Sci. of the total Environ. 650, 759–768. doi: 10.1016/j.scitotenv.2018.09.076
Ke Z., Tan Y., Huang L., Zhao C., Jiang X. (2017). Spatial distributions of δ13C, δ15N and C/N ratios in suspended particulate organic matter of a bay under serious anthropogenic influences: Daya bay, China. Mar. pollut. Bull. 114, 183–191. doi: 10.1016/j.marpolbul.2016.08.078
Kendall C. (1998). “Tracing nitrogen sources and cycling in catchments,” in Isotope tracers in catchment hydrology (Elsevier), 519–576. doi: 10.1016/B978-0-444-81546-0.50023-9
Kothawala D. N., Murphy K. R., Stedmon C. A., Weyhenmeyer G. A., Tranvik L. J. (2013). Inner filter correction of dissolved organic matter fluorescence. Limnol. Oceanogr.: Methods 11, 616–630. doi: 10.4319/Iom.2013.11.616
Krishna M. S., Naidu S. A., Subbaiah C. V., Sarma V. V. S. S., Reddy N. P. C. (2013). Distribution and sources of organic matter in surface sediments of the eastern continental margin of India. J. Geophys. Res.: Biogeosciences 118, 1484–1494. doi: 10.1002/2013jg002424
Lønborg C., Álvarez-Salgado X. A., Davidson K., Martínez-García S., Teira E. (2010). Assessing the microbial bioavailability and degradation rate constants of dissolved organic matter by fluorescence spectroscopy in the coastal upwelling system of the ría de vigo. Mar. Chem. 119, 121–129. doi: 10.1016/j.marchem.2010.02.001
Lai J., Jiang F., Ke K., Xu M., Lei F., Chen B. (2014). Nutrients distribution and trophic status assessment in the northern beibu gulf, China. Chin. J. OF OCEANOL. AND LIMNOL. 32, 1128–1144. doi: 10.1007/s00343-014-3199-y
Lao Q., Liu G., Shen Y., Su Q., Guo J., Chen F. (2020). Distribution characteristics and fluxes of nutrients in the rivers of the beibu gulf. Acta Oceanol. Sin. 42, 93–100. doi: 10.3969/j.issn.0253-4193.2020.12.010
Lao Q., Liu G., Zhou X., Chen F., Zhang S. (2021). Sources of polychlorinated biphenyls (PCBs) and dichlorodiphenyltrichloroethanes (DDTs) found in surface sediment from coastal areas of beibu gulf: A reflection on shipping activities and coastal industries. Mar. pollut. Bull. 167, 112318. doi: 10.1016/j.marpolbul.2021.112318
Lawaetz A. J., Stedmon C. A. (2009). Fluorescence intensity calibration using the raman scatter peak of water. Appl. Spectrosc. 63, 936–940. doi: 10.1366/000370209788964548
Li X., Liu Z., Chen W., Wang L., He B., Wu K., et al. (2018). Production and transformation of dissolved and particulate organic matter as indicated by amino acids in the pearl river estuary, China. J. OF GEOPHYS. RESEARCH-BIOGEOSCIENCES 123, 3523–3537. doi: 10.1029/2018JG004690
Liu Q., Liang Y., Cai W. J., Wang K., Wang J., Yin K. (2020). Changing riverine organic C:N ratios along the pearl river: Implications for estuarine and coastal carbon cycles. Sci. Total Environ. 709, 136052. doi: 10.1016/j.scitotenv.2019.136052
Lu X., Huang C., Chen F., Zhang S., Lao Q., Chen C., et al. (2021). Carbon and nitrogen isotopic compositions of particulate organic matter in the upwelling zone off the east coast of hainan island, China. Mar. pollut. Bull. 167, 112349. doi: 10.1016/j.marpolbul.2021.112349
Maksymowska D., Richard P., Piekarek-Jankowska H., Riera P. (2000). Chemical and isotopic composition of the organic matter sources in the gulf of gdansk (Southern Baltic Sea). Estuarine Coast. Shelf Sci. 51, 585–598. doi: 10.1006/ecss.2000.0701
Martínez–Pérez A. M., Catalá T. S., Nieto–Cid M., Otero J., Álvarez M., Emelianov M., et al. (2019). Dissolved organic matter (DOM) in the open Mediterranean sea. II: Basin–wide distribution and drivers of fluorescent DOM. Prog. Oceanogr. 170, 93–106. doi: 10.1016/j.pocean.2018.10.019
McDonough L. K., Andersen M. S., Behnke M. I., Rutlidge H., Oudone P., Meredith K., et al. (2022). A new conceptual framework for the transformation of groundwater dissolved organic matter. Nat. Commun. 13, 2153. doi: 10.1038/s41467-022-29711-9
Meyers P. A. (1994). Preservation of elemental and isotopic source identification of sedimentary organic matter. Chem. geol. 114, 289–302. doi: 10.1016/0009-2541(94)90059-0
Meyers P. A. (1997). Organic geochemical proxies of paleoceanographic, paleolimnologic, and paleoclimatic processes. Organic geochemist. 27, 213–250. doi: 10.1016/S0146-6380(97)00049-1
Middelburg J. J., Herman P. (2007). Organic matter processing in tidal estuaries. Mar. Chem. 106, 127–147. doi: 10.1016/j.marchem.2006.02.007
Moran M., Sheldon W. M. Jr., Zepp R. G. (2000). Carbon loss and optical property changes during long-term photochemical and biological degradation of estuarine dissolved organic matter. Limnol. Oceanogr 45, 1254–1264. doi: 10.2307/2670519
Nelson N. B., Siegel D. A., Carlson C. A., Swan C. M. (2010). Tracing global biogeochemical cycles and meridional overturning circulation using chromophoric dissolved organic matter. Geophys. Res. Lett. 37, L03610. doi: 10.1029/2009GL042325
O'Leary M. H. (1988). Carbon isotopes in photosynthesis. Bioscience 38, 328–336. doi: 10.2307/1310735
Ohno T. (2002). Fluorescence inner-filtering correction for determining the humification index of dissolved organic matter. Environ. Sci. Technol. 36, 742–746. doi: 10.1021/es0155276
Parnell A. (2008) SIAR: stable isotope analysis in r. Available at: http://cran.r-project.org/web/packages/siar/index.html.
Qu L., He C., Wu Z., Dahlgren R. A., Ren M., Li P., et al. (2022). Hypolimnetic deoxygenation enhanced production and export of recalcitrant dissolved organic matter in a large stratified reservoir. Water Res. 219, 118537. doi: 10.1016/j.watres.2022.118537
Raymond P. A., Saiers J. E. (2010). Event controlled DOC export from forested watersheds. Biogeochemistry 100, 197–209. doi: 10.1007/s10533-010-9416-7
Raymond P. A., Spencer R. G. (2015). “Riverine DOM,” in Biogeochemistry of marine dissolved organic matter (Elsevier), 509–533. doi: 10.1016/B978-0-12-405940-5.00011-X
Rochelle-Newall E., Fisher T. (2002). Production of chromophoric dissolved organic matter fluorescence in marine and estuarine environments: an investigation into the role of phytoplankton. Mar. Chem. 77, 7–21. doi: 10.1016/S0304-4203(01)00072-X
Sarma V. V. S. S., Krishna M. S., Prasad V. R., Kumar B. S. K., Naidu S. A., Rao G. D., et al. (2014). Distribution and sources of particulate organic matter in the Indian monsoonal estuaries during monsoon. J. Geophys. Res.: Biogeosciences 119, 2095–2111. doi: 10.1002/2014jg002721
Sarma V., Krishna M. S., Srinivas T. N. R. (2020). Sources of organic matter and tracing of nutrient pollution in the coastal bay of Bengal. Mar. pollut. Bull. 159, 111477. doi: 10.1016/j.marpolbul.2020.111477
Sato T., Miyajima T., Ogawa H., Umezawa Y., Koike I. (2006). Temporal variability of stable carbon and nitrogen isotopic composition of size-fractionated particulate organic matter in the hypertrophic sumida river estuary of Tokyo bay, Japan. Estuar. Coast. AND SHELF Sci. 68, 245–258. doi: 10.1016/j.ecss.2006.02.007
Savoye N., Aminot A., Tréguer P., Fontugne M., Naulet N., Kérouel R. (2003). Dynamics of particulate organic matter δ15N and δ13C during spring phytoplankton blooms in a macrotidal ecosystem (Bay of seine, France). Mar. Ecol. Prog. Ser. 255, 27–41. doi: 10.3354/meps255027
Stedmon C., Markager S. (2005). Tracingthe production and degradation of autochthonous fractions of dissolved organic matter using fluorescence analysis. Limnol Oceanogr 50, 1415–1426. doi: 10.4319/lo.2005.50.5.1415
Stedmon C. A., Markager S., Kaas H. (2000). Optical properties and signatures of chromophoric dissolved organic matter (CDOM) in Danish coastal waters. Estuarine Coast. Shelf Sci. 51, 267–278. doi: 10.1006/ecss.2000.0645
Tanaka K., Kuma K., Hamasaki K., Yamashita Y. (2014). Accumulation of humic-like fluorescent dissolved organic matter in the Japan Sea. Sci. Rep. 4, 5292. doi: 10.1038/srep05292
Thornton S. F., Mcmanus J. (1994). Application of organic carbon and nitrogen stable isotope and C/N ratios as source indicators of organic matter provenance in estuarine systems: Evidence from the Tay estuary, Scotland. Estuar. Coast. Shelf 38, 219–233. doi: 10.1006/ecss.1994.1015
Thottathil S. D., Hayakawa K., Hodoki Y., Yoshimizu C., Kobayashi Y., Nakano S.-i. (2013). Biogeochemical control on fluorescent dissolved organic matter dynamics in a large freshwater lake (Lake biwa, Japan). Limnol. oceanogr. 58, 2262–2278. doi: 10.4319/lo.2013.58.6.2262
Twichell S. C., Meyers P. A., Diester-Haass L. (2002). Significance of high C/N ratios in organic-carbon-rich neogene sediments under the benguela current upwelling system. Organic Geochemist. 33, 715–722. doi: 10.1016/S0146-6380(02)00042-6
Wang C., Guo W., Li Y., Dahlgren R. A., Guo X., Qu L., et al. (2021). Temperature-regulated turnover of chromophoric dissolved organic matter in global dark marginal basins. Geophys. Res. Lett. 48, e2021GL094035. doi: 10.1029/2021gl094035
Wang C., Guo W., Li Y., Stubbins A., Li Y., Song G., et al. (2017). Hydrological and biogeochemical controls on absorption and fluorescence of dissolved organic matter in the northern south China Sea. J. Geophys. Res.: Biogeosciences 122, 3405–3418. doi: 10.1002/2017JG004100
Wang R., Li B., Zhang L., Hou Y., Lin H., Luo B., et al. (2021). Antibiotic resistance in bacterial communities of the oyster crassostrea rivularis from different salinity zones in qinzhou bay, beibu gulf, China. Elem Sci. Anth 9, 95. doi: 10.1525/elementa.2020.00095
Weishaar J. L., Aiken G. R., Bergamaschi B. A., Fram M. S., Fujii R., Mopper K. (2003). Evaluation of specific ultraviolet absorbance as an indicator of the chemical composition and reactivity of dissolved organic carbon. Environ. Sci. Technol. 37, 4702–4708. doi: 10.1021/es030360x
Welschmeyer N. A. (1994). Fluorometric analysis of chlorophyll a in the presence of chlorophyll b and pheopigments. Limnol. oceanogr. 39, 1985–1992. doi: 10.4319/lo.1994.39.8.1985
Willey J. D., Kieber R. J., Eyman M. S., Avery G. B. Jr. (2000). Rainwater dissolved organic carbon: concentrations and global flux. Global Biogeochemi. Cycles 14, 139–148. doi: 10.1029/1999GB900036
Wu K., Dai M., Chen J., Meng F., Li X., Liu Z., et al. (2015). Dissolved organic carbon in the south China Sea and its exchange with the Western pacific ocean. DEEP-SEA Res. Part II-TOPICAL Stud. IN OCEANOGR. 122, 41–51. doi: 10.1016/j.dsr2.2015.06.013
Wu Y., Koch B. P., Wang X., Witt M., Wang X., Bao H., et al. (2022). Molecular composition of dissolved organic matter in the changjiang (Yangtze river) - imprints of anthropogenic impact. Front. IN Mar. Sci. 9, 980176. doi: 10.3389/fmars.2022.980176
Wu Y., Zhang J., Li D. J., Wei H., Lu R. X. (2003). Isotope variability of particulate organic matter at the PN section in the East China Sea. Biogeochemistry 65, 31–49. doi: 10.1023/a:1026044324643
Xiao X. L., Guo W. D., Li X. L., Wang C., Chen X. W., Lin X. Q., et al. (2021). Viral lysis alters the optical properties and biological availability of dissolved organic matter derived from prochlorococcus picocyanobacteria. Appl. AND Environ. Microbiol. 87, e02271-20. doi: 10.1128/AEM.02271-20
Yamashita Y., Tanoue E. (2008). Production of bio-refractory fluorescent dissolved organic matter in the ocean interior. Nat. Geosci. 1, 579–582. doi: 10.1038/ngeo279
Yamashita Y., Tsukasaki A., Nishida T., Tanoue E. (2007). Vertical and horizontal distribution of fluorescent dissolved organic matter in the southern ocean. Mar. Chem. 106, 498–509. doi: 10.1016/j.marchem.2007.05.004
Yang L. Y., Chen C. T. A., Hong H. S., Chang Y. C., Lui H. K. (2015). Mixing behavior and bioavailability of dissolved organic matter in two contrasting subterranean estuaries as revealed by fluorescence spectroscopy and parallel factor analysis. Estuar. Coast. AND SHELF Sci. 166, 161–169. doi: 10.1016/j.ecss.2014.10.018
Yang L., Chen C.-T. A., Lui H.-K., Zhuang W.-E., Wang B.-J. (2016). Effects of microbial transformation on dissolved organic matter in the east Taiwan strait and implications for carbon and nutrient cycling. Estuar. Coast. AND SHELF Sci. 180, 59–68. doi: 10.1016/j.ecss.2016.06.021
Ye F., Guo W., Shi Z., Jia G., Wei G. (2017). Seasonal dynamics of particulate organic matter and its response to flooding in the pearl river estuary, China, revealed by stable isotope (δ13C and δ15N) analyses. J. Geophys. Res.: Oceans 122, 6835–6856. doi: 10.1002/2017jc012931
Ye F., Jia G. D., Xie L. H., Wei G. J., Xu J. (2016). Isotope constraints on seasonal dynamics of dissolved and particulate n in the pearl river estuary, south China. J. Geophys. Research-Oceans 121, 8689–8705. doi: 10.1002/2016jc012066
Zhou X., Jin G., Li J., Song Z., Zhang S., Chen C., et al. (2021). Effects of typhoon mujigae on the biogeochemistry and ecology of a semi-enclosed bay in the northern south China Sea. J. of Geophys. Research-Biogeosciences 126, e2020JG006031. doi: 10.1029/2020JG006031
Zhu Z., Wei H., Guan Y., Zhang L., Jia R., Sun P., et al. (2022a). Distribution, spectral characteristics, and seasonal variation of dissolved organic matter in the northern beibu gulf, south China Sea. Front. IN Mar. Sci. 9, 1023953. doi: 10.3389/fmars.2022.1023953
Zhu Z., Wei H., Huang W., Wu X., Guan Y., Zhang Q. (2022b). Occurrence of microplastic pollution in the beibu gulf, the northern south China Sea. Front. Mar. Sci. 8. doi: 10.3389/fmars.2021.821008
Zhu J., Zhang Q., Li Y., Tan S., Kang Z., Yu X., et al. (2019). Microplastic pollution in the maowei Sea, a typical mariculture bay of China. Sci. Total Environ. 658, 62–68. doi: 10.1016/j.scitotenv.2018.12.192
Zhu W.-Z., Zhang H.-H., Zhang J., Yang G.-P. (2018). Seasonal variation in chromophoric dissolved organic matter and relationships among fluorescent components, absorption coefficients and dissolved organic carbon in the bohai Sea, the yellow Sea and the East China Sea. J. OF Mar. Syst. 180, 9–23. doi: 10.1016/j.jmarsys.2017.12.003
Keywords: Qinzhou bay, Beibu Gulf, dissolved organic matter, particulate organic matter, absorption and fluorescence spectra, δ13C and δ15N
Citation: Cai S, Wang C, Zhu Q and Lao Q (2023) Source, distribution, and transformation of dissolved and particulate organic matters in Qinzhou Bay, Northern Beibu Gulf. Front. Mar. Sci. 10:1163899. doi: 10.3389/fmars.2023.1163899
Received: 11 February 2023; Accepted: 27 March 2023;
Published: 18 April 2023.
Edited by:
Jiapeng Wu, Guangzhou University, ChinaReviewed by:
Wen-zhuo Zhu, Zhejiang Ocean University, ChinaZuhao Zhu, Ministry of Natural Resources, China
Copyright © 2023 Cai, Wang, Zhu and Lao. This is an open-access article distributed under the terms of the Creative Commons Attribution License (CC BY). The use, distribution or reproduction in other forums is permitted, provided the original author(s) and the copyright owner(s) are credited and that the original publication in this journal is cited, in accordance with accepted academic practice. No use, distribution or reproduction is permitted which does not comply with these terms.
*Correspondence: Chao Wang, Y2hhb3dhbmdAZ2RvdS5lZHUuY24=