 Yafei Sun1
 Guizhi Wang1,2,3*Yubin Weng4Qing Li1Fei Zhang1Weizhen Jiang1Guiyuan Dai1Wen Lin1Shengyao Sun1,3Yiyong Jiang5Yuanjing Zhang6*
- 1State Key Laboratory of Marine Environmental Science and College of Ocean and Earth Sciences, Xiamen University, Xiamen, China
- 2Fujian Provincial Key Laboratory for Coastal Ecology and Environmental Studies, Xiamen University, Xiamen, China
- 3National Observation and Research Station for the Taiwan Strait Marine Ecosystem, Xiamen University, Zhangzhou, China
- 4Fujian Institute of Oceanology, Fujian Provincial Key Laboratory of Coast and Island Management Technology Study, Xiamen, China
- 5College of the Environment and Ecology, Xiamen University, Xiamen, China
- 6The Institute of Hydrogeology and Environmental Geology, Chinese Academy of Geological Science (CAGS), Shijiazhuang, China
Despite over 90% of China’s coastal bays have an area less than 500 km2, the geochemical effects of SGD on those ecosystems are ambiguous. Based on mapping and time-series observations of Ra isotopes and nutrients, a case study of small bays (<500 km2), we revealed that submarine groundwater discharge (SGD) predominately regulated the distribution of nutrients and fueled algal growth in Dongshan Bay, China. On the bay-wide scale, the SGD rate was estimated to be 0.048 ± 0.022 m day−1 and contributed over 95% of the nutrients. At the time-series site where the bay-wide highest Ra activities in the bottom water marked an SGD hotspot with an average rate an order of magnitude greater, the maximum chlorophyll concentration co-occurred, suggesting that SGD may support the algal bloom. The ever-most significant positive correlations between 228Ra and nutrients throughout the water column (P< 0.01, R2 > 0.90 except for soluble reactive phosphorus in the surface) suggested the predominance of SGD in controlling nutrient distribution in the bay. Extrapolated to a national scale, the SGD-carried dissolved inorganic nitrogen flux in small bays was twice as much as those in large bays (>2,000 km2). Thus, the SGD-carried nutrients in small bays merit immediate attention in environmental monitoring and management.
1 Introduction
Coastal eutrophication is a worldwide environmental issue, defined as an increase in the rate of supply of organic matter to a coastal ecosystem, primarily caused by excessive nutrient inputs and resulting in biomass growth in the ecosystem (Smith, 2003; Nixon, 2012; O’Neil et al., 2012). These excessive nutrients have been produced by human activities such as agricultural fertilizer use (Glibert et al., 2006) and industrial farming since the Industrial Revolution (Glibert, 2020). The main pathways of these anthropogenic nutrients into coastal waters include rivers (Zhang et al., 2021), effluents from sewers (Nyenje et al., 2010), atmospheric deposition (Paerl, 1997), diffusion from sediments (Nyenje et al., 2010), and submarine groundwater discharge (SGD) (Beck et al., 2007; Cheng et al., 2020).
Among these pathways, SGD has been recognized as a nutrient carrier even more important than rivers in almost half of the coastal ecosystems so far investigated around the globe (Santos et al., 2021). SGD is defined as any and all flow of water on the continental margins that discharges from the seabed to the coastal ocean (Burnett and Dulaiova, 2003; Moore, 2010), and may be composed of fresh groundwater discharge and recirculated seawater discharge (Taniguchi et al., 2002; Santos et al., 2012). Considerable nutrients delivered by SGD may either sustain coastal ecosystems and their services (Alorda-Kleinglass et al., 2021) or result in eutrophication, even hypoxia (Guo et al., 2020) and acidification (Correa et al., 2021).
Eutrophication has been widely observed along Chinese coasts (Wang Y. et al., 2021). However, the contribution of SGD is poorly known, especially in small bays in China. As a matter of fact, approximately 90% of China’s coastal bays have an area of less than 500 km2 (Wang and Chen, 1993). Over 60% of previous studies on SGD in China’s embayments have been focused on larger (>500 km2) estuaries and bays. Few foci, however, are placed on the geochemical impacts of SGD in small bays (<500 km2) (Figure 1). Is SGD in small bays negligible in the nutrient sources in the coastal zone of China?
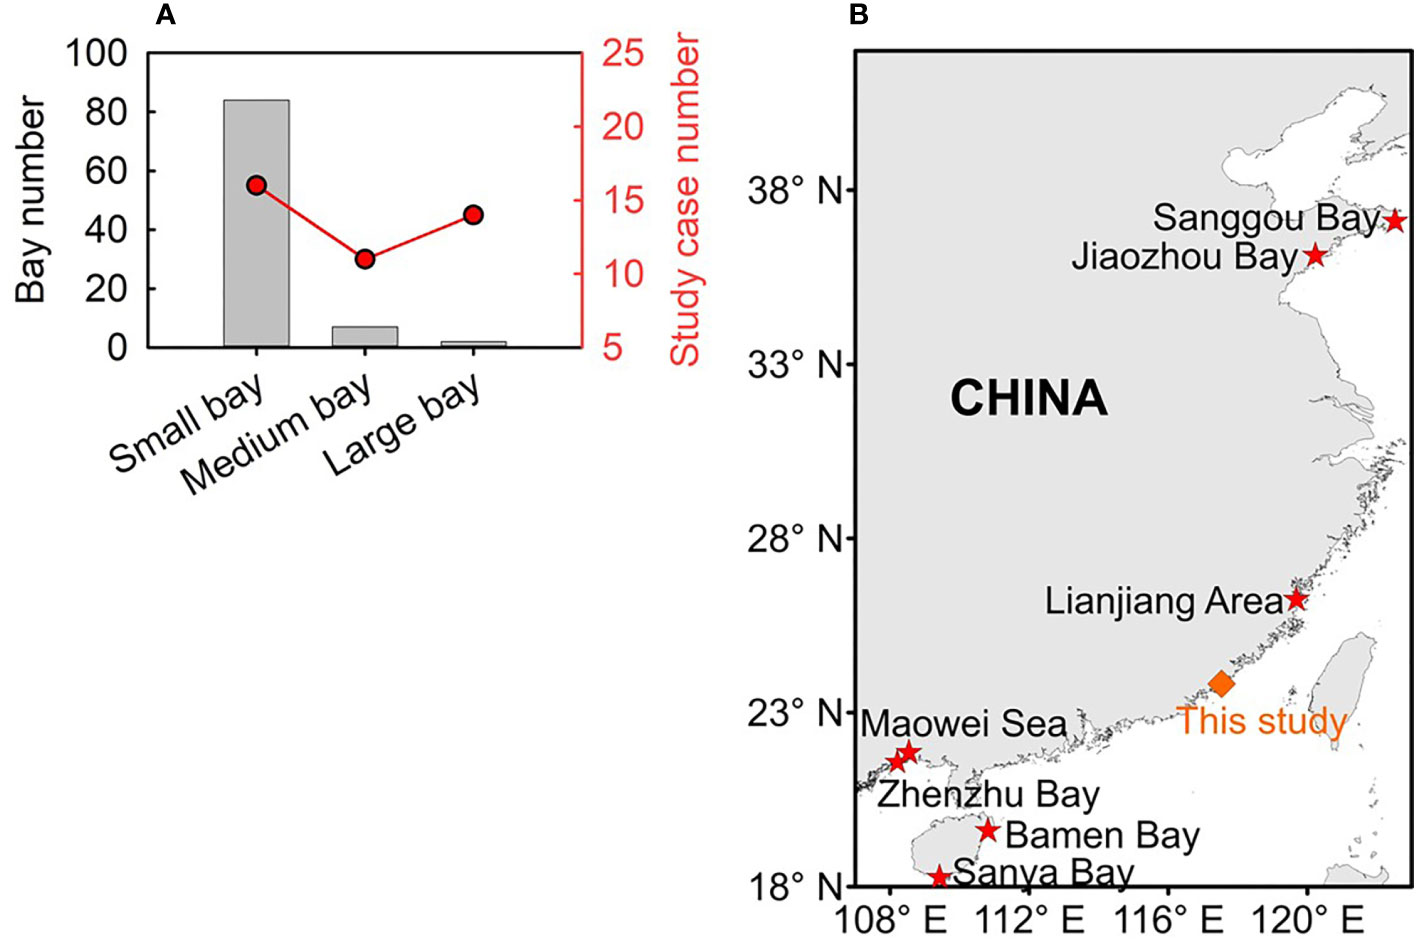
Figure 1 Studies on submarine groundwater discharge (SGD)-carried nutrient fluxes in Chinese embayments. (A) The number of embayments with different areas in China and the number of relevant SGD studies published as of 1 February 2023; (B) small embayments where studies on SGD-carried nutrients have been carried out.
To fill in this knowledge gap, we classified China’s bays into small (<500 km2), medium (500-2,000 km2), and large (>2,000 km2) according to the k-means clustering analysis (Jain, 2010) considering the surface area, length of shoreline, upstream river discharge, sediment porosity, and slope of the seabed of these bays (Figure S1, Supplementary Material (SM)). Then, Dongshan Bay was taken as a case study site of small bays. Dongshan Bay is located in Fujian Province in southeast China (Figure 2) with a total area of 247.9 km2. With the industry and population in this region growing rapidly (Gao et al., 2021), quantifying the sources of nutrients is essential in the sustainable ecosystem and recreational developments and management of Dongshan Bay. To investigate the role that SGD plays in the nutrient budget and distribution in Dongshan Bay and to further explore the relative importance of small bays along the entire Chinese coast, we chose 226Ra (half-life of 1,600 years) and 228Ra (half-life of 5.75 years) to trace SGD in this study as radium isotopes have been proven to be excellent natural tracers of SGD (Moore, 1996; Beck et al., 2007; Swarzenski et al., 2007).
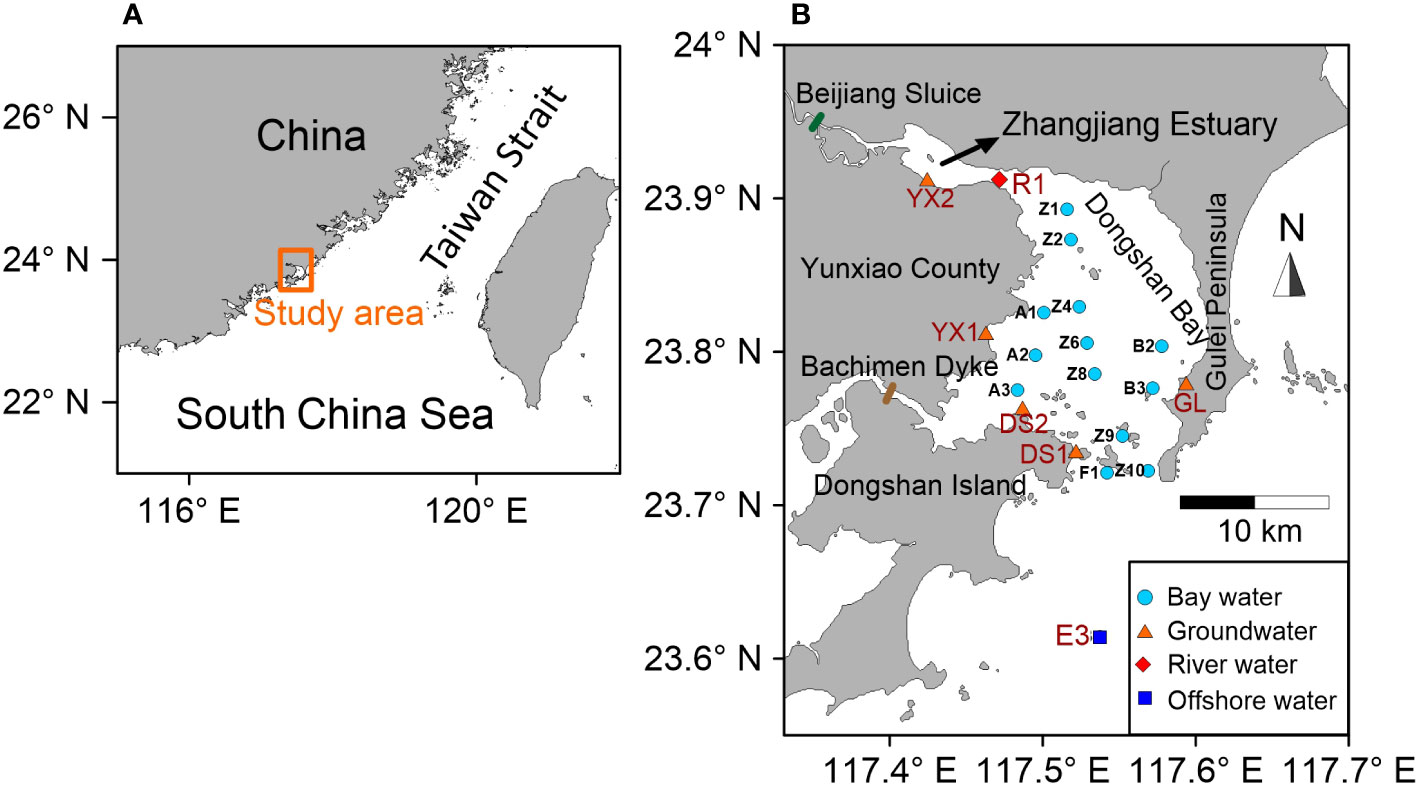
Figure 2 Study area and sampling stations in Dongshan Bay and its adjacent region. (A) Location of the study area and (B) sampling stations.
In this study, we calculated the SGD rate and SGD-associated nutrient fluxes in Dongshan Bay. We compared what was contributed by SGD to those from the Zhangjiang River and atmospheric deposition in the nutrient budget of Dongshan Bay and evaluated the relation between SGD and the distribution of nutrients in the bay. Finally, we extrapolated the SGD-associated nutrient fluxes to all the bays along the entire Chinese coast differentiating nutrient contributions via SGD in small, medium, and large bays.
2 Materials and methods
2.1 Study area
Dongshan Bay is a semi-enclosed water body with a narrow outlet of 5 km wide to the Taiwan Strait (Figure 2). The surface water area only covers 155.5 km2, with the rest being tidal flats (Liu, 2011). The Zhangjiang River flows into Dongshan Bay with an annual average discharge of 9.24 × 10⁵ m3 day−1 in 2020. Because of the influence of the East Asia monsoon, approximately 70% of the annual precipitation and approximately 50% of the annual river discharge occur from May to September (Figure 3).
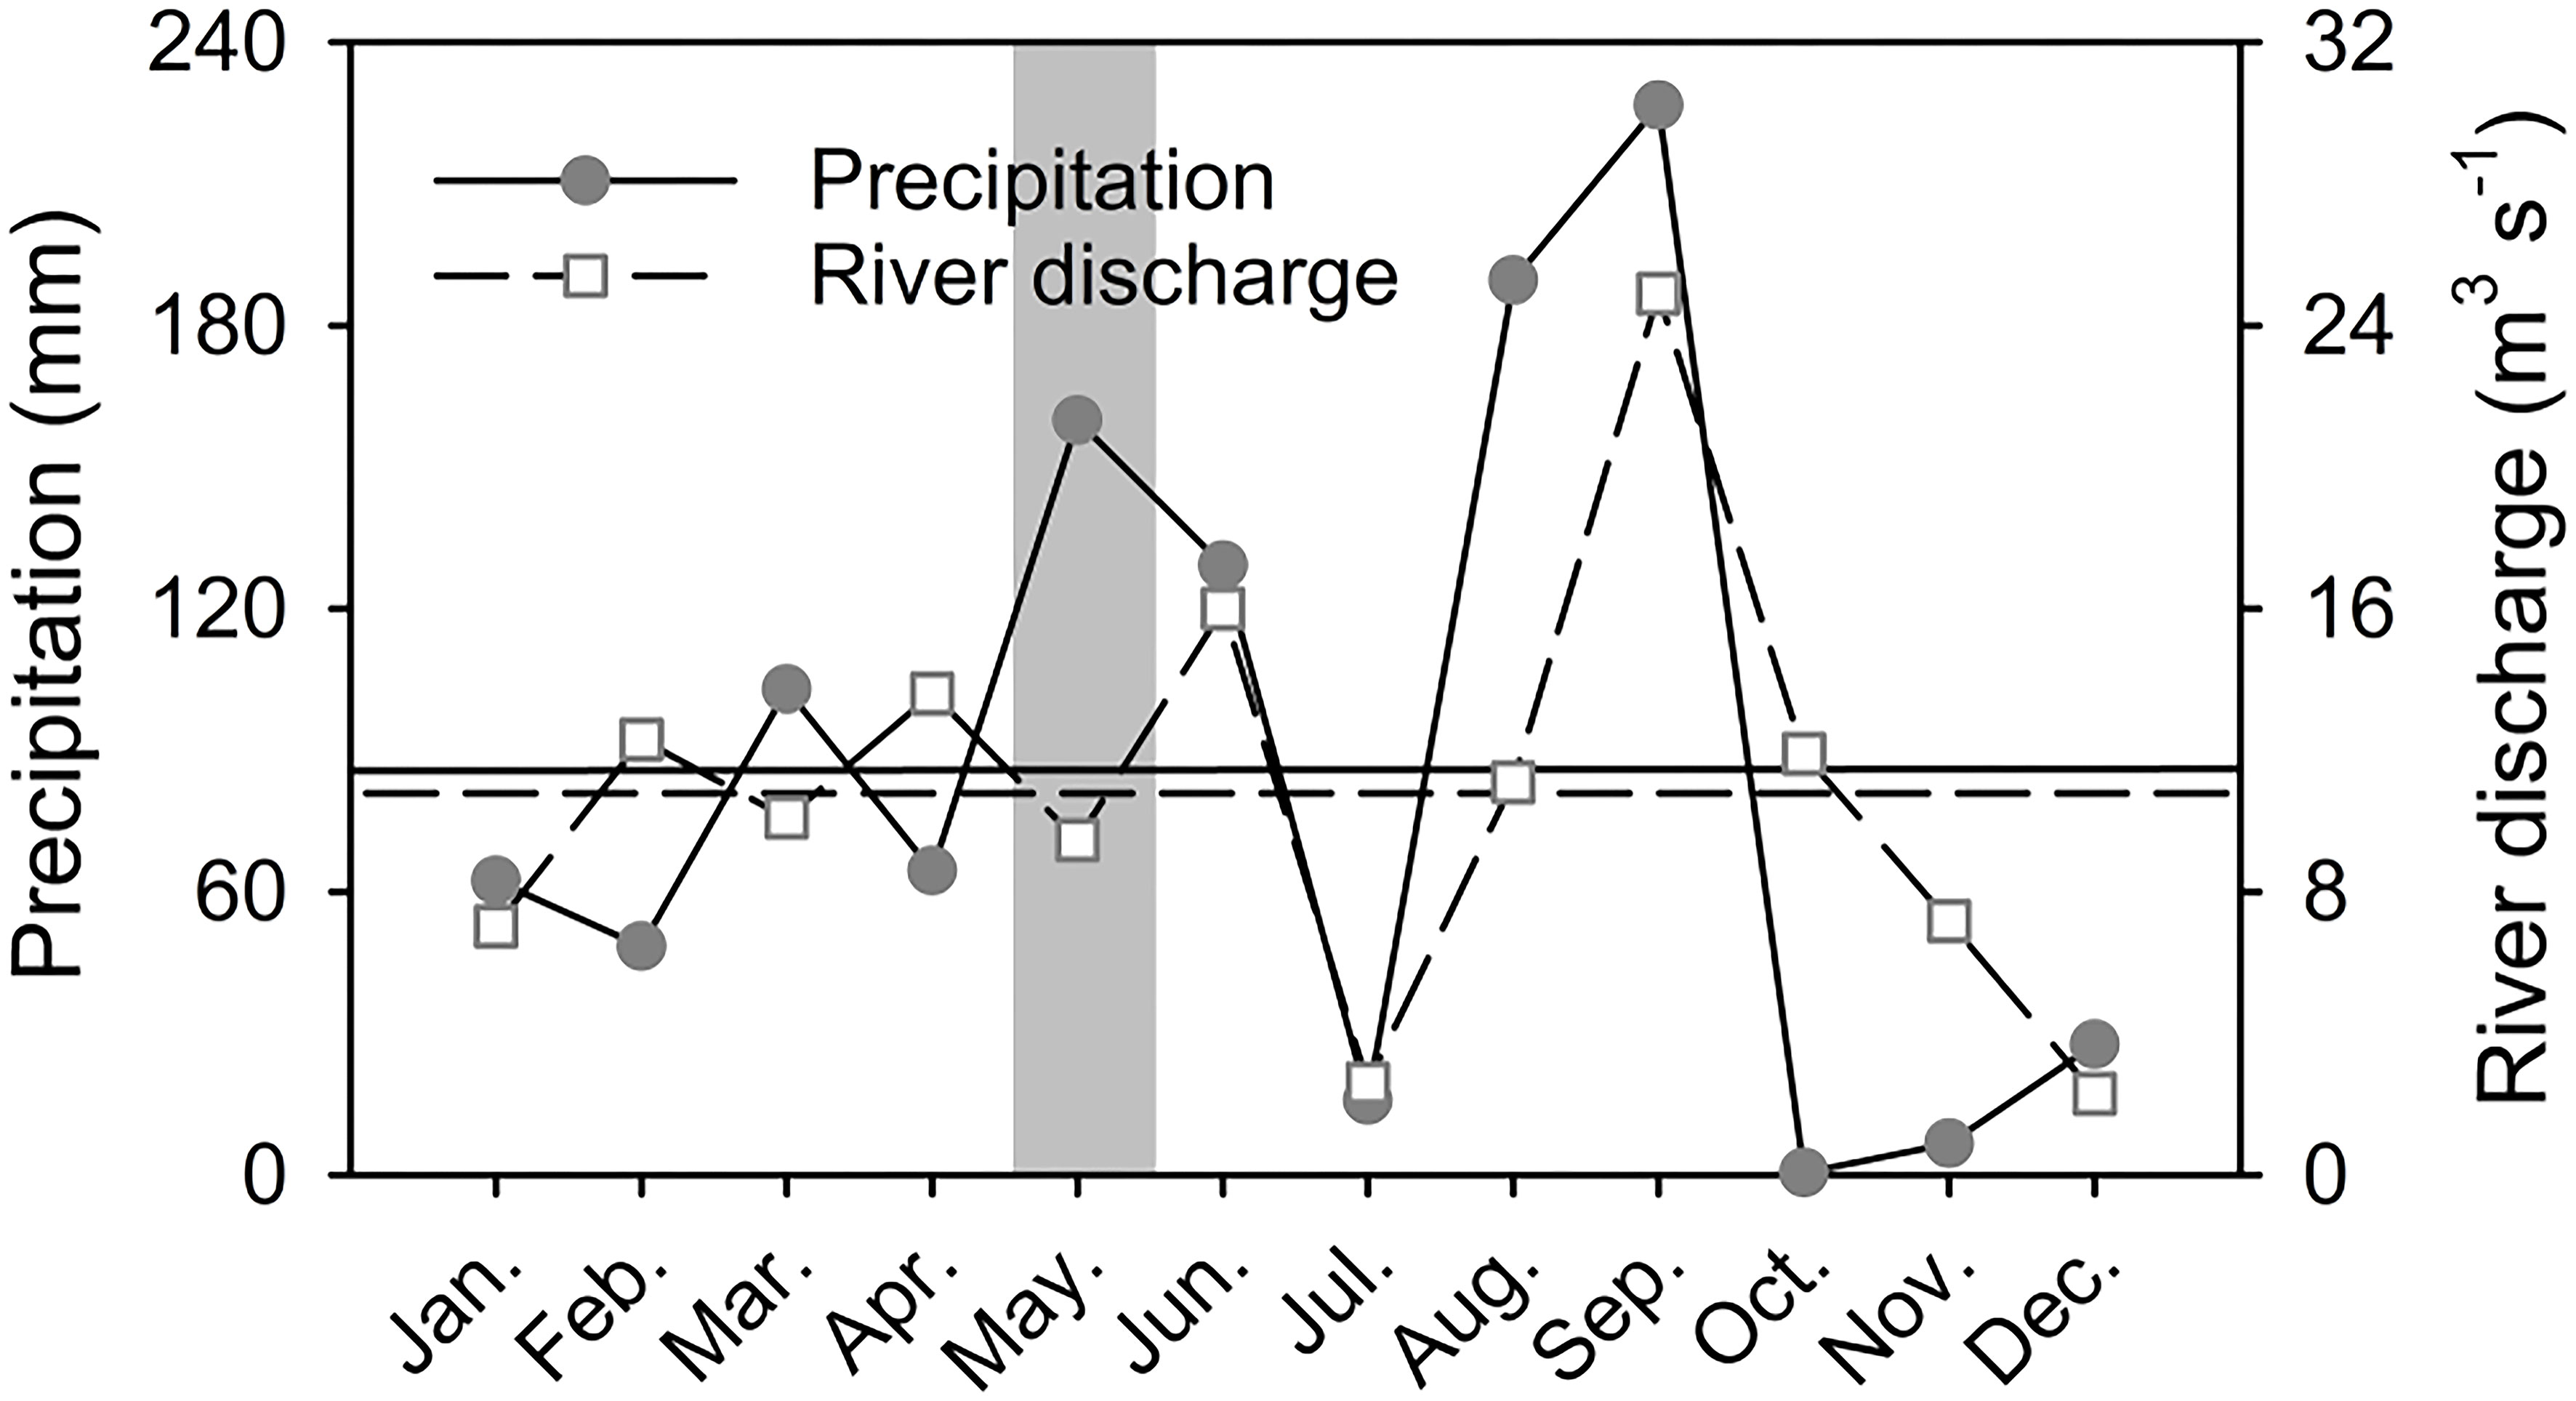
Figure 3 Precipitation and the Zhangjiang River discharge in 2020 in Dongshan Bay. The horizontal solid and long dash lines are the annual average precipitation (86.2 mm month−1) and river discharge (10.7 m3 s−1), respectively. Precipitation data were from http://fj.cma.gov.cn/and the Zhangjiang River discharge was from http://slj.zhangzhou.gov.cn/.
Dongshan Bay is dominated by irregular semidiurnal tides, with an average tidal range of 2.30 m and a tidal period of 12.22 h. The 0–0-5, 5-10, 10-20, and 20-36 m isobaths enclose surface water areas of 117.2, 22.1, 11.1, and 5.1 km2, respectively (Liu, 2011). The surface sediments in Dongshan Bay comprise sands, silty sands, sandy silts, and silts. On the left side of the bay, the sediments were sandy silts, excluding some areas near the Bachimen Dyke where sediments were silts. On the right side, the sediments were sandy silts from the bay inlet to the bay center, whereas the sediments were silty sands and sands from the bay center to the bay outlet (Gao et al., 2021). These sediments pile up on the top of crystalline granite bedrock with thickness up to 30 m. There are no confined aquifers directly connecting with Dongshan Bay (Zhang, 2021). The coast of Dongshan Bay has spatial heterogeneity with weak erosional coast in the west, clayey coast in the north, and sandy coast in the east (Liu, 2011).
As in most coastal systems in Fujian Province, Dongshan Bay is undergoing anthropogenic impacts associated with increasing human activities. With the construction of dams and reservoirs, terrigenous organic matter delivered to Dongshan Bay through the Zhangjiang Estuary was almost absent in May 2018 (Gao et al., 2021). There were no large-scale aquaculture activities in Dongshan Bay in May 2020 (Wu, 2021) except for one fish farm in the southwest corner (Cui et al., 2022).
2.2 Sampling and measurements
The surface water of Dongshan Bay was firstly scanned with an underway hydrographic mapping on 19 May 2020. Five days later, a 12-h time-series investigation was carried out at Site Z6 from 8:00 to 20:00 with water samples collected every 2 h. The continuous sampling started at the lowest tide and ended at the next lowest tide, which covered an entire tidal cycle including a flood tide and an ebb tide. Therefore, our sampling process could cover the hydrodynamic effects of tidal changes on SGD. On 28 May 2020, we carried out chemical sampling of the whole bay on board R/V Mindongyu 63093. Groundwater and river water samples were collected both on 29-31 December 2020 and 18-22 August 2021.
Approximately 20 L of bay water, river water, and offshore water samples were collected for dissolved radium isotopes from the surface using a plastic barrel and from the bottom using Niskin bottles. Another 5 L of water was collected for dissolved inorganic nitrogen (DIN), soluble reactive phosphorus (SRP), dissolved silicate (DSi), total suspended matter (TSM), and chlorophyll a (Chl. a) using Niskin bottles. Groundwater samples were collected using a PushPoint sampler (MHE products, USA) and a peristaltic pump at subsurface depths of 1.0-2.0 m on sandy beaches evenly distributed around Dongshan Bay. Approximately 2-8 L of groundwater was collected for dissolved radium. Approximately 2 L of groundwater samples were collected for DIN, SRP, and DSi. Time-series investigation was determined to be carried out at Site Z6 because the maximum concentration of Chl. a was found on 19 May 2020 using an EXO3 Multiparameter Sonde (YSI, Xylem Inc., Washington, DC, USA).
The temperature and salinity of bay water, river water, and offshore water samples were measured using a Conductivity-Temperature-Depth (CTD) System (AML-3, USA). The density anomaly, i.e., density − 1,000 in kg m−3, of seawater was calculated in accordance with Millero and Poisson (1981). The temperature and salinity of groundwater samples were measured using a multiparameter portable meter (WTW, Xylem Inc.).
Radium water samples were run through a 1-μm polypropylene cartridge before flowing through a preweighted column with 16 g of MnO2-coated fiber (Mn-fiber) at a flow rate of less than 0.5 L min−1 to extract dissolved radium with an efficiency greater than 95% (Wang et al., 2015). In the laboratory, Mn-fibers were washed using Ra-free deionized water with a salinity of 0 and temperature of 25°C. Then, Mn-fibers were leached using a mixture of 1 M of hydroxylamine hydrochloride and 1 M of HCl at a ratio of 2:1 at 90°C (Tan et al., 2018). After that, radium was coprecipitated with BaSO4 and the precipitate was sealed in a small counting vial for at least 3 weeks before being measured using a Canberra germanium well-type gamma detector (GCW4022, Canberra). The activity of 226Ra was determined using the energy peaks at 295, 352, and 609 keV. The activity of 228Ra was determined using the energy peaks at 338 and 911 keV (van Beek et al., 2010). We used the standards of 226Ra and 228Ra provided by the National Institute of Standards and Technology (NIST, USA) to determine the detection efficiency of the gamma detector. The 226Ra and 228Ra standards were co-precipitated and measured following the same process. The recovery of Ra in co-precipitation with BaSO4 was 99% (van Beek et al., 2010). The measurement errors of 226Ra and 228Ra were less than 4%.
Nutrient water samples were filtered using 0.45 µm pore-size cellulose acetate filters. Then, DSi samples were stored at 4°C after being preserved with 1‰-2‰ chloroform (Han et al., 2012), while nitrate (), nitrite (), ammonium (), and SRP samples were frozen and kept at −20°C before further analysis (Wang et al., 2018). Upon returning to our laboratory, , , DSi, and SRP were measured using an AA3 Auto-Analyzer. was measured using a spectrophotometer (Yan et al., 2012). The analytical errors were less than 1% for and , 2% for SRP, and 3% for and DSi (Wang et al., 2018). For the analysis of Chl. a, 200–400 ml of seawater was filtered onto 25-mm-diameter GF/F filters. Chl. a was extracted with acetone and determined using a Turner Trilogy fluorometer with an analytical error of less than 1% (Welschmeyer, 1994).
3 Results
3.1 Distribution of salinity and temperature in Dongshan Bay
From the bay inlet to the outlet, trends of salinity increase and temperature decrease for both the surface and bottom waters were observed (Figure 4), indicating mixing between the Zhangjiang estuarine water and the offshore seawater. The salinity ranged from 31.2 to 34.1 with an average of 33.2 for the surface water and from 32.3 to 34.1 with an average of 33.4 for the bottom water. Sites Z9, Z10, B3, and F1, located at or near the bay outlet, had the same salinity in both surface and bottom layers as the offshore station, Station E3, indicating the intrusion of the offshore seawater into Dongshan Bay and well mixing at these stations. The temperature (°C) varied from 25.1 to 26.7 with an average of 25.9 for the surface water and from 25.1 to 26.6 with an average of 25.8 for the bottom water. Based on the density anomaly, water stratification appeared in the bay inlet at Stations Z2 and Z4, near the Zhangjiang Estuary (Figure 5), indicating the influence of the Zhangjiang River plume.
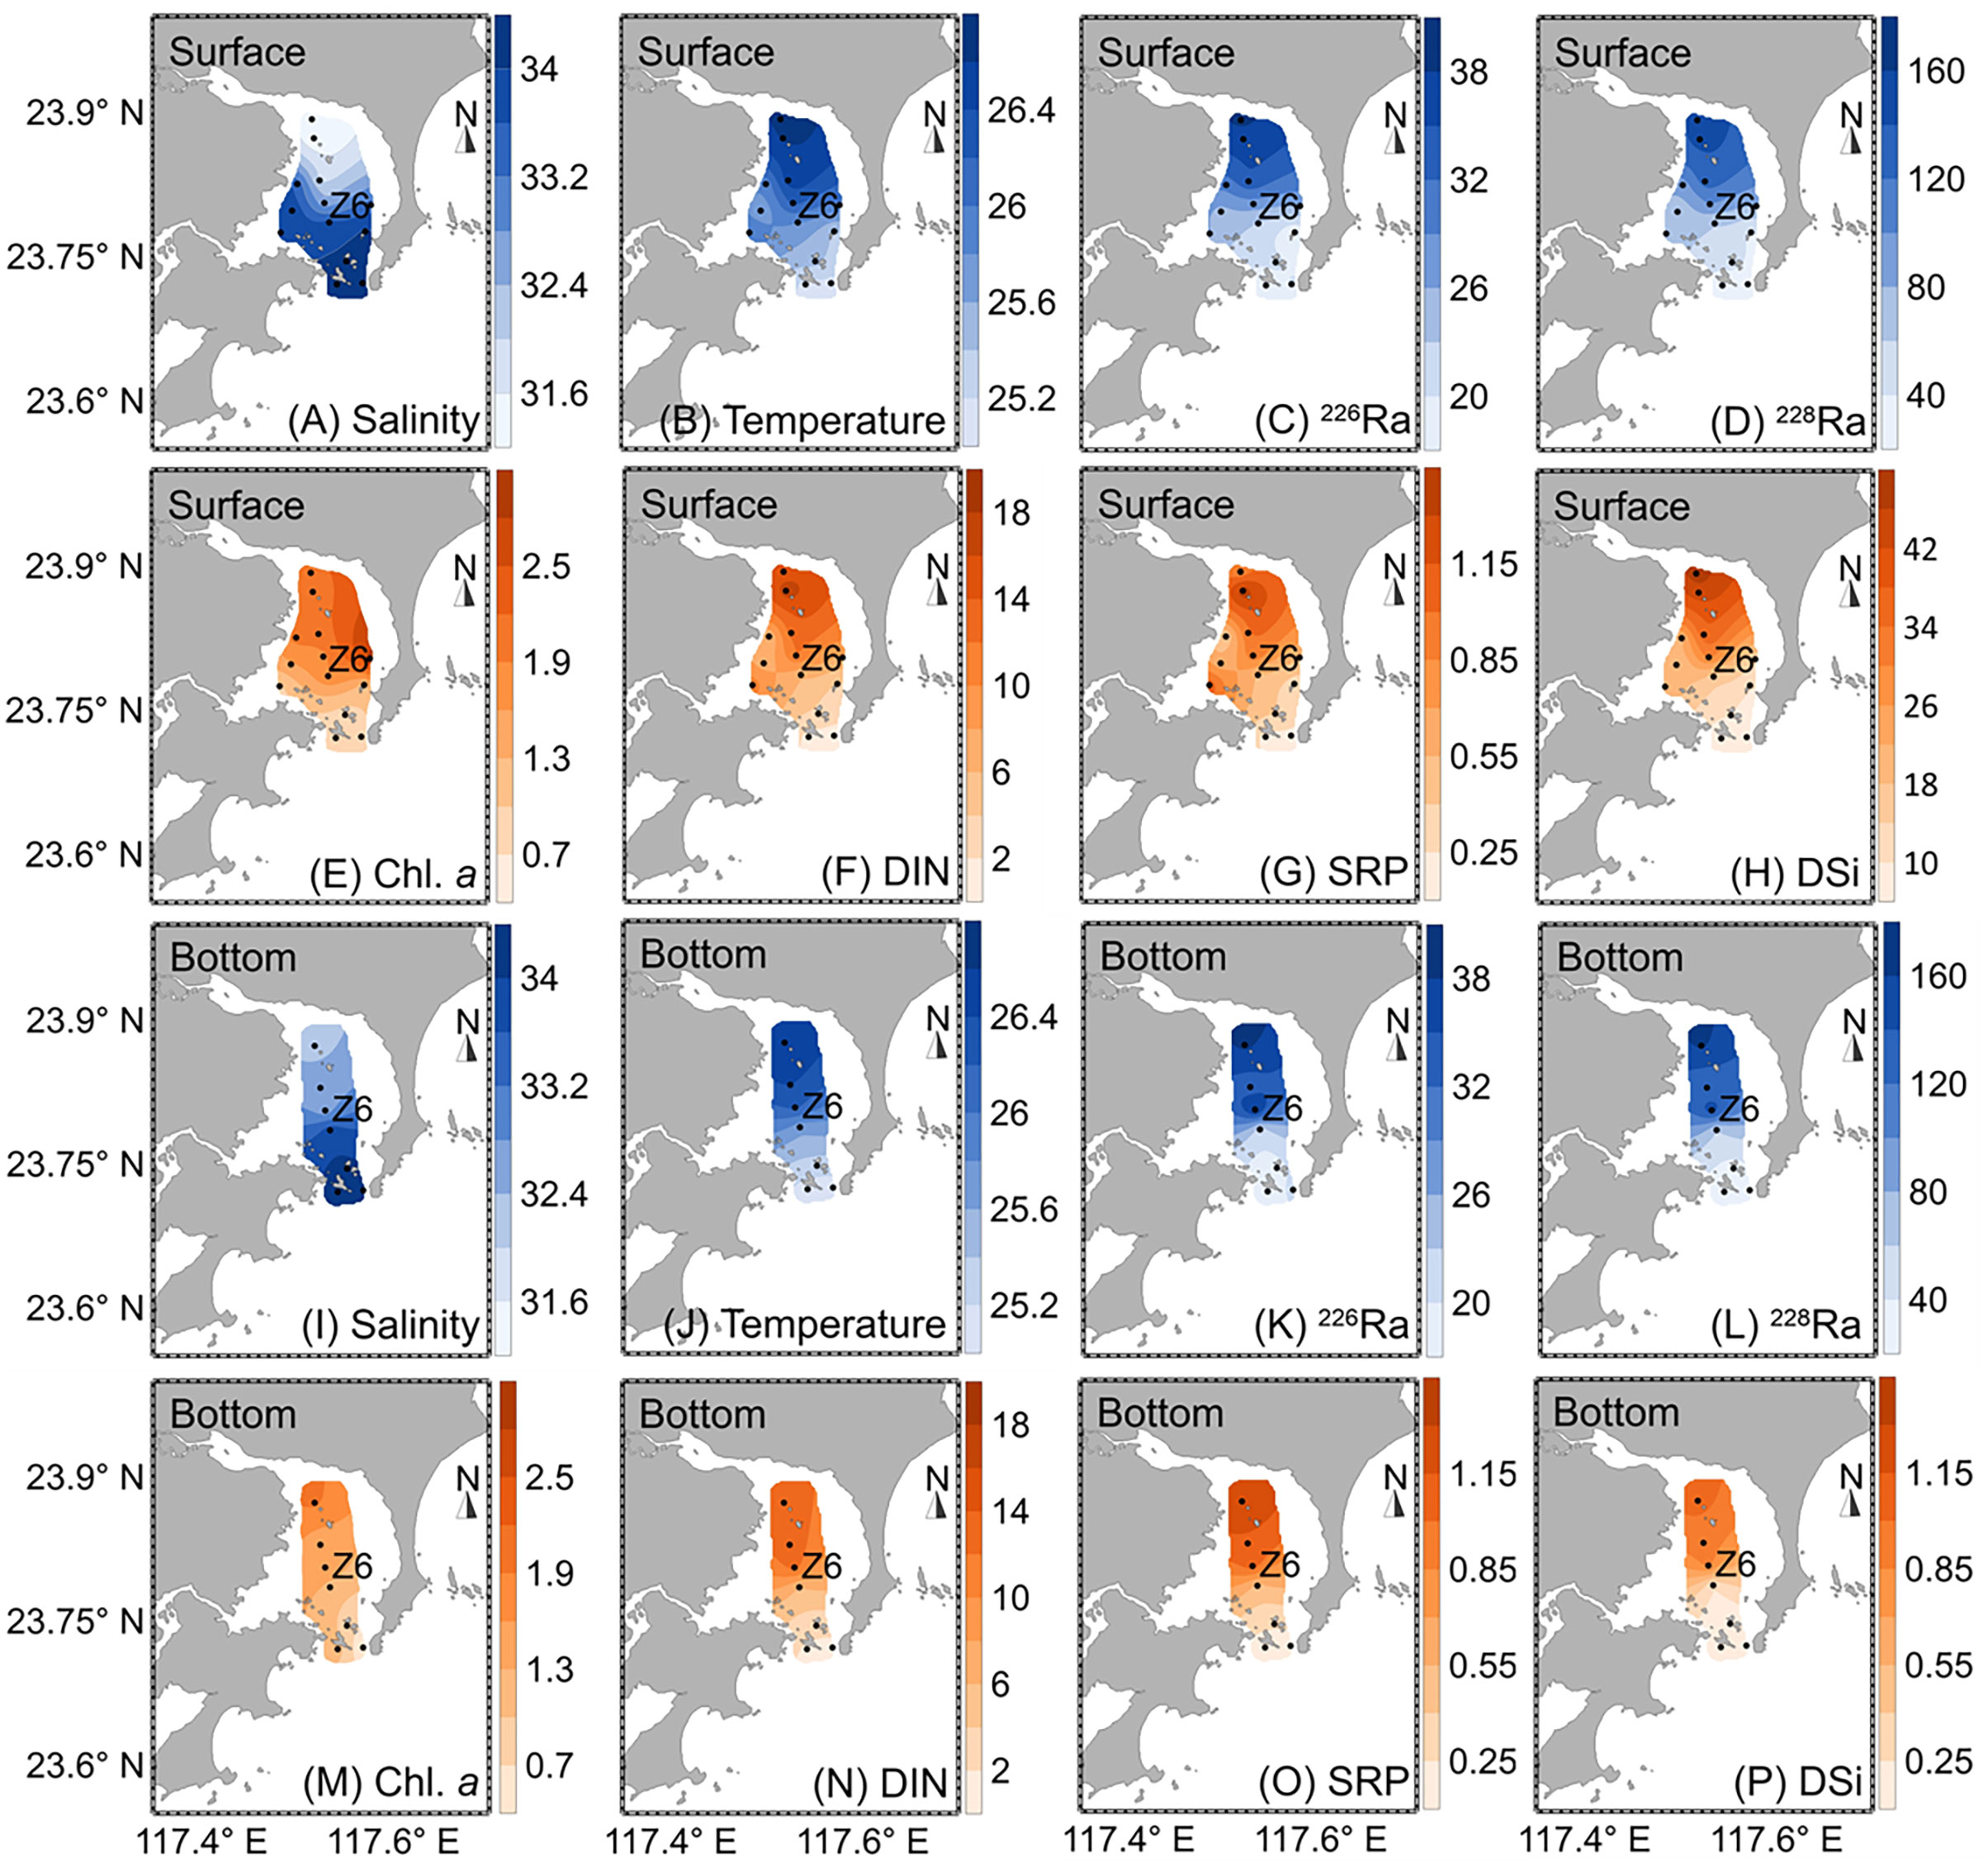
Figure 4 Distribution of salinity, temperature (°C), radium isotopes (dpm 100 L−1), Chl. a (μg L−1), and nutrients (μmol L−1) in Dongshan Bay on 28 May 2020. (A–H) surface water and (I–P) bottom water.
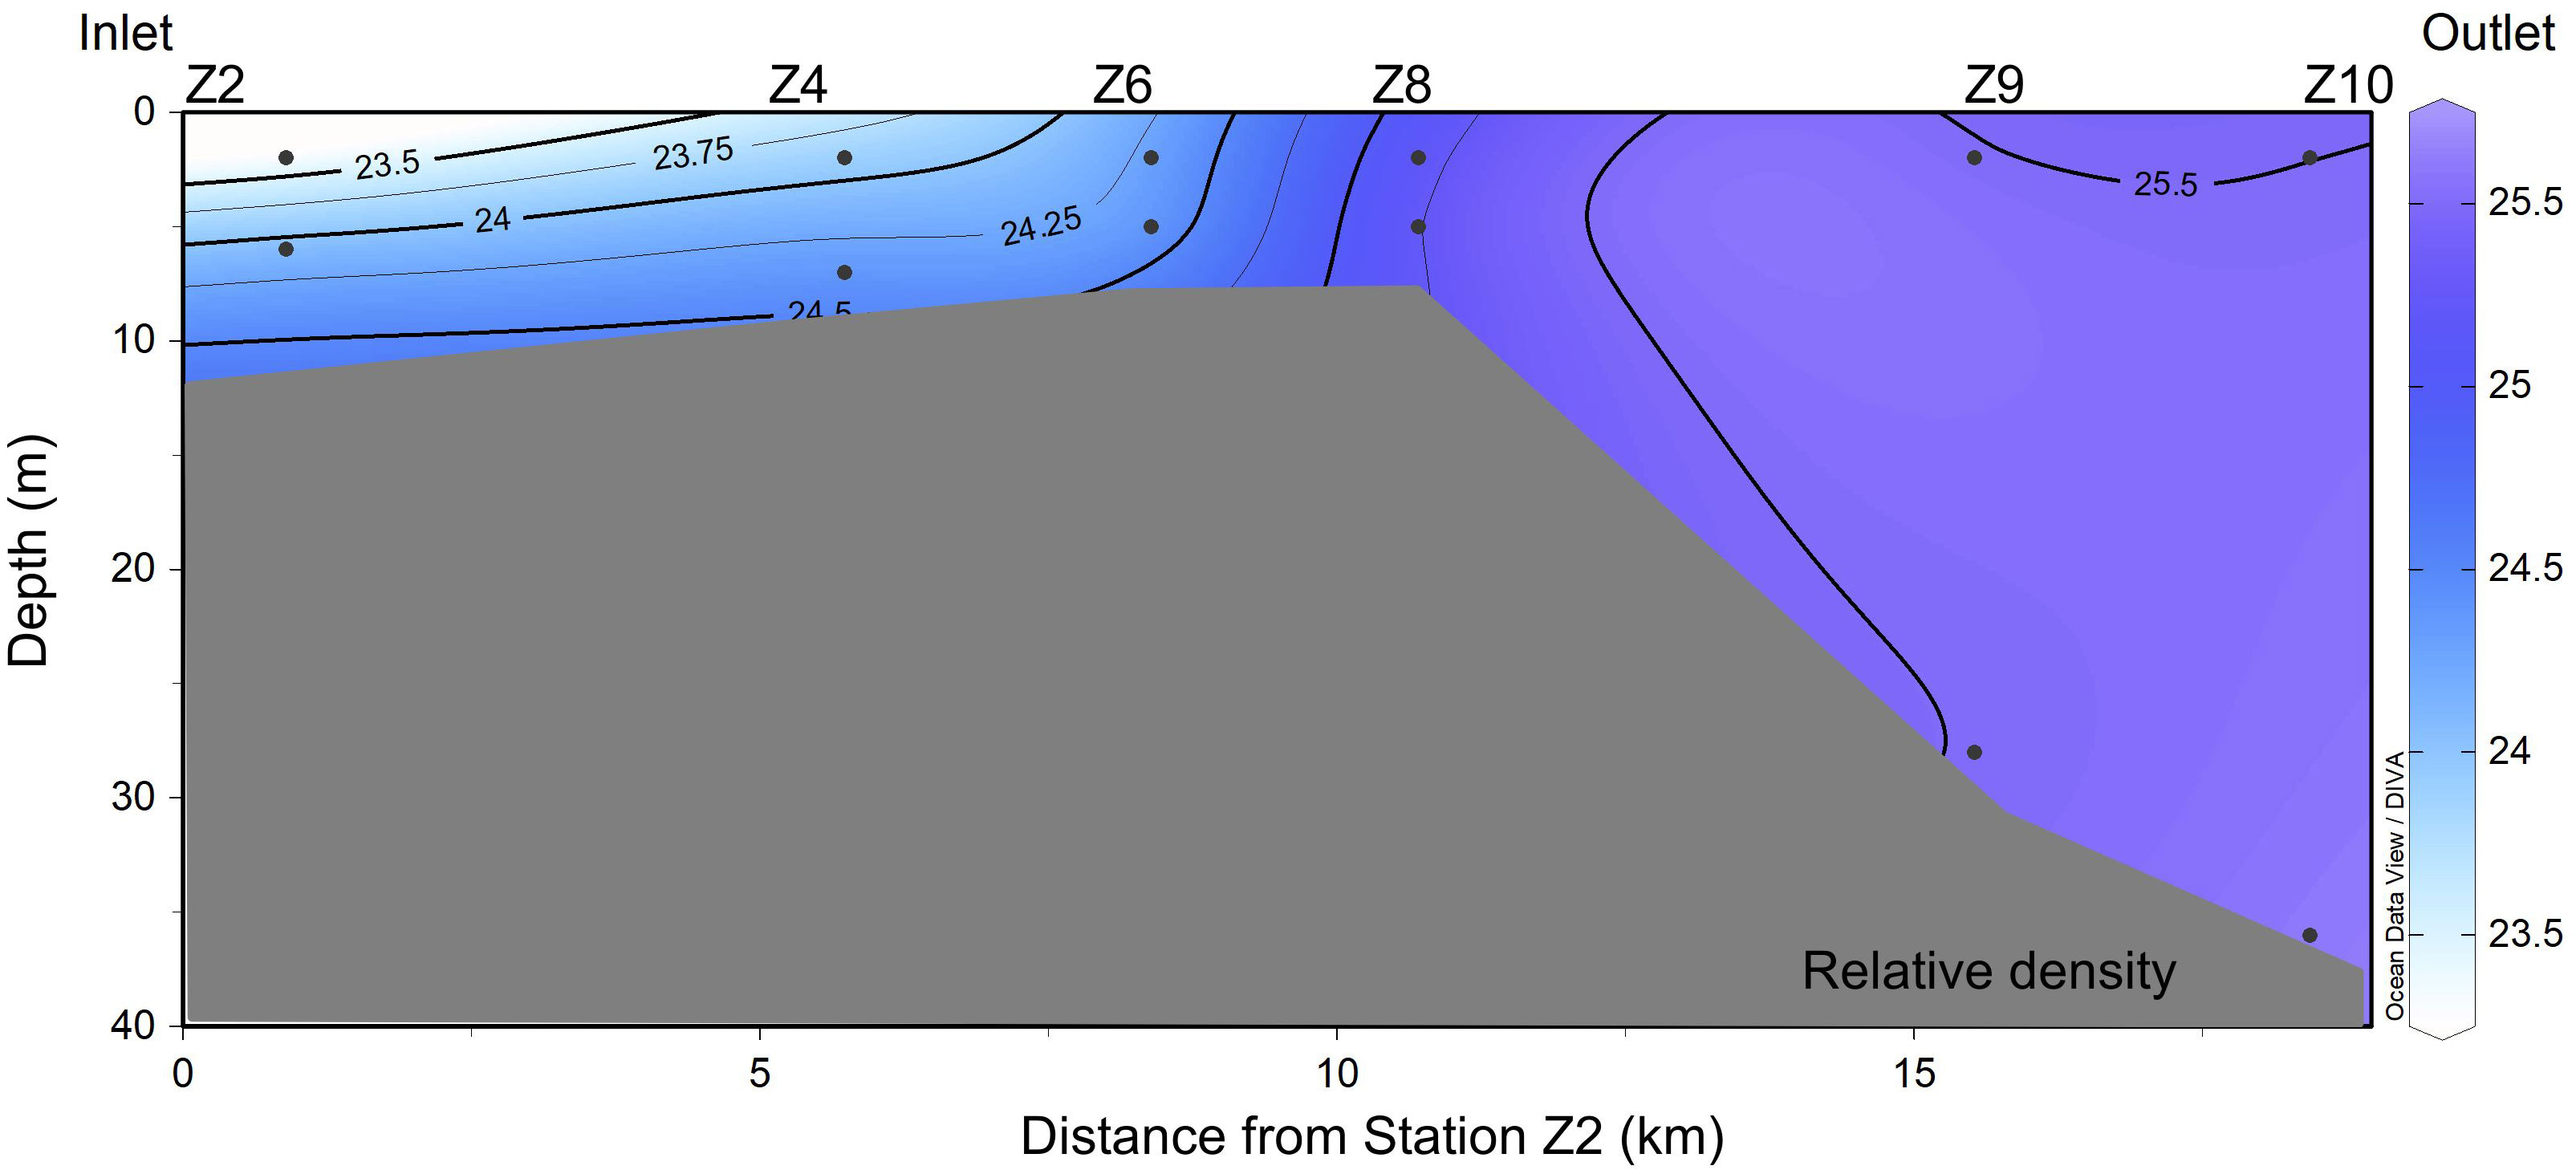
Figure 5 The sectional distribution of the density (kg m−3) anomaly from the inlet to the outlet in Dongshan Bay on 28 May 2020. The figure was produced using Ocean Data View v. 5.6.2 (https://odv.awi.de).
3.2 Distributions of radium isotopes and Chl. a in Dongshan Bay
Contrary to the salinity distribution, the activity of radium isotopes and the concentration of Chl. a decreased from the bay inlet toward the outlet (Figure 4). In the surface water, the activities (dpm 100 L−1) of 226Ra and 228Ra ranged from 17 to 39 and 27 to 147, respectively (Table S1, SM). The bottom activity (dpm 100 L−1) ranged from 18 to 39 for 226Ra and 29 to 163 for 228Ra, respectively. Vertically, the activity of 226Ra in the bottom water was indistinguishable, considering its maximum measurement error, from that in the surface except at Site Z6 where the bottom activity was greater by 42% than in the surface (Figure S2, SM). The vertical pattern of 228Ra differed near the inlet, Sites Z2 and Z4, and the outlet, Site Z9, where approximately 10% of vertical difference was present. At Site Z4, the activity of 228Ra in the surface water was greater than that in the bottom water because of the spreading of the Zhangjiang River plume as shown by the apparent water stratification (Figure 5). The bay-wide 228Ra was positively correlated with 226Ra significantly with a slope of 6.02 ± 0.28 (P< 0.01, R2 = 0.96) (Figure S3, SM). At Site Z6, we observed a local maximum in the activity of radium isotopes in the bottom water (Figure 4), where a relatively high concentration of Chl. a, 5.02 μg L−1, in the surface water was observed approximately 10 days earlier in the underway mapping (Figure 6). On 28 May 2020, the concentration of Chl. a (μg L−1) decreased from 2.86 in the inlet to 0.84 in the outlet with an average of 1.61 in the surface layer and from 1.95 to 0.85 with an average of 1.22 in the bottom layer.
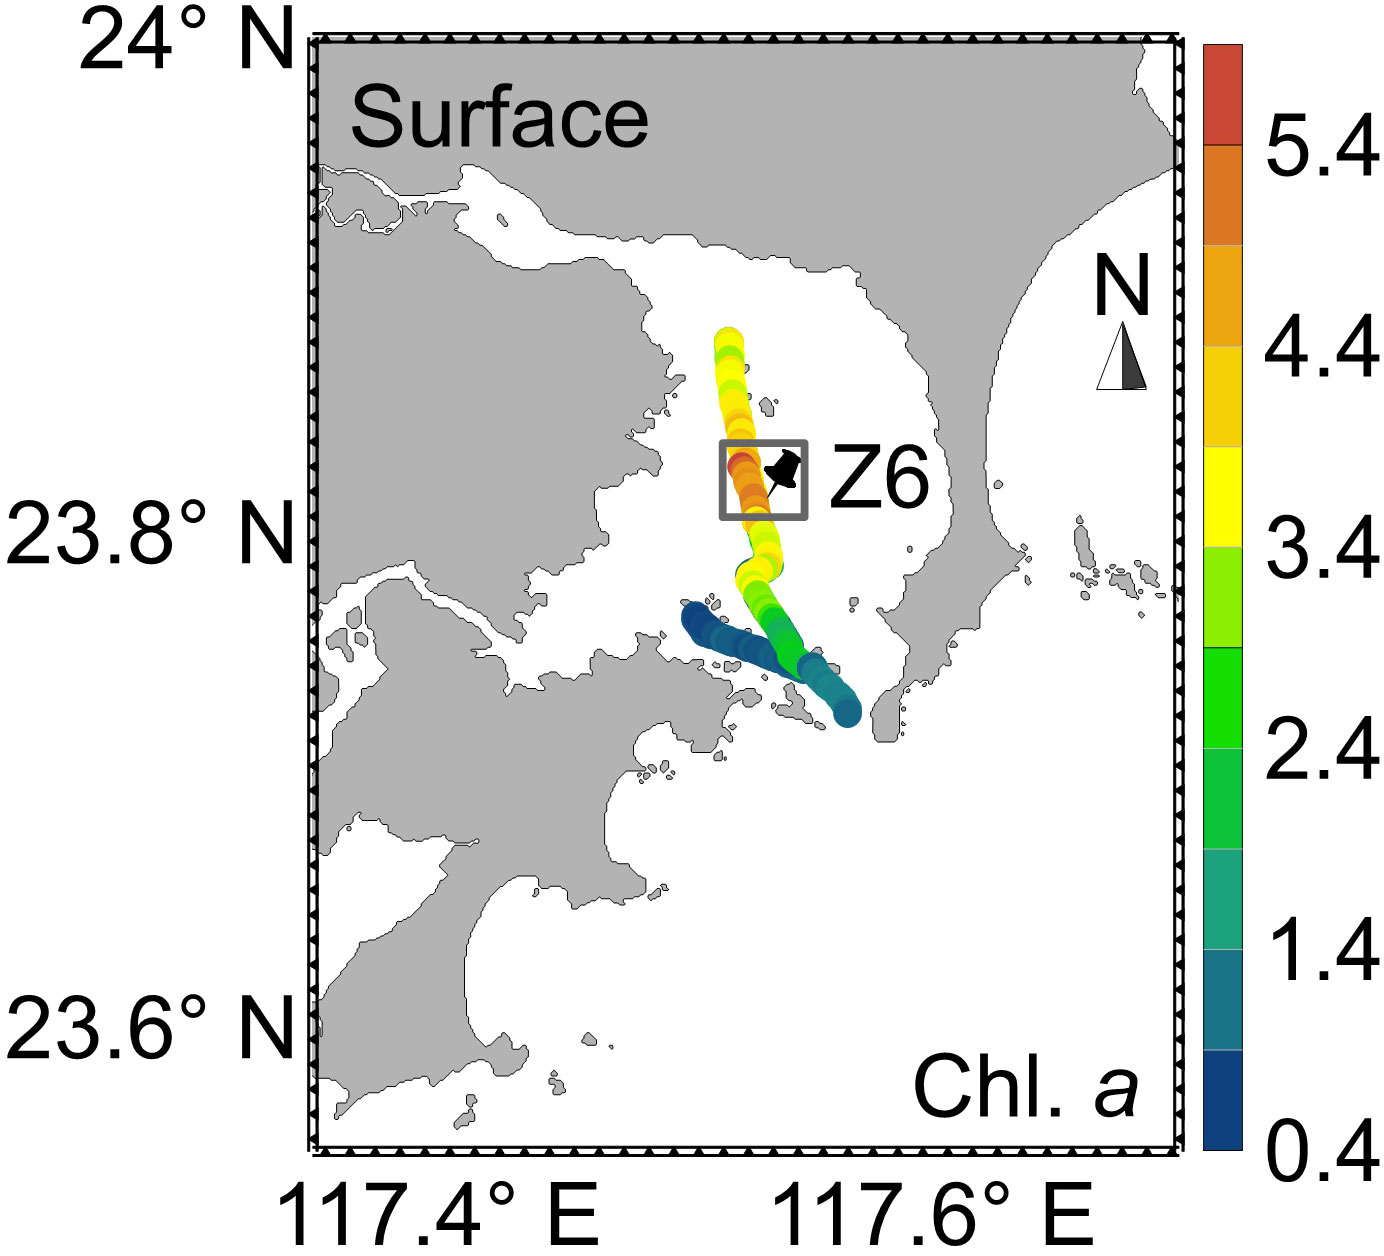
Figure 6 The distribution of Chl. a (μg L−1) in Dongshan Bay based on an underway investigation on 19 May 2020. Site Z6 and its surrounding area (framed by the gray rectangle) showed the highest Chl. a concentration.
3.3 Distributions of nutrients in Dongshan Bay
Similar to the radium distribution, there was a general trend of nutrients decreasing from the inlet to the outlet (Figure 4). In the surface layer, the concentrations of nutrients (μmol L−1) varied from 1.28 to 17.1 for DIN, 0.20 to 1.41 for SRP, and 6.98 to 47.6 for DSi. In the bottom water, the concentrations of nutrients (μmol L−1) ranged from 1.45 to 12.8 for DIN, 0.16 to 1.28 for SRP, and 6.71 to 35.2 for DSi (Table S1, SM). Vertically, the concentrations of nutrients were greater by 37% for DIN, 10% for SRP, and 26% for DSi in the surface water in the bay inlet (Site Z2) (Figure S2, SM), due to the spreading of the Zhangjiang River plume (Figure 5). Further downstream, the differences in nutrient concentrations between the surface and bottom waters got smaller. In the bay center (Site Z6), the concentrations of DIN and SRP in the bottom water were greater by 6% and 13%, respectively, than in the surface, while the concentration of DSi showed no vertical difference. Even further downstream, however, the vertical nutrient structure was back to the pattern of higher concentrations in the surface at Site Z9 due to the intrusion of dense offshore seawater with lower concentrations of nutrients (Figure 5).
3.4 Time-series observations in the bay center
At Site Z6, salinity changed in phase with water depth for both surface and bottom waters (Figure 7A). The surface salinity increased from 32.6 to 33.7 during the flood tide and decreased from 33.7 to 31.9 during the ebb tide, while the bottom salinity increased from 32.6 to 34.0 during the flood flow and decreased from 34.0 to 32.0 during the ebb flow. Temperature varied in antiphase with water depth in the bottom but showed a trend of increasing with time on the surface during the day (Figure 7B). The tidal pattern of the activity of 228Ra almost mirrored the water depth in both surface and bottom waters (Figure 7C). The surface activity (dpm 100 L−1) of 228Ra decreased from 132 to 52 during the flood tide and increased from 52 to 151 during the ebb tide. In the bottom water, the activity of 228Ra decreased from 119 to 50 during the flood flow and increased from 50 to 142 during the ebb flow.
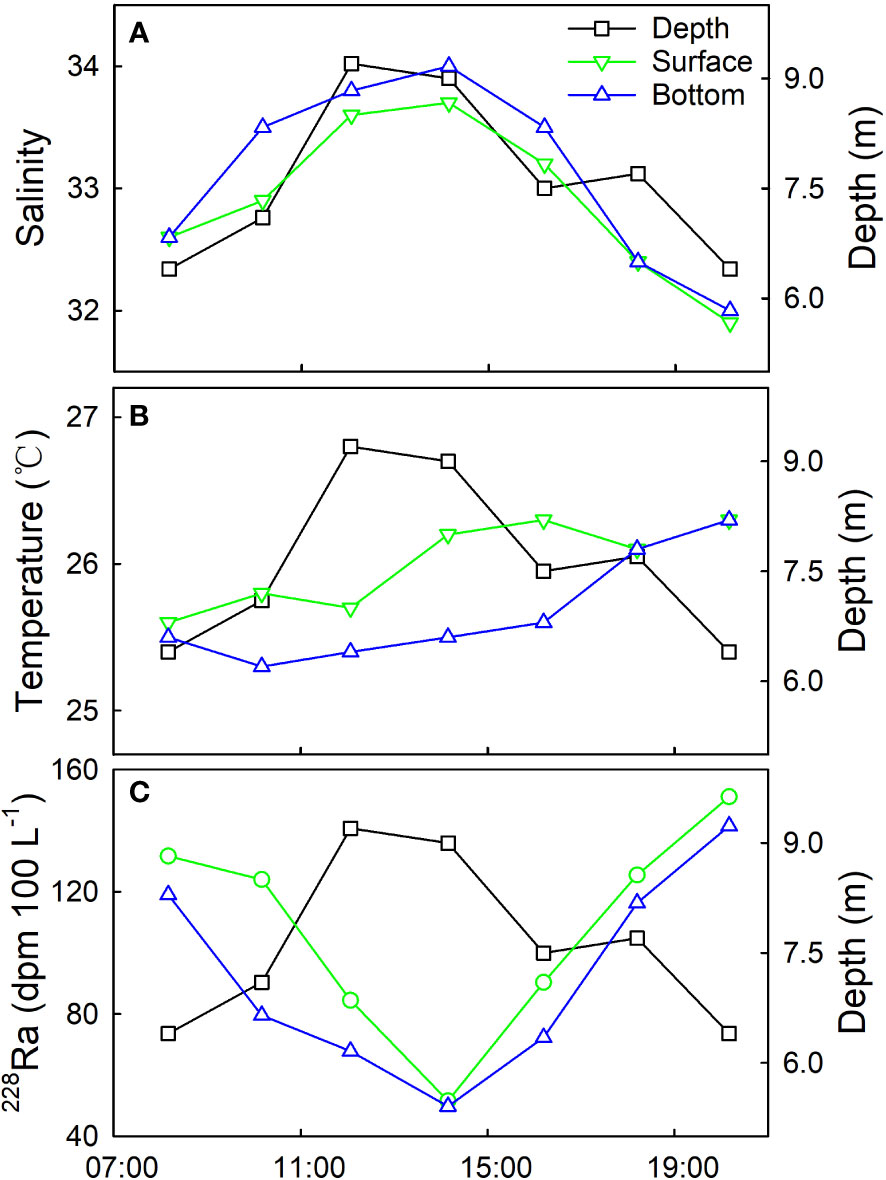
Figure 7 Time-series observations of hydrographic parameters and the activity of 228Ra in the surface and bottom waters at Site Z6 on 24 May 2020. (A) Water depth and salinity, (B) temperature, and (C) 228Ra.
3.5 Groundwater parameters
Spatial and temporal variations were present in the hydrographic and chemical parameters of the groundwater. The salinity of groundwater sampled varied from 22.7 to 30.1 with an average of 27.5 in December 2020 and ranged from 12.7 to 32.9 with an average of 27.1 in August 2021 (Table 1), all of which were slightly lower than those of the adjacent seawater, suggesting that we had sampled groundwater close to the discharging point and most of the groundwater was recirculated seawater. The radium activities (dpm 100 L−1) fell in the range from 76 to 222 in December and from 52 to 441 in August for 226Ra and from 299 to 1241 in December and from 335 to 3038 in August for 228Ra. The seasonal variation in 228Ra with a standard deviation of 223 dpm 100 L−1 was much smaller than its spatial variation with a standard deviation of 505 dpm 100 L−1. The activity of 228Ra significantly correlated with that of 226Ra in the groundwater (P< 0.01, R2 = 0.81) with a slope of 6.54 ± 1.11 (Figure S3, SM), indicating a uniform source of radium in the coastal aquifer. This slope deviated greatly from that in the river water, 1.00, but was similar to that in the bay water, 6.02 ± 0.28, suggesting that the radium in the bay water was mainly sourced from the saline groundwater and confirming that our selection of the groundwater end-member is proper.
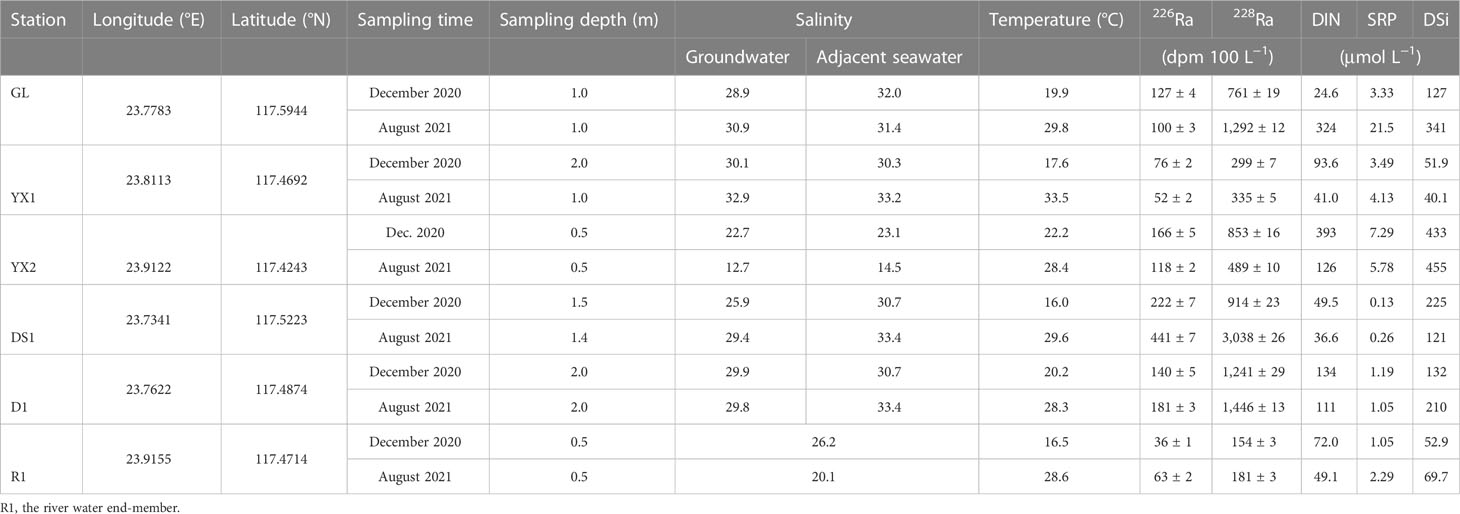
Table 1 Radium activities and nutrient concentrations in the coastal groundwater around Dongshan Bay and the river water end-member.
The concentrations of nutrients (μmol L−1) ranged from 24.6 to 393 for DIN, from 0.13 to 7.29 for DIP, and from 51.9 to 433 for DSi in December and from 36.6 to 324 for DIN, from 0.26 to 21.5 for DIP, and from 40.1 to 455 for DSi in August. Similar to the radium isotopes, the seasonal standard deviations in nutrients were at most half as much as their spatial standard deviations. However, there were no significant correlations between 228Ra and nutrients in the groundwater. The mean values of radium activities and nutrient concentrations of the groundwater were an order of magnitude greater than those of the bay water. In choosing our groundwater end-member, an assumption was that no significant transformation of radium and nutrients in the groundwater had occurred before discharging. The mean values of salinity and radium activities were used in the calculation of the flux of SGD to reduce the uncertainty caused by seasonal and spatial variations.
4 Discussion
4.1 The SGD flux and net associated nutrient fluxes in Dongshan Bay
4.1.1 The flux of SGD on the bay-wide scale
The sources of dissolved radium in Dongshan Bay include the Zhangjiang River, diffusion from sediments, and SGD. The loss terms of radium are mixing with the offshore seawater and radioactive decay. In terms of 228Ra, its decay loss can be neglected in coastal systems where the residence time is usually at least an order of magnitude shorter than its half-life (Wang et al., 2015). For Dongshan Bay, with semi-enclosed geomorphology and relatively stable hydrodynamic conditions (Qin and Zhao, 2020), an assumption of steady state is valid within our investigation period of 10 days, i.e., the sources of radium balance its losses. Thus, a radium mass balance model can be set up as follows (Wang et al., 2018):
where is the Zhangjiang River discharge, 228RaR and 228RaGW are the activities of dissolved 228Ra of the river and groundwater, and CTSM is the concentration of TSM of the river end-member, for which the TSM at Station Z1, 26.0 mg L−1, was used. 228Rad is the activity of desorbable 228Ra on suspended particles with a value from the Jiulong River nearby adopted (Wang et al., 2015), FSED is the diffusive flux of 228Ra from sediments, and A is the surface water area of Dongshan Bay, 155.5 km2. The sediments of Dongshan Bay are mainly composed of sands and silts (Gao et al., 2021), which are the same as the sediment composition in Jiaozhou Bay (Zhang et al., 2020b). Thus, the diffusive flux, 5.52 dpm m−2 day−1, used in Jiaozhou Bay was adopted in this study. FSGD is the flux of SGD. is the total inventory of excess 228Ra in Dongshan Bay. The investigated area was divided into 13 equal-sized grids. was estimated by integration over the grids (Wang et al., 2018).
Tf is the flushing time of Dongshan Bay. Assuming that the influence of winds was negligible, which is valid as no strong wave was observed in Dongshan Bay (Qin and Zhao, 2020), a tidal prism model was adopted to calculate the flushing time (Liu et al., 2018):
where Vbay is the volume of bay water, VP is the volume of the mean tidal prism, b is the return flow factor, and T is the tidal period, 12.22 h. Vbay was estimated as,
where Ai, i = 1, 2, 3, 4, is the area enclosed by 0-5, 5-10, 10-20, and 20-36 m isobath, respectively, and Hi is the average water depth of Ai. The mean tidal prism was estimated by multiplying the water surface area by the mean tidal range. The return flow factor, b, represents the fraction of the offshore seawater from the Taiwan Strait into Dongshan Bay. It can be determined using a three-end-member mixing model (Wang et al., 2015).
where f is the fraction of each end-member in Dongshan Bay, S and 228Ra are the salinity and the activity of 228Ra, and the subscripts “O,” “R,” “B,” and “GW” refer to “offshore seawater,” “river water,” “bay water,” and “groundwater,” respectively. Here, fO = b. All the values of the parameters used in Eqs. (2) and (4) are listed in Table S2, SM. The flushing time in Dongshan Bay was 9.85 ± 1.57 days, which is comparable to the mean semi-exchange period of Dongshan Bay, 10.6 days based on a planar 2-D mathematical model (Qin and Zhao, 2020). Then, the flux of SGD was calculated from Eq. (1) with the values of parameters listed in Table S3, SM. The flux of SGD on the bay-wide scale in May was (7.47 ± 3.40) × 106 m3 day−1, which was approximately 9 times greater than the concomitant Zhangjiang River discharge. After dividing the flux of SGD by the water surface area, the SGD rate in Dongshan Bay was 0.048 ± 0.022 m day−1. The SGD rate was also estimated using another tracer, 226Ra, using a similar calculation procedure to 228Ra. The SGD rate based on the 226Ra mass balance model was (0.065 ± 0.015) m day−1, comparable to that based on the 228Ra mass balance model, (0.048 ± 0.022) m day−1. The consistency of the SGD rates based on the two traces suggested the reliability of our estimates.
4.1.2 The net SGD-associated nutrient fluxes
The net nutrient fluxes carried by SGD were calculated with the flux of SGD in May 2020 multiplied by the difference in nutrient concentrations between the groundwater and bay water. To have a conservative estimate, the SGD flux derived from the 228Ra mass balance model was chosen. The median, instead of the mean, values of nutrient concentrations in the groundwater were used to avoid large uncertainties caused by extreme values. The riverine nutrient fluxes were calculated with the river discharge in May 2020 multiplied by the nutrient concentrations of the river water. The net DIN, SRP, and DSi fluxes via SGD were (7.06 ± 0.82) × 105, (2.05 ± 0.34) × 104, and (1.12 ± 0.34) × 106 mol day−1, respectively, which were at least an order of magnitude greater than the concomitant riverine fluxes in May (Figure 8A). Such small riverine nutrient fluxes may be due to dam construction in the Zhangjiang River upstream (Gao et al., 2021) and nutrient retention in the mangrove system of the Zhangjiang Estuary (Wang F. et al., 2021). Sand and silt are the predominant sediment types in the bay (Gao et al., 2021); thus, the contribution of nutrients from sediment diffusion in the nutrient budget is negligible (Zhou et al., 2022). Taking the dry deposition flux of DIN (nitrate plus ammonium) in the western Taiwan Strait (Wu et al., 2019), 40.8 μmol m−2 day−1, the atmospheric deposition of DIN in Dongshan Bay was calculated to be 6.34 × 10³ mol day−1, which was an order of magnitude lower than the riverine input. The only fish farm in Dongshan Bay was close to Site A3 (Cui et al., 2022). However, we did not observe point-source-induced nutrient anomaly at this site, suggesting no apparent influence on nutrients from local aquaculture in this system. Therefore, SGD was the predominant nutrient source in Dongshan Bay during our investigation.
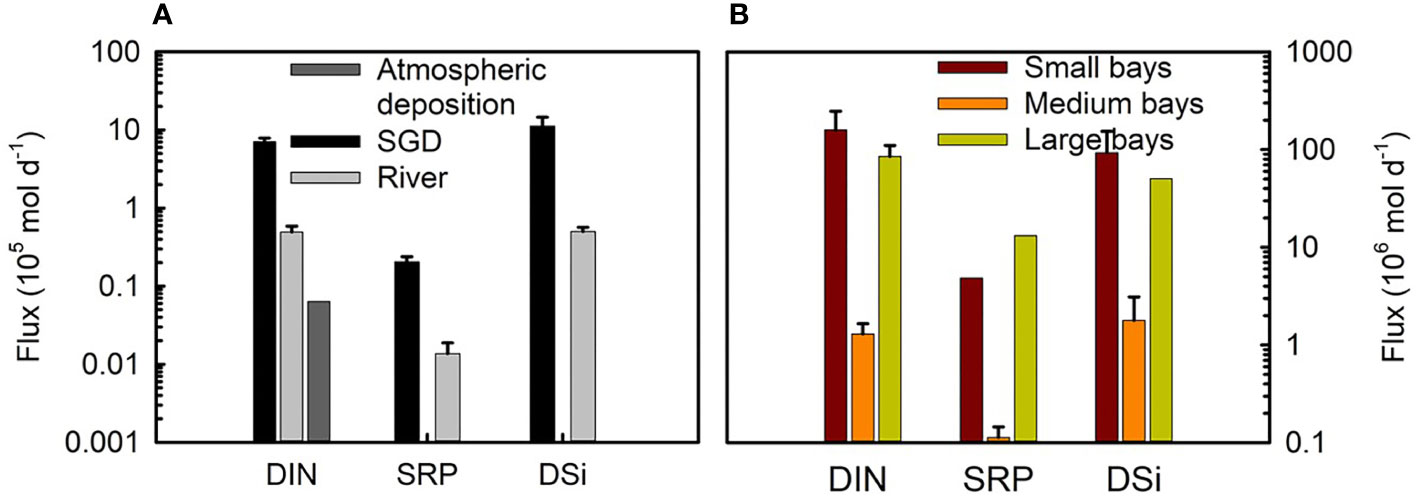
Figure 8 (A) The nutrient fluxes carried by SGD, the Zhangjiang River, and atmospheric deposition in Dongshan Bay in May 2020. (B) The SGD-associated nutrient fluxes in small bays, medium bays, and large bays along the entire Chinese coast.
4.1.3 Uncertainty analysis
The uncertainty in a function, F = f(x1, x2,…, xn), caused by errors in xi (i = 1, 2, …, n) can be estimated using error propagation (Taylor, 1997),
where δF is the error for F and is the error for xi. The total uncertainty in the flushing time was estimated to be 16%, which was mainly contributed by the uncertainty of salinity in the river water (Table S4, SM). The uncertainties in salinity, 228Ra activity, and nutrient concentrations of the river water, groundwater, and bay water were the standard deviations of these parameters at multiple sites. The total uncertainty in the flux of SGD was estimated to be 46%, which mainly resulted from the spatial variation in the activity of 228Ra in the groundwater (Table S4, SM). The seasonal variation in the salinity and 228Ra activity in the river water contributed less than 6% of the total uncertainty in the flux of SGD. The uncertainties in the net SGD-associated nutrient fluxes resulted not only from the parameters involved in Eq. (1) but also from the concentrations of nutrients in the groundwater and bay water. In fact, the major uncertainties in the DIN flux were from the spatial variation in the nutrient concentrations in the groundwater (63%) and in the bay water (20%). Similarly, the major uncertainty in the SRP flux was from the spatial variation in the nutrient concentration in the bay water (71%), and the major uncertainty in the DSi flux was from the spatial variation in the nutrient concentration in the bay water (75%) (Table S4, SM). The uncertainties in the riverine nutrient fluxes (Figure 8A) resulted from the seasonal variation in the concentrations of nutrients of the river water.
4.2 SGD predominantly regulated the nutrient distribution in Dongshan Bay
4.2.1 SGD dominates the bay-wide nutrient distribution
The predominance of SGD in the nutrient sources in Dongshan Bay was further consolidated by the fact that the nutrient distribution in the bay was mainly controlled by SGD. 228Ra was chosen as a proxy of SGD here for the following three reasons. a) The contribution of 228Ra from the Zhangjiang River accounted for less than 2% of the radium sources in the bay, so that the riverine contribution can be overlooked. b) The decay of 228Ra can be ignored due to its long half-life relative to the flushing time in the bay. c) The contribution of sediment diffusion can be neglected because the regeneration of 228Ra was negligible during the flushing time of the bay (Gonneea et al., 2008). On a bay-wide scale, despite the relatively small size of the sample number (n = 13 and 7 in the surface and bottom waters, respectively), significant positive correlations between 228Ra and nutrients were consistently found in both surface and bottom waters (P< 0.01) with R2 >0.90 except for SRP in the surface where R2 was still as high as 0.72 (Figure 9). Such highly significant correlations indicate that SGD was the master control of the nutrient distribution in Dongshan Bay, which is consistent with limited riverine nutrient exports from the Zhangjiang Estuary and the major contribution of SGD in the nutrient sources. The surface SRP had less R2 most likely due to that SRP in the surface water was regulated more readily by photosynthesis/respiration than DIN and DSi. Although particle sorption/desorption might have played a role in regulating the concentration of SRP, its contribution would have been trivial as the concentration of TSM in the surface water was 2.86–26.0 g m−3 (Table S1, SM) since a similar concentration of TSM in the bottom layer resulted in no apparent particle sorption/desorption (Figure S4, SM). The greater R2 in the bottom layer for all the nutrients was due to the following reasons: a) the SGD-associated nutrient input mainly occurring in the seabed, instead of along the coastline; b) greater biological regulation in the surface layer due to more sunlight available; and c) the additional nutrient in the overflow of less dense estuarine water from the Zhangjiang Estuary in the surface. Therefore, the nutrient distribution in Dongshan Bay was predominantly controlled by SGD with the regulation stronger in the bottom water than in the surface water.
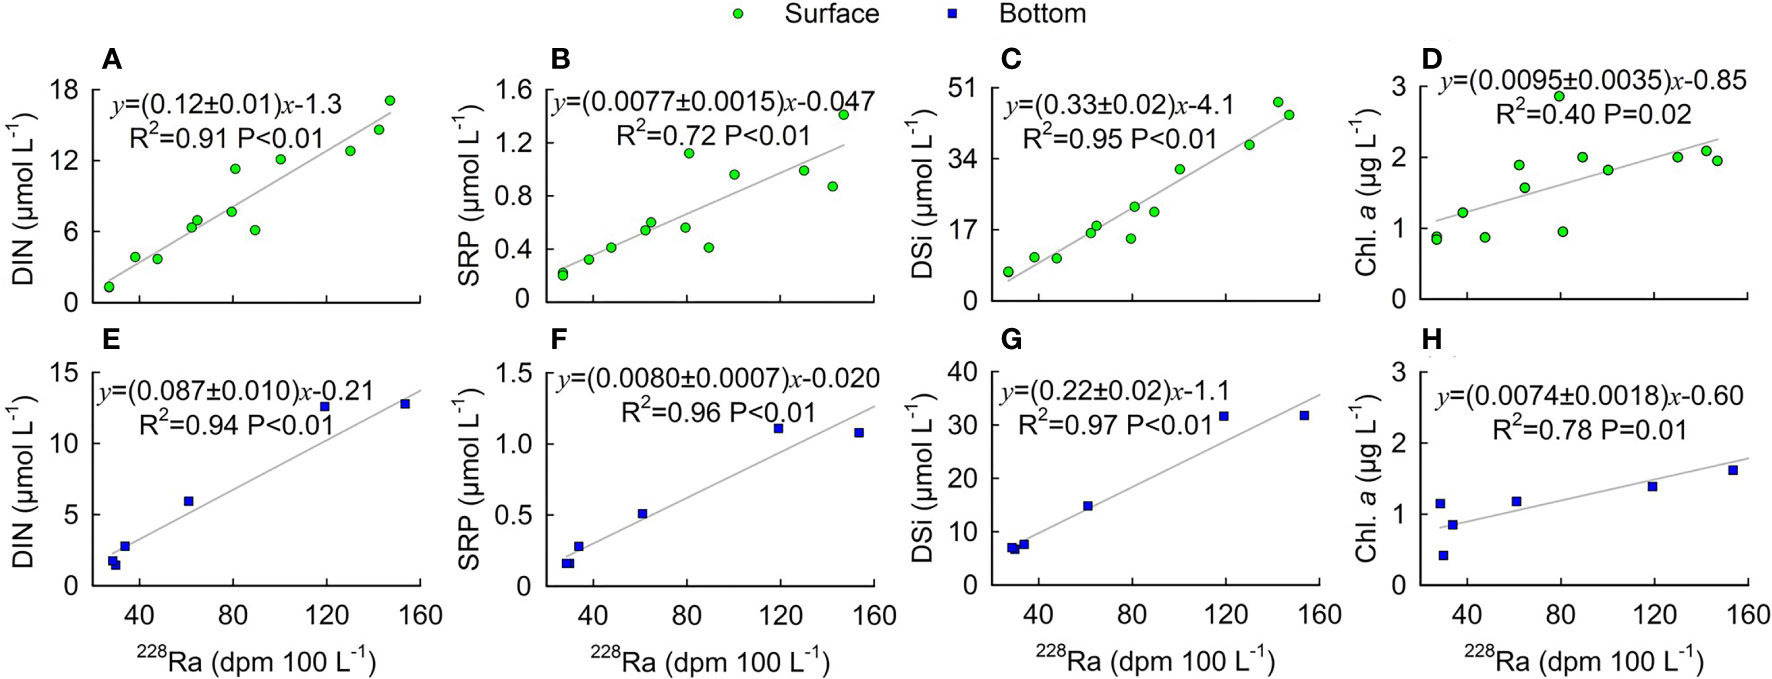
Figure 9 The concentration of nutrients and Chl. a versus the activity of 228Ra in the water column in Dongshan Bay. (A–D) Surface water and (E–H) bottom water.
Significant positive correlations between 228Ra and Chl. a were also found in both surface (P = 0.02) and bottom waters (P = 0.01) (Figure 9) with a greater R2 (0.78) in the bottom water. Obviously, because of its predominant contribution of control on nutrients, SGD significantly supported the biomass in Dongshan Bay. The smaller R2 in the surface water was likely caused by other factors that would regulate phytoplankton, such as light and temperature (Zohdi and Abbaspour, 2019). Similar to Dongshan Bay, significant positive relationships between SGD tracers (222Rn and 226Ra) and nutrients and Chl. a were found in Tolo Harbor, Hongkong (Cheng et al., 2020), and Little Lagoon, USA (Su et al., 2013), suggesting that SGD-borne nutrients supported the outbreaks of algal blooms in these regions. In Yeoja Bay, South Korea, an algal bloom was also found to be linked to SGD based on similar DIN/SRP ratios in the red tide water and groundwater (Lee and Kim, 2007). Therefore, SGD-borne nutrients merit greater attention in the monitoring and management of potential eutrophication and algal blooms in coastal areas.
Such significant correlations (P< 0.01, R2 > 0.90) between the activity of 228Ra, an SGD proxy, and the concentration of nutrients were never seen in any other coastal systems so far reported. The major proportion SGD possesses in the nutrient budget in the bay is apparently a necessary and sufficient condition for a significant correlation between the concentrations of an SGD proxy and nutrients in the bay. Such a statement is also supported by other studies (Table S5, SM). For example, in the Liangjiang Area, China (Peng et al., 2021), where the riverine input was the predominant source of nutrients in October, no significant correlations between 224Ra and DIN or SRP were found. The same situation was also reported in Waquoit Bay, USA (Charette et al., 2001). In the cases of Sydney Harbor (Correa et al., 2020), Jiaozhou Bay (Zhang et al., 2020b), and Daya Bay (Zhang et al., 2020a), despite greater SGD-associated nutrient flux than the riverine input, the conclusion that nutrient distribution was dominated by SGD may not be drawn recklessly. Indeed, significant correlations between 226Ra and DIN and SRP were observed (P< 0.05). However, the R2 values of these correlations were all less than 0.50, implying that although SGD was a factor regulating the nutrient distribution in these systems, it was not the predominant one. We speculated that other factors such as effluent discharge and/or atmospheric deposition may also have had significant effects on the nutrient distribution in these systems.
4.2.2 An SGD hotspot in the bay center
On the site-specific scale, we evaluated the effect of SGD on eutrophication at the SGD hotspot, Site Z6. Our underway sampling showed a maximum Chl. a concentration at Site Z6 (Figure 6), suggesting the highest biomass at this site. For this high biomass to occur, sufficient nutrients would be required. Since Site Z6 was located in the center of the bay, far from the Zhangjiang Estuary, and there were no sewage discharge and aquaculture nearby (Gao et al., 2021; Cui et al., 2022), we speculated that this phytoplankton bloom might be supported by nutrients from SGD. Although the water depth at Site Z6 was deep, the bottom nutrients from the aquifer below could affect the algal growth because of well mixing of the water column (Figure 5).
Our later mapping showed the maxima of 226Ra and 228Ra activities at Site Z6 in the bottom water (Figure 4), which confirmed this speculation. The desorption of radium from resuspended sediments might have caused the high activities of radium in the bottom water. However, the concentration of TSM in the bottom water at Site Z6 during our sampling period was very low, only 8.3 g m−3 (Table S1, SM). Therefore, no intensive disturbance of sediments had occurred. Moreover, after subtracting the contribution of suspended particles, local maximum activities of radium isotopes were still present (Figure S5, SM). Furthermore, our 12-h observations at this site demonstrated that the activity of 228Ra varied in antiphase with water depth in both surface and bottom waters (Figure 7C), implying the influence of a tidal-driven SGD throughout the water column. However, no local peak concentration of nutrients was observed at the bottom of Site Z6 on May 28 (Figure 4). This may be due to a couple of reasons: a) nutrients had been very active in the biogeochemical cycle and taken up/regenerated very quickly in the water column; and b) during our sampling period, the water column was well mixed (Figure 5) so that when the nutrients in the surface layer were consumed by phytoplankton, the nutrients in the bottom layer could be mixed into the surface quickly.
A non-steady-state model (Garcia-Orellana et al., 2010) was applied at Site Z6 to estimate the SGD rate. The sources of radium at this site include the Zhangjiang River, diffusion from sediments, tidal input, and SGD. The loss terms of radium are decay (can be neglected considering our time scale of observation, i.e., 2 h) and mixing. The mass balance equation was set up as:
where is the difference in the flux of 228Ra between two contiguous measurements (Δt =2 h in this study), FZJ is the flux of 228Ra from the Zhangjiang River, Fsed is the diffusive flux of 228Ra from sediments, FTIDE is the tidal flux of 228Ra, FG is the SGD-associated 228Ra flux, and FMIX is the mixing loss of 228Ra.
In Eq. (6), ΔI can be calculated by:
where 228Rat is the average 228Ra activity of surface and bottom waters at time t, and ht is the water depth at time t.
FZJ can be estimated by multiplying the river discharge by the 228Ra activity in the river water. The diffusive flux, 5.52 dpm m−2 day−1, was adopted. During a flood tide, FTIDE can be estimated by:
During an ebb tide, FTIDE can be calculated by:
After was corrected for the river input, diffusion from sediments, and tidal input and output, the net 228Ra flux can be estimated by:
To have a conservative estimation of the contribution from SGD, the maximum negative value of FNET was chosen as the mixing loss (Burnett and Dulaiova, 2003). Finally, FG can be converted to an SGD flux by dividing the 228Ra activity in the groundwater listed in Table S3, the same groundwater end-member used in the mass balance model.
The conservative estimate of SGD rate at Site Z6 was 1.24 ± 1.47 m day−1, which was an order of magnitude greater than the bay-wide SGD rate (0.048 ± 0.022 m day−1) and those near the shore (within 0.5 km) in other bays (Hsu et al., 2020; Luo et al., 2020). The uncertainty in the SGD rate at Site Z6 was the standard deviation of the SGD rate over the time-series investigation period, reflecting the temporal variation in the SGD rate. Generally, the closer to the shore, the higher the SGD rate is (Debnath and Mukherjee, 2016). However, our study demonstrates an SGD hotspot in the bay center (>5 km offshore), where the sediment type is sandy silt (Gao et al., 2021). The permeable sediments of Dongshan Bay (Gao et al., 2021) ensured the discharge of submarine groundwater from the seabed. Plus, no anomalously high signals of radium were observed near the coastline. Therefore, the SGD distribution seemed not related to the geological pattern of the coastline.
At this site, great loads of nutrients via SGD were discharged into the water column. This site may be the deposition site of organic particles as Gao et al. (2021) observed organic-rich sediments at this site. The nutrients produced from the degradation of organic matter in the sediments were then transported to the water column via SGD. However, the nutrients may be unlikely released from the SPM directly because no abnormal elevation of TSM was observed at this site. The nutrients via SGD were then mixed into the surface layer and fueled the high productivity we observed on May 19.
4.3 Local and national significance of SGD in small bays
On the local scale, the sources and spatial distribution of nutrients turned out to be dominated by SGD in Dongshan Bay. The SGD hotspot in the bay center is a site more readily to be eutrophied and bloom than other locations in the bay that merits particular attention in local environmental management and monitoring of eutrophication and phytoplankton blooms. The bay-wide inputs of nutrients via SGD are a top priority in water quality and ecosystem monitoring and management. Moreover, marine or anthropogenic terrestrial sources in SGD need to be identified and quantified before any corresponding regulation can be planned. Furthermore, there may be a time lag for SGD to respond to any treatment, so the outcome may take days, months, or even years to be seen.
On the nation-wide scale, we extrapolated our bay-wide SGD-carried nutrient fluxes to the entire Chinese coastline using the median SGD-carried nutrient fluxes (Table S6, SM) considering bays with small, medium, and large areas where SGD-associated nutrient fluxes are available. Notably, most investigations in Table S6 including ours were conducted in only one season. Considering that seasonal variations of SGD-associated nutrient fluxes may be present, additional uncertainties may be introduced in our extrapolation, which would be reduced by further investigations in more seasons. In the present extrapolation process, we assumed that there was no seasonal variation of SGD-carried nutrient fluxes. The total nutrient flux (mol day−1) via SGD along the Chinese coastline is (2.57 ± 1.07) × 108 for DIN, (3.21 ± 1.36) × 106 for SRP, and (1.49 ± 0.26) × 108 for DSi. Our results are comparable to the total nutrient flux estimate of Zhang et al. (2020b). Despite the relatively small sizes of individual small bays, the great cumulative area as well as the greater area-normalized SGD-carried nutrient flux makes the total DIN contribution from SGD in small bays approximately twice as much as that in large bays (Figure 8B). Therefore, investigations in small bays are critical to accurately estimate the SGD-associated nutrient fluxes and to assess the biogeochemical and environmental impacts of SGD along the entire Chinese coast.
From a global perspective, small bays may similarly contribute a significant amount of nutrients to coastal waters because their greater area-normalized SGD-carried nutrient fluxes and limited riverine inputs and therefore may likely play a disproportionately big role in local and national coastal systems. Thus, SGD-carried nutrients in small bays merit attention in environmental monitoring and management. A better understanding of the biogeochemical impacts of SGD in small bays is indispensable in future environmental investigations. Such investigations will definitely contribute to the United Nations Decade of Ocean Science for Sustainable Development (2021-2030; https://en.unesco.org/ocean-decade) in terms of understanding land- and sea-based sources of pollutants and contaminants and their potential impacts on ocean ecosystems.
5 Conclusions
We carried out station-based and underway mappings, as well as a 12-h time-series investigation in subtropical Dongshan Bay, China, to investigate the role that SGD plays in small bays (<500 km2). We found the most significant positive correlations (P< 0.01, R2 > 0.90) in global coastal ecosystems ever investigated between concentrations of the SGD tracer, 228Ra, and nutrients in Dongshan Bay, which revealed that the nutrient concentration was predominantly controlled by SGD on a bay-wide scale. Furthermore, SGD seemed to support the productivity of phytoplankton in the bay, as shown by the significant positive correlation (P = 0.02, R2 > 0.40) between concentrations of 228Ra and Chl. a. Additional evidence of the support of SGD was that the highest biomass observed during the underway survey occurred where the highest activity of 228Ra was found in the station-based mapping, implying the support of SGD-carried nutrients to algal blooms. On the bay-wide scale, the SGD-carried nutrient fluxes (mmol day−1) were (7.06 ± 0.82) × 105, (2.05 ± 0.34) × 104, and (1.12 ± 0.34) × 106 for DIN, SRP, and DSi, respectively, which accounted for over 95% of the nutrient sources. After extrapolating our results to the entire Chinese coast, the SGD-carried DIN flux in small bays was approximately twice as much as those in large bays (>2,000 km2), highlighting the importance of small bays in estimating the role that SGD plays in coastal nutrient distribution and budgets on a national scale.
Data availability statement
The original contributions presented in the study are included in the article/Supplementary Material. Further inquiries can be directed to the corresponding authors.
Author contributions
All authors listed have made a substantial, direct, and intellectual contribution to the work and approved it for publication.
Funding
This research was supported by the Natural Science Foundation of Fujian Province of China (grant no. 2019J01020) and the National Natural Science Foundation of China (grant no. 42188102, 41576074).
Acknowledgments
We thank the crew of Mindongyu 63093 for their industrious work. We also thank the technicians at the Dongshan Swire Marine Station, Xiamen University for their technical support.
Conflict of interest
The authors declare that the research was conducted in the absence of any commercial or financial relationships that could be construed as a potential conflict of interest.
Publisher’s note
All claims expressed in this article are solely those of the authors and do not necessarily represent those of their affiliated organizations, or those of the publisher, the editors and the reviewers. Any product that may be evaluated in this article, or claim that may be made by its manufacturer, is not guaranteed or endorsed by the publisher.
Supplementary material
The Supplementary Material for this article can be found online at: https://www.frontiersin.org/articles/10.3389/fmars.2023.1164589/full#supplementary-material
References
Alorda-Kleinglass A., Ruiz-Mallén I., Diego-Feliu M., Rodellas V., Bruach-Menchén J. M., Garcia-Orellana J. (2021). The social implications of submarine groundwater discharge from an ecosystem services perspective: A systematic review. Earth-Science Rev. 221, 103742. doi: 10.1016/j.earscirev.2021.103742
Beck A. J., Rapaglia J. P., Cochran J. K., Bokuniewicz H. J. (2007). Radium mass-balance in Jamaica bay, NY: Evidence for a substantial flux of submarine groundwater. Mar. Chem. 106, 419–441. doi: 10.1016/j.marchem.2007.03.008
Burnett W. C., Dulaiova H. (2003). Estimating the dynamics of groundwater input into the coastal zone via continuous radon-222 measurements. J. Environ. Radioactivity 69, 21–35. doi: 10.1016/s0265-931x(03)00084-5
Charette M. A., Buesseler K. O., Andrews J. E. (2001). Utility of radium isotopes for evaluating the input and transport of groundwater-derived nitrogen to a cape cod estuary. Limnology Oceanography 46, 465–470. doi: 10.4319/lo.2001.46.2.0465
Cheng K. H., Luo X., Jiao J. J. (2020). Two-decade variations of fresh submarine groundwater discharge to tolo harbour and their ecological significance by coupled remote sensing and radon-222 model. Water Res. 178, 115866. doi: 10.1016/j.watres.2020.115866
Correa R. E., Cardenas M. B., Rodolfo R. S., Lapus M. R., Davis K. L., Giles A. B., et al. (2021). Submarine groundwater discharge releases CO2 to a coral reef. ACS ES&T Water 1, 1756–1764. doi: 10.1021/acsestwater.1c00104
Correa R. E., Tait D. R., Sanders C. J., Conrad S. R., Harrison D., Tucker J. P., et al. (2020). Submarine groundwater discharge and associated nutrient and carbon inputs into Sydney harbour (Australia). J. Hydrology 580, 124262. doi: 10.1016/j.jhydrol.2019.124262
Cui G., Liu Z., Xu W., Gao Y., Yang S., Grossart H. P., et al. (2022). Metagenomic exploration of antibiotic resistance genes and their hosts in aquaculture waters of the semi-closed dongshan bay (China). Sci. Total Environ. 838, 155784. doi: 10.1016/j.scitotenv.2022.155784
Debnath P., Mukherjee A. (2016). Quantification of tidally-influenced seasonal groundwater discharge to the bay of Bengal by seepage meter study. J. Hydrology 537, 106–116. doi: 10.1016/j.jhydrol.2016.03.010
Gao C., Yu F., Chen J., Huang Z., Jiang Y., Zhuang Z., et al. (2021). Anthropogenic impact on the organic carbon sources, transport and distribution in a subtropical semi-enclosed bay. Sci. Total Environ. 767, 145047. doi: 10.1016/j.scitotenv.2021.145047
Garcia-Orellana J., Cochran J. K., Bokuniewicz H., Yang S., Beck A. J. (2010). Time-series sampling of 223Ra and 224Ra at the inlet to great south bay (New york): a strategy for characterizing the dominant terms in the Ra budget of the bay. J. Environ. Radioact 101, 582–588. doi: 10.1016/j.jenvrad.2009.12.005
Glibert P. M. (2020). From hogs to HABs: impacts of industrial farming in the US on nitrogen and phosphorus and greenhouse gas pollution. Biogeochemistry 150, 1–42. doi: 10.1007/s10533-020-00691-6
Glibert P. M., Harrison J., Heil C., Seitzinger S. (2006). Escalating worldwide use of urea – a global change contributing to coastal eutrophication. Biogeochemistry 77, 441–463. doi: 10.1007/s10533-005-3070-5
Gonneea M. E., Morris P. J., Dulaiova H., Charette M. A. (2008). New perspectives on radium behavior within a subterranean estuary. Mar. Chem. 109, 250–267. doi: 10.1016/j.marchem.2007.12.002
Guo X., Xu B., Burnett W. C., Wei Q., Nan H., Zhao S., et al. (2020). Does submarine groundwater discharge contribute to summer hypoxia in the changjiang (Yangtze) river estuary? Sci. Total Environ. 719, 137450. doi: 10.1016/j.scitotenv.2020.137450
Han A., Dai M., Kao S.-J., Gan J., Li Q., Wang L., et al. (2012). Nutrient dynamics and biological consumption in a large continental shelf system under the influence of both a river plume and coastal upwelling. Limnology Oceanography 57, 486–502. doi: 10.4319/lo.2012.57.2.0486
Hsu F.-H., Su C.-C., Wang P.-L., Lin I.-T. (2020). Temporal variations of submarine groundwater discharge into a tide-dominated coastal wetland (Gaomei wetland, Western Taiwan) indicated by radon and radium isotopes. Water 12, 1806. doi: 10.3390/w12061806
Jain A. K. (2010). Data clustering: 50 years beyond K-means. Pattern Recognition Lett. 31, 651–666. doi: 10.1016/j.patrec.2009.09.011
Lee Y. W., Kim G. (2007). Linking groundwater-borne nutrients and dinoflagellate red-tide outbreaks in the southern sea of Korea using a Ra tracer. Estuarine Coast. Shelf Sci. 71, 309–317. doi: 10.1016/j.ecss.2006.08.004
Liu X. (2011). Numerical modeling and environmental studies of coastal bay in fujian province, China (Beijing, China: China Ocean Press).
Liu J., Du J., Wu Y., Liu S. (2018). Nutrient input through submarine groundwater discharge in two major Chinese estuaries: the pearl river estuary and the changjiang river estuary. Estuarine Coast. Shelf Sci. 203, 17–28. doi: 10.1016/j.ecss.2018.02.005
Luo M. H., Zhang Y., Li H. L., Wang X. J., Xiao K. (2020). Submarine groundwater discharge in a coastal bay: Evidence from radon investigations. Water 12, 2552. doi: 10.3390/w12092552
Millero F. J., Poisson A., Smith W. L., Dorsey C. P., Abraham A., Dickey R. W. (1981). International one-atmosphere equation of state of seawater. Deep-Sea Res. 28(6), 625–629.
Moore W. S. (1996). Large Groundwater inputs to coastal waters revealed by 226Ra enrichments. Nature 380, 612–614. doi: 10.1038/380612a0
Moore W. S. (2010). The effect of submarine groundwater discharge on the ocean. Ann. Rev. Mar. Sci. 2, 59–88. doi: 10.1146/annurev-marine-120308-081019
Nixon S. W. (2012). Coastal marine eutrophication: A definition, social causes, and future concerns. Ophelia 41, 199–219. doi: 10.1080/00785236.1995.10422044
Nyenje P. M., Foppen J. W., Uhlenbrook S., Kulabako R., Muwanga A. (2010). Eutrophication and nutrient release in urban areas of sub-Saharan Africa-a review. Sci. Total Environ. 408, 447–455. doi: 10.1016/j.scitotenv.2009.10.020
O’Neil J. M., Davis T. W., Burford M. A., Gobler C. J. (2012). The rise of harmful cyanobacteria blooms: The potential roles of eutrophication and climate change. Harmful Algae 14, 313–334. doi: 10.1016/j.hal.2011.10.027
Paerl H. W. (1997). Coastal eutrophication and harmful algal blooms: Importance of atmospheric deposition and groundwater as “new” nitrogen other nutrient sources. Limnol. Oecanogr 42, 1154–1165. doi: 10.2307/2839008
Peng T., Zhu Z., Du J., Liu J. (2021). Effects of nutrient-rich submarine groundwater discharge on marine aquaculture: A case in lianjiang, East China Sea. Sci. Total Environ. 786, 147388. doi: 10.1016/j.scitotenv.2021.147388
Qin X., Zhao Y. (2020). Hydrodynamic numerical simulation on dongshan bay and calculation of its tidal prism and water exchange cycle. Water Resour. Hydropower Eng. 51, 93–99. doi: 10.13928/j.cnki.wrahe.2020.06.011
Santos I. R., Chen X., Lecher A. L., Sawyer A. H., Moosdorf N., Rodellas V., et al. (2021). Submarine groundwater discharge impacts on coastal nutrient biogeochemistry. Nat. Rev. Earth Environ. 2, 307–323. doi: 10.1038/s43017-021-00152-0
Santos I. R., Eyre B. D., Huettel M. (2012). The driving forces of porewater and groundwater flow in permeable coastal sediments: A review. Estuarine Coast. Shelf Sci. 98, 1–15. doi: 10.1016/j.ecss.2011.10.024
Smith V. H. (2003). Eutrophication of freshwater and coastal marine ecosystems: a global problem. Environ. Sci. pollut. Res. Int. 10, 126–139. doi: 10.1065/espr2002.12.142
Su N., Burnett W. C., Macintyre H. L., Liefer J. D., Peterson R. N., Viso R. (2013). Natural radon and radium isotopes for assessing groundwater discharge into little lagoon, AL: Implications for harmful algal blooms. Estuaries Coasts 37, 893–910. doi: 10.1007/s12237-013-9734-9
Swarzenski P. W., Reich C., Kroeger K. D., Baskaran M. (2007). Ra And Rn isotopes as natural tracers of submarine groundwater discharge in Tampa bay, Florida. Mar. Chem. 104, 69–84. doi: 10.1016/j.marchem.2006.08.001
Tan E., Wang G., Moore W. S., Li Q., Dai M. (2018). Shelf-scale submarine groundwater discharge in the northern south China Sea and East China Sea and its geochemical impacts. J. Geophysical Research: Oceans 123, 2997–3013. doi: 10.1029/2017jc013405
Taniguchi M., Burnett W. C., Cable J. E., Turner J. V. (2002). Investigation of submarine groundwater discharge. Hydrological Processes 16, 2115–2129. doi: 10.1002/hyp.1145
Taylor J. R. (1997). An introduction to error analysis (Sausalito, California: University Science Books).
van Beek P., Souhaut M., Reyss J. L. (2010). Measuring the radium quartet (228Ra, 226Ra, 224Ra, 223Ra) in seawater samples using gamma spectrometry. J. Environ. Radioact 101, 521–529. doi: 10.1016/j.jenvrad.2009.12.002
Wang J., Chen M. (1993). The document of bay in China: the eighth volume (Beijing, China: China Ocean Press).
Wang F., Cheng P., Chen N., Kuo Y. M. (2021). Tidal driven nutrient exchange between mangroves and estuary reveals a dynamic source-sink pattern. Chemosphere 270, 128665. doi: 10.1016/j.chemosphere.2020.128665
Wang G., Han A., Chen L., Tan E., Lin H. (2018). Fluxes of dissolved organic carbon and nutrients via submarine groundwater discharge into subtropical sansha bay, China. Estuarine Coast. Shelf Sci. 207, 269–282. doi: 10.1016/j.ecss.2018.04.018
Wang Y., Liu D., Xiao W., Zhou P., Tian C., Zhang C., et al. (2021). Coastal eutrophication in China: Trend, sources, and ecological effects. Harmful Algae 107, 102058. doi: 10.1016/j.hal.2021.102058
Wang G., Wang Z., Zhai W., Moore W. S., Li Q., Yan X., et al. (2015). Net subterranean estuarine export fluxes of dissolved inorganic c, n, p, Si, and total alkalinity into the jiulong river estuary, China. Geochimica Cosmochimica Acta 149, 103–114. doi: 10.1016/j.gca.2014.11.001
Welschmeyer N. A. (1994). Fluorometric analysis of chlorophyll-a in the presence of chlorophyll-b and pheopigments. Limnology Oceanography 39, 1985–1992. doi: 10.4319/lo.1994.39.8.1985
Wu H. (2021). Phytoplankton community structure and assessment of trophic state in important mariculture area of dongshan bay. J. Fisheries Res. 6, 578–586. doi: 10.14012/j.cnki.fjsc.2021.06.004
Wu S.-P., Dai L.-H., Zhu H., Zhang N., Yan J.-P., Schwab J. J., et al. (2019). The impact of sea-salt aerosols on particulate inorganic nitrogen deposition in the western Taiwan strait region, China. Atmospheric Res. 228, 68–76. doi: 10.1016/j.atmosres.2019.05.015
Yan X., Zhai W., Hong H., Li Y., Guo W., Huang X. (2012). Distribution, fluxes and decadal changes of nutrients in the jiulong river estuary, southwest Taiwan strait. Chin. Sci. Bull. 57, 2307–2318. doi: 10.1007/s11434-012-5084-4
Zhang Y. (2021). Characteristics and evolution of late pleistocene sedimentary strata in jiulongjiang and dongshan bay, fujian province. Pearl River Water Transport 1, 102–103. doi: 10.14125/j.cnki.zjsy.2021.01.047
Zhang J., Du Y. N., Zhang G. S., Chang Y., Zhou Y. C., Zhang Z. F., et al. (2021). Increases in the seaward river flux of nutrients driven by human migration and land-use changes in the tide-influenced delta. Sci. Total Environ. 761, 144501. doi: 10.1016/j.scitotenv.2020.144501
Zhang Y., Li H. L., Guo H. M., Zheng C. M., Wang X. J., Zhang M., et al. (2020a). Improvement of evaluation of water age and submarine groundwater discharge: A case study in daya bay, China. J. Hydrology 586, 124775. doi: 10.1016/j.jhydrol.2020.124775
Zhang Y., Santos I. R., Li H., Wang Q., Xiao K., Guo H., et al. (2020b). Submarine groundwater discharge drives coastal water quality and nutrient budgets at small and large scales. Geochimica Cosmochimica Acta 290, 201–215. doi: 10.1016/j.gca.2020.08.026
Zhou N., Zhang G. L., Liu S. M. (2022). Nutrient exchanges at the sediment-water interface and the responses to environmental changes in the yellow Sea and East China Sea. Mar. pollut. Bull. 176, 113420. doi: 10.1016/j.marpolbul.2022.113420
Keywords: submarine groundwater discharge, nutrients, algal growth, small bay, radium isotopes
Citation: Sun Y, Wang G, Weng Y, Li Q, Zhang F, Jiang W, Dai G, Lin W, Sun S, Jiang Y and Zhang Y (2023) Submarine groundwater discharge in Dongshan Bay, China: A master regulator of nutrients in spring and potential national significance of small bays. Front. Mar. Sci. 10:1164589. doi: 10.3389/fmars.2023.1164589
Received: 13 February 2023; Accepted: 16 March 2023;
Published: 30 March 2023.
Edited by:
Kai Xiao, Southern University of Science and Technology, ChinaCopyright © 2023 Sun, Wang, Weng, Li, Zhang, Jiang, Dai, Lin, Sun, Jiang and Zhang. This is an open-access article distributed under the terms of the Creative Commons Attribution License (CC BY). The use, distribution or reproduction in other forums is permitted, provided the original author(s) and the copyright owner(s) are credited and that the original publication in this journal is cited, in accordance with accepted academic practice. No use, distribution or reproduction is permitted which does not comply with these terms.
*Correspondence: Guizhi Wang, Z3pod2FuZ0B4bXUuZWR1LmNu; Yuanjing Zhang, bWlycm9yenlqQDE2My5jb20=