 Simon Dedman1,2*
 Emilius A. Aalto1
 Michael J. W. Stokesbury3
 Robert J. Schallert1Michael R. Castleton1
 Barbara A. Block1
- 1Hopkins Marine Station, Stanford University, Pacific Grove, CA, United States
- 2Institute of Environment, Department of Biological Sciences, Florida International University, North Miami, Florida, Fl, United States
- 3Department of Biology, Acadia University, Wolfville, Nova Scotia, NS, Canada
Introduction: Atlantic bluefin tuna (ABT) are large, migratory pelagic predators of high economic importance. ABT are currently managed as two independent stocks assigned to discrete spawning areas (Gulf of Mexico, and Mediterranean); however, stock overlap outside spawning areas makes accurate assignment of catch to stock-of-origin difficult.
Methods: Within this two-stock paradigm, we characterised stock-specific spatial distributions and behaviours by comparing habitat usage and vertical movement behaviours of 118 electronically tagged adult ABT spatially assigned to the GOM and Med spawning grounds. These spatial and behavioural differences were used in tests to probabilistically assign unknown individuals (which did not visit the GOM/Med spawning areas) to a stock.
Results: This new methodological approach using existing tag data, enables increased assignment of a track to a potential stock, to be achieved before genetic assignments. We identified certain markedly different movement patterns, range extents, depth use preferences (and associated area usage), migration directness and speeds, corresponding distance from shore, and mesopelagic-layer visitation. The probabilistic assignment approach had 97% in-bag testing accuracy, then assigned 190 individuals to a stock, doubling the number of assigned stock-of-origin tracks in our dataset, and potentially revealing novel movement and behaviour patterns among pre-spawning-age ABT.
Discussion: This approach can be easily adapted to other study species, more stocks, and different testing variables, hopefully serving as a useful addition to the fisheries management toolkit.
1 Introduction
Biologging technology has rapidly advanced the capacity to study pelagic fish movements over the past two decades. For teleost fishes, tag development (e.g., archival and pop-up) has increased our ability to study the movements of bluefin tunas (Block et al., 1998a; Block et al., 1998b; Lutcavage et al., 1999; Block et al., 2001). Electronic tagging studies have identified ABT (Thunnus thynnus) migration patterns, physiology, oceanographic preferences, and behaviours (Josse et al., 1998; Block et al., 2005; Boustany et al., 2010; Lawson et al., 2010; Galuardi and Lutcavage, 2012; Abascal et al., 2016; Arregui et al., 2018; Block et al., 2019). This has improved our understanding of how ABT utilize North Atlantic habitats and adjacent seas in the Gulf of Mexico (GOM) and Mediterranean Sea (Med). Satellite and archival tagging takes high resolution data from multiple sensors to provide information on location (Lutcavage et al., 1999; Teo et al., 2004; Block et al., 2011; Galuardi and Lutcavage, 2012; Jonsen et al., 2013), foraging (Bestley et al., 2008; Whitlock et al., 2015) and oceanography (Hazen et al., 2019) as well as dynamic use of the water column, yielding information on fish diving behaviour (Walli et al., 2009; Wilson and Block, 2009; Lawson et al., 2010; Stehfest et al., 2014; Cermeño et al., 2015; Arregui et al., 2018). Biologging data can also be used to examine the spatial movements and changes in habitat use with life history parameters vital for tuna population models (Kurota et al., 2009; Taylor et al., 2011; Block et al., 2019).
Studies indicate that electronic tagging data can provide information on the region of spawning, temperature and oceanography, fidelity to spawning grounds (when ABT return over multiple years), age of entry to spawning grounds (Block et al., 2005; Wilson et al., 2015), duration of occupation of spawning grounds, and length of time spawning. These tag datasets enable comparison with genetic and otolith stock-specific identification of ABT, and can be used to expand close-kin genetic models that require some estimates of fecundity and spawning duration. The spatial data are also valuable for identifying regional areas for protection of spawners within their respective spawning grounds. Since electronic tagging can record daily locations for a year or more, natal assignment can be confirmed by the residency of ABT into one of the two formally accepted spawning grounds (GOM or Med) during the appropriate season.
ABT are currently managed by the International Commission for the Conservation of Atlantic Tunas (ICCAT) as two stocks: the western stock is assumed to spawn solely in the GOM and adjacent waters, the eastern stock in the Med. ICCAT uses the 45°W meridian in the North Atlantic as the management line dividing the two stocks (hereafter the GOM and Med groups) and assumes spawning ground fidelity (ICCAT, 1982; ICCAT, 2012). Recent management of ABT is increasingly based on complex multi-stock models such as the M3 mixing model (Carruthers, 2016) that use biological data (tagging, microconstituents, genetics) to assign ABT to stocks that then inform transition rates between the stock management regions (Schloesser et al., 2010; Taylor et al., 2011; ICCAT, 2015; Carruthers et al., 2016; Rooker et al., 2019). Consequently, improvements in biological knowledge of stocks (e.g. genetics) as well as spatial stock differentiation can lead to more accurate catch assignments and thus more accurate stock assessments e.g. Aalto et al. (2021).
Tagging of ABT indicates that while there is spatial separation to discrete spawning grounds (GOM and Med), considerable mixing occurs throughout the year when on foraging grounds. Tagged ABT have shown high visitation to the two well-known spawning grounds, with annual and multi-year cycles recorded on tags (Block et al., 2005; Wilson et al., 2015; Horton et al., 2020). More recently a third spawning ground has been discovered in the Western North Atlantic slope waters (Richardson et al., 2016; Rypina et al., 2019) where the presence of ABT larvae has led to examination of tagging data for ABT associated with this region during spawning (Aalto et al. (2023)). Outside the GOM, spawning near Cape Hatteras has also been suggested based on tracking data (Block et al., 2001).
Tagging movement studies, larval, and genetic analyses are leading to further developments past the two-stock paradigm, potentially leading to its revision in the future. The Med may be split in two, with the western subpopulation distinct from the central and eastern subpopulation (Carlsson et al., 2004; Boustany et al., 2008), and with additional spawning in the Eastern Med (Karakulak et al., 2004) and Bay of Biscay (Rodriguez et al., 2021). There seems to be interbreeding between the GOM and Med stocks (Johnstone et al., 2021), and the GOM stock may also have a more complex population structure than is currently recognised (Muhling et al., 2011; Brophy et al., 2020). Genetic data from several markers indicate support for at least two populations, yet more recent data indicate mixing can occur (Carlsson et al., 2007; Boustany et al., 2008; Puncher et al., 2018). Recent genetic analyses suggest that movement can also occur from west to east, bringing Med spawners into the GOM, while individuals genetically identified as bluefin of GOM origin can also move into the Med spawning areas (Johnstone et al., 2021).
However, the full complexity of ABT population dynamics is not considered in the current management regime, which remains dependent on the two-stock paradigm and has only recently incorporated stock mixing across the 45°W meridian. Even within this simplified population structure, accurately modeling seasonal biomass distributions with electronic tags across regional boundaries depends on having sufficient assigned tracks to capture the full range of migrations for each putative stock. Although much effort is put into tracking studies, limitations in stock assignment (e.g., inconclusive genetics, tracks which do not extend into one of the spawning areas) mean that many tracks, sometimes the majority, remain unassigned and cannot be used to inform management models.
In this study, we explore a potential method to make a subset of these unassigned tracks available for management use by incorporating additional behavioral data beyond spawning ground visitation. We use 118 tracks varying in length from 22 to 1936 days and spanning from 1996-2020. ABT were spatially assigned to a presumed group/stock based on visitation to a known spawning area (however true stock identity must be confirmed with genomic assignment techniques e.g. Puncher et al. (2022), or organochlorine and otolith microchemistry via O18 e.g. Schloesser et al. (2010). Our analysis tests the hypothesis that high resolution archival tag data can improve tag data use within the current two-stock framework by assigning unassigned individuals to one of the two primary stocks based on movement behavior and oceanographic preferences. In order to ensure sufficient assigned-origin tracks to differentiate between groups, and to focus on management relevance, we limit the algorithmic analysis to the eastern and western stocks and do not consider additional minority spawning groups discussed above.
Our goal is to better understand the annual and ontogenetic movement patterns and behaviours of the GOM and Med-group ABT, particularly while residing in the western North Atlantic, and we describe regional differences in North Atlantic habitat use by group, including distinctions in thermal and depth use of habitats, migration timing, and spatial extent, as well as foraging behaviours and locations, which can improve our understanding of habitat use, and foraging and breeding strategies. Uncovering differences between them may allow for improved use of tag data in stock assessments, improvements in management models, and development of alternatives for fisheries regulations (Fromentin, 2003; Block et al., 2005; Block et al., 2005; Tensek et al., 2017).
Having identified these group-specific traits, we use these differences to algorithmically assign a group (GOM or Med) to the tagged ABT which did not visit one of the two primary spawning areas. This is a novel use of tagging data, which doubles the size of our dataset, and can reveal insights into the movements of pre-spawning-age ABT. These outcomes can be tested once genetic markers can assign bluefin to groups with high efficiency.
2 Methods
2.1 Data acquisition and selection
This study utilized western Atlantic electronic tagging data acquired from tagging expeditions conducted by Stanford University’s TAG A Giant program between 1996 and 2019. During this time, 1399 ABT were electronically tagged along the North American eastern seaboard at specific locations with archival and/or satellite tags. Main tagging sites were the Gulf of St Lawrence (GSL), (Canada), Nantucket (MA, USA; both in September and October), and off Cape Lookout and/or Cape Hatteras, NC (USA; both January and March; locations shown in Figures 1, 2). Methods of fishing, tagging, and releasing are as previously described for these data (Block et al., 1998b; Block et al., 2001; Stokesbury et al., 2004); a summary of the data used in this analyses are in SM 1 Table 1. Mean sizes of tagged ABT were Med 183cm, GOM 253cm; see SM 1 Figure 1. Electronic tagging procedures were conducted under protocols approved by the Stanford University Administrative Panel on Laboratory Care in accordance with the Institutional Animal Care and Use Committee’s proper guidelines and Acadia Animal Care Committee protocol #18-11. Tagging in Canadian waters was approved under permits issued by Fisheries and Oceans Canada, license # SG-RHQ-18-159A.
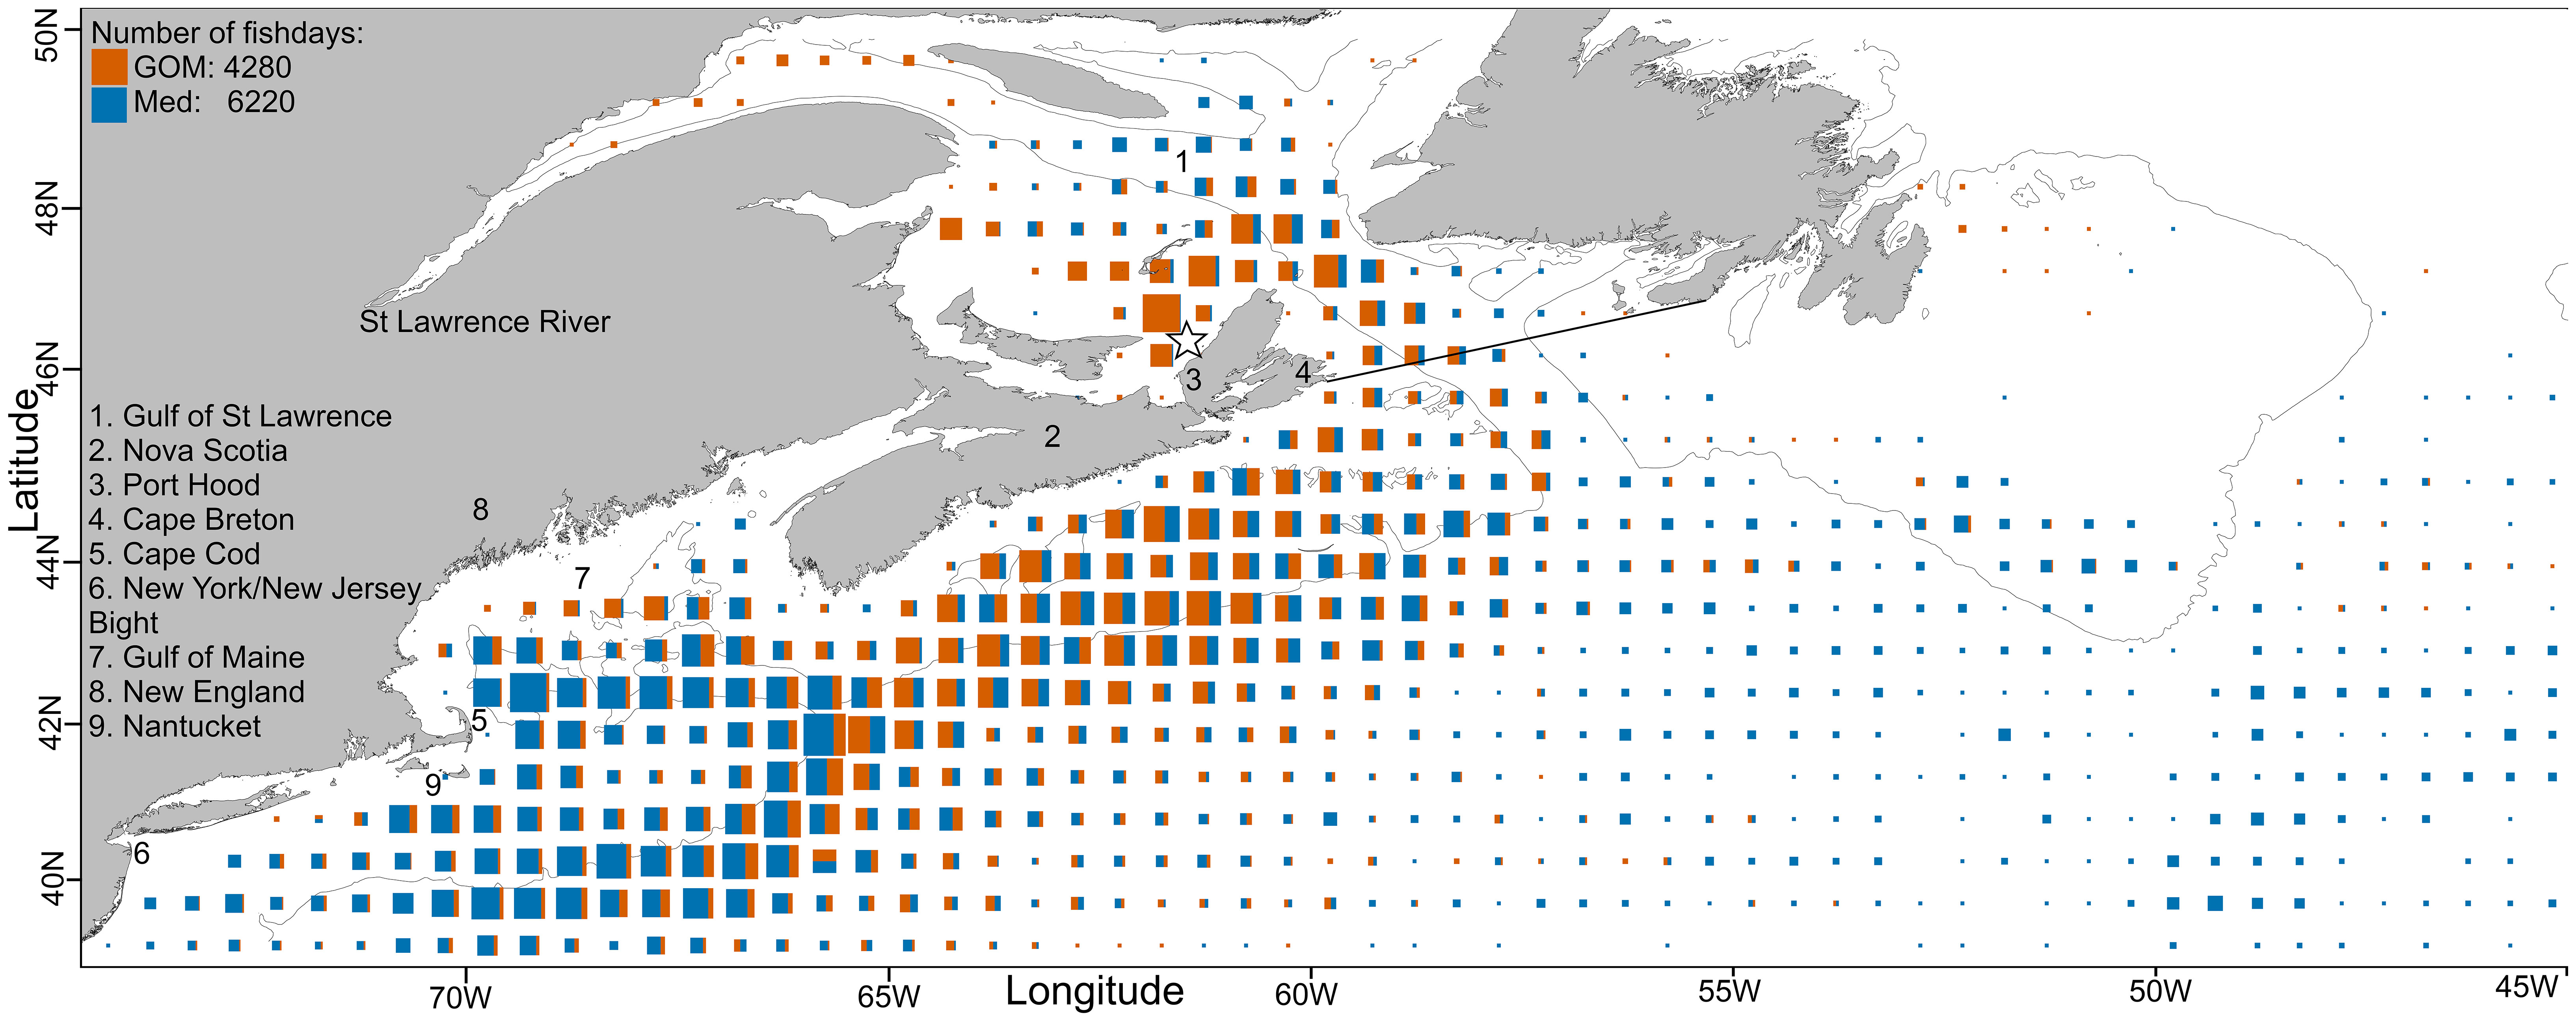
Figure 1 North-WAtl: total daily fish positions per 0.5° square, size scaled to maximum value. The thin black line is the 200m depth contour and the star denotes the Port Hood tagging location. GSL data were included in the NW feeding grounds analysis but also analysed separately. The thick black line demarking the GSL corresponds to the IHO Marine Area. N fishdays GOM (orange): 4280, Med (blue): 6220.
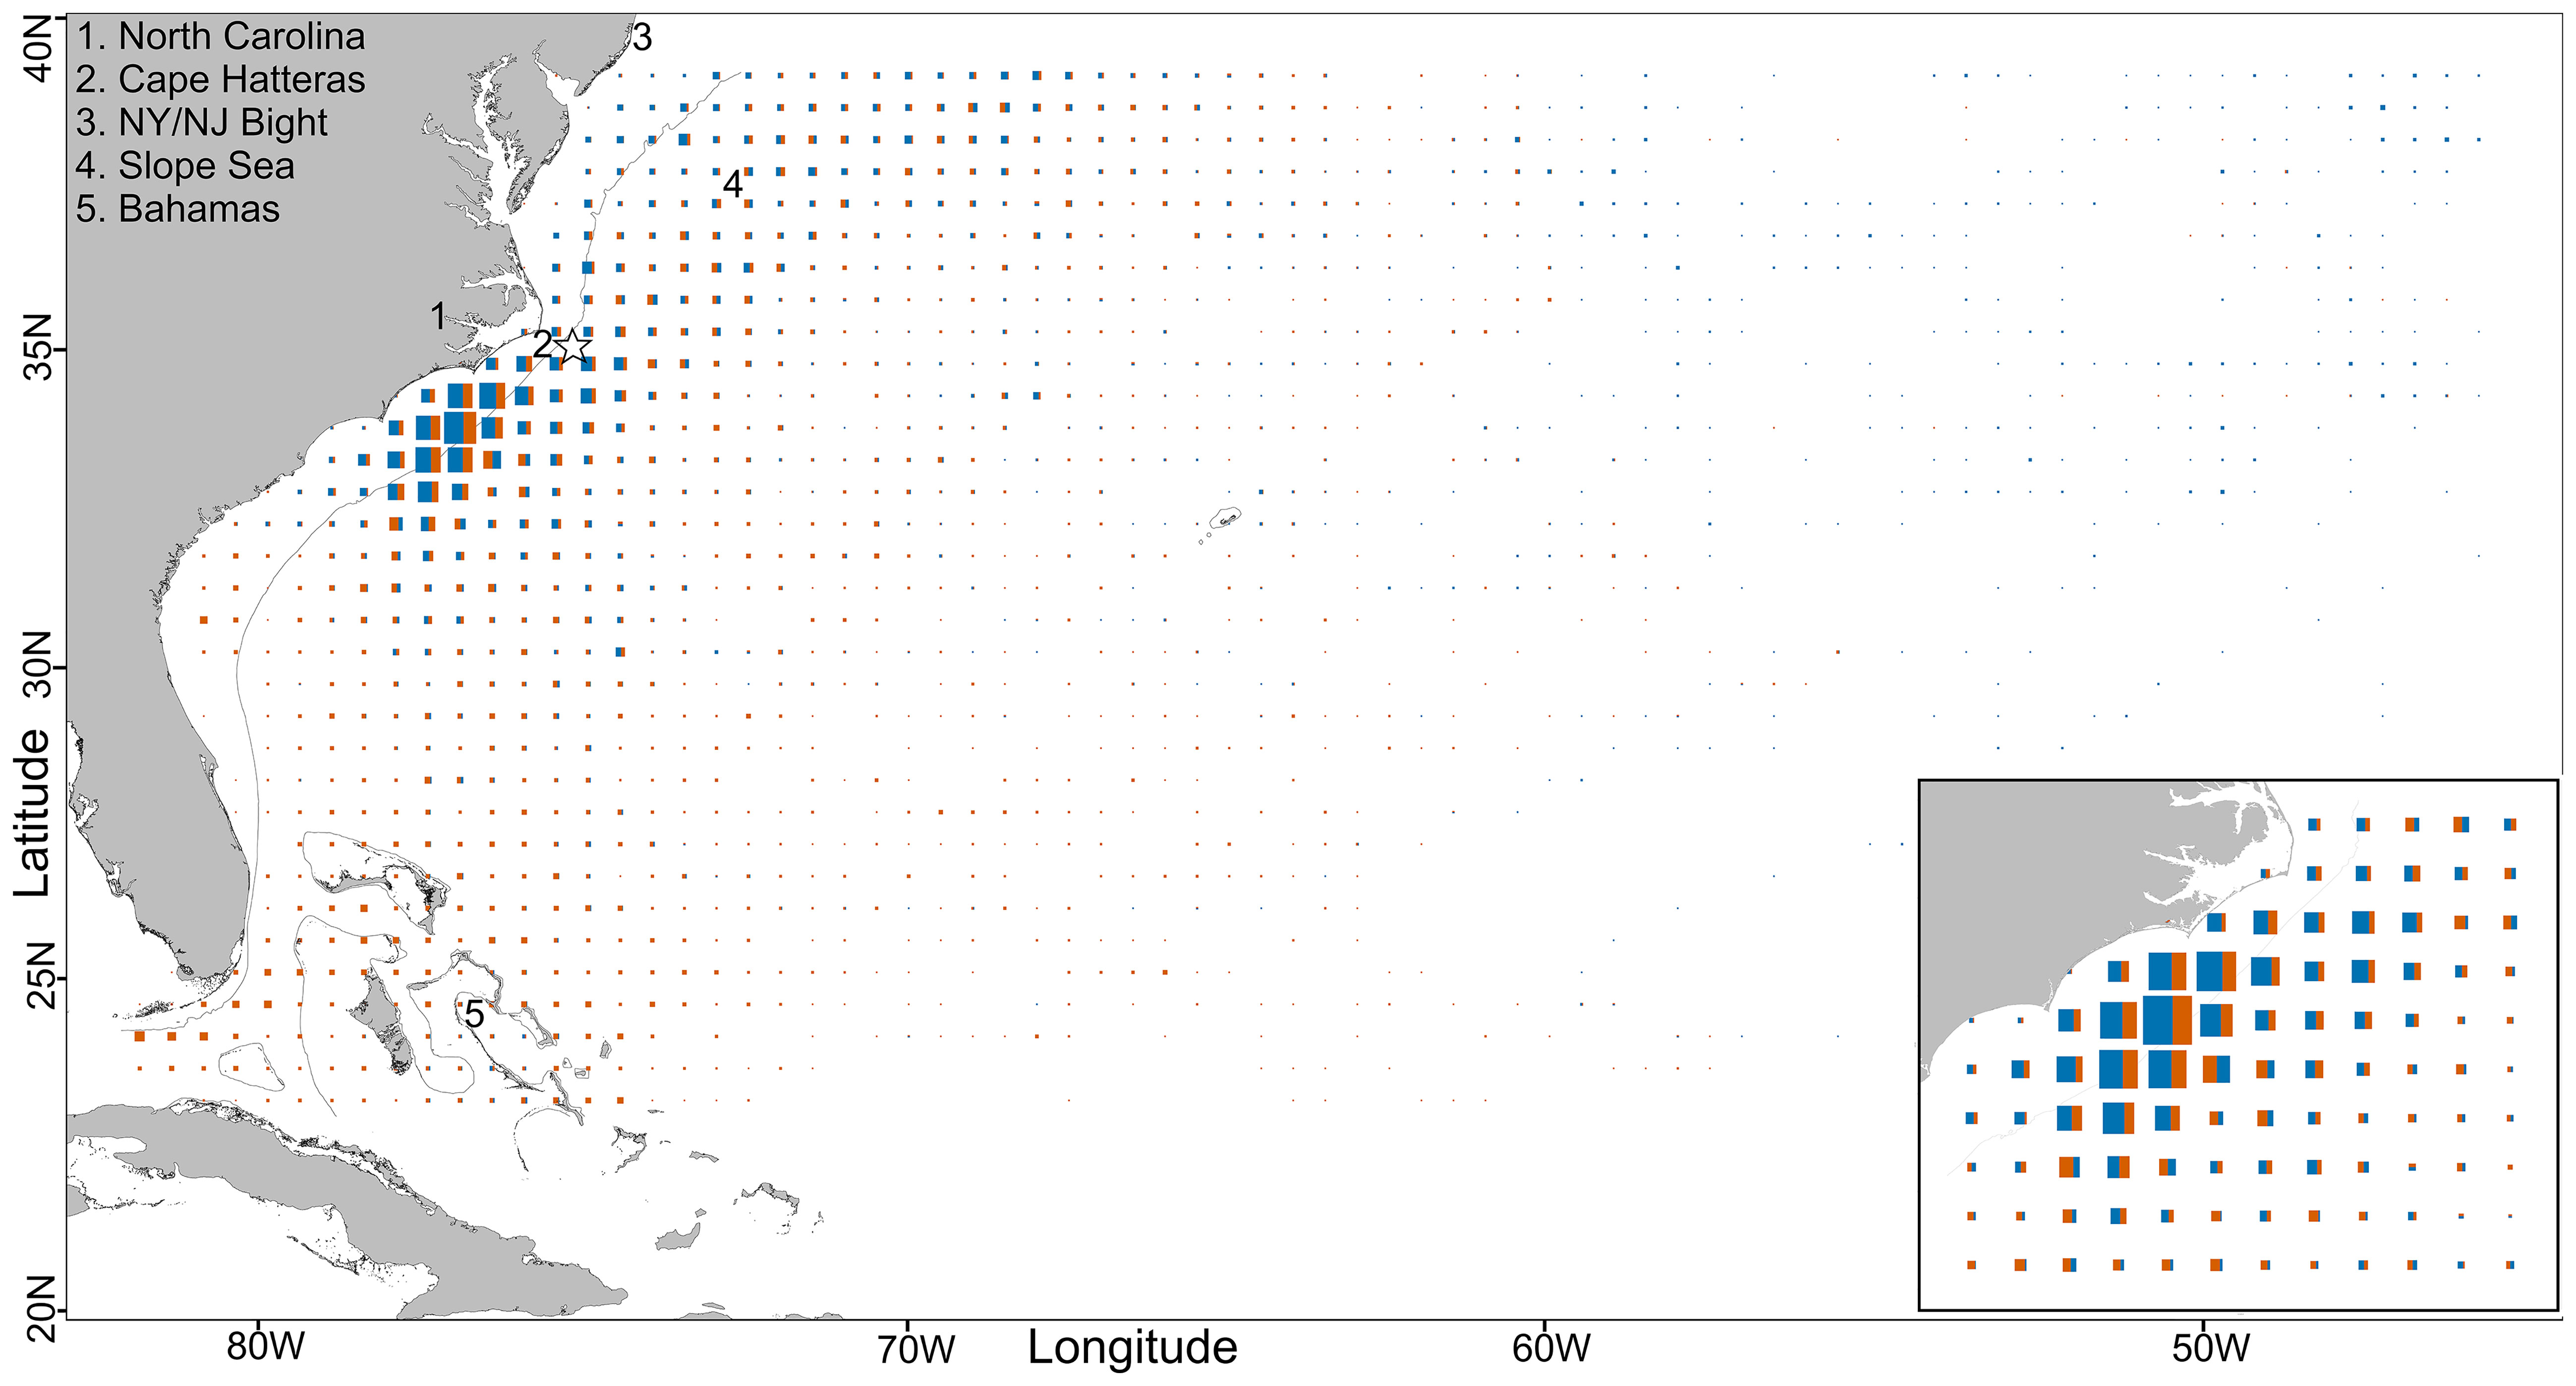
Figure 2 Central-WAtl, total daily fish positions per 0.5° square, scaled to maximum value. The thin black line is the 200m depth contour, and the star denotes the Cape Hatteras tagging location. The inset is the Hotspot 79:73°W, 31:36°N. GOM boundary from IHO. N fishdays main panel GOM: 6026, Med: 5025; inlay GOM (orange): 2014, Med (blue): 2838.
From the full dataset, tagging locations were restricted to the North American eastern seaboard to cleanly assess differences between GOM and West-Atlantic-visiting Med assigned ABT in these waters. Only ABT spatially assigned to a spatial group by visitation to a spawning ground were used for this study (n = 76 GOM, 42 Med); ABT were assigned as GOM or Med group if tags were deployed, entered, popped up, or were recovered in one of the two primary spawning grounds (spatial definitions of spawning grounds in Study regions section below). Mean curved fork length (CFL) at tagging was 267 ± 24.3 cm for GOM ABT, 198 ± 38.1 cm for Med; mean age at tagging was 18.2 ± 3.9 years for GOM ABT, 9.2 ± 3.5 years for Med. Age was calculated from length at tagging, using von Bertalanffy growth function values from Restrepo et al. (2010).
2.2 Data processing
Data from all tag types were first archived in memory and either recovered when the tag was returned or transmitted data via ARGOS satellite. Data were retrieved from ARGOS or manufacturer servers and processed for quality control, corrected for pressure drift or missing data, and processed using a geolocation model from Teo et al. (2004), updated to a state-space methodology described in Block et al. (2011), Winship et al. 2012, and Hazen et al. (2016), for position, diving behaviours, and oceanographic datasets. Tags record pressure (depth), light intensity, ambient and internal temperature data, from 1 s to 2 min intervals depending on the tag type and model year. Pressure and temperature were corrected for pressure drift and thermal inertia respectively (Teo et al., 2004). For implantable archival tags, daily locations were derived from estimates of geolocation of light data, then probable tracks calculated using a Bayesian state-space model, following established procedures (Teo et al., 2004; Block et al., 2011; Wilson et al., 2011; Winship et al. 2012; Wilson et al., 2015). ABT lengths are recorded when tagged, then their lengths are calculated each day based on growth rate, per Block et al. (2005). All data processing and analyses were conducted in R version 4.0.2 (R Core Team, 2020). A script containing the code used for all figures and analysis (including Probabilistic Assignment) is available1. Secondary data and external data sources were generated/acquired and then joined; data types, sources, and processing are given in Table 1 Eddy data processing is additionally detailed in SM 1, Additional Methods.
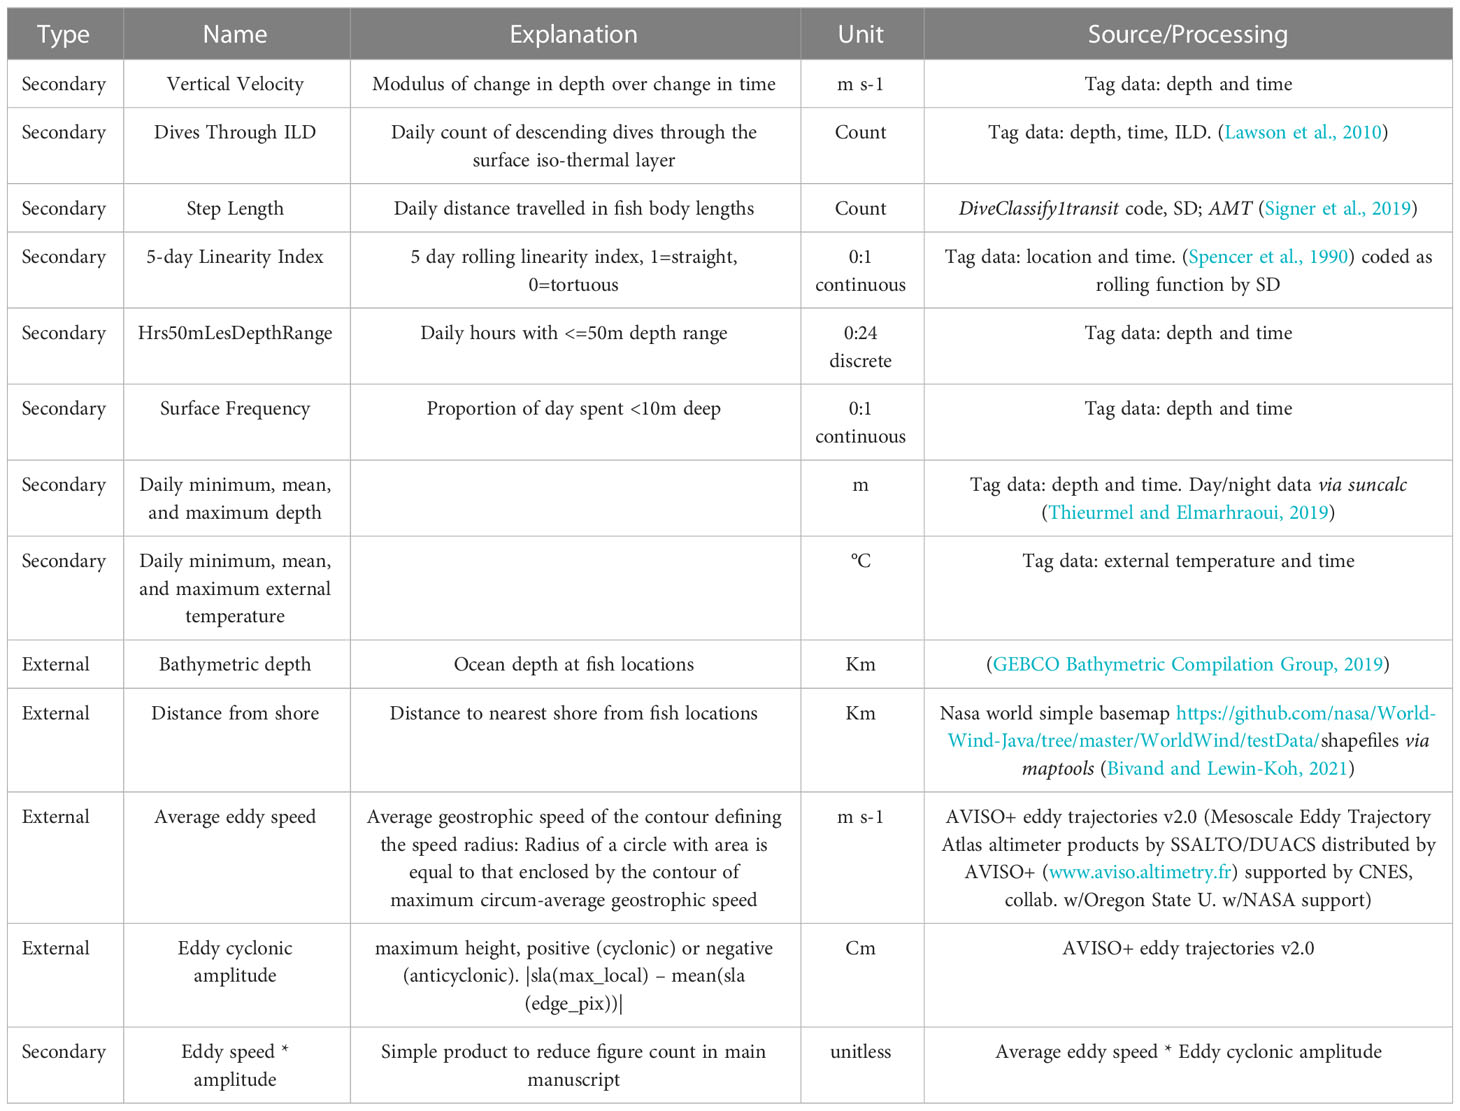
Table 1 Data types, sources, and processing used in these analyses.
2.3 Study regions
We partitioned the ABT geolocation estimations into distinct biogeographic regions defined as the western Atlantic at the 45°W meridian following the ICCAT management line (ICCAT, 1982), then latitudinally subdivided at 39.3°N per the NOAA Highly Migratory Species management plan (NOAA NMFS, 2006). We labelled the northern portion ‘North-WAtl’ and the southern portion ‘Central-WAtl’ (see Figure 3 for map). We assessed the GSL independent of the North-WAtl to see if ABT patterns within this sub-region are distinct.
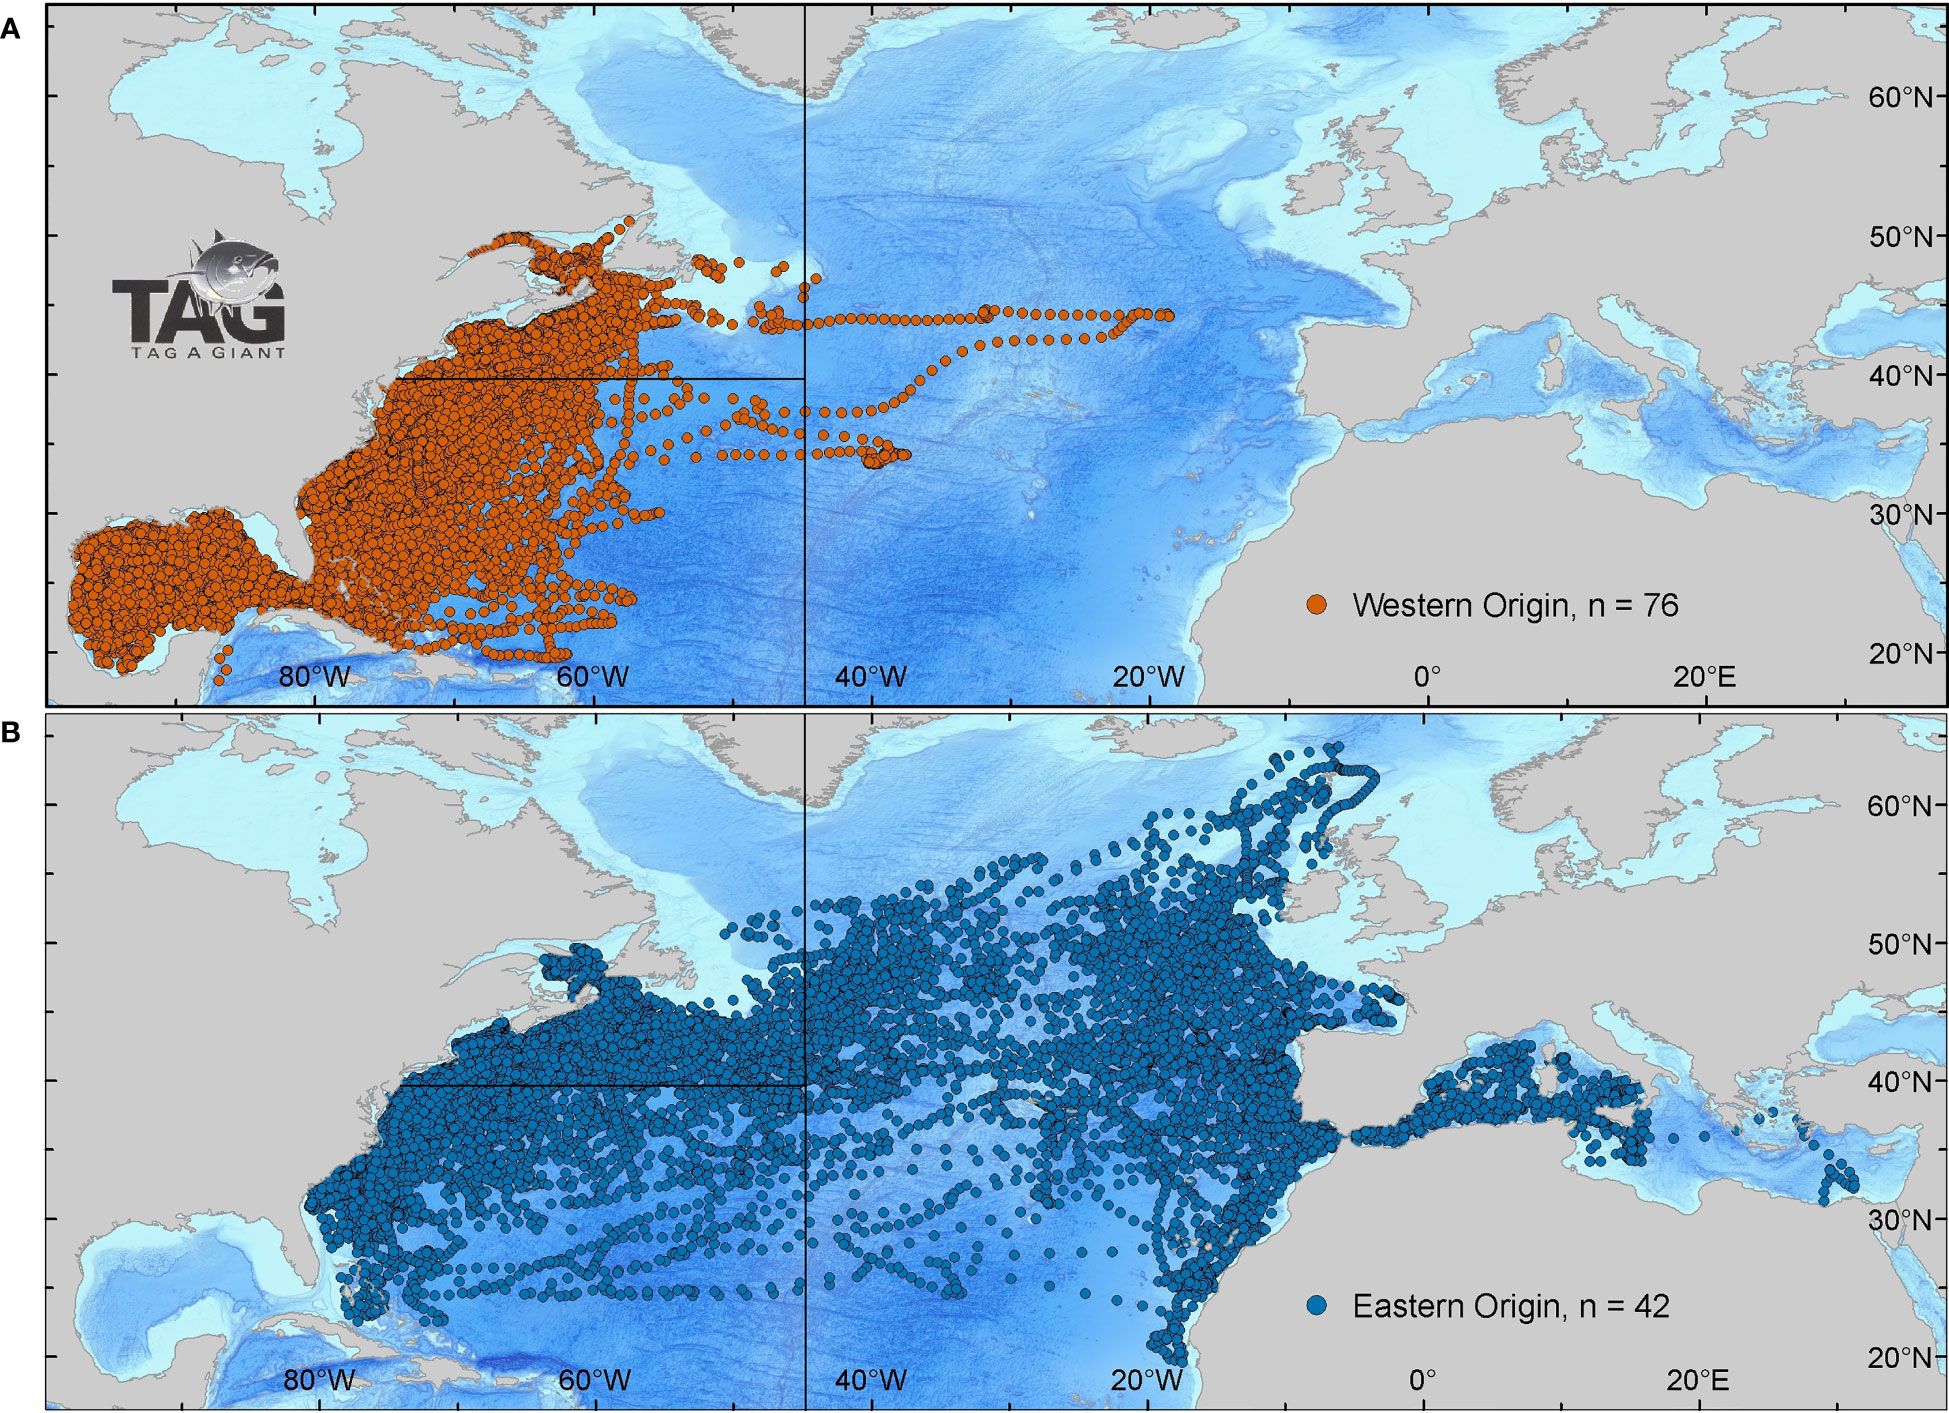
Figure 3 Daily positions of Atlantic bluefin tuna tagged in the NW Atlantic from 1996-2019. Bluefin were spatially assigned to a spawning ground if they crossed the 803° meridian to the Gulf of Mexico (western origin) group (A, red), and once past Gibraltar to the Mediterranean (eastern origin) group (B, blue). Space is partitioned into North-WAtl (A, top left) and Central-WAtl (A, bottom left) by the 453°W ICCAT and 39.3°N NOAA management lines.
Following preliminary spatial analysis of the ABT locations, we visually identified an area with a high concentration of ABT between 31 and 36°N latitude, 79 and 73°W longitude which we labelled the Central-WAtl Hotspot. Here, the Gulf Stream and Labrador Current mix warm, northward flowing subtropical, and cool, southward flowing temperate waters, upwelling nutrients which support high biodiversity including migrating pelagic species (Fautin et al., 2010), and subsequently many fisheries (Schwartz, 1989; Schaff et al., 1992). In this area, ABT are known to prey on Atlantic menhaden (Brevoortia tyrannus) in the southern portion of this region (Butler, 2007).
We delineated the spawning grounds using international cartographic precedents. The GOM is defined by the International Hydrographic Organization (IHO, 1953), available from MarineRegions.org (MarineRegions), though the entry line can be approximated as 80°W at that latitude. Similarly, we used IHO boundaries (MarineRegions) for the Med, with an additional Strait of Gibraltar polygon added to move the entry boundary line to 5.61°W (Tarifa).
2.4 Data analysis
To compare spatial group assignments for diving and surface behaviours derived from the pressure sensor, and habitat preference discerned within a spatial region, we predominantly compared group means. Differences in mean values for different variables by group were calculated using two-sided Student’s T-Tests, with the multi-sided comparison of different route time pairs calculated using analysis of variance then Tukey’s Honest Significant Difference. T-tests do not require normal data as long as the sample size is sufficient (Lumley et al., 2002); all tests conducted and discussed in this paper satisfy the conditions of sufficient sample size or normality. Differences in distributions of values by group were compared with two-sided Kolmogorov-Smirnov tests (Kolmogorov, 1933; Smirnov, 1948). Results are then organised and discussed by region.
2.5 Probabilistic assignment
Once we had identified geographic habitat utilization differences between the two assigned ABT groups we explored whether these could be used to assign probable spatial assignments to ABT which had not visited a known spawning ground. We created 26 movement and behavioural pattern tests to differentiate ABT from the two spatial groups – see Figure 4. Each test comprised one to three criteria for which the two groups differed notably, where GOM/Med group means were skewed at least 75:25 in favour of one group. These were typically identified from analyses of data distributions, e.g. annual/monthly locations of ABT, violin plots of depths, etc. For example, ‘proportion of days north of 50°N latitude’ is a test with a single criterion, and ‘proportion of days spent greater than 800 km from shore, in the northern forage region’ is a test with two criteria. For each test and for each ABT, the proportion of days satisfying the criteria (of total eligible days), was recorded for already-classified (assigned-group) ABT. Proportions of fishdays (the summary statistics for one day of data per ABT, e.g. mean depth) were corrected to account for the unequal number of fishdays by group in the full dataset (GOM 16088, Med 13967), or in subset regions (e.g., GSL). This results in a table of proportion scores for all tests for all classified ABT, from which the per-group means are calculated, i.e., the mean proportion of (eligible) days satisfying each criterion, per test, per spawning group. For example, mean GOM : Med proportions ‘days north of 50°N latitude’ was 0: 0.01 respectively.
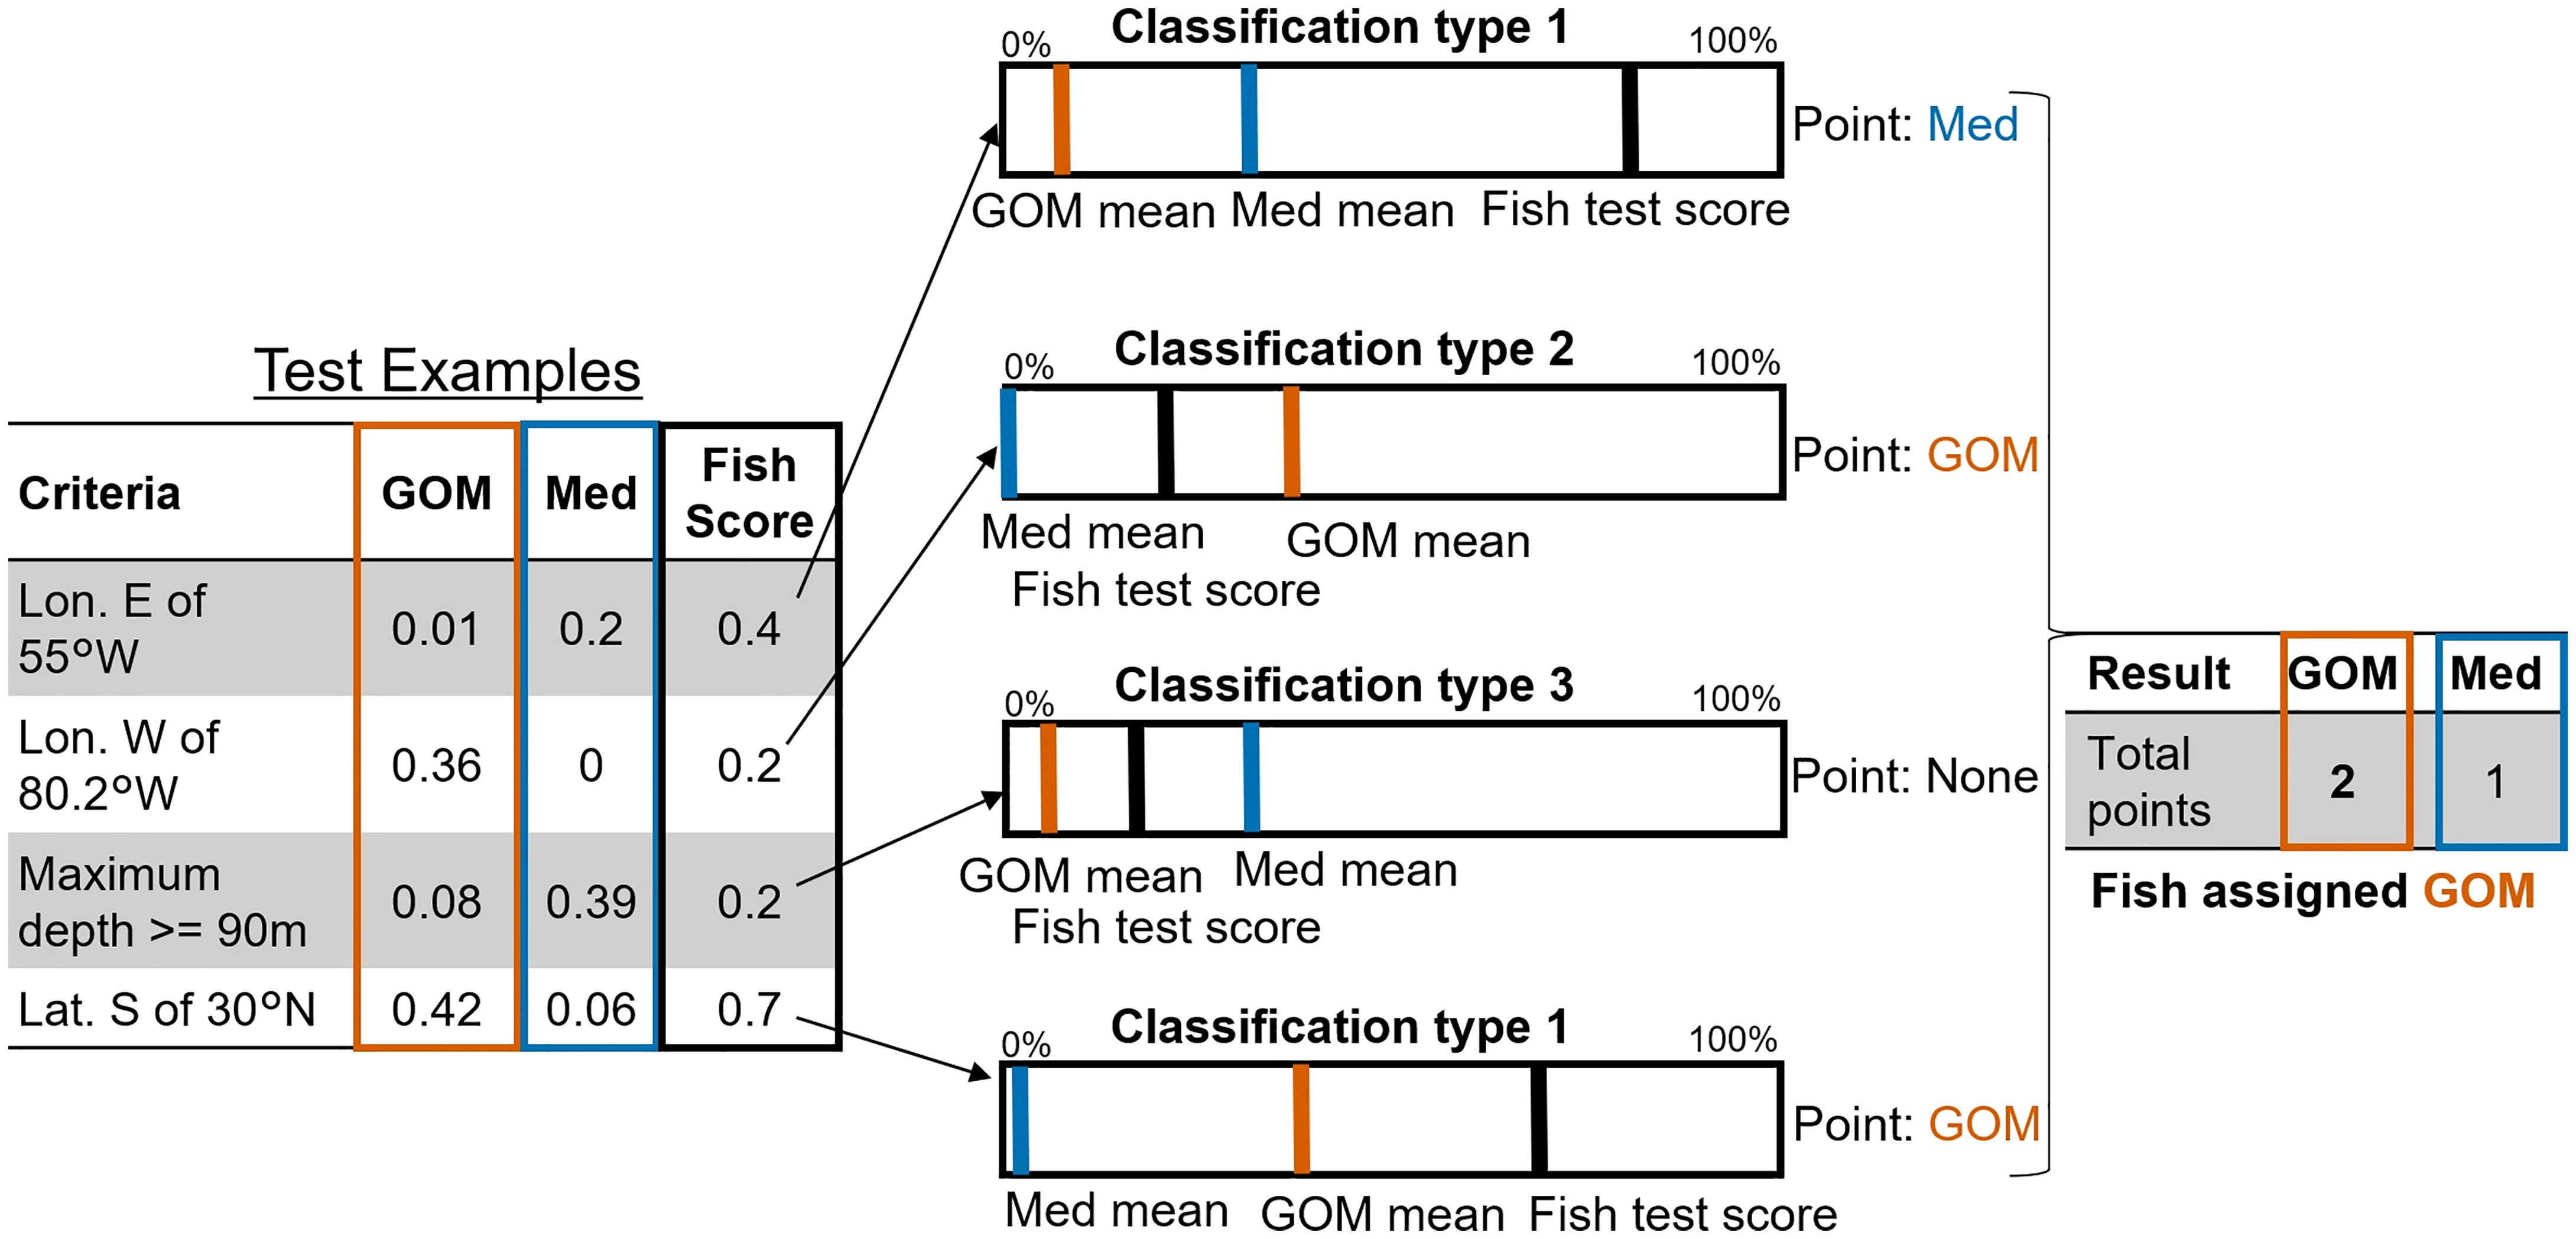
Figure 4 Methodological diagram of Probabilistic Assignment process. 1: 26 tests were created (4 shown) which highlight notable per-group differences in scores for average proportion of fishdays satisfying criteria, e.g. test 1: GOM 0.01, Med 0.2. 2: For each unknown-group fish, if their value is higher than the highest group mean value they are assigned to the high-value group (test 1: Med, test 4: GOM). If they have a non-zero value and one group has only zero values, they are assigned to the non-zero mean group (test 2: GOM). If their value lies between the means of the two groups, they remain unassigned (test 3). 3:Fish are assigned to whichever group they score the most test points for.
For each test, classification (to GOM, Med, or neither) was determined using a three-tiered rules system:
1. If the fish’s test value (proportion of eligible days meeting criteria) exceeds the highest-value mean from both groups, that fish is likely to be within that highest-mean-value group, and unlikely to be in the other group. For example, if an individual fish spends 0.4 (40%) of its days east of 55°W, this is more than the highest mean (Med), which was 0.2 (20%) (compared to the GOM mean of 0.001 (0.1%)), so the fish would be assigned as Med for that test (Figure 4 Classification type 1).
2. For some tests there were no fishdays satisfying the criteria for one group, e.g., no Med fish were found west of 80.2°W. In those cases, fish were assigned to the other group (GOM) if they had any days qualifying (i.e., proportion > 0; Figure 4, Classification type 2).
3. If the fish’s test value lies below the highest mean, and neither group means are zero, that test is not assigned to either (e.g., maximum depth >= 90 m; Figure 4, Classification type 3).
A total of 32 tests were initially examined, and then, trimmed to 26 after removing six tests where the number of days by group was more evenly balanced than 75:25 in favour of one group. See SM 1 Table 3 for the list of test criteria, including GOM/Med only tests. Each fish is scored as GOM, Med, or neither for each test, then finally assigned to whichever group they score highest across the 26 tests (tied-score fish remain unassigned). After parameterizing and validating the rules using classified fish, we then applied the same methodology to unclassified fish to determine which could be assigned to specific groups based on movement and behaviour. To avoid minor confounding, per-group means were generated for every known-assigned fish independently, omitting that fish, so the fish in question wouldn’t be tested against a mean which included its own score.
3 Results
Mean date of entry in the spawning areas are January 22nd for spatially-assigned GOM ABT, and May 25th for spatially-assigned Med ABT (SM 1 Figure 1). The analysis of spatial use of habitat of the GOM-assigned bluefin indicate that over 98% of the estimates were west of the 45° meridian, with only a few individuals moving into the eastern Atlantic (Figures 3A, 5C). ABT assigned by spawning location to the Med group had a much more extensive use of the North Atlantic, ranging north to the Faroe Islands and south toward the upwelling areas of the African coast (Figures 3B, 5B).
To compare habitat usage between spatially-assigned GOM and Med ABT, we focused on the geographic distributions within the foraging areas to identify maximum areas of overlap within the northwest Atlantic region (west of 45°W), then latitudinally subdivided at 39.3°N to compare migration and behaviour between the ‘North-WAtl’ and the ‘Central-WAtl’ (see Methods and Figure 5).
3.1 Overview of annual migration cycle, patterns of behaviour, and environment
GOM ABT have restricted spatial ranges, clustering around the slope waters of either the GOM or the Central-WAtl (Hatteras shelf and slope) from December to June, then to the North-WAtl (Gulf of Maine and Nova Scotian shelf waters), between July and November. GOM ABT of the sizes tagged display a clear, tight migratory pattern, especially with regards to the fast exit from the GOM in spring and immediate transit up to the North-WAtl (Figures 5A, C). Compared to Med ABT, GOM ABT generally go further south (required to enter the GOM; Figure 5A, T-test p<0.001) and, by definition, further west to enter and reside in the GOM (Figure 5C, T-test p<0.001), but also rarely swim above 50°N and rarely past 45°W (Figures 3, 5, 6). Tracks indicate GOM ABT enter their spawning ground between November and May (Figure 5A, C; SM 1 Figure 2), with variable residence periods – some spending only weeks in the GOM, while others stay for months before spawning (Figure 5C). Post-spawning, they leave from May to June and proceed directly to the North-WAtl, typically to the GSL, often covering distance at relatively fast speeds (>40°N; high speed taken as being above 31.6km/day, Figures 5A, 7, SM 1 Figure 5). Variance in GOM departure and arrival dates results in a diffuse presence in the Central-WAtl throughout the year, though presence here is highest from December to February.
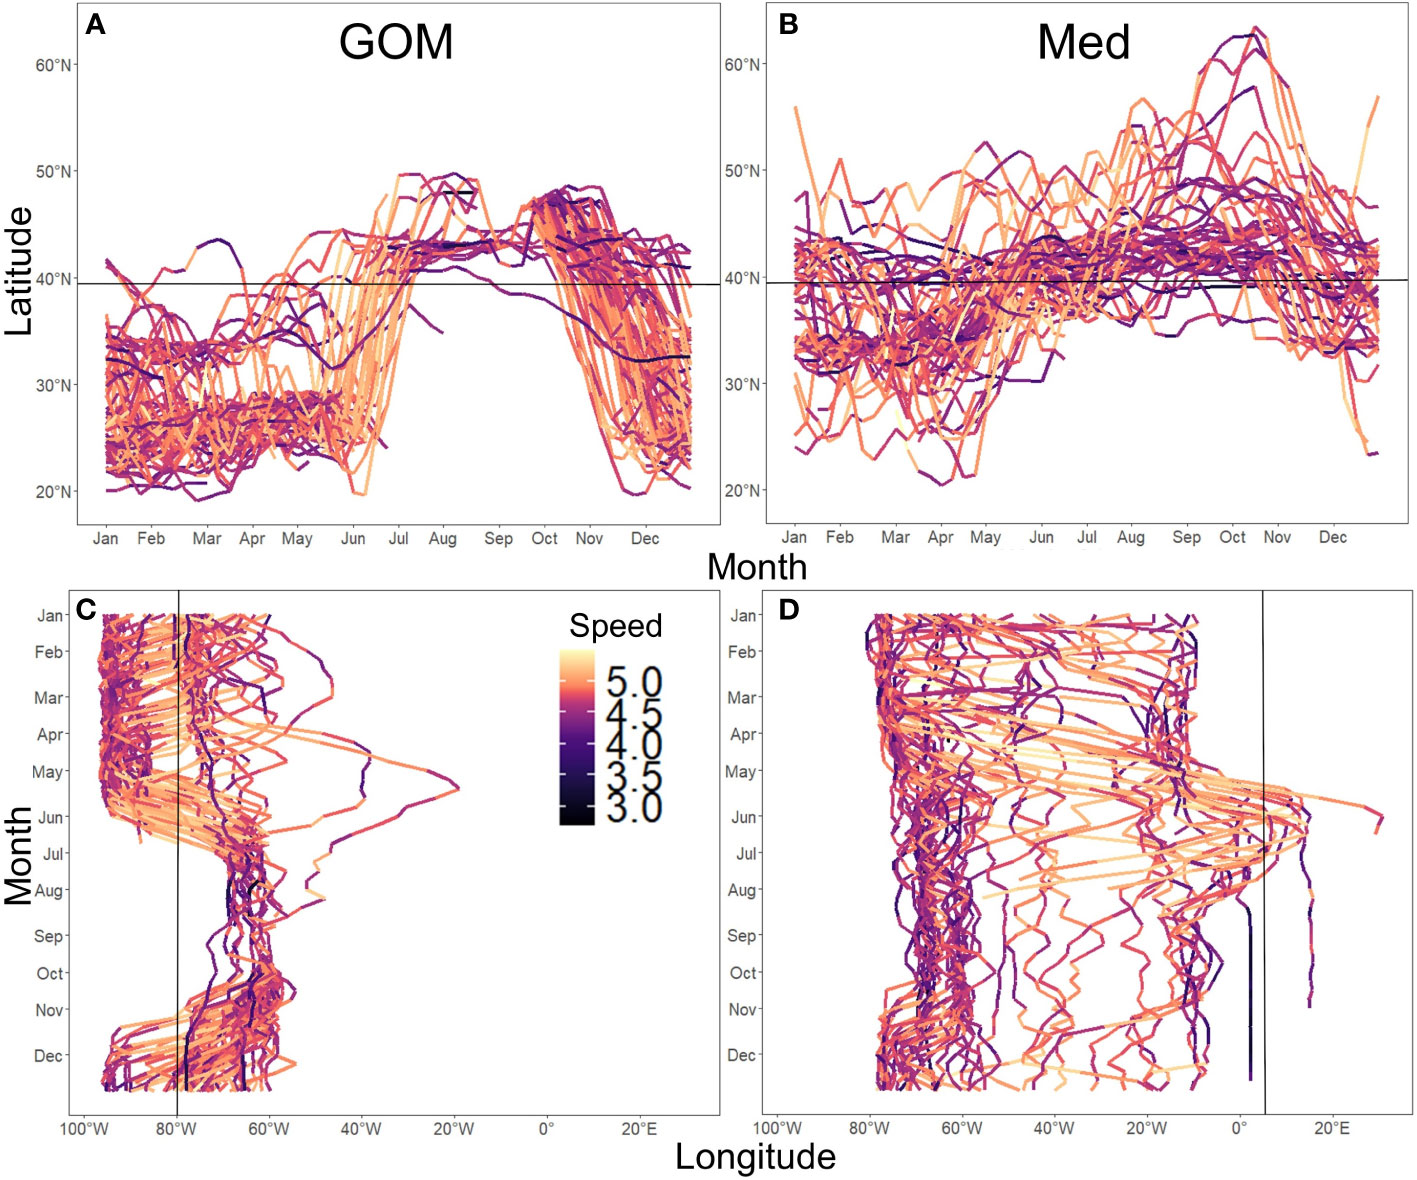
Figure 5 Spatial ranges of ABT groups. Panels show latitudinal and longitudinal tracks for all individuals of GOM (A, C) and Med (B, D) groups. Track colour indicates mean weekly speed in m/day, log10-transformed. Black lines denote the division between North and Central WAtl at 39.3N° for Latitude (A, B), and the entry to the GOM at 80°W (C, D) and Med at 5.5°W (D).
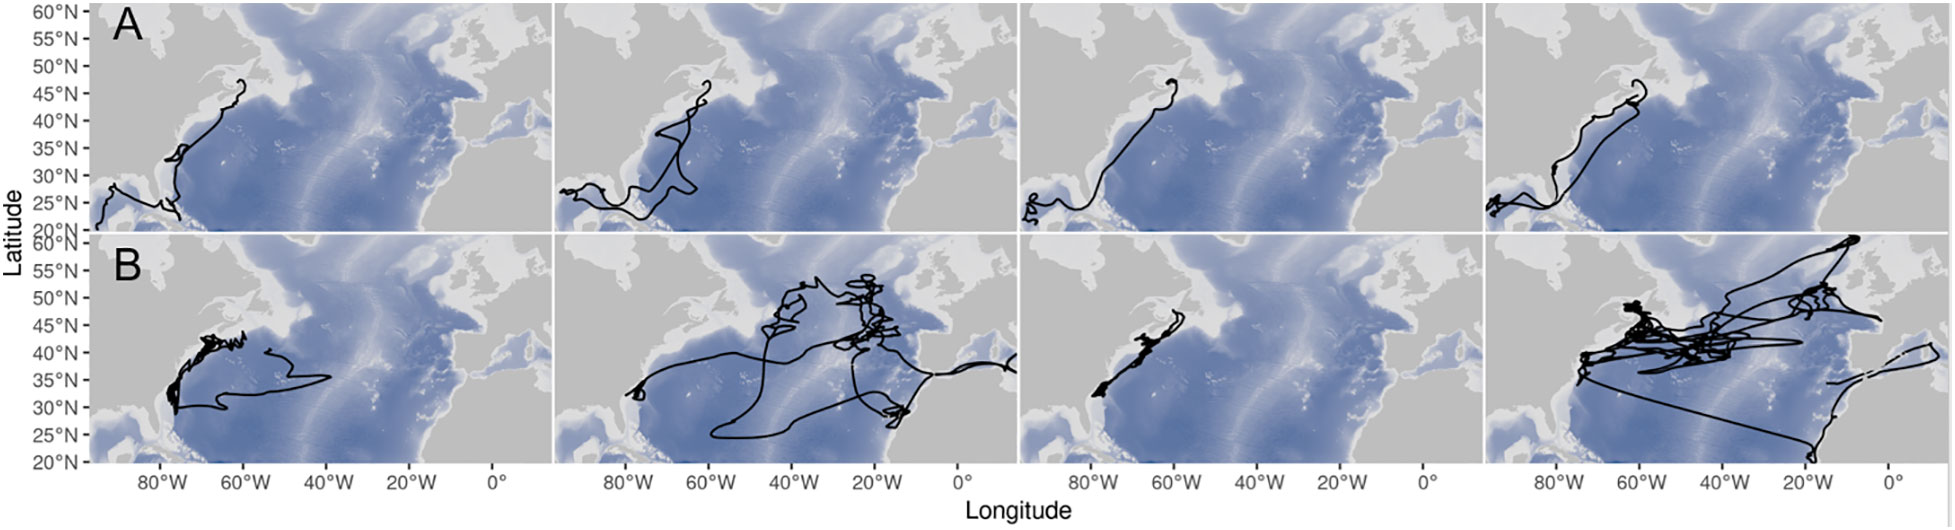
Figure 6 Example tracks for GOM (A, left) and Med (B, right) Atlantic bluefin tuna tagged in the northwestern Atlantic.
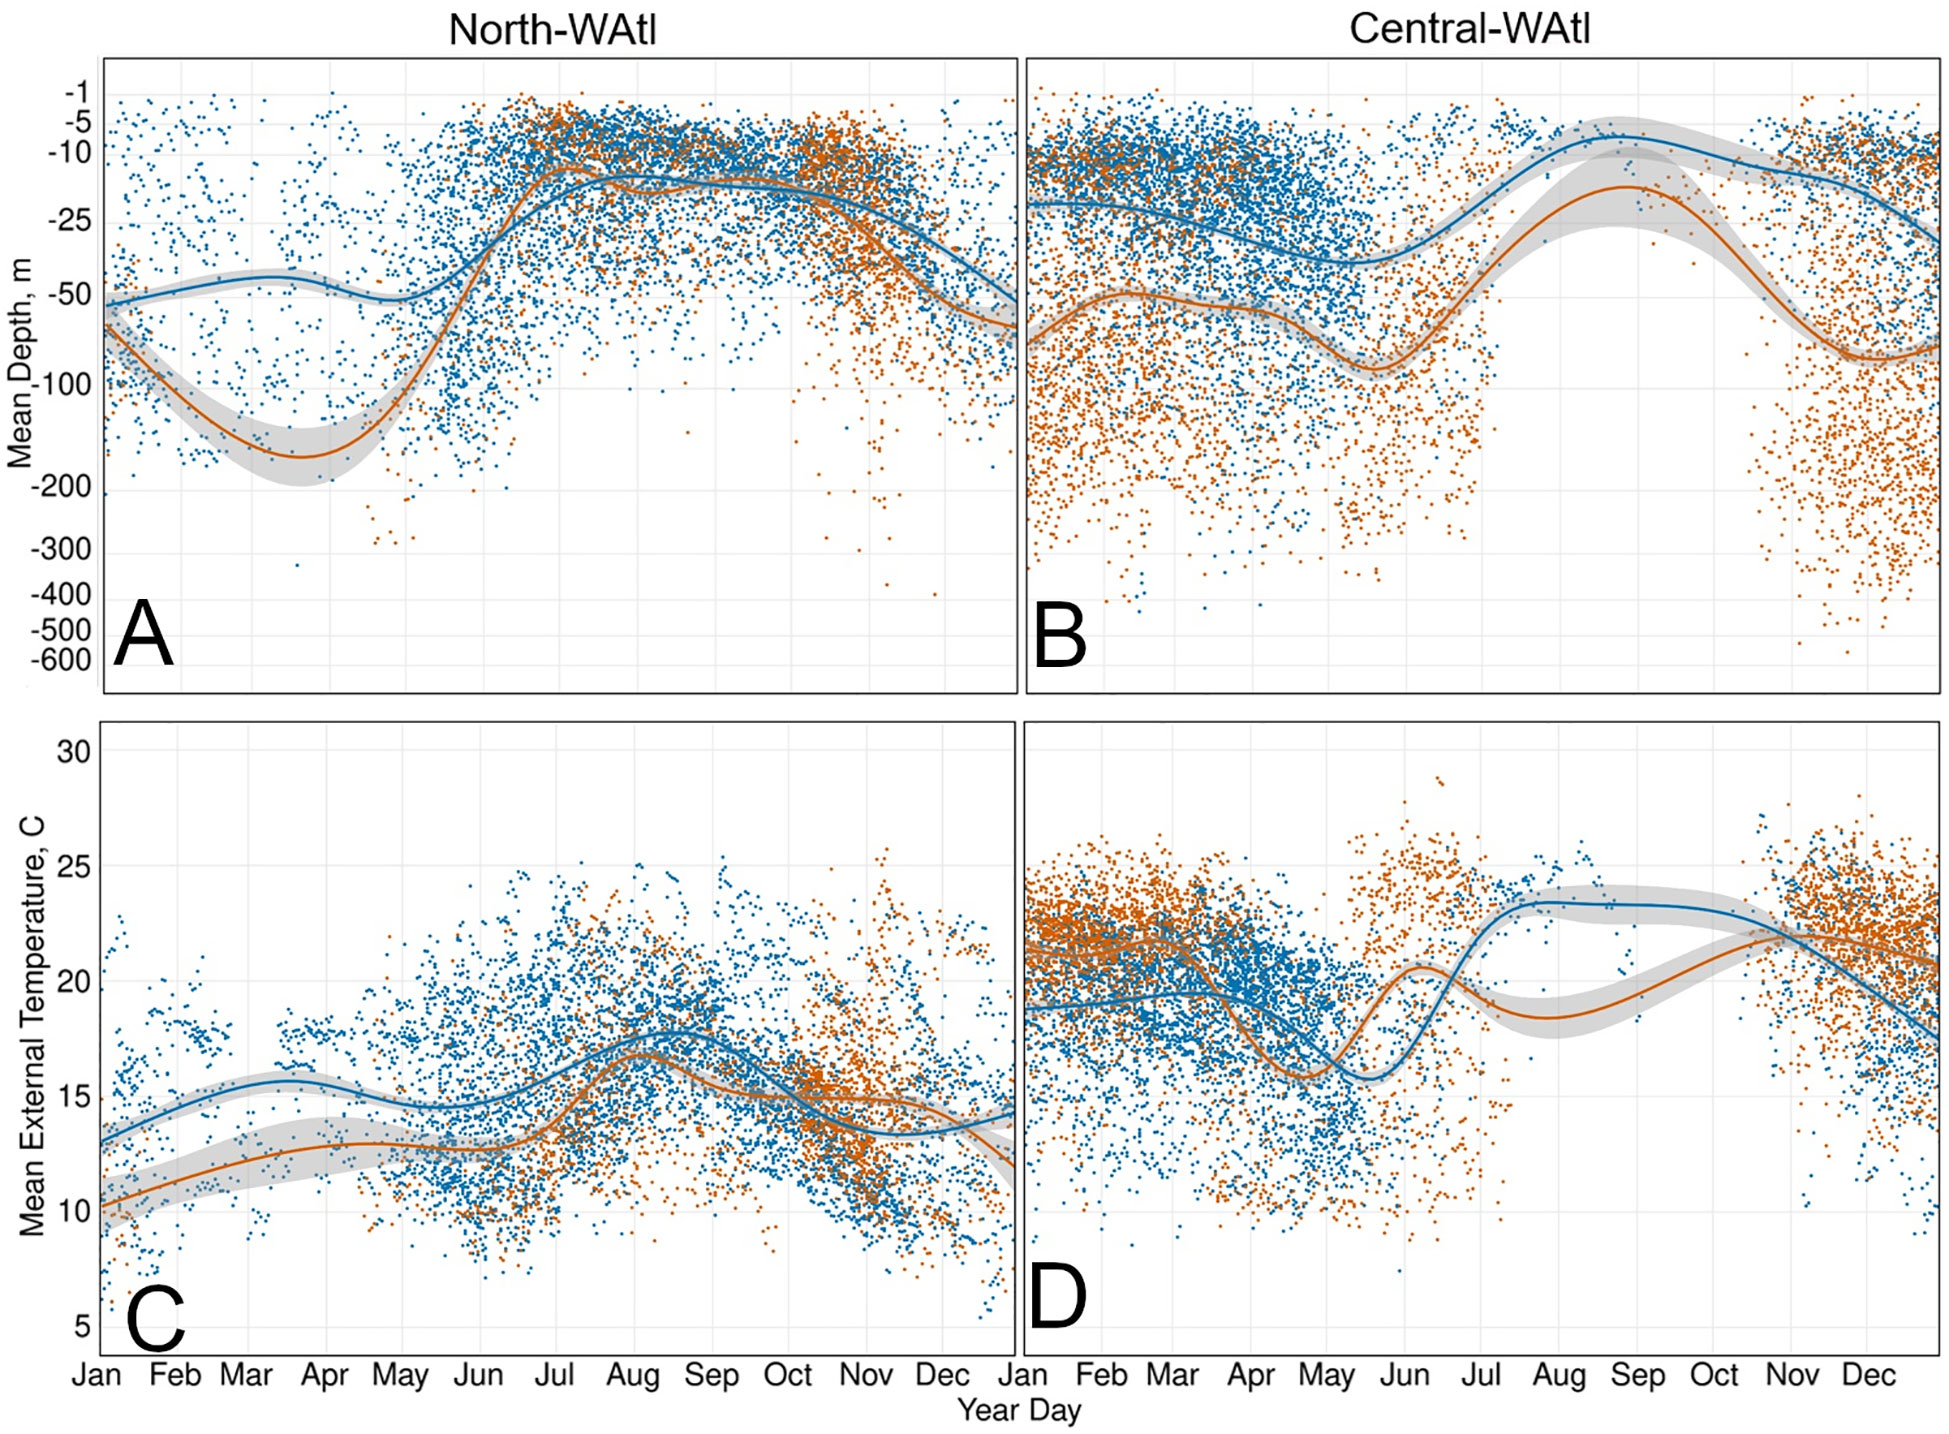
Figure 7 Daily mean depth (m) (A, B) and daily mean external temperature (°C) (C, D) of GOM and Med fish, with GAM smoothed trend lines, in the North-WAtl (A, C) and Central_WAtl (B, D) regions. GOM orange, Med blue.
GOM bluefin travel from the GSL to the GOM either in direct paths offshore, or less commonly they follow the continental shelf break (Figure 6). Due to these direct offshore routes, GOM ABT are typically swimming deeper than Med ABT (Figure 7), which more closely follow the shelf break. When in the North-WAtl, GOM ABT linger around Port Hood and Prince Edward Island in the GSL, and off the shelf break off Nova Scotia (Figure 1).
Western-tagged Med ABT have migration patterns and residency timing that are distinct from the GOM-assigned ABT. Med-assigned ABT have a more variable set of annual movement patterns, with some remaining in the Western Atlantic, rarely traveling far south into the Caribbean (<25°N), some going north into the Eastern Atlantic waters (>50°N; Figure 5B), and some crossing to the Med to spawn some years but remaining in the West Atlantic in other years (Figure 5D). Med ABT show two movement patterns: some travel south along the North American shelf and slope (Med-W), others travel far from North America to the central Atlantic, including to Europe (Med-E; SM 1 Figure 4).
Med-assigned ABT arrive in the North-WAtl in April, slightly earlier than GOM ABT, but leave at a similar time in December (Figures 5B, D, 8, SM 1 Figures 2–4). Their movement timings in the northeast Atlantic are similarly timed to those in the North-WAtl (SM 1 Figure 3). Med ABT inhabit the Central-WAtl for a longer continuous period than GOM ABT, from November to April (Figures 5A vs B, 8, SM 1 Figures 2–4). For those Med ABT not returning to their spawning grounds in a given year (the majority of those tagged), summer months are spent around 40°N, either near to shore around the Gulf of Maine shelf, or in deeper waters of the mid-Atlantic. Western-tagged Med ABT which visit Europe in a given year arrive in the same latitudinal range as the Central-WAtl in April and leave by July heading north, either staying east or returning west to the North-WAtl. Those ABT that enter the Med do so in June (Figures 5, 7B, D, SM 1 Figure 3). Most North-EAtl-visiting ABT spending little time in the Med itself, instead remaining in the East Atlantic (east of 45°W; Figure 5D). Med ABT speed during transit is high (Figure 5D) but with a less pronounced increase in mean speed than for the GOM exit (SM 1 Figure 5).
Spatially-assigned GOM and Med ABT both overlap in the same regions in the North-WAtl from June to December (Figure 8, SM 1 Figures 2-4), and have similar depth profiles (Figure 7A). While there is fine-scale separation between the groups in some areas, there is broad similarity in their locations, especially when migrating through and out of their overwintering locations.
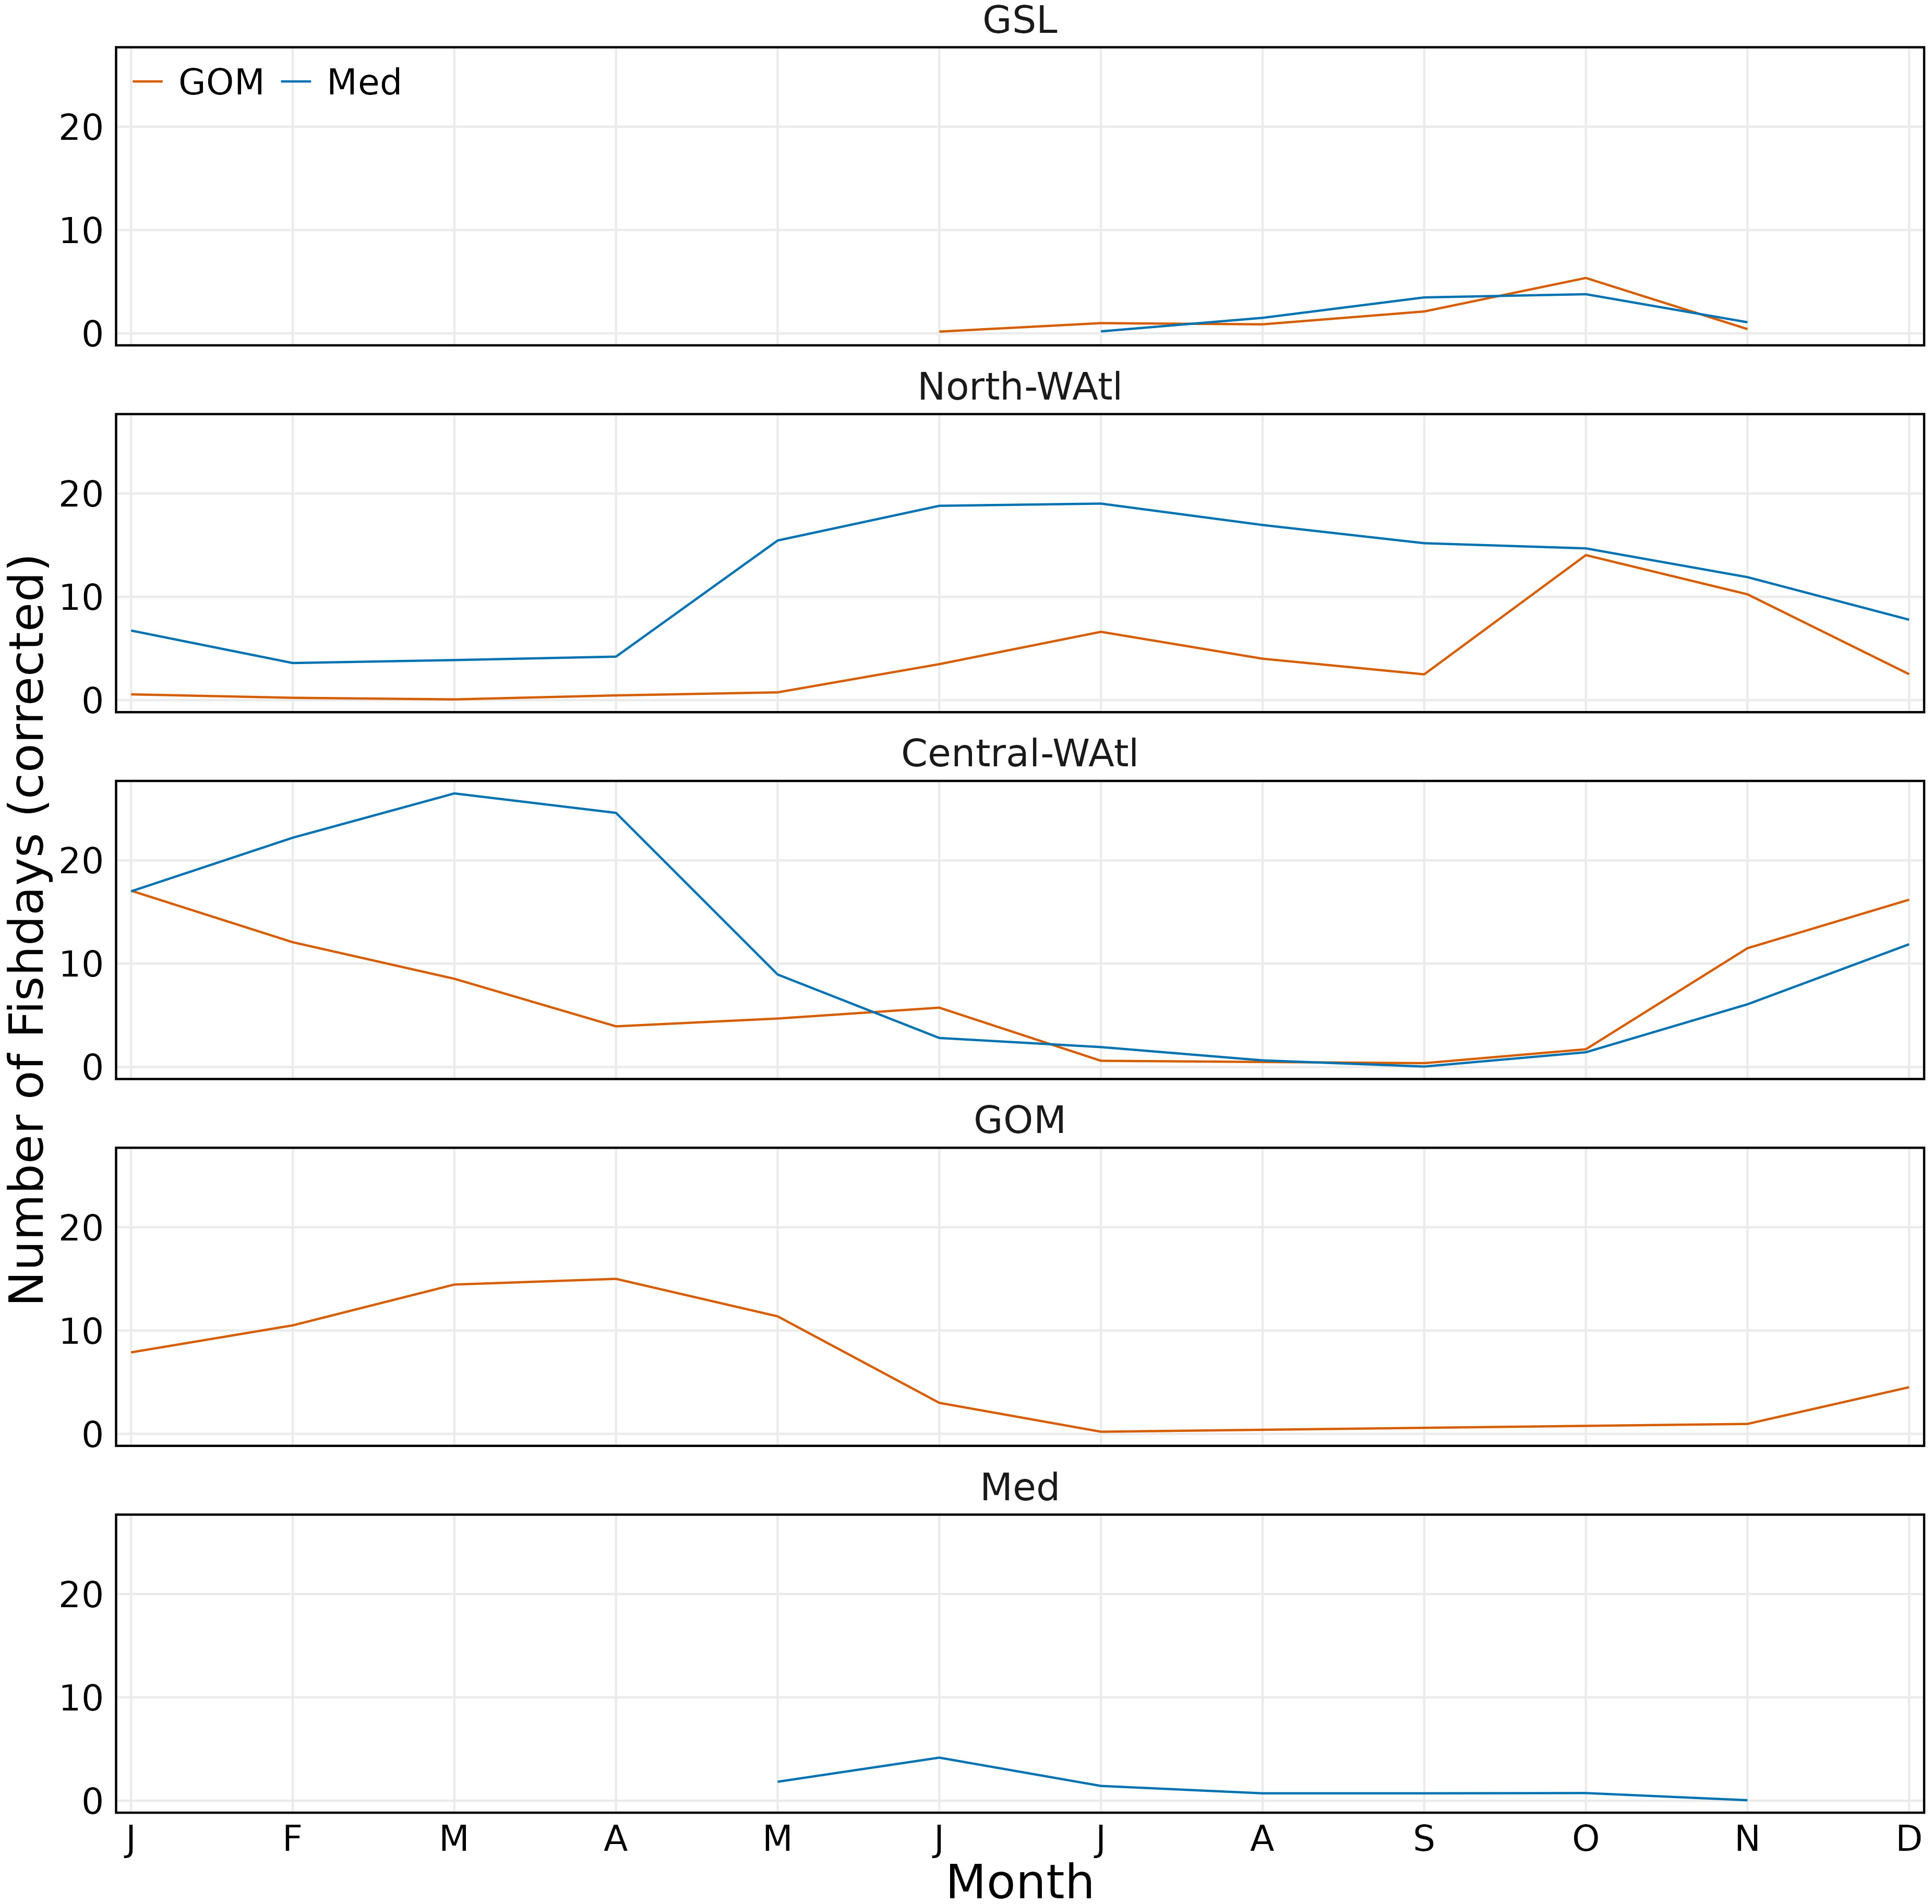
Figure 8 Monthly number of fishdays per region by group (GOM orange, Med blue). Fishdays scaled to number of tagged fish per group.
Some GOM ABT do not enter the GOM in certain years (i.e., they were assigned based on presence in the GOM in a different year), and predominately remain in the Central-WAtl Hotspot (Figure 2) from November to April, which they again overlap with Med ABT. Both groups are off the shelf and slope waters of the Gulf of Maine and Nova Scotia from August to October.
Pressure and temperature data were used to delineate distinctions in vertical habitat use between areas by the GOM- and Med-assigned ABT. While there were regional overlaps, and similarities in depth utilization, there were also subtle differences. In the GSL, both GOM- and Med-assigned ABT are foraging in the surface waters (Student’s T-test of Mean Depth p=0.27, i.e. similar), moving deeper as waters warm over successive months (SM 1 Figure 7A). Med ABT experience significantly colder mean External Temperatures while in the GSL, however (T-test p<0.001), suggesting differing behaviour between the two groups. In the wider North-WAtl, Med ABT Mean Depths are also similar to GOM ABT (Figure 7A; T-test p=0.44), but Med ABT are in warmer waters (Figure 7C, External Temperature T-test p<0.001), again suggesting behavioural partitioning, distinct from the GSL behaviours. In the Central-WAtl and on their respective spawning grounds, GOM ABT are in deeper waters (both Ocean Depth T-tests p<0.001) and swimming deeper (Figure 7B, both Mean Depth T-tests p<0.001), (Figure 7D; External Temperature T-tests both p<0.001).
3.2 North-West Atlantic
Both groups showed important geographical differences around the Gulf of Maine, but generally overlap in the North-WAtl. Spatial partitioning is evident at 65.5°W, with more GOM-assigned ABT on the Scotian Shelf, and in the western GSL, on the shelf near Georges Banks, and in the northeastern Gulf of Maine. Med ABT were located toward the south and west, occupying much of the Gulf of Maine, also the New York Bight, Hudson Canyon, and offshore far past the shelf break – Med ABT are 100-130 km further offshore than GOM ABT in August and September, when GOM ABT are all within 300 km of shore in the North-WAtl (SM 1 Figure 6). Importantly, GOM and Med groups spatially overlap for much of their time in the North-WAtl, sharing some travelling and feeding areas along the shelf break (Figure 1), from August to October (Figure 8).
Shelf and slope regions appear to be common for both groups, potentially for foraging purposes, but GOM ABT spend more time there. GOM ABT spend more time on the shelf (~200m bathymetric depth or less), extend their range further north (latitude T-test P<0.001), and occupy in colder water (Figure 7C; External Temperature P<0.001). Med ABT spend more time off the shelf in greater Ocean Depths, and with higher Distance To Shore (T-tests both P<0.001), including sometimes heading to the mid-Atlantic (Figures 3, 5, 6). However both GOM and Med ABT also display a general affinity for the shelf break and slope water regions, which potentially serve as important foraging grounds. Here both groups have similar Mean Depths of around 35m (Figure 7A; T-test P=0.36), and inhabit cyclonic eddies that upwell nutrients and thus support prey food webs (Eddy Cyclonic Amplitude T-test p=0.55, though Eddy Average Speed T-test P<0.001, with Med ABT in the faster eddies). See also SM 1 Figures 95:109.
Pertaining to the PA methodology, North-WAtl-specific tests constituted 43% of tests that positively contributed to ABT assignments; 5% of GOM assignments, 72% of Med. Distance to Shore and Ocean Depth tests were the main contributors to ABT assignments (Figure 9).
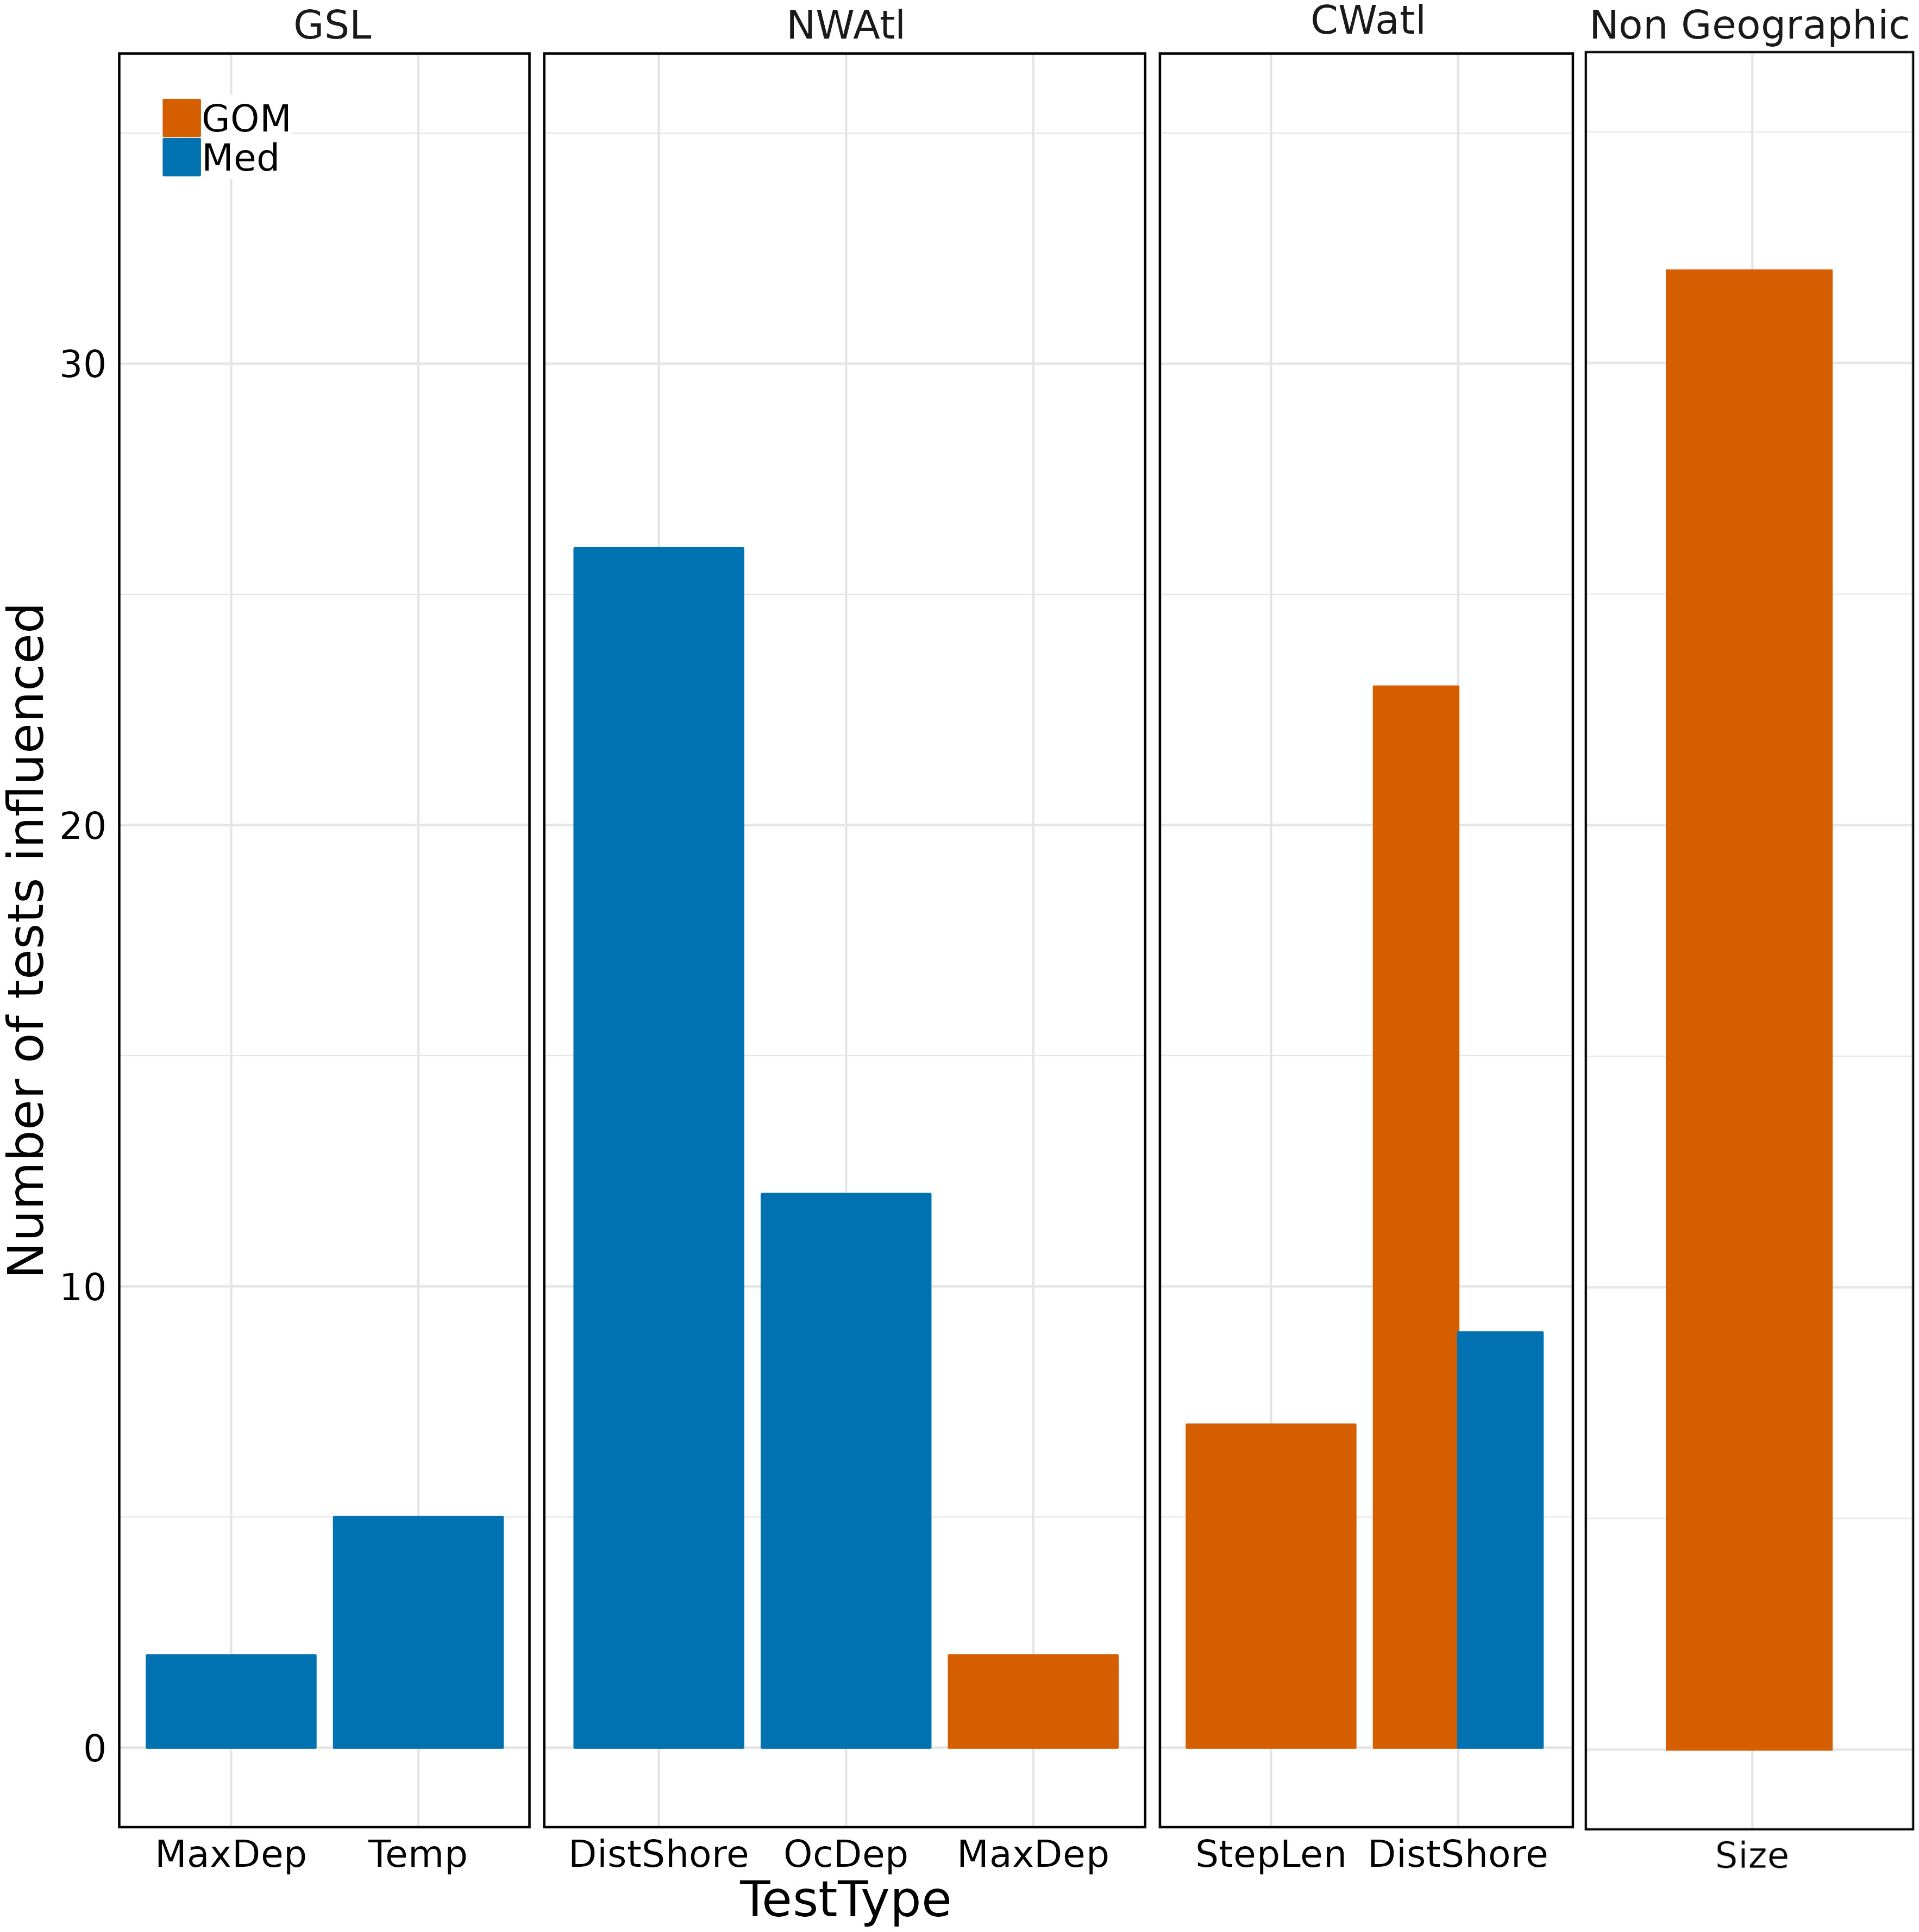
Figure 9 Number of assignments of ABT to group correctly (i.e. the test assigned the individual fish to the group it was finally assigned to after assessing all tests) influenced by test types in different geographical regions, plus size (length > 250 cm). GOM orange, Med blue. Test types influencing zero tests per region are omitted.
3.3 Feeding within the Gulf of St Lawrence
GOM and Med-assigned ABT have behavioural and oceanographic distinctions in the GSL. Tagging positional data demonstrate that GOM ABT have a mean date of arrival of August 27th, and leave by mid-November (Figure 8). Med ABT also have a mean date of arrival of August 27th and leave more gradually, ending late November. Within the GSL there is a strong spatial partitioning: GOM-assigned ABT remain on the shelf and Med ABT are further from the shore (SM 1 Figure 92; Distance To Shore T-test p<0.001). GOM ABT favour the southern shelf around Cape Breton Island, with occasional forays into the mouth of the St Lawrence River to the west. Med ABT inhabit the central and northern bight, avoiding the inshore shelf waters with shallower depths (Figure 1). Med ABT are in much deeper waters (Figure 10C; Ocean Depth T-test p<0.001), typically around 450m, while GOM ABT are in shallower depths, <75m. Both groups’ daily Mean Depths are around 11m (SM 1 Figure 80), but Med ABT have Maximum Depths in excess of 90m over four times more frequently (Figures 10A, B; T-test p<0.001). The most commonly experienced daily Minimum Temperature is 4°C by GOM ABT, versus 0°C for Med ABT, and Med ABT experience sub-zero water temperatures when diving much more frequently (Figure 10D; T-test p<0.001).
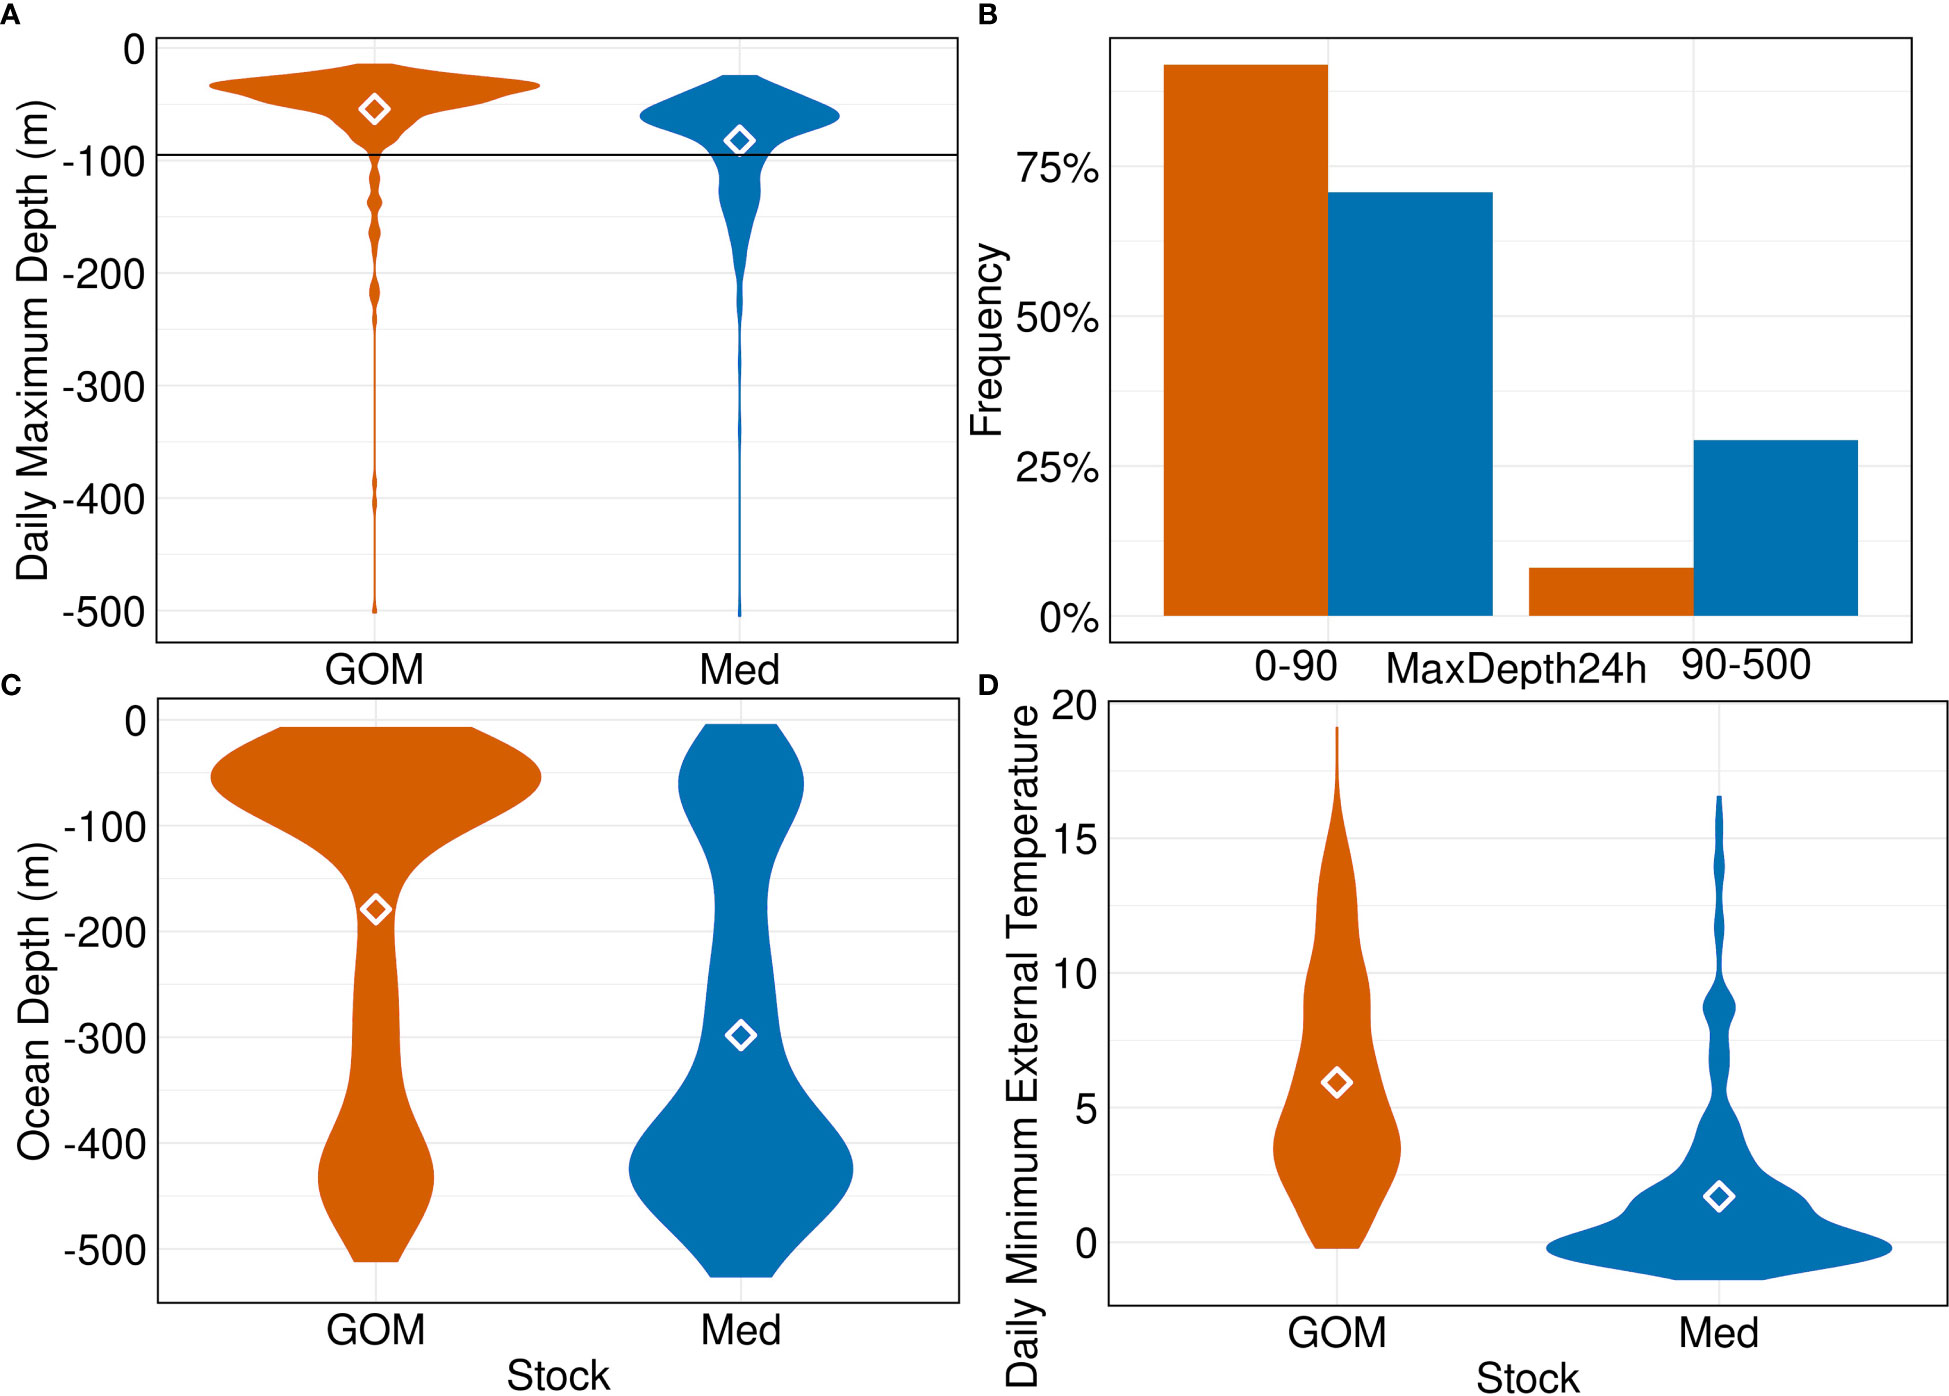
Figure 10 GSL region variables by group. (A) Daily maximum depth (m), with 90m breakpoint denoted. (B) Frequency histograms of the proportions of GOM and Med groups above and below 90m, with totals summing to 100% per group. (C) Daily Ocean Depth (m). (D) Daily minimum external temperature (°C).
The above discrepancies were converted into tests for the probabilistic assignment approach, with minimum and mean external temperatures of 0 and 9°C respectively only seen for Med fish, and maximum depth greater than 90m seen ~5X more for Med fish than GOM. GSL-specific tests constituted 13% of tests that positively contributed to ABT assignments; 25% of GOM assignments, 3% of Med. Temperature and Maximum Depth tests were the main contributors to ABT assignments (Figure 9).
3.4 Central-West Atlantic
In the Central-WAtl both GOM- and Med-assigned ABT overlap in the Hotspot in winter and spring, but otherwise partition due to different migration patterns. ABT move south into the Central-WAtl between November and February (Figures 8, SM 1 Figures 42:53). The spatial overlap between the two groups is highest at the shelf break and slope waters off North Carolina, where high usage by GOM and Med ABT occurs within the relatively small area of the Hotspot (Figure 2). Med ABT not venturing to the mid-Atlantic congregate in this area from December to May, making them more numerous than the spawning-ground-bound GOM ABT, which are passing through around November/December and again in May/June. This is roughly the southernmost extent of Med ABT presence in the West Atlantic, with few Med ABT south of 30°N. GOM ABT take direct paths between the North-WAtl and their spawning grounds, going further offshore than south-migrating coastal Med ABT. However Med ABT have a greater average Distance To Shore due to the few Med ABT travelling far into the mid-Atlantic; T-test p<0.001; Figures 3, 5, 6). Multiple Med tracks are heading due east towards their East Atlantic spawning grounds (See also Figure 11); this is distinct from GOM ABT, which are rarely east of 60°W. 30°N and 60°W therefore represent spatial thresholds which could assist in the probabilistic assignment of ABT to groups.
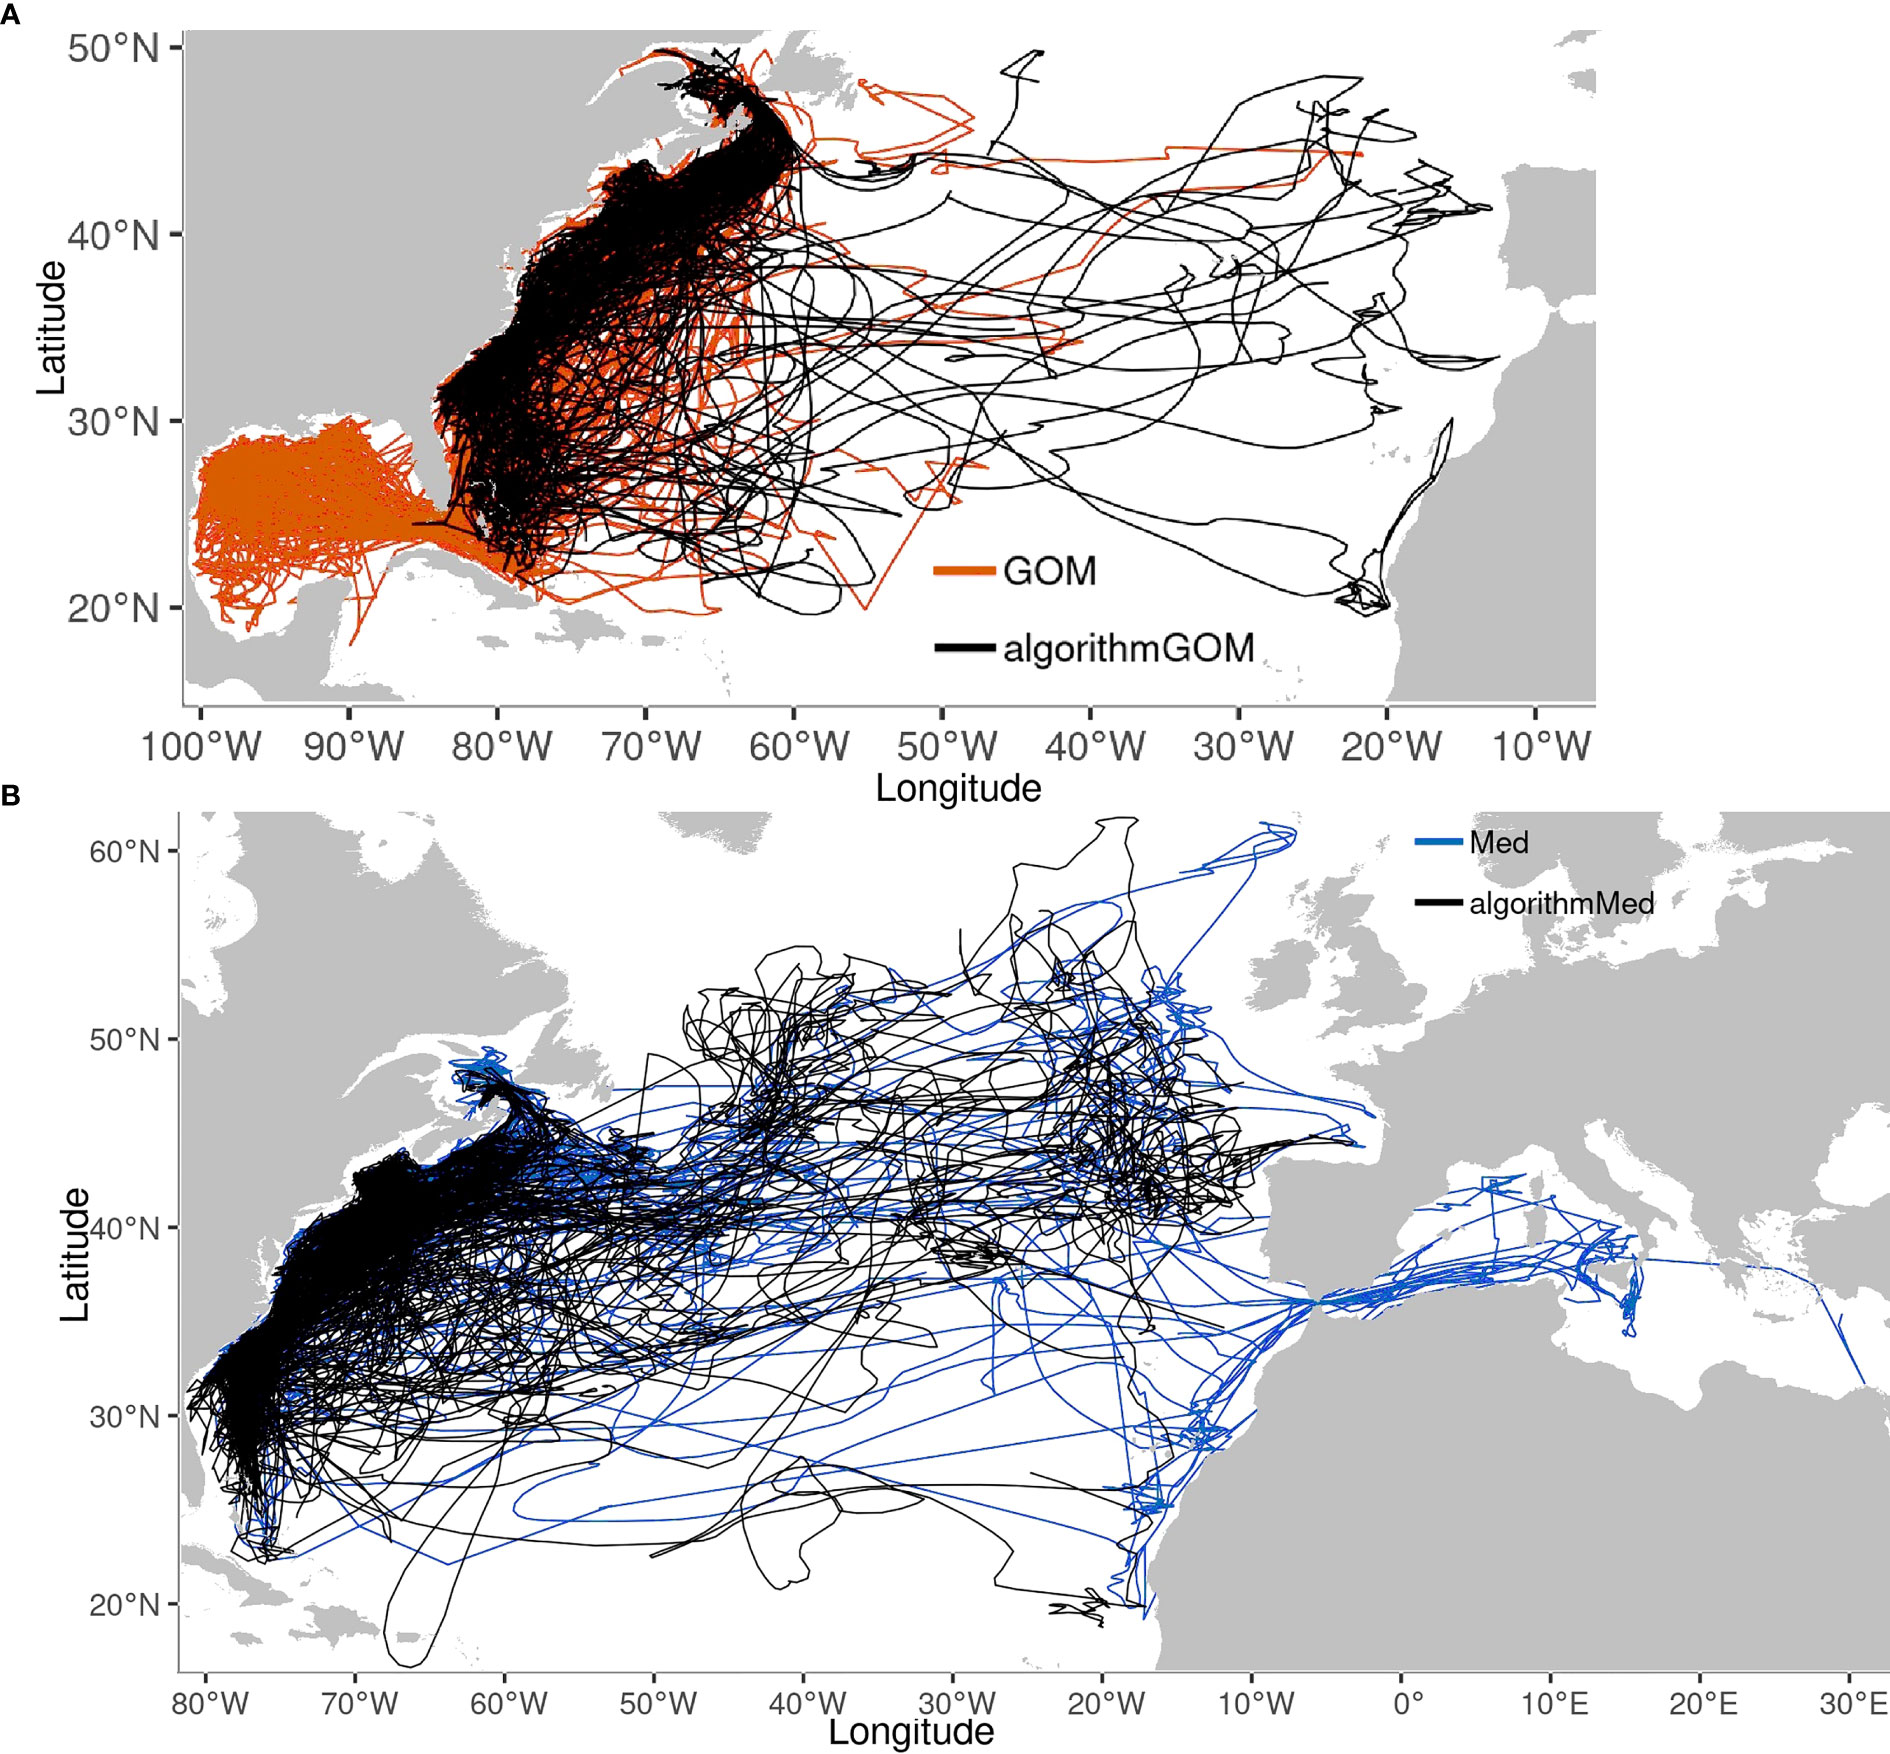
Figure 11 Tracks of group-assigned fish overlaid with their algorithmically-assigned counterparts. (A) GOM (orange). (B) Med (Blue). N= 76 GOM, 71 aGOM, 42 Med, 119 aMed.
GOM ABT are travelling through the open ocean foraging, in deeper water - they have a group mean depth between 50 and 100m, but many individuals have daily mean depths between 200 and 400m Figure 7B). while Med ABT are clustered around the shelf, feeding in the shallows (mean depth 25-30m; Figure 7B). GOM ABT in the Central-WAtl are in greater Ocean Depths and have higher Maximum Depths on average (SM 1 Figures 124, 111; both T-tests p<0.001), because Med ABT are clustered on the Carolinas shelf, and GOM ABT take direct routes straight to and from the spawning grounds (Figure 6A). Subsequently GOM ABT spend much more of their day scanning a large depth range (Daily Hours <=50m Depth Range T-test p<0.001). GOM ABT are in warmer water on average (SM 1 Figures 5A, F; External Temperature T-test p<0.001) but are further south (Latitude T-test p<0.001). Med ABT spend more time in -35cm eddies (hot and salty) and are in >75 cm/s speed eddies (fast) over twice as often (SM 1 Figures 119-122); these will facilitate access to mesopelagic feeding. Med ABT remain in a narrower daily range of depths (Daily Hours <=50m Depth Range T-tests p<0.001 for all regions), possibly due to their more restricted Latitude range within this region, and therefore restricted External Temperature range (SM 1 Figures 7C–F). See also SM 1 Figures 110:125. Hotspot trends match the wider Central-WAtl (Figures 7B, D, 2), with Med ABT swimming shallow (SM 1 Figure 126) and in slightly cooler water (SM 1 Figure 7C, F), GOM deeper, further offshore, and slightly warmer (SM 1 Figure 128). See also SM 1 Figures 126:140.
For the PA tests, GOM ABT were more frequently south of 30°N, travelling long distances per day, staying near the surface, and >500km offshore in June, November, and December. In contrast, Med ABT were more frequently >1600km from shore. Central-WAtl-specific tests constituted 25% of tests that positively contributed to ABT assignments; 41% of GOM assignments, 12% of Med. Distance to Shore and Step Length tests were the main contributors to ABT assignments (Figure 9).
3.5 Spawning grounds
ABT travel quickly, on straight paths, and in deep water, to enter their respective spawning grounds, via the Florida Keys or the Strait of Gibraltar. They are in spawning areas at different times – GOM from December to June, Med from May to July, and both associate with slope regions as shown previously for ABT in the GOM (Hazen et al., 2016). GOM ABT experience warmer conditions but buffer this with behavioural thermoregulation (deeper diving during the day); Med ABT are in cooler, more stratified waters. The GOM-assigned ABT then return to the North-WAtl, moving faster northwards than they did when moving toward the spawning grounds southwards. See the SM 1 Spawning Grounds Results section, and SM 1 Figures 141:185, for more.
3.6 Probabilistic assignment
To assign ABT of unknown spatial assignment to a group, each track was assessed against 26 statistically significant differences observed between GOM- and Med-assigned ABT for movements and behaviours (SM 1 Table 3). This approach performed well, assigning most unknown-group ABT to a group. After parameterizing the rule set on known-group ABT, we tested it against those same fish, to evaluate its performance (a leave-one-out approach was used so each individual fish was not included in the group means the fish was tested against). 115 of the 118 already-classified fish were correctly assigned to their group (97%), with fish qualifying for a mean 3.6 of the 26 tests. Having established that the tests could successfully distinguish known-group individuals, we applied the procedure to the 290 unassigned fish. 71 were classified as GOM (24%), 119 as Med (41%), and 100 remained unclassified (34%) by failing to pass a single test. ABT qualified for a mean 1.8 tests – 2.9 for GOM, 2.13 for Med, and 0.6 for unassigned.
Size (>250 cm) was the test which correctly contributed to the greatest number of ABT assignments, all GOM, substantiating the hypothesis in the test’s creation that once large Med fish have returned to the Med to spawn, those remaining should all be GOM (Figure 9). In the GSL specifically, Maximum Depth and Temperature positively contributed to assignments for Med fish, while in the North-West Atlantic, Distance to Shore and Ocean Depth were most influential, again for Med fish. Distance to Shore and Step length were most influential in the Central-West Atlantic, this time for GOM ABT.
Algorithmically-assigned fish tracks (hereafter aGOM, aMed) were generally like their known-group counterparts, with some exceptions (Figure 11). Several aGOM ABT go east of 55°W, unusual for GOM ABT but similar to known Med tracks. Similarly, some aMed tracks visit the Caribbean, a region more typically associated with GOM group individuals. Most low-scoring tracks remain near to shore, in the common space inhabited by both groups (SM 1 Figure 188). Both the aGOM tracks reaching the East Atlantic, and the aMed tracks visiting the Caribbean, passed four to eleven tests, confirming that these classifications are driven by multiple test results.
4 Discussion
4.1 Overview
In analysing the data from over 23 years of tagging of ABT in the West Atlantic, we have found numerous differences between the movements, behaviours and migration timings of the two defined groups, the western-origin Gulf of Mexico group, and the eastern-origin Mediterranean group. Med ABT – tagged smaller and younger than GOM ABT – migrate a shorter distance along the US Eastern Seaboard, generally between 30 and 45°N, further from shore, deeper when in the GSL . When outside the GSL they occupy colder waters, and are often shallower than the GOM ABT. The older, larger, GOM ABT employ a ‘high effort, high reward’ approach, undertaking long migrations between spawning in the warm, lower-quality-prey GOM, then rapidly migrating to the northern extent of their range for the high-reward feeding grounds of the GSL and Scotian shelves. In the North-WAtl including the GSL, Med ABT spend more of the day scanning a greater depth range of deeper ocean areas; in the Central-WAtl and spawning grounds the reverse is true, with GOM ABT behaving this way. GOM ABT travel straighter through the Central-WAtl, which constitutes most of the shared area, travelling rapidly from their spawning ground to the North-WAtl, but taking a longer time to return. In doing so they cohabit a Central-WAtl area called the Hotspot with the Med ABT, but even then, subtle environmental preferences are revealed. Multi-year track data suggest that once Med group individuals reach maturity and begin spawning, they increasingly remain in the East Atlantic post-spawning rather than returning. Consequently, West Atlantic Med individuals are relatively young compared to the GOM group. See the Caveats section and SM 1, SM 2 for further discussion on the age disparity.
Throughout the year, both groups follow the same general pattern of migration – moving north into the North-WAtl from late summer to early winter, then migrating back south along the shelf. While they broadly overlap for much of this time, there are many examples of spatial partitioning within regions.
Some of these have been used as tests in our probabilistic assignment approach for assigning fish to groups, alongside other discovered discrepancies in mean and minimum external temperature, depth range and maxima, and experienced ocean/bathymetric parameters like ocean depth and distance from shore. The approach was successful, demonstrating high accuracy, and thus showing promise for future applications.
High spatial overlap in certain small areas indicates mutually agreeable habitat that may host inter-group breeding, and/or be preferred habitats for hybrid ABT. The Central-WAtl Hotspot is the prime example, but much of the shelf-break region between North Carolina and the Gulf of Maine is shared by a wide age range of both groups’ fish.
4.1.1 GSL
GOM ABT forage in the shallows, often close to shore or in bays, Med ABT forage in deeper water. Both groups’ arrivals coincide with the presence of calorie-rich mackerel (Scomber scombrus) and herring (Clupea harengus) prey (Stokesbury et al., 2011; Pleizier et al., 2012; Wilson et al., 2015), but while GOM ABT hunt these species in the warm shallows of the shelf waters around Cape Breton and Prince Edward Islands, Med ABT remain in the central GSL channel and northern bight, frequently diving to 200m and beyond, likely foraging for squid and other mesopelagic and demersal species (Pinkas et al., 1971; Chase, 2002) in waters down to 0°C and below. ABT often have access to calorific forage fish when in the GSL but will consume mesopelagic fish and cephalopods. In the GSL, our data suggest ABT are partitioning by group.
4.1.2 North-West Atlantic
Both groups exit the GSL/North-WAtl in October/November as temperatures drop. Since conditions in the GOM are suboptimal for breeding at this time (Dicenta and Piccinetti, 1980; Richards, 1990; Cort and Liourzu, 1991), GOM ABT can migrate slower and feed on the North-WAtl shelf, or, if they leave the North-WAtl late, can be direct and include mesopelagic feeding. As they travel south past Cape Hatteras, they are swimming against the powerful Gulf Stream, impeding their progress. Many western-tagged Med ABT do not travel to the Med during the lifespan of their tag data (typically <1-3 years; often due to tag memory filling or battery limitations assignment was made by eventual location of capture or tag retrieval as detailed above), and thus have a much shorter migration from the Gulf of Maine to North Carolina. Many Med ABT make distant offshore excursions, while others congregate along the 200m isobath from the southern half of the Gulf of Maine to the New York/New Jersey Bight. Near shore, the groups spatially partition despite a shared preference for feeding on the slope, with GOM ABT found to the north and east of the Gulf of Maine, Med ABT to the south and west.
Pertaining to the PA tests, GOM ABT were larger and explored a wide depth range more frequently, while Med ABT were further offshore, especially in winter months. Fishing offshore, or in the southern half of the Gulf of Maine shelf break (see Figure 1), could preferentially target Med ABT, but such proposals require evaluation in context of existing management frameworks and fishing fleet regimes, which may reveal the proposals are untenable.
4.1.3 Central-West Atlantic
Timing and routes of GOM spawning migration means the groups are apart for much of the year in this region, with Med ABT on the shelf-edge or far offshore. The Central-WAtl demonstrates the biggest divergence in behaviour between the two groups, with GOM ABT travelling fast and relatively straight north through the area when returning to the North-WAtl from May to August and spending more time further offshore around 30°N when travelling south to the spawning grounds. During these offshore migrations, GOM ABT demonstrate deep-scanning vertical movements, perhaps feeding on the available mesopelagic cephalopods and fish (Pinkas et al., 1971; Karakulak et al., 2009), aided by the Gulf Stream (Braun et al., 2019). In contrast, Med ABT remain in the northern part of the area, only minimally venturing south of 32°N.
Between November and April, both groups inhabit the shelf break off North Carolina, with Med ABT in ~500m shallower water, diving less, and not as deep. Despite this, Med ABT are more commonly found in 8-12°C waters than GOM ABT, again suggesting that Med ABT have a colder niche. The abundance of both groups in this relatively small area provides additional evidence of the importance of this Hotspot to ABT (Block et al., 2005; Butler, 2007; Rooker et al., 2008; Walli et al., 2009).
Med ABT could be selectively caught on the shelf in the Central-WAtl Hotspot south of Cape Hatteras from December to March while GOM ABT are typically still on their spawning grounds, though again this would require substantial spatial and temporal quota allocations. Med ABT are also notably more abundant across the Hotspot in April, albeit further offshore, as they head north before the GOM ABT pass through.
4.1.4 Returning north
Both groups head north quickly, but GOM ABT travel further and faster, and at different times. After their time spent in the Central-WAtl or GOM, both groups quickly head to the North-WAtl aided by the Gulf Stream, which can advect objects from southern Florida to the Central-WAtl within 20 days (Kazimir, 1969). Large fish such as ABT can use this to speed up their migration, and access mesopelagic prey.
GOM ABT travel the width of the GOM and the length of the North American eastern seaboard to reach the GSL, to regain body condition by feeding on lipid-rich prey. The timing of this long-distance, high-speed migration is enforced by the worsening physiological constraints of the GOM as summer temperatures increase (Blank et al., 2004). By contrast, western Med ABT travel a shorter distance from around 35°N to around 43°N, generally stopping before the GSL. The discrepancy in starting position and migration distance means the groups’ migrations are asynchronous, giving scope for fishers to target different groups’ fish based on the time of year and location, as discussed above.
Med ABT often take wide arcing offshore paths from North Carolina up to the North-WAtl between February and June, a difference which is incorporated within the Probabilistic Assignment rule tests.
4.2 Probabilistic assignment
The probabilistic assignment approach worked well and has notable implications for fisheries management modelling. Classification performance against already-classified fish was excellent (97% success rate), and unassigned fish classified with this approach comprise 190 individuals and 32,045 fishdays, more than doubling the existing dataset. GOM and Med ABT qualified for fewer than 3 tests on average, which intuitively seems concerning, but is to be expected given tests were tailored on behaviours that are uncommon for one group, but extremely uncommon for the other. If reliable, this PA technique would confer sizeable benefits to the various fields which use these data, such as mixing models for group management, spatial habitat use and its connection to dynamic environmental drivers, and behavioural analysis, especially spawning behaviour (potential circularity notwithstanding). One of the main limitations on the utility of tagging data is accurate group assignment which is dependent upon the tagged individual visiting a known spawning ground, though the development of genetic group identification through close-kin mark-recapture appears close to fruition.
Outside of size (ABT length > 250 cm), the prevalence of Distance to Shore, Ocean Depth, and Step Length tests positively contributing to group assignment of ABT in the PA process shows the tests successfully discriminate the different migratory styles taken by GOM and Med ABT. Each test proved useful in different locations.
The classification of unassigned fish did result in some questionable outcomes, but the process can be refined, and the unexpected outcomes might be realistic. Notable unexpected tracks are the GOM ABT crossing to the East Atlantic and the West African coast, and Med ABT around the Bahamas and Puerto Rico. Although 2D track maps are only part of the story and do not include other behaviours, we know that location is important for establishing spawning grounds, group boundaries, and effective management.
Firstly, the current approach weighs each test equally, but more exhaustive evaluation and expert judgement might disagree. Weighting values could be applied, updating the testing process with the knowledge gleaned from past decades of tuna science, especially the disciplines of tracking and physiology.
Secondly, this may not inherently be a problem at all. We already have examples of uncommon tracks from known-group ABT (Med ABT near the Caribbean, GOM ABT close to Spain). Their range expands as they age (Mather et al., 1995), and we preferentially tag fish over a certain size and therefore age. Given a mean track duration of under a year, these conditions limit our knowledge of the tracks of pre-spawning-age ABT, and hence the full extent of their spatial range across their lifetimes. Thus atypical tracks for young unassigned ABT may not be as atypical as we first think. Gathering any additional data on these subjects would be useful for group management. Additionally, given that the timing and location of spawning and feeding hinges on environmental variation (Stokesbury et al., 2011; Pleizier et al., 2012; Wilson et al., 2015; Medina, 2020), climatic fluctuations might also allow expansive excursions away from expected tracks and habitat centres in some years (Druon et al., 2016), potentially driven by the temperature-mediated movements of their prey.
The impact of genetic mixing of GOM and Med ABT on the results and viability of the probabilistic assignment approach is not known, however we anticipate the following plausible scenarios:
Either: mixed fish behave like a blend between GOM and Med ABT, and would be expected to predominantly remain unclassified due to failing to meet the deliberately high threshold criteria set for the tests. Or: mixed fish behave like either GOM or Med ABT, and are incorrectly assigned as such. This may confound any analyses using the whole GOM/Med dataset plus these ABT, however any effect is anticipated to be small, as the proportion of mixed-group ABT will inevitably be small, given the small magnitude of the Slope Sea (Richardson et al. 2016) and other mixing grounds compared to the GOM and Med (Aalto et al. 2023).
Finally, the purpose of the probabilistic assignment was to demonstrate the feasibility of such an approach, taking the first steps in a process that would require a greater level of development to realise a defensible management proposal.
4.3 Caveats
This approach has shown promise as an independent means of delineating groups, but would likely be most valuable when combined with alternative approaches such as otolith trace elements (Rooker et al., 2003), otolith stable isotopes (Schloesser et al., 2010; Rooker et al., 2014; Hanke et al., 2016), otolith shape (Brophy et al., 2016), and genetics (Puncher et al., 2018; Puncher et al., 2022). This approach may also provide insights into the Slope Sea spawning aggregation of ABT [e.g., Richardson et al. (2016; Rypina et al., 2019)].
We limited this study to the GOM and Med groups for management relevance and data richness, but our growing database of Slope Sea ABT tracks (Aalto et al. 2023) could be used as their own group, with their own testing criteria, to examine whether this approach can successfully delineate differential behaviours for mixed-group ABT, and be easily upgraded to compare three or more groups.
GOM ABT are larger than Med ABT in our database (SM 1 Figure 1), due to tagging location and the ontogenetic movements of Med ABT. To test whether the size difference affected behavioural differentiation, we reran the analyses on a subset of same-size individuals and found that group identity, not just size, is key to an individual’s behaviour (SM 2, 200-250cm Subset Comparison). These analyses did reveal some size-dependent behavioral differences. Larger Med ABT individuals were more commonly off Europe and in the Med in spring and summer, while small GOM ABT were more commonly off North Carolina in winter and spring, rather than in the GOM. In the GSL, while Med ABT generally reside in the central channel, larger individuals travel slower and come into the shallows like GOM ABT. In the North-WAtl, larger Med ABT are further offshore, travelling further per day, in deeper water, aligning to their trips to the East Atlantic. In the Central-WAtl larger Med ABT are near the surface more often, diving less, in warmer waters, and again further offshore; in the Hotspot they’re on the shelf more. Overall, larger Med ABT visit the East Atlantic more, but also act slightly more like GOM ABT when in North American waters. Given that these differences were small in comparison to the group-based behavioural differences described in the primary analysis, we do not anticipate that the size difference between the groups qualitatively affected our results.
ABT tagging effort was not uniformly distributed across the range of years, nor were equal numbers of GOM and Med ABT tagged per year, though the number of fishdays per year somewhat addresses this imbalance, as Med fish kept their tags longer than GOM, on average. Additionally, there is a known level of spatial error associated with the fish locations, but this is not anticipated to undermine the results. See SM 1, Additional Discussion, Caveats, and SM 2, 200-250cm Subset Comparison, for a full description of these topics.
5 Conclusion
The probabilistic assignment demonstrated the feasibility of this methodology, providing more information about track assignments without genetic analyses. The model performance scores were high, and the tracks of newly-assigned ABT appear reasonable; deeper exploration of these tracks, including comparing them to their already-labelled counterparts, may reveal new insights into diversity of movement, life history changes, and hidden sampling biases. This approach uses relative frequencies of behaviours, which are simple to generate following thorough exploration of the data, and this method could therefore be applied in a variety of similar situations, potentially allowing for discriminant targeting for fisheries or management protection. Incorporating genetic assignment, and characterising Slope Sea ABT, are logical next steps.
From the data exploration stage, we have characterised the behavioural differences of the two accepted ABT groups. Despite generally similar habitat use, we found notable differentiation in key areas, and differences in depth/hunting strategy in the GSL, and migration and depth use patterns.
This study demonstrates the value that long time-series electronic tagging studies can provide for elucidating behavioural traits of species, among groups and across life histories, and how knowledge of those behavioural differences can be translated into greater data availability for fisheries management.
Data availability statement
The datasets presented in this study can be found in online repositories. The names of the repository/repositories and accession number(s) can be found below: Data are made available to ICCAT following a delay. Requests to access these datasets should be directed toYmJsb2NrQHN0YW5mb3JkLmVkdQ==.
Ethics statement
The animal study was reviewed and approved by Stanford University Administrative Panel on Laboratory Care in accordance with IACUC; Acadia Animal Care Committee protocol #18-11; Permits issued by Fisheries and Oceans Canada license # SG-RHQ-18-159A.
Author contributions
Conceptualization, Ideas, Writing - Review & Editing: SD, EA, BB. Methodology, Formal analysis: SD, EA. Software, Visualization: SD, EA, MC. Investigation: SD, MS, RS, MC, BB. Data acquisition: RS, BB, MS. Resources, Supervision, Project administration, Funding acquisition: BB, MS. Data Curation: MC, SD. Writing - Original Draft: SD. All authors contributed to the article and approved the submitted version.
Funding
This research was funded by the NOAA Bluefin Tuna Research Program grants NA19NMF4720095 and NA20NMF4720043, TAG-A-Giant Fund of The Ocean Foundation, Stanford University, and an NSERC Discovery Grant to MJWS. MJWS was supported by the Canada Research Chairs Program.
Acknowledgments
GSL bluefin were tagged under a Fisheries and Ocean Scientific License to Fish #SG-RHQ-19–120 and Acadia Animal Care Protocol # 12–16R#3. The authors thank the fishers of Morehead City and Cape Hatteras North Carolina, for supporting the TAG A Giant Campaign, particularly Captains Dale Britt, Gary Stuve, the late Captain John Jenkins and in Port Hood Canada, Captain Dennis Cameron, Lloyd McInnis, the late Captain Steve McInnis, and Captain Bernie and Kenny Chisolm for their dedication and fishing effort on behalf of the research program. The authors also thank sponsors of tags and postdocs, students, and technicians who helped electronically tag Atlantic bluefin tuna the past 25 years. We are grateful for the assistance in: internal review by Dr Samantha Andrzejaczek and Chloe Mikles; data collection and processing by Ted Reimer, Dr Samantha Andrzejaczek, Perry Comolli; data processing and systems management by James Ganong and Alan Swithenbank. The authors would also like to thank Peter J. Auster and Walter Golet, whose comments helped shape and improve an earlier version of this manuscript significantly.
Conflict of interest
The authors declare that the research was conducted in the absence of any commercial or financial relationships that could be construed as a potential conflict of interest.
Publisher’s note
All claims expressed in this article are solely those of the authors and do not necessarily represent those of their affiliated organizations, or those of the publisher, the editors and the reviewers. Any product that may be evaluated in this article, or claim that may be made by its manufacturer, is not guaranteed or endorsed by the publisher.
Supplementary material
The Supplementary Material for this article can be found online at: https://www.frontiersin.org/articles/10.3389/fmars.2023.1165910/full#supplementary-material
SM 1 | Data sources, additional analyses, and complete plot output sets for all variables in all locations, for 2D barplot maps and violin plots, as well as Probabilistic Assignment results tables and additional outputs.
SM 2 | Repeat analyses using only 200-250 cm fish, compares to the same analyses in the manuscript and Supplementary Document 1, and reveals there are few differences in the general patterns found, substantiating the claim that group identity is more important than size, in determining individual fish behaviour. A compilation of notes on the comparisons is at the bottom.
Footnotes
References
Aalto E. A., Dedman S., Stokesbury Michael J. W., Schallert R. J., Castleton M., Block B. A. (2023). Evidence of bluefin tuna (Thunnus thynnus) spawning in the slope waters of the Northwest Atlantic. ICES Journal of Marine Science 1–17. doi: 10.1093/icesjms/fsad015
Aalto E. A., Ferretti F., Lauretta M. V., Walter J. F., Stokesbury M. J. W., Schallert R. J., et al. (2021). Stock-of-origin catch estimation of Atlantic bluefin tuna (Thunnus thynnus) based on observed spatial distributions. Can. J. Fisheries Aquat. Sci. 78, 1193–1204. doi: 10.1139/cjfas-2019-0445
Abascal F. J., Medina A., de la Serna J. M., Godoy D., Aranda G. (2016). Tracking bluefin tuna reproductive migration into the Mediterranean Sea with electronic pop-up satellite archival tags using two tagging procedures. Fisheries Oceanography 25, 54–66. doi: 10.1111/fog.12134
Arregui I., Galuardi B., Goñi N., Lam C. H., Fraile I., Santiago J., et al. (2018). Movements and geographic distribution of juvenile bluefin tuna in the northeast Atlantic, described through internal and satellite archival tags. ICES J. Mar. Sci. 75, 1560–1572. doi: 10.1093/icesjms/fsy056
Bestley S., Patterson T. A., Hindell M. A., Gunn J. S. (2008). Feeding ecology of wild migratory tunas revealed by archival tag records of visceral warming. J. Anim. Ecol. 77, 1223–1233. doi: 10.1111/j.1365-2656.2008.01437.x
Bivand R., Lewin-Koh N. J. (2021) Maptools: tools for reading and handling spatial objects, r package version 1.1-1. Available at: http://cran.r-project.org/package=maptools.
Blank J. M., Morrissette J. M., Landeira-Fernandez A. M., Blackwell S. B., Williams T. D., Block B. A. (2004). In situ Cardiac performance of pacific bluefin tuna hearts in response to acute temperature change. J. Exp. Biol. 207, 881–890. doi: 10.1242/jeb.00820
Block B. A., Dewar H., Blackwell S. B., Williams T. D., Prince E. D., Farwell C. J., et al. (2001). Migratory movements, depth preferences, and thermal biology of Atlantic bluefin tuna. Science 293, 1310–1314. doi: 10.1126/science.1061197
Block B. A., Dewar H., Farwell C., Prince E. D. (1998a). A new satellite technology for tracking the movements of Atlantic bluefin tuna. Proc. Natl. Acad. Sci. U.S.A. 95, 9384–9389. doi: 10.1073/pnas.95.16.9384
Block B. A., Dewar H., Williams T., Prince E. D, Charles Farwell and Doug Fudge. (1998b). Archival tagging of Atlantic bluefin tuna (Thunnus thynnus thynnus). Mar. Technol. Society. Mar. Technol. Soc. J. 32, 37.
Block B. A., Jonsen I. D., Jorgensen S. J., Winship A. J., Shaffer S. A., Bograd S. J., et al. (2011). Tracking apex marine predator movements in a dynamic ocean. Nature 475, 86–90. doi: 10.1038/nature10082
Block B. A., Teo S. L., Walli A., Boustany A., Stokesbury M. J. W., Farwell C. J., et al. (2005). Electronic tagging and population structure of Atlantic bluefin tuna. Nature 434, 1121. doi: 10.1038/nature03463
Block B. A., Whitlock R., Schallert R. J., Wilson S., Stokesbury M. J. W., Castleton M., et al. (2019). Estimating natural mortality of Atlantic bluefin tuna using acoustic telemetry. Sci. Rep. 9, 4918. doi: 10.1038/s41598-019-40065-z
Boustany A. M., Matteson R., Castleton M., Farwell C., Block B. A. (2010). Movements of pacific bluefin tuna (Thunnus orientalis) in the Eastern north pacific revealed with archival tags. Prog. Oceanography 86, 94–104. doi: 10.1016/j.pocean.2010.04.015
Boustany A. M., Reeb C. A., Block B. A. (2008). Mitochondrial DNA and electronic tracking reveal population structure of Atlantic bluefin tuna (Thunnus thynnus). Mar. Biol. 156, 13–24. doi: 10.1007/s00227-008-1058-0
Braun C. D., Gaube P., Sinclair-Taylor T. H., Skomal G. B., Thorrold S. R. (2019). Mesoscale eddies release pelagic sharks from thermal constraints to foraging in the ocean twilight zone. Proceedings of the National Academy of Sciences 116 (35), 17187–17192. doi: 10.1073/pnas.1903067116
Brophy D., Haynes P., Arrizabalaga H., Fraile I., Fromentin J. M., Garibaldi F., et al. (2016). Otolith shape variation provides a marker of stock origin for north Atlantic bluefin tuna (Thunnus thynnus). Mar. Freshw. Res. 67, 1023–1036. doi: 10.1071/MF15086
Brophy D., Rodríguez-Ezpeleta N., Fraile I., Arrizabalaga H. (2020). Combining genetic markers with stable isotopes in otoliths reveals complexity in the stock structure of Atlantic bluefin tuna (Thunnus thynnus). Sci. Rep. 10, 1–17. doi: 10.1038/s41598-020-71355-6
Butler C. M. (2007). Atlantic Bluefin tuna (Thunnus thynnus) feeding ecology and potential ecosystem effects during winter in North Carolina. masters thesis. North Carolina State University. Raleigh, NC, USA
Carlsson J., McDowell J. R., Carlsson J. E., Graves J. E. (2007). Genetic identity of YOY bluefin tuna from the eastern and western Atlantic spawning areas. J. Heredity 98, 23–28. doi: 10.1093/jhered/esl046
Carlsson J., McDowell J. R., Díaz-Jaimes P., Carlsson J. E., Boles S. B., Gold J. R., et al. (2004). Microsatellite and mitochondrial DNA analyses of Atlantic bluefin tuna (Thunnus thynnus thynnus) population structure in the Mediterranean Sea. Mol. Ecol. 13, 3345–3356. doi: 10.1111/j.1365-294X.2004.02336.x
Carruthers T., Kimoto A., Powers J. E., Kell L., Butterworth D. S., Lauretta M. V., et al. (2016). Structure and estimation framework for Atlantic bluefin tuna operating models. Collect. Vol. Sci. Pap. ICCAT 72, 1782–1795.
Cermeño P., Quílez-Badia G., Ospina-Alvarez A., Sainz-Trápaga S., Boustany A. M., Seitz A. C., et al. (2015). Electronic tagging of Atlantic bluefin tuna (Thunnus thynnus, l.) reveals habitat use and behaviors in the Mediterranean Sea. PloS One 10, e0116638. doi: 10.1371/journal.pone.0116638
Chapman E. W., Jørgensen C., Lutcavage M. E. (2011). Atlantic Bluefin tuna (Thunnus thynnus): a state-dependent energy allocation model for growth, maturation, and reproductive investment. Can. J. Fisheries Aquat. Sci. 68, 1934–1951. doi: 10.1139/F2011-109
Chase B. C. (2002). Differences in diet of Atlantic bluefin tuna (Thunnus thynnus) at five seasonal feeding grounds on the new England continental shelf. Fishery Bull. 100, 168–180.
Cort J., Liourzu B. (1991). Reproduction-Eastern Atlantic and Mediterranean. Ed. Clay D. (La Jolla, CA: IATTC).
Dicenta A., Piccinetti C. (1980). Comparison between the estimated reproductive stocks of bluefin tuna (Thunnus thynnus) of the gulf of Mexico and western Mediterranean. Recueil documents scientifiques IX (2), 442 448.
Druon J.-N., Fromentin J.-M., Hanke A. R., Arrizabalaga H., Damalas D., Tičina V., et al. (2016). Habitat suitability of the Atlantic bluefin tuna by size class: an ecological niche approach. Prog. Oceanography 142, 30–46. doi: 10.1016/j.pocean.2016.01.002
Fautin D., Dalton P., Incze L. S., Leong J.-A. C., Pautzke C., Rosenberg A., et al. (2010). An overview of marine biodiversity in united states waters. PloS One 5, e11914. doi: 10.1371/journal.pone.0011914
Fromentin J.-M. (2003). The East Atlantic and Mediterranean bluefin tuna stock management: uncertainties and alternatives. Scientia Marina 67, 51–62. doi: 10.3989/scimar.2003.67s151
Galuardi B., Lutcavage M. (2012). Dispersal routes and habitat utilization of juvenile Atlantic bluefin tuna, Thunnus thynnus, tracked with mini PSAT and archival tags. PloS One 7, e37829. doi: 10.1371/journal.pone.0037829
GEBCO Bathymetric Compilation Group (2019). The GEBCO 2019 grid - a continuous terrain model of the global oceans and land. British Oceanographic Data Centre, National Oceanography Centre, NERC, UK doi: 10.5285/836f016a-33be-6ddc-e053-6c86abc0788e
Hanke A., Busawon D., Rooker J., Secor D. (2016). Estimates of stock origin for bluefin tuna caught in western Atlantic fisheries from 1975 to 2013. ICCAT Collective Volume Sci. Papers 72, 1376–1393.
Hazen E. L., Abrahms B., Brodie S., Carroll G., Jacox M. G., Savoca M. S., et al. (2019). Marine top predators as climate and ecosystem sentinels. Front. Ecol. Environ. 17, 565–574. doi: 10.1002/fee.2125
Hazen E. L., Carlisle A. B., Wilson S. G., Ganong J. E., Castleton M. R., Schallert R. J., et al. (2016). Quantifying overlap between the deepwater horizon oil spill and predicted bluefin tuna spawning habitat in the gulf of Mexico. Sci. Rep. 6, 33824. doi: 10.1038/srep33824
Horton T., Block B. A., Drumm A., Hawkes L. A., Stokesbury M. J. W., Ó Maoiléidigh N., et al. (2020). Tracking Atlantic bluefin tuna from foraging grounds off the northwest coast of Ireland. ICES J. Mar. Sci. 77, 2066–2077. doi: 10.1093/icesjms/fsaa090
ICCAT (1982). Report of the standing committee on research and statistics (SCRS). ICCAT report for the biennial period 1980-81, part II, (1981). (Madrid, Spain: ICCAT)
ICCAT SCRS (2012). Report of the 2012 Atlantic bluefin tuna stock assessment session. Collect. Vol. Sci. Pap. ICCAT 69 (1), 1–198.
ICCAT (2015) Recommendation by ICCAT on the development of harvest control rules and of management strategy evaluation. Available at: https://www.iccat.int/documents/recs/compendiopdf-e/2015-07-e.pdf.
IHO (1953). Limits of oceans and seas. 3rd ed (Monte-Carlo: International Hydrographic Organization).
Johnstone C., Pérez M., Malca E., Quintanilla J. M., Gerard T., Lozano-Peral D., et al. (2021). Genetic connectivity between Atlantic bluefin tuna larvae spawned in the gulf of Mexico and in the Mediterranean Sea. PeerJ 9, e11568. doi: 10.7717/peerj.11568
Jonsen I., Basson M., Bestley S., Bravington M., Patterson T., Pedersen M. W., et al. (2013). State-space models for bio-loggers: a methodological road map. Deep Sea Res. Part II 88, 34–46. doi: 10.1016/j.dsr2.2012.07.008
Josse E., Bach P., Dagorn L. (1998). Simultaneous observations of tuna movements and their prey by sonic tracking and acoustic surveys. Hydrobiologia 371, 61–69. doi: 10.1023/A:1017065709190
Karakulak S., Oray I., Corriero A., Deflorio M., Santamaria N., Desantis S., et al. (2004). Evidence of a spawning area for the bluefin tuna (Thunnus thynnus l.) in the eastern Mediterranean. J. Appl. Ichthyology 20, 318–320. doi: 10.1111/j.1439-0426.2004.00561.x
Karakulak F., Salman A., Oray I. (2009). Diet composition of bluefin tuna (Thunnus thynnus l. 1758) in the Eastern Mediterranean Sea, Turkey. J. Appl. Ichthyology 25, 757–761. doi: 10.1111/j.1439-0426.2009.01298.x
Kazimir D. (1969). Gulf stream drift mission report, Ben franklin drift mission chronology. (Palm Beach, FL, USA: Grumman Aerospace Corporation, Ocean Systems Department)
Kolmogorov A. (1933). Sulla Determinazione empirica di una legge di distribuzione. Giornale dell’Istituto Italiano degli Attuari 4, 83–91.
Kurota H., McAllister M. K., Lawson G. L., Nogueira J. I., Teo S. L., Block B. A. (2009). A sequential Bayesian methodology to estimate movement and exploitation rates using electronic and conventional tag data: application to Atlantic bluefin tuna (Thunnus thynnus). Can. J. Fisheries Aquat. Sci. 66, 321–342. doi: 10.1139/F08-197
Lawson G. L., Castleton M. R., Block B. A. (2010). Movements and diving behavior of Atlantic bluefin tuna Thunnus thynnus in relation to water column structure in the northwestern Atlantic. Mar. Ecol. Prog. Ser. 400, 245–265. doi: 10.3354/meps08394
Lumley T., Diehr P., Emerson S., Chen L. (2002). The importance of the normality assumption in large public health data sets. Annu. Rev. Public Health 23, 151–169. doi: 10.1146/annurev.publhealth.23.100901.140546
Lutcavage M. E., Brill R. W., Skomal G. B., Chase B. C., Howey P. W. (1999). Results of pop-up satellite tagging of spawning size class fish in the gulf of Maine: do north Atlantic bluefin tuna spawn in the mid-Atlantic? Can. J. Fisheries Aquat. Sci. 56, 173–177. doi: 10.1139/f99-016
MarineRegions Gulf of Mexico (2020a). Available at: https://www.marineregions.org/gazetteer.php?p=details&id=4288.
MarineRegions Mediterranean Sea (2020b). Available at: https://www.marineregions.org/gazetteer.php?p=details&id=1905.
Mather F. J., Mason J. M., Jones A. C. (1995). Historical document: life history and fisheries of Atlantic bluefin tuna. (75 Virginia Beach Drive, Miami, FL 33149, USA: US Department of Commerce, NOAA, NMFS. SEFSC)
Medina A. (2020). Reproduction of Atlantic bluefin tuna. Fish Fisheries 21, 1109–1119. doi: 10.1111/faf.12489
Muhling B. A., Lamkin J. T., Quattro J. M., Smith R. H., Roberts M. A., Roffer M. A., et al. (2011). Collection of larval bluefin tuna (Thunnus thynnus) outside documented western Atlantic spawning grounds. Bull. Mar. Sci. 87, 687–694. doi: 10.5343/bms.2010.1101
NOAA NMFS (2006). Final consolidated Atlantic highly migratory species fishery management plan. US Department of Commerce, NOAA, NMFS. Highly Migratory Species Management Division, Office of Sustainable Fisheries, National Marine Fisheries Service, 1315 East-West Highway, Silver Spring, Maryland 20910, USA.
Pinkas L. M. S., Oliphant S., Iverson I. L. K. (1971). Food habits of albacore, bluefin tuna and bonito in California waters. Cail. Dep. Fish Game Fish. Bll 152, 105.
Pleizier N. K., Campana S. E., Schaller R., Wilson S. G., Block B. A. (2012). Atlantic Bluefin tuna (Thunnus thynnus) diet in the gulf of st. Lawrence and on the eastern scotian shelf. J. Northwest Atlantic Fishery Sci. 44, 67–76. doi: 10.2960/J.v44.m685
Puncher G. N., Cariani A., Maes G. E., Van Houdt J., Herten K., Cannas R., et al. (2018). Spatial dynamics and mixing of bluefin tuna in the Atlantic ocean and Mediterranean Sea revealed using next-generation sequencing. Mol. Ecol. Resour. 18, 620–638. doi: 10.1111/1755-0998.12764
Puncher G. N., Hanke A., Busawon D., Sylvester E., Golet W., Hamilton L. C., et al. (2022). Individual assignment of Atlantic bluefin tuna in the northwestern Atlantic ocean using single nucleotide polymorphisms reveals an increasing proportion of migrants from the eastern Atlantic ocean. Can. J. Fisheries Aquat. Sci. 79, 111–123. doi: 10.1139/cjfas-2020-0336
R Core Team (2020) R: a language and environment for statistical computing (Vienna, Austria: R Foundation for Statistical Computing). Available at: www.R-project.org (Accessed October 26, 2020).
Restrepo V. R., Diaz G. A., Walter J. F., Neilson J. D., Campana S. E., Secor D., et al. (2010). Updated estimate of the growth curve of western Atlantic bluefin tuna. Aquat. Living Resour. 23, 335–342. doi: 10.1051/alr/2011004
Richards W. (1990). Results of a review of the US bluefin tuna larval assessment with a brief response. ICCAT. Coll. Vol. Sci. Pap 32, 240–247.
Richardson D. E., Marancik K. E., Guyon J. R., Lutcavage M. E., Galuardi B., Lam C. H., et al. (2016). Discovery of a spawning ground reveals diverse migration strategies in Atlantic bluefin tuna (Thunnus thynnus). Proc. Natl. Acad. Sci. 113, 3299–3304. doi: 10.1073/pnas.1525636113
Rodriguez J. M., Johnstone C., Lozano-Peral D. (2021). Evidence of Atlantic bluefin tuna spawning in the bay of Biscay, north-eastern Atlantic. J. Fish Biol. 99, 964–969. doi: 10.1111/jfb.14782
Rooker J. R., Arrizabalaga H., Fraile I., Secor D. H., Dettman D. L., Abid N., et al. (2014). Crossing the line: migratory and homing behaviors of Atlantic bluefin tuna. Mar. Ecol. Prog. Ser. 504, 265–276. doi: 10.3354/meps10781
Rooker J. R., Fraile I., Liu H., Abid N., Dance M., Itoh T., et al. (2019). Wide-ranging temporal variation in transoceanic movement and population mixing of bluefin tuna in the north Atlantic ocean. Front. Mar. Sci. 6, 398. doi: 10.3389/fmars.2019.00398
Rooker J. R., Secor D. H., De Metrio G., Schloesser R., Block B. A., Neilson J. D. (2008). Natal homing and connectivity in Atlantic bluefin tuna populations. Science 322, 742–744. doi: 10.1126/science.1161473
Rooker J. R., Secor D. H., Zdanowicz V. S., De Metrio G., Relini L. O. (2003). Identification of Atlantic bluefin tuna (Thunnus thynnus) stocks from putative nurseries using otolith chemistry. Fisheries Oceanography 12, 75–84. doi: 10.1046/j.1365-2419.2003.00223.x
Rypina I. I., Chen K., Hernández C. M., Pratt L. J., Llopiz J. K. (2019). Investigating the suitability of the slope Sea for Atlantic bluefin tuna spawning using a high-resolution ocean circulation model. ICES J. Mar. Sci. 76, 1666–1677. doi: 10.1093/icesjms/fsz079
Schaff T., Levin L., Blair N., DeMaster D., Pope R., Boehme S. (1992). Spatial heterogeneity of benthos on the Carolina continental slope: large (100 km)-scale variation. Mar. Ecology-Progress Ser. 88, 143–143. doi: 10.3354/meps088143
Schloesser R. W., Neilson J. D., Secor D. H., Rooker J. R. (2010). Natal origin of Atlantic bluefin tuna (Thunnus thynnus) from Canadian waters based on otolith delta13C and delta18O. Can. J. Fisheries Aquat. Sci. 67, 563–569. doi: 10.1139/F10-005
Schwartz F. (1989). Zoogeography and ecology of fishes inhabiting north carolina’s marine waters to depths of 600 meters. NOAA Nat. Undersea Res. Program Rep., 89–82.
Signer J., Fieberg J., Avgar T. (2019). Animal movement tools (amt): r package for managing tracking data and conducting habitat selection analyses. Ecol. Evol. 9, 880–890. doi: 10.1002/ece3.4823
Smirnov N. (1948). Table for estimating the goodness of fit of empirical distributions. Ann. Math. Stat 19, 279–281. doi: 10.1214/aoms/1177730256
Spencer S. R., Cameron G. N., Swihart R. K. (1990). Operationally defining home range: temporal dependence exhibited by hispid cotton rats. Ecology 71, 1817–1822. doi: 10.2307/1937590
Stehfest K. M., Patterson T. A., Barnett A., Semmens J. M. (2014). Intraspecific differences in movement, dive behavior and vertical habitat preferences of a key marine apex predator. Mar. Ecol. Prog. Ser. 495, 249–262. doi: 10.3354/meps10563
Stokesbury M. J. W., Neilson J. D., Susko E., Cooke S. J. (2011). Estimating mortality of Atlantic bluefin tuna (Thunnus thynnus) in an experimental recreational catch-and-release fishery. Biol. Conserv. 144, 2684–2691. doi: 10.1016/j.biocon.2011.07.029
Stokesbury M. J. W., Teo S. L., Seitz A., O’Dor R. K., Block B. A. (2004). Movement of Atlantic bluefin tuna (Thunnus thynnus) as determined by satellite tagging experiments initiated off new England. Can. J. Fisheries Aquat. Sci. 61, 1976–1987. doi: 10.1139/F04-130
Taylor N. G., McAllister M. K., Lawson G. L., Carruthers T., Block B. A. (2011). Atlantic Bluefin tuna: a novel multistock spatial model for assessing population biomass. PloS One 6, e27693. doi: 10.1371/journal.pone.0027693
Tensek S., Di Natale A., Pagá García A. (2017). ICCAT GBYP PSAT tagging: the first five years. Collect. Vol. Sci. Pap. ICCAT 73, 2058–2073.
Teo S. L., Boustany A. M. (2016). “Movements and habitat use of Atlantic bluefin tuna,” in Biology and ecology of bluefin tuna. Eds. Kitagawa T., Kimura S. (Boca Raton, FL: CRC Press), 137–188.
Teo S. L., Boustany A., Blackwell S., Walli A., Weng K. C., Block B. A. (2004). Validation of geolocation estimates based on light level and sea surface temperature from electronic tags. Mar. Ecol. Prog. Ser. 283, 81–98. doi: 10.3354/meps283081
Thieurmel B., Elmarhraoui A. (2019) Suncalc: compute sun position, sunlight phases, moon position and lunar phase. r package version 0.5.0. Available at: https://CRAN.R-project.org/package=suncalc.
Walli A., Teo S. L. H., Boustany A., Farwell C. J., Williams T., Dewar H., et al. (2009). Seasonal movements, aggregations and diving behavior of Atlantic bluefin tuna (Thunnus thynnus) revealed with archival tags. PloS One 4, e6151. doi: 10.1371/journal.pone.0006151
Whitlock R. E., Hazen E. L., Walli A., Farwell C., Bograd S. J., Foley D. G., et al. (2015). Direct quantification of energy intake in an apex marine predator suggests physiology is a key driver of migrations. Sci. Adv. 1, e1400270. doi: 10.1126/sciadv.1400270
Wilson S. G., Block B. A. (2009). Habitat use in Atlantic bluefin tuna Thunnus thynnus inferred from diving behavior. Endangered Species Res. 10, 355–367. doi: 10.3354/esr00240
Wilson S. G., Jonsen I. D., Schallert R. J., Ganong J. E., Castleton M. R., Spares A. D., et al. (2015). Tracking the fidelity of Atlantic bluefin tuna released in Canadian waters to the gulf of Mexico spawning grounds. Can. J. Fisheries Aquat. Sci. 72, 1700–1717. doi: 10.1139/cjfas-2015-0110
Wilson S. G., Lawson G. L., Stokesbury M. J. W., Spares A., Boustany A. M., Neilson J. D., et al. (2011). Movements of Atlantic bluefin tuna from the gulf of st. Lawrence to their spawning grounds. Collect. Vol. Sci. Pap. ICCAT 66, 1247–1256.
Winship, Arliss J and Jorgensen, Salvador J and Shaffer, Scott A and Jonsen, Ian D and Robinson, Patrick W and Costa, Daniel P and Block, Barbara A. (2012). State-space framework for estimating measurement error from double-tagging telemetry experiments. Methods in Ecology and Evolution. 3 (2), 291–302. doi: 10.1111/j.2041-210X.2011.00161.x
Keywords: Atlantic bluefin tuna, tagging, spatial management, behaviour, migration, habitat partitioning, megafauna
Citation: Dedman S, Aalto EA, Stokesbury MJW, Schallert RJ, Castleton MR and Block BA (2023) Assignment of tracks from tagged Atlantic bluefin tuna Thunnus thynnus to potential stocks using behavioural differences and habitat partitioning. Front. Mar. Sci. 10:1165910. doi: 10.3389/fmars.2023.1165910
Received: 14 February 2023; Accepted: 31 March 2023;
Published: 25 May 2023.
Edited by:
Nuno Queiroz, Centro de Investigacao em Biodiversidade e Recursos Geneticos (CIBIO-InBIO), PortugalReviewed by:
Xiujuan Shan, Yellow Sea Fisheries Research Institute (CAFS), ChinaDmitry Lajus, Independent Researcher, Saint Petersburg, Russia
Copyright © 2023 Dedman, Aalto, Stokesbury, Schallert, Castleton and Block. This is an open-access article distributed under the terms of the Creative Commons Attribution License (CC BY). The use, distribution or reproduction in other forums is permitted, provided the original author(s) and the copyright owner(s) are credited and that the original publication in this journal is cited, in accordance with accepted academic practice. No use, distribution or reproduction is permitted which does not comply with these terms.
*Correspondence: Simon Dedman, c2ltb25kZWRtYW5AZ21haWwuY29t